
TECHNICAL ANALYSIS (by Intraday Dynamics)
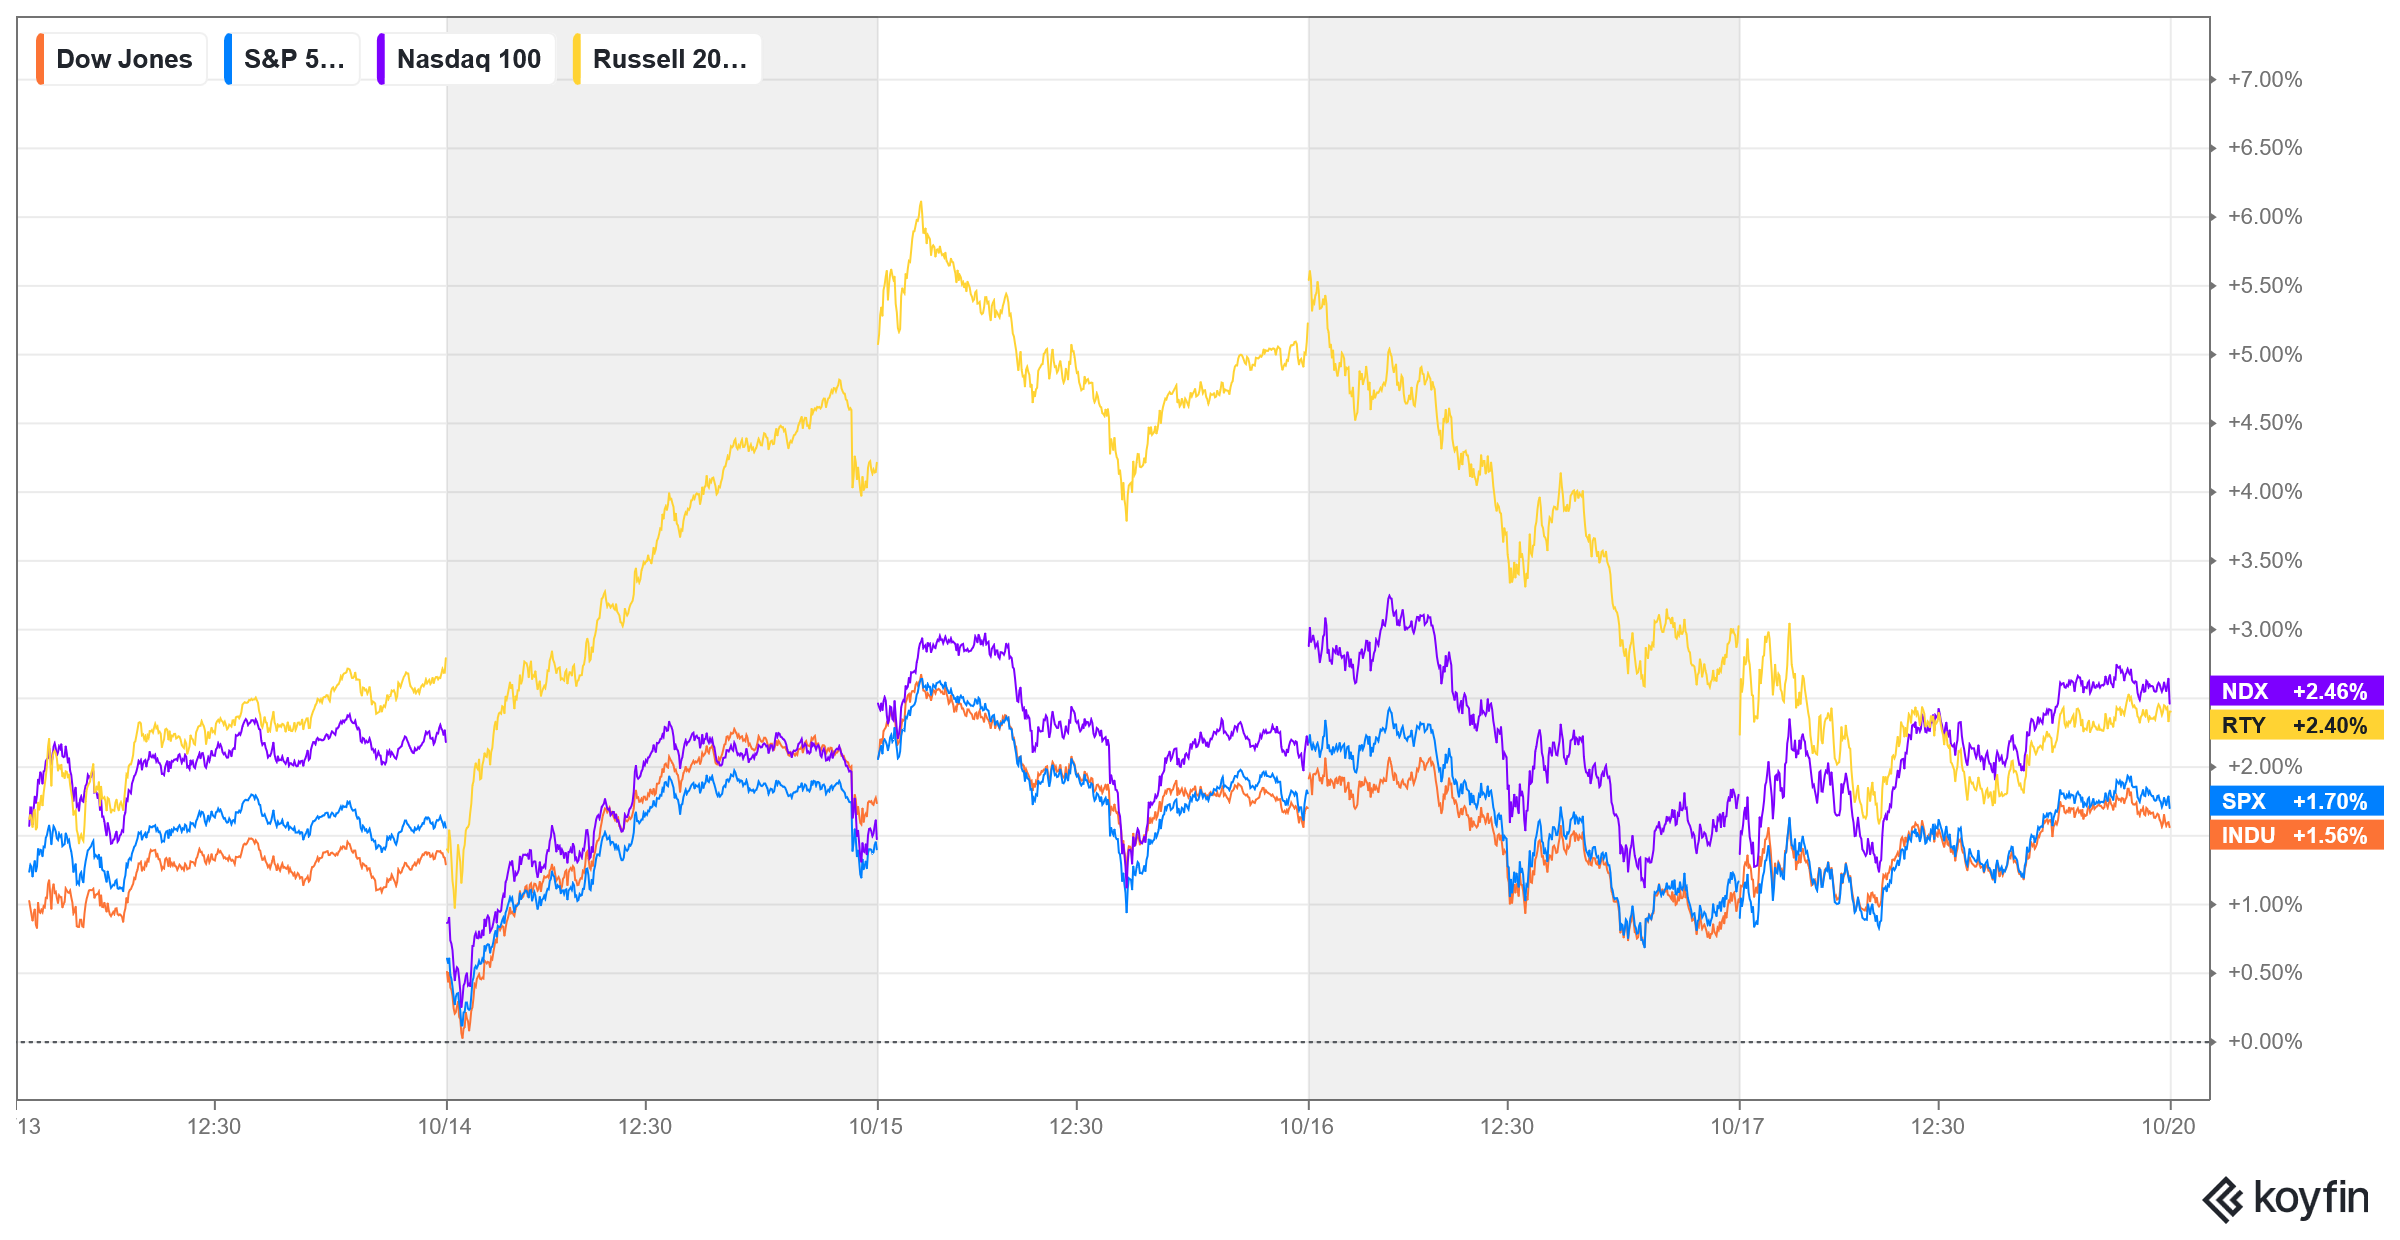
Major Indices Week of October 17, 2025
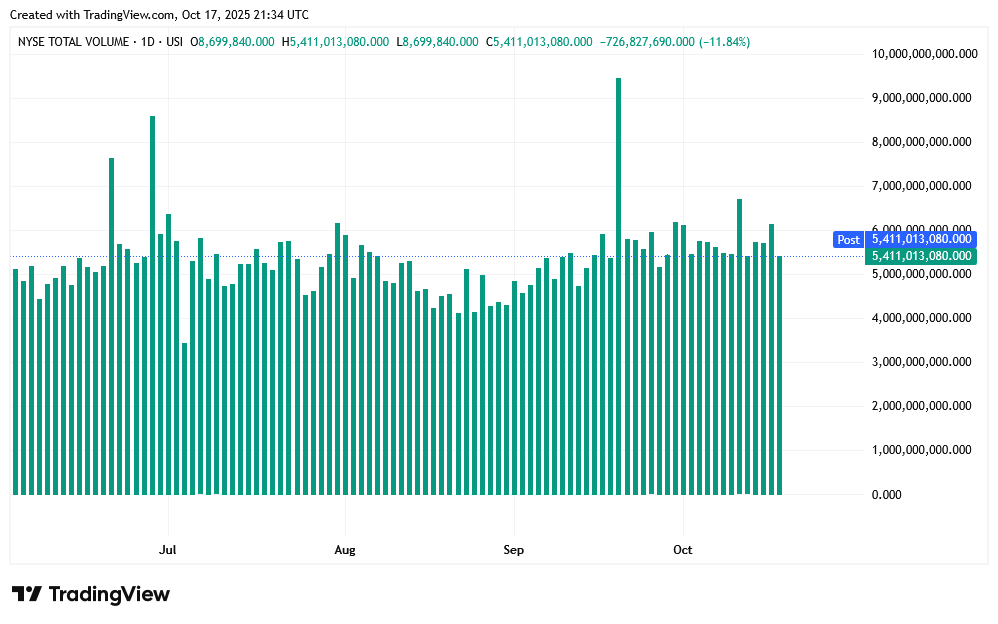
NYSE Volume
 As goes tech, so goes the market. Stocks traded mostly inside of the previous week’s trade and closed higher across the board as prices build flagging patterns off the side of the recent tops except for the IWM which surged to record highs mid-week. The market recovered a chunk of the previous week’s tariff driven meltdown as Wall Street responded with the “TACO Trade” once again. Not only was the action on 10 October 2025 another TACO, but it exposed more radical market manipulation as outlined by Unusual Whales.
Nasdaq Regional Banking Index Daily Candles
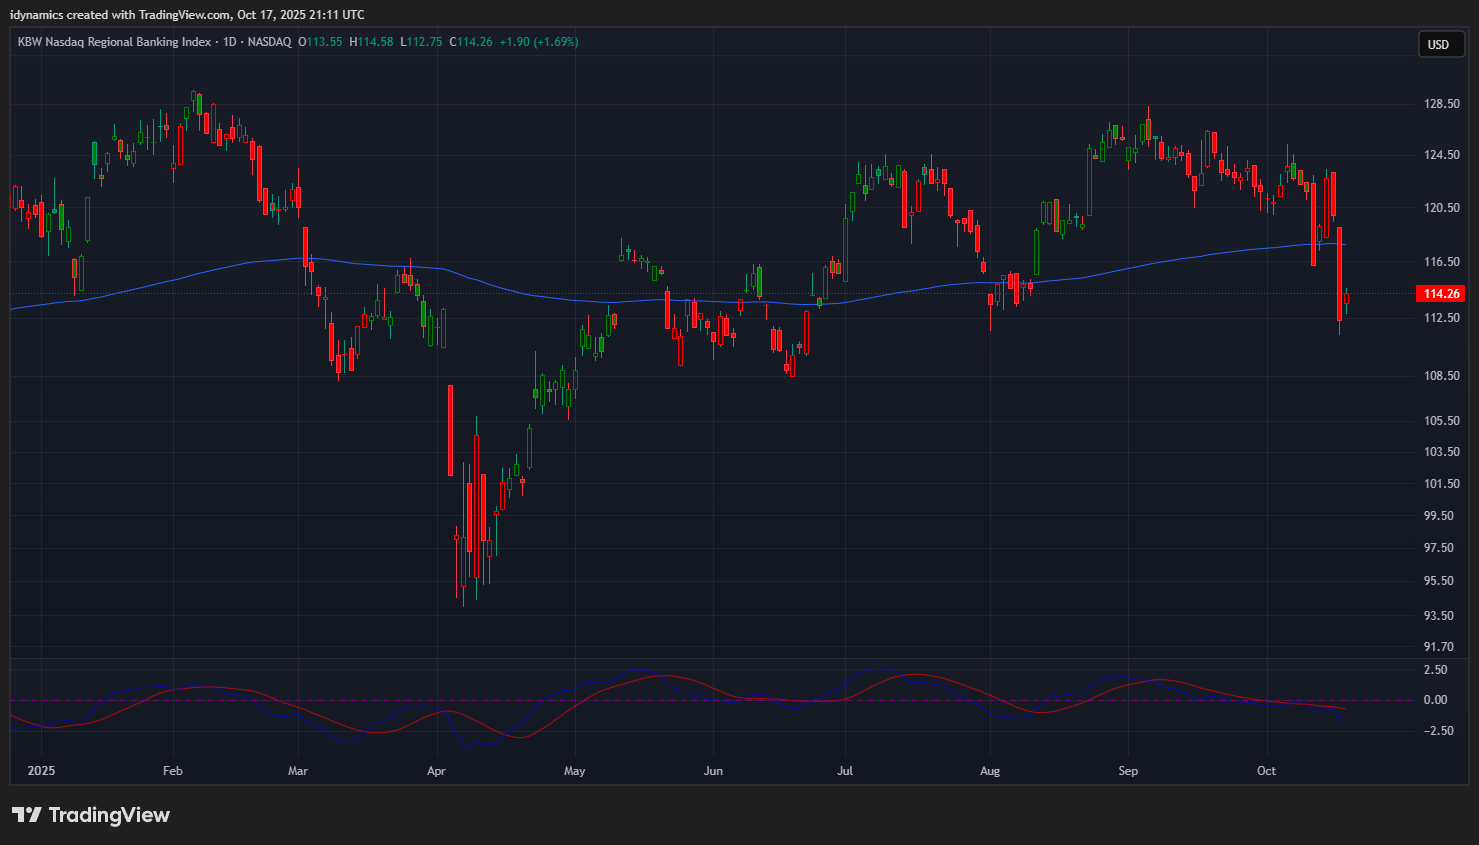 Prices were dragged down mid-week by a collapse in regional banks which prompted a quick response from the Fed to say they will buffer the bank’s losses. This also shifted sentiment decidedly to fear.
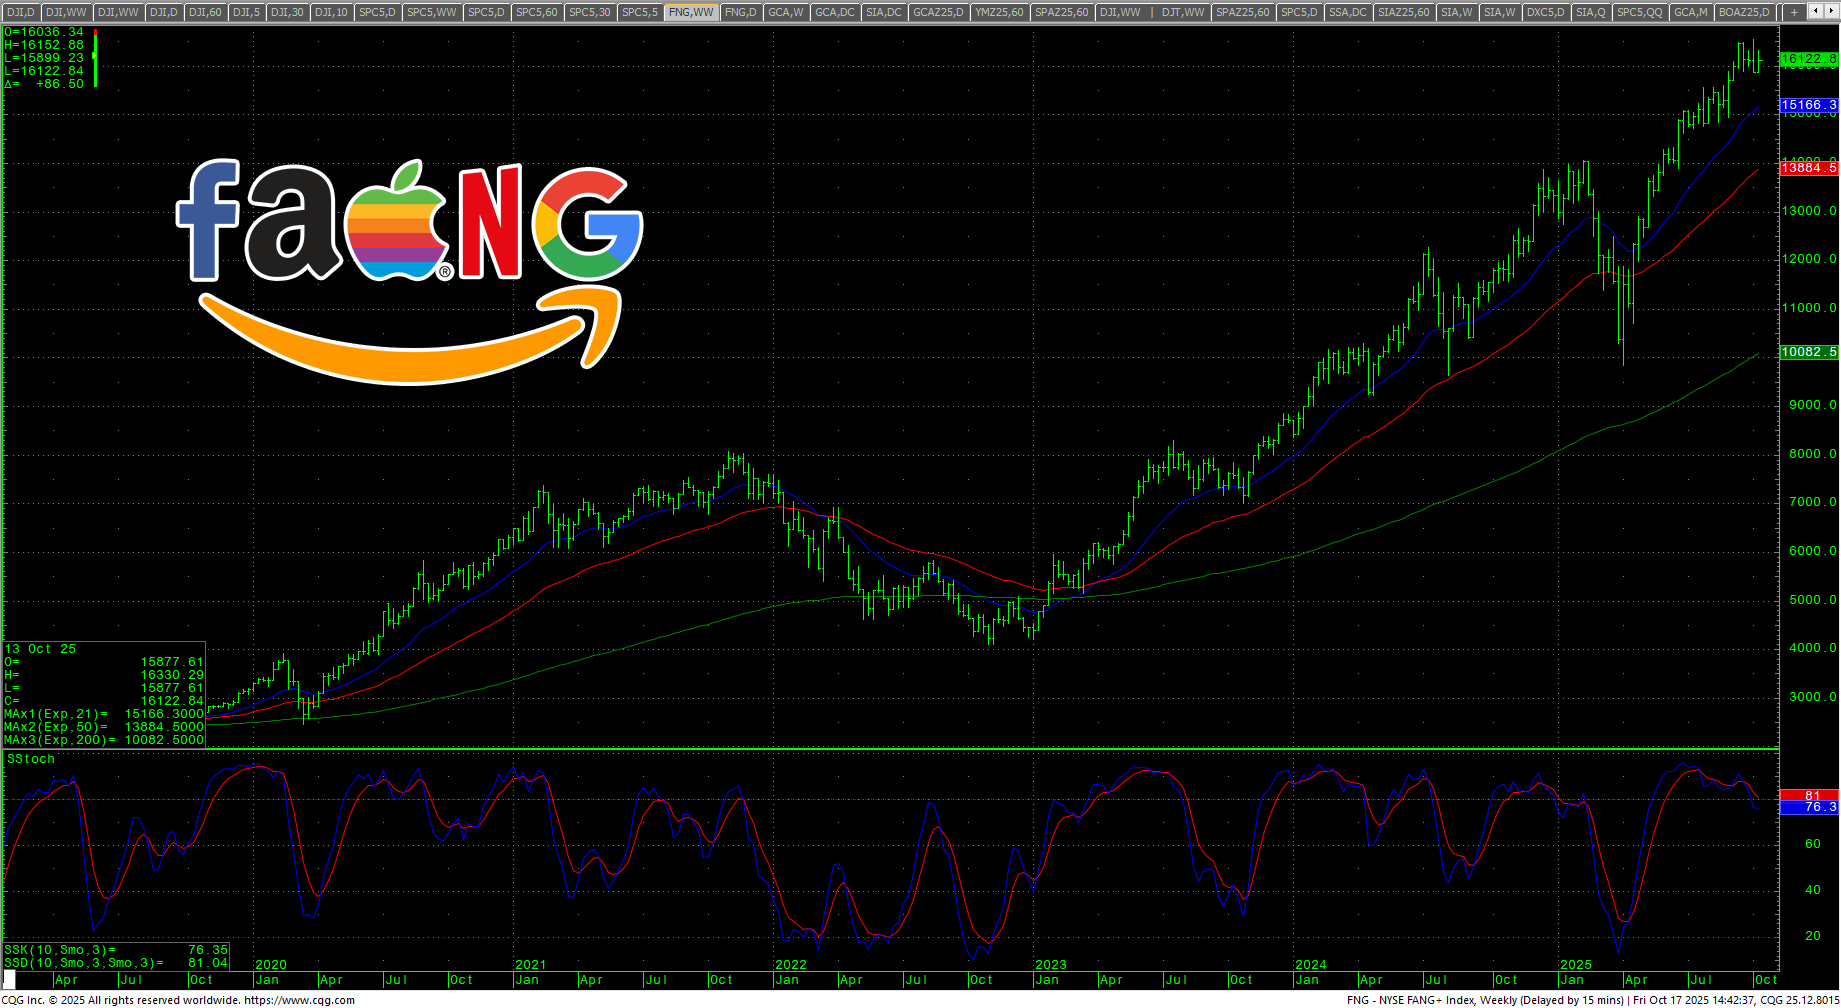
NYSE FANG Daily Close
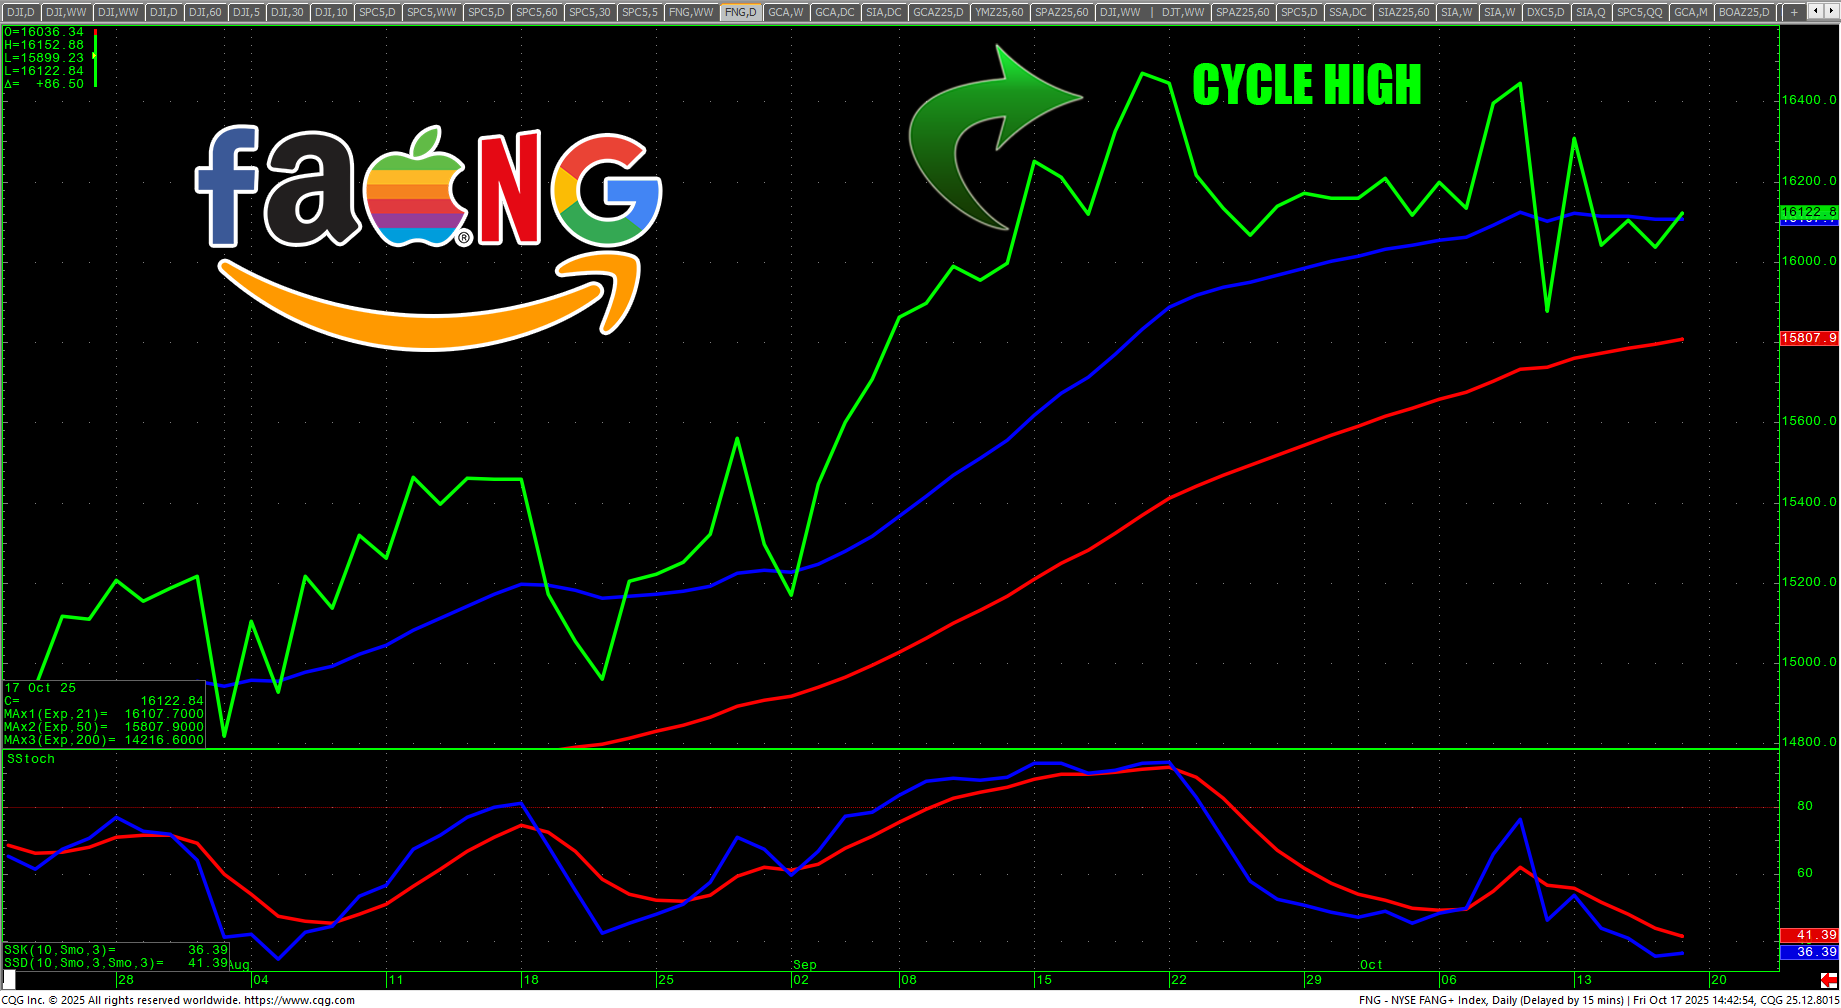 Tracking with the recent theme, thus far the critical cycle timing of the week ending September 19th has caught the top in the FANG. How this continues to play out will be interesting. It will be up to tech stocks and sentiment as we move further into the month. If this churn ends up being just a PIT (pullback in time), then it is likely prices continue their move into the first quarter of 2026…and it could be a vertical blowoff. If these recent closing highs hold, then the first quarter of 2026 could be brutal for stocks.
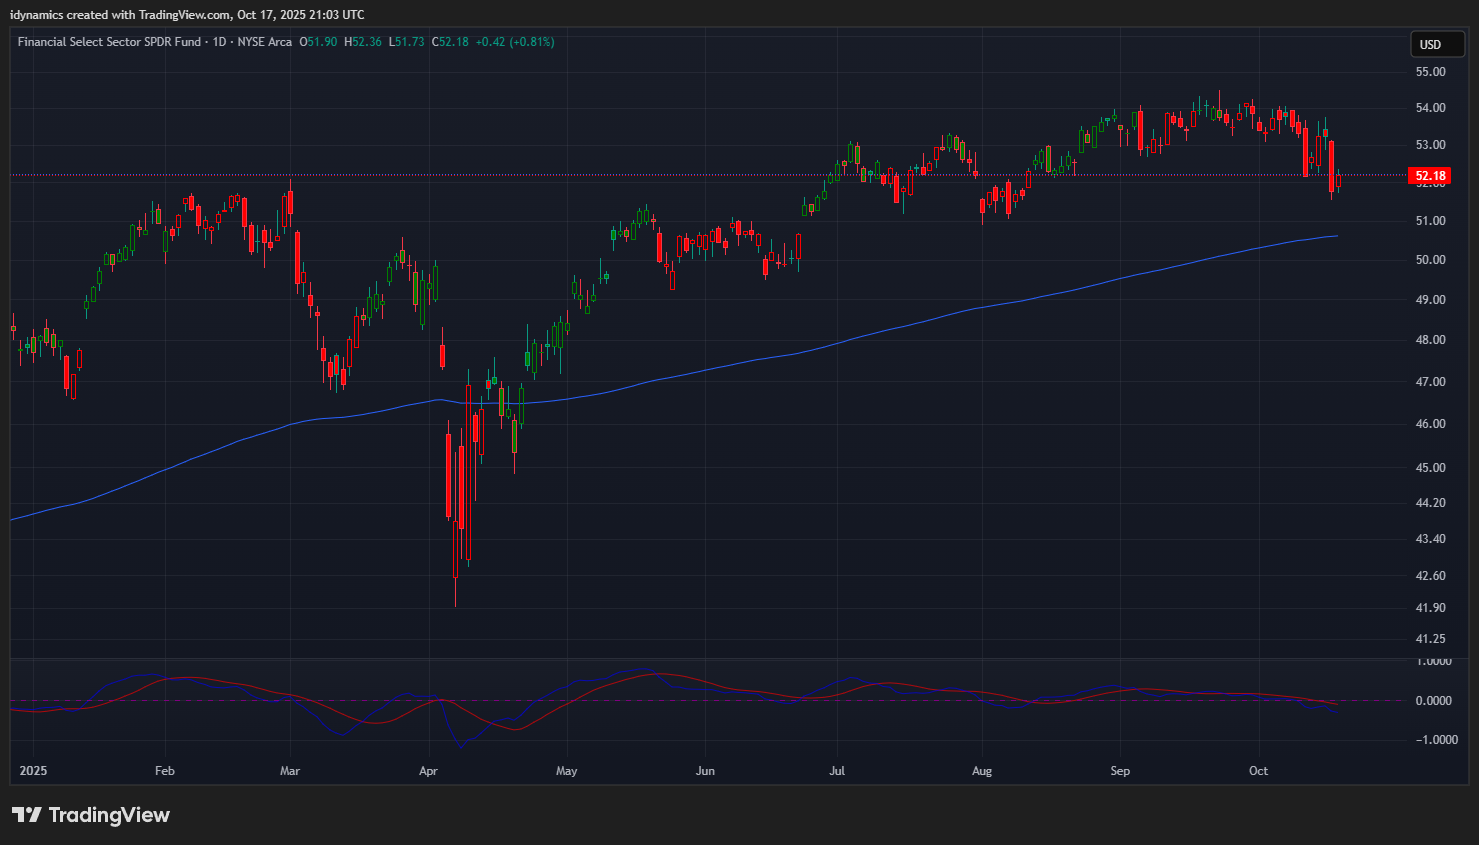 As mentioned previously, the XLF has stalled at the recent record highs. The XLF has its weekly closing high in the critical timing of the week ending 09/19/25 and is rolling over as a result of the banking scare last week.
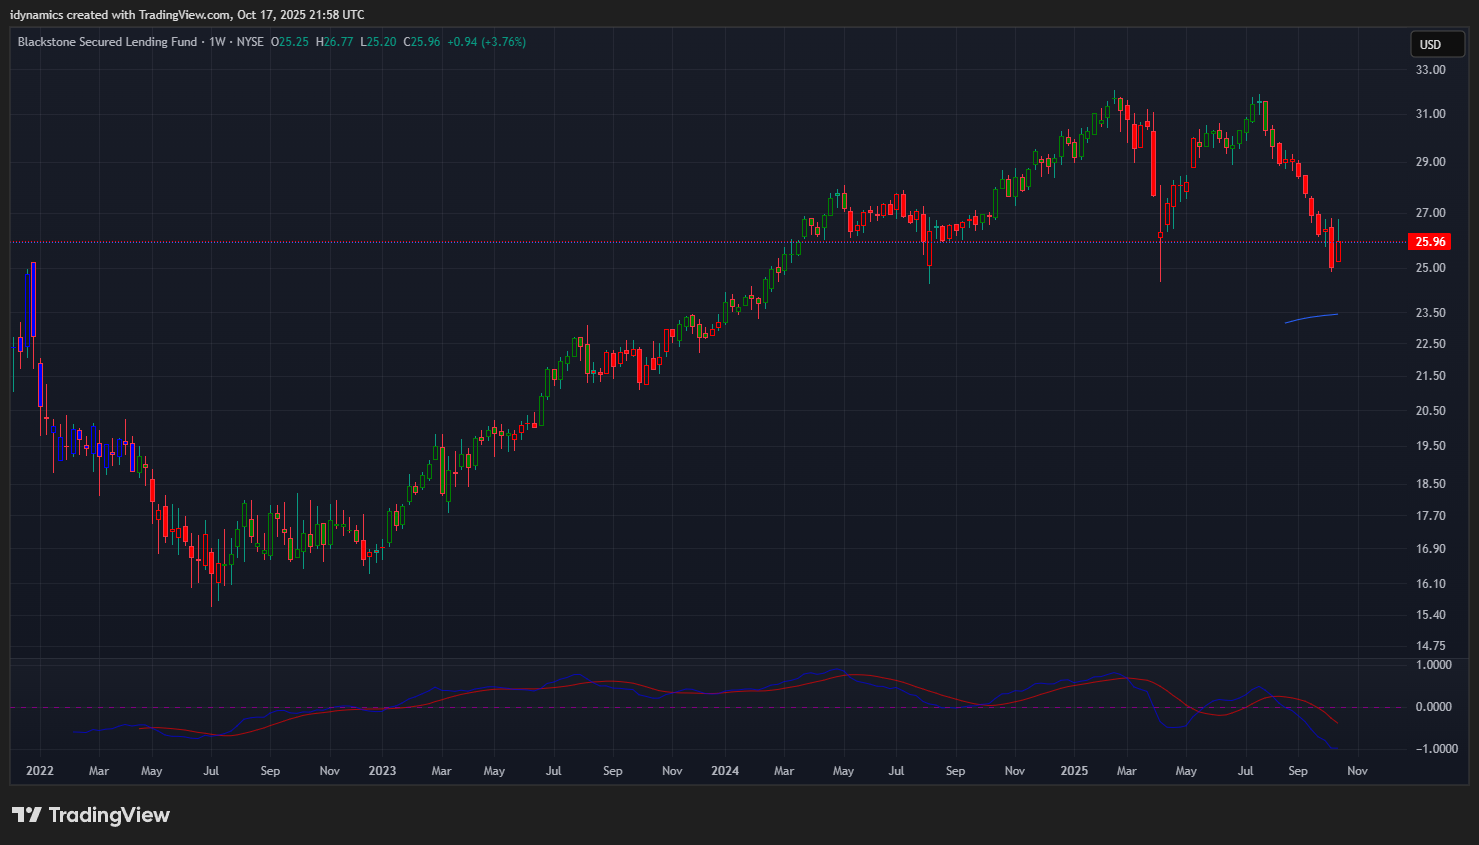 Another chart that remains critical is the Blackstone Secured Lending Fund (BXSL) which rebounded last week but has a bearish candle on the weekly. The chart is testing a double bottom on the weekly. BXSL is the grease on the AI Revolution wheels, e.g., the “bank.” This is a chart to keep an eye on moving forward.
SPX Quarterly H-L-C
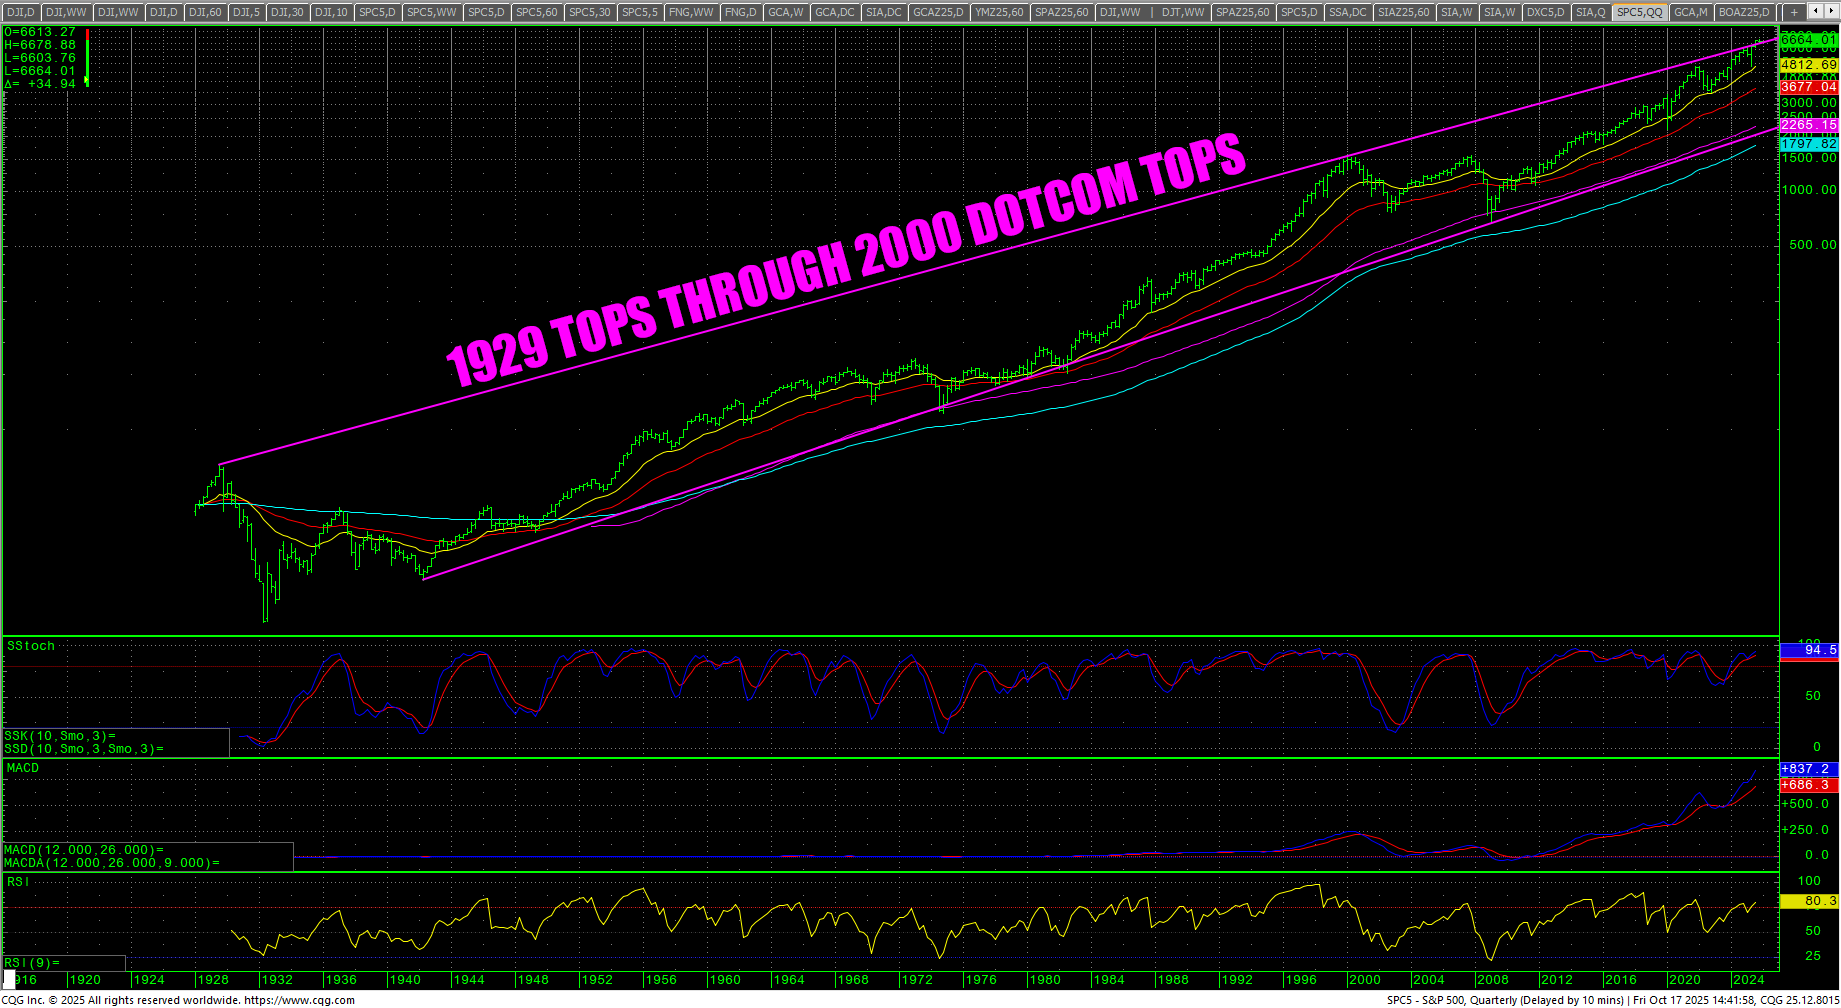 The other chart to monitor closely is the SPX quarterly that connects the 1929 tops through the 2000 Dot-Com tops. If prices start to trade back under the trendline, it could signal further selling in equities. It also holds potential for a blowoff move.
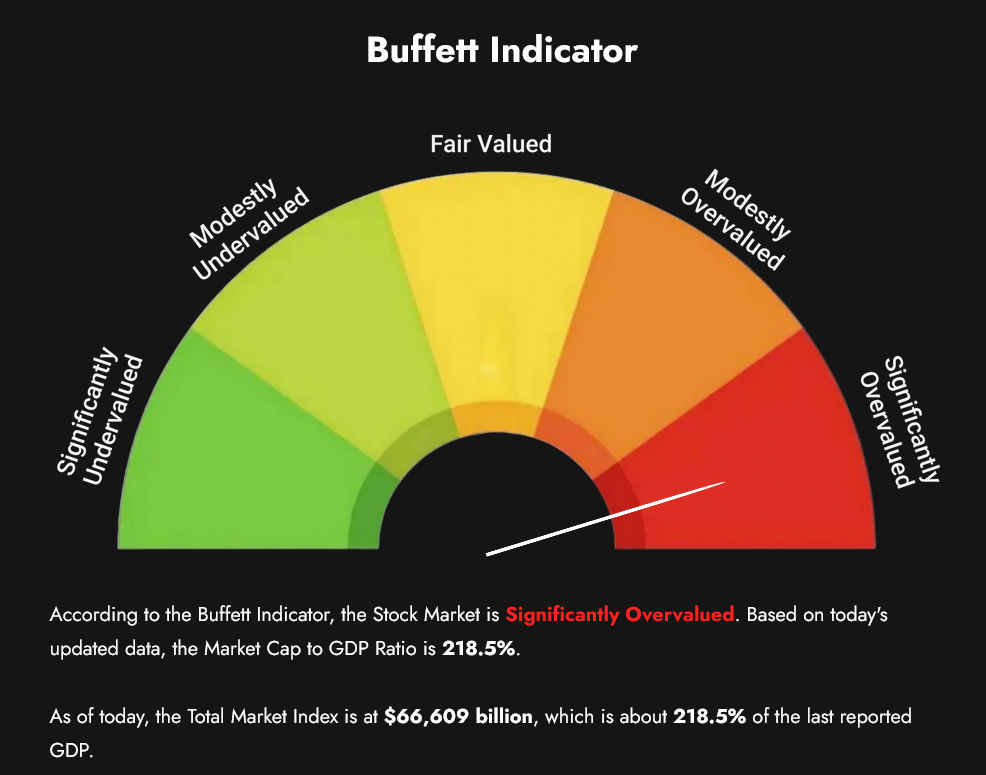
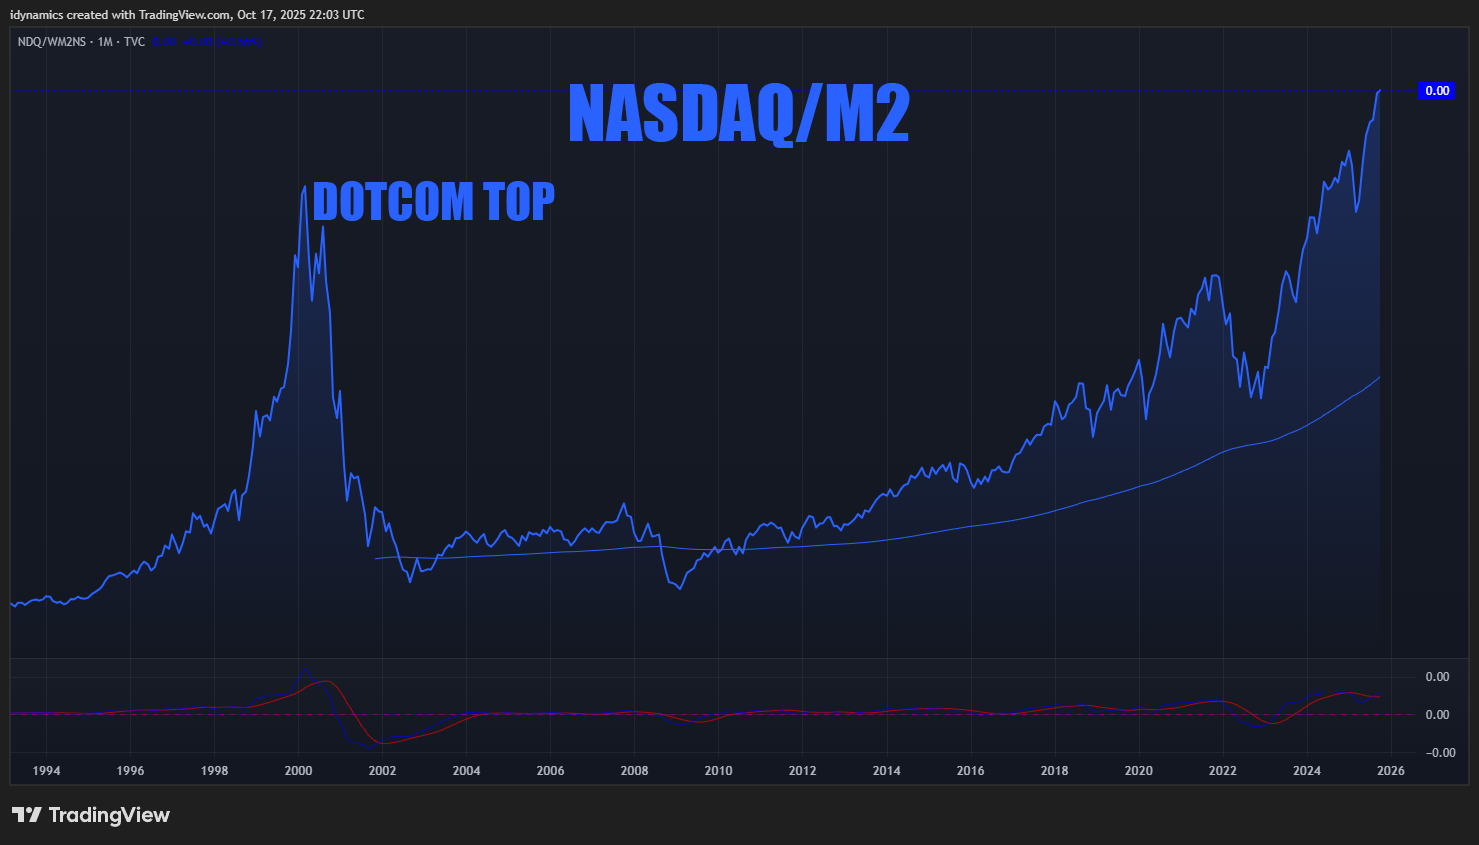 The Buffet Indicator is back to 218.5% just off its ATH at 220.3%. The market cap to M2 has blown past levels last seen at the Dot-Com highs.
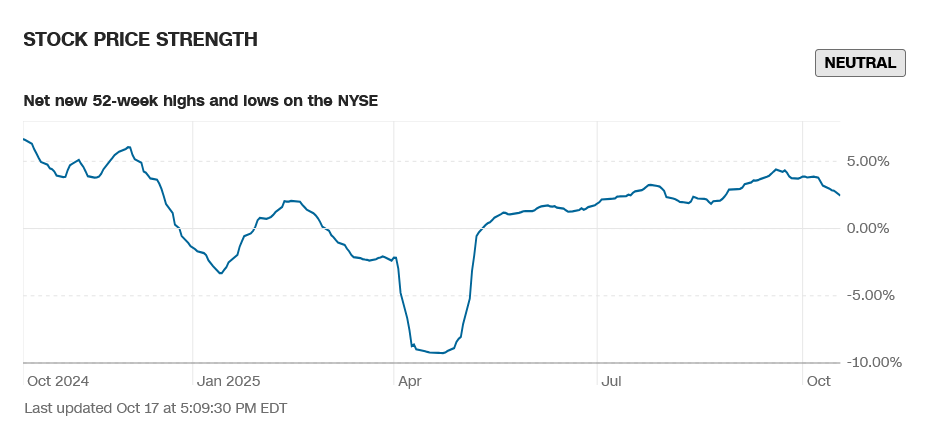
S&P 500 Stocks Above the 200-day MA
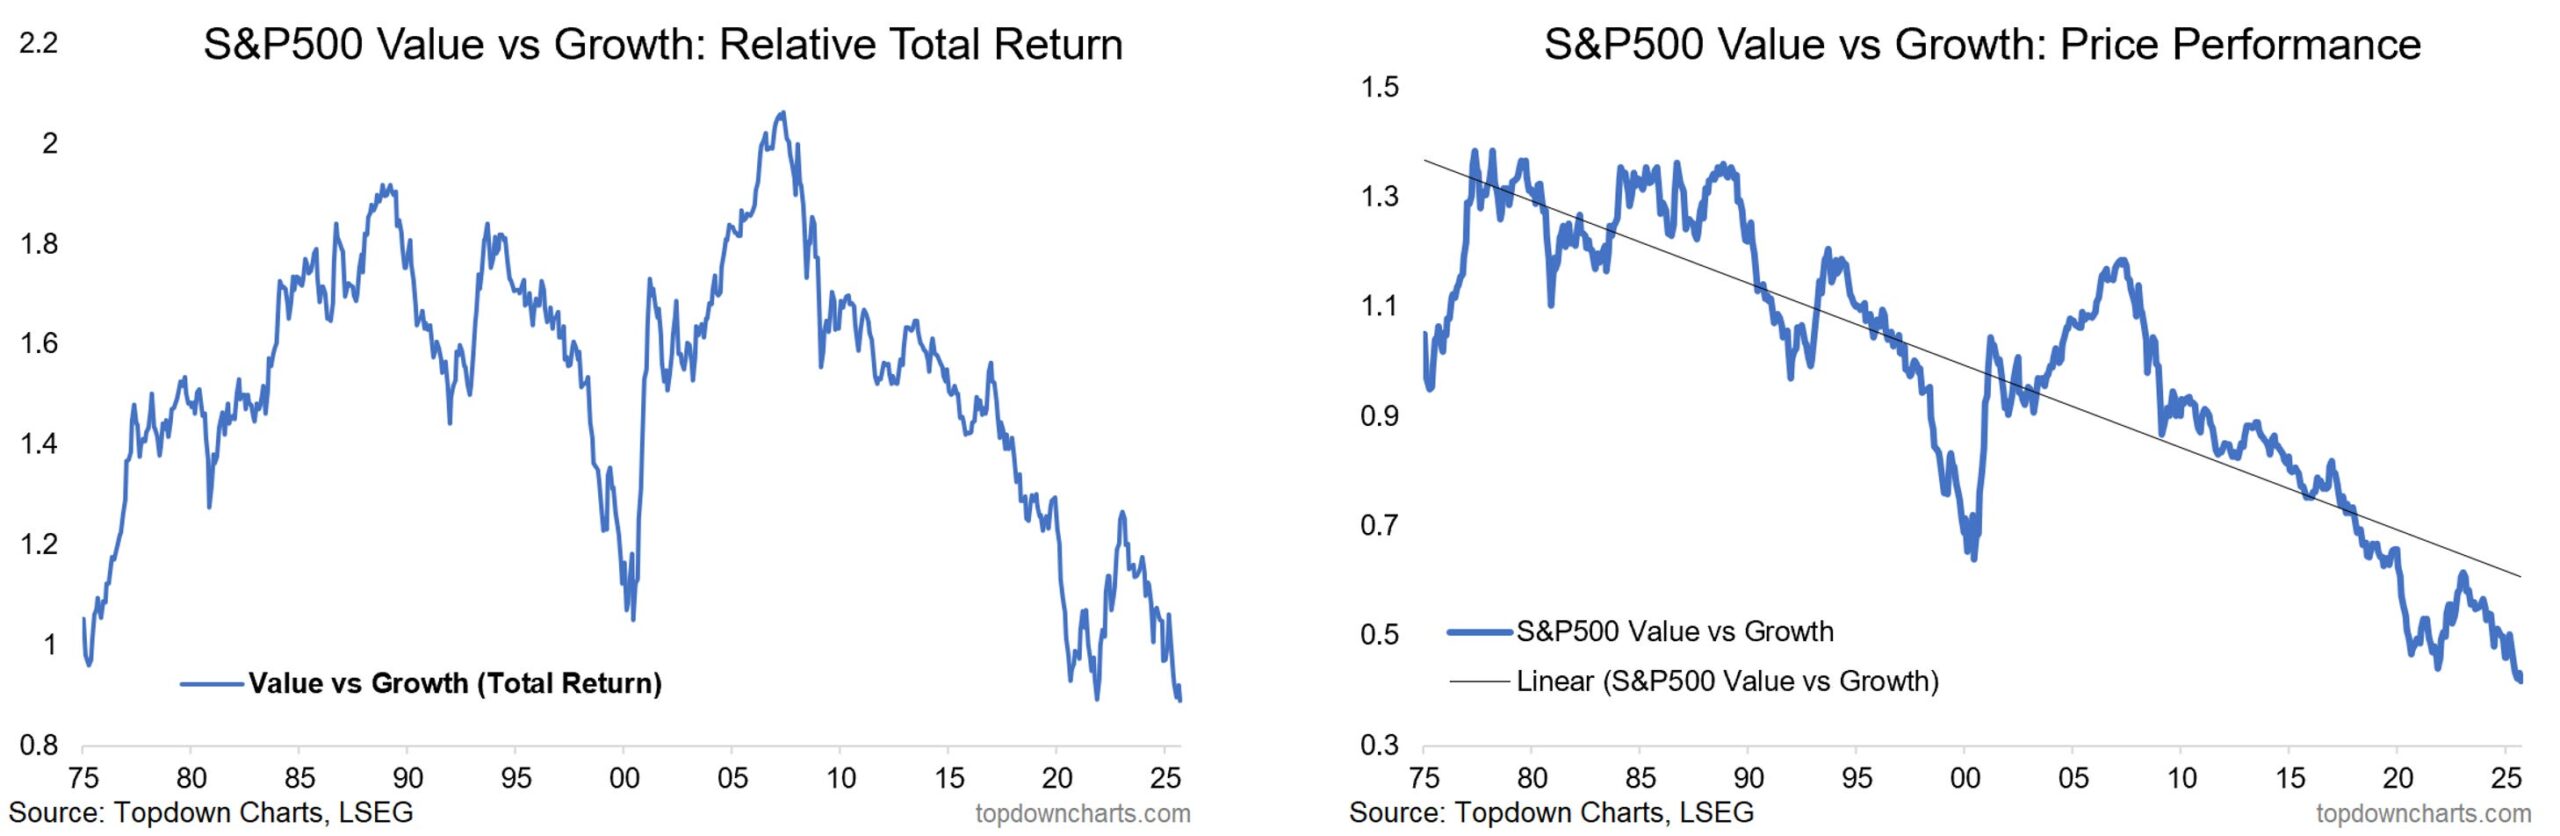
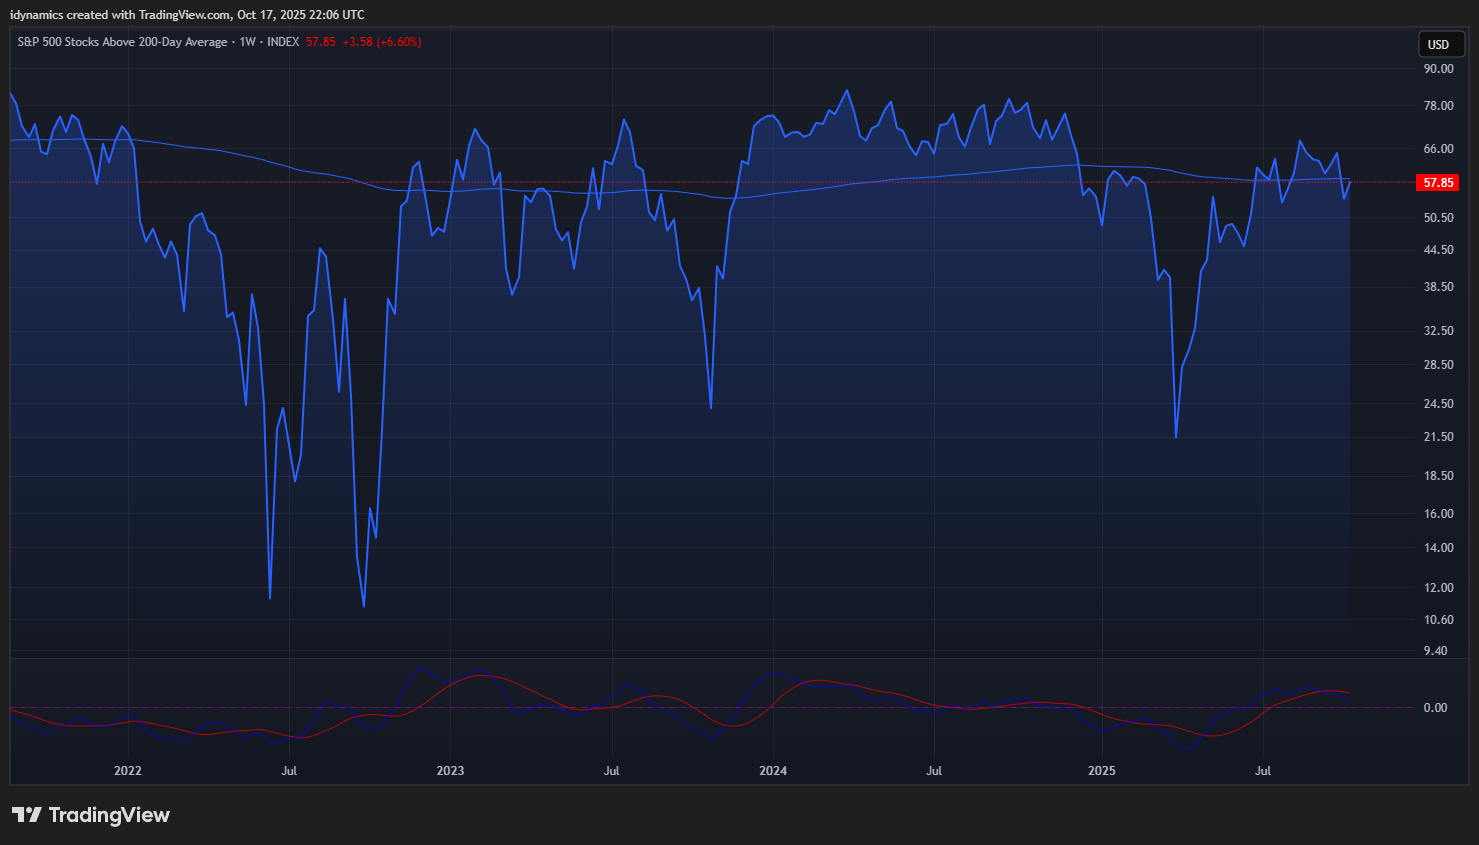 Breadth improved slightly on the week with the share of SPX stocks above the 200-day MA moving to 57.25%. The high in September 2024 was 72.92% and 82.70% in March of 2024. Divergence remains the name of the game. As Topdown Charts shows, growth versus value is anemic at these lofty levels.
 Dow Theory
 Dow Theory still shows a bearish divergence.
Inflation
 The markets will not get Leading Indicators or CPI data this week, but prices have been rising since Spring and it is showing in stores.
Comex Silver Spot Weekly
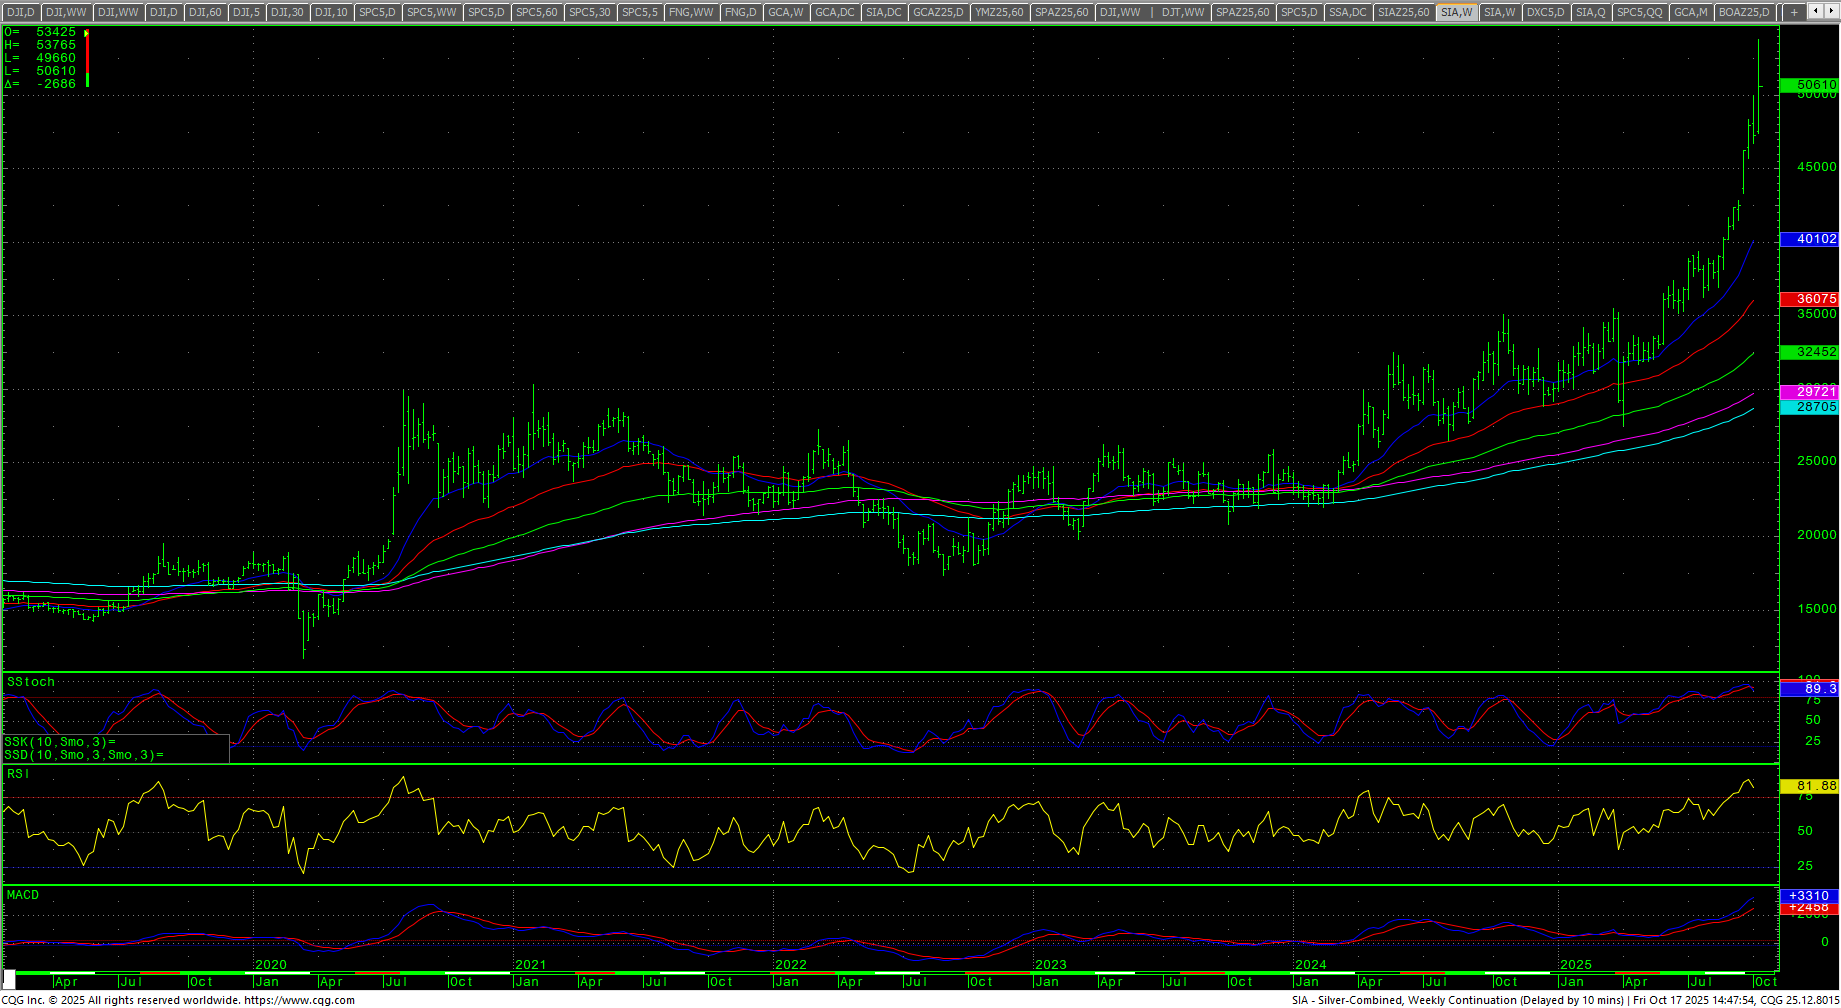
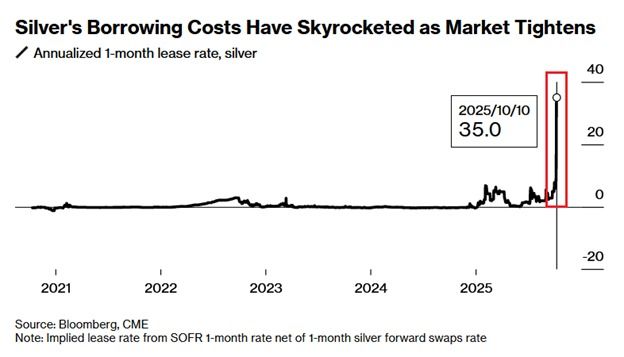
This has led to some big jumps in precious metals with a squeeze in Silver that sent Comex futures to record highs above the $50 an ounce level prior to a massive reversal in both silver and gold on Friday.
MAGS (Magnificent 7) Weekly Candles
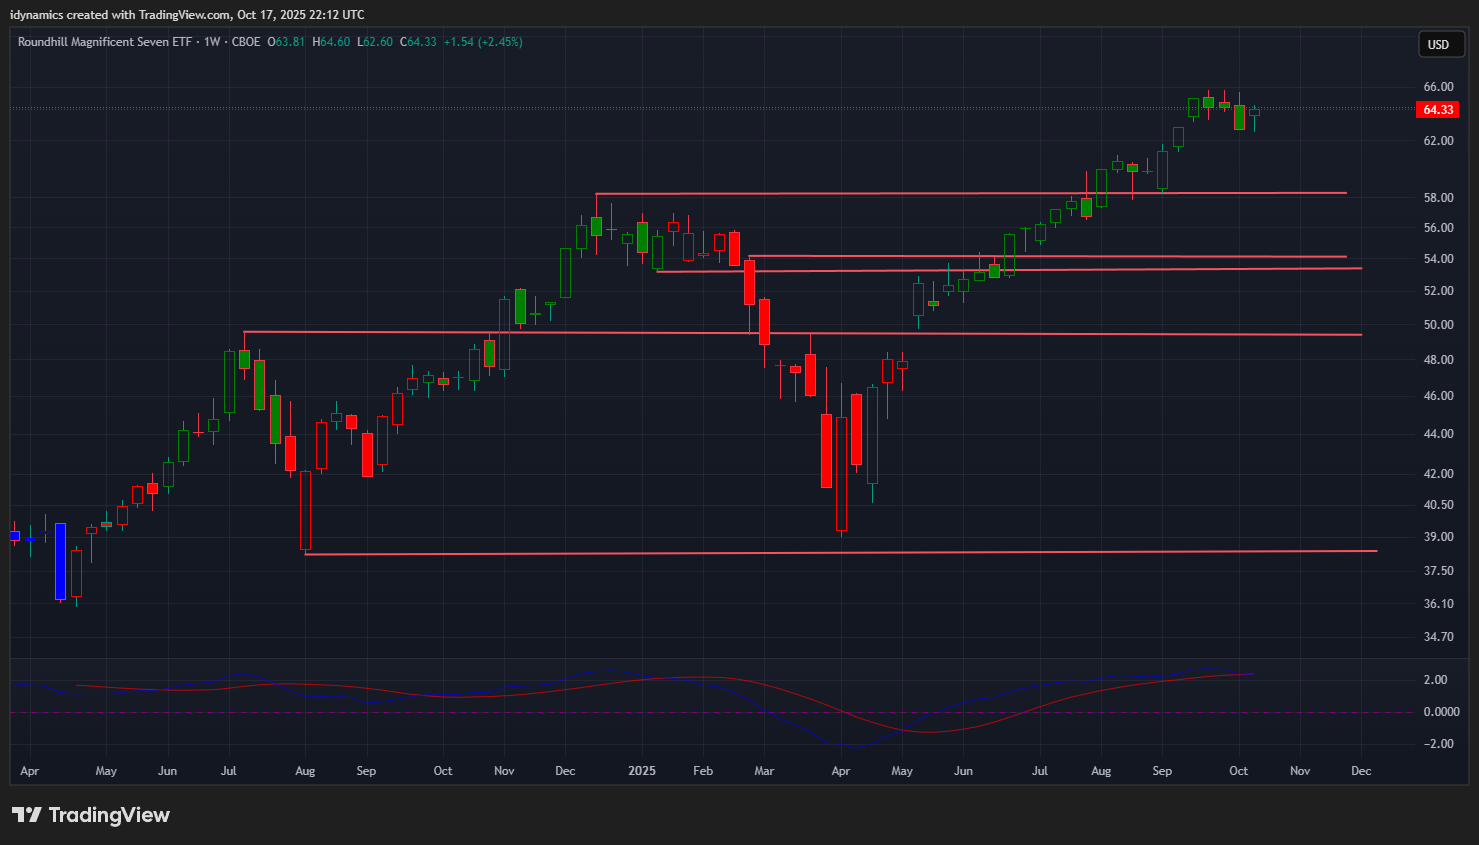 The MAGS traded an inside week’s range and closed on the highs, up +2.45. The index is reacting to resistance against the target of 64.50. The chart still has a higher target at 74.30. Support is still at 59.42/58.85 and 55.52. Under 55.52 can test 52.37 with critical support at 49.217/49.00.
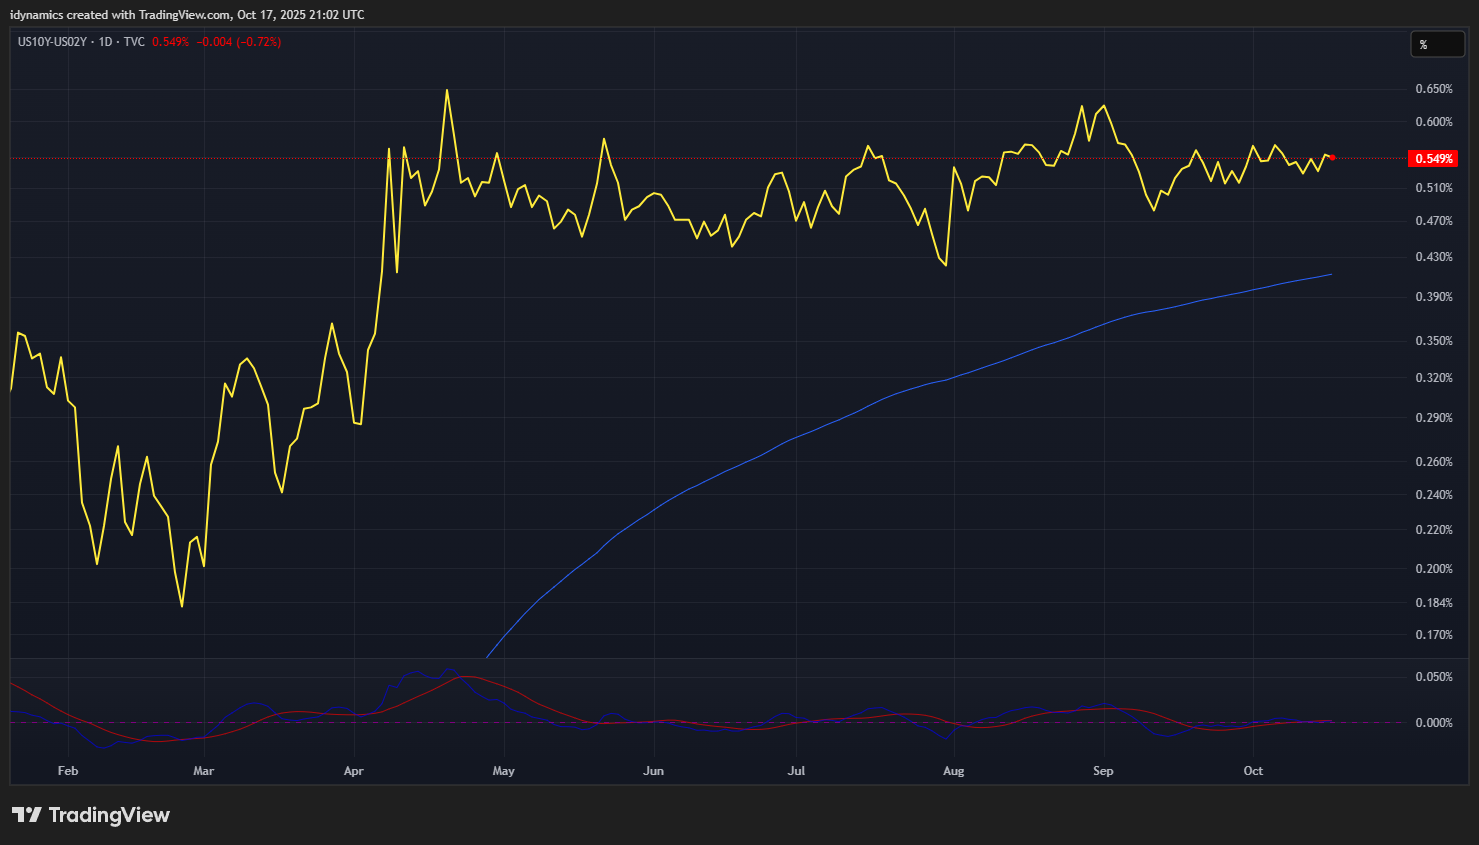
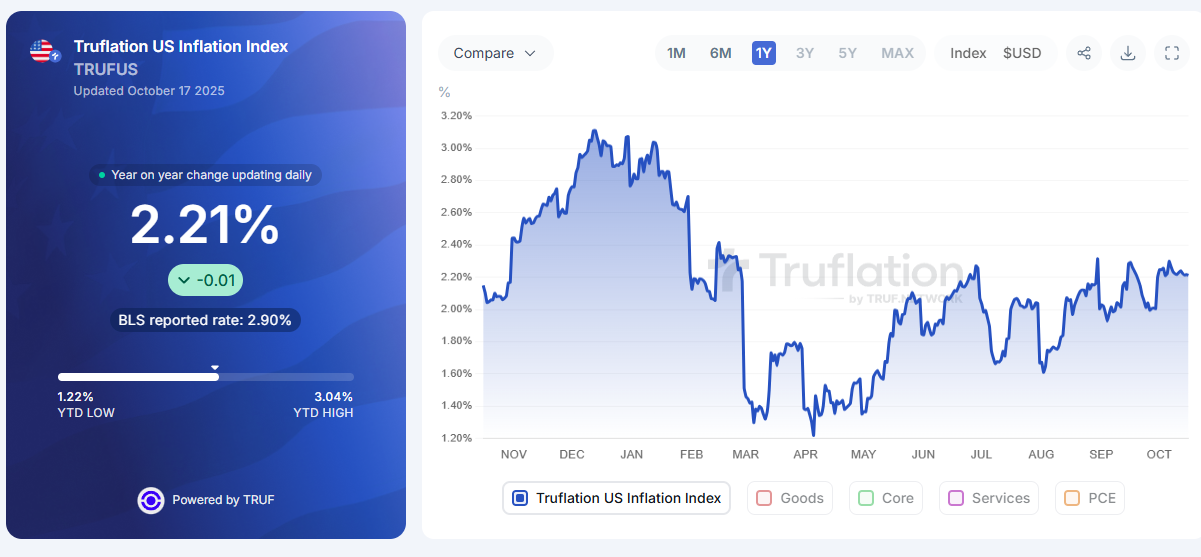
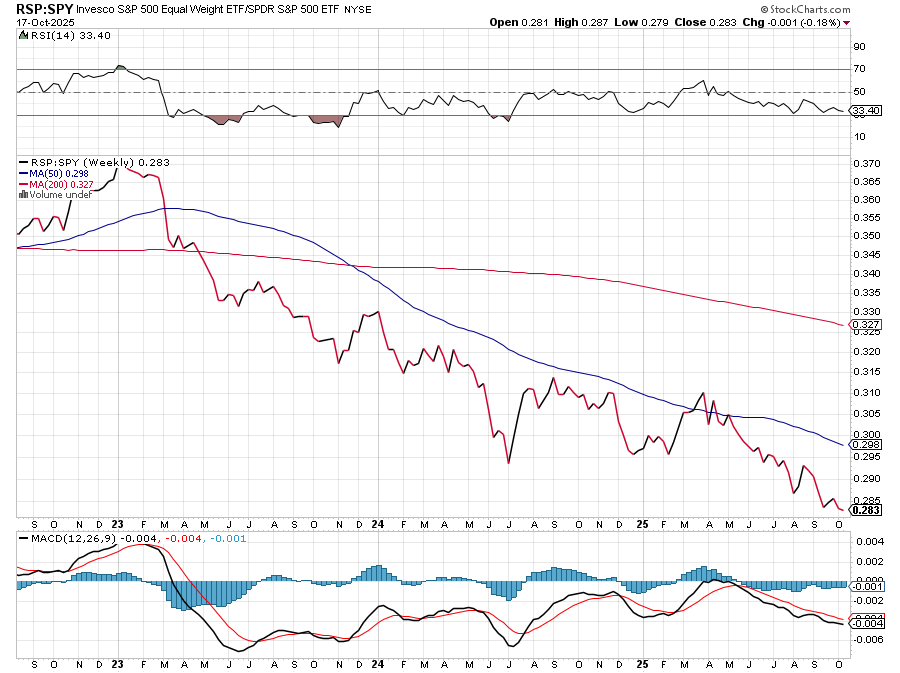
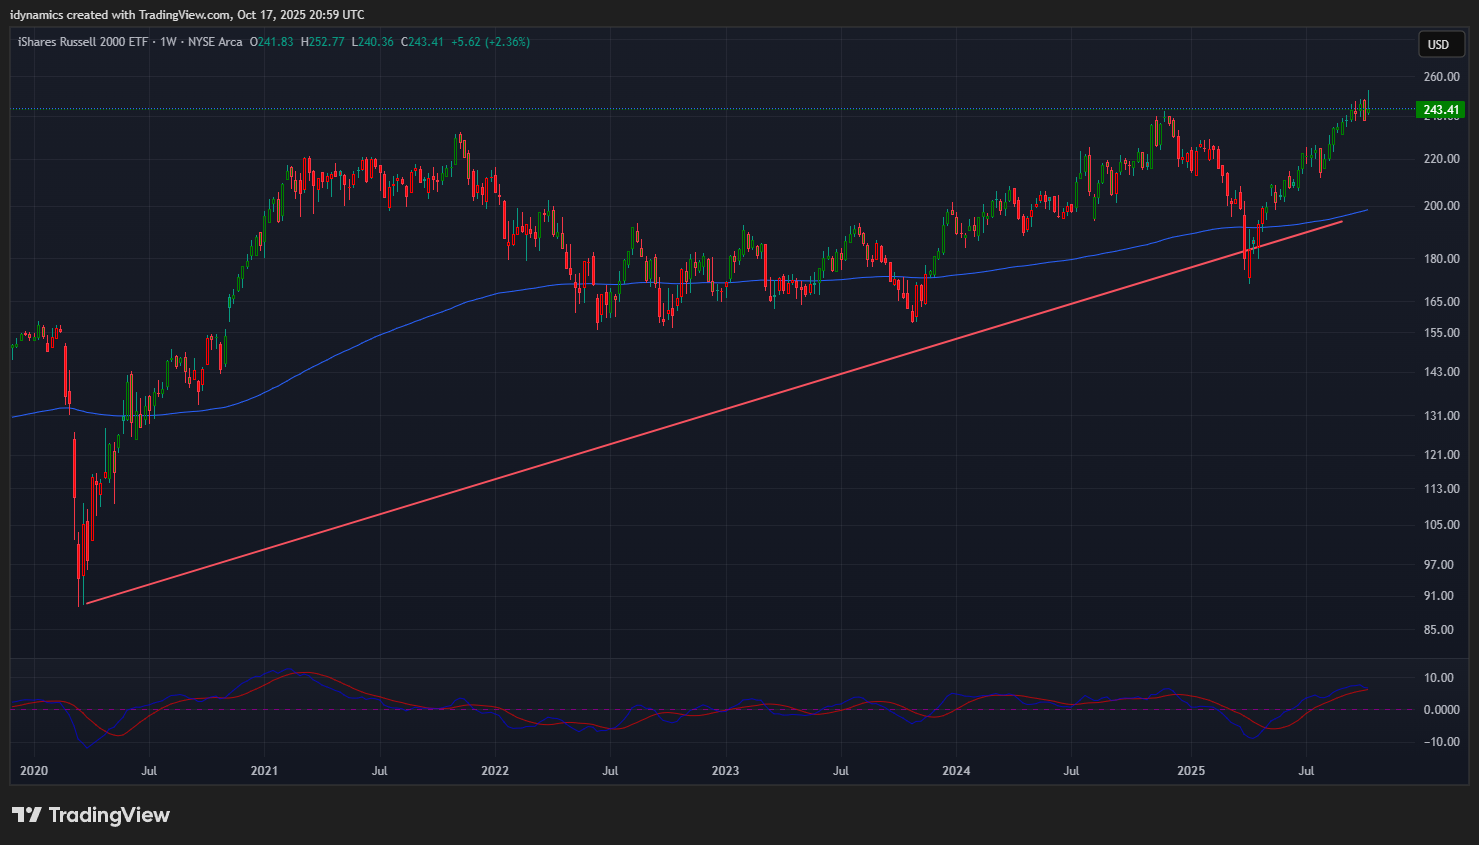
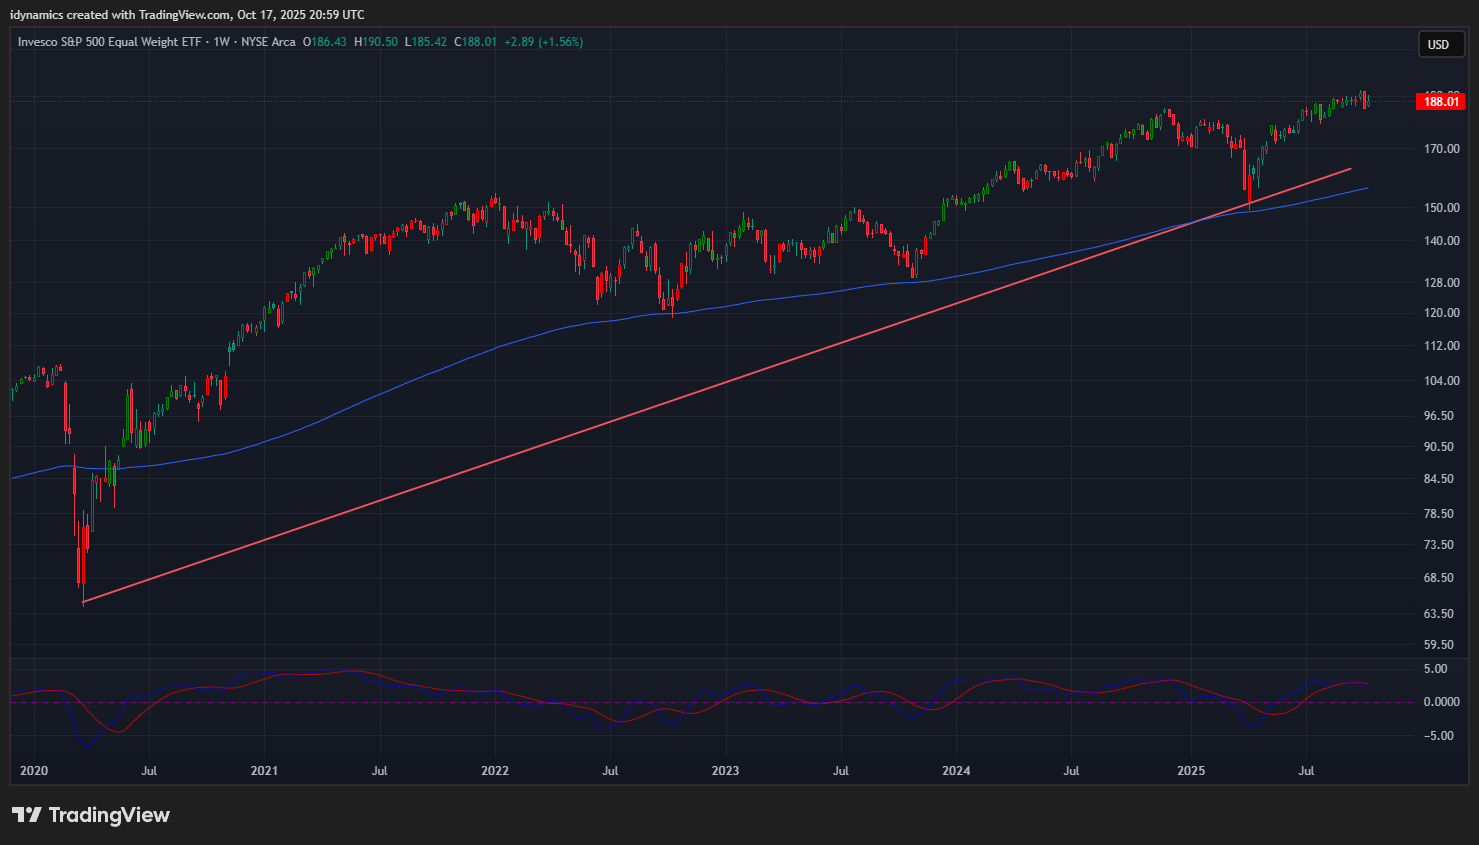
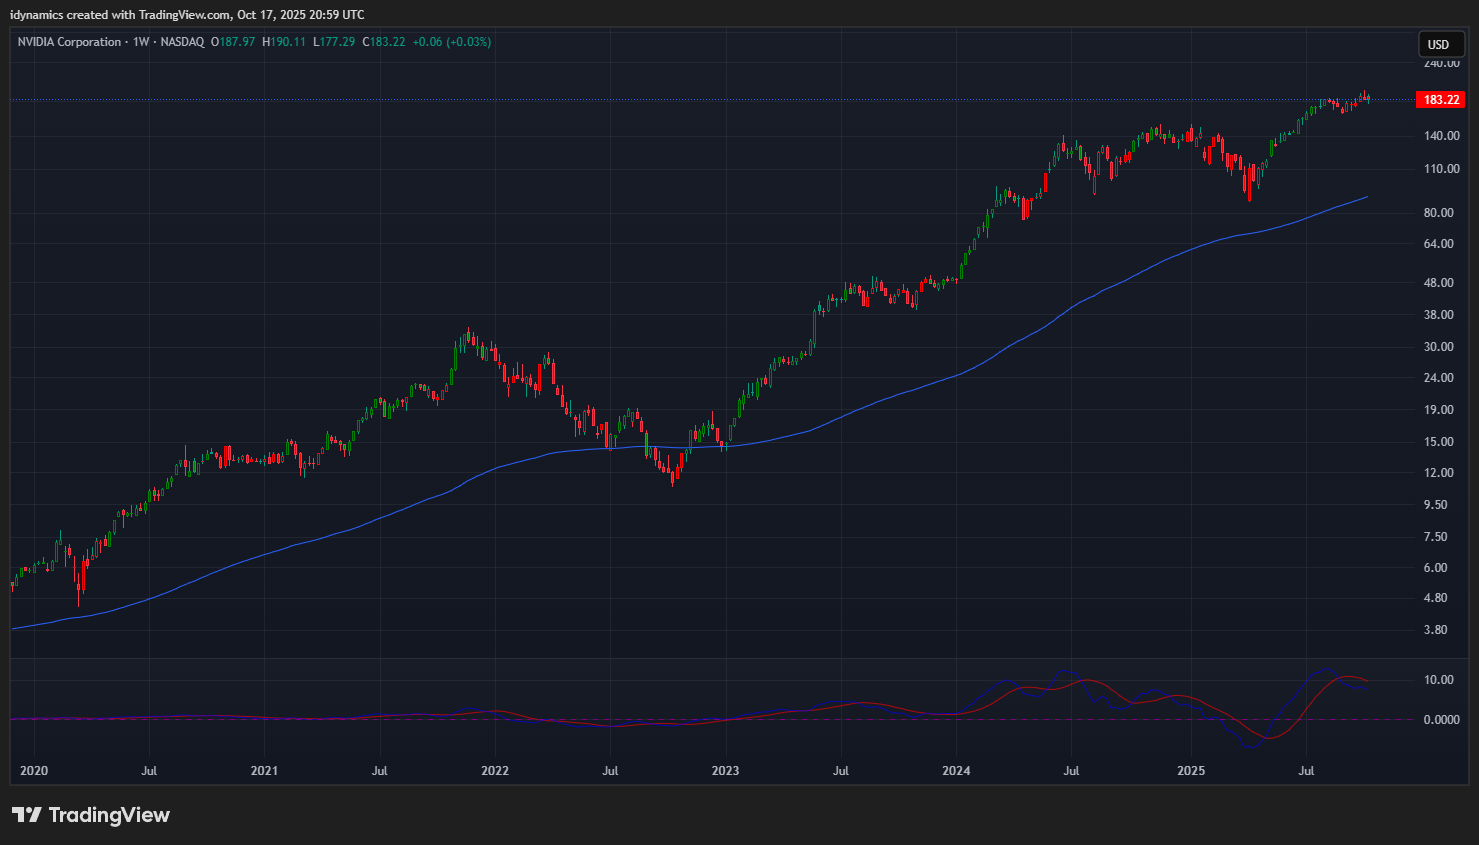
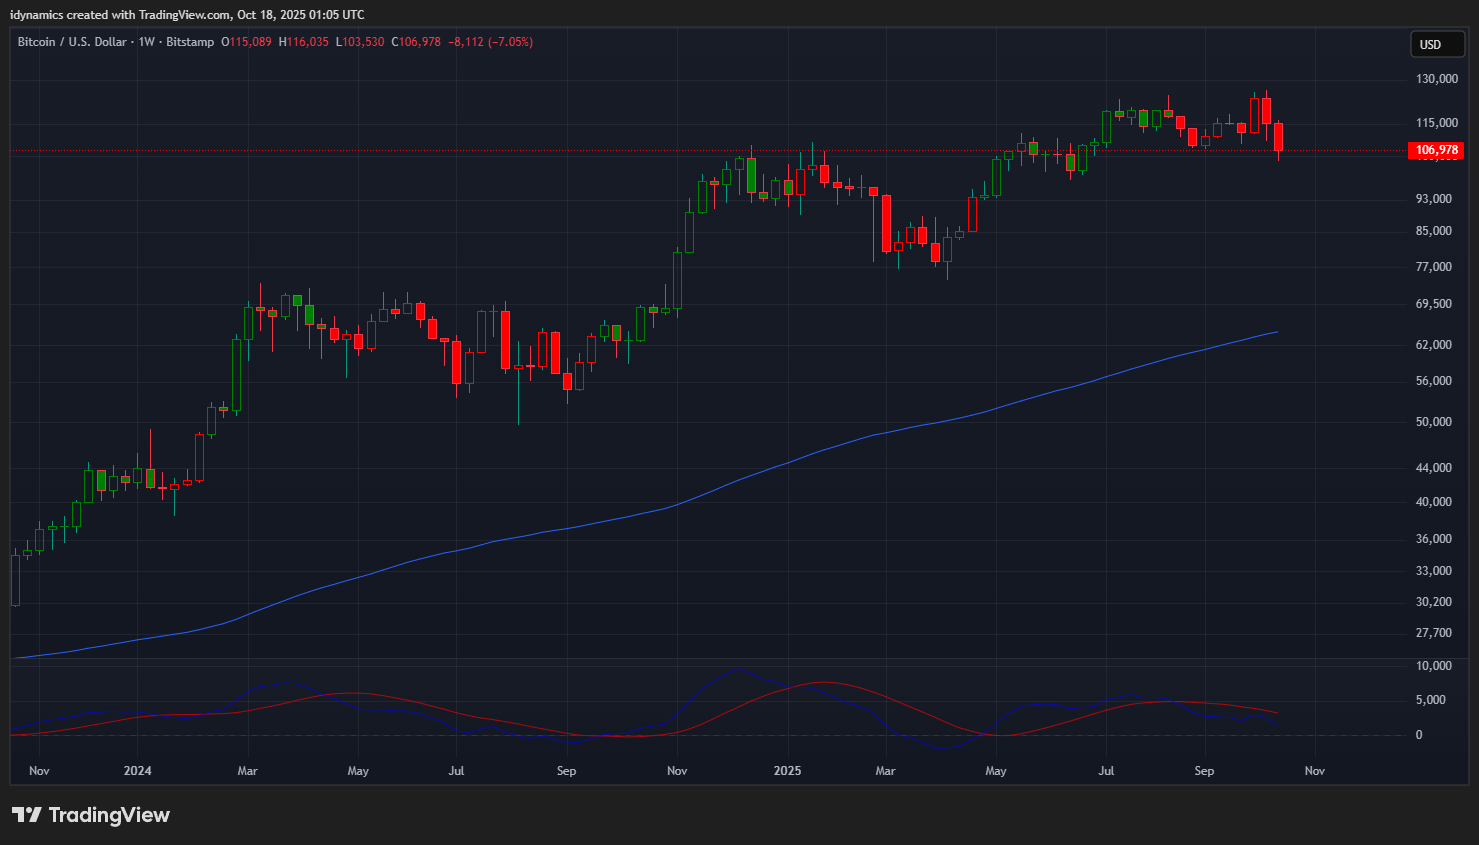
The RSP:SPY continues to deteriorate, setting new multi-year lows. The weekly is trending lower in an oversold position and the MACD is down. Resistance remains at .294. The IWM spiked to a record high but closed on the week’s lows, up +2.36%. The RSP traded an inside week and closed up +1.56% in the middle of the weekly range. NVDA tested three week lows and recovered to close out the week -0.03% in the middle of the range. Bitcoin collapsed to a four month trading low and settled the week down -6.81% in the lower end of the range. Support is pivotal at 98.70. Resistance is 114.90 and 117.60/118,00. McClellan Oscillators are neutral for the Dow. The Yield Curve was flat on the week closing at +0.549%. The 10YR yield dropped, closing at 4.011%. Truflation was flat at 2.21%. Corporate bond spreads are at a 27-year low.
10YR-2YR Yield Curve Daily Close

 VIX Weekly Candles
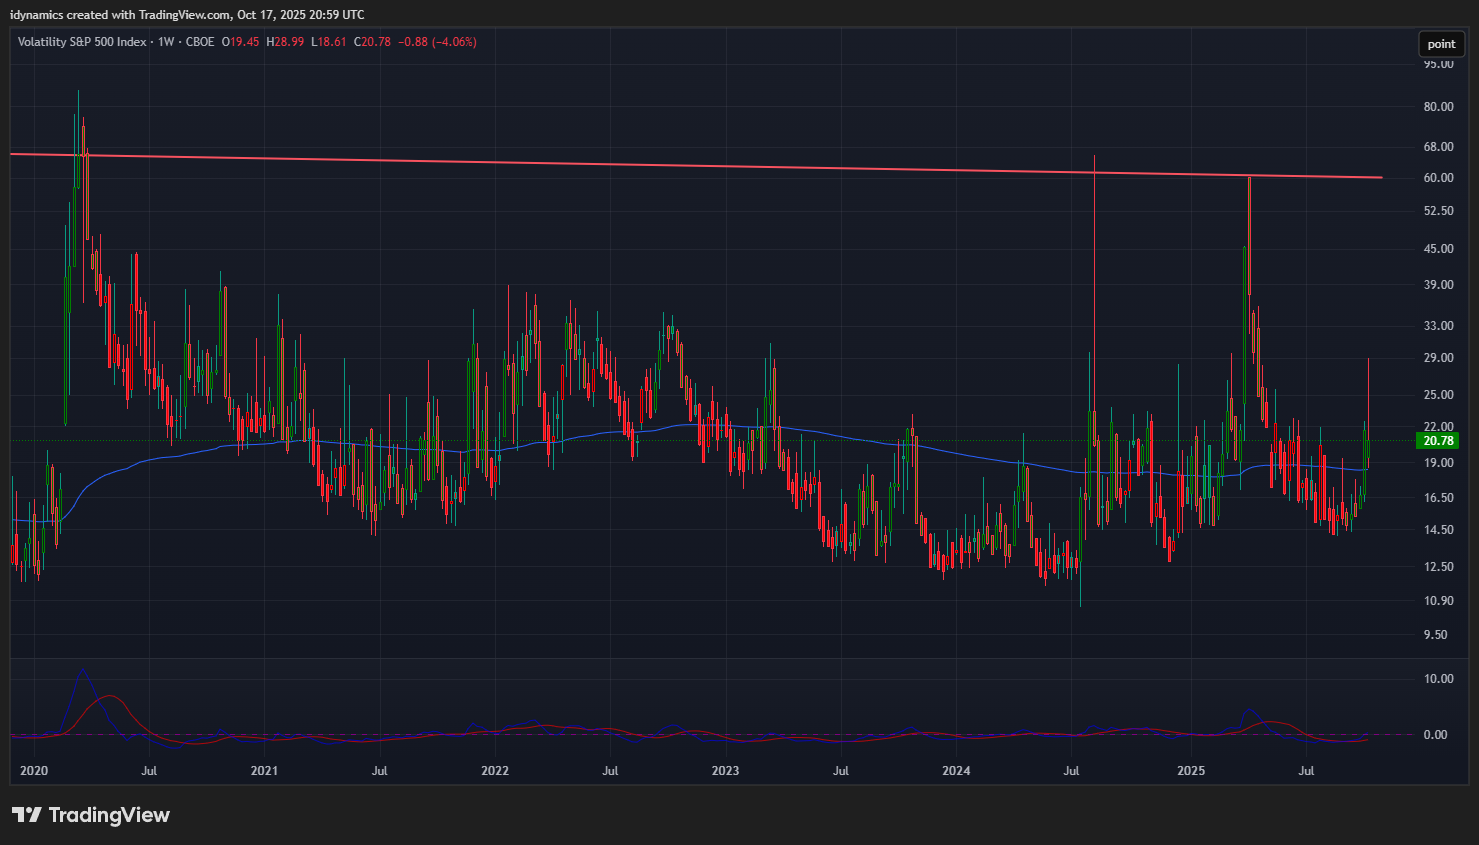
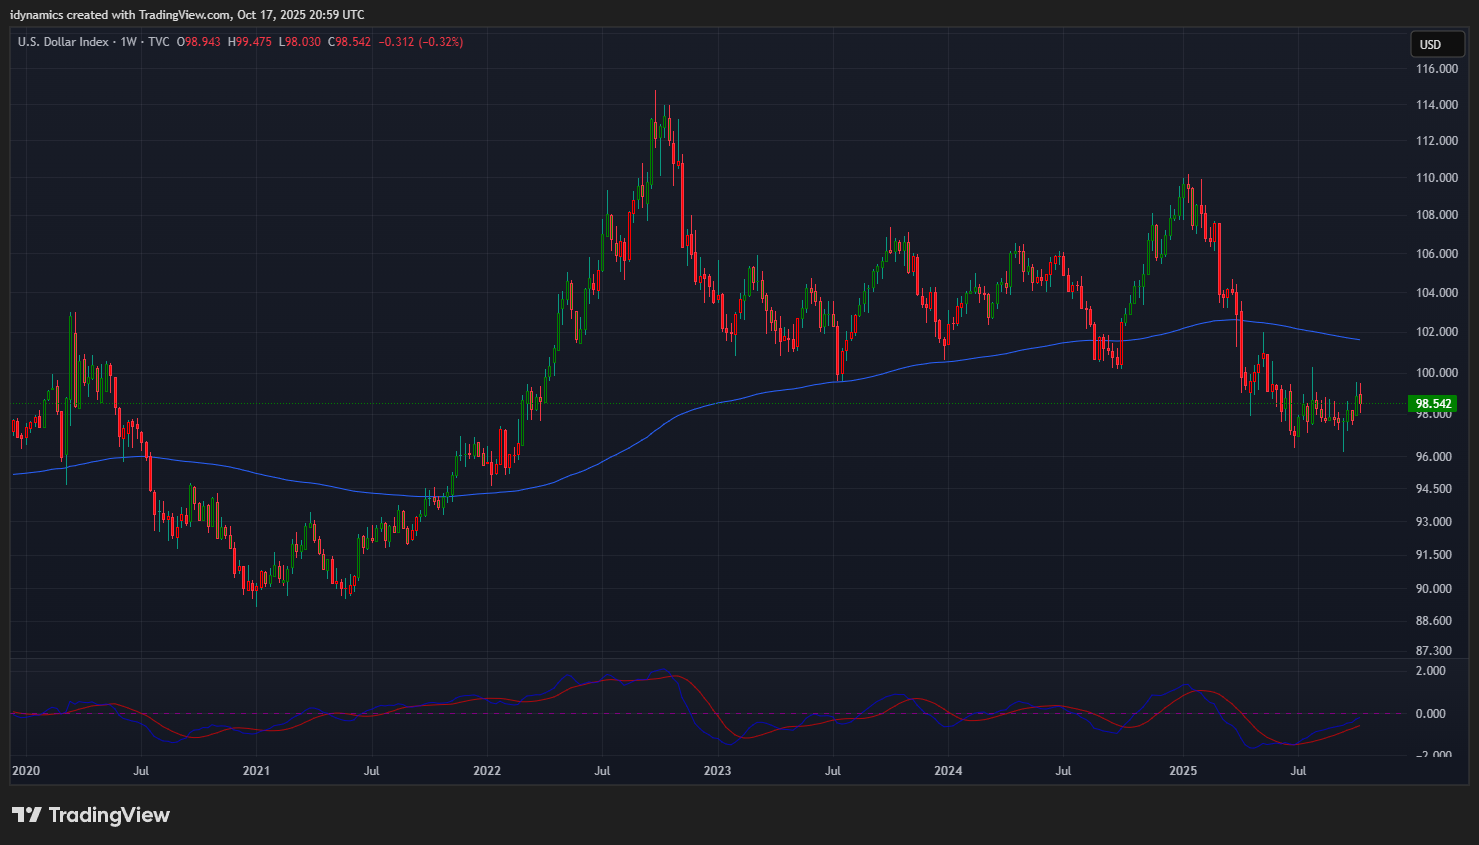
The VIX jumped sharply on the week, hitting five month highs before reversing to close out the week -4.06% in the lower part of the range. The US Dollar held a tight range and closed in the lower half down -0.32%.
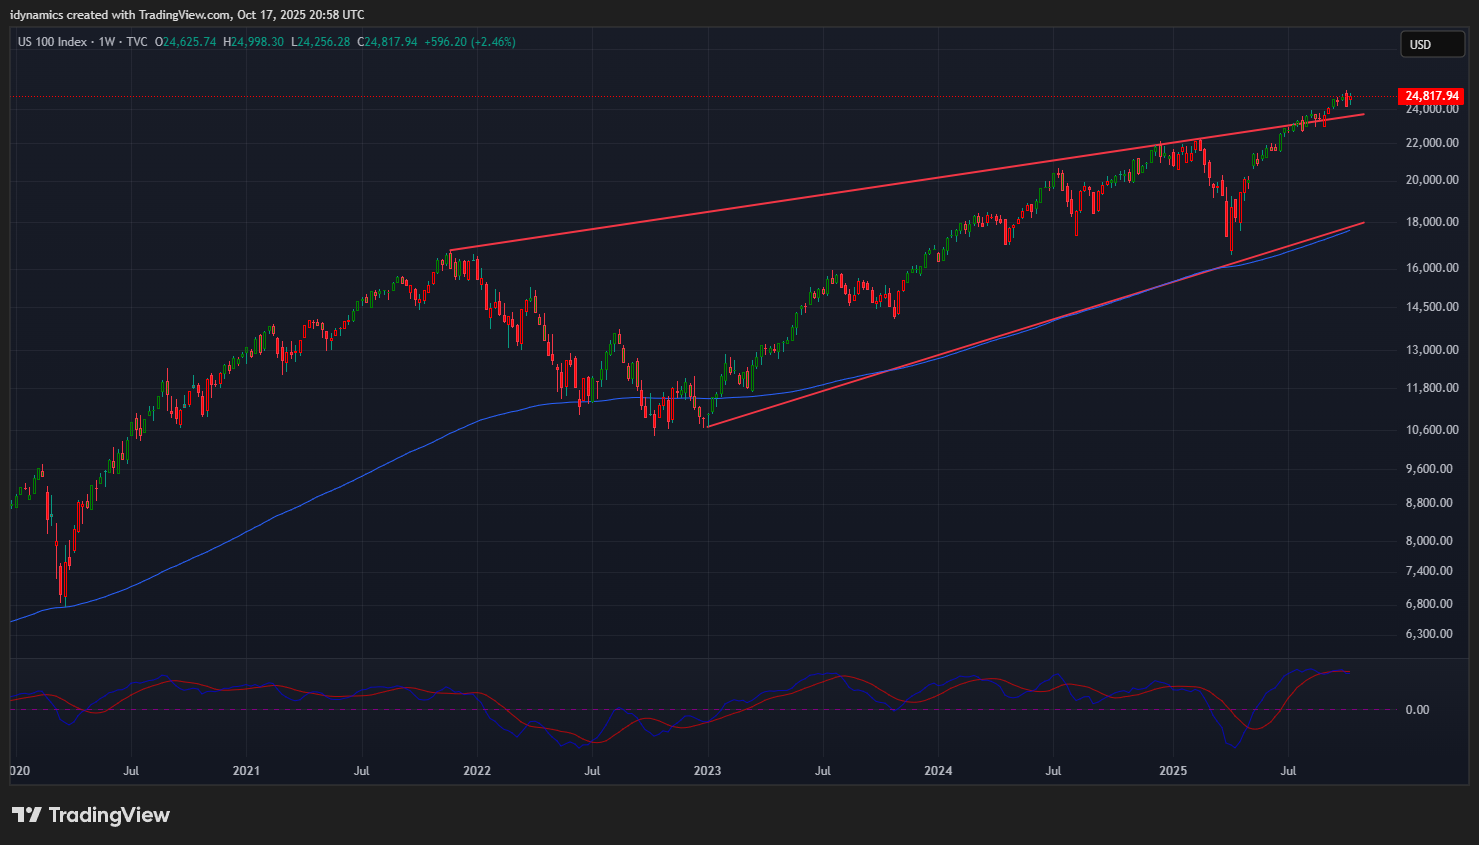
 Nasdaq 100 Weekly Candles
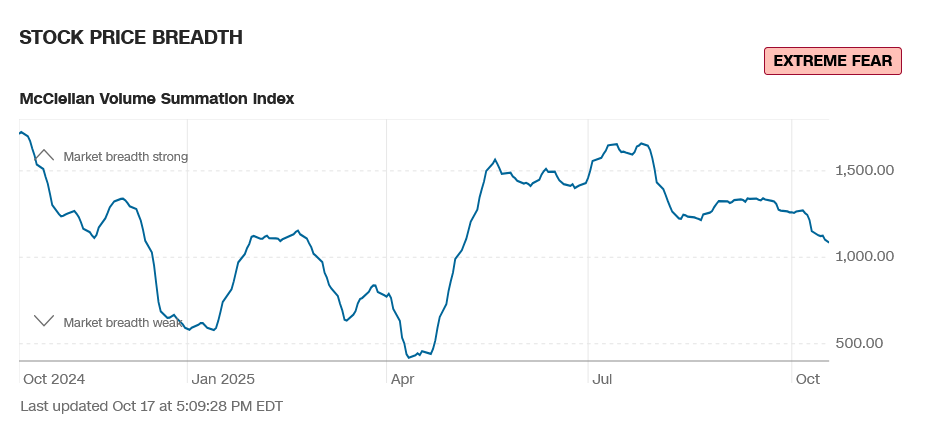
Daily Breadth 
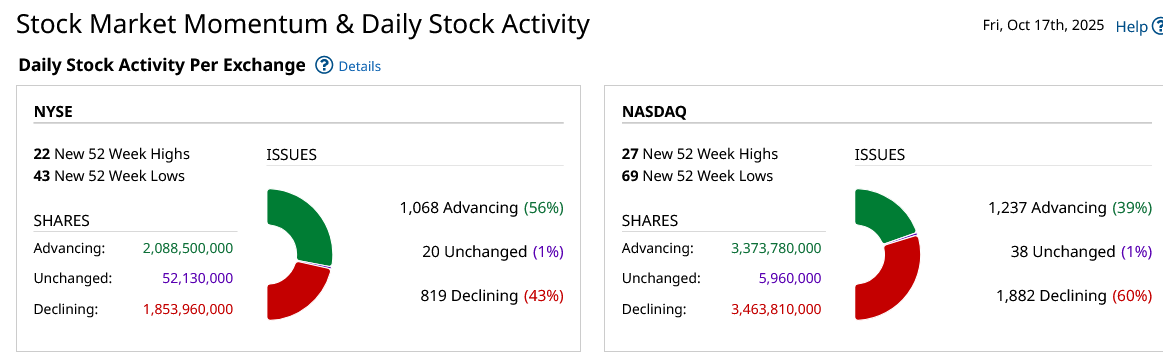
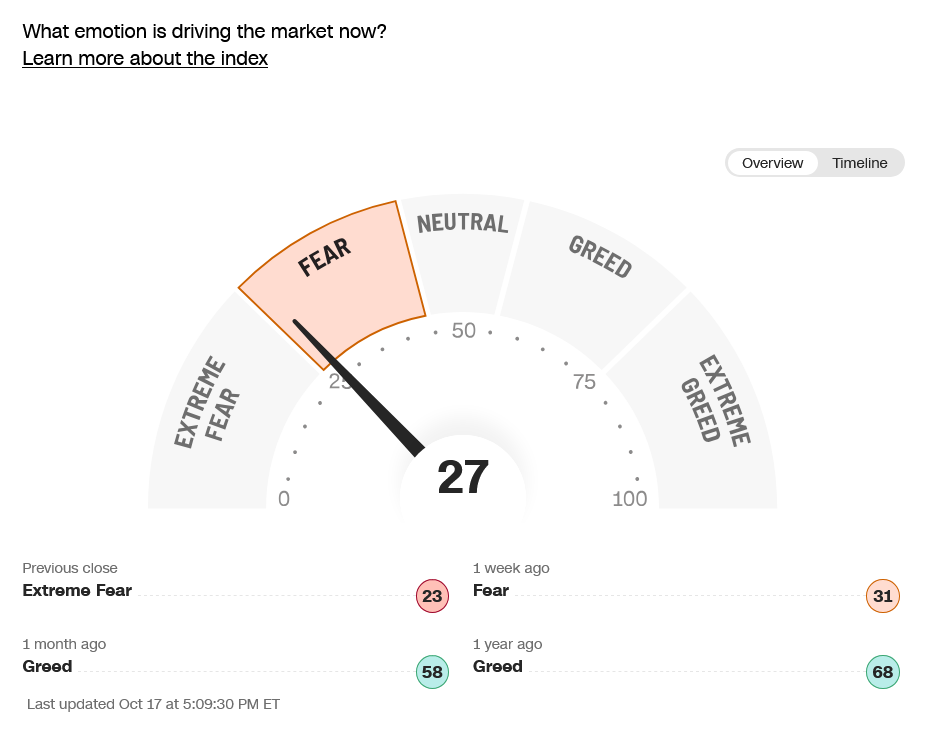
Breadth declined on the week and sentiment now reads extreme fear.
CNN Fear & Greed Index
 AAII Investor Sentiment Survey
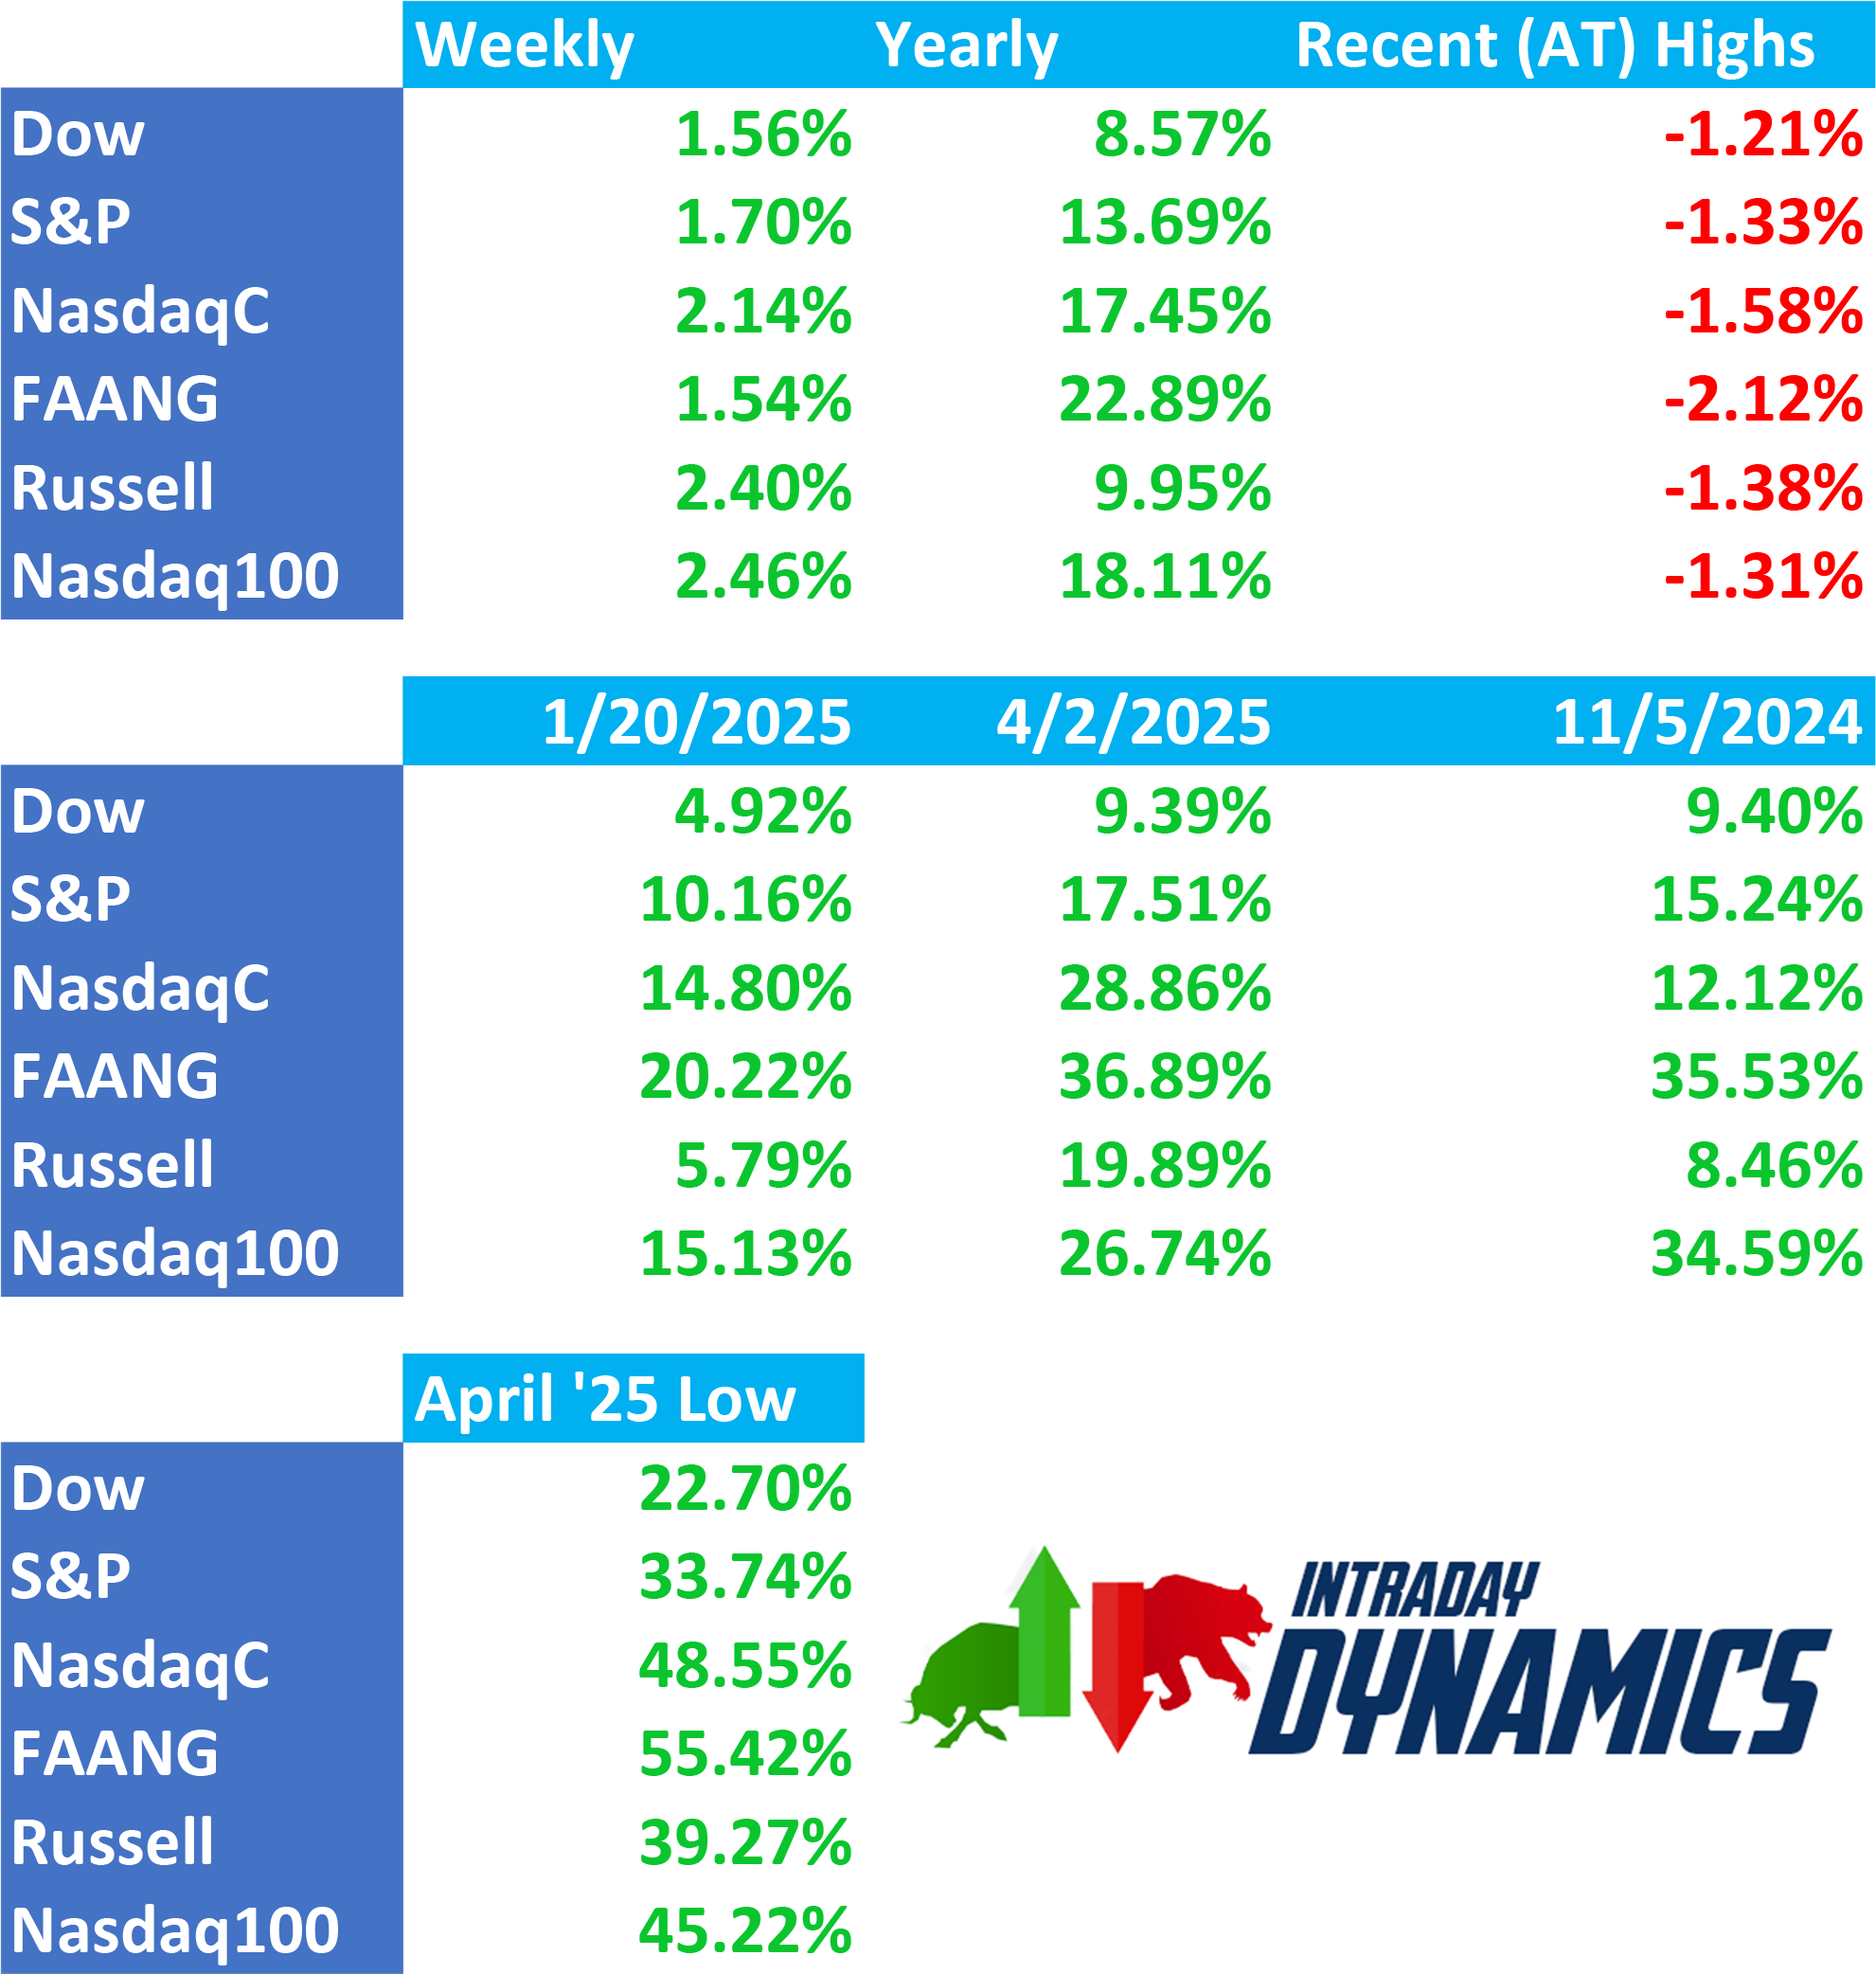
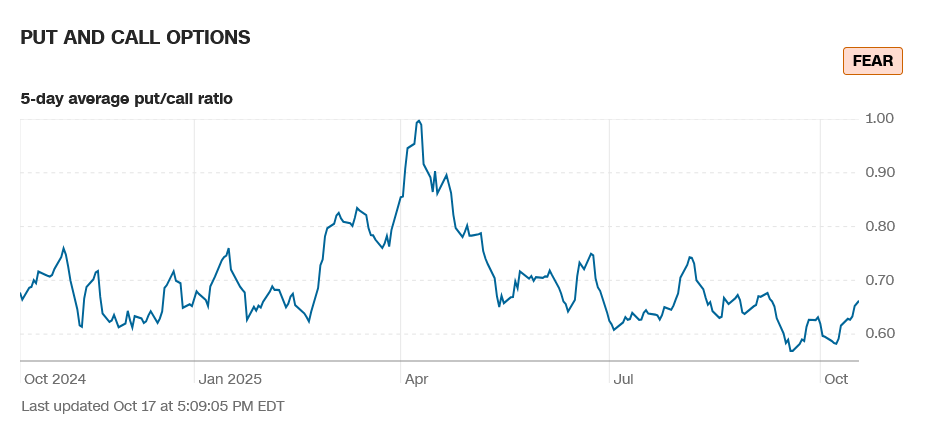
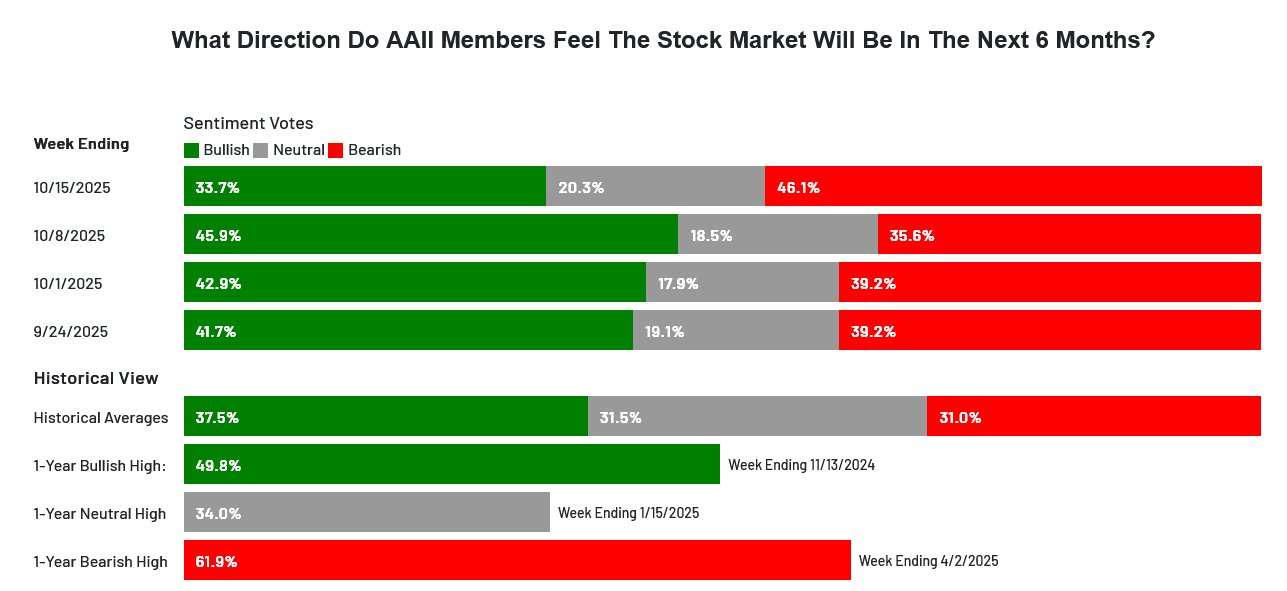 The CNN Fear and Greed Index is 27 and reads fear. Breadth declined on the week and reads extreme fear. Latest AAII Sentiment Survey: Optimism Sinks . The Dow A/D improved to 6962. The VIX jumped sharply on the week, hitting five month highs before reversing to close out the week -4.06% in the lower part of the range. The Put/Call closed at 0.66 and reads fear. The 52-week, A/D dropped to +2.45% and reads neutral. The Dow closed the week up +1.56%, closing in the upper half of a reversal range. The S&P traded an inside week and closed in the upper end of the range up +1.70%. The Nasdaq Composite was up +2.14% and the Nasdaq 100 was up +2.46%. The NYSE FANG closed up +1.54% toward the middle of the weekly range. The Russell was up +2.40% in the middle of the range. The 10-year notes closed higher in the middle of the range. The yield on the 10YR declined to 4.011%.
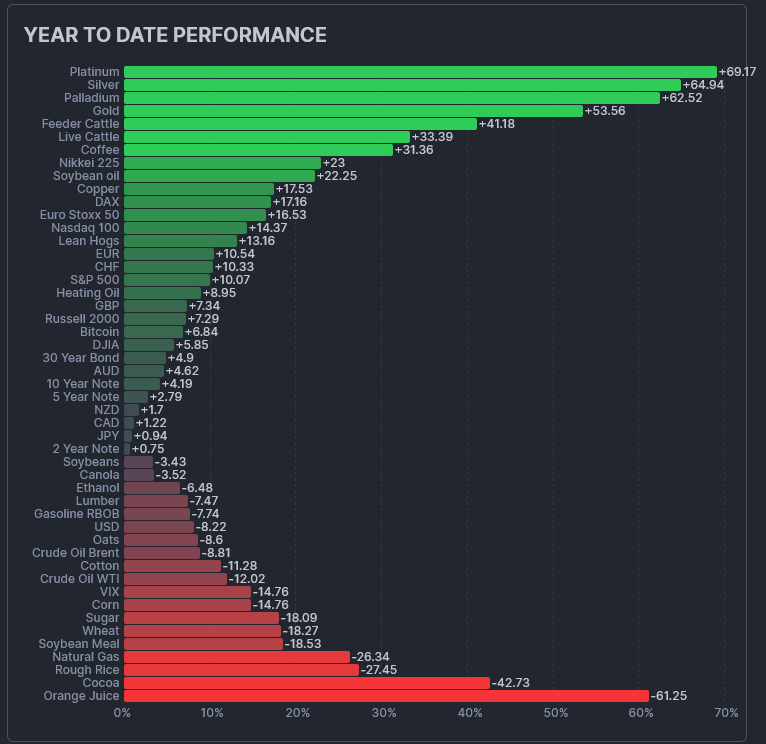
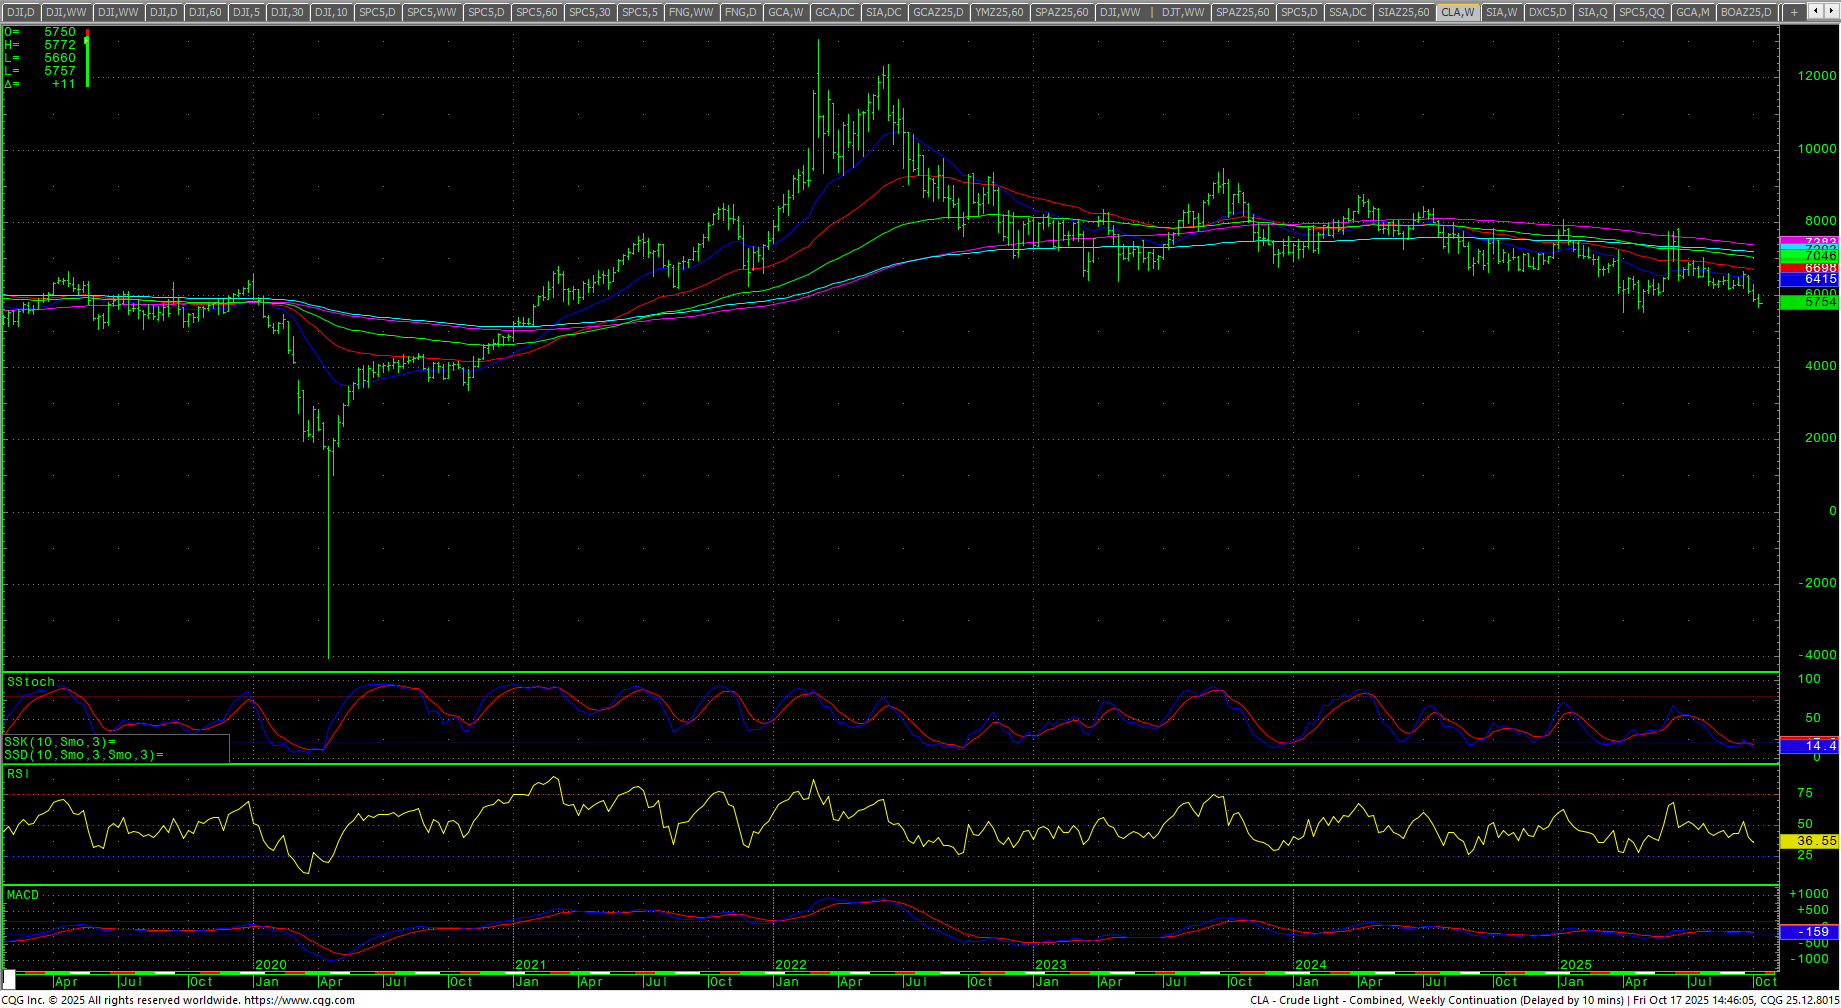
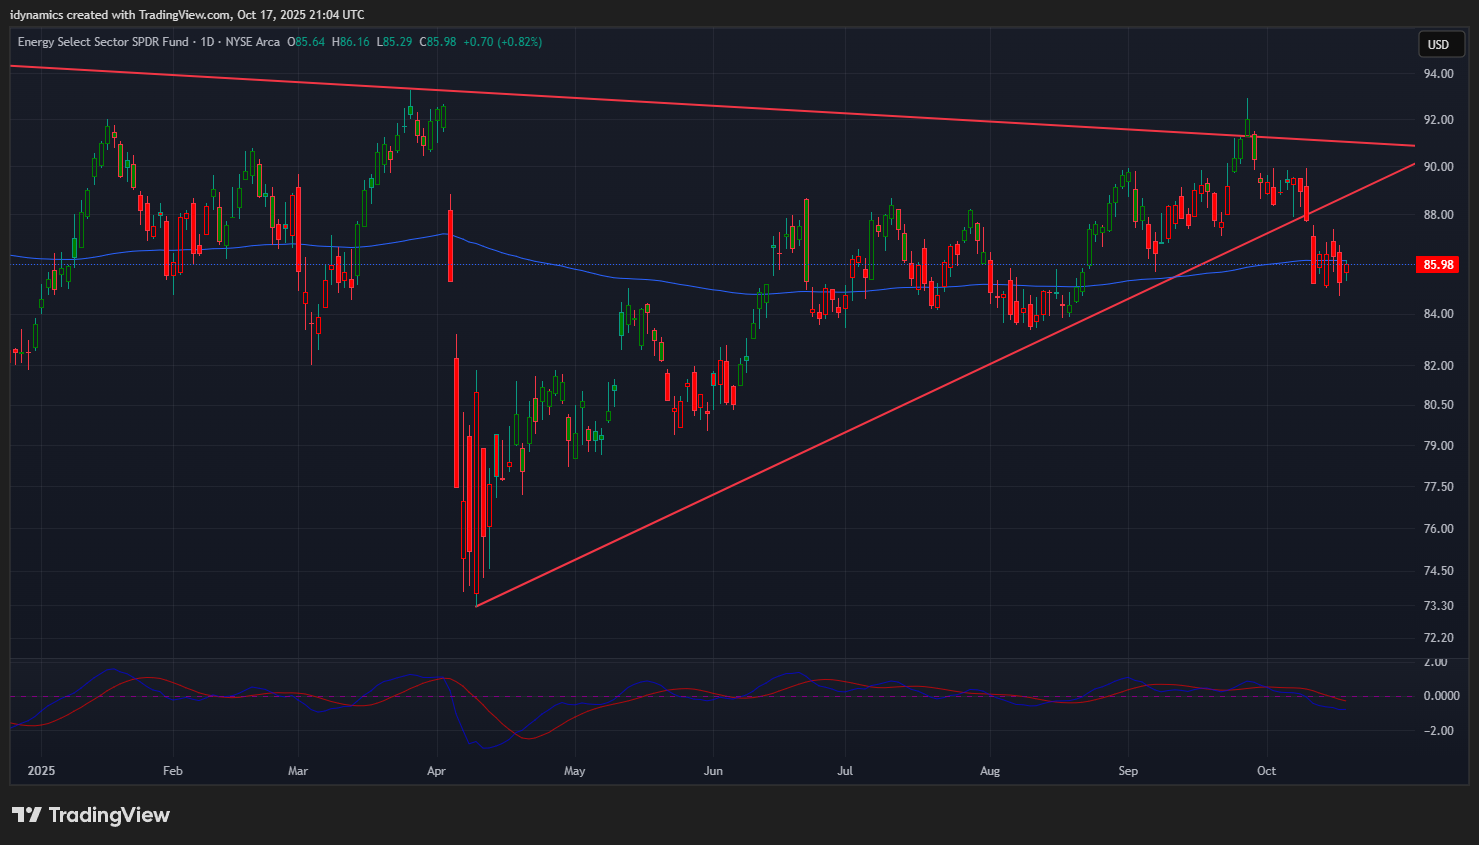
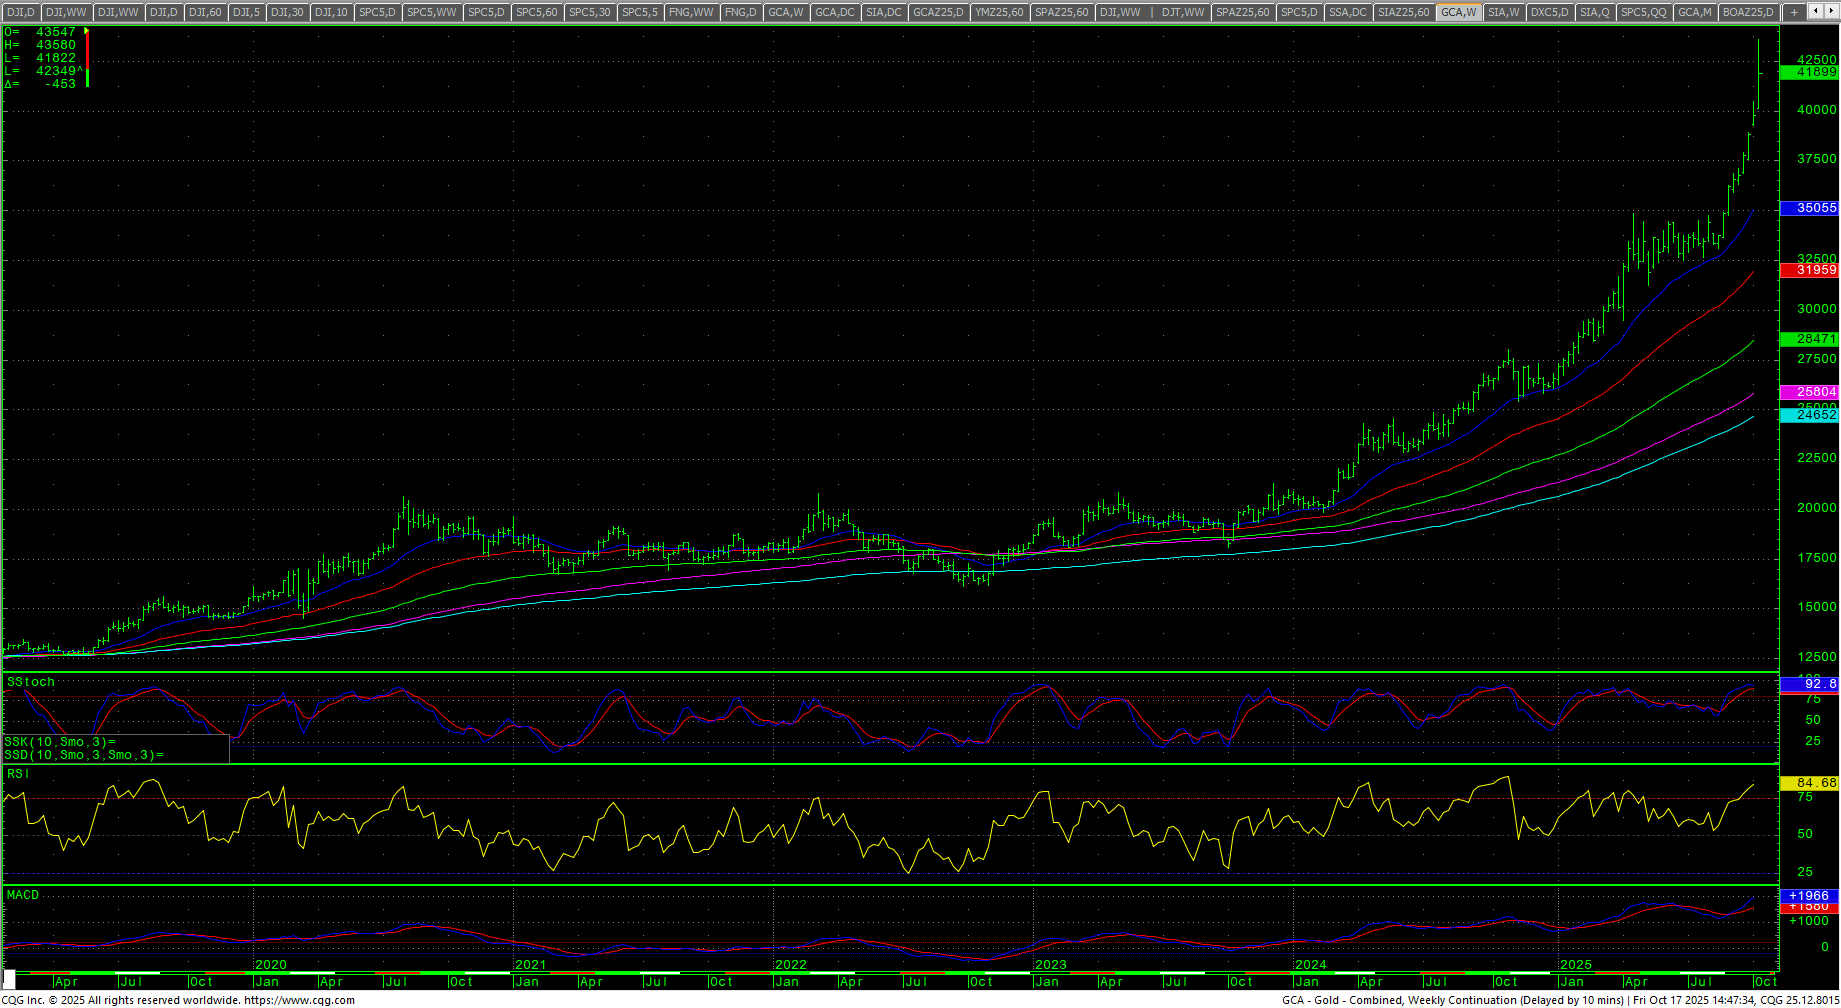
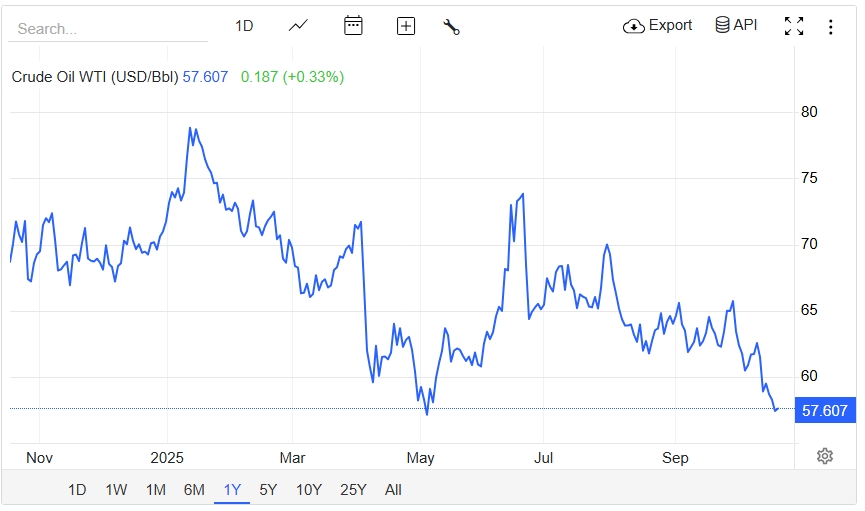 The CRB Index closed down -1.76% as crude collapsed. Crude oil plunged to over a four year low under $60 and closed at the lowest weekly close since 1 February 2021. The XLE followed oil and tested two month lows but managed a slightly higher close on the week. Gold had its biggest week (CFDs) since 2020 as it neared the $4400 level before cratering on Friday. Silver exploded with CFDs setting ATHs above the $54 level before crashing on Friday. The CoT for the S&P 500 still shows small speculators entering the market. The CFTC S&P 500 Non-Commercial Net Positions ios not reporting with the government shutdown. Last reading was -172.549K.
Timing Points
Wednesday is minor timing. The next critical timing dates are 10/28-29. We won’t be seeing the expected reports again this week. 
- 10/22 ***
- 10/28-29 *** X
- 11/05-06 *** X
- 11/14 **
- 11/19-20 ***
- 11/25 **
- 12/04 ***
- 12/15 *** X may run through
- 12/17 *** X key to bonds/interest rates
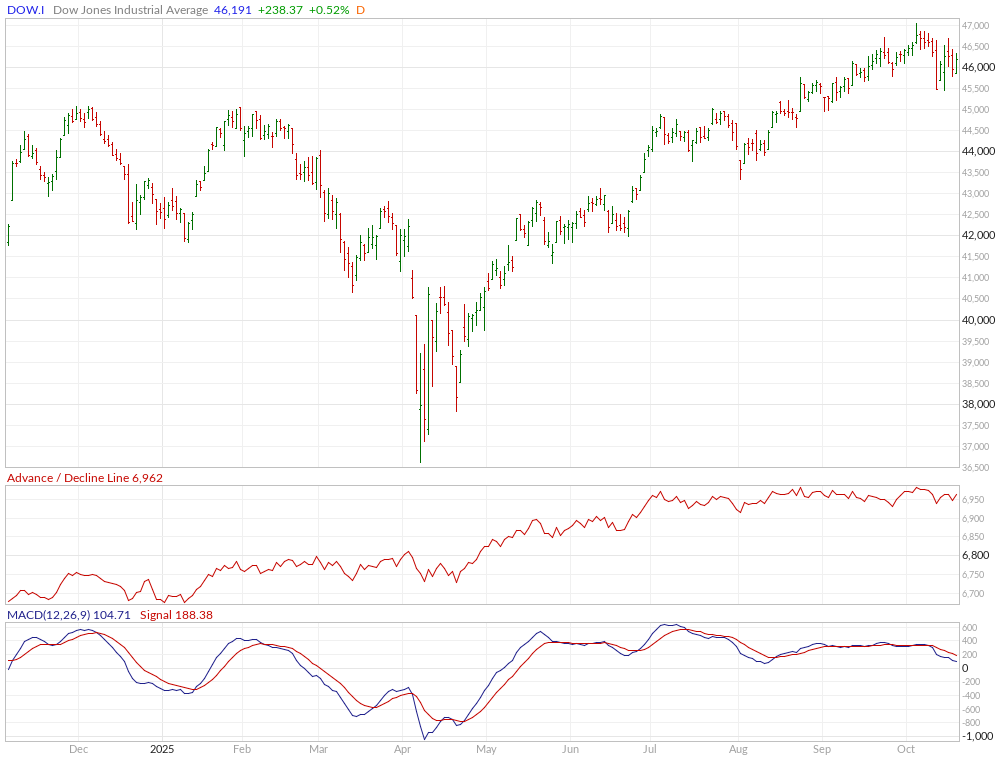
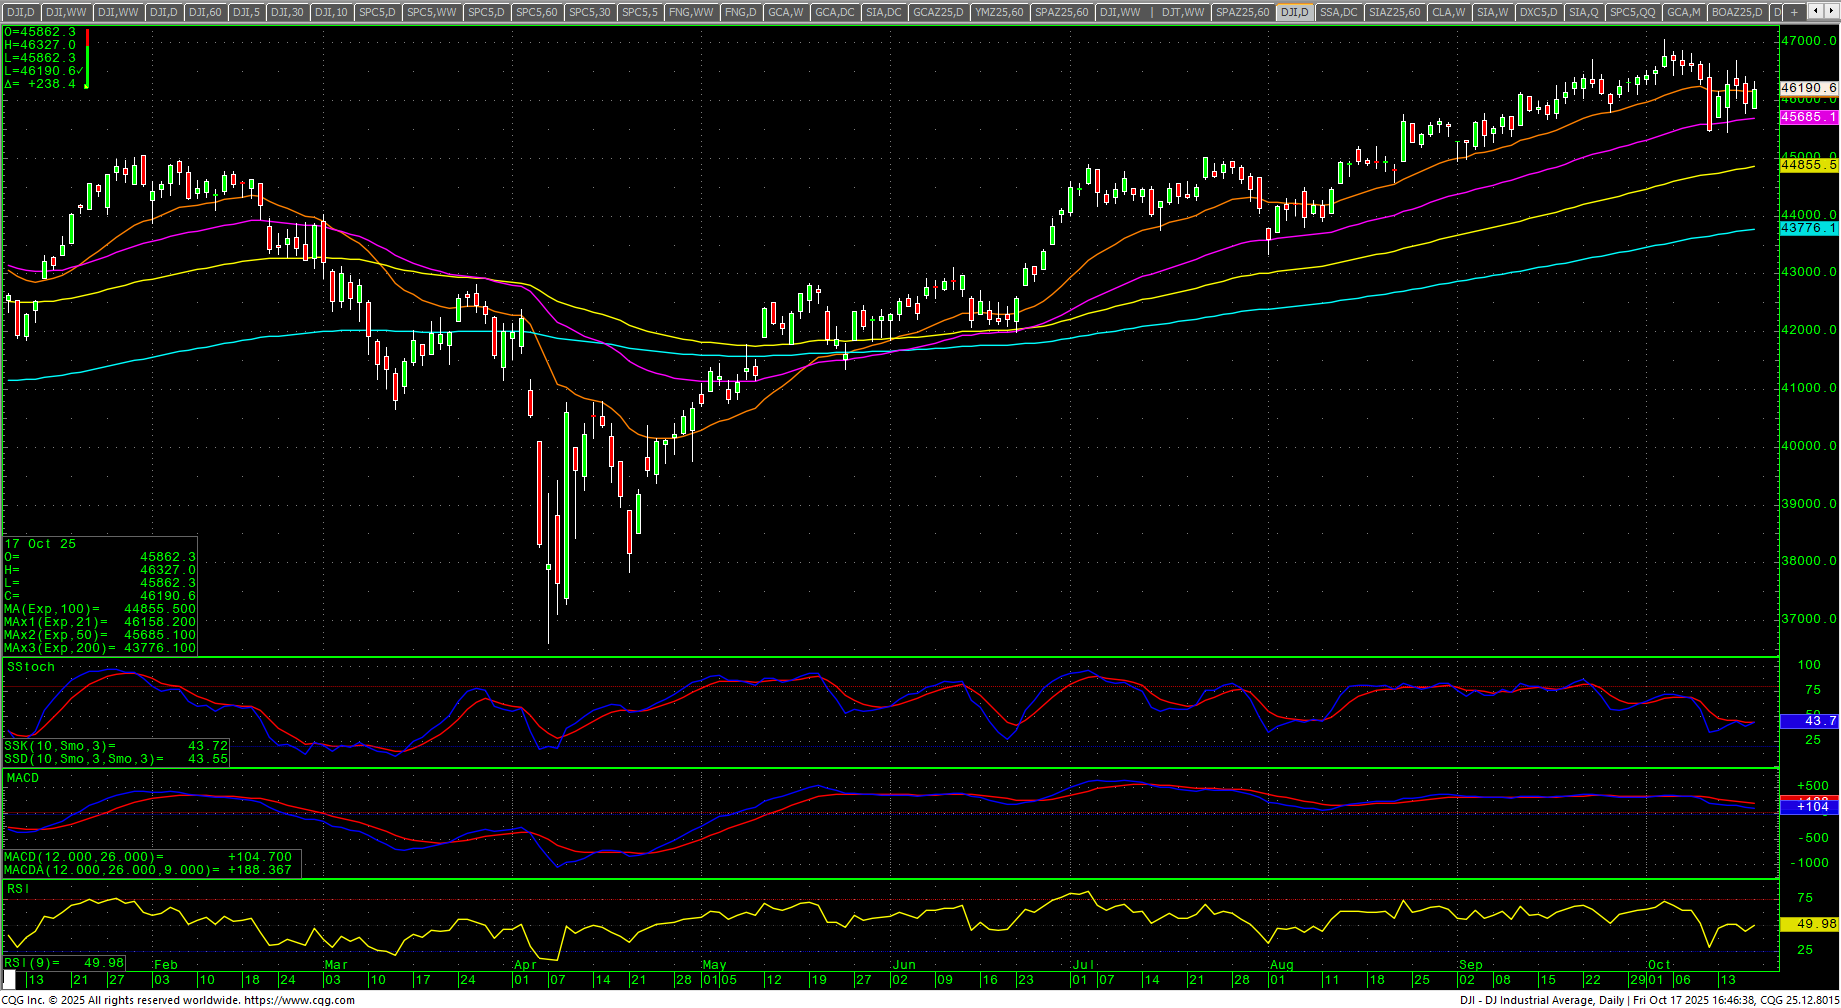
Dow Jones Industrial Average
Dow Jones Industrial Average Weekly H-L-C
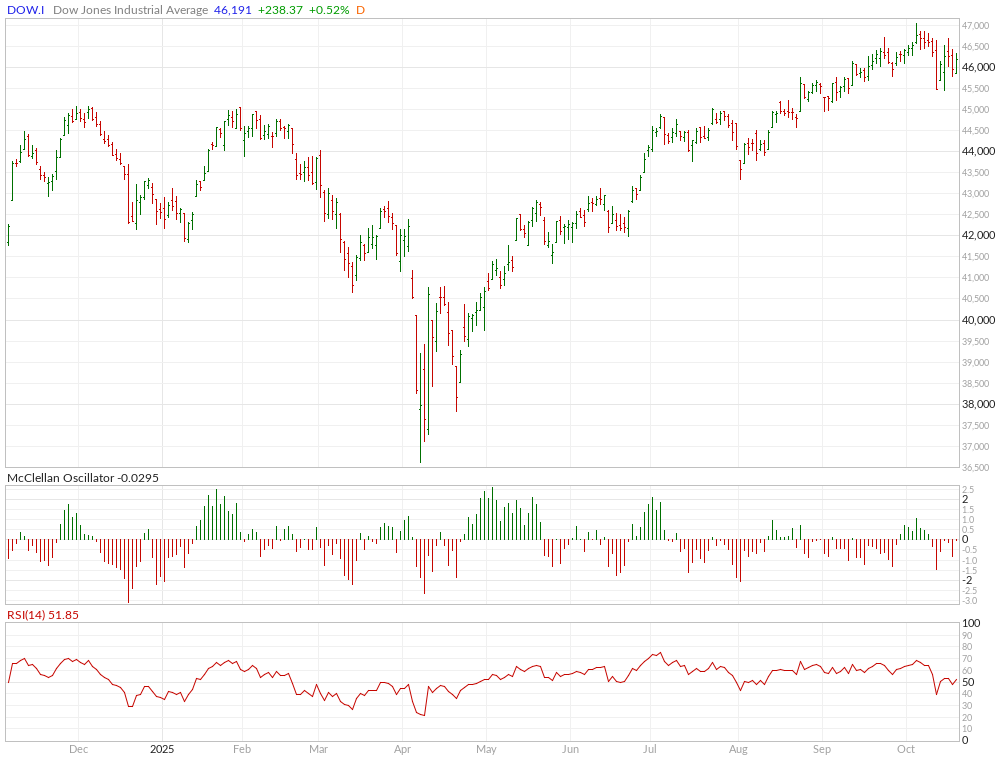
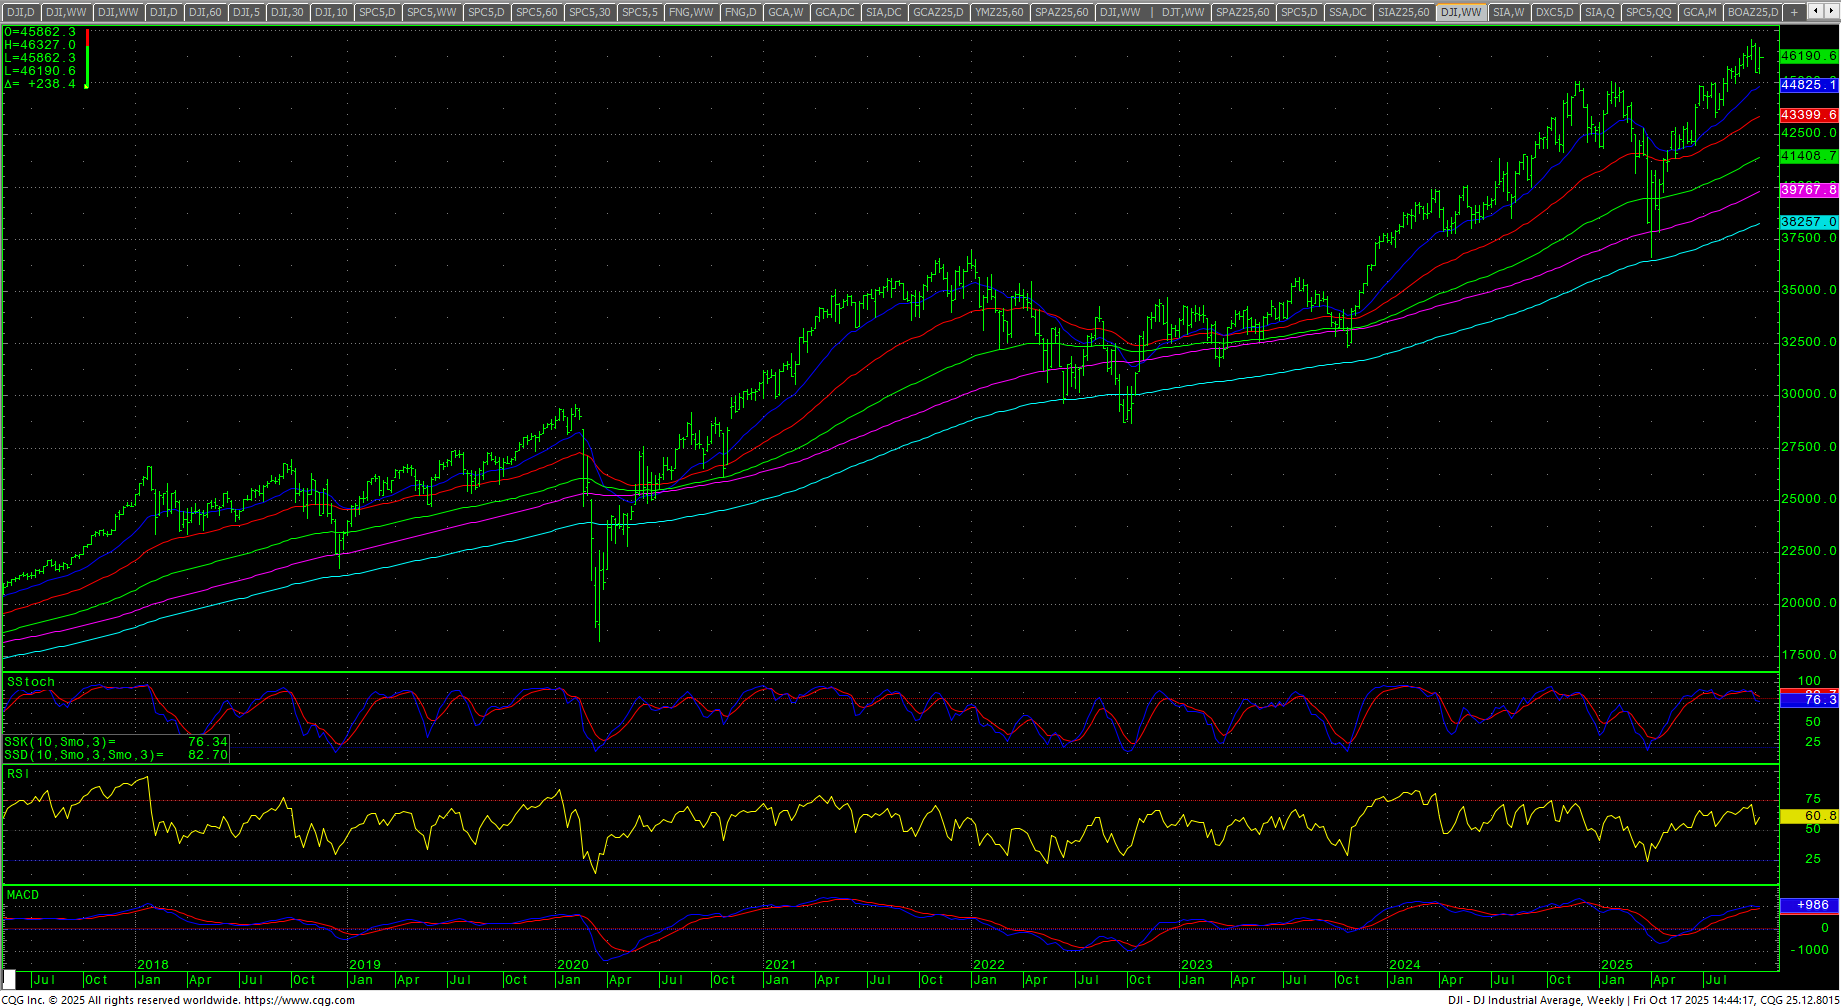 The Dow closed the week up +1.56% on upper half of a slight reversal range, but registered a bearish candle. Prices are building a flagging pattern off the recent tops (see above comments for short-term thinking). The daily stochastics and MACD are down as they react to numerous preliminary bearish divergences. The daily RSI improved to 49.98. The 200-day MA starts the week at 43776.10 and is at record highs. The weekly has hooked lower in the stochastics from overbought conditions. The action leaves most of the numbers the same.
Dow Jones Industrial Average Weekly Candles
 Resistance is 46250, 46327 and 46439/46443. A drive over 46443 should minimally test the short-term death zone at 46650/46672 with an hourly swing at 46694. Rallies through 46694 should retest the record intraday highs at 47048/47070. Closes over 47070 set up 47142 with counts to 47214. Closes over 47214 should test 47286 with full counts toward critical resistance of 47400/47430. Closes over 47430 will open counts to 47520 and 47610.
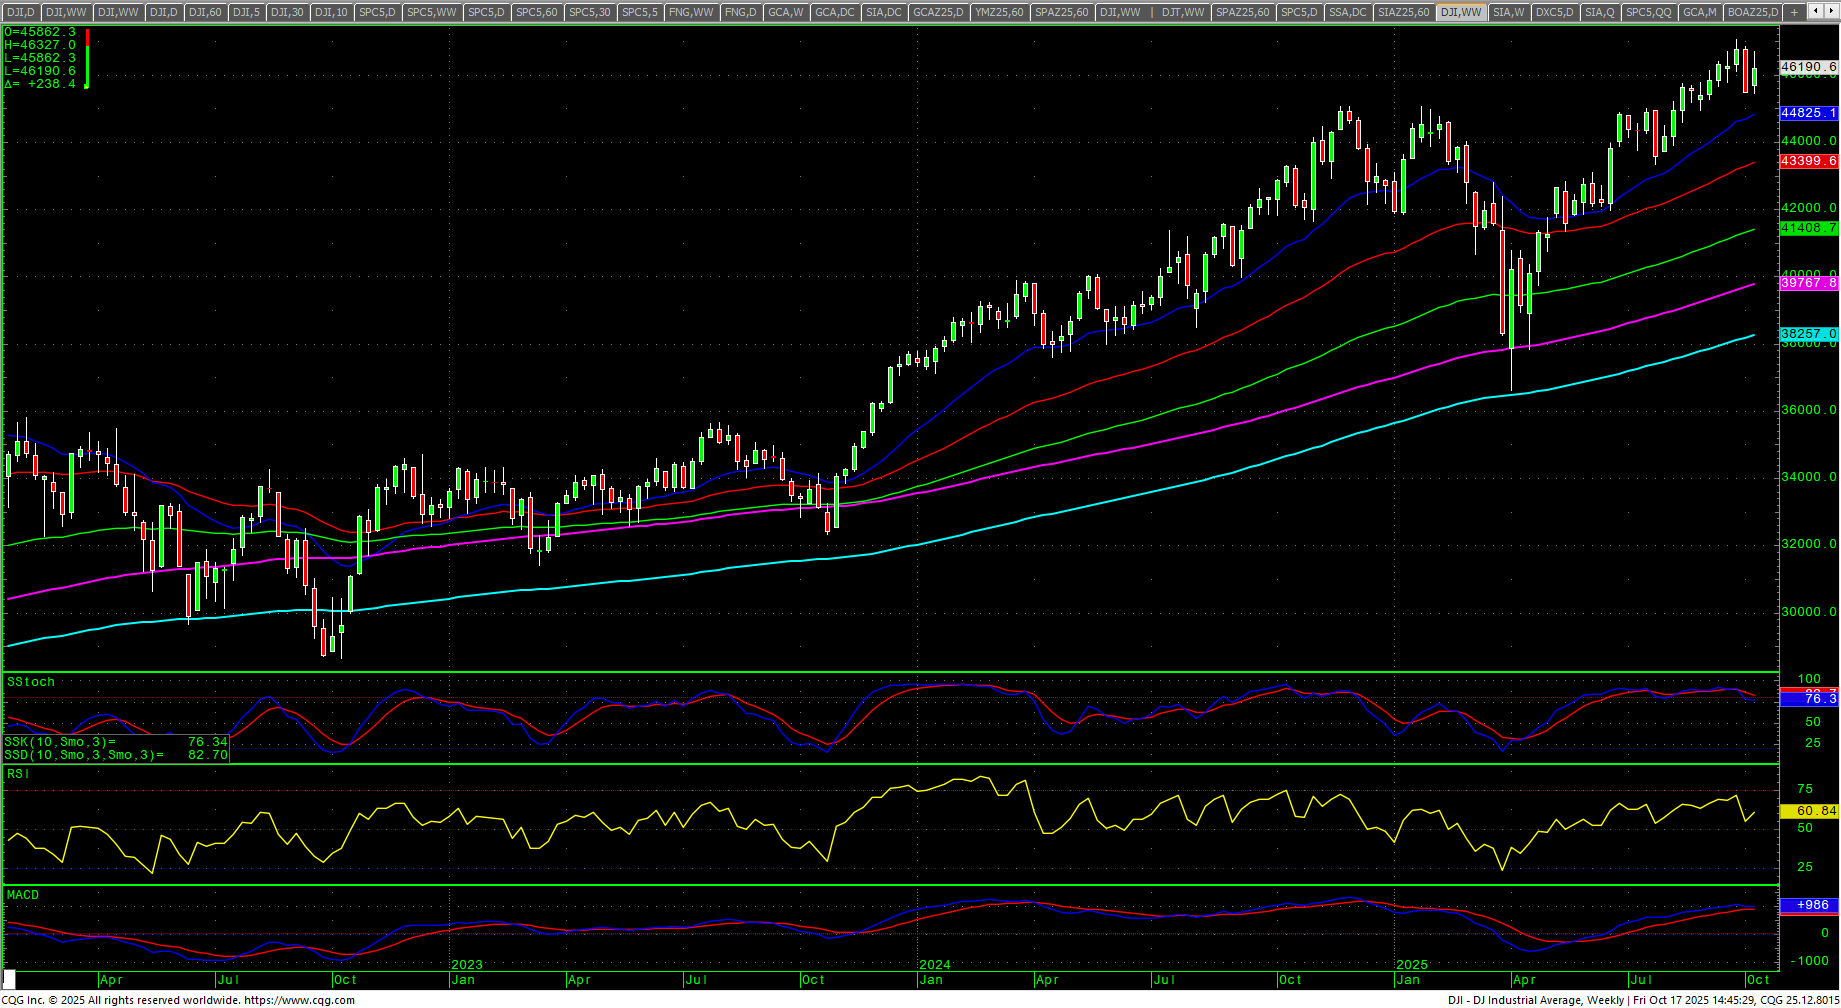
Dow Jones Industrial Average Hourly H-L-C
 The hourly is neutral on Friday’s close. Support is 45989/45986 and 45917/45909. Under 45909 sets up a retest of the hourly swing at 45781. A breakdown under 45781 should test 45632. A breakdown with closes under 45632 sets up 45195 with counts to critical short-term support at 44757/44754 with support at 44976 and 44851/44948. Closs under 44754 opens counts to 44268 through 44215. Under 44215 sets up a retest of the 43340 area.
Dow Jones Industrial Average Daily Candles
| Resistance | Support |
|
|
S&P 500 Cash Index: SPX
S&P 500 Index Weekly H-L-C
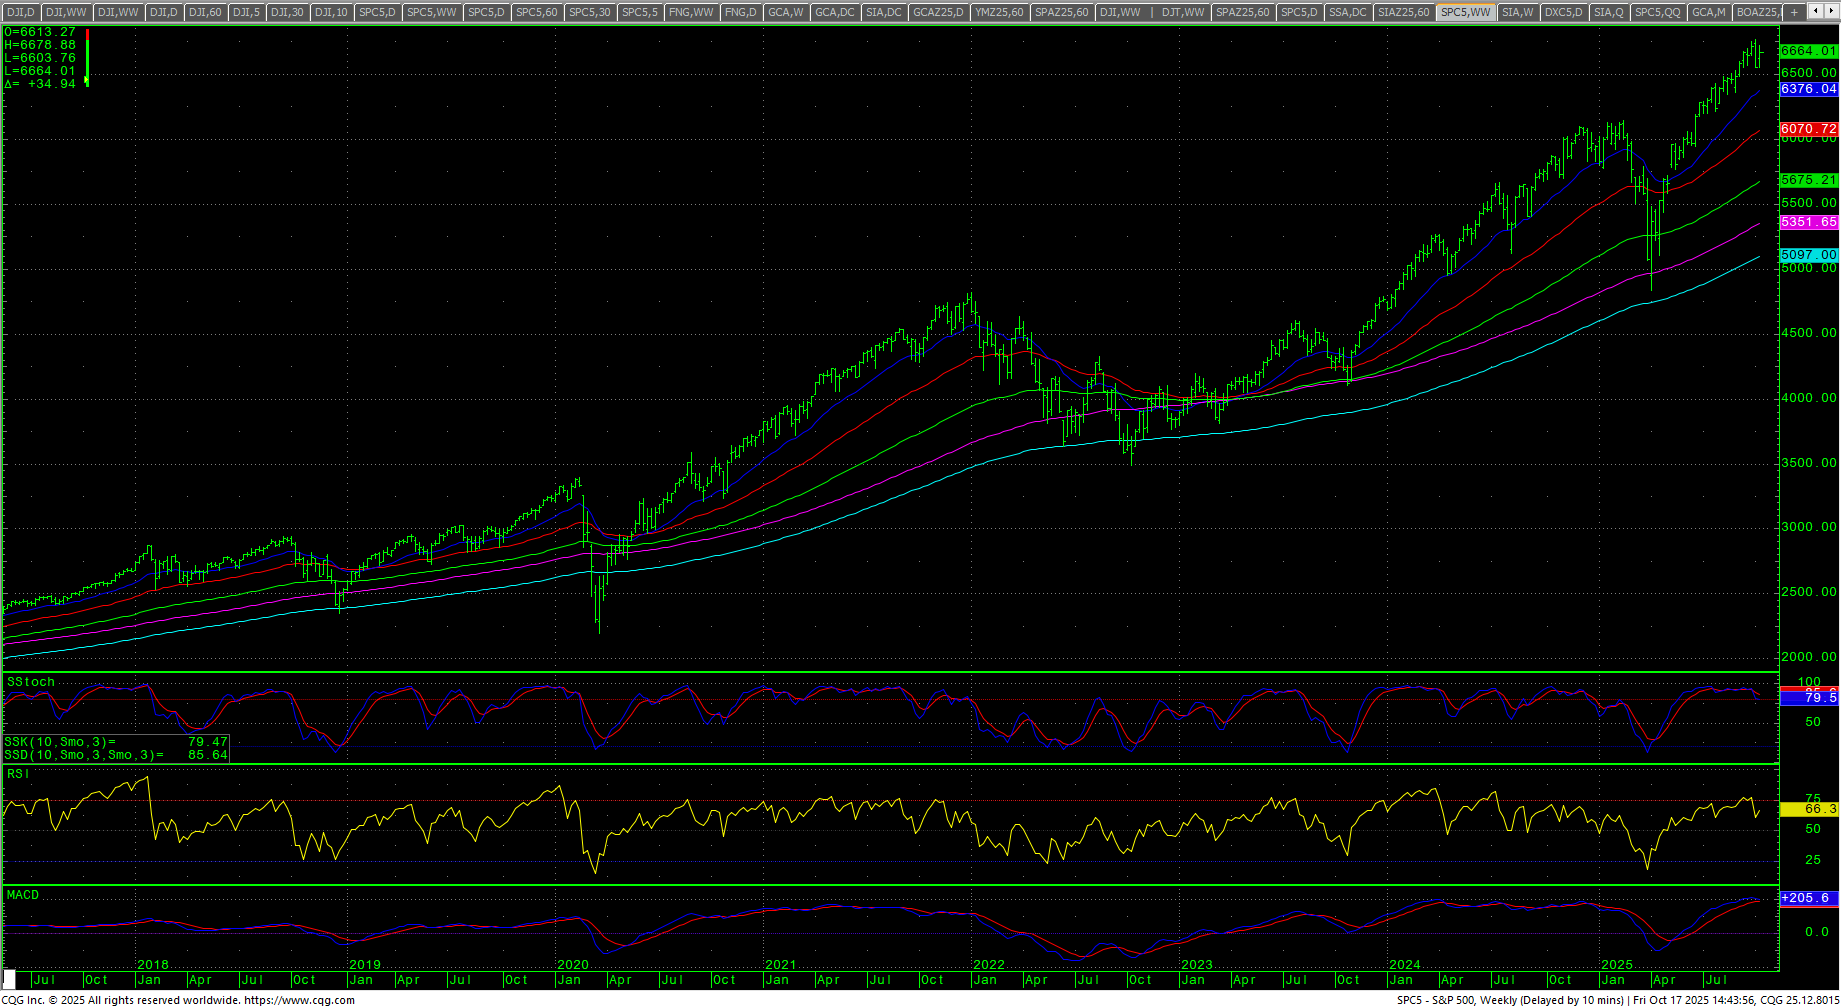 The S&P traded an inside week and closed just to the upper half of the range, up +1.70% as prices build a flag to the side of the record highs. The daily is down as the stochastics and MACD react to multiple bearish divergences. The weekly has hooked lower with a bearish divergence. The daily RSI recovered to 50.86. The hourly is neutral with Friday’s collapse. The 200-day MA is 6149.70 and at record highs.
SPY Weekly Candles
 Resistance is 6682/6685 and 6711/6714. A drive above 6714 should retest the intraday highs at 6762/6764. A move above 6764 should test 6800. Closes over 6800 can carry to 6872 and 6908. Closes over 6908 have counts to 6944 and 6980 through 7016. A close over 7016 offers counts to 7088, 7160 and 7214. Closes over 7214 setup a drive to 7250 and 7286 while opening counts as high as 7448.
S&P 500 Index Hourly H-L-C
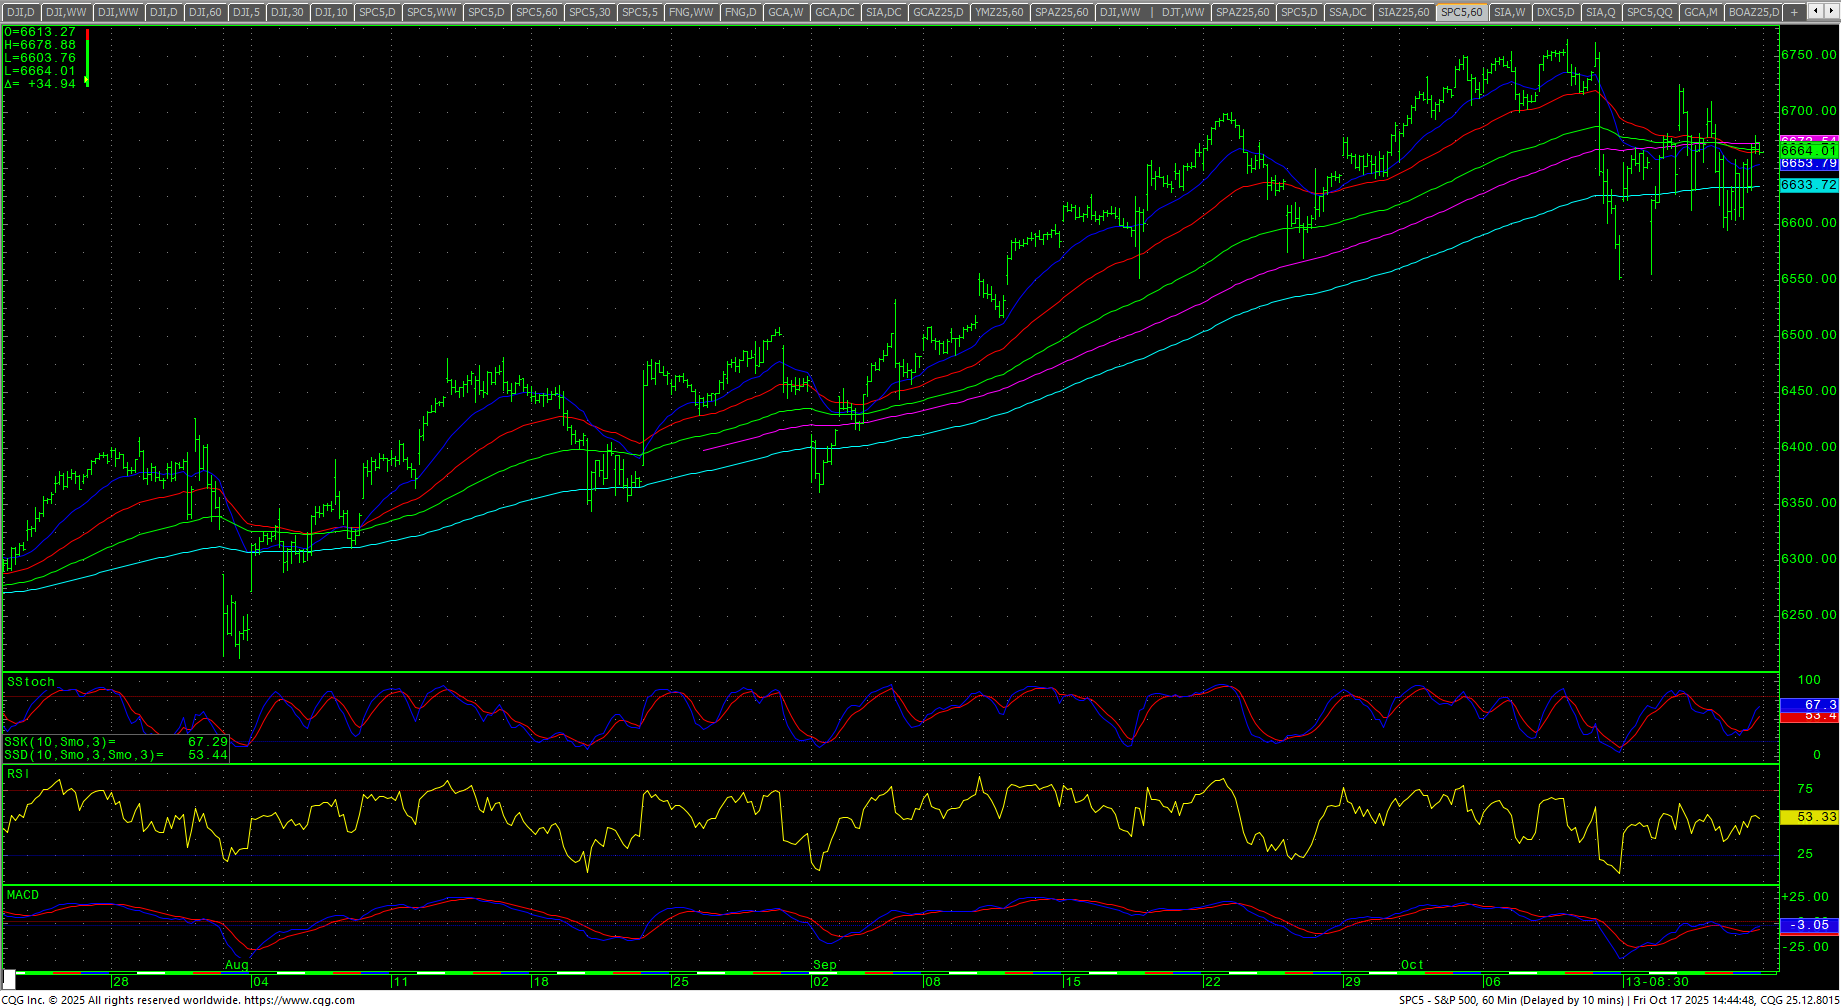 Support is 6637 and 6618/6616. A breakdown under 6616 should test 6594/6591 and retest the swings at 6555/6550. Closes below 6550 suggest a test of pivotal near-term support at 6514/6510. Closes under 6510 open counts to key support at 6361/6360. A breakdown under 6360 should test 6307 with full counts into the 6027/6026 level with critical hourly support at 6212/6201. Daily closes under 6026 should minimally test 5952 and 5799/5798 with counts to 5571/5568.
| Resistance | Support |
|
|
Charts courtesy of CQG, Inc., CNN, Koyfin, Trading View and AAII