
TECHNICAL ANALYSIS (by Intraday Dynamics)
Major Indices Week of October 31, 2025
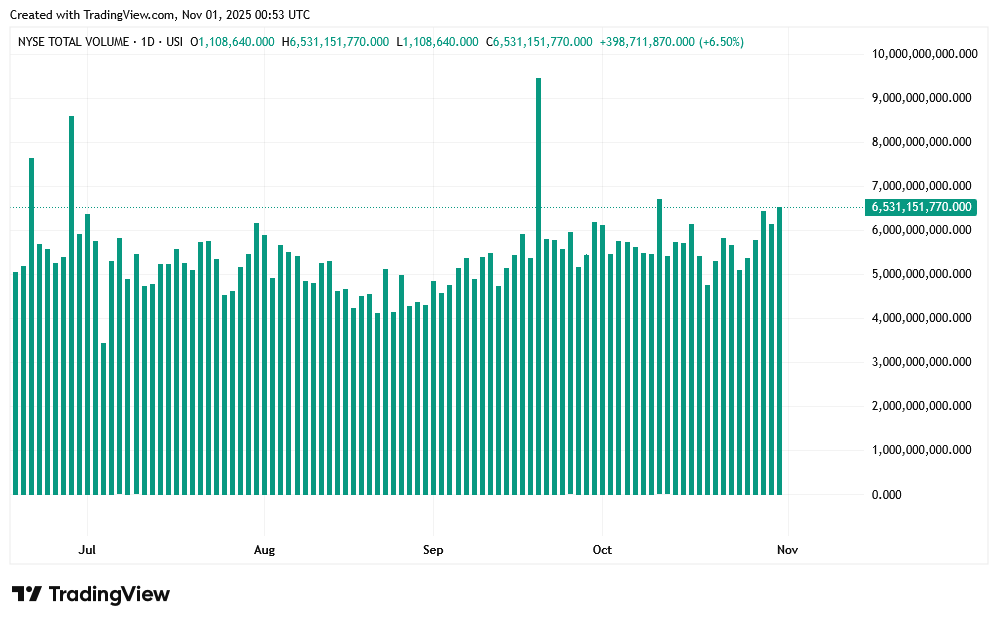
 NYSE Volume
 As goes tech, so goes the market. From last week: “…a blow off type rally could be in the offing…particularly if prices were able to clear the September cycle timing highs for the FAANG and other key charts.”
Stocks gapped higher on Monday is a huge week of trading action and news with prices soaring into record highs on some fairly hefty volume.
“I am going to put out a timing update in November. I believe that we are looking at the bottom of the 9th inning now for stocks and that the end of this move will come in this long window we are in…most likely in the first month or two of 2026. Certainly, by the 1st quarter. The market has now issued a Hindenburg Omen, which is not the most reliable indicator…but can be a preliminary red-flag that prices are within a couple months of a major turning point. which fits with the current timing data.”
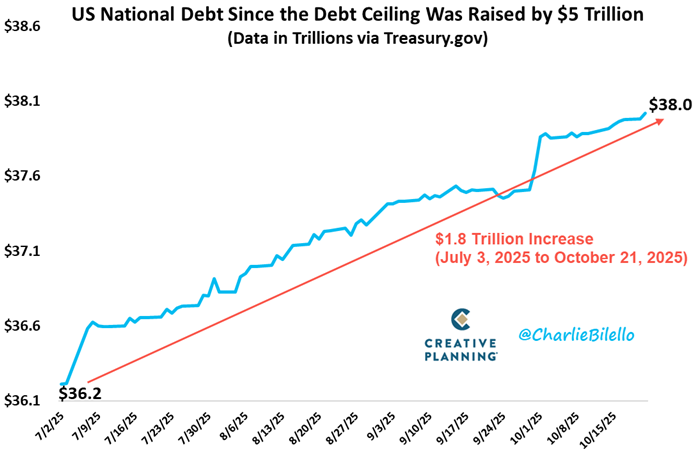
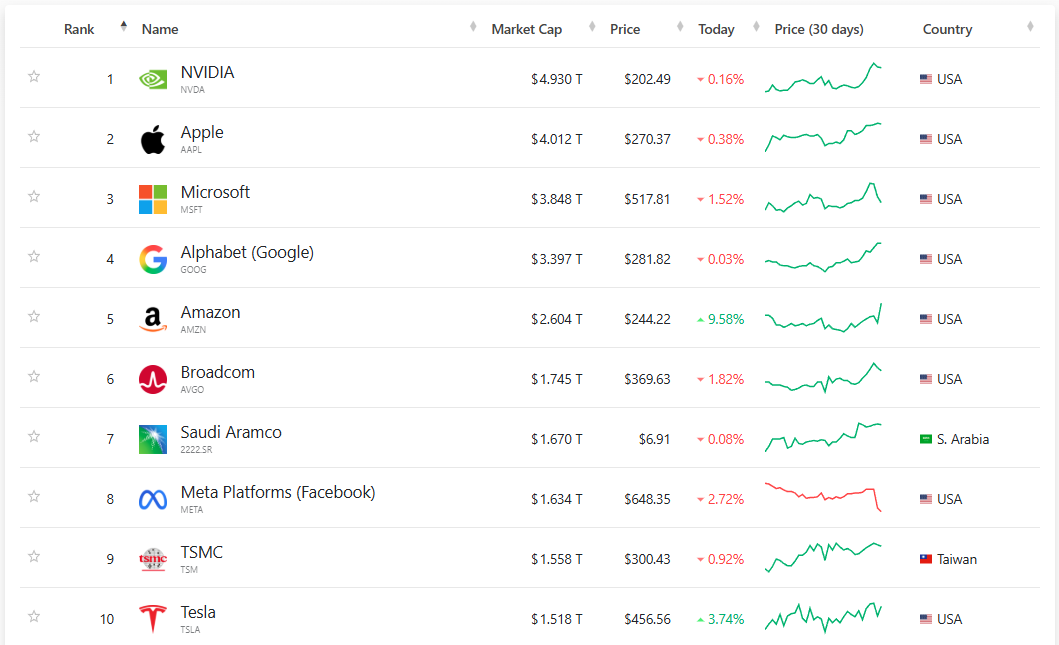 It was a crazy week with NVDA hitting a +$5T market cap and both Microsoft and Apple crossing the +$4T cap intraweek. Tech earnings were strong and they continue to meet 85% of targets. The Fed cut rates by 25 bps and announced that QT will be coming to an end in December. The Fed is about to start financing the debt again. Debt that has now eclipsed $38 trillion. The move from $37T to $38T is the fastest in history.
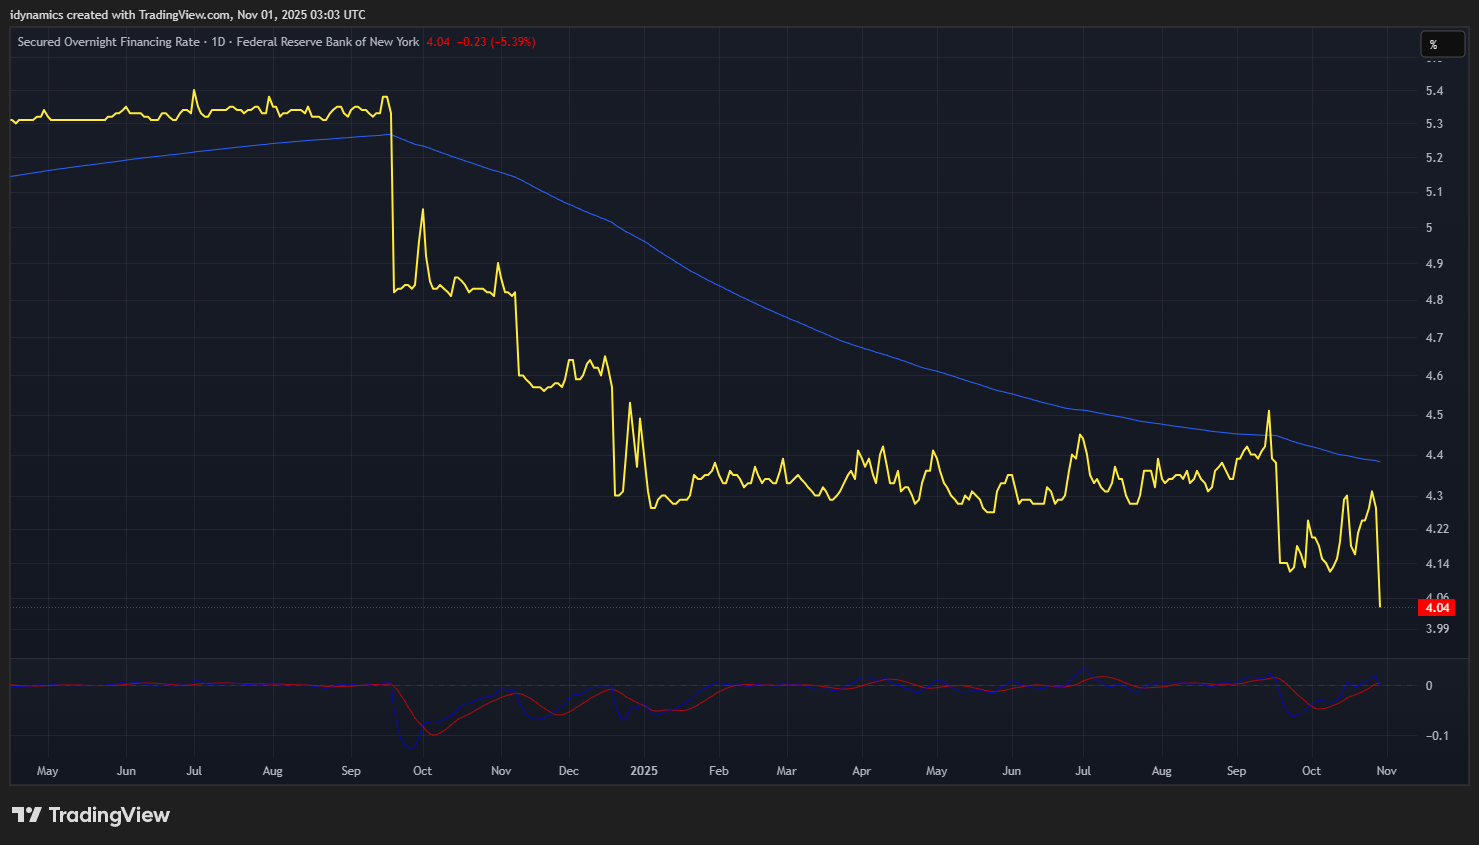 There was a two-week freakout where the overnight SOFR jumped 20 bps before crashing into new lows following the rate cut.
Dow Jones Monthly
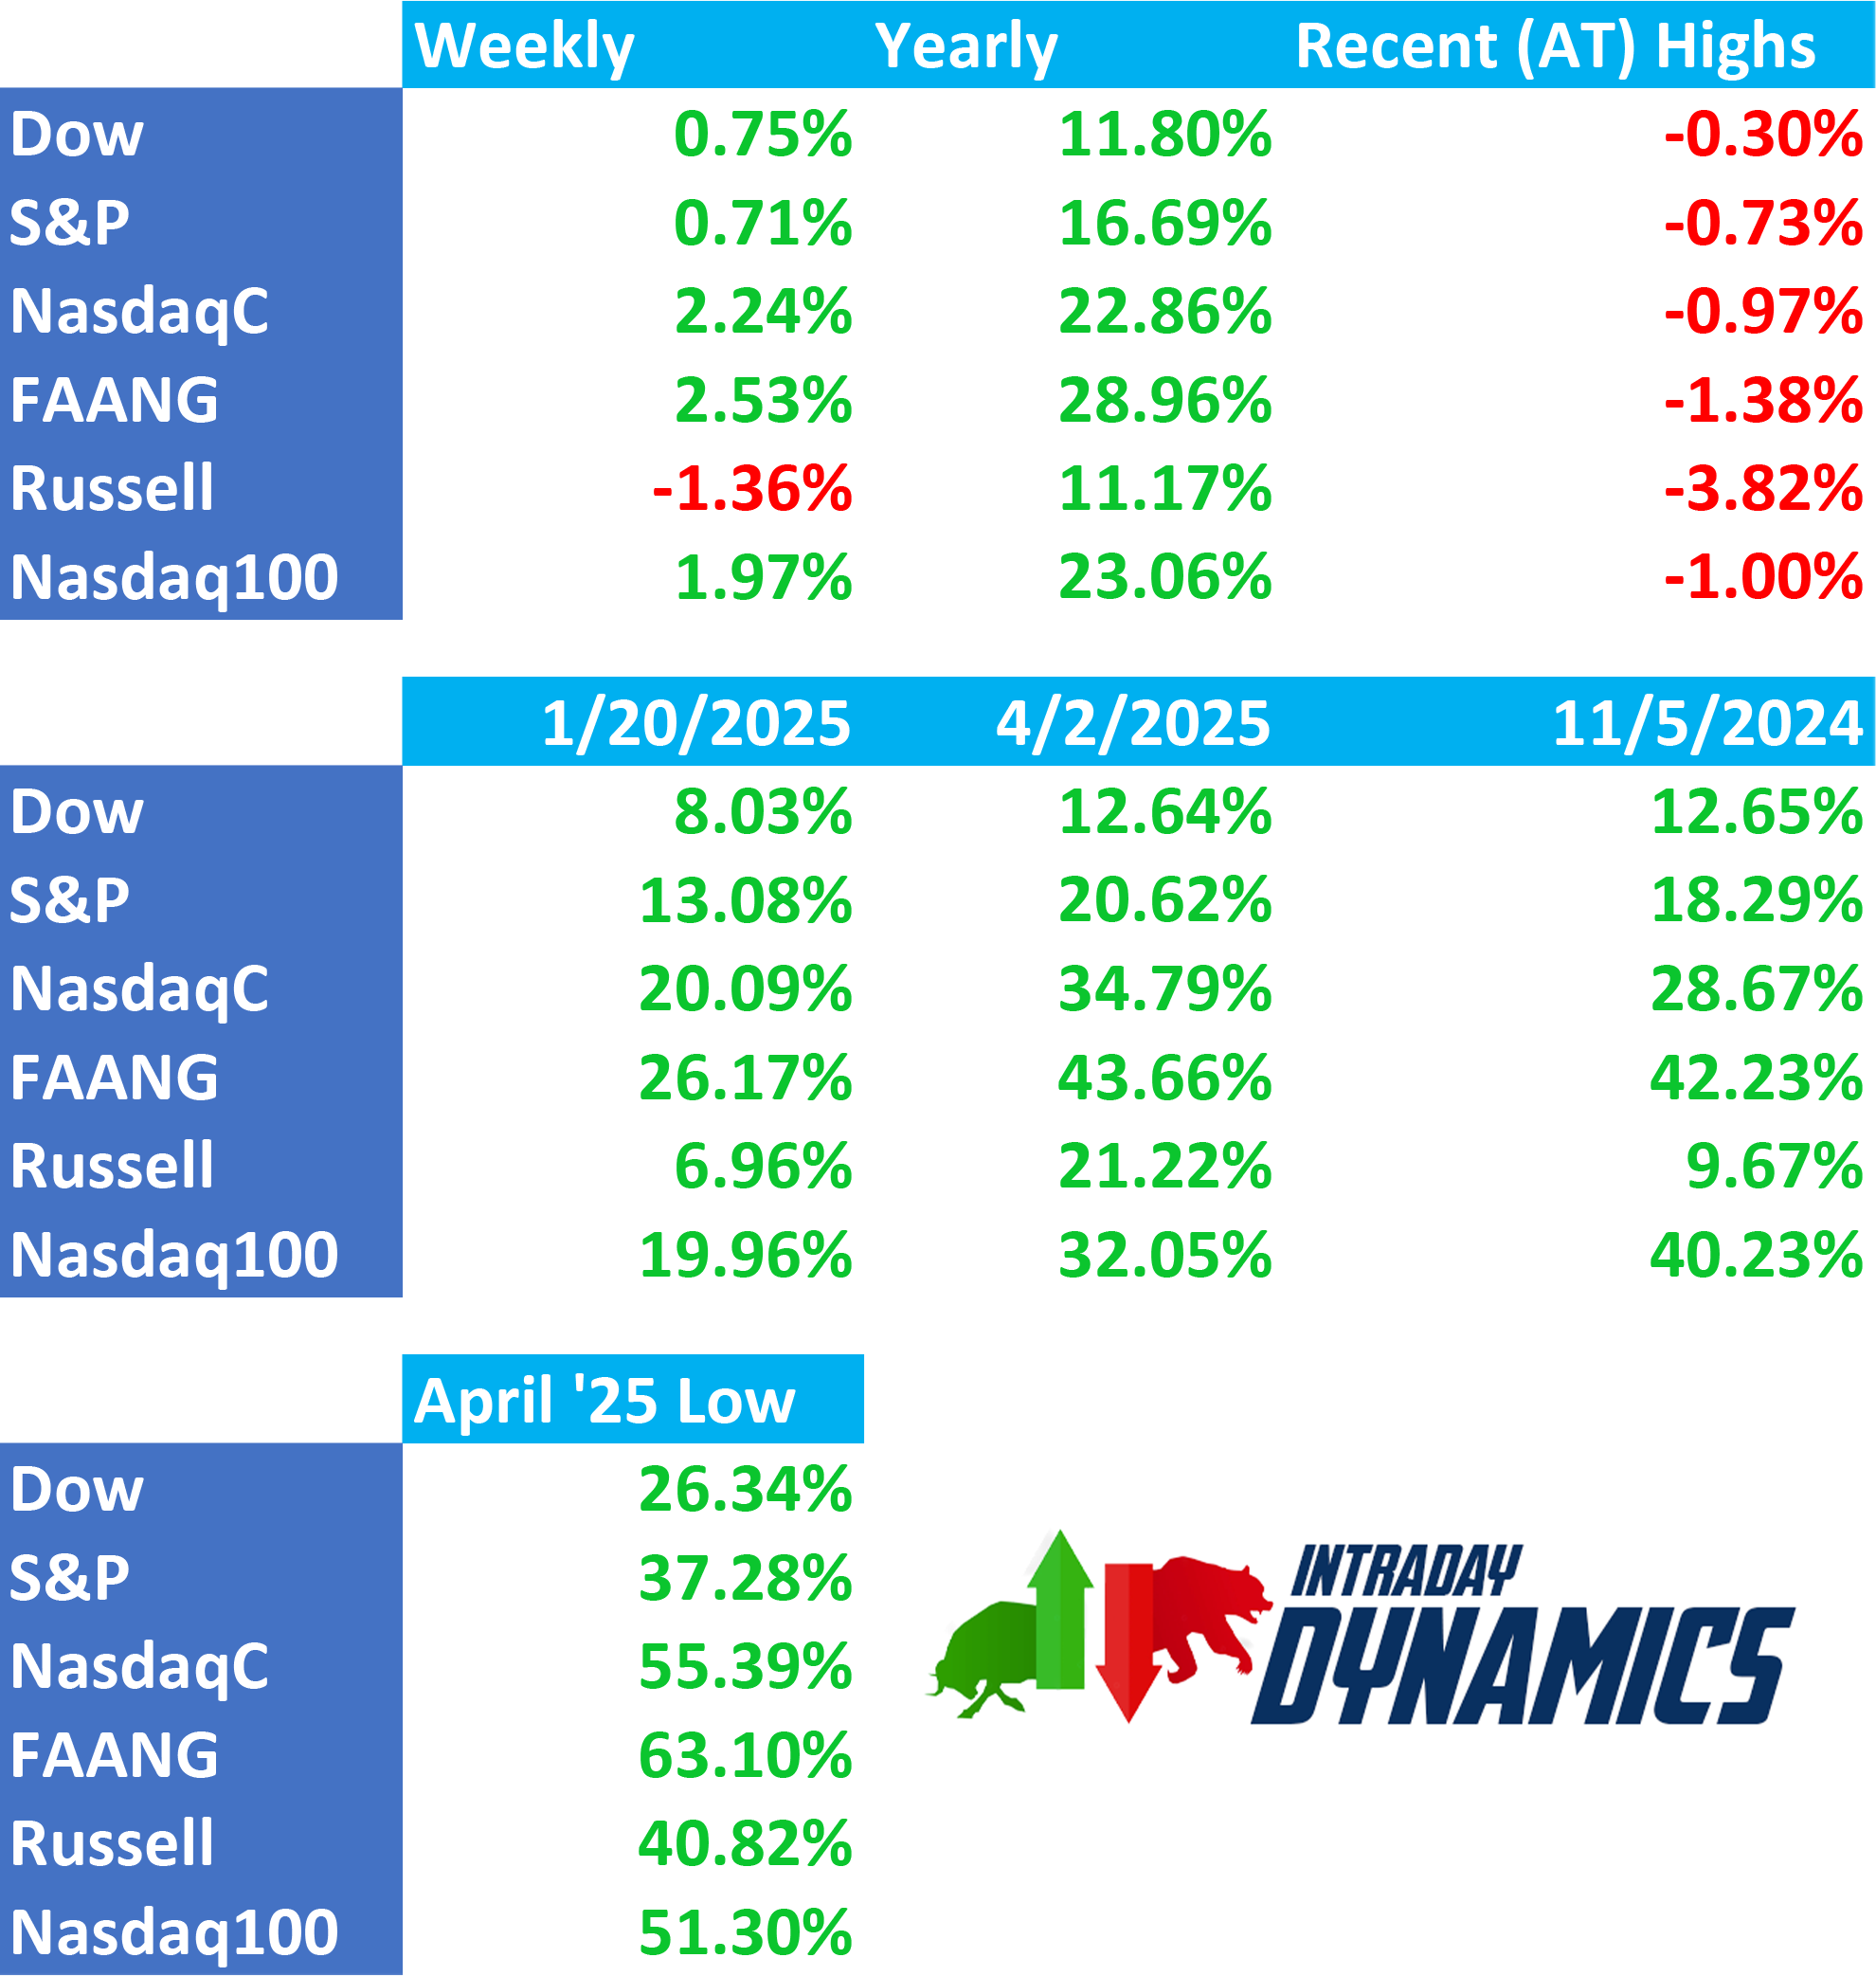
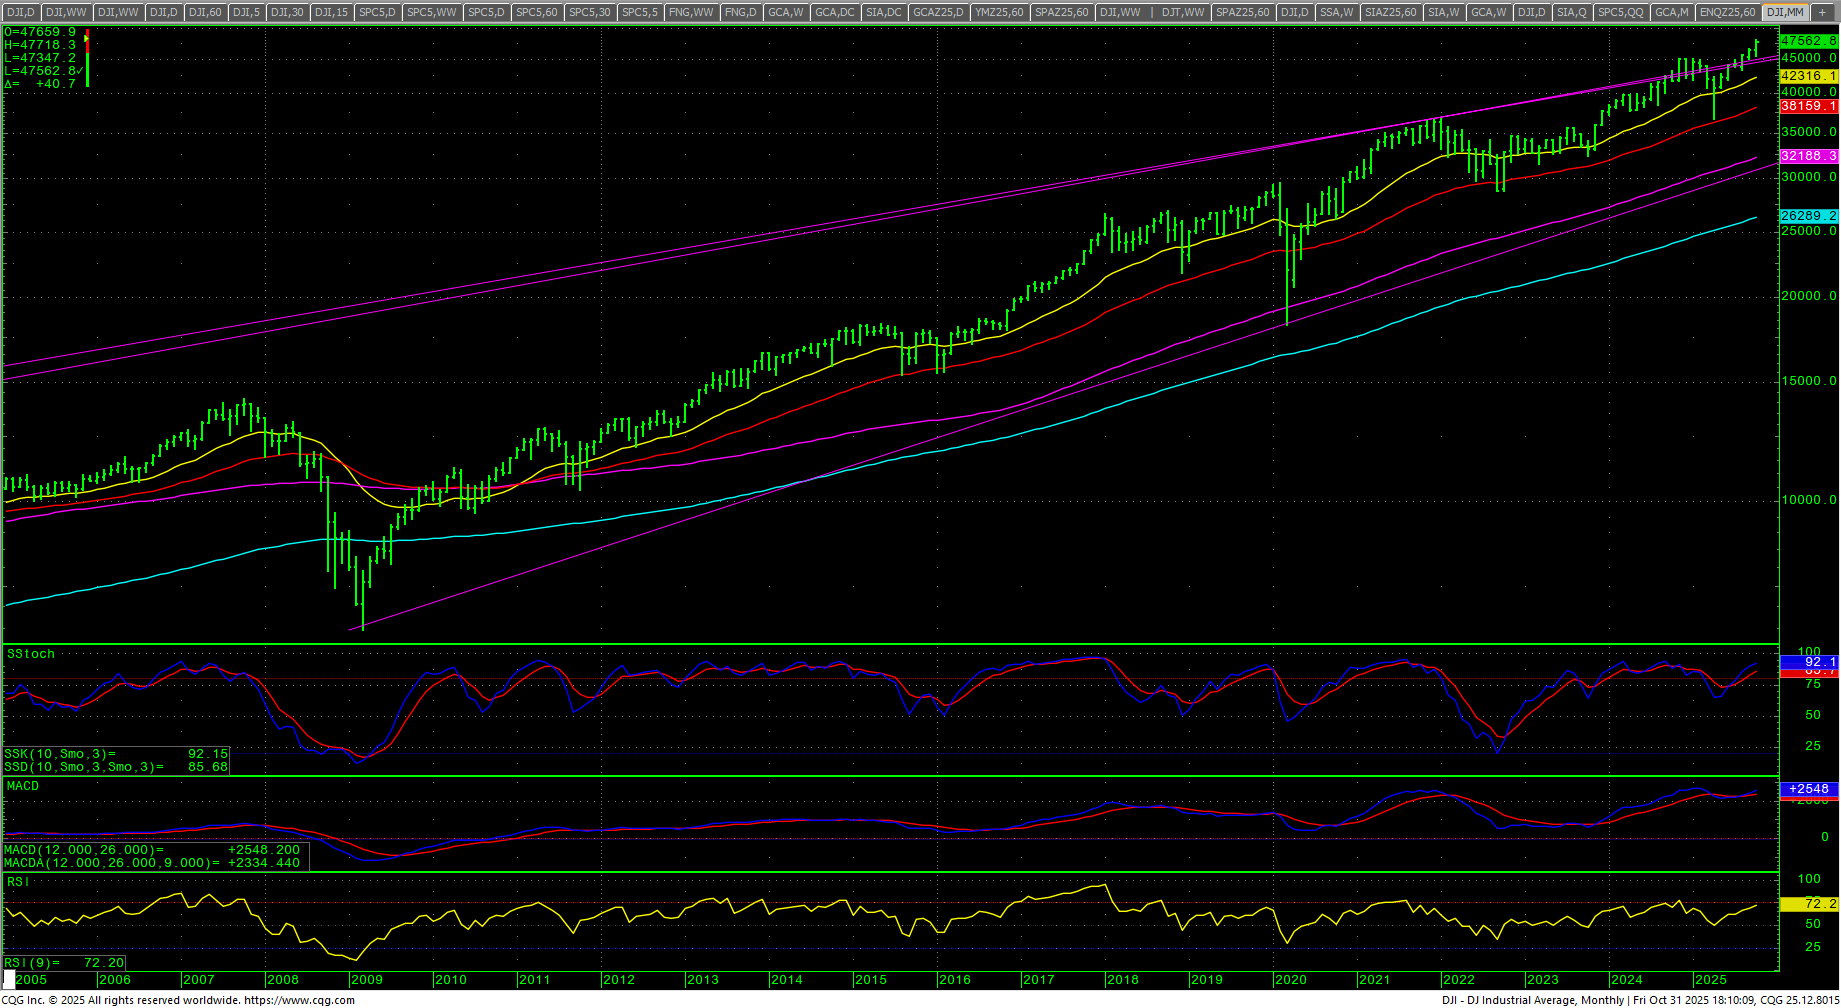 The market closed out the month of October in one of the most historic six-month runs ever recorded. The Dow is up +11.80% on the year and +26.34% since the April bottom.
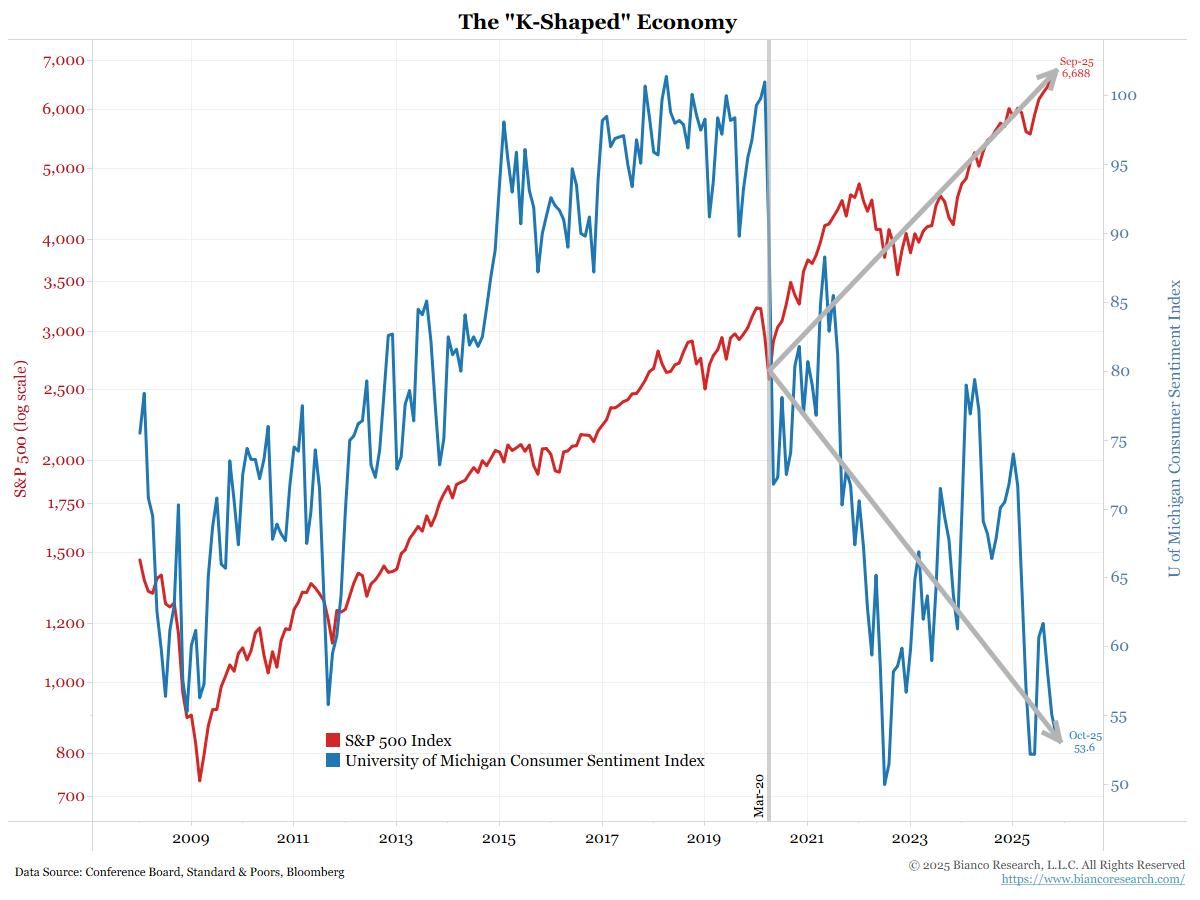
 The market and the rest of country are in total Schizophrenia at this juncture. The K-shaped economy is serving the very top wealth in the nation while the bottom 80/90% are sucking wind. Inflation remains hot and jobs are deteriorating. The top 10% now accounts for 50% of ALL consumer spending.
NYSE FANG Daily Candles
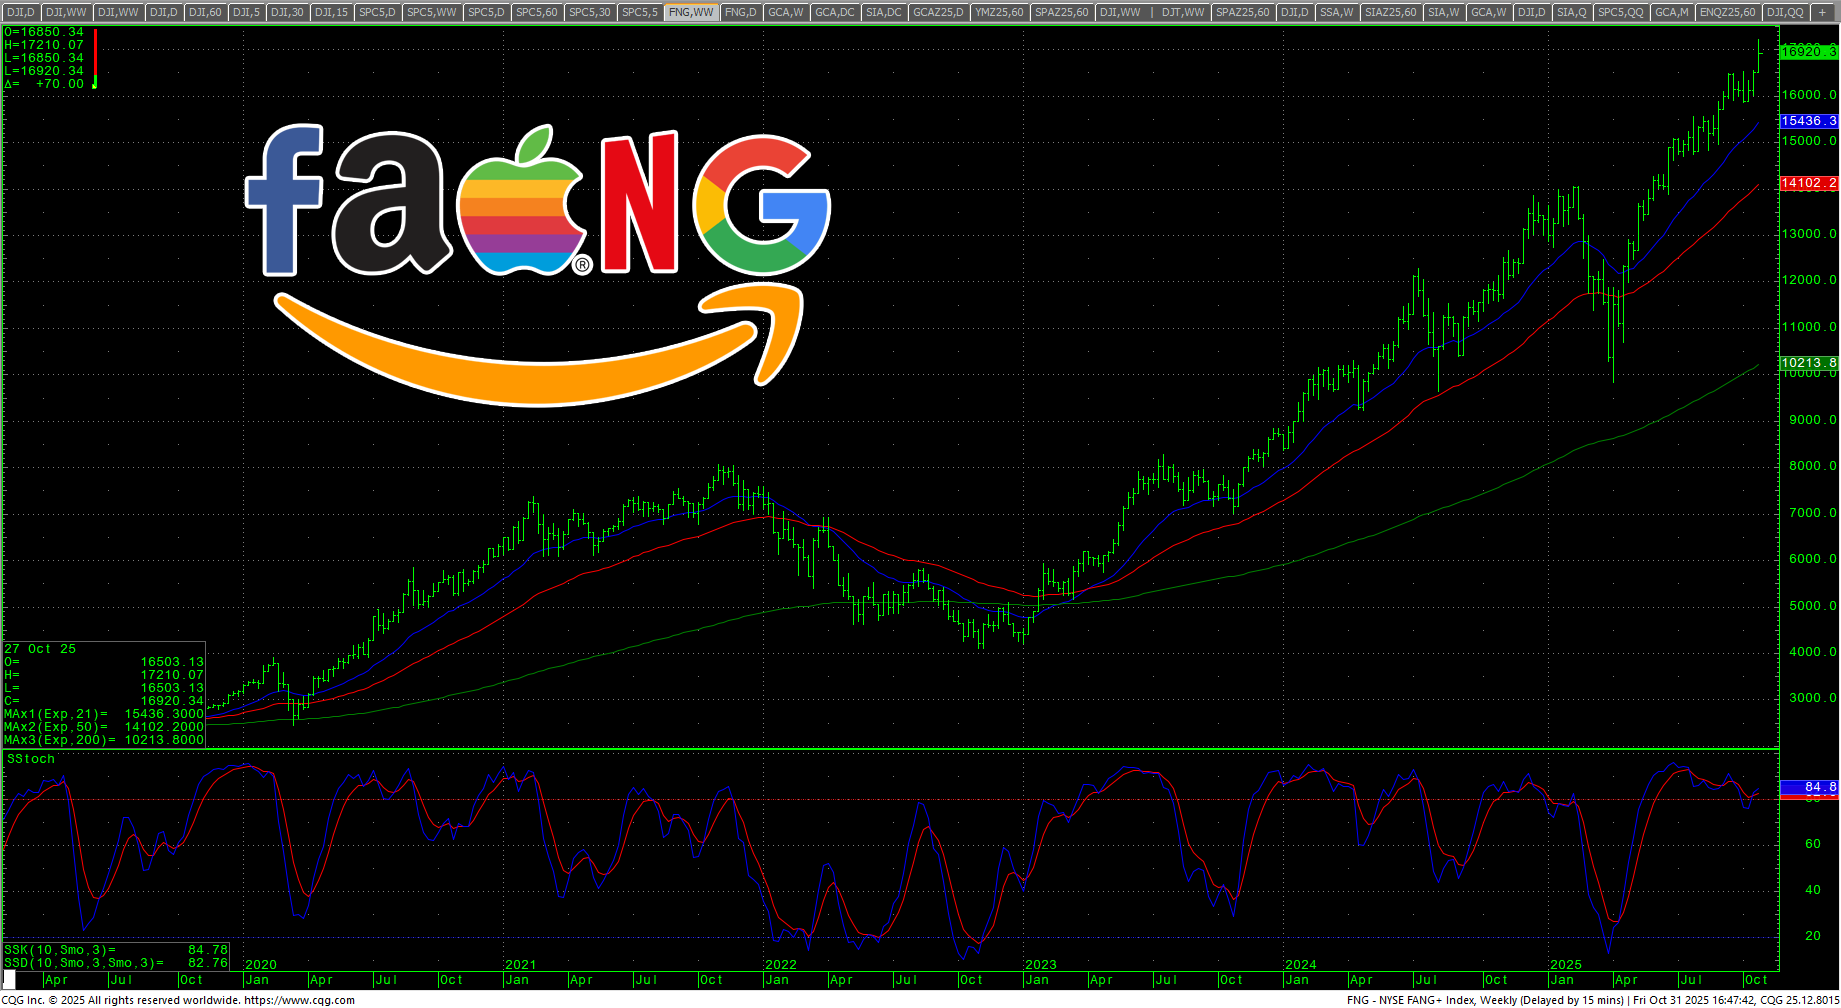
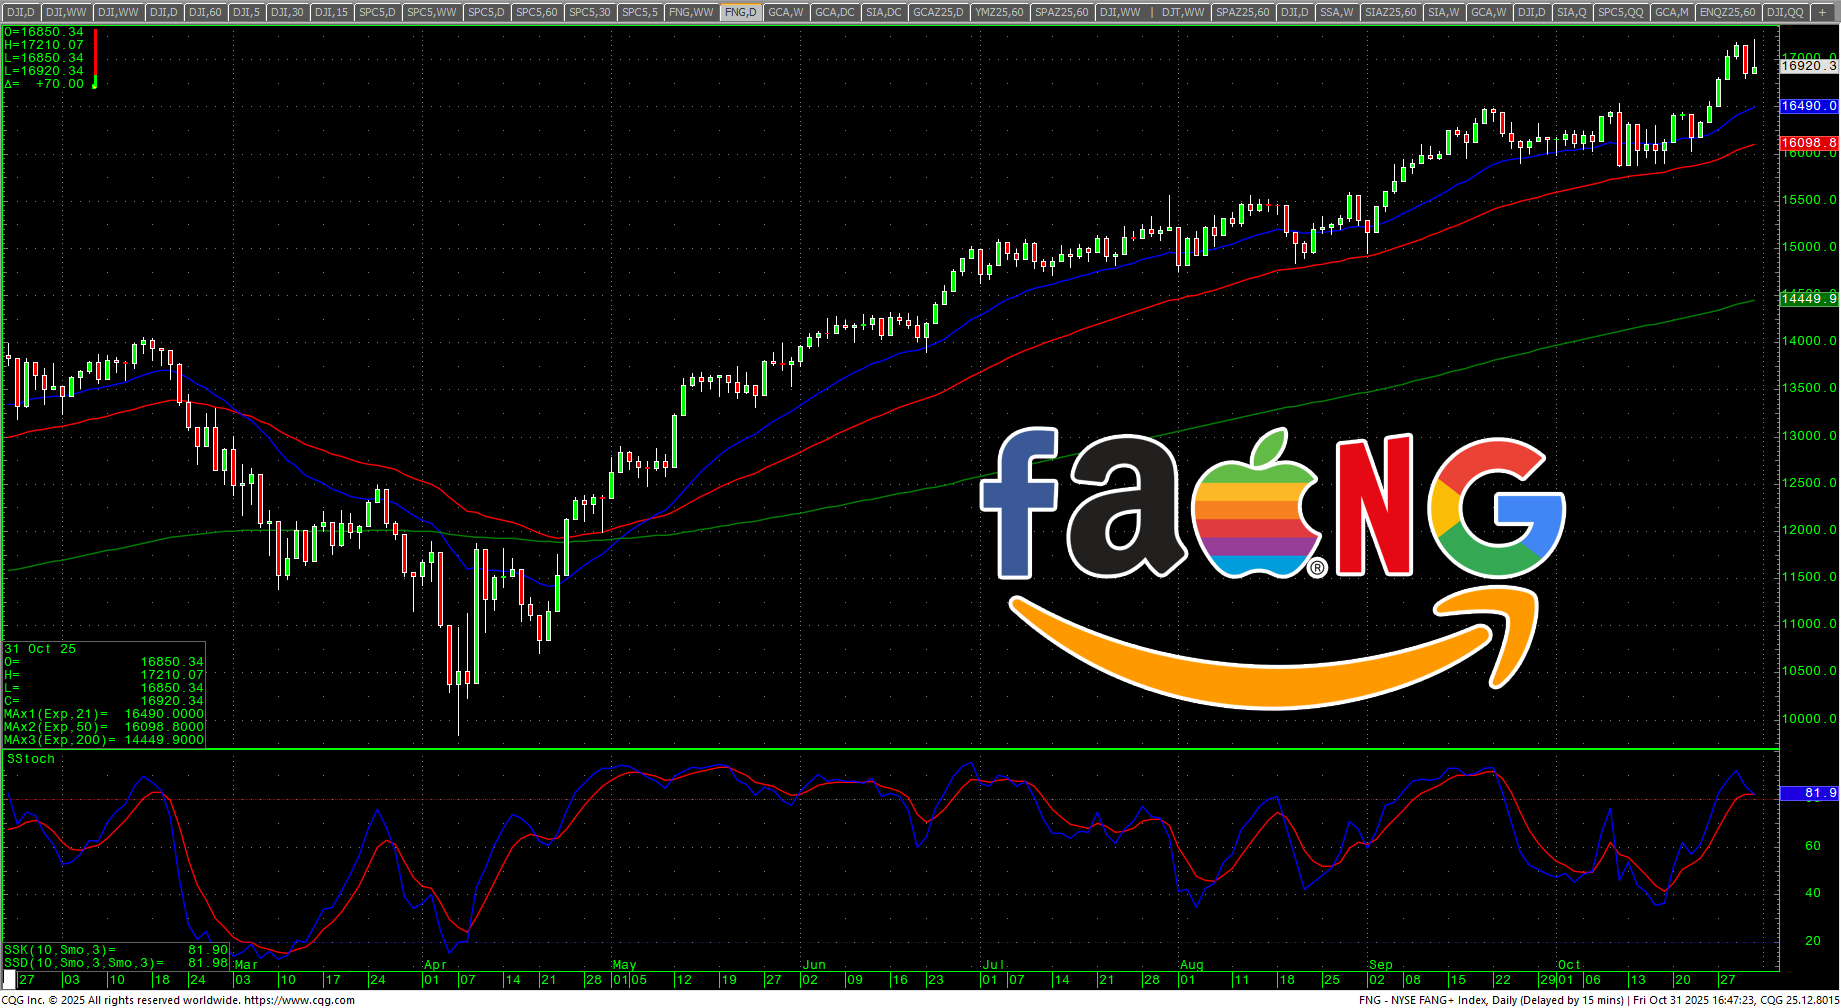 The NYSE FANG took the bullish signal by closing over the critical cycle timing highs of the week ending September 19th and cleared the 17K level before backing off in last week’s cycle timing. Sentiment is extremely mixed with some bullishness, but a number of indicators are sitting in fear as prices set record highs.
Some of this fear is the justified reality of the insane concentration of the market while the rest of the overall market and breadth is extremely weak. In fact, the market has now issued a Hindenburg Omen, which is not the most reliable indicator…but can be a preliminary red-flag that prices are within a couple months of a major turning point, which fits with the timing data.
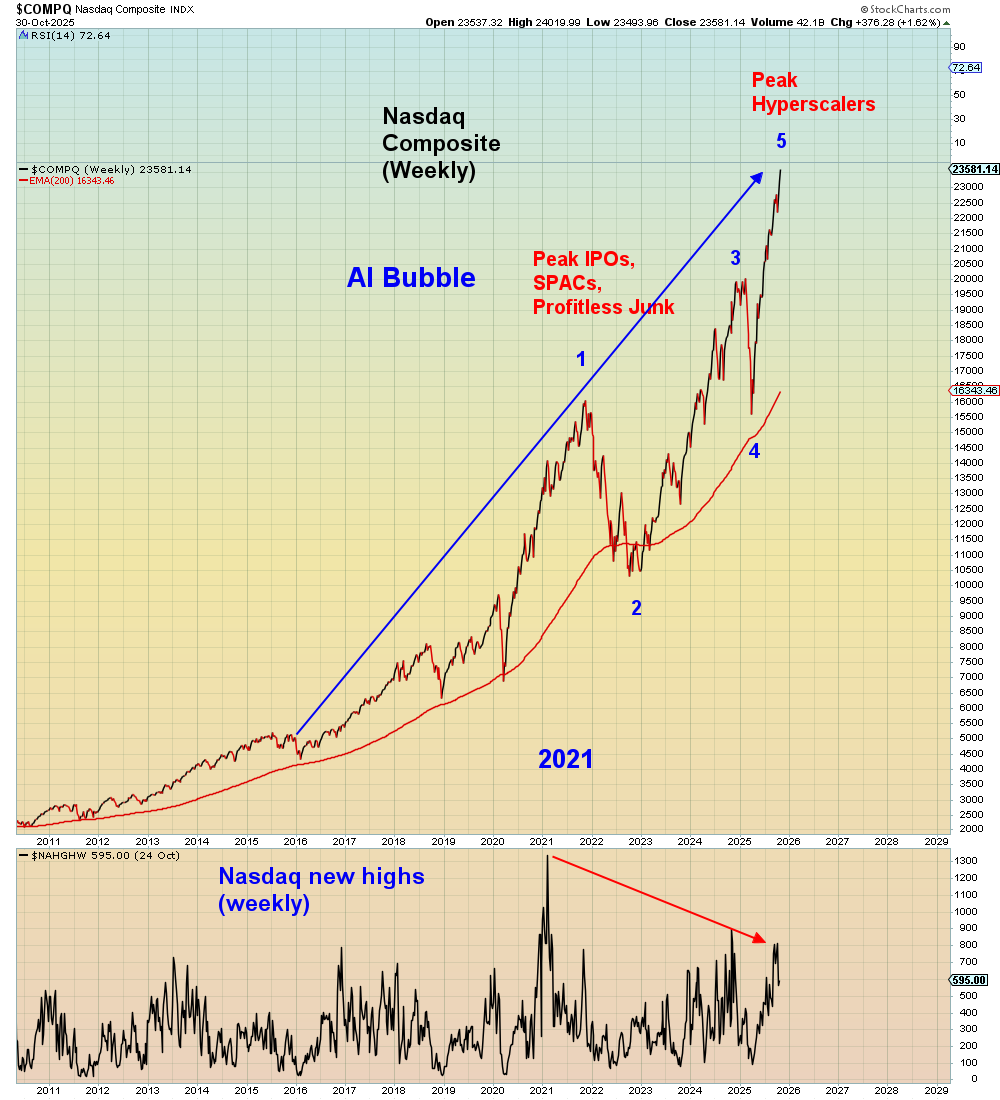
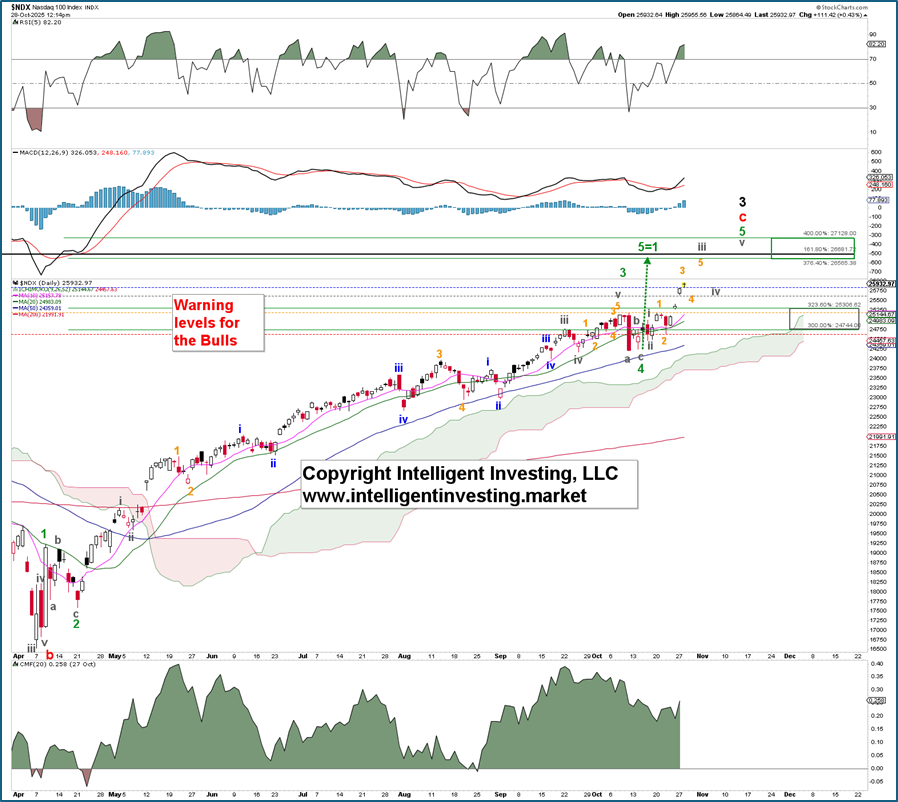 One point to note is that Elliot Wave counts are calling for a Fifth Wave in the Nasdaq. Targets were almost hit in last week’s trade with both the Nasdaq and the Composite falling just a fraction under the Wave 5 objectives.
 Meanwhile, breadth is narrowing as the high-flying MAG7 stocks account for almost all the trade in equities. Perhaps one contrarian indicator might be that perma-bear Michael Burry posted on Twitter for the first time in over two years after changing his handle to “Cassandra Unchained.” His post was about “Bubbles,” see the link.
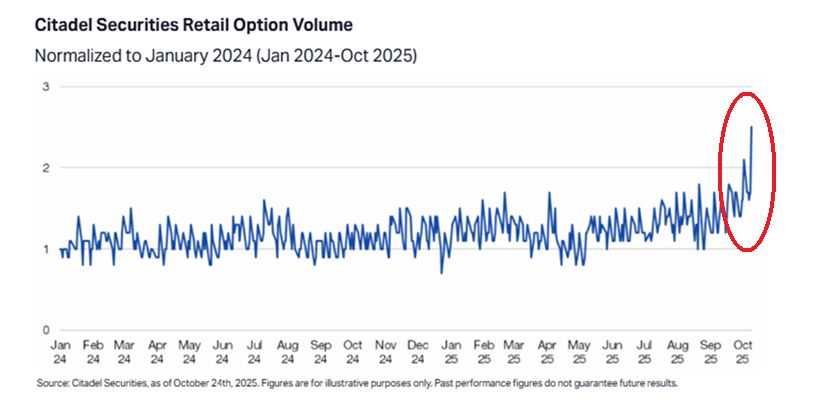
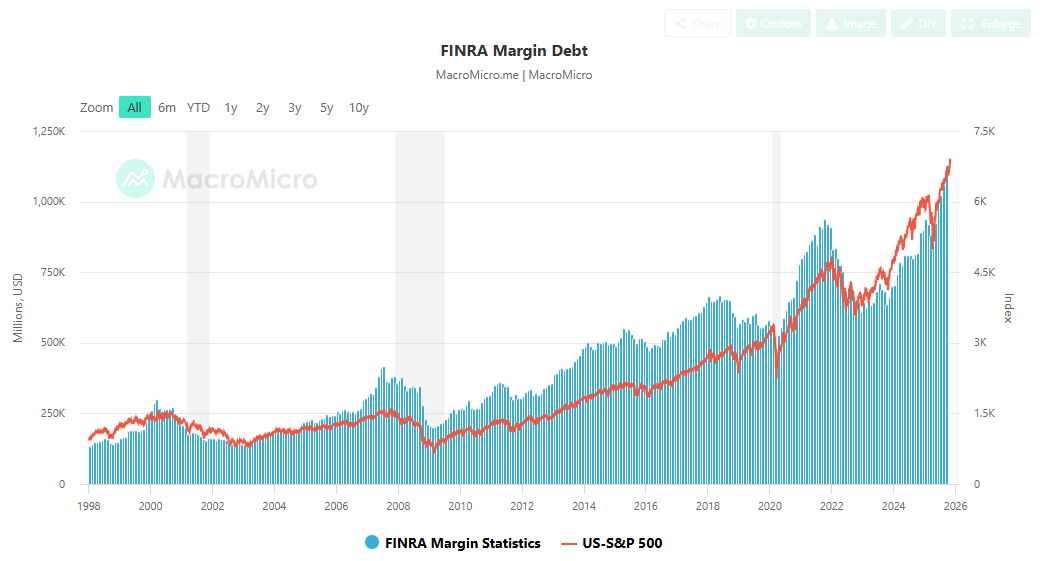 Right now, Fund Managers are way behind this market, and rallies are continuing to be driven by retail traders. Retail options trade has exploded…along with margins, which have now hit almost $1.2 trillion. The number of stocks/ETFs being purchased on debt continues to climb.
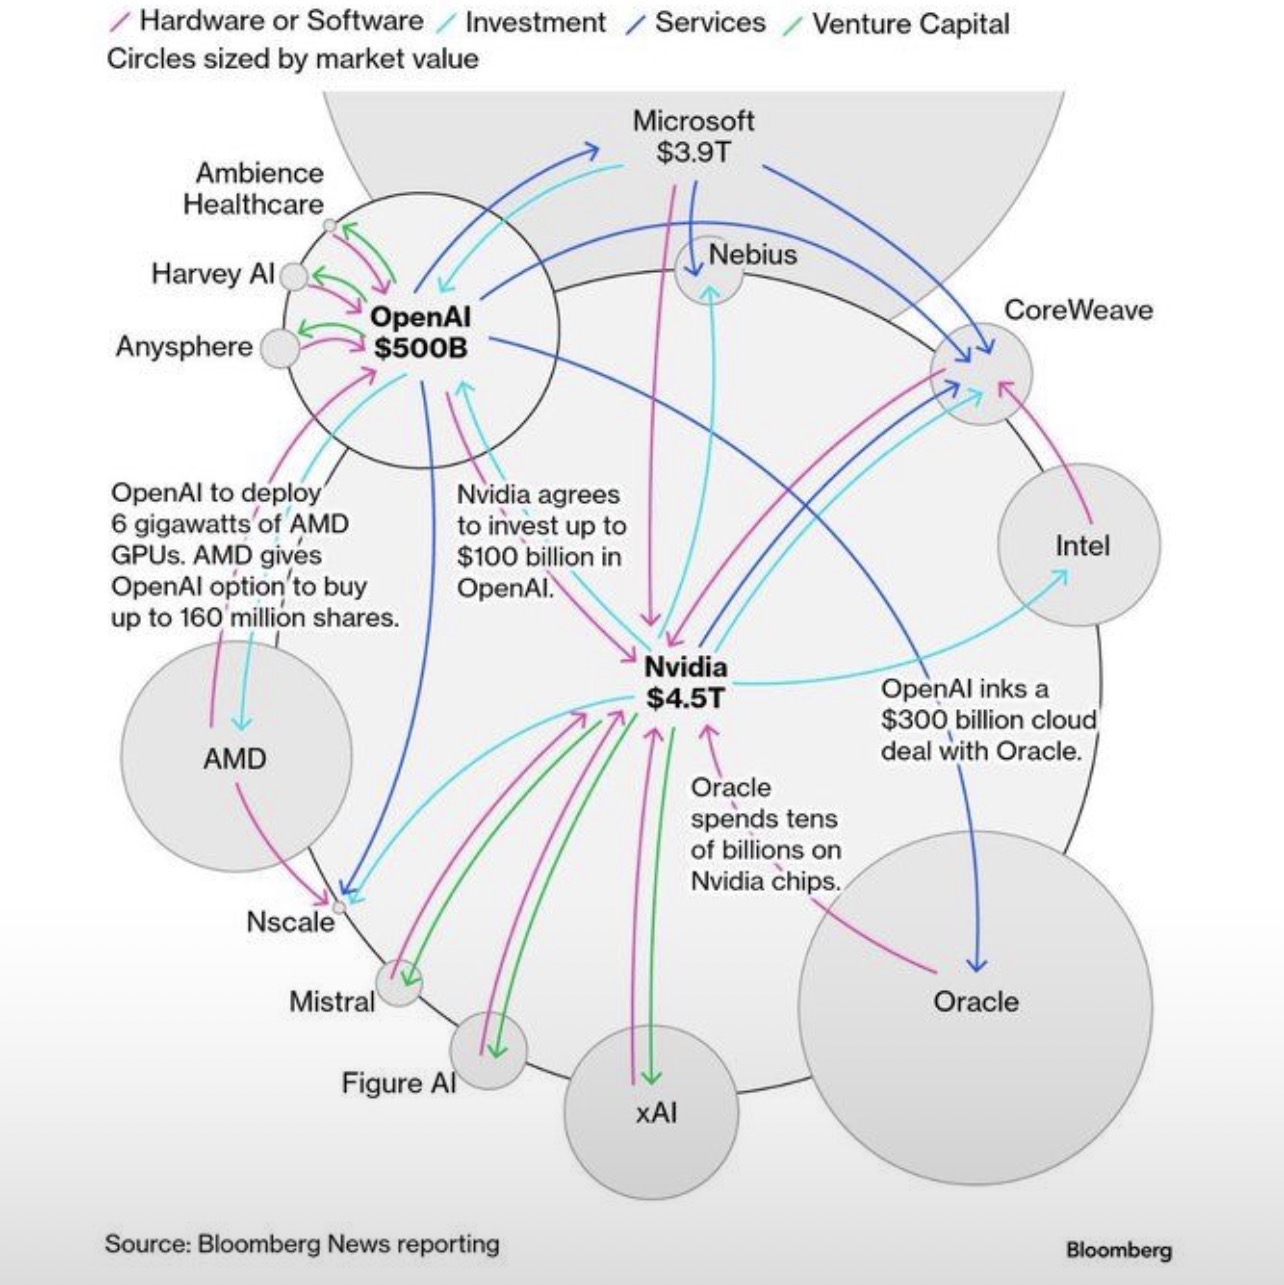
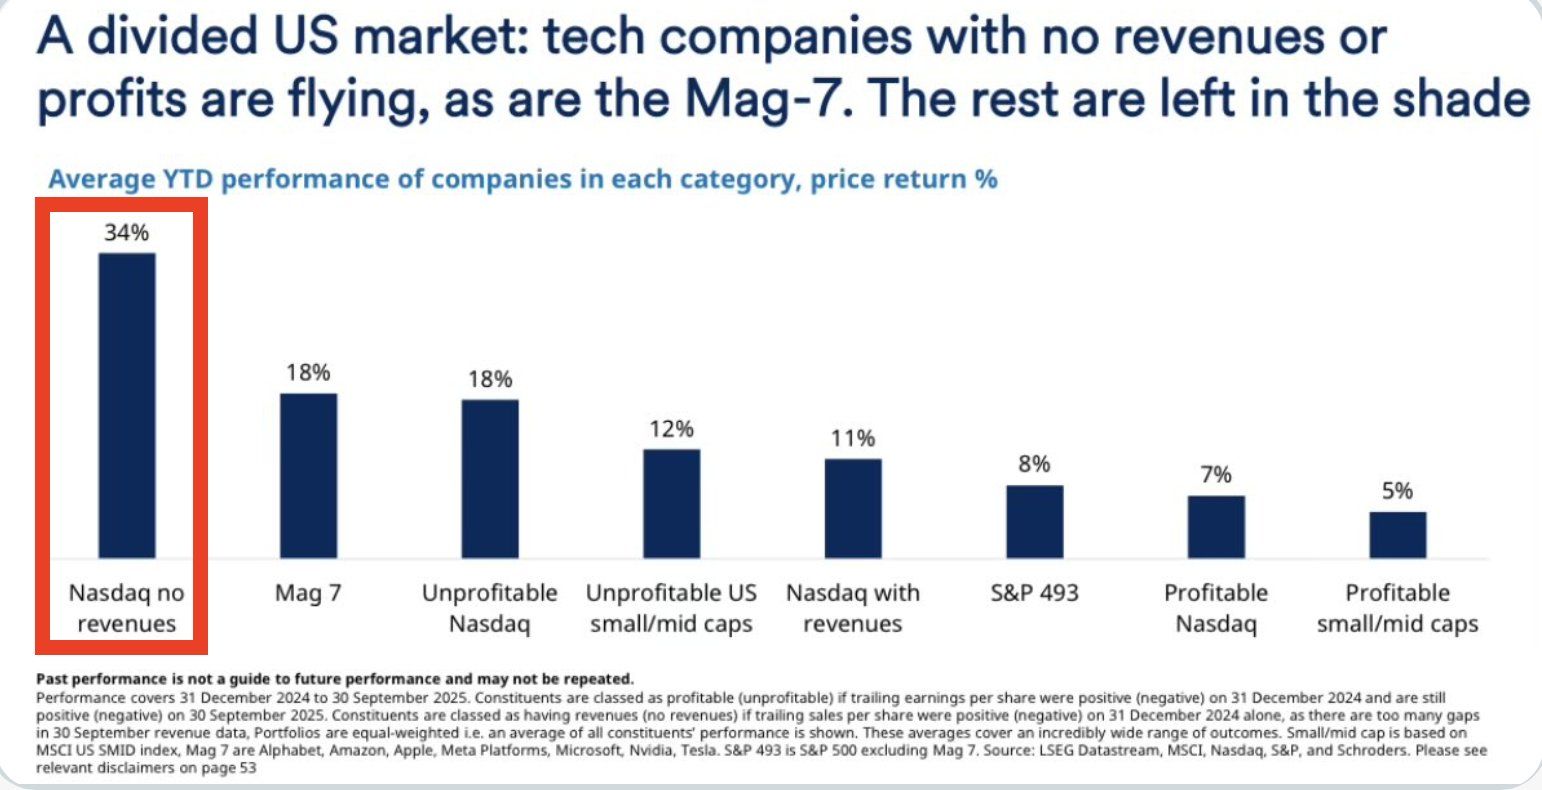
Again, while this is happening, breadth is weak and the market is being dragged higher by the “vanity stocks.” These stocks make up 40% of the entire SPX and have accounted for 80% of the entire rally this year. This is all being done under the auspices of circular funding…while the companies involved in the massive spending spree are NOT profitable. “Hyperscaling” is a massive shell game.
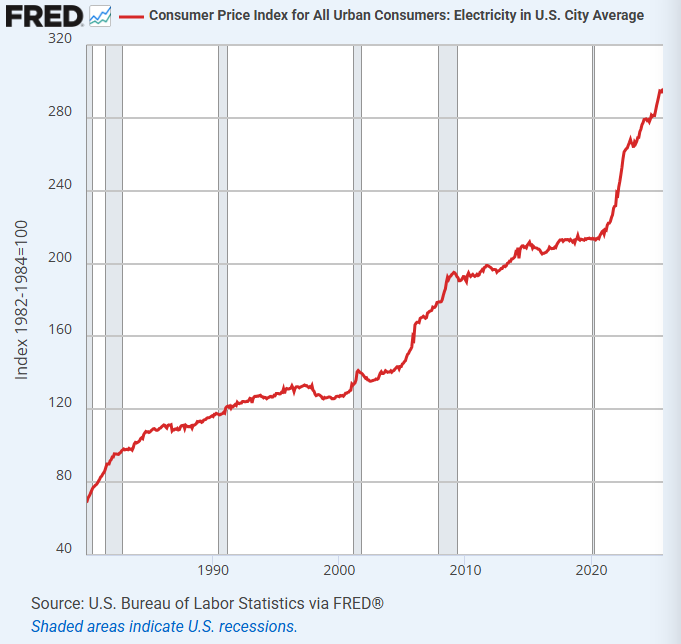
And the reality that “Data Centers” need to gobble up massive amounts of electricity remains a critical problem with no short-term solutions.
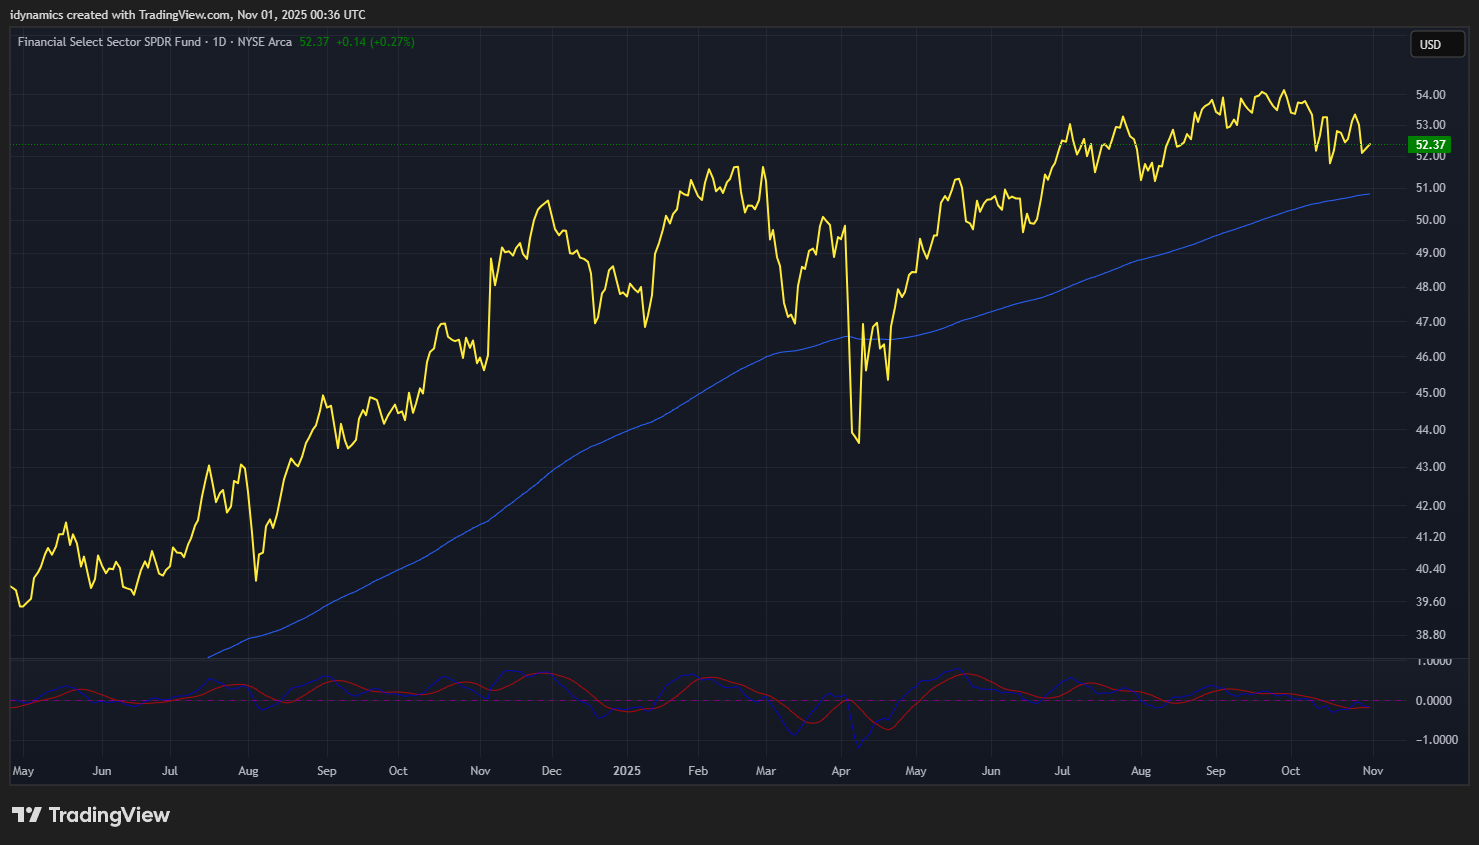
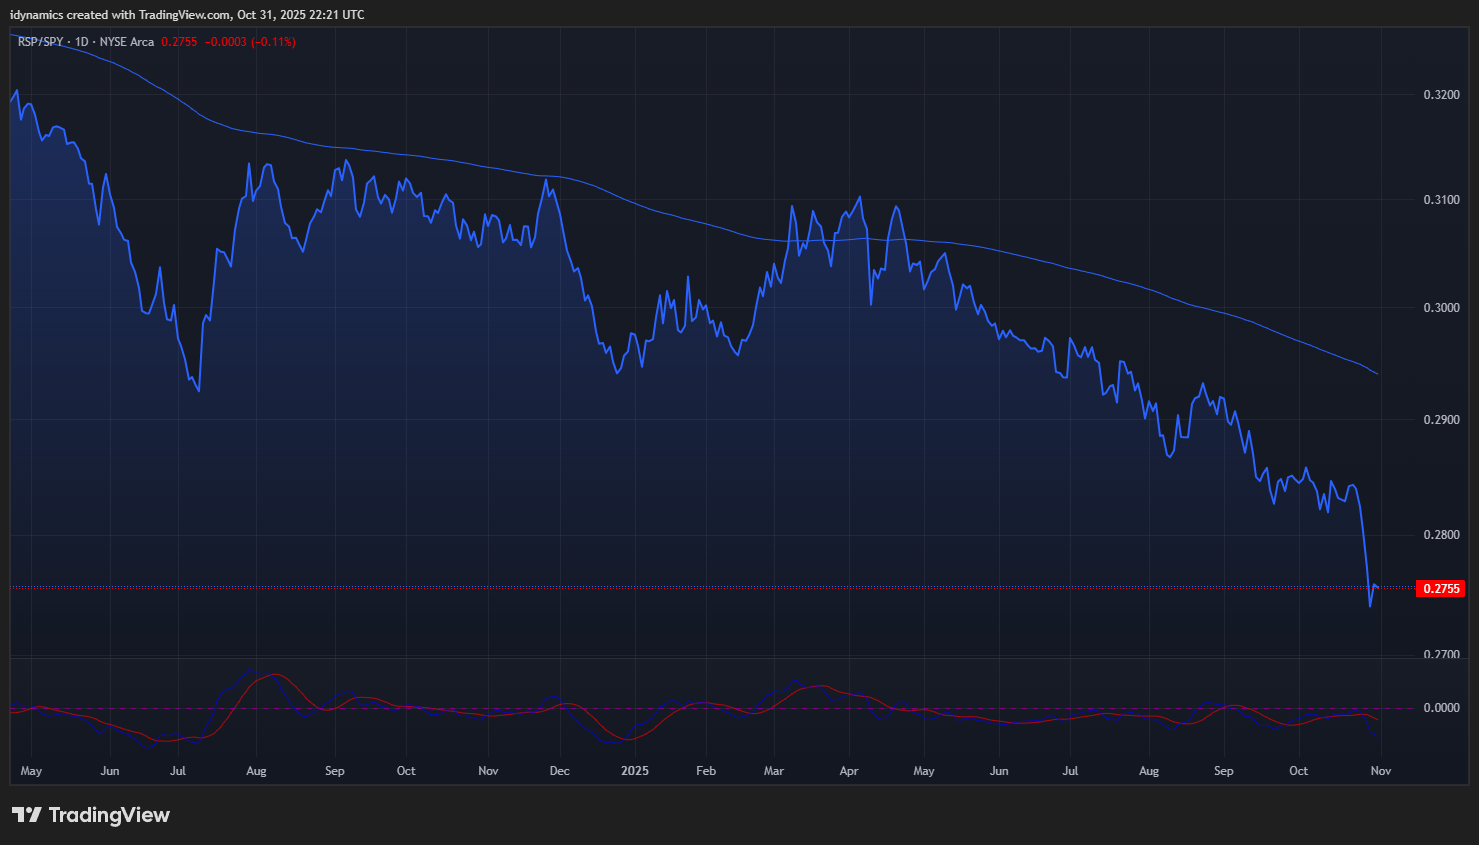
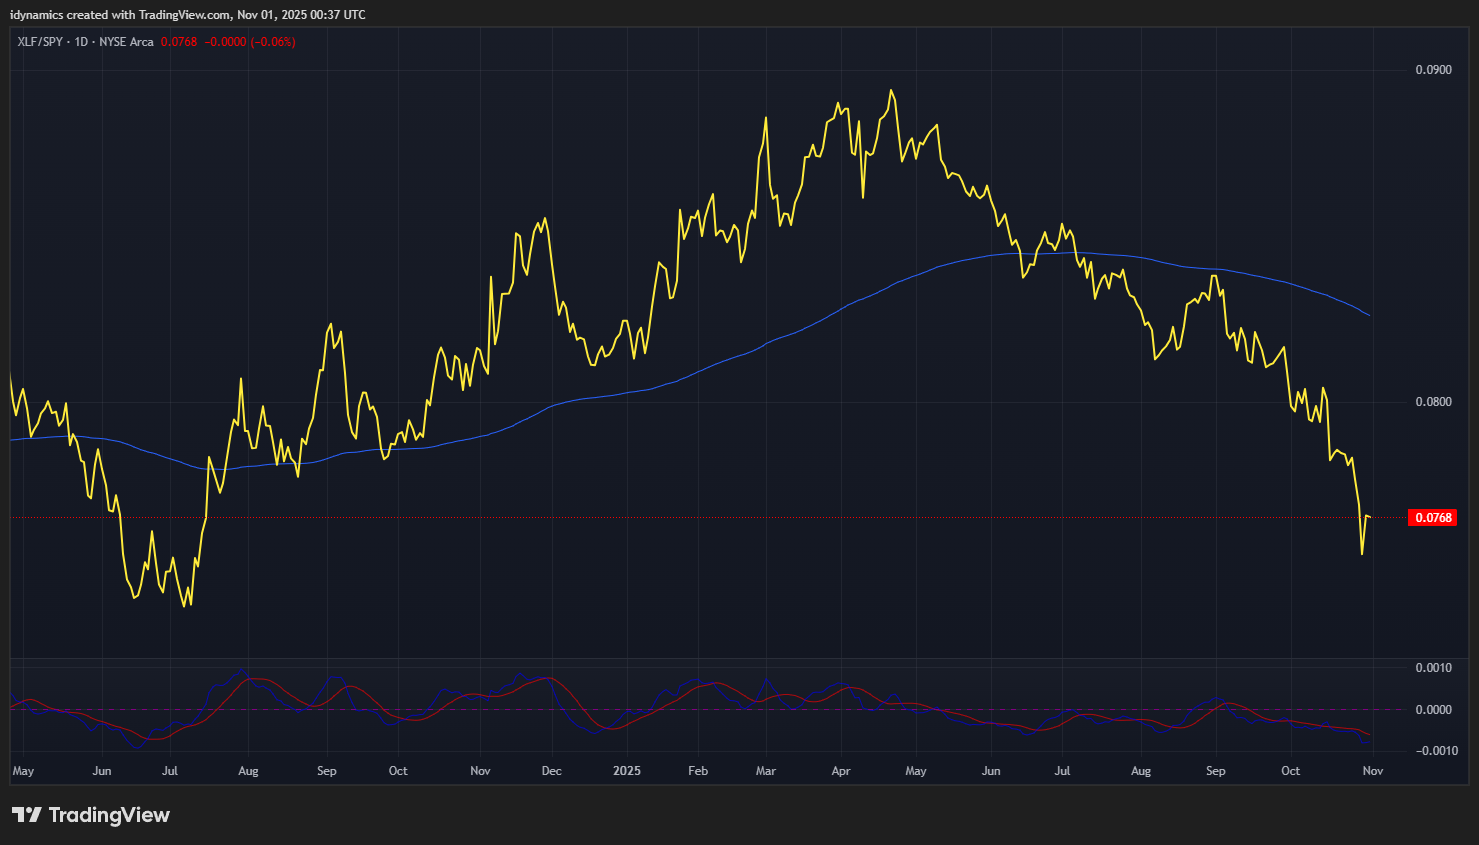 The XLF is still below the September cycle highs as it remains in a PIT (pullback in time). The XLF/SPY has been in serious decline throughout the year. This normally would be a red-flag…in addition to the new lows set the past week in the RSP/SPY.
SPX Quarterly H-L-C
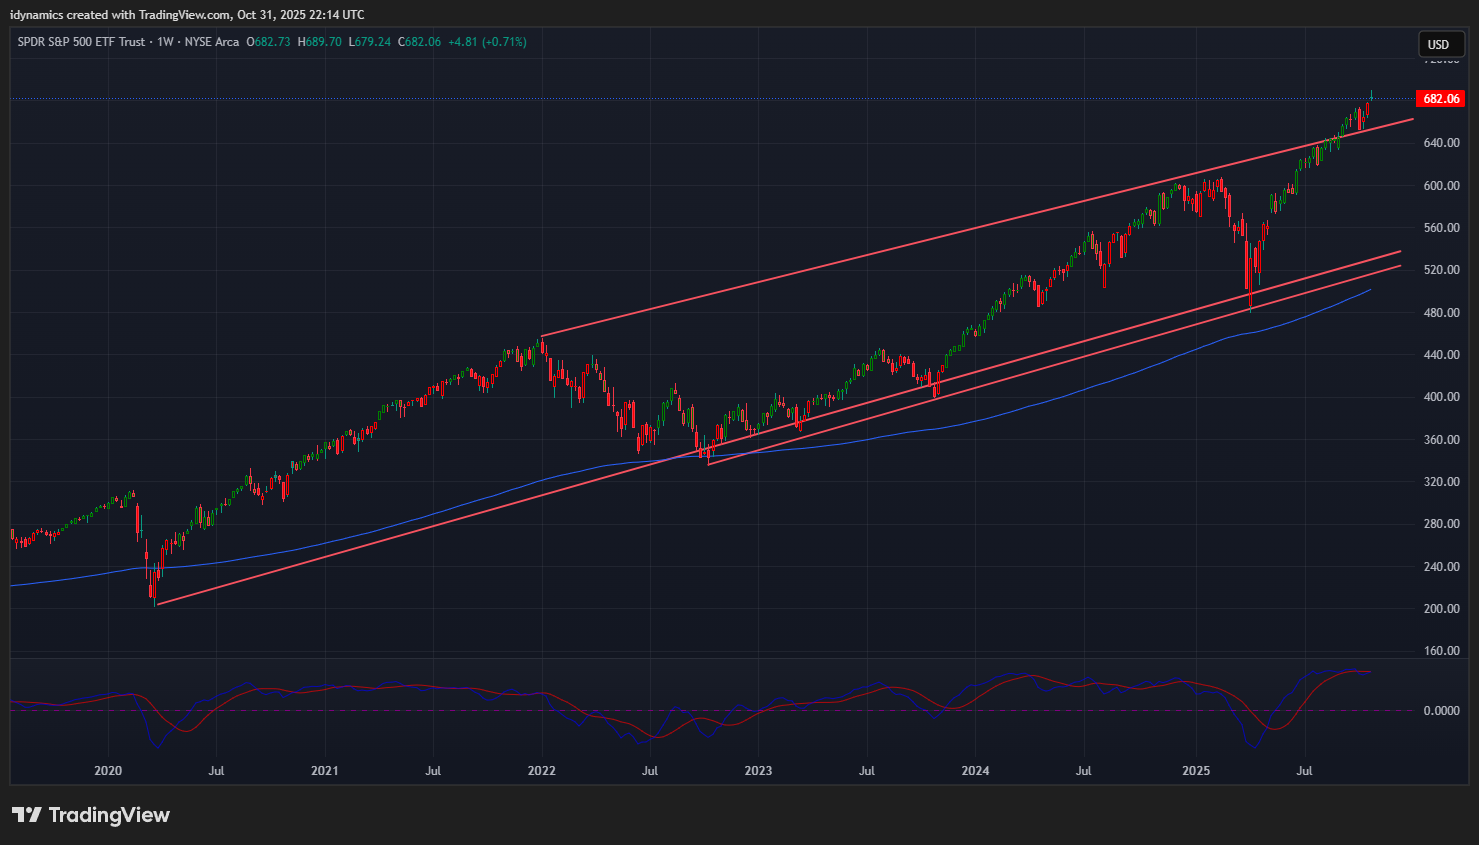
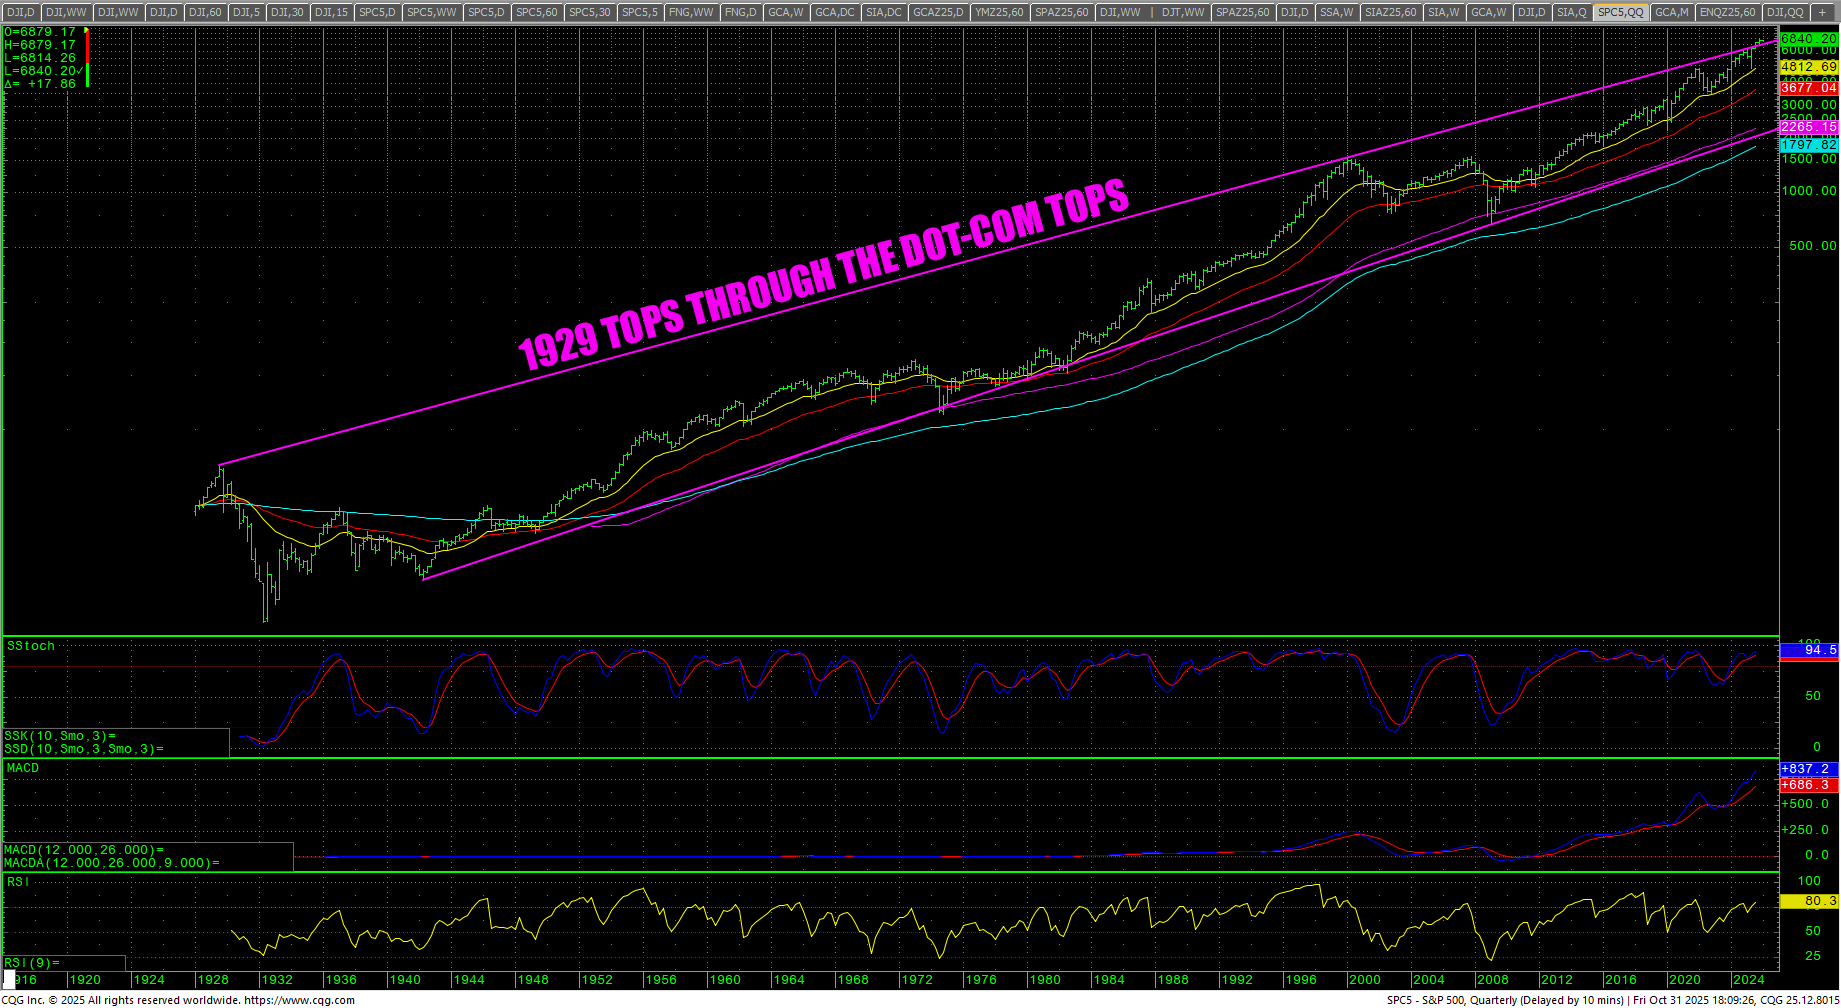 The SPX quarterly still offers the super bull scenario as prices break away from the overhead trendline that connects the 1929 tops through the 2000 Dot-Com tops. If prices start to trade back under the trendline, it could signal selling in equities. It also holds potential for a continued blowoff move.
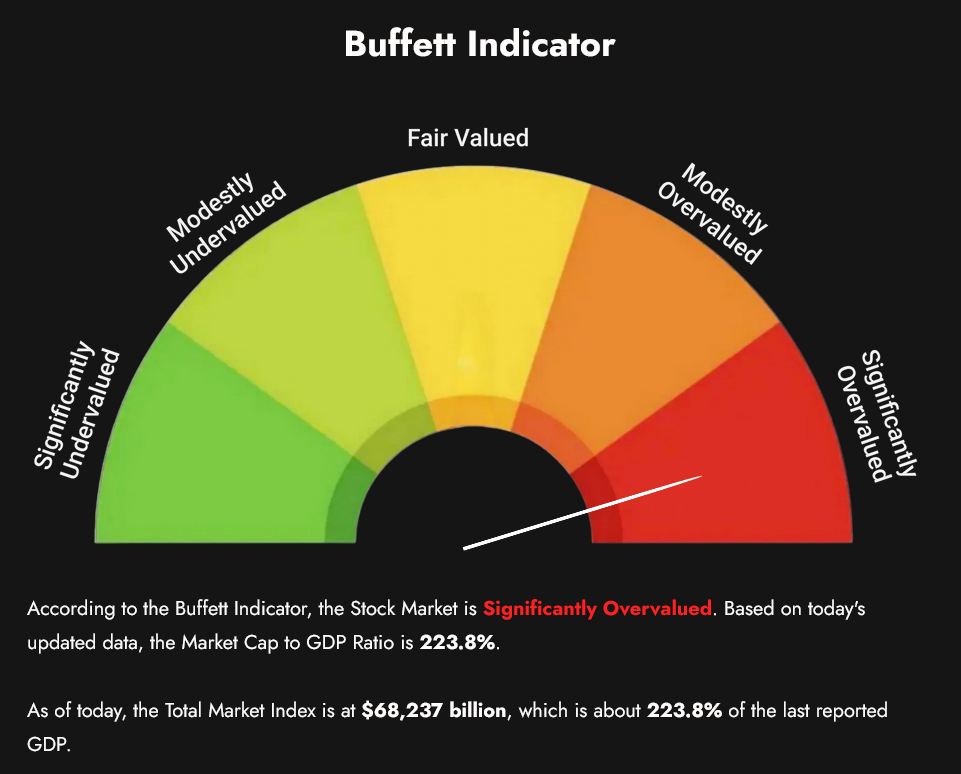
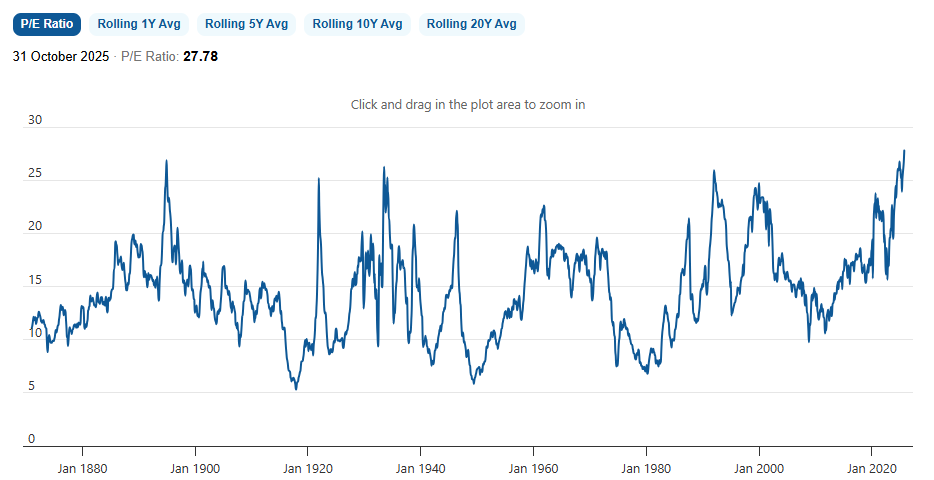 The Buffet Indicator set an ATH Friday, now sitting at 223.8%. P/E ratios are grossly inflated.
Dow Theory
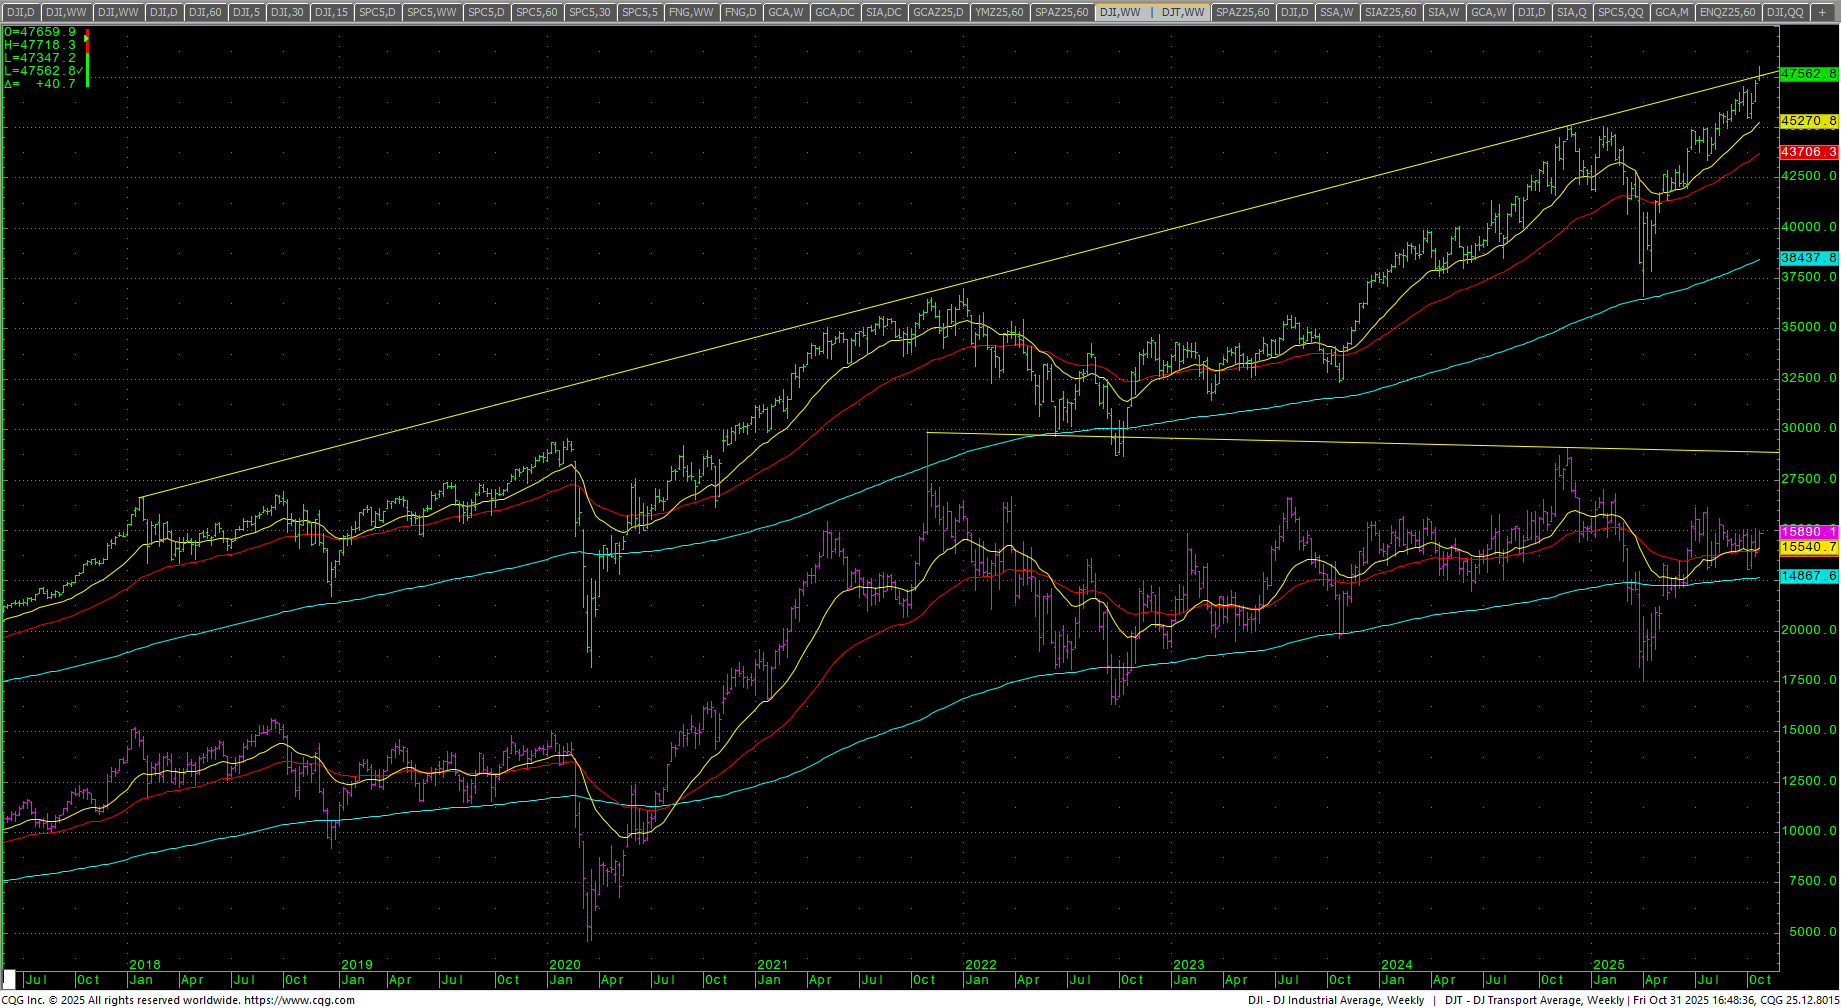 Dow Theory still shows a bearish divergence.
S&P 500 Stocks Above the 200-day MA
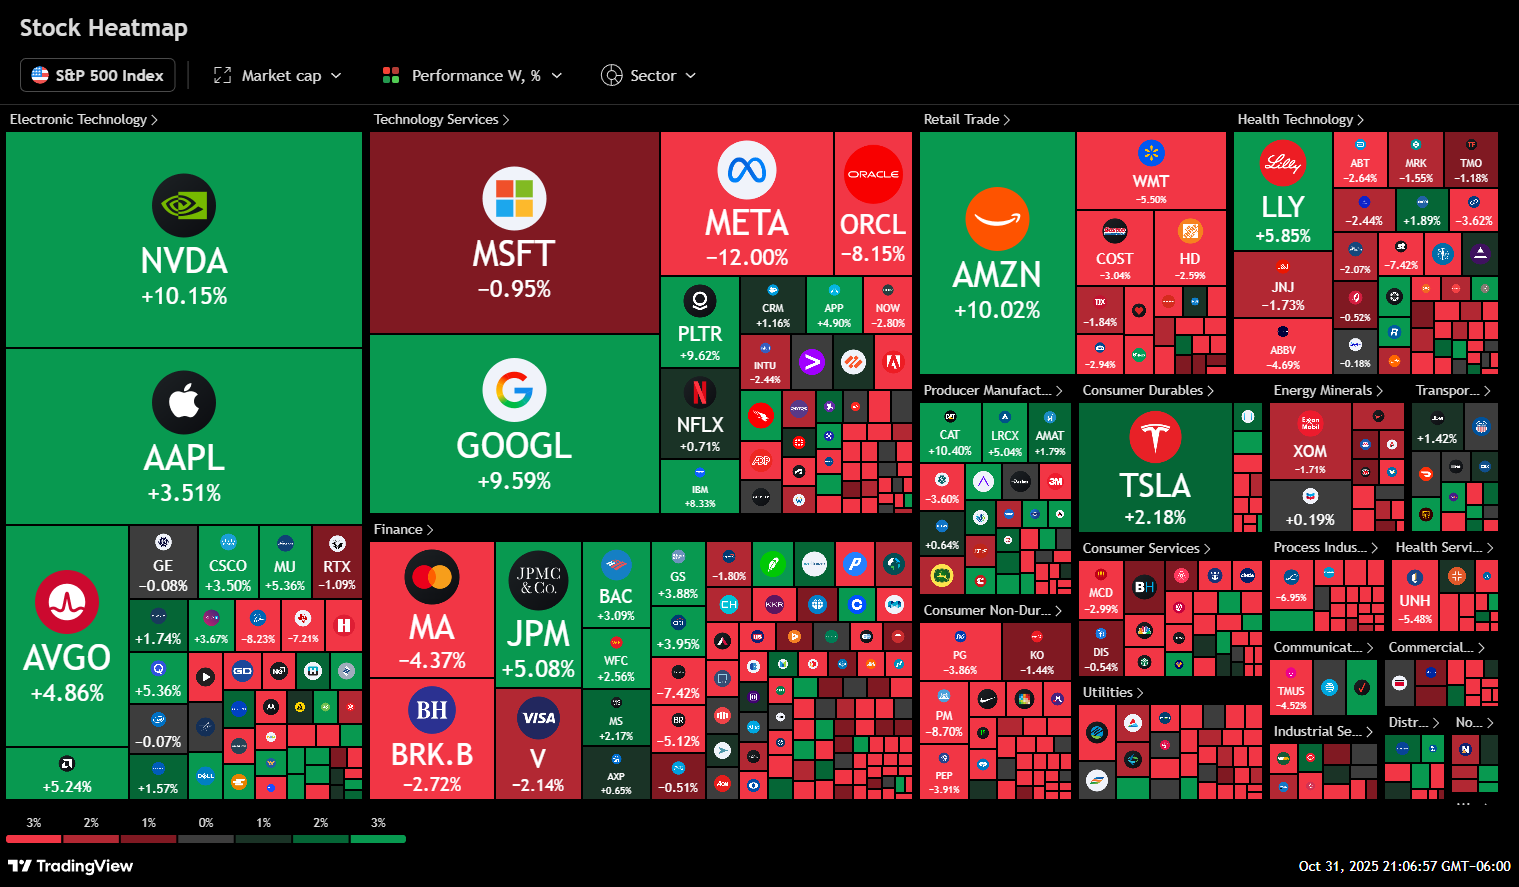
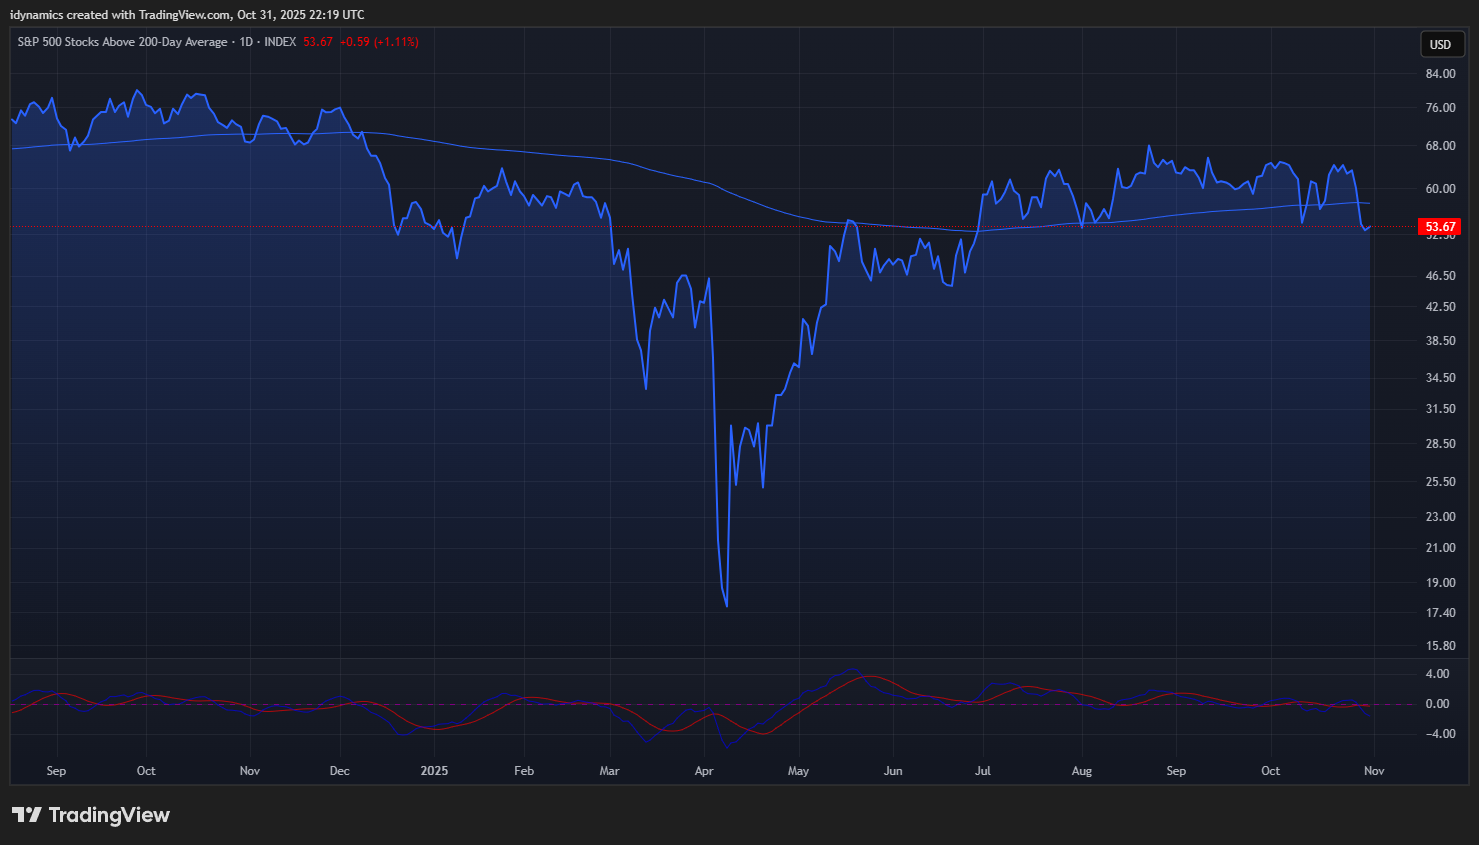 Breadth deteriorated with the SPX clearing another century mark at 6900. The share of SPX stocks above the 200-day MA dropped to 53.47%. The high in September 2024 was 72.92% and 82.70% in March of 2024. Divergence remains the name of the game. 10 stocks make up 40% of the SPX. (See above)
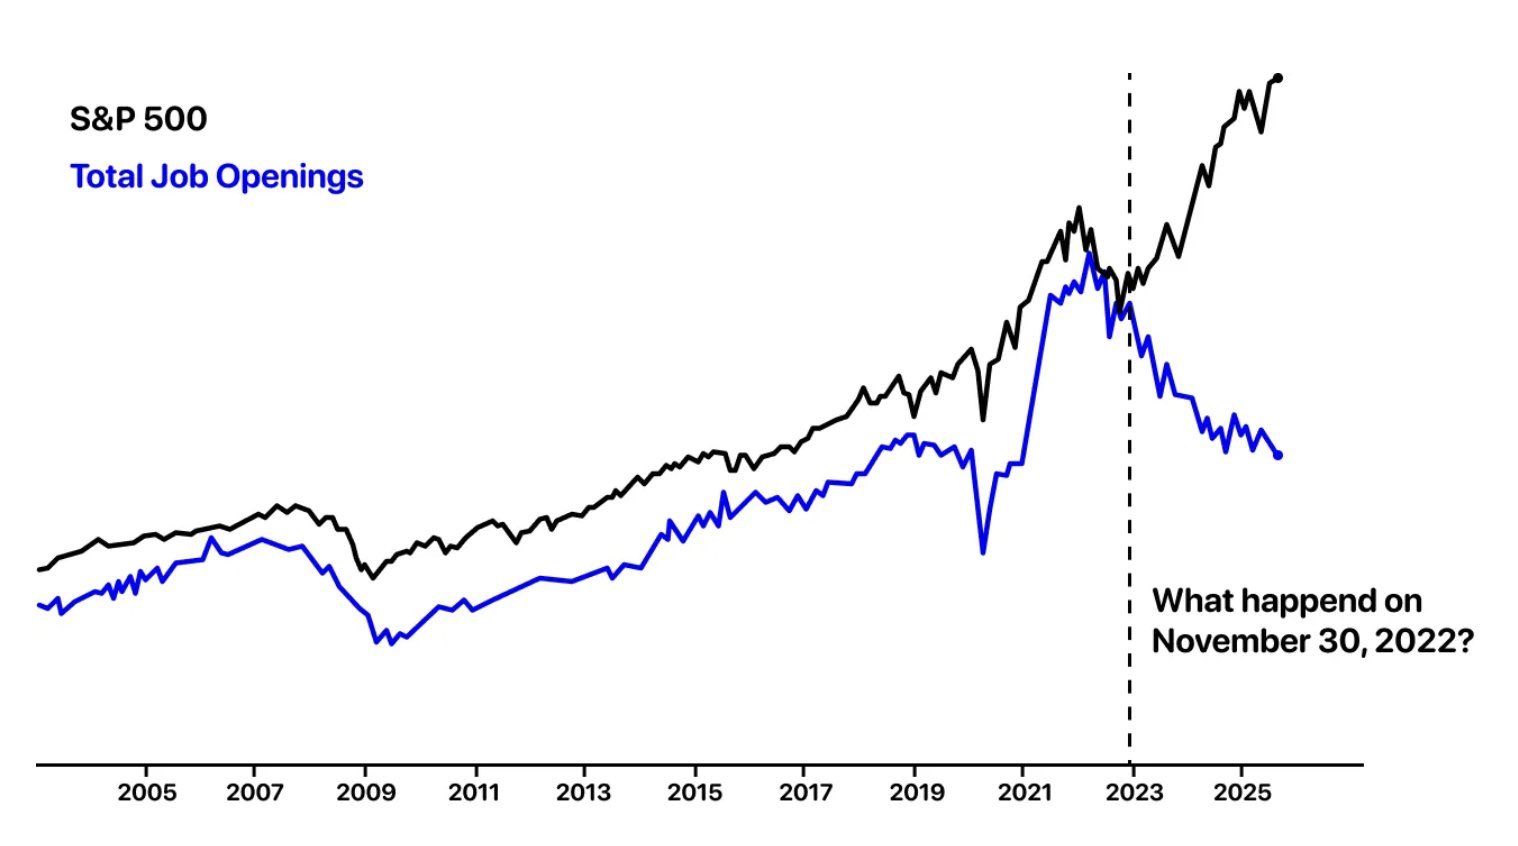
Consumer Sentiment
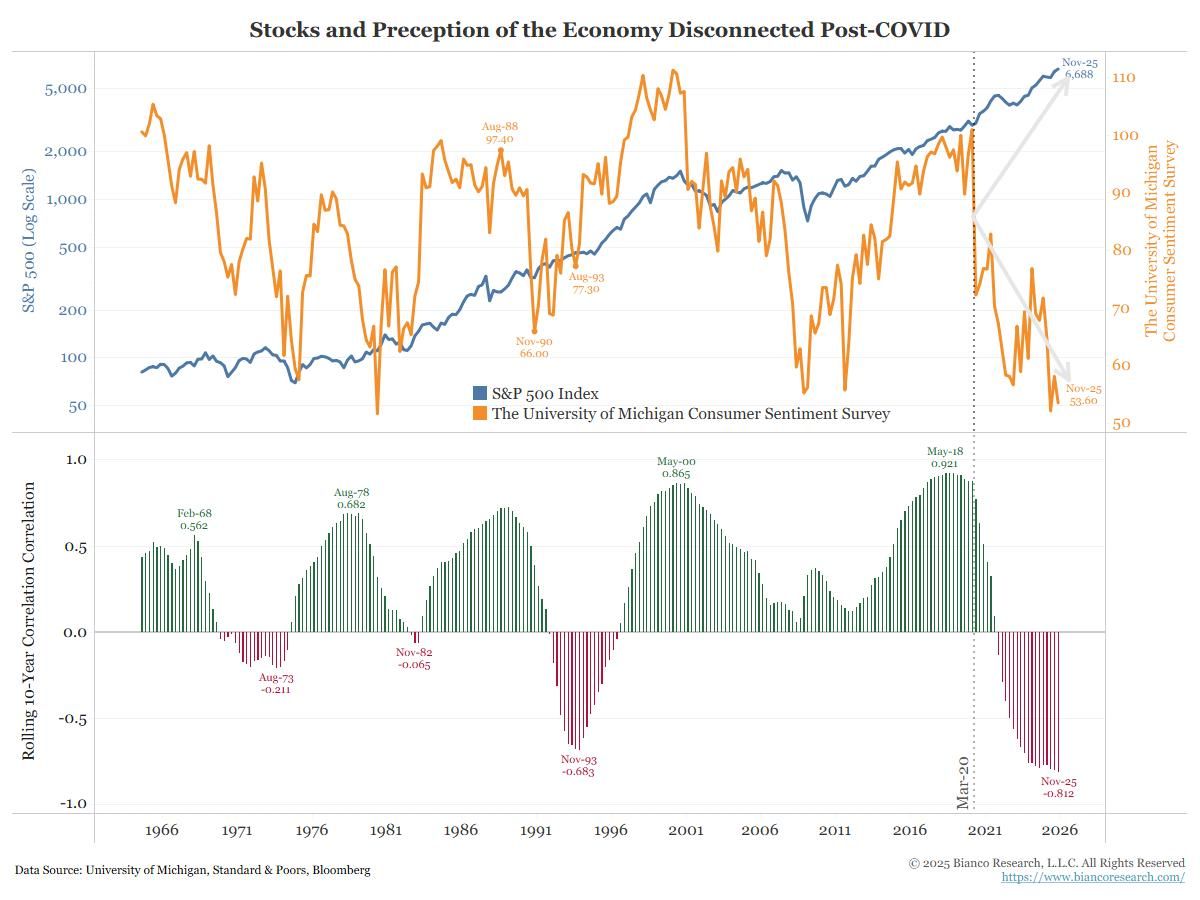 Consumer Sentiment continues to crash relative to the price of equities. Again, two completely different worlds for the U.S.A.
MAGS (Magnificent 7) Weekly Candles
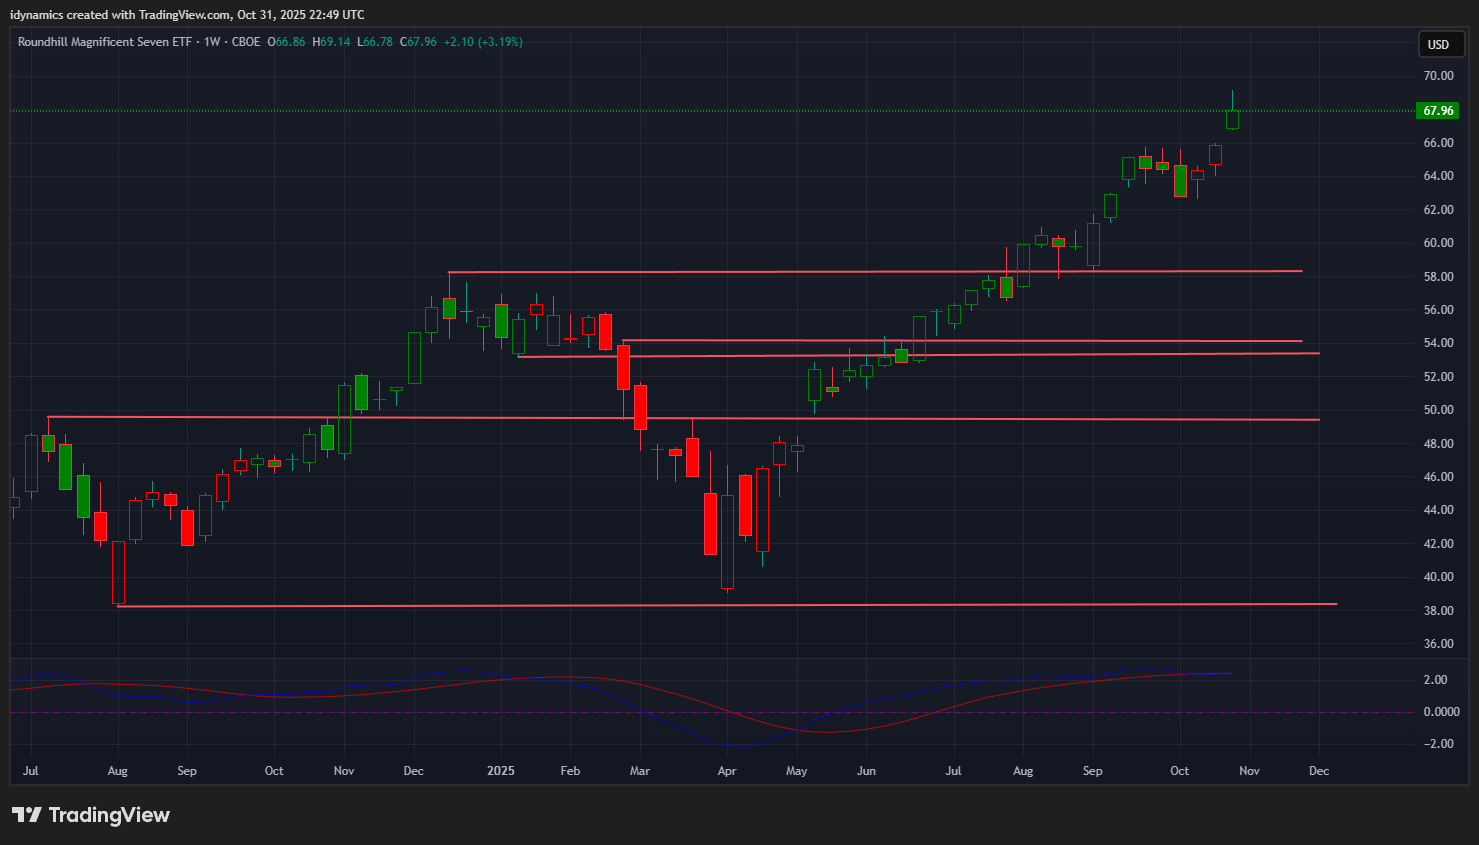 The MAGS gapped into record highs and closed up +3.19% in the middle of the week’s range. The chart still has higher targets at 74.00/74.30. Support is now 62.03 and 57.63. Under 57.63 can test 54.07 with critical support at 50.51/50.00.
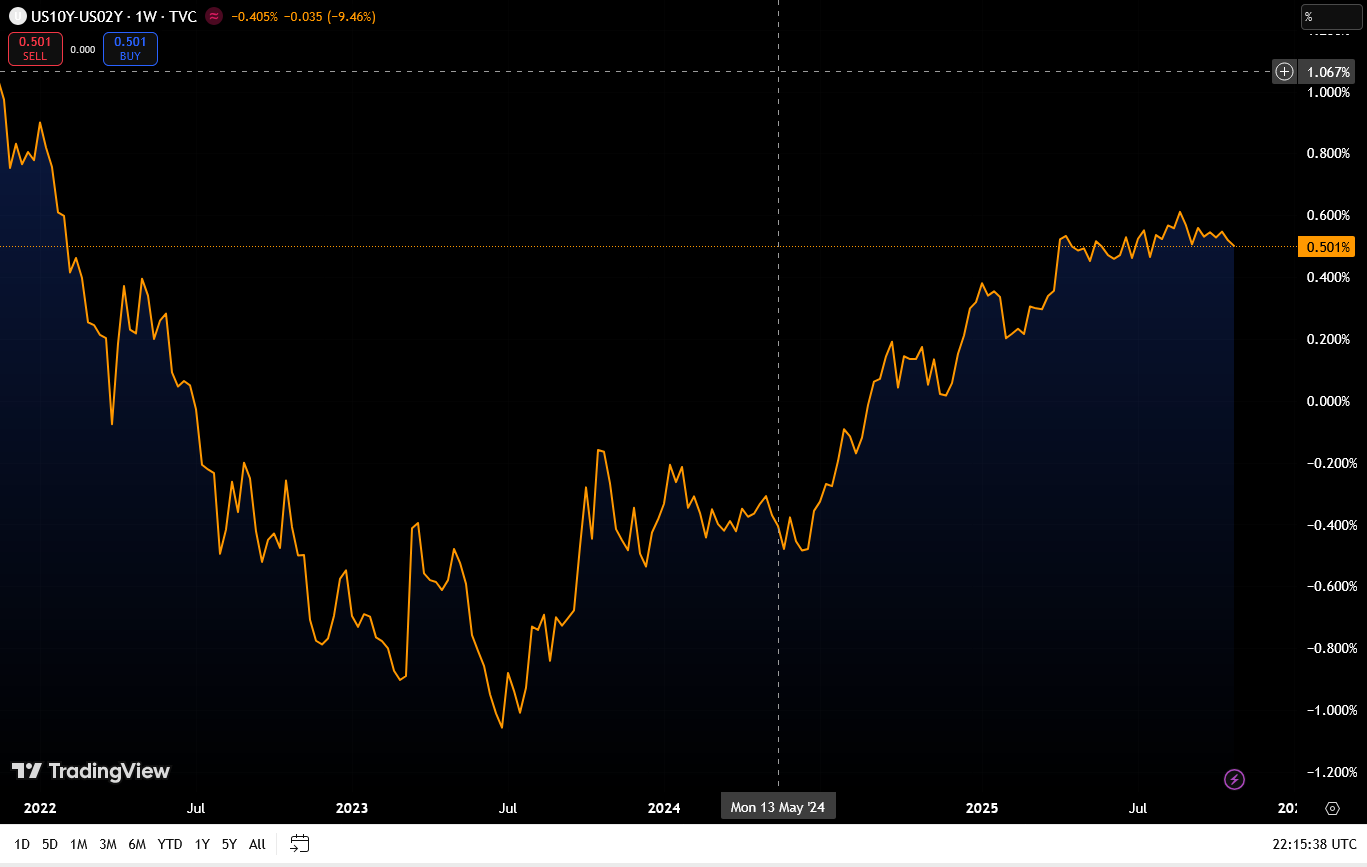
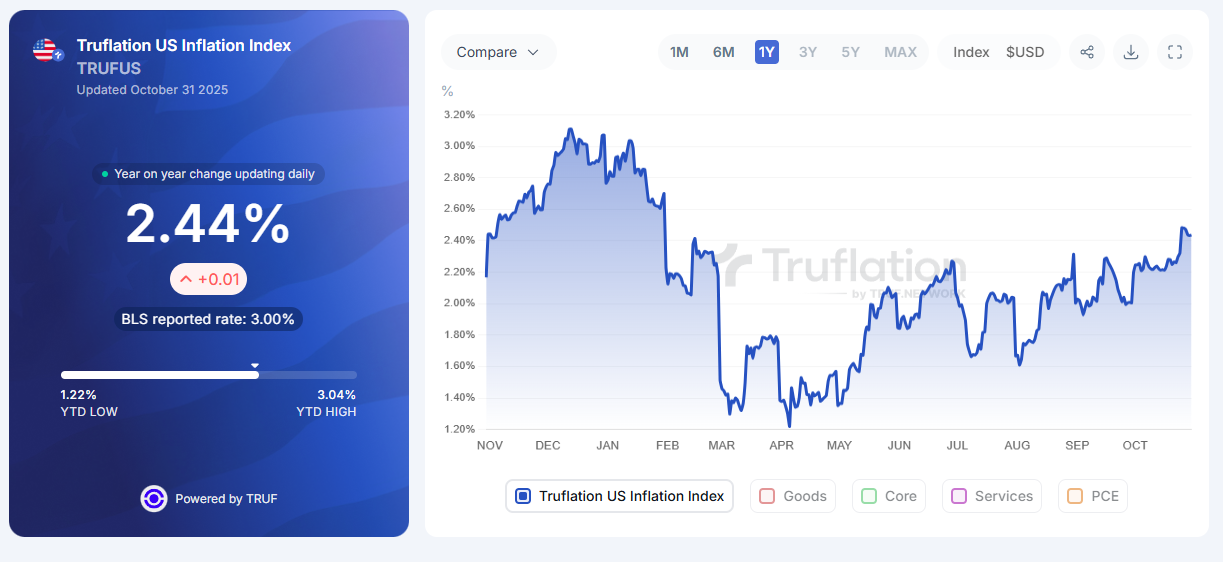
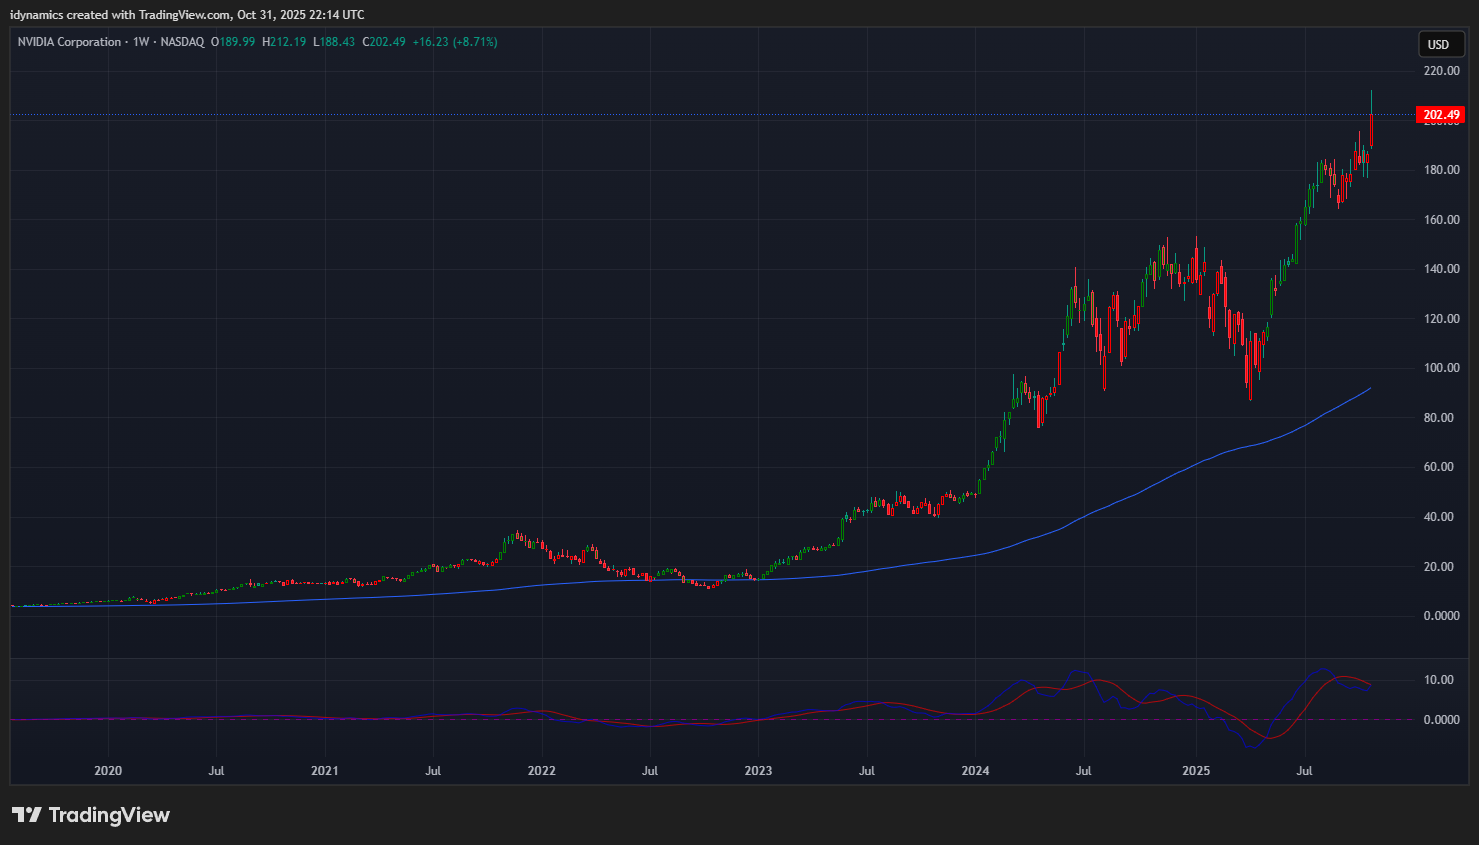
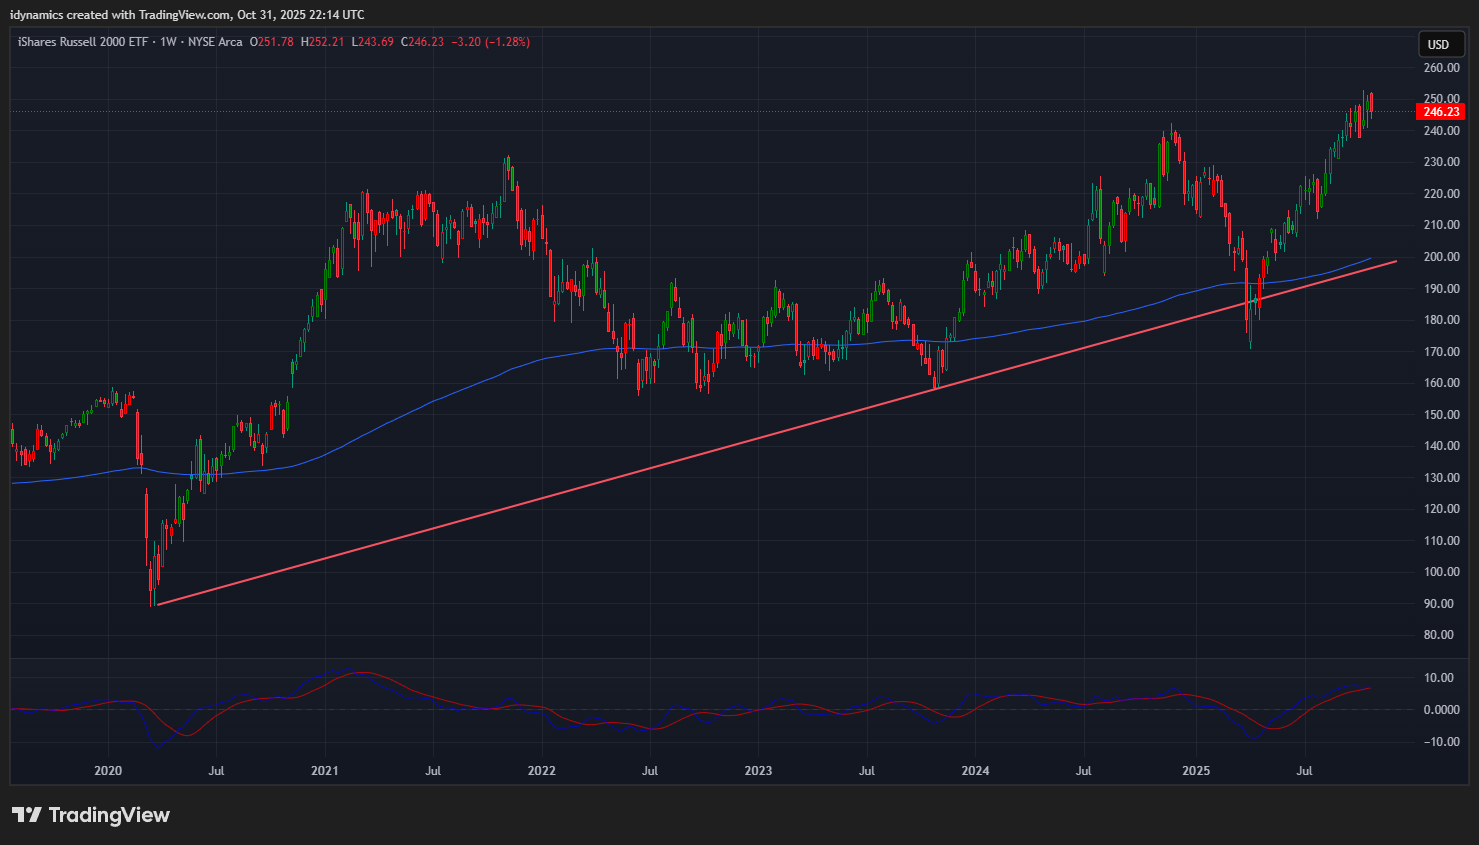
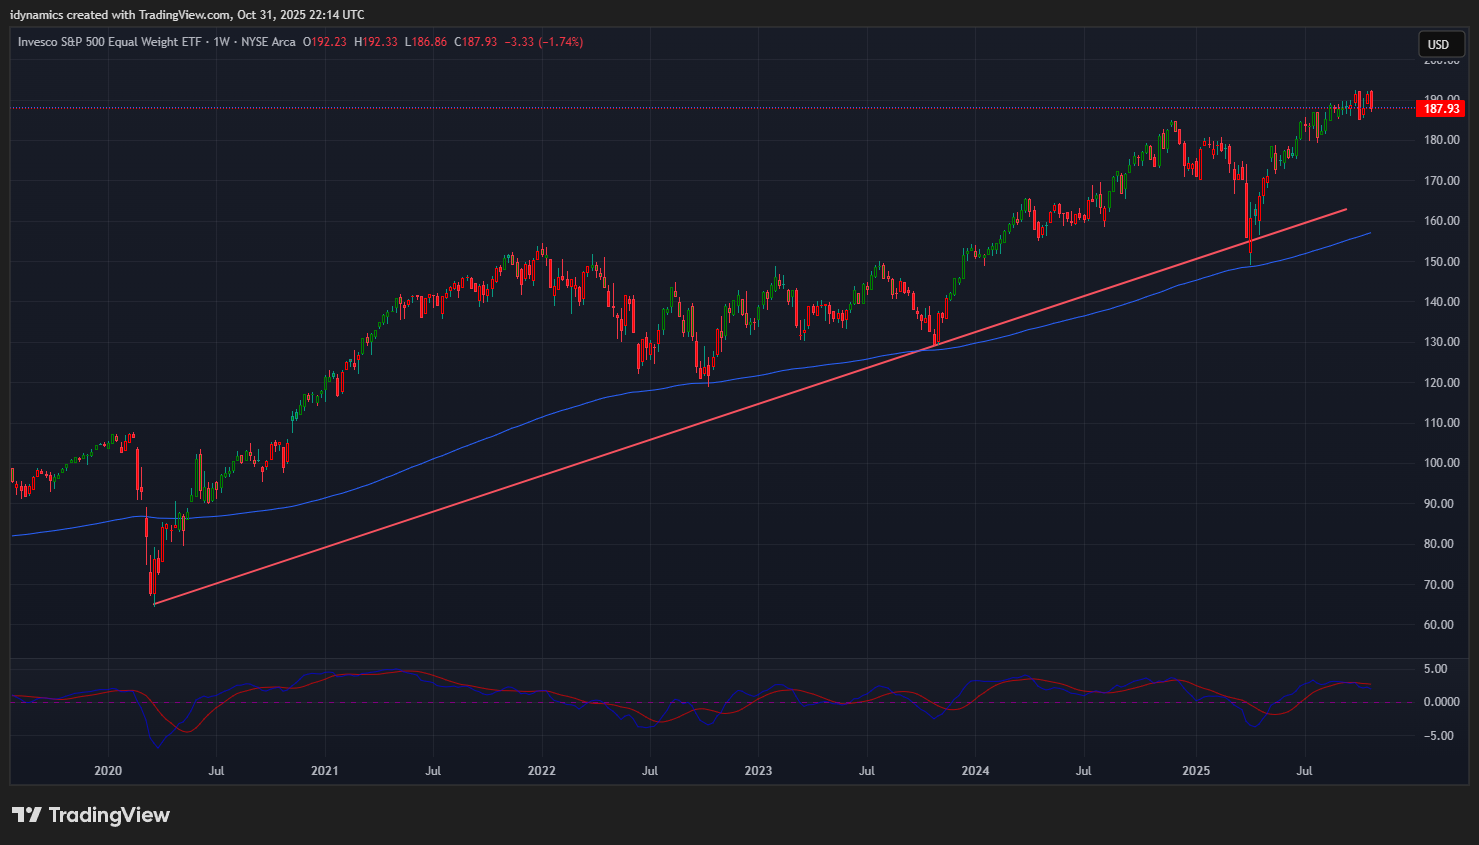
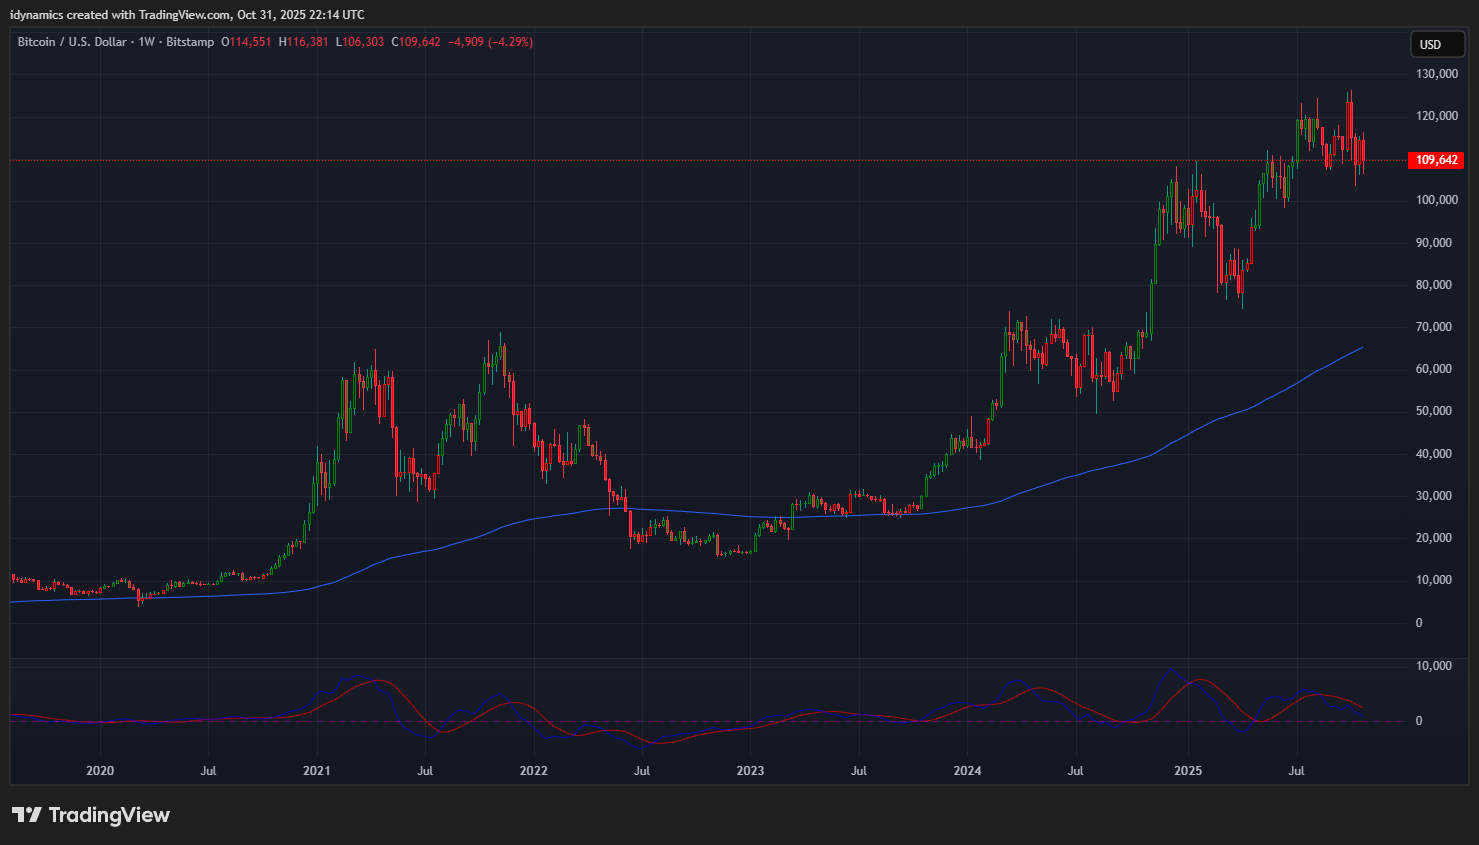
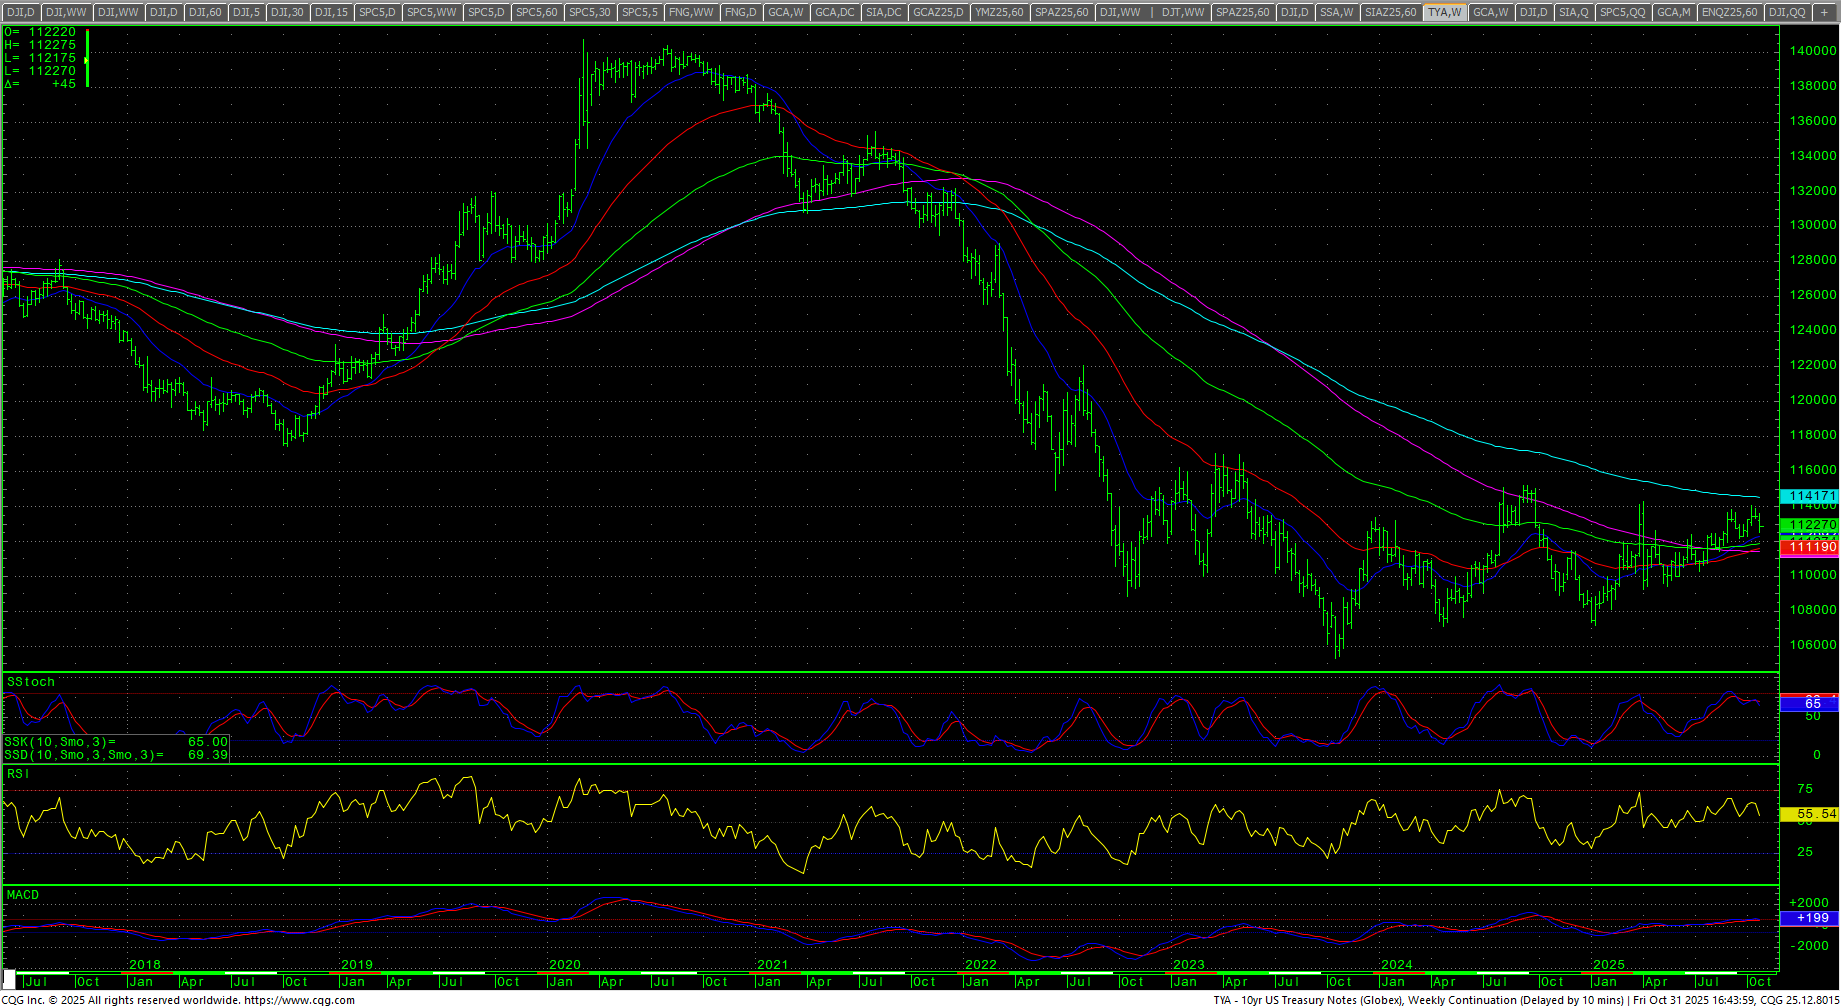
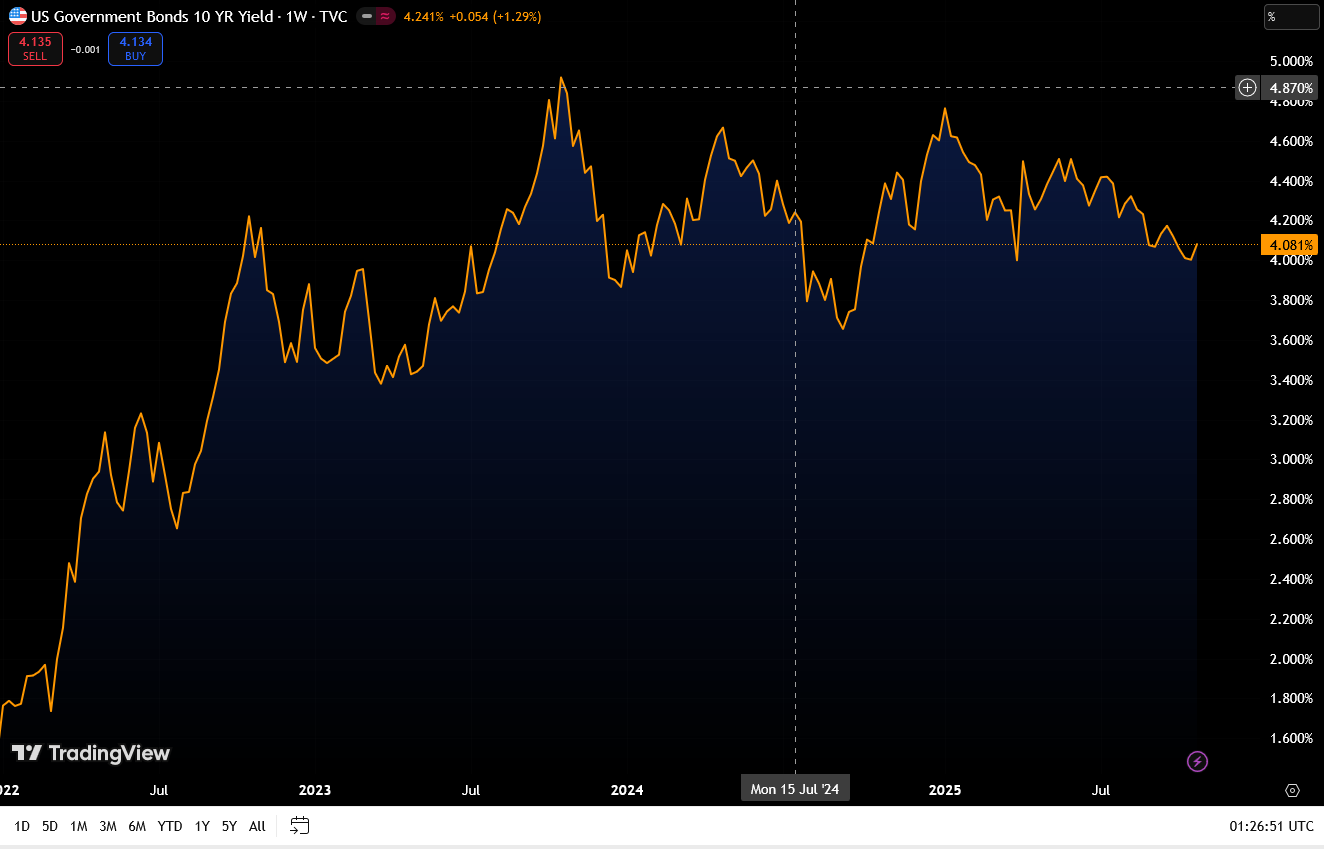
The RSP:SPY crashed into new lows for the move, reflecting the underlying weakness in the broader market. The weekly is trending lower in an oversold position and the MACD is down. Resistance remains pivotal at .294. The IWM traded a downside reversal week and closed on the lows, down -1.28%. The RSP traded a wide outside down week and closed on the lows, down -1.74%. NVDA gapped higher and soared to record highs (hitting that +$5T market cap mid-week) and closed in the upper 50% of the range at a record high, up +8.71%. Bitcoin reversed lower and closed on the lows, down -4.26%. Support is pivotal at 100.35/100.00 and 94.26/94.00. Resistance remains at 114.90 and 11760/118. McClellan Oscillators are neutral for the Dow. The Yield Curve was flat on the week closing at +0.501%. The 10YR yield jumped, closing at 4.081% after trading under 4% during the week. Truflation increased to 2.44%.
10YR-2YR Yield Curve Daily
VIX Weekly Candles 
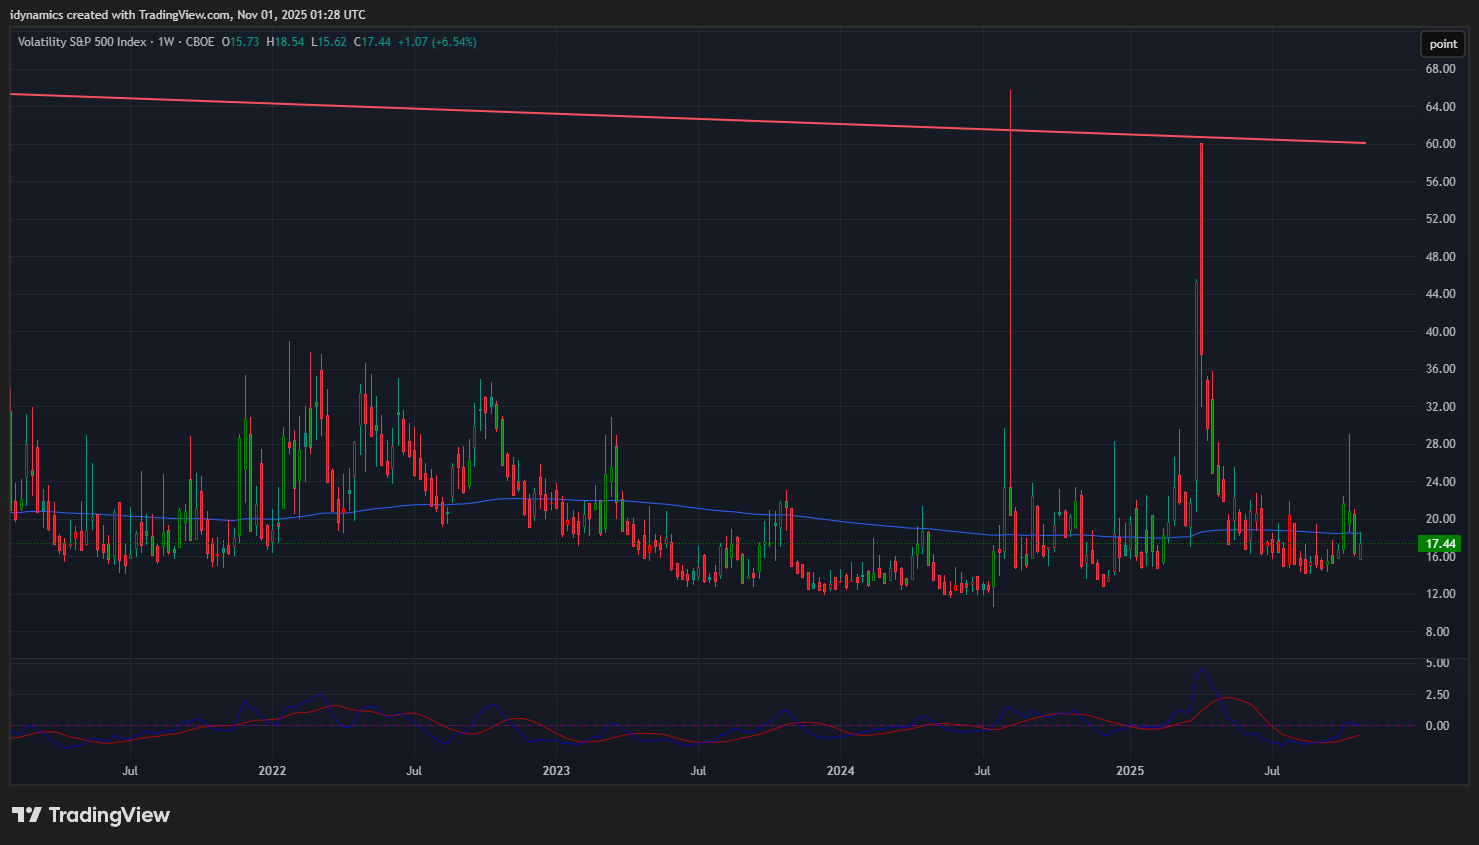
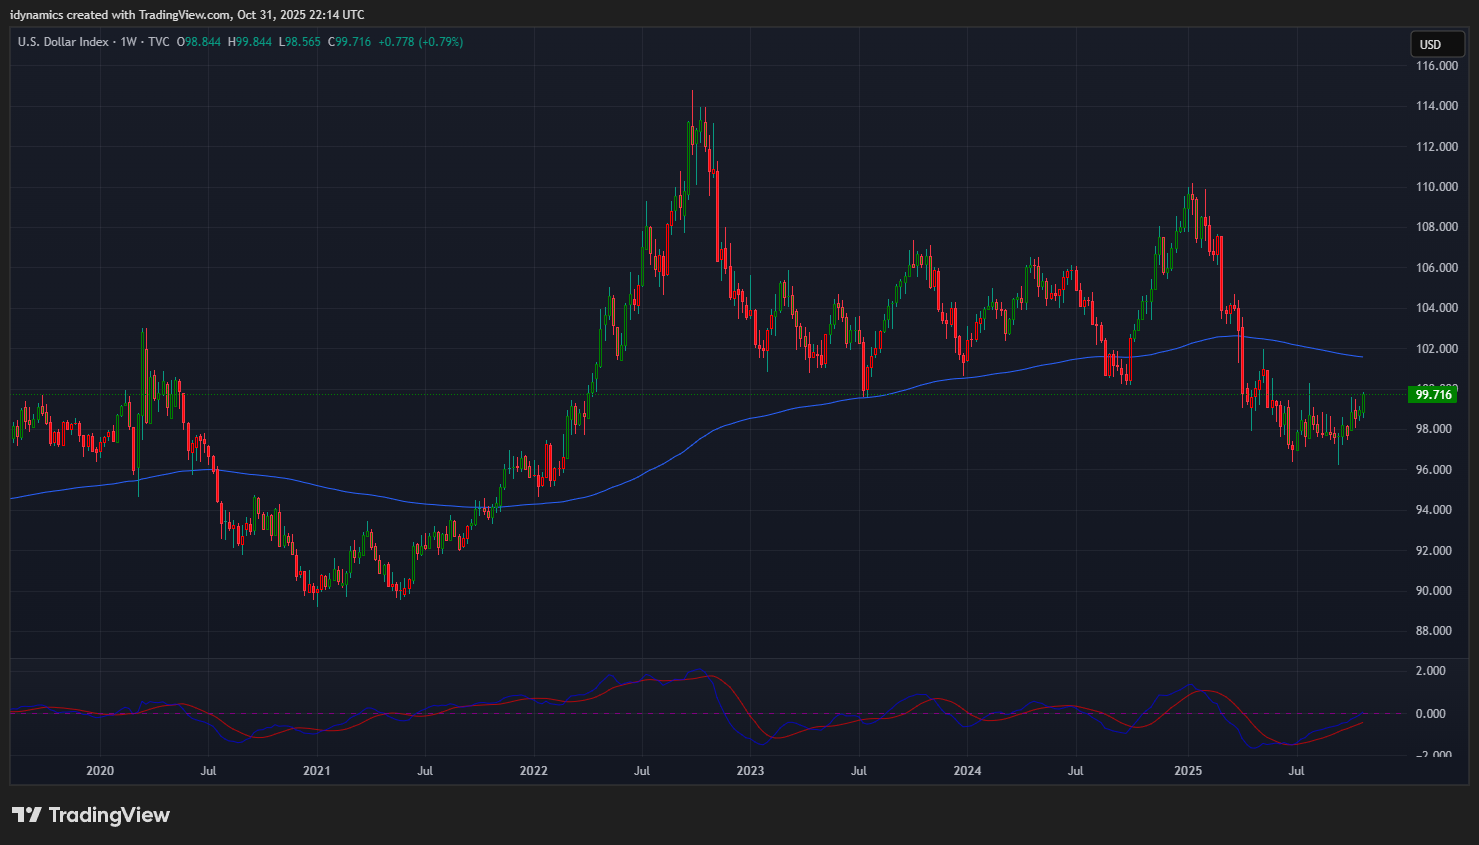
The VIX was choppy and stayed under 20 on the week, and closed up +6.54% in the upper end of the range. The US Dollar rallied to five-month highs and closed on the top of the range up +0.79%.
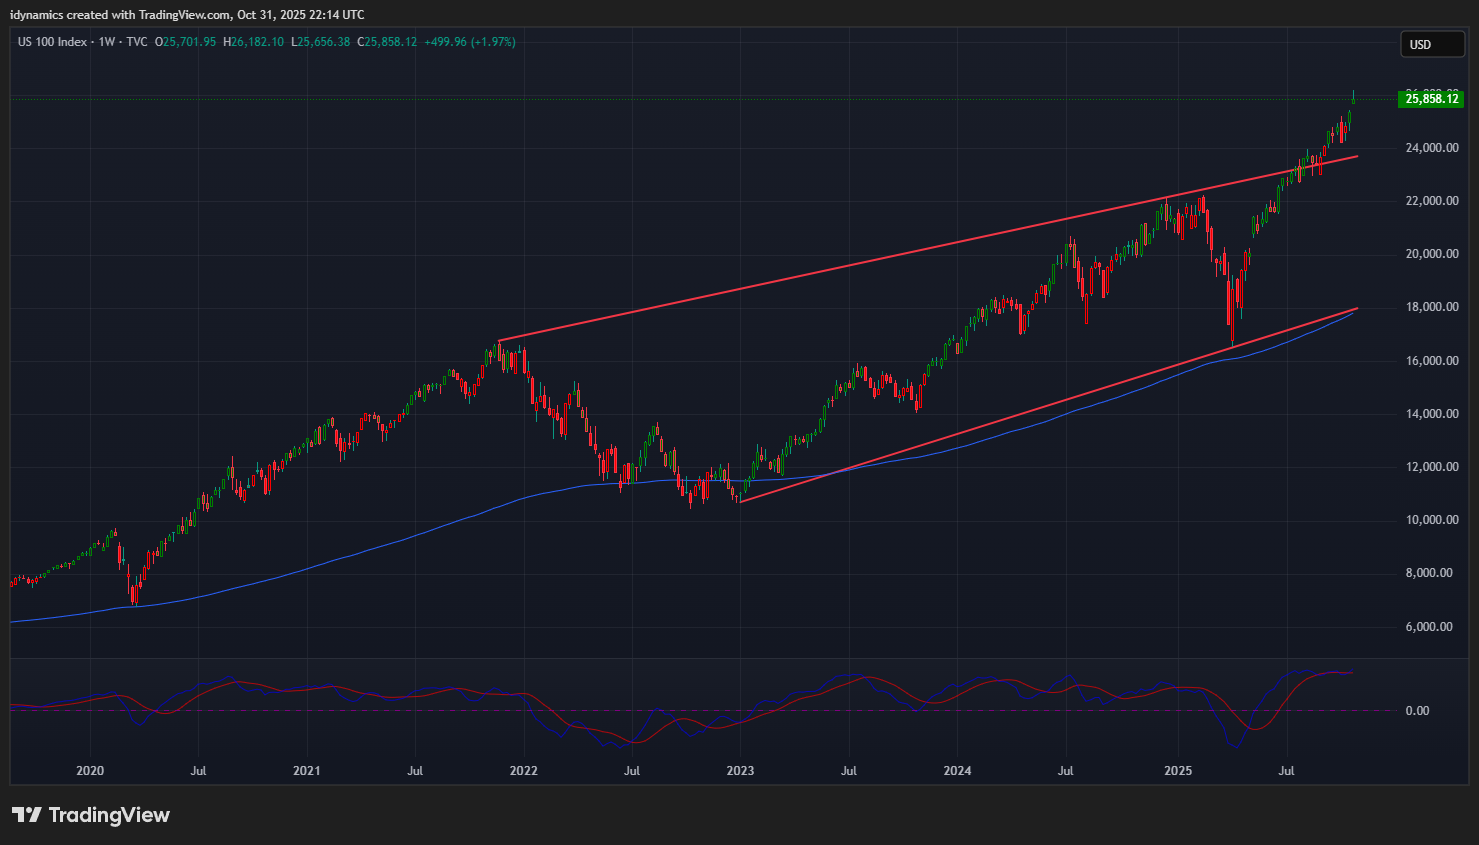
 Nasdaq 100 Weekly Candles
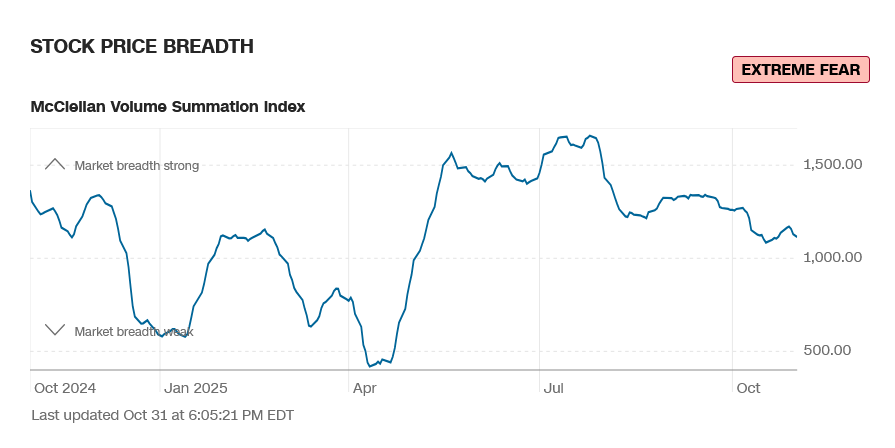
Daily Breadth 
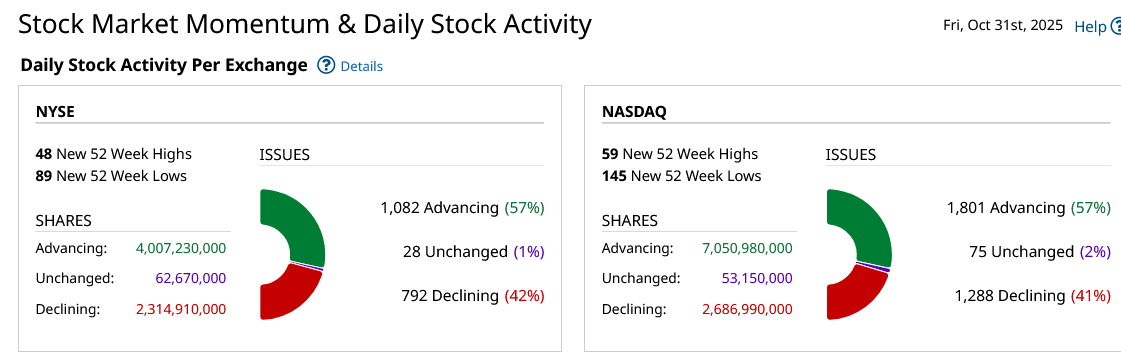
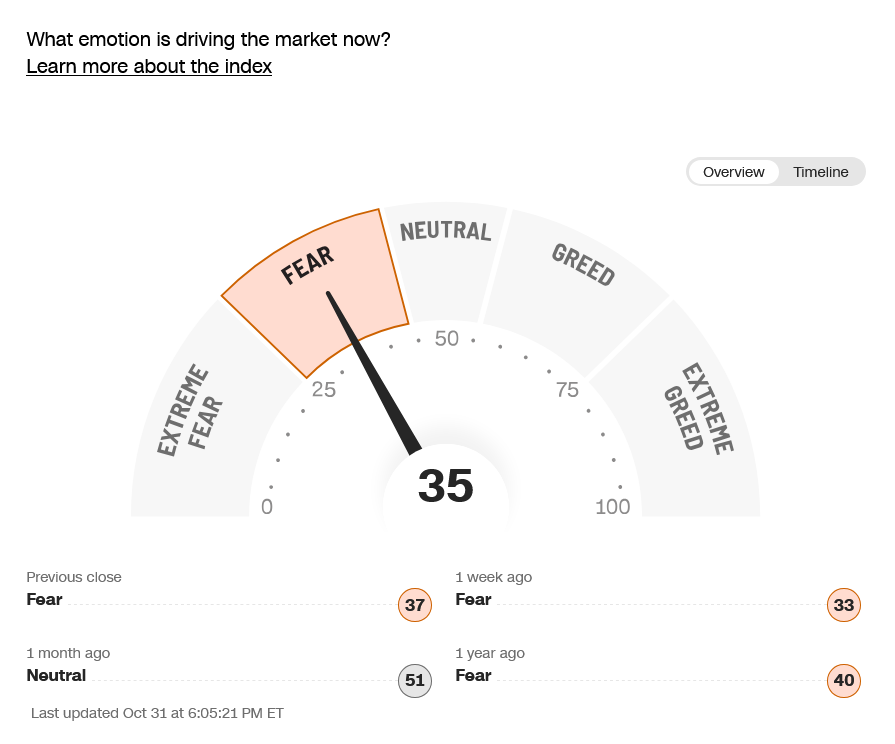
Breadth declined on the week and sentiment still reads extreme fear.
CNN Fear & Greed Index
 AAII Investor Sentiment Survey
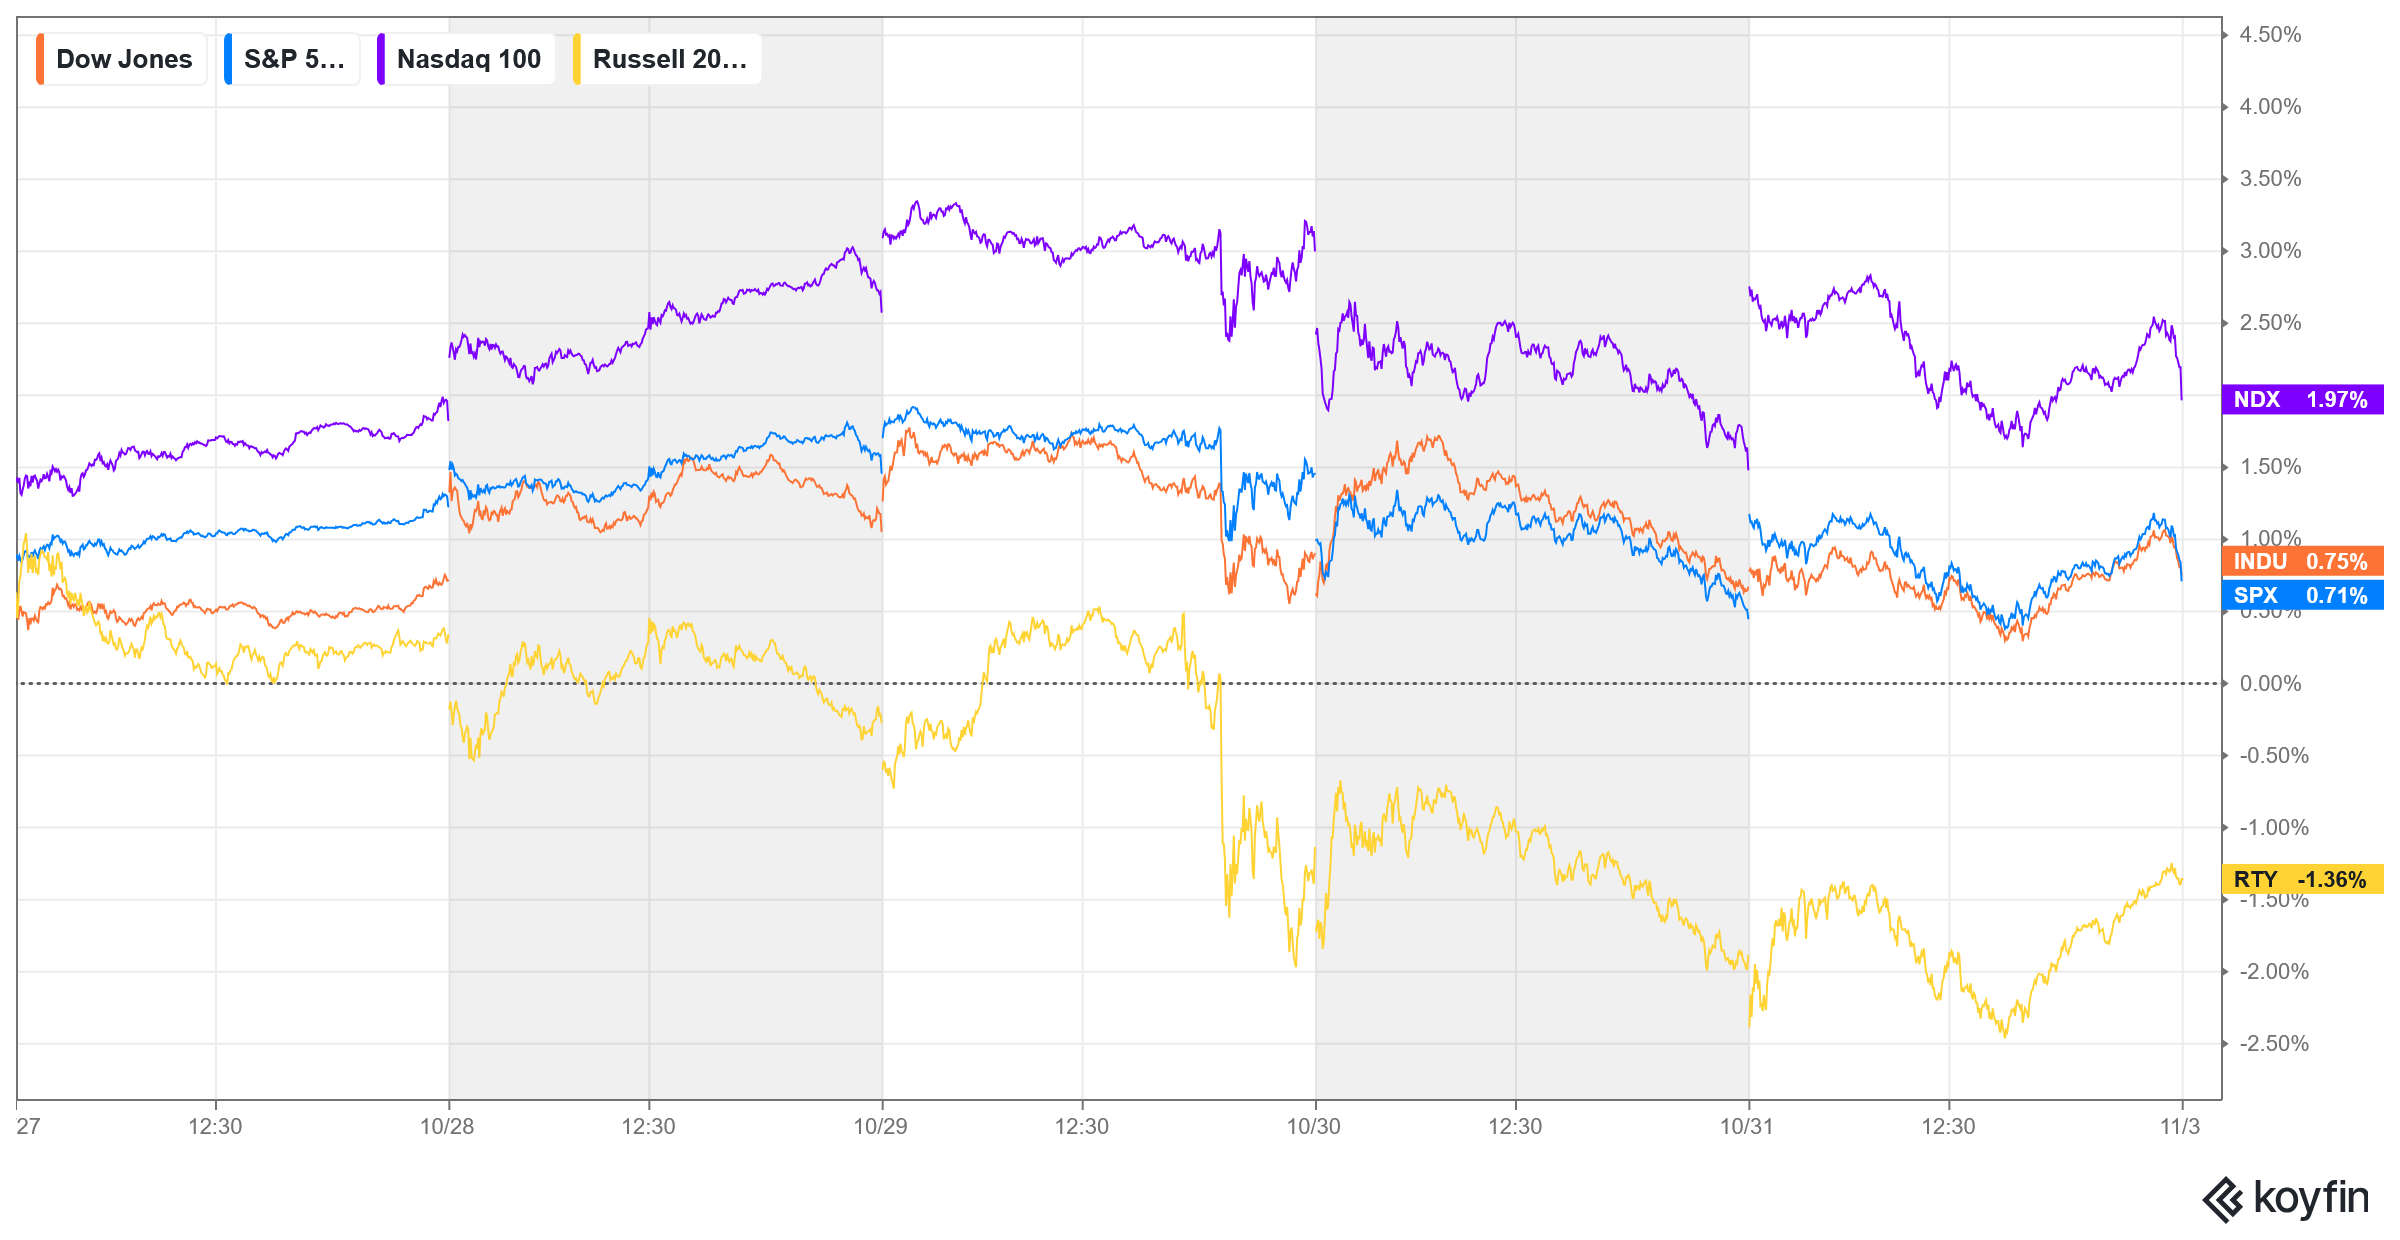
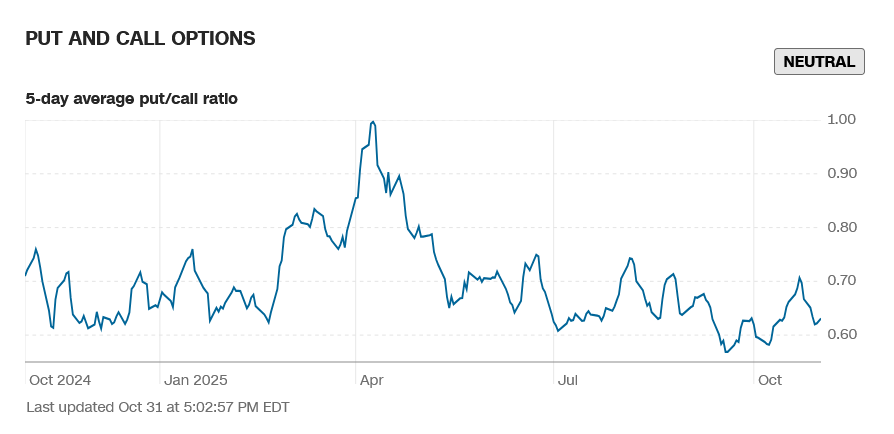
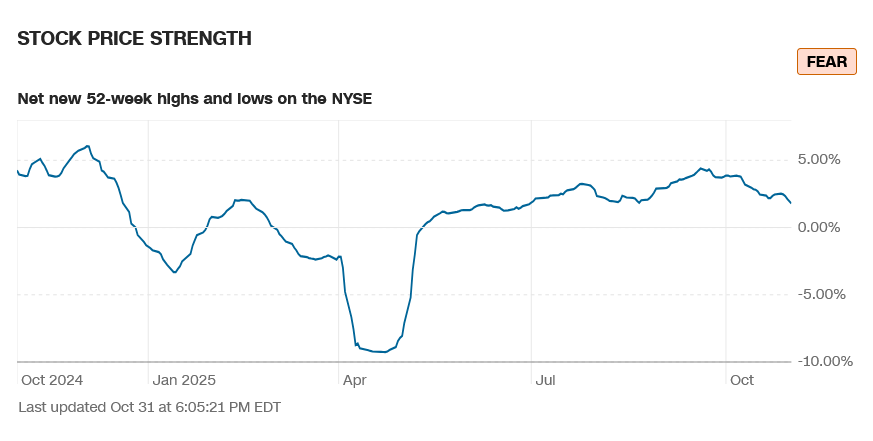
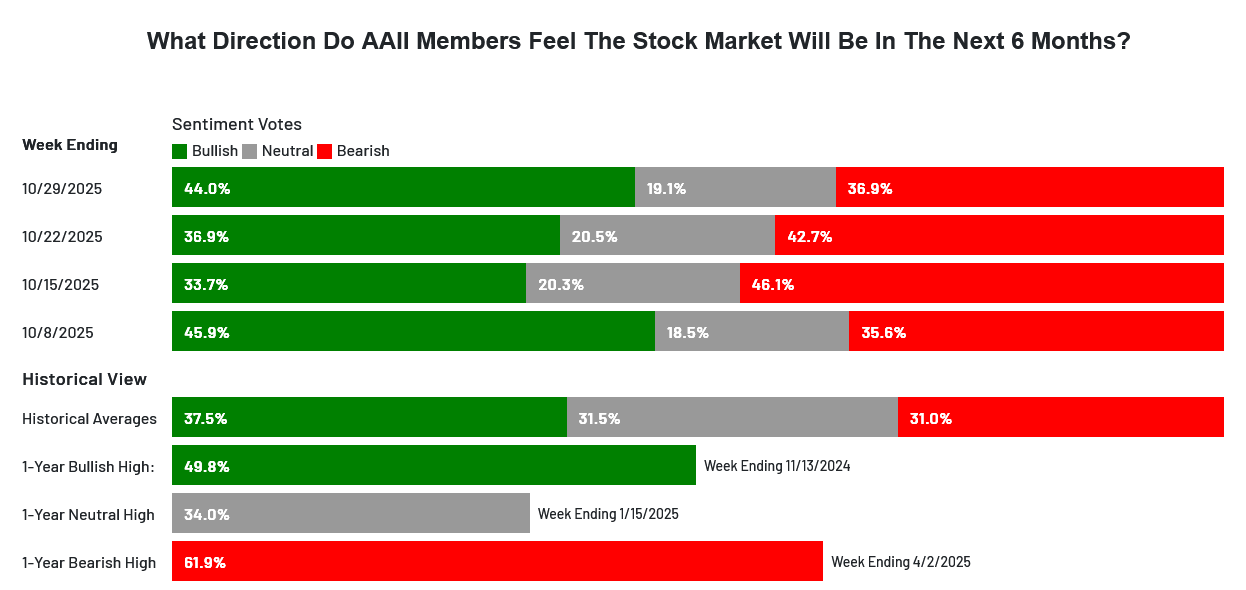 The CNN Fear and Greed Index is 35 and reads fear. Breadth declined on the week and sentiment still reads extreme fear. Latest AAII Sentiment Survey: Optimism Rises . The Dow A/D flattened to 6979. The VIX was choppy and stayed under 20 on the week, and closed up +6.54% in the upper end of the range. The Put/Call closed at 0.63 and reads neutral. The 52-week, A/D was declined to +1.79% and reads fear. The Dow closed the week up +0.75%, closing in the bottom of a gap range at an ATH. The S&P traded to record high territory and settled up +0.71% on the bottom of the gap range. The Nasdaq Composite was up +2.24% and the Nasdaq 100 was up +1.97%. The NYSE FANG closed up +2.53% into record high territory. The Russell was down -1.36% in the bottom of the range. The 10-year notes sold off and closed near the bottom of a the week’s range. The yield on the 10YR jumped to 4.081%.
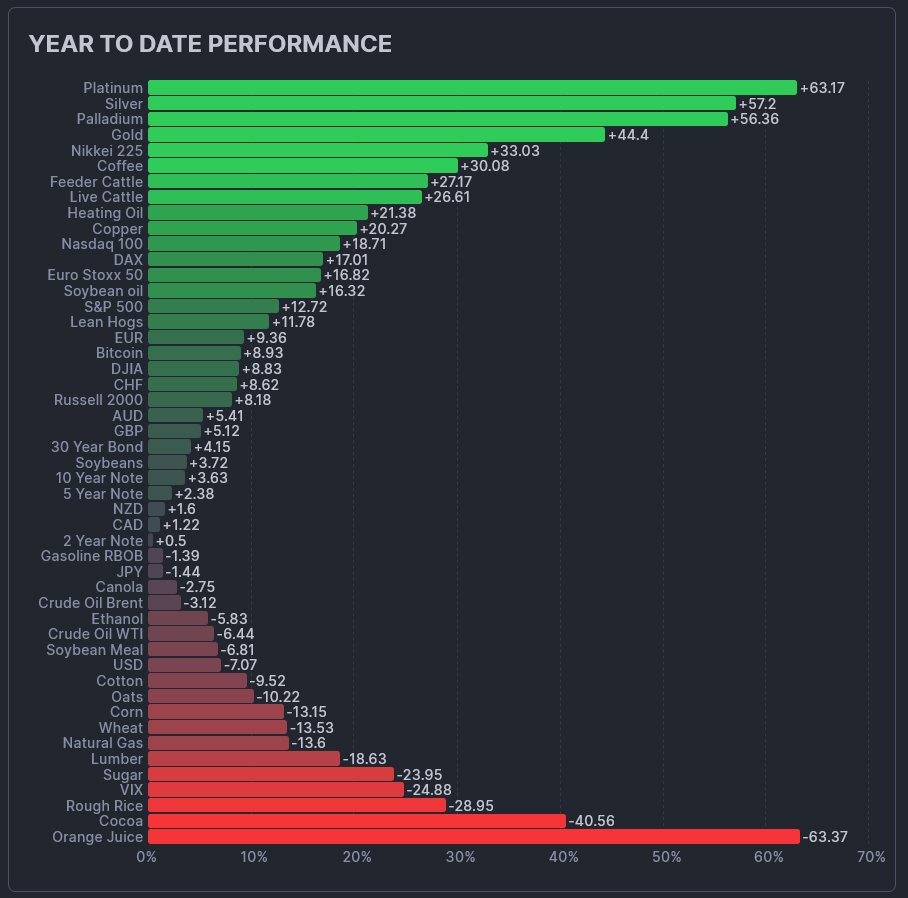
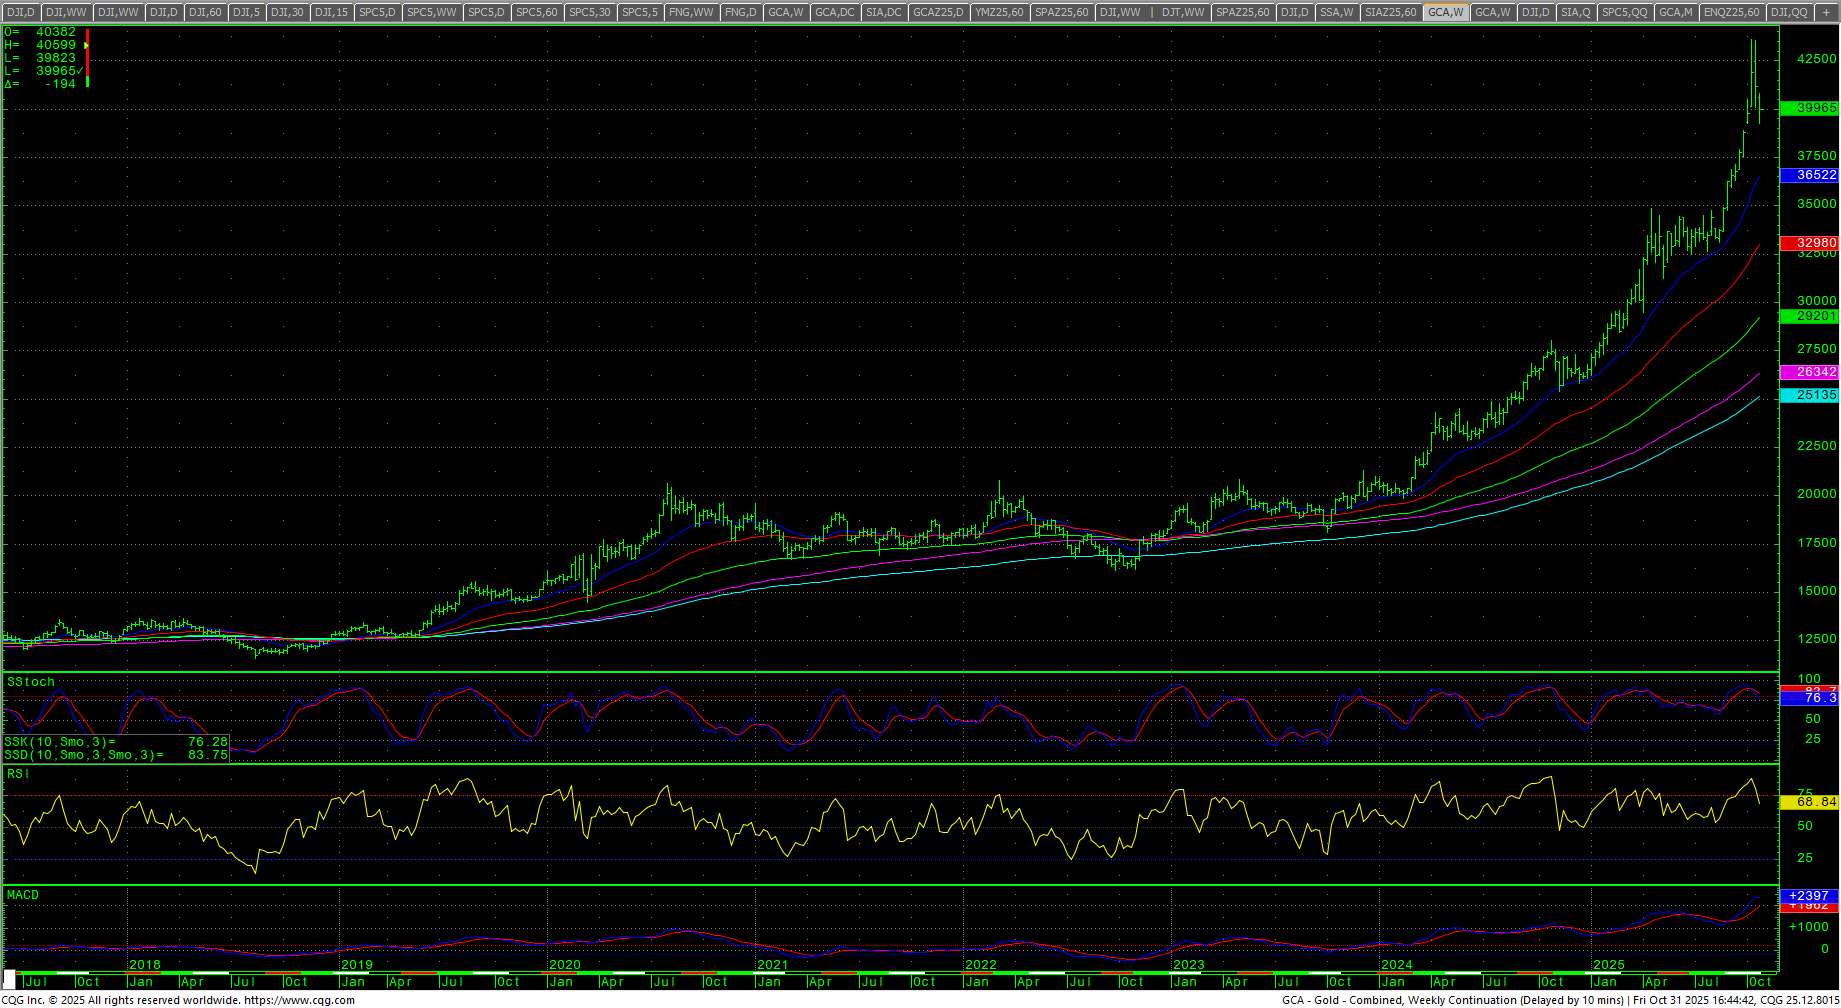
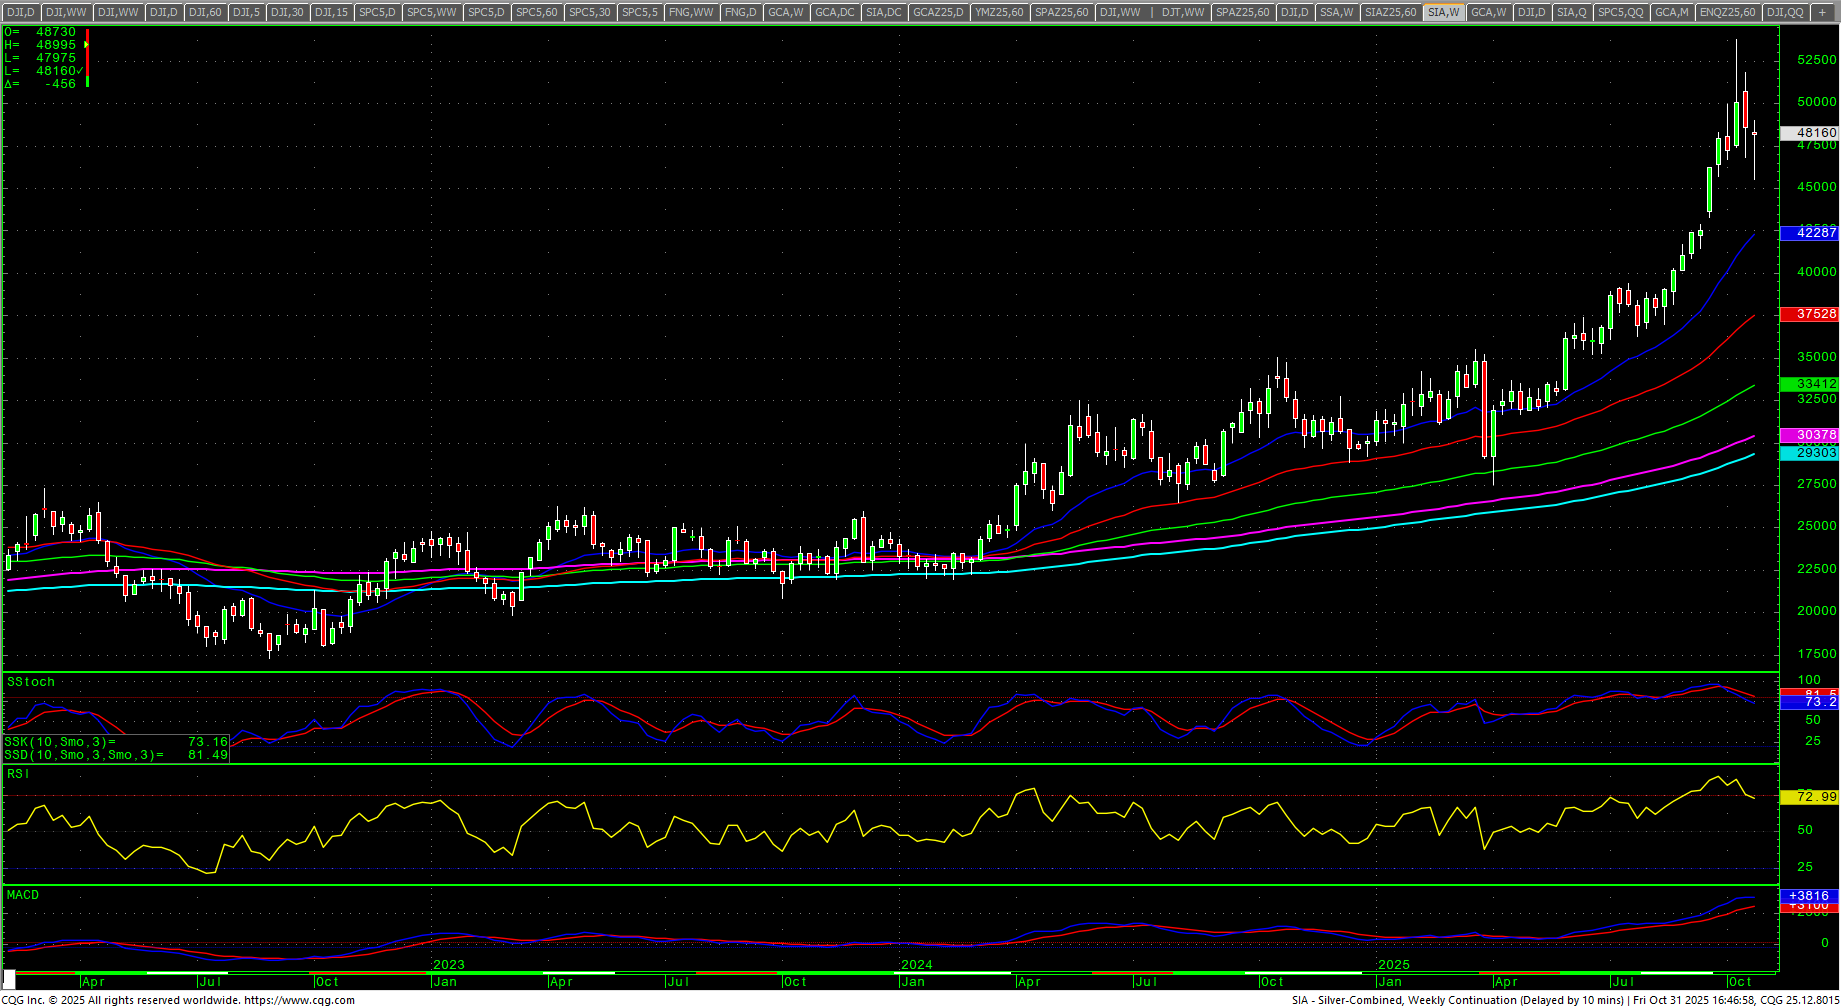
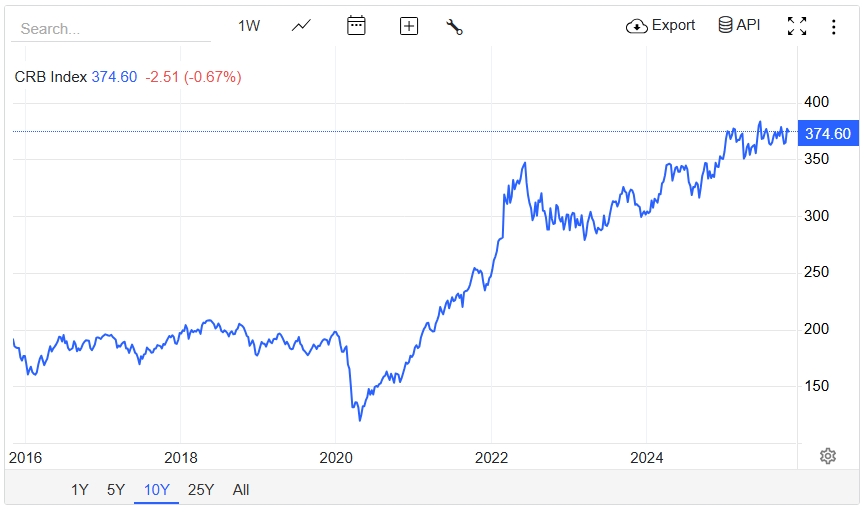 The CRB Index was down -1.32% as the metals continue to struggle after their meteoric run. Gold was lower all week and settled in the middle of the range, right at $4000. Silver fared better and cloed on the highs around the $48 level.
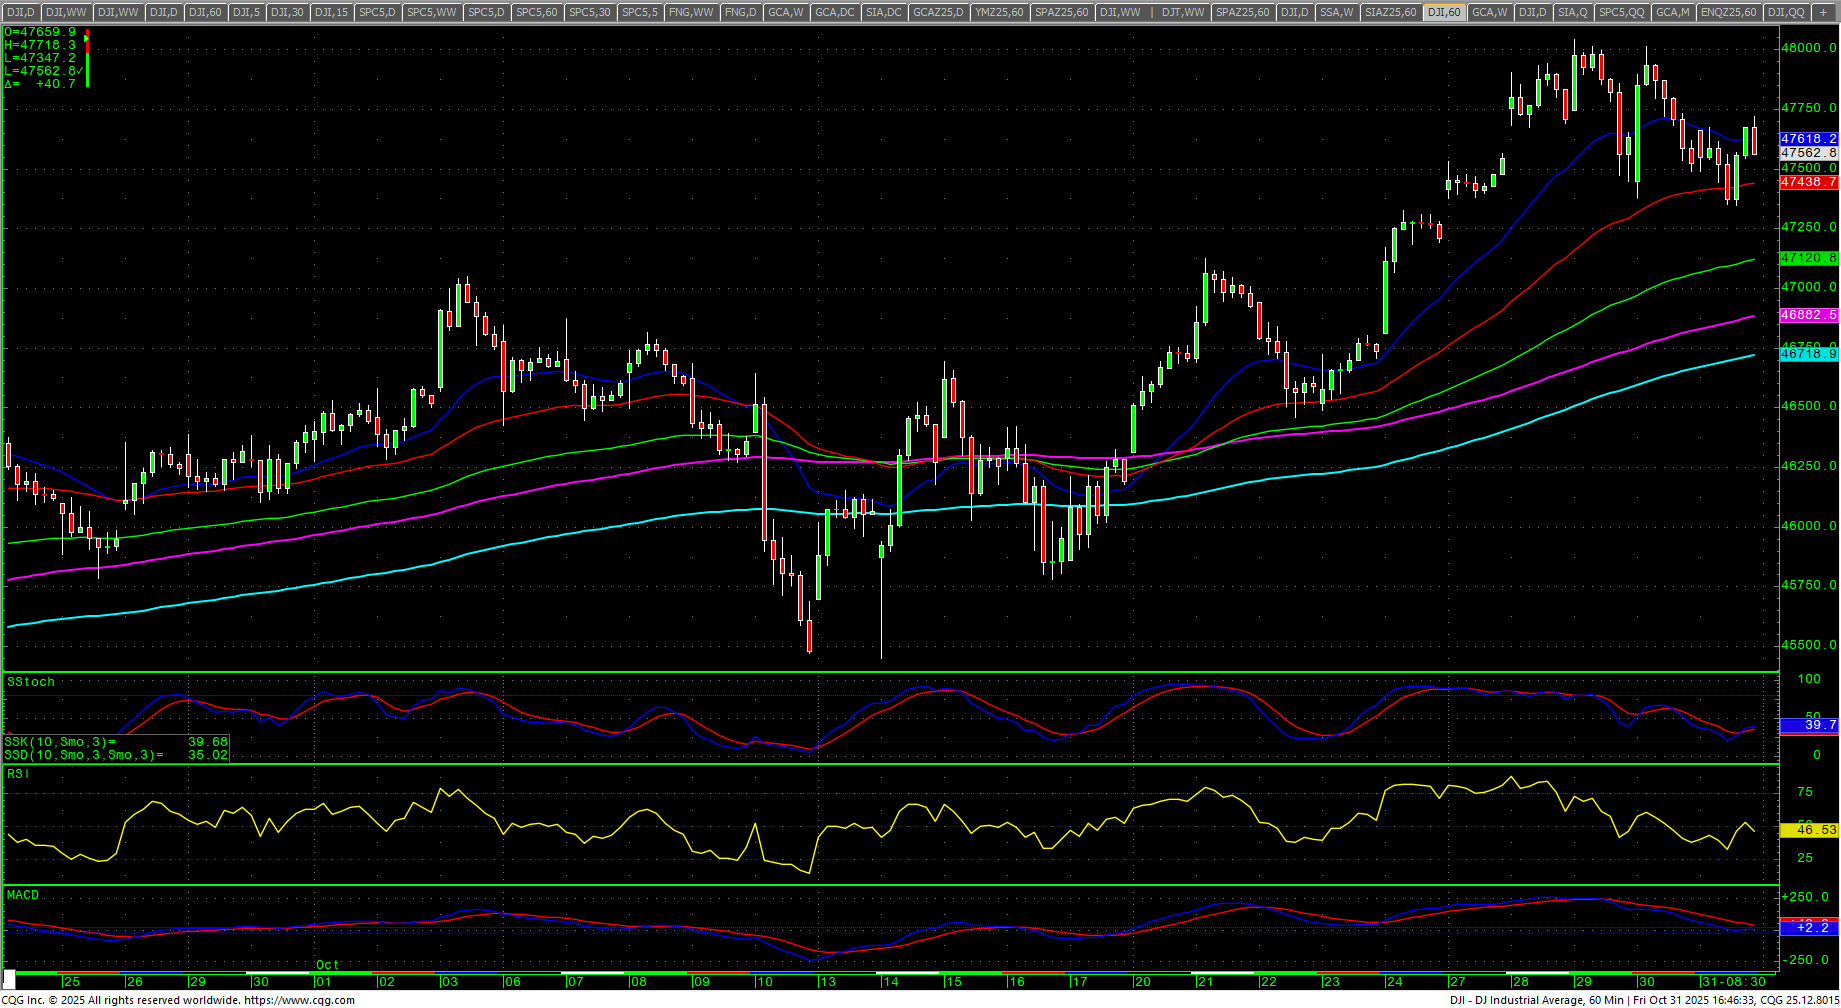
Timing Points
Wednesday/Thursday marks critical timing. Government remains shut down and that means no data releases.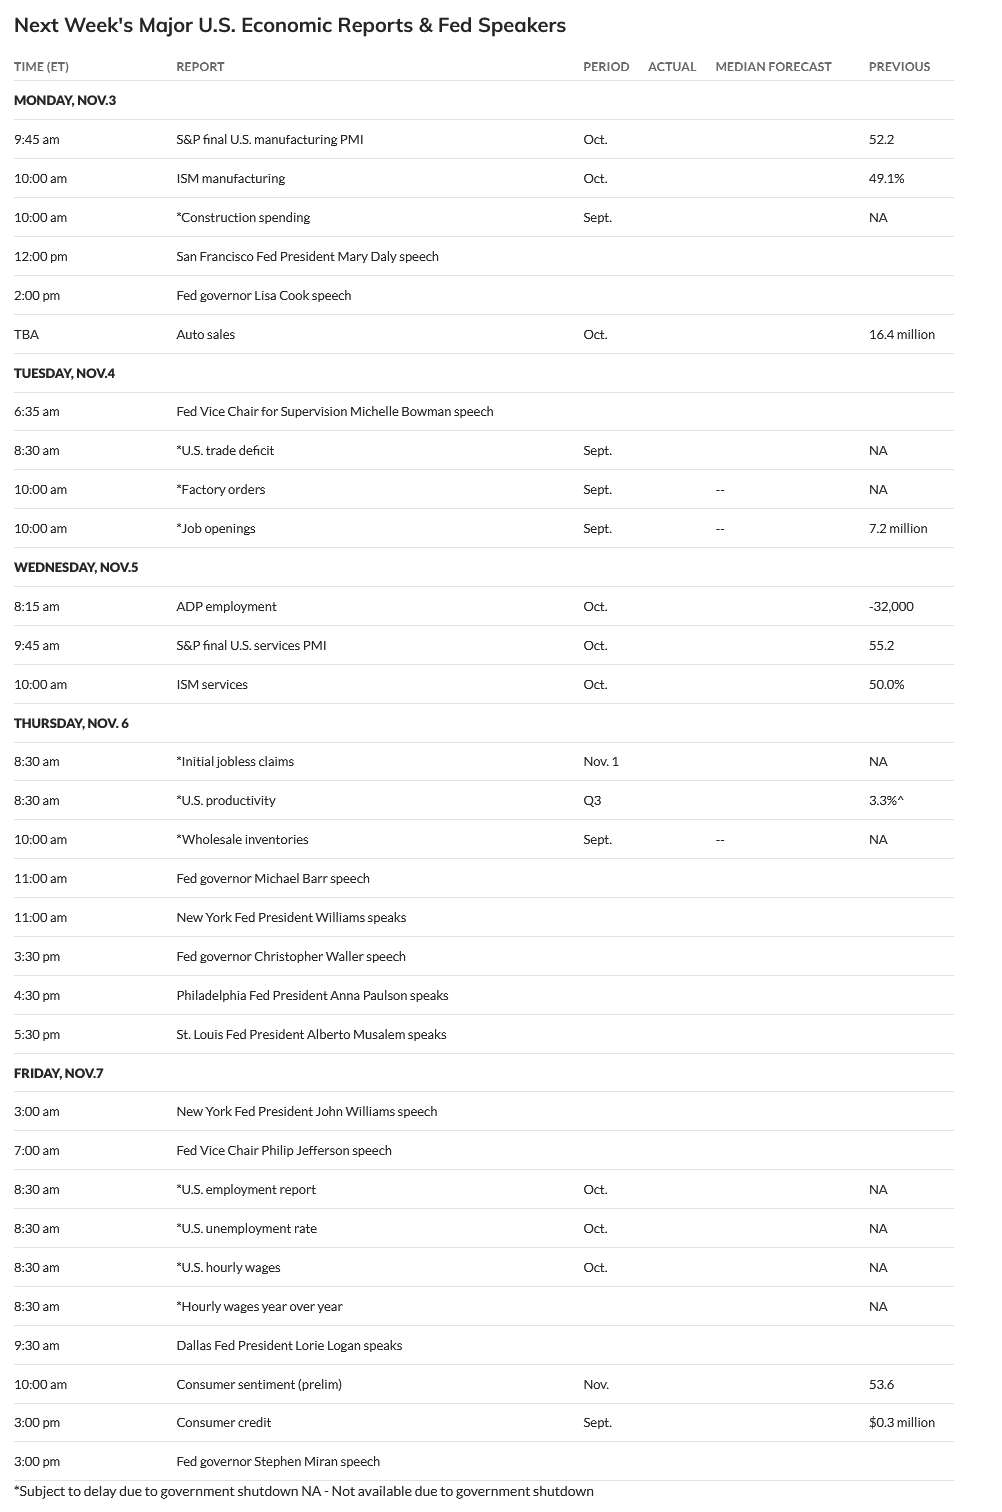
- 11/05-06 *** X
- 11/14 **
- 11/19-20 ***
- 11/25 **
- 12/04 ***
- 12/15 *** X may run through
- 12/17 *** X key to bonds/interest rates
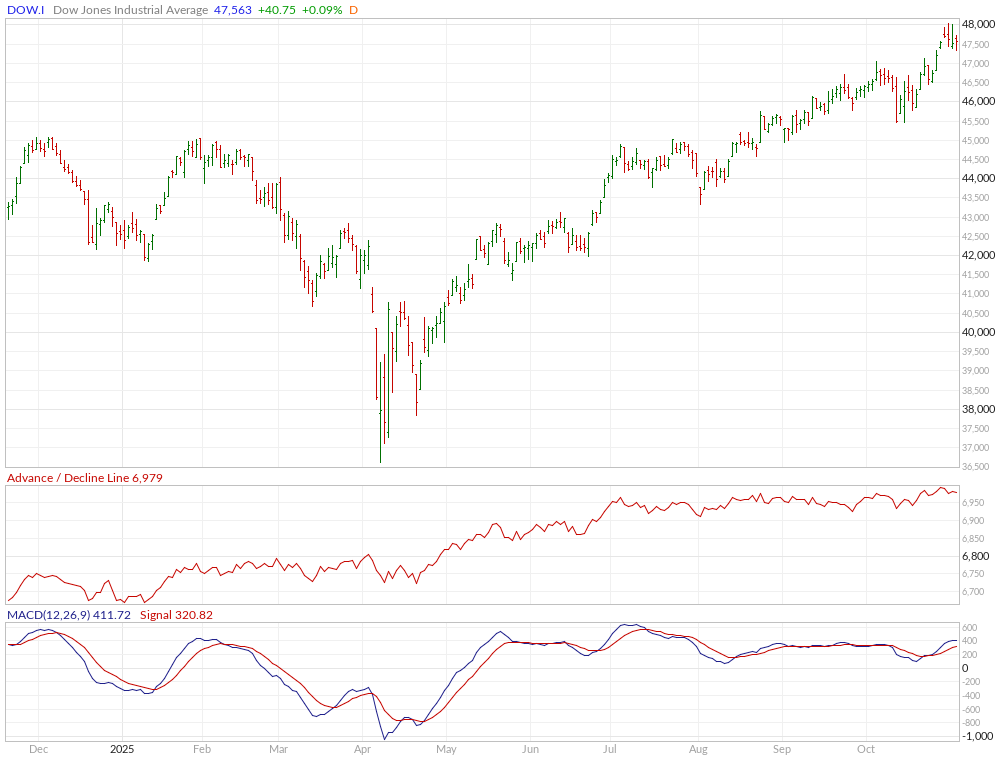
Dow Jones Industrial Average
Dow Jones Industrial Average Weekly H-L-C
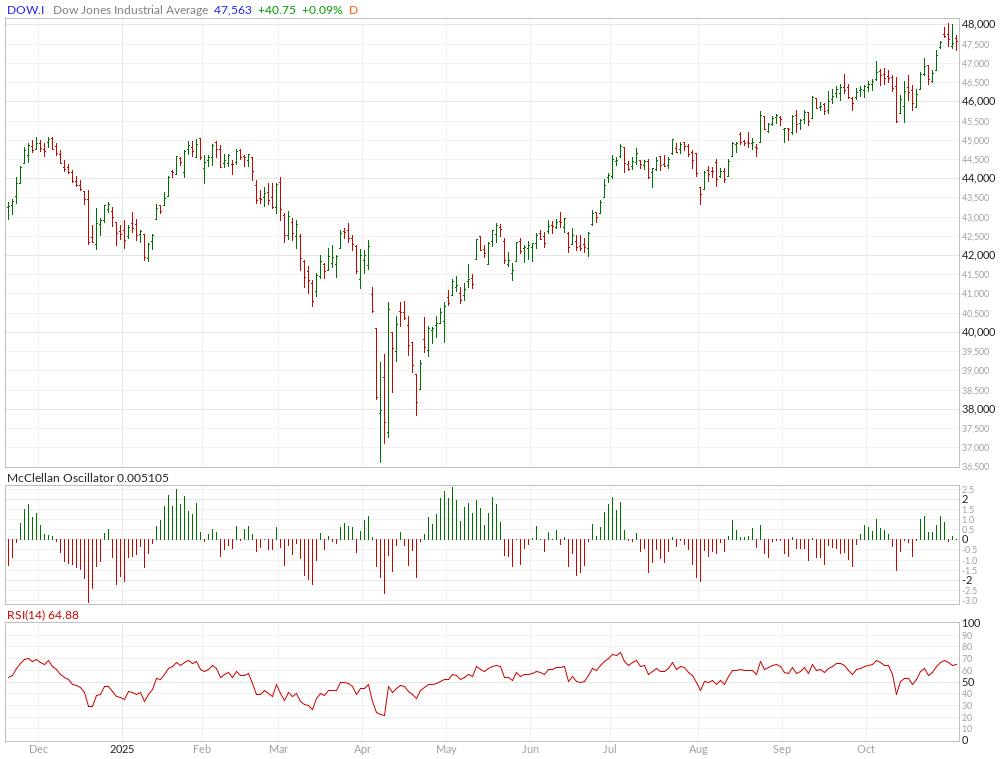
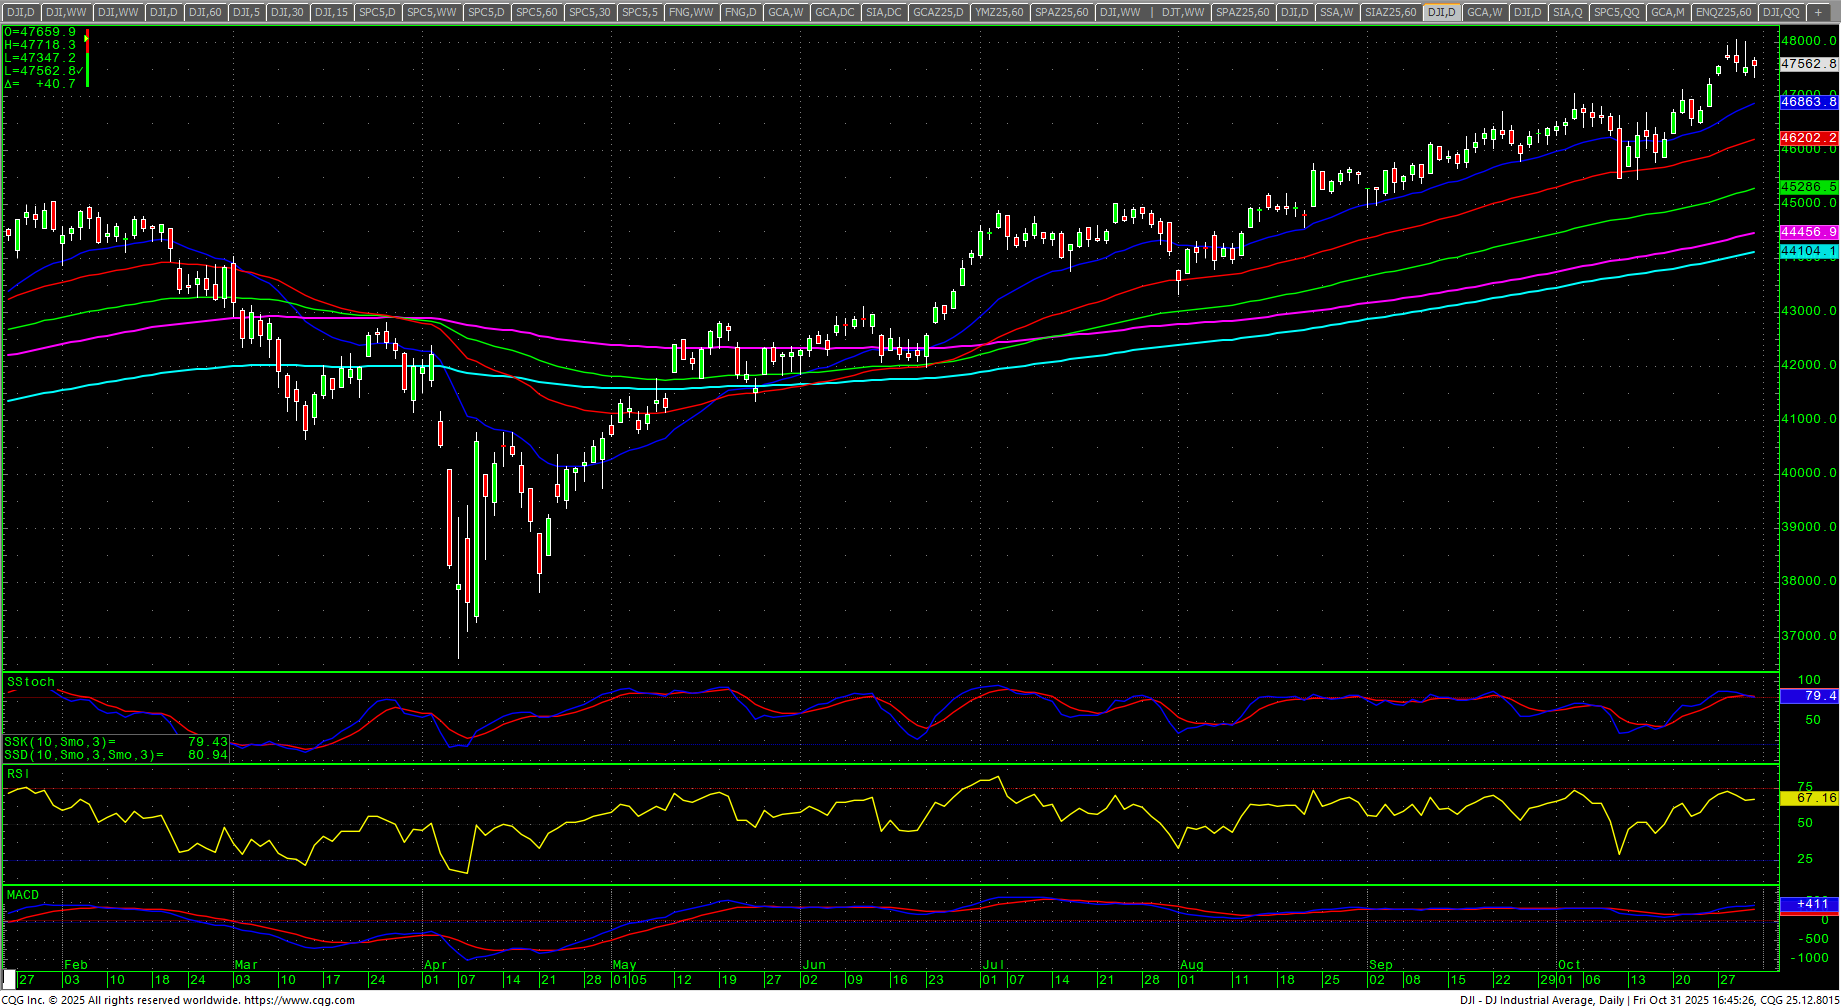
 The Dow closed the week up +0.75% on bottom of a gap week’s range at record highs. Prices gapped up on Monday and took the Dow above the $48K level, prior to dropping back toward the weekly lows. As is the case with fast moves, the oscillators continue to flash divergences. The daily stochastics are up and overbought. The MACD is up and in preliminary bearish divergence. The daily RSI is 67.20. The 200-day MA starts the week at 44104.10 and is at record highs. The weekly is neutral with a bearish divergence.
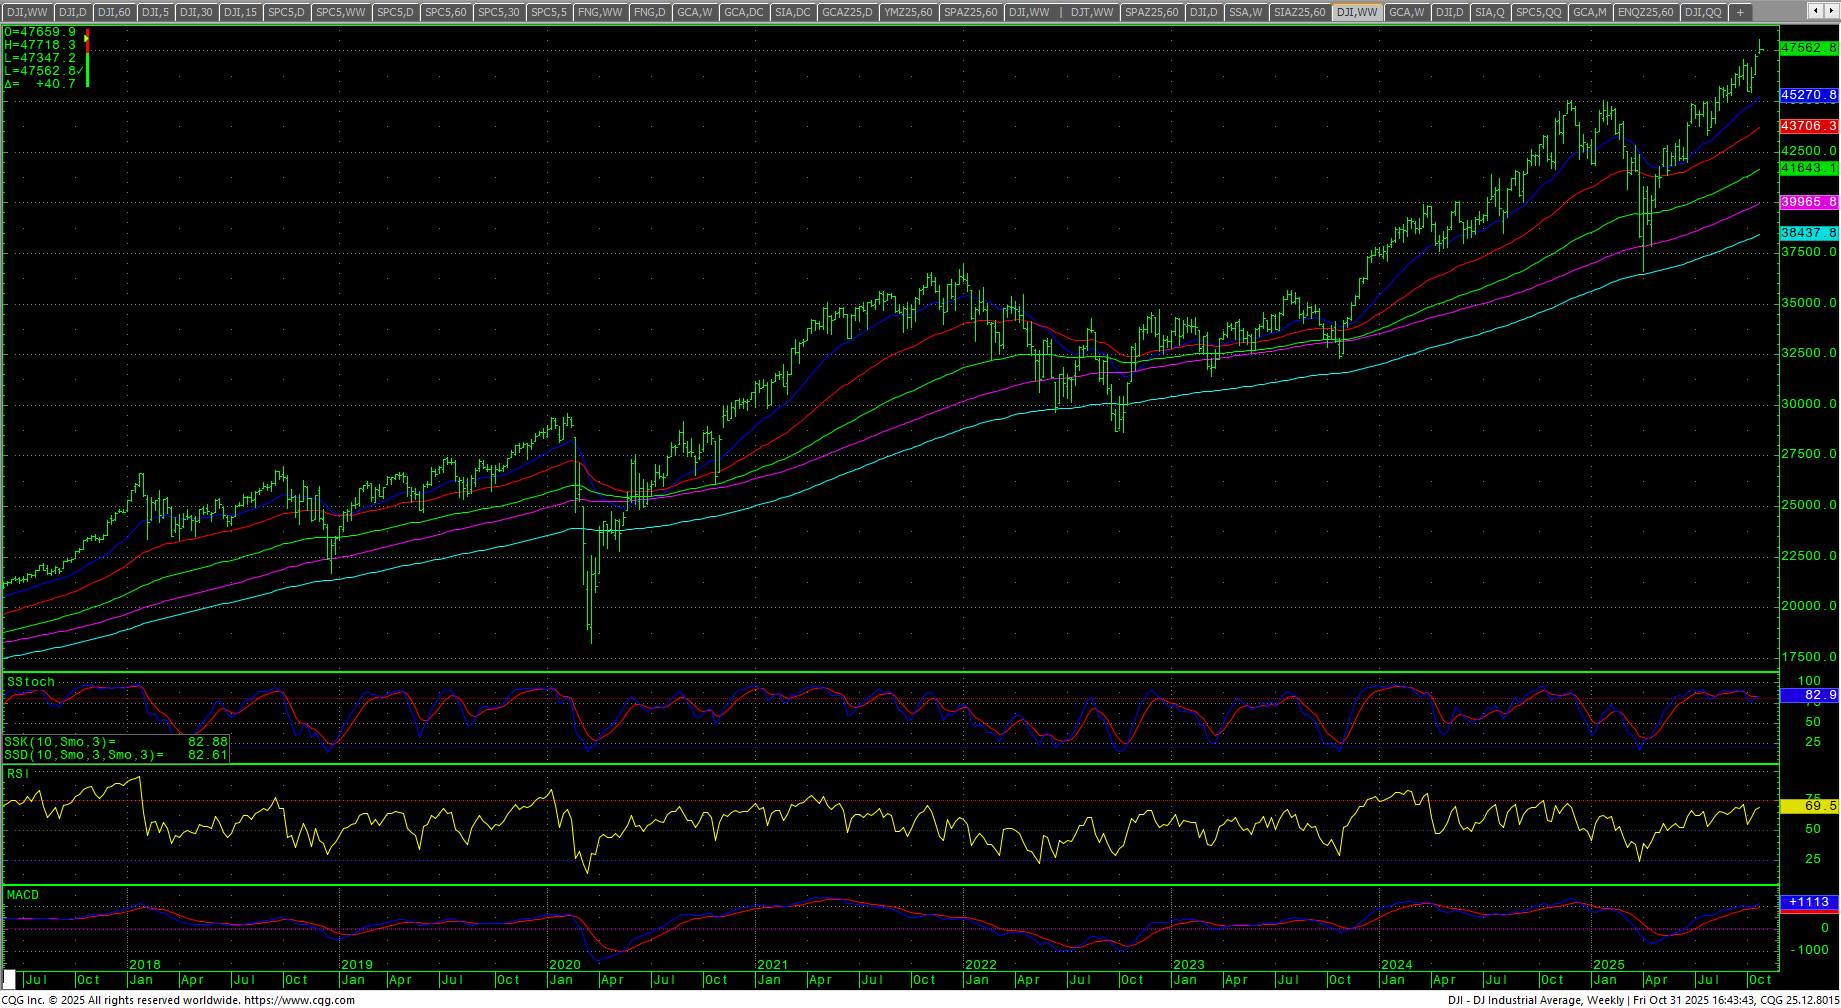
Dow Jones Industrial Average Weekly Candles
 Prices took out a long-term monthly target against critical resistance of 47400/47430. The market achieved an intraday high of 48040.6. Resistance is 47694 and 47775/47780. Rallies back over 47780 should minimally test 47876 with counts back to 48040/48078. Daily closes over 48078 have potential to 48222. A breakout over 48222 sets up 48366 with counts to 48510. Closes over 48510 will open counts toward 48654 with potential to 48798. Above 48798 opens counts to 48942 and 49086.
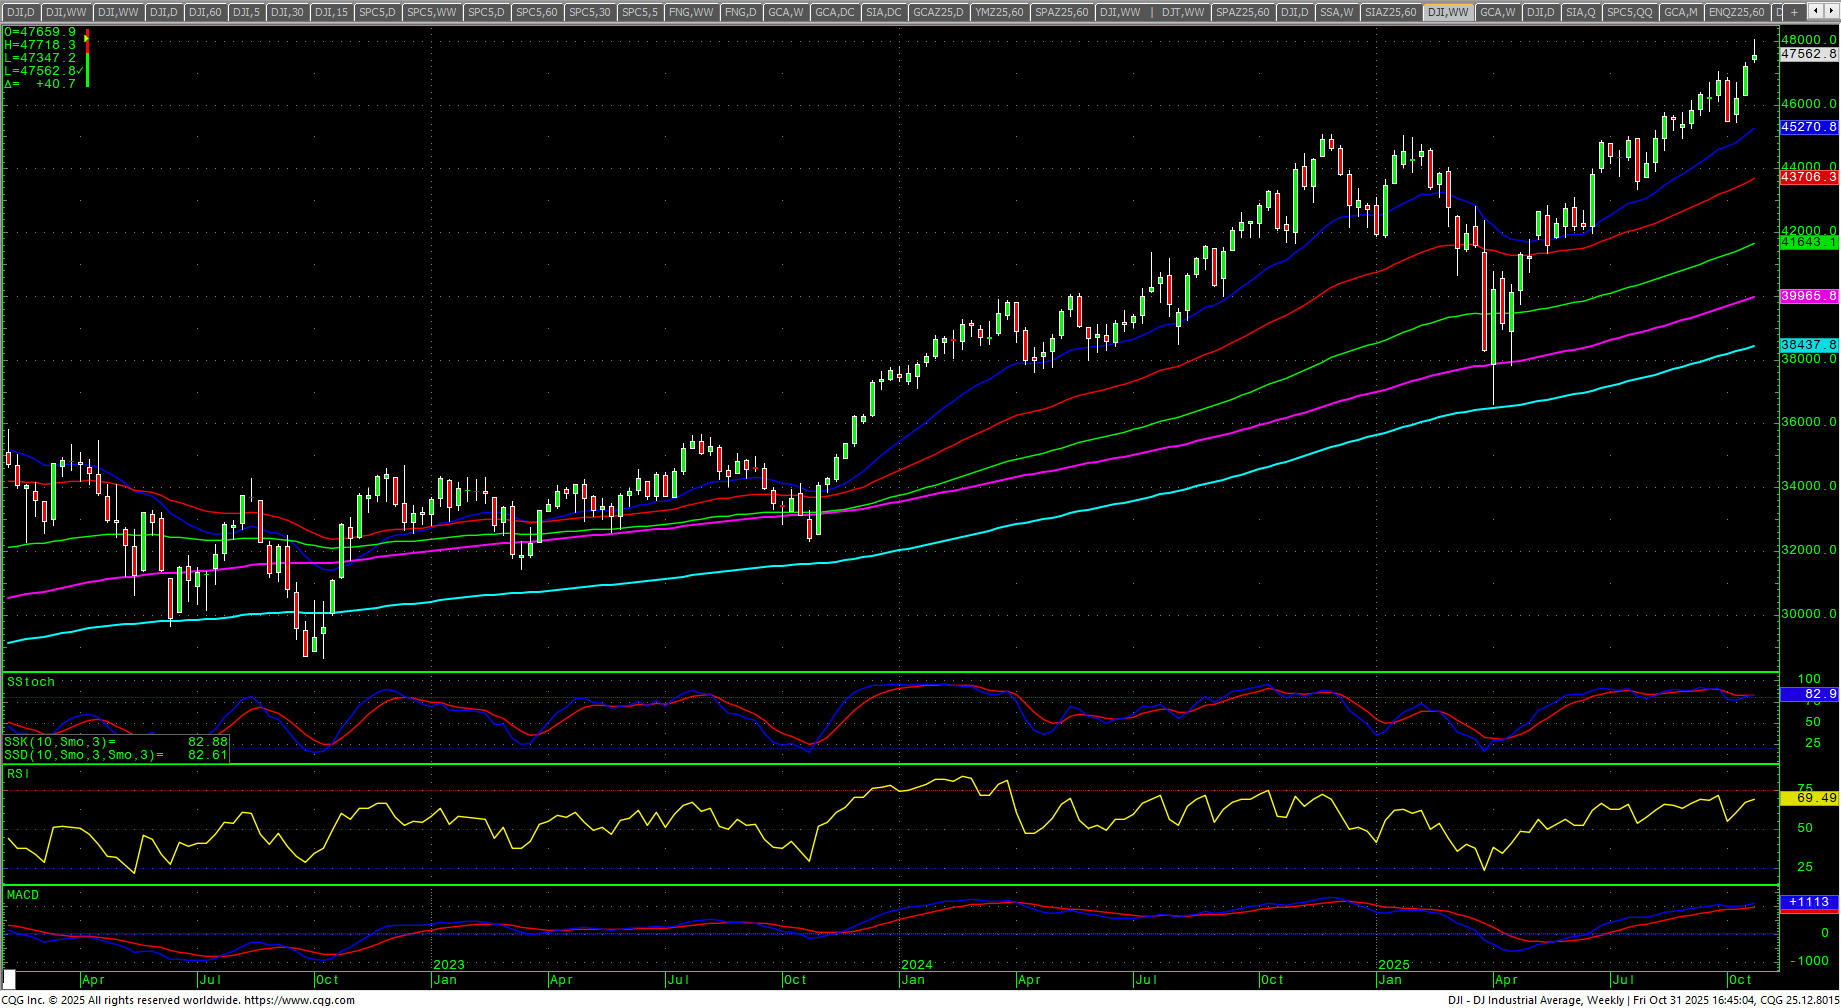
Dow Jones Industrial Average Hourly Candles
 The hourly is neutral on Friday’s close. Support is 47347, 47251/47247 and 47064/47051. A breakdown under 47051 sets up 46746 with counts to 46440/46435. Closes under 46435 should test 46385 should minimally test 46099/46062 with full potential to 45452/45450. A breakdown with closes under 45452 can test 45343 with counts to critical short-term support at 44948. Daily closes below 44948 are bearish and suggest a move as low as 43674..
Dow Jones Industrial Average Daily Candles
| Resistance | Support |
|
|
S&P 500 Cash Index: SPX
S&P 500 Index Weekly H-L-C
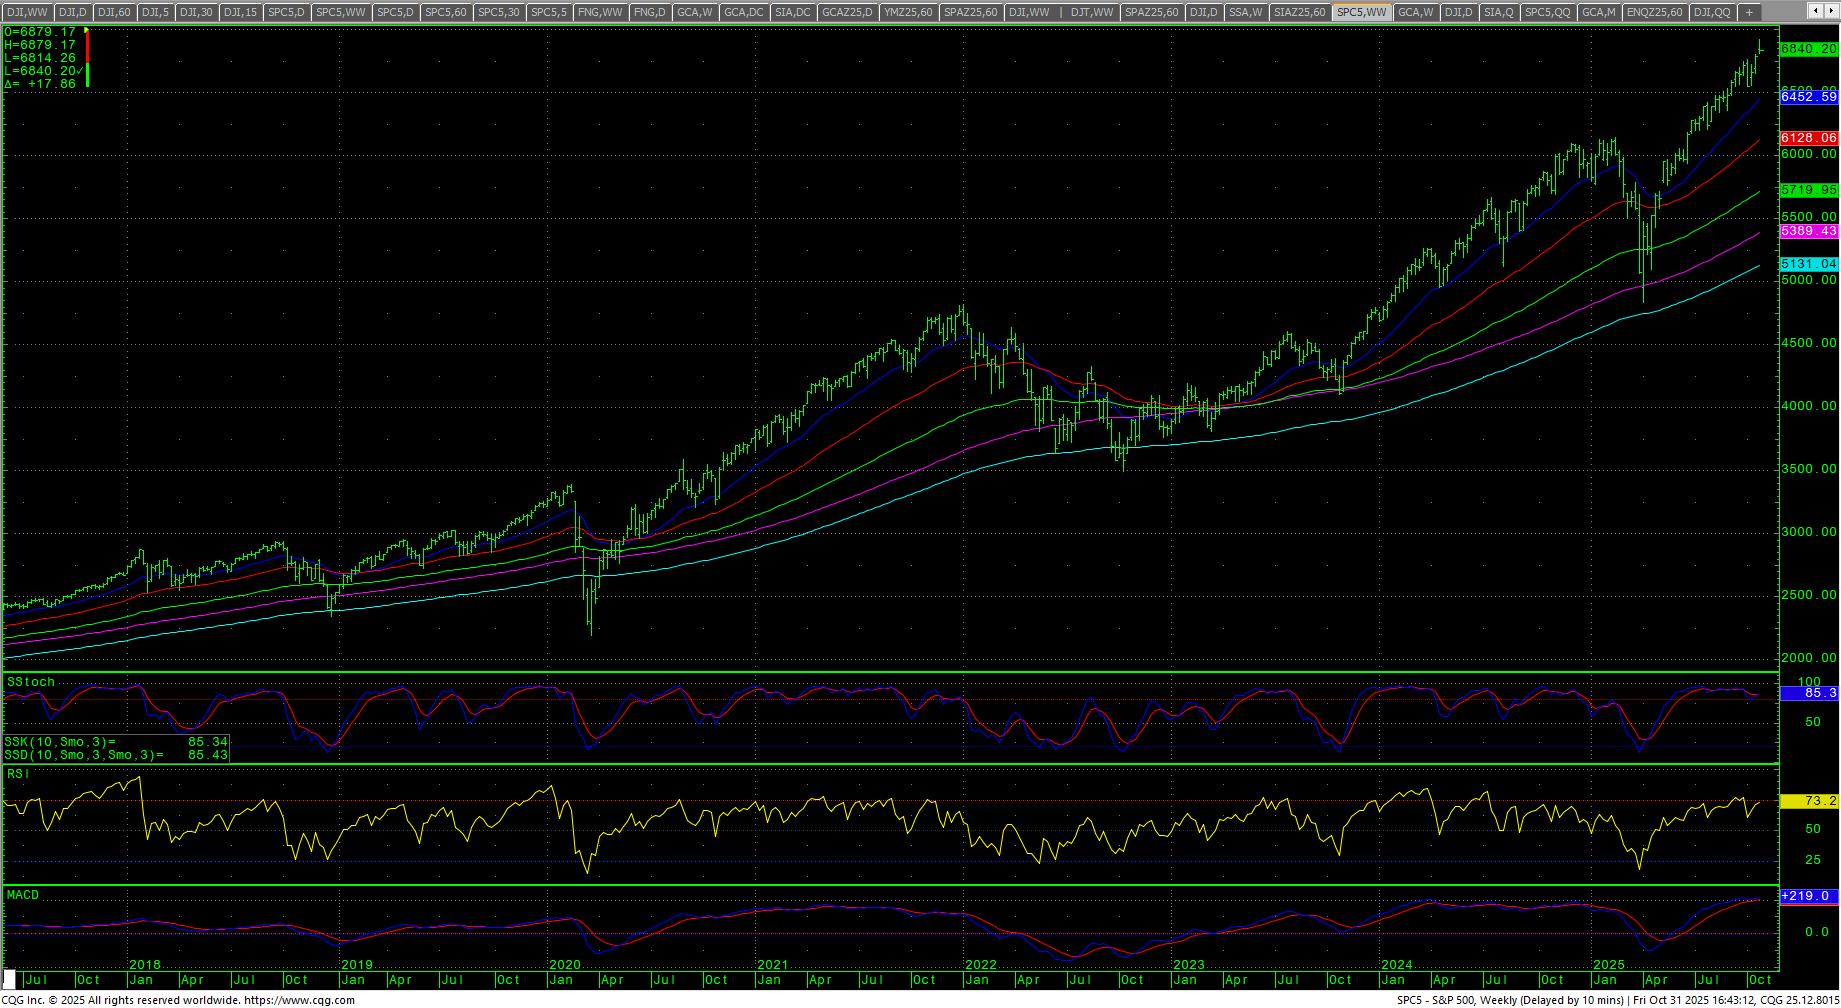 The S&P gapped higher on Monday and drifted back toward the gap mid-week and closed out the week at a record high weekly close but on the bottom end of the range. The SPX cleared yet another century mark at 6900, setting an intraday high at 6920. The weekly is neutral with preliminary bearish divergence. The SPX ended up +0.71% on the week. The daily hooked higher in the stochastics and MACD crossed up and they both remain in bearish divergence. The daily RSI closed at 61.56. The hourly is neutral with Friday’s close. The 200-day MA is 6211.91 and at record highs.
SPY Weekly Candles
 Resistance is 6867 and 6879/6880. A drive back over 6880 should test 6895 with counts back to 6908/6920. Closes over 6920 open counts to 6944 and 6980 through 7016. A close over 7016 offers counts to 7088, 7160 and 7214. Closes over 7214 setup a drive to 7250 and 7286 while opening counts as high as 7448. Above 7488 counts to 7520 and 7592. A drive above 7592 can test 7664 with counts to 7736 and as high as 7808.
S&P 500 Index Hourly Candles
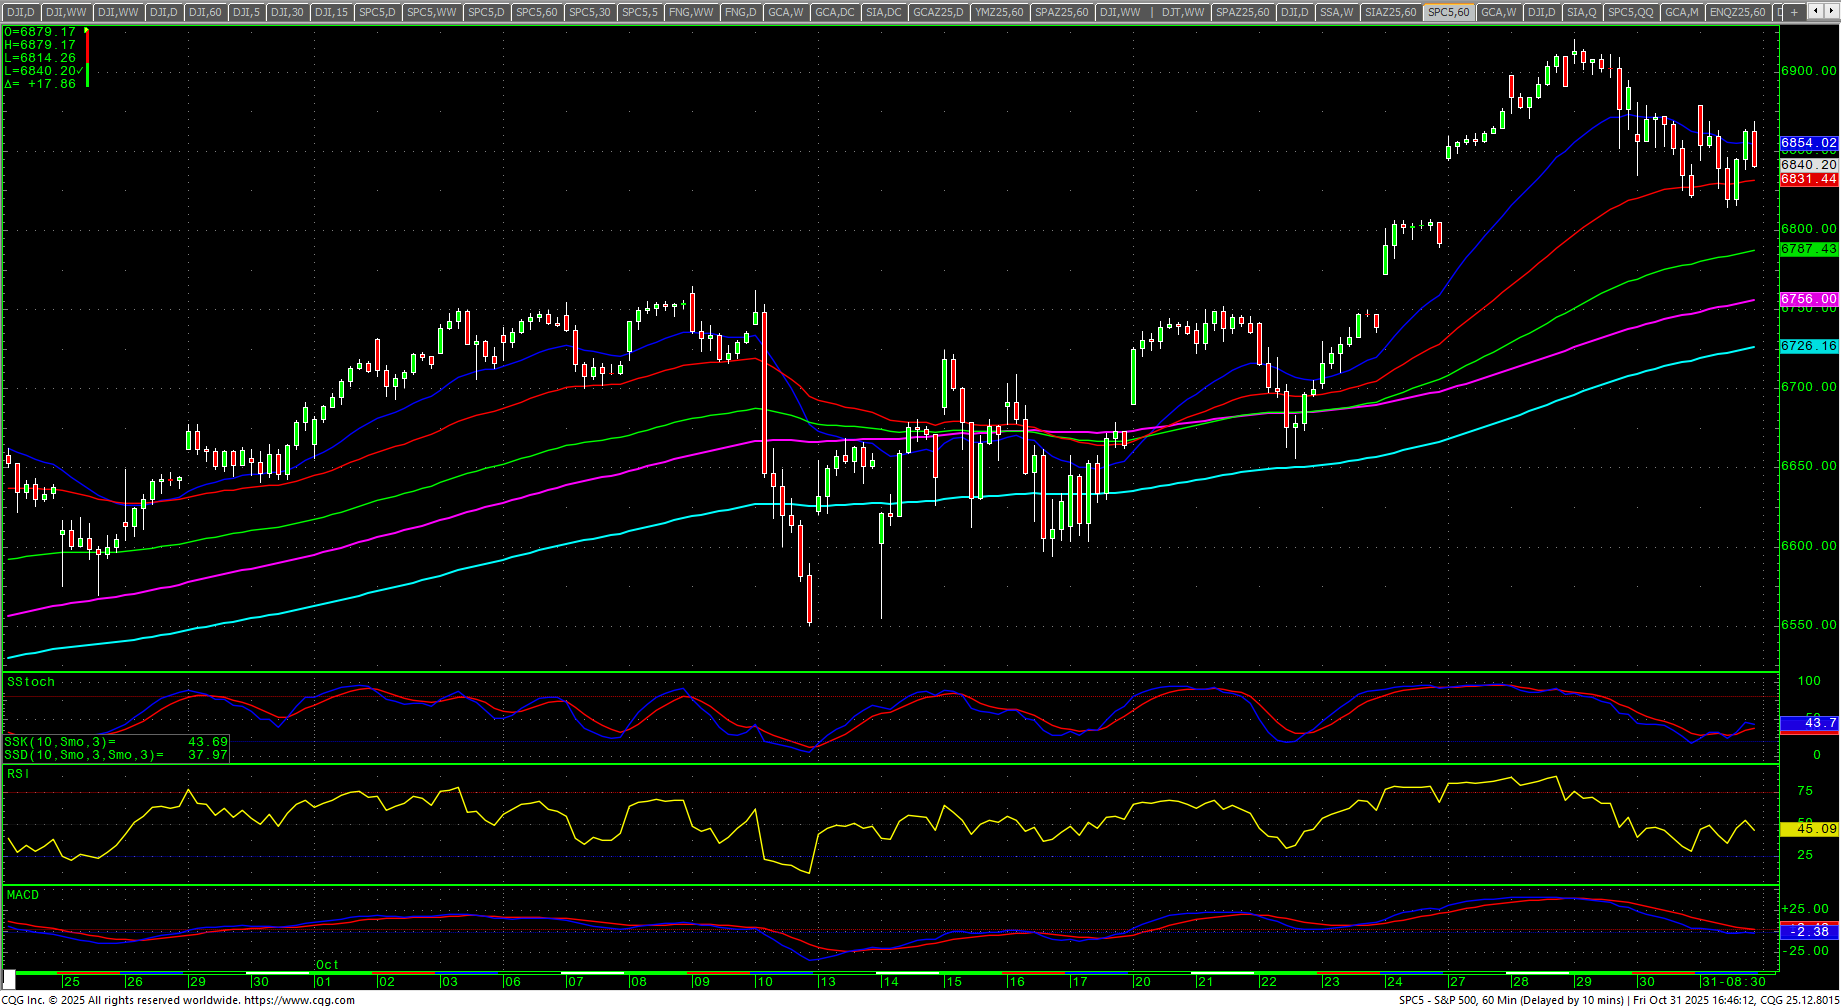 Support is 6779 and 6691/6689. A breakdown under 6689 should test 6643/6637 and retest the swings at 6555/6550. Closes below 6550 suggest a test of 6360 through 6643. pivotal near-term support at 6514/6510. Closes under 6510 open counts to key support at 6361/6360. A breakdown under 6360 should test 6123 with full counts into the 6044 level with critical hourly support at 6212/6201. Daily closes under 6044 should minimally test 5877 and 5799/5798 with counts to 5631/5628.
| Resistance | Support |
|
|
Charts courtesy of CQG, Inc., CNN, Koyfin, Trading View and AAII