
TECHNICAL ANALYSIS (by Intraday Dynamics)
Cycle Timing Update: November 7, 2025
Timing Points in 2025
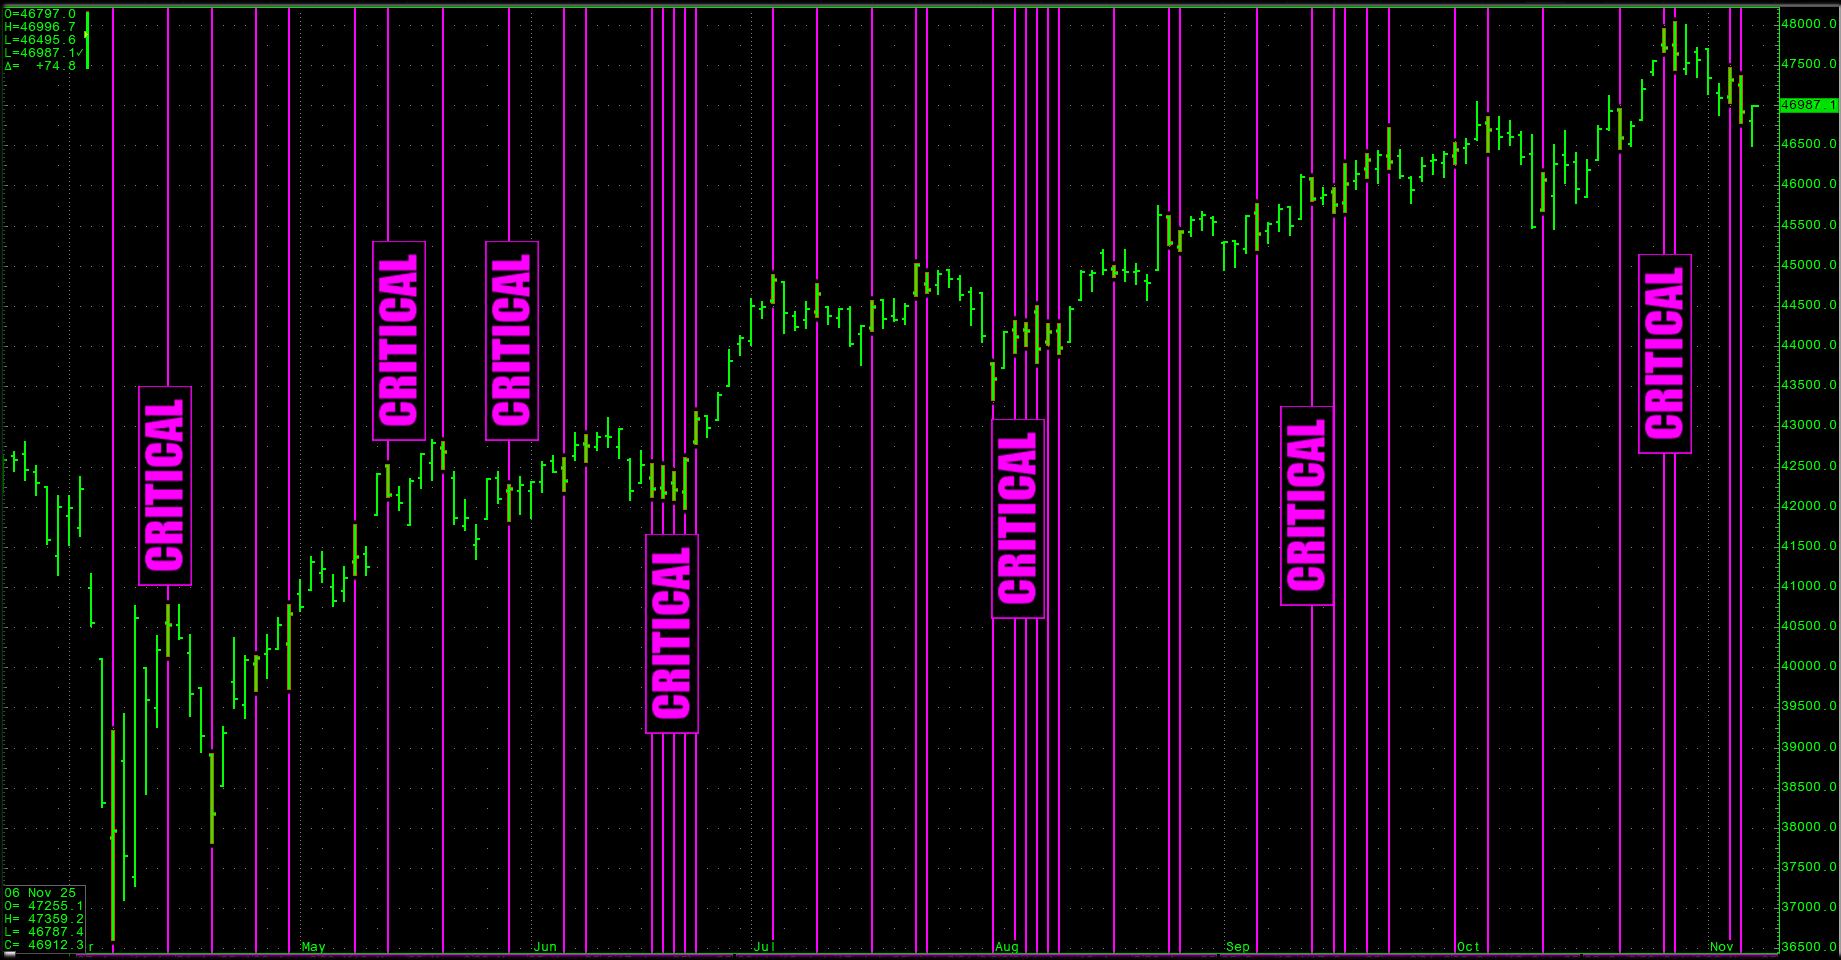 We are basically smack dab in the middle of this massive 6–7-month timing window that started in late August and runs into Mid-February to early-March 2026.
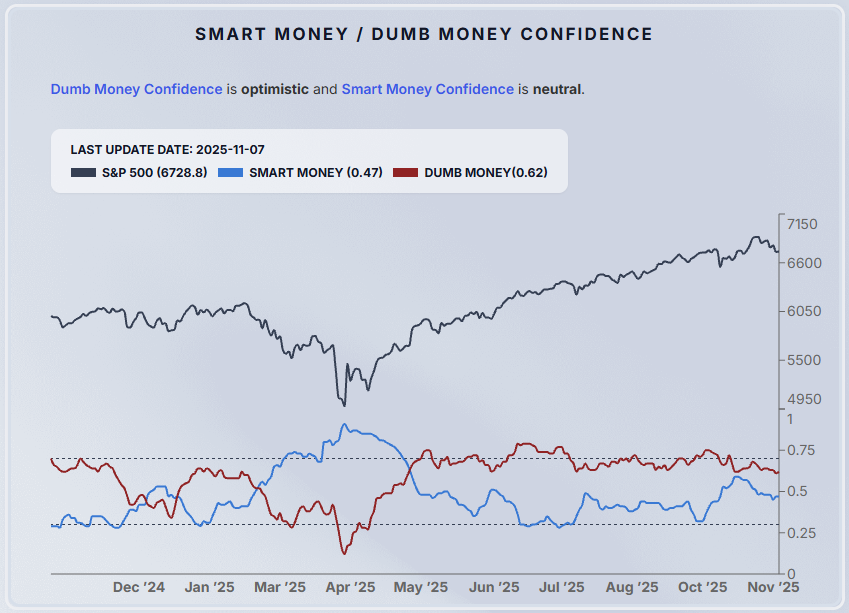
In the past two weeks, markets have issued a couple of dynamic shifts while sentiment remains decidedly in fear. Conflicted is the best way to describe indicators. Some are pointing to extreme fear, while others are suggesting extreme froth (particularly for the “dumb money”).
“The market has now issued multiple Hindenburg Omens, and now a Nasdaq Titanic Syndrome which can be a preliminary red-flag that prices are within a couple months of a major turning point.”
It is important to note that both of these cutely named indicators have been a punching bag for bulls throughout the years. That said: “During the 16 occurrences going back to 1987, the Nasdaq Composite has fallen by an average of 21.7% one year later, and has only been higher afterward 40% of the time.”—MorningStar
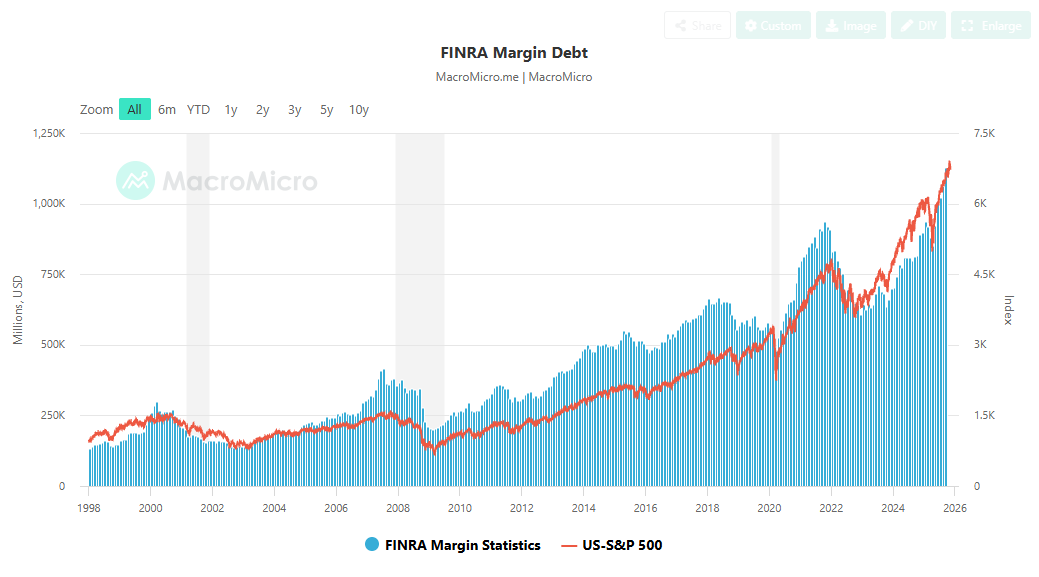 In Friday’s letter, I went over the Schizophrenic sentiment indicators. They basically represent a market where fund managers have seriously under performed in 2025 while small retail traders have been dictating market moves…albeit on massive margins.
Add to this, fund managers got to their most bullish posture since February in the middle to late October…basically right at the recent highs.
Secured Overnight Financing Rate
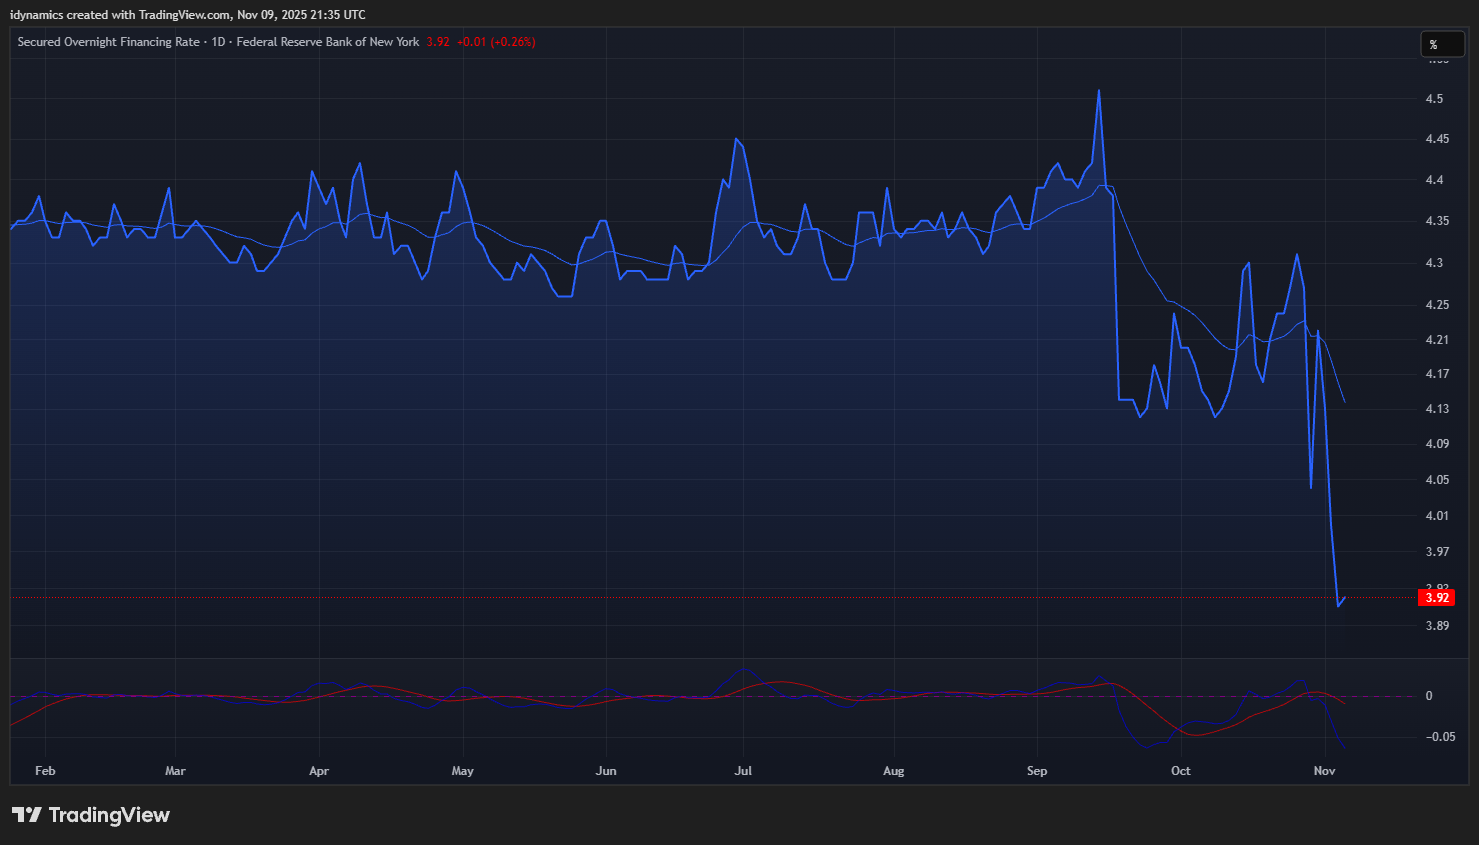 This weekend, Syz Group’s Charles-Henry Monchau, posted about the huge move in the SOFR recently.
Some of the takeaways:
It just plunged 30 basis points — from 4.22% to 3.92% in six days.
That’s roughly $50 billion in annual borrowing cost savings…
…but is this collapse masking something more worrying for markets and the economy?
🧩 WHAT THE FED ISN’T SAYING
The Fed has already cut 150 basis points this year.
Reserves are flooding the repo market.
Overnight borrowing costs have dropped to levels not seen since September 2023 — the last time recession fears hit the radar.
Translation:
👉 The Fed sees something breaking and is trying to patch it before it’s visible.
⚙️ STILL, THE DROP OF THE SOFR SHOULD BE BULLISH IN THE SHORT TO MEDIUM TERM:
Bank funding costs fall 10–30 bps
Corporate loan rates fall ~15 bps
Adjustable mortgages reset ~20 bps lower
→ average monthly payments drop $200
Credit expands.
Lending accelerates.
Asset prices inflate.
But here’s the dark side: Every time SOFR has gone below 4% since 2008, an asset bubble followed.
Cheap money doesn’t fix weak growth — it hides it.
To this degree, here’s a reprint from Friday’s letter regarding Bubbles, with a reminder that last week Ray Dalio posted: “Stimulating Into a Bubble” And a second reminder that Michael Burry had come out of hibernation with his first Tweet in 2.5 years. Last week, it was announced that his Scion Asset Management had taken huge short positions. “Scion bought roughly $187.6 million in puts on Nvidia and $912 million in puts on Palantir, according to Securities and Exchange Commission filings.” PLTR -11.24%, NVDA -7.08%.
*******************************************
Is This a Bubble?
 “AGI is basically a human-level intelligent computer, a milestone that many theorize will either launch humanity to unimaginable heights or send us all to extinction.”
The current AI Bubble has been driven by insane valuations of only a handful of companies. The top ten stocks in the S&P 500 account for 80% of ALL growth in 2025 and 42%+ of the entire net worth of the S&P. If AI companies are removed from the economy, U.S. GDP has only grown by +0.1% all year.
Hyperscaling, Growth Hacking and Blitz Scaling are the buzz words used for today’s top stocks.
Wages are not Hyperscaling, job growth is not Hyperscaling. The only thing Hyperscaling in a “K Shaped Economy” is the wealth of the top 1-2%.
In a twist of irony, Open A.I. is asking the taxpayers to provide ‘loan guarantees’ for up to $1 trillion dollars in investments. A company with zero profits, that promises to go public at a valuation of $500 billion, wants the government to guarantee $1 trillion in speculative investment in a technology that is totally unregulated and for which no one knows exactly what the outcome might be.
So far, AI has given us “AI Slop,” videos that are basically undetectable from something genuine and robots that foment trash talk in comment sections of social media feeds because…Rage Sells.
*******************************************
How does this fit into the timing window? There is still a strong possibility that with the Fed easing, it could send fund managers scrambling to beef up their 2025 numbers and chasing a vertical blowoff. The biggest problem with this scenario is the public. Plebeians are struggling and buying stocks on margin. And: Cheap money doesn’t fix weak growth — it hides it.
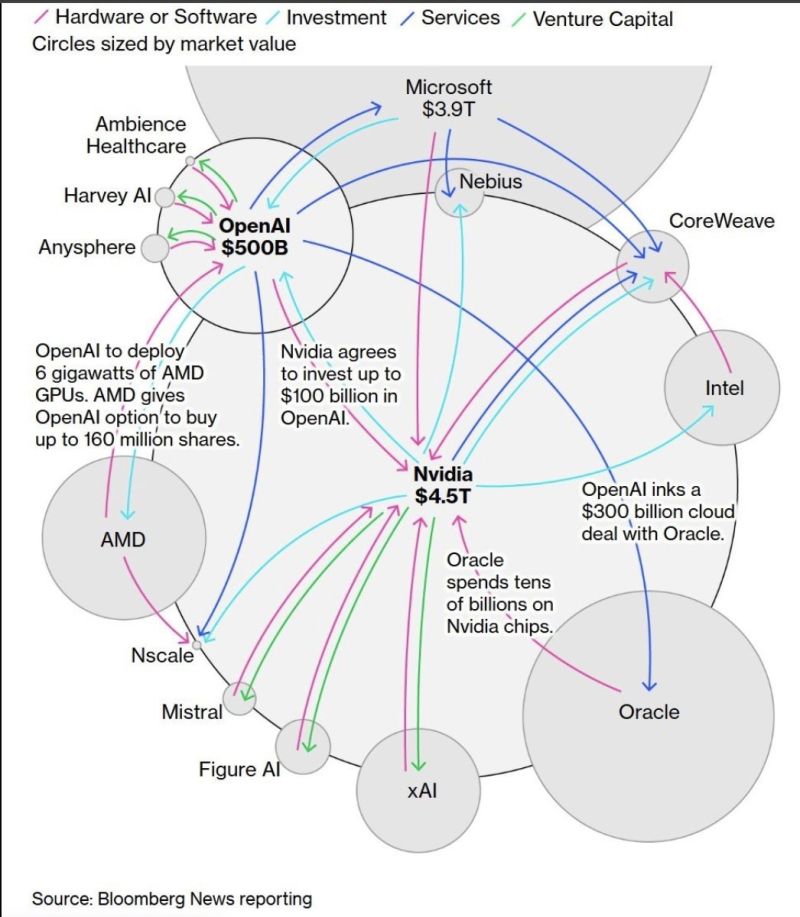
The economic indicators are deteriorating. Without the CAPEX in AI ventures (which are not profitable…and are funded by a ridiculous circular financing scheme ⬆️), the U.S. economy is staggering.
If it starts stumbling harder, no amount of Fed intervention will really matter, It may keep financial assets artificially high for a bit…but cannot fix weak growth.
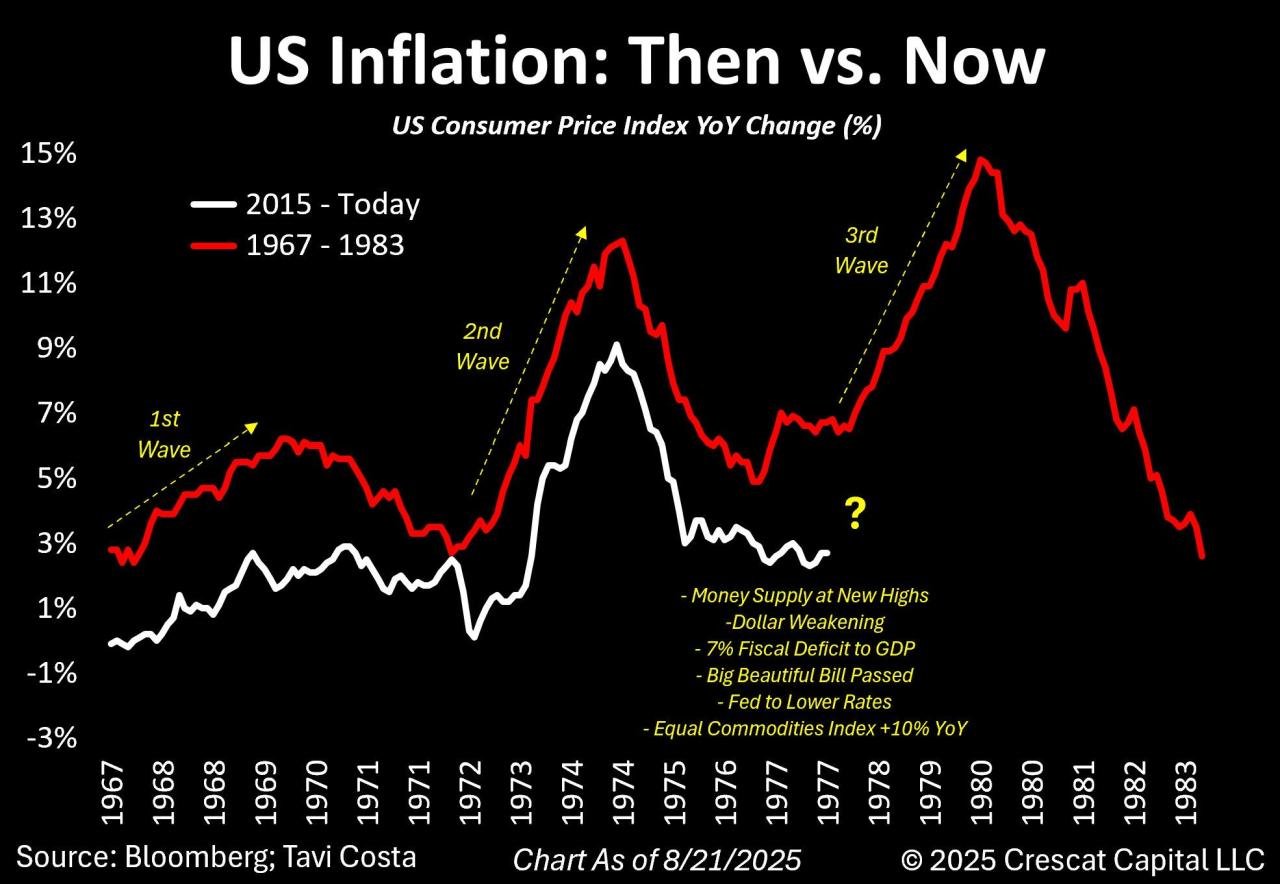 It is also possible that SCOTUS will rule the tariffs illegal and that the government will need to pull back on all the tariffs. That should be considered a bullish signal as it lowers the threat of hyperinflation in the next 12 months.
Timing Points
The next key window is 11/19-20 and we have a CRITICAL window hitting in the middle of December. The entire month of January 2026 lights up huge with the timing and the first trading week of the year could be filled with fast moves and increased volume/volatility. There is another big window of the 19th through the 21st. Then the final trading days of January have strong timing. Again, this long window runs into the middle of February and then the first week of March could see fireworks.
- 11/14 **
- 11/19-20 ***
- 11/25 **
- 12/04 ***
- 12/15 *** X may run through
- 12/17 *** X key to bonds/interest rates
- 12/24 **
- 01/09 *** X critical/fast moves
- 01/19-21 *** X
- 01/29-30 ***
Here are the technical data reprinted from Friday’s market report:
Dow Jones Industrial Average
Dow Jones Industrial Average Weekly H-L-C
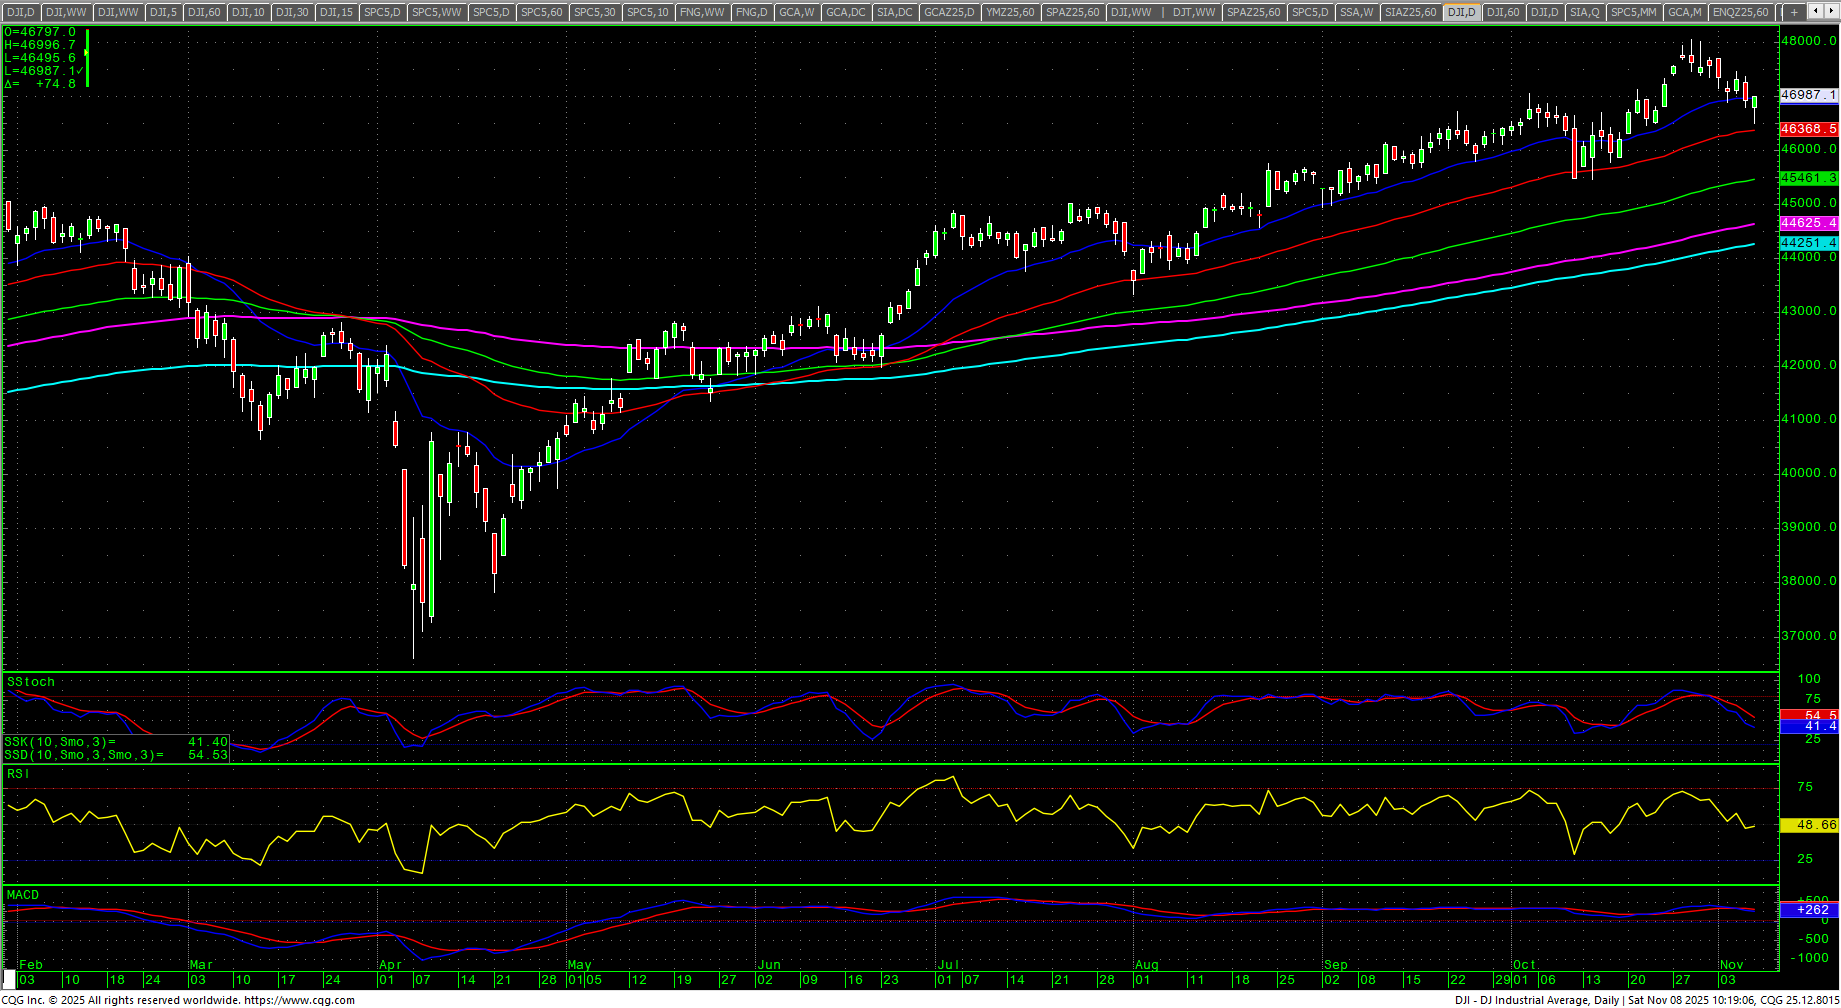
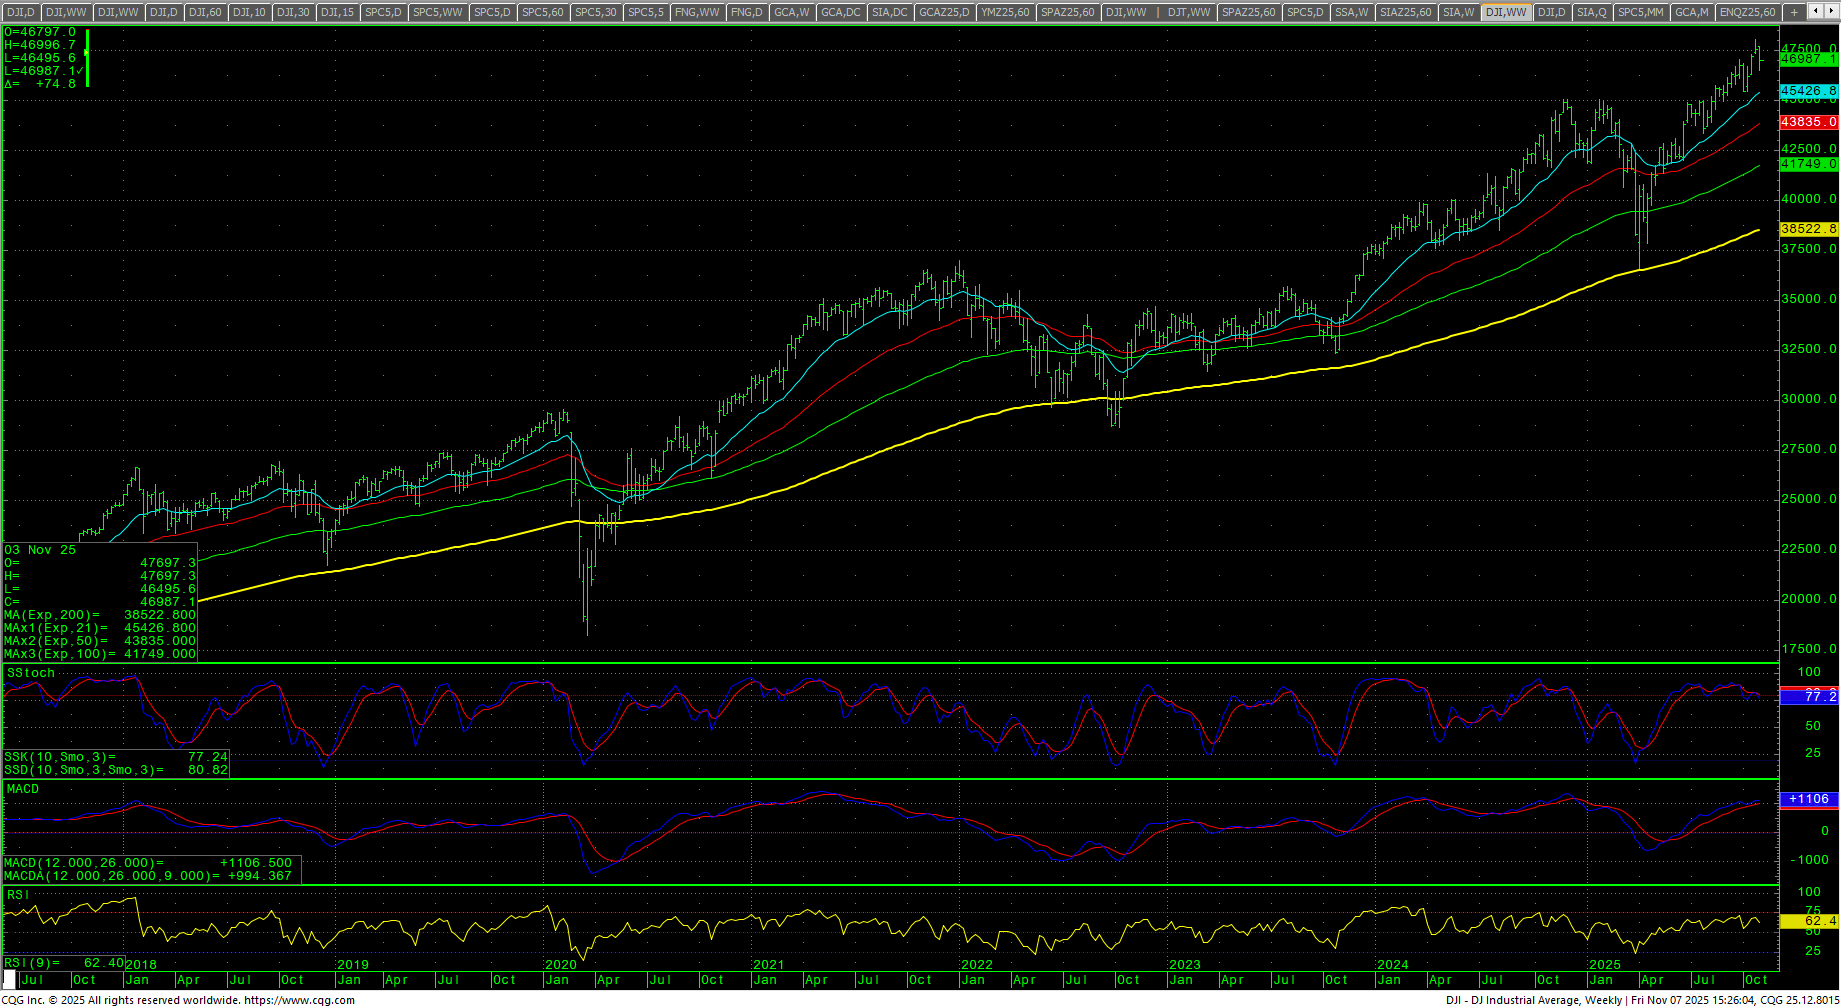 The Dow closed the week down -1.21% near the lower end of the week’s range after being down as much as -2.24% as the index came close to a pivotal area of support at 46440/46435. The daily stochastics are down. The MACD is down and reacting to a preliminary bearish divergence. The daily RSI is 48.70. The 200-day MA starts the week at 44251.40 and is at record highs. The weekly is down as it reacts to a bearish divergence. Last week saw headlines discussing 50K Dow, so it is not unusual to see a reaction here. (See above comments regarding November corrections).
Dow Jones Industrial Average Weekly Candles
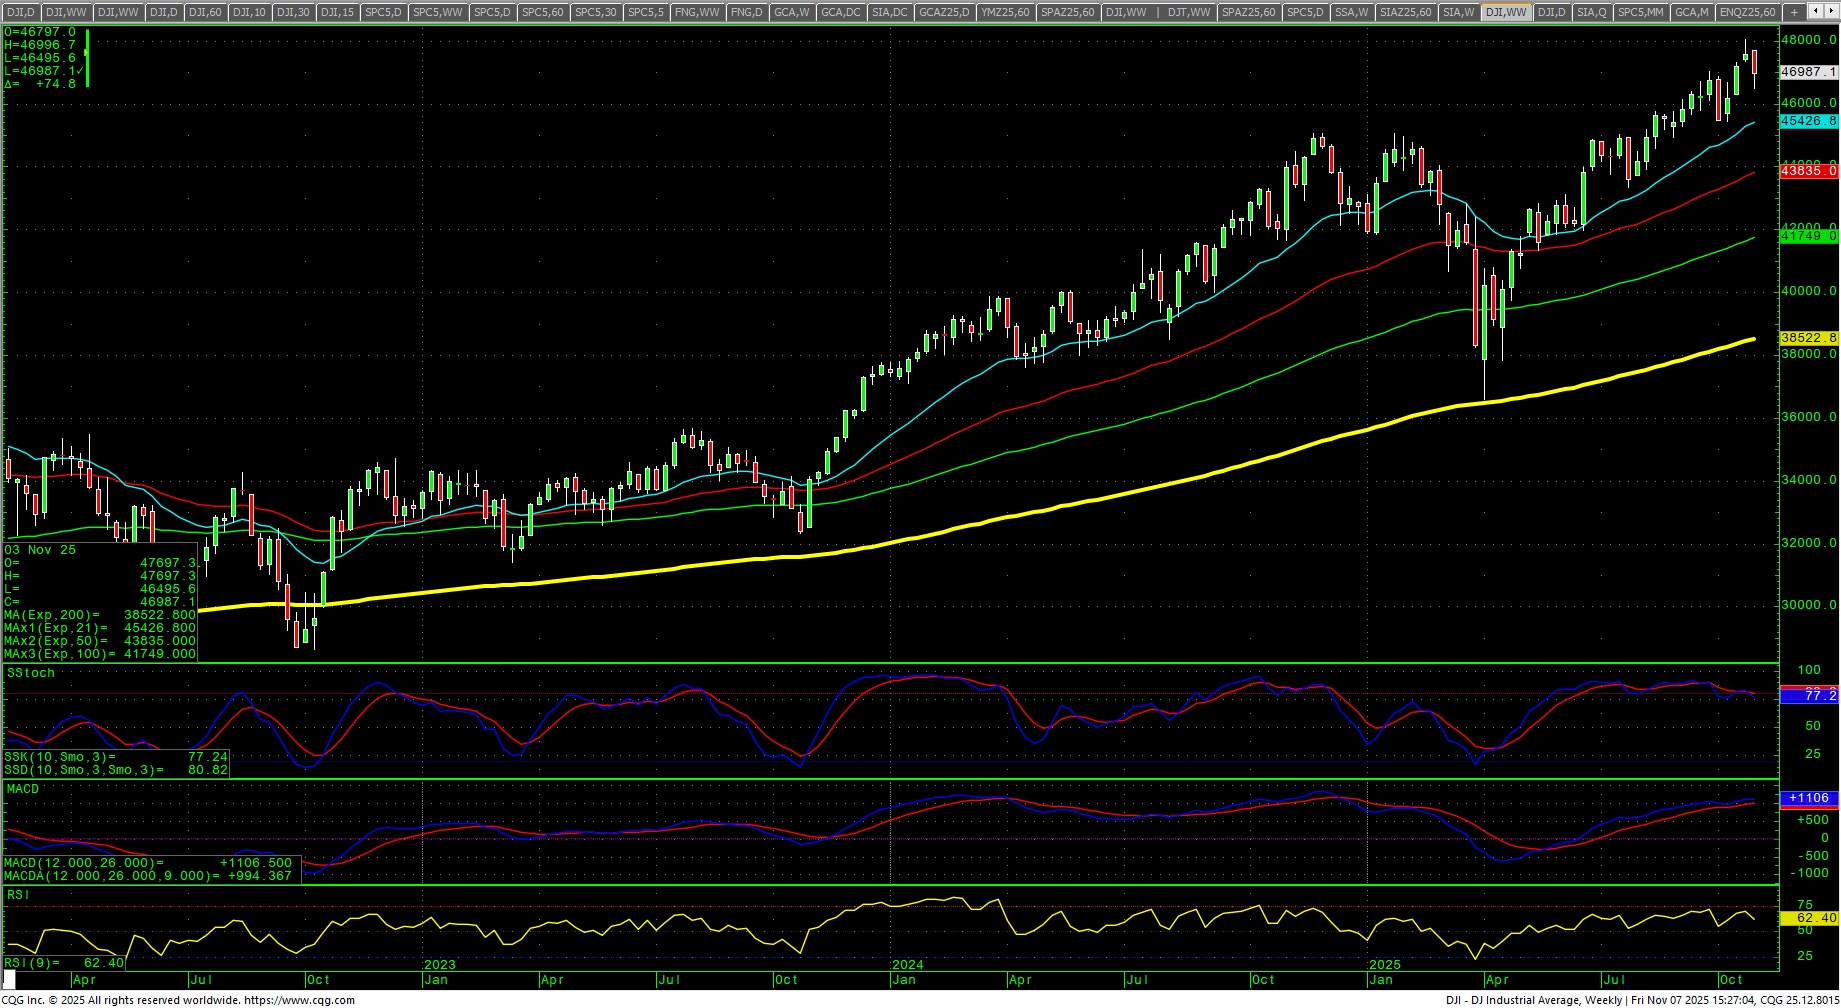 Prices dropped near a pivotal area of support at 46440/46435. Support is now 46805, 46746 and 46687/46685. A breakdown under 46685 sets up 46620/46613 with counts to 46495 and 46440/46435. Closes under 46435 should test 46385 should minimally test 46099/46062 with full potential to 45452/45450. A breakdown with closes under 45452 can test 45343 with counts to critical short-term support at 44948. Daily closes below 44948 are bearish and suggest a move as low as 43674.
Dow Jones Industrial Average Hourly H-L-C
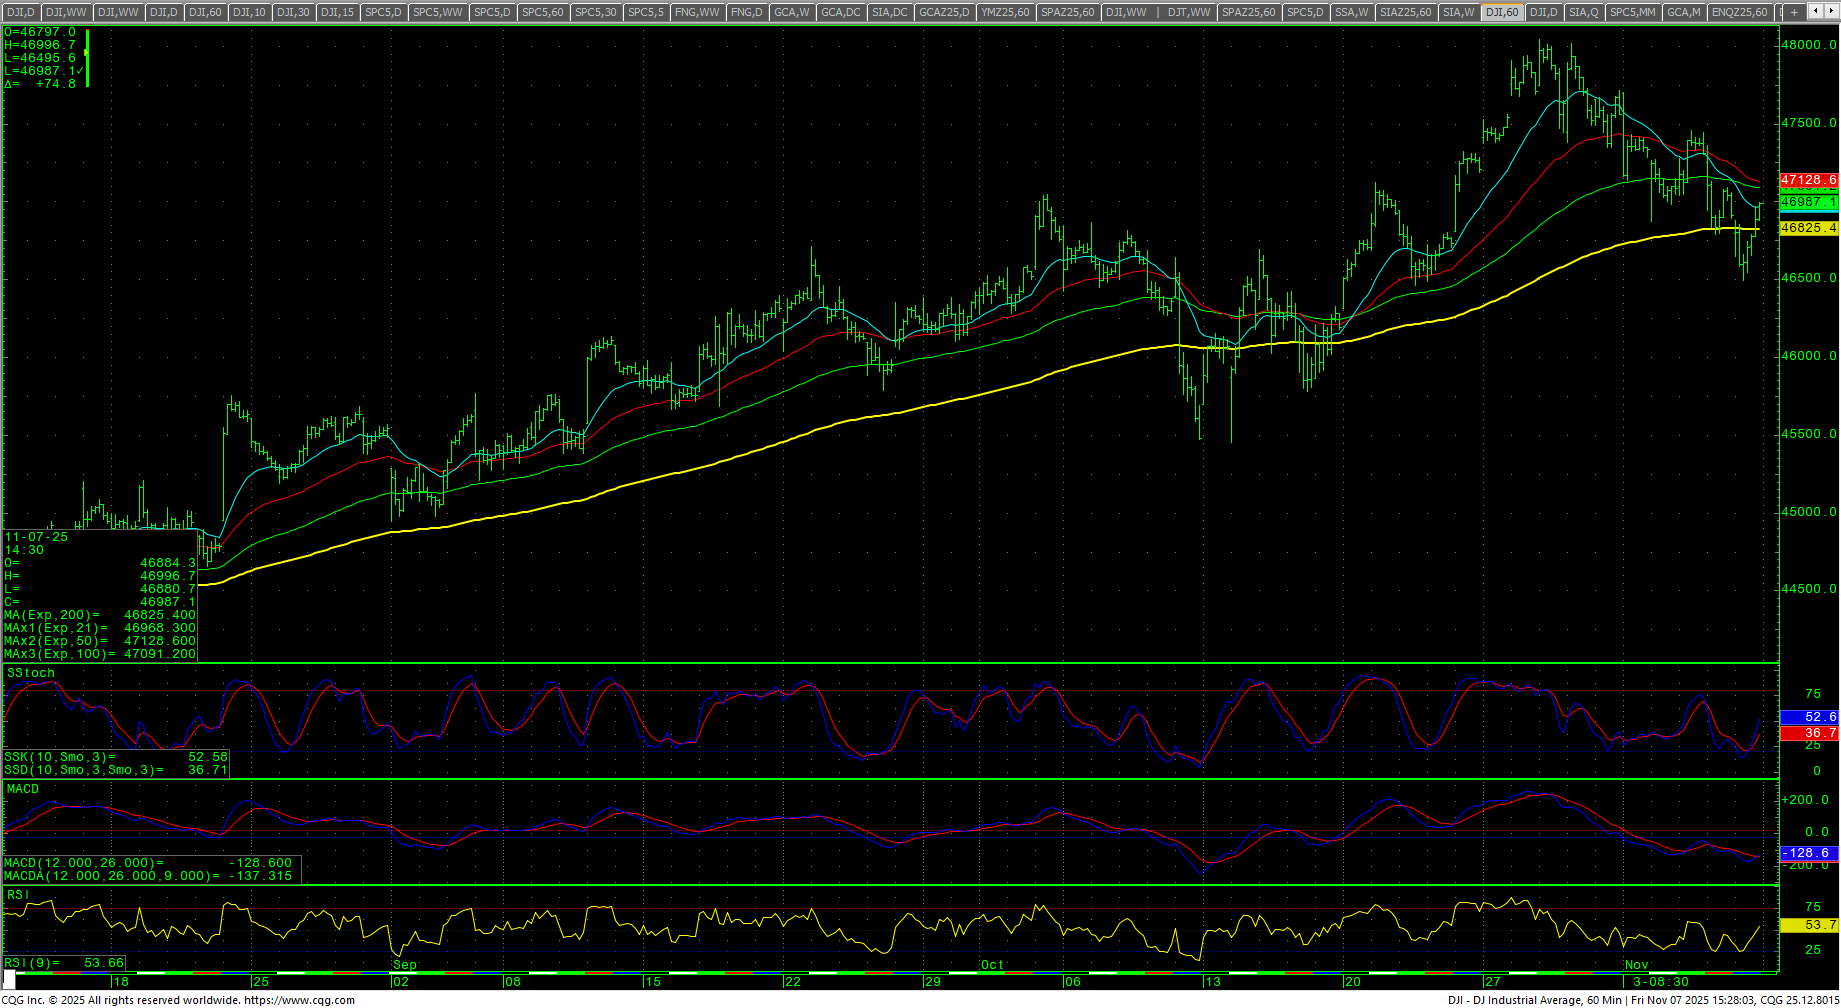 The hourly is neutral and coming off oversold conditions. Resistance is 47085/47094, 47268 and 47450/47460. A breakout above 47460 sets up 47654/47675 and will open potential for a retest of the record highs at 48040/48078. Daily closes over 48078 have potential to 48222. A breakout over 48222 sets up 48366 with counts to 48510. Closes over 48510 will open counts toward 48654 with potential to 48798. Above 48798 opens counts to 48942 and 49086.
Dow Jones Industrial Average Daily Candles
| Resistance | Support |
|
|
S&P 500 Cash Index: SPX
S&P 500 Index Weekly H-L-C
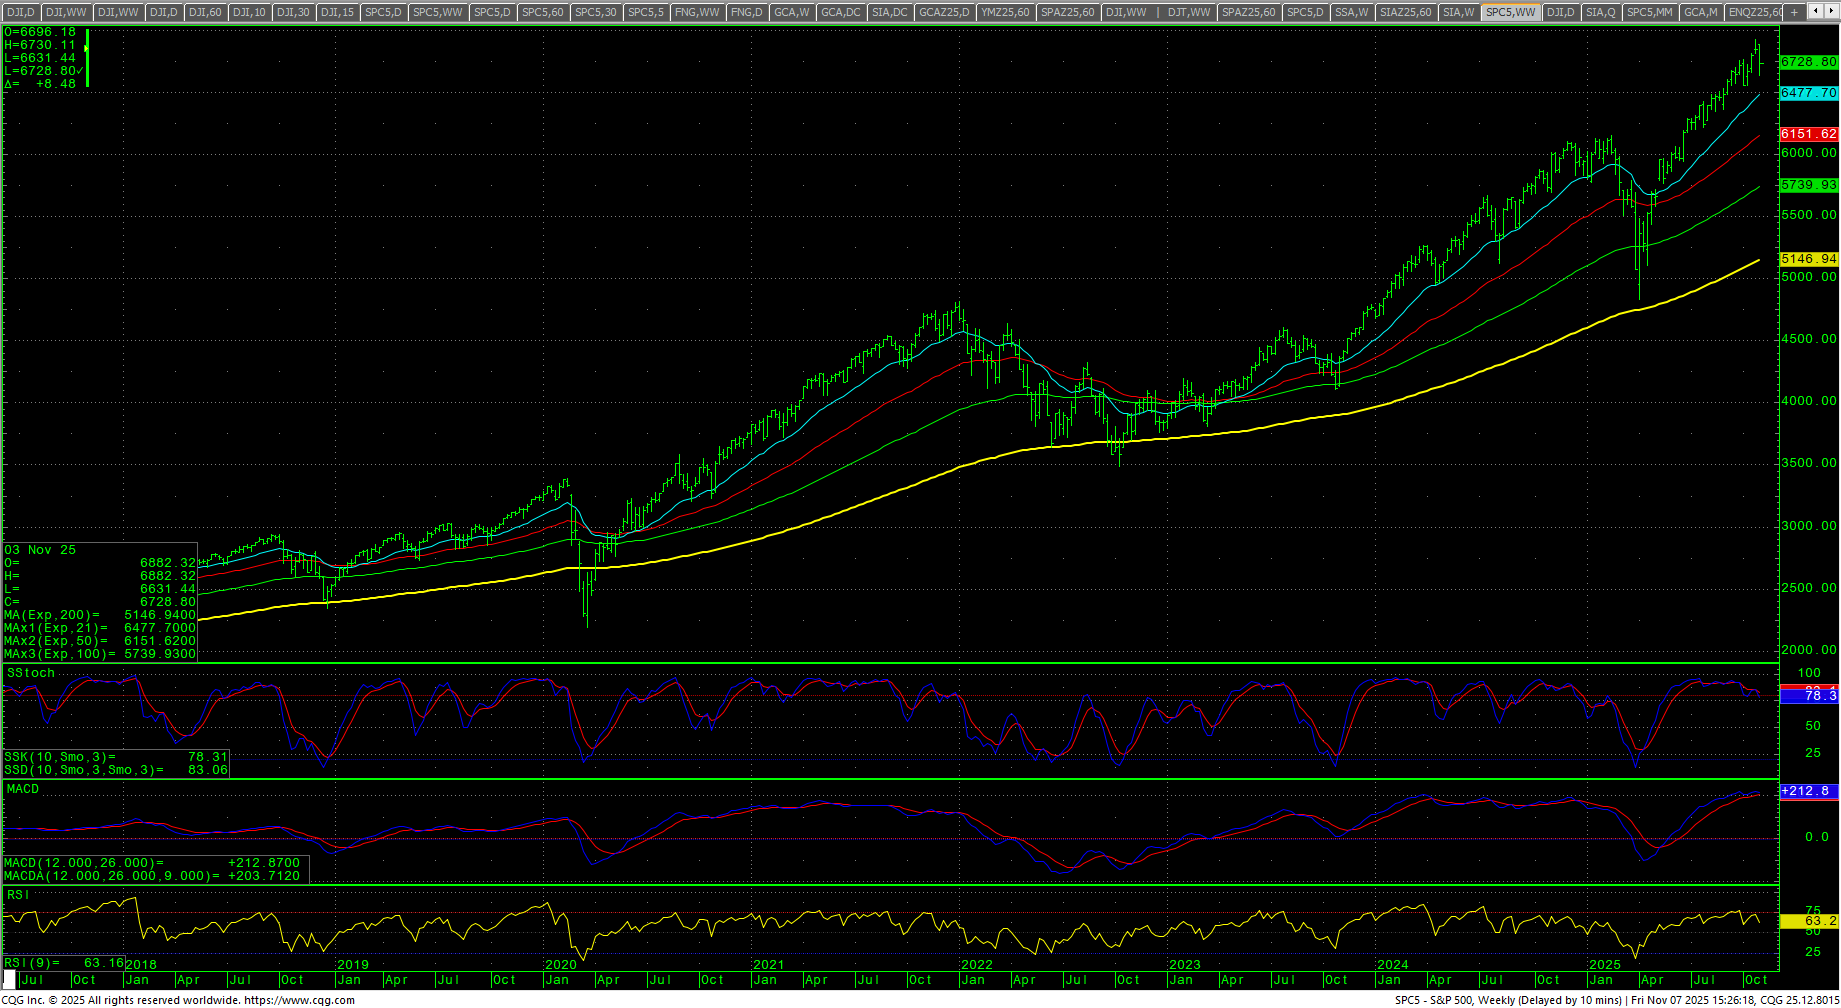 The S&P plunged as much as -3.05% on the week and rallied sharply Friday to reverse higher to close out the week down -1.63% in the lower half of the weekly range. The intraweek low took the SPX to a -3.76% decline from the ATH. As noted above, many analysts are looking for the November -5%/-10% pullback. The daily has hooked lower in the stochastics and MACD is down as they both react to recent bearish divergences. The daily RSI closed at 43.69. The weekly is down with a bearish divergence. The hourly is neutral with Friday’s close and coming off oversold conditions. The 200-day MA is 6238.28 and at record highs.
SPY Weekly Candles
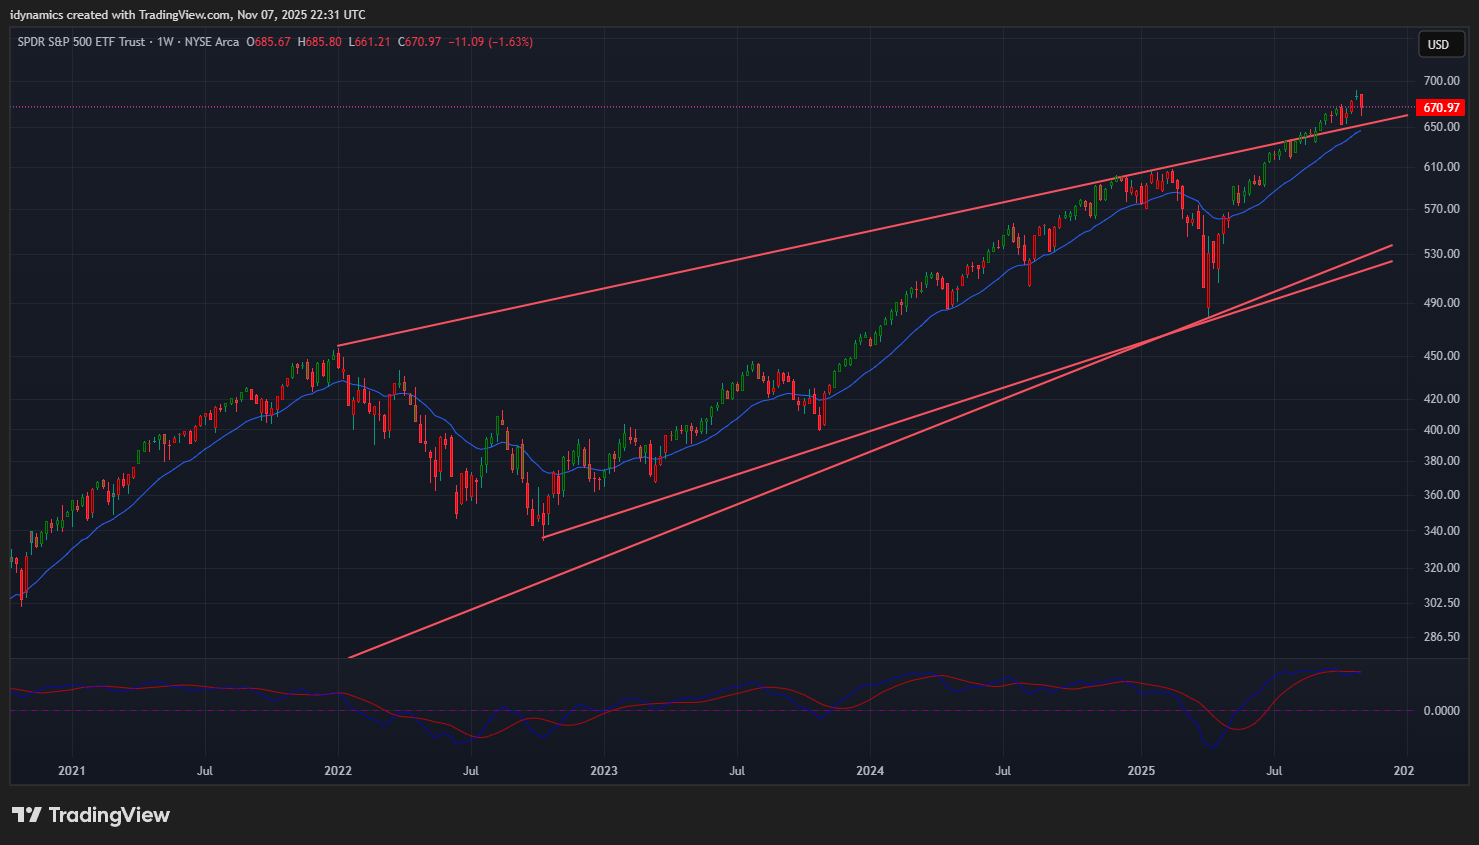 Prices dropped to a zone of support at 6660 through 6643. Support is 6692, 6680 and 6669/6667 with this band of key support through 6643/6631. A breakdown with closes under 6631 can retest the swings at 6555/6550. Closes below 6550 suggest a test of 6360 through 6643. pivotal near-term support at 6514/6510. Closes under 6510 open counts to key support at 6361/6360. A breakdown under 6360 should test 6123 with full counts into the 6044 level with critical hourly support at 6212/6201. Daily closes under 6044 should minimally test 5877 and 5799/5798 with counts to 5631/5628.
S&P 500 Index Hourly H-L-C
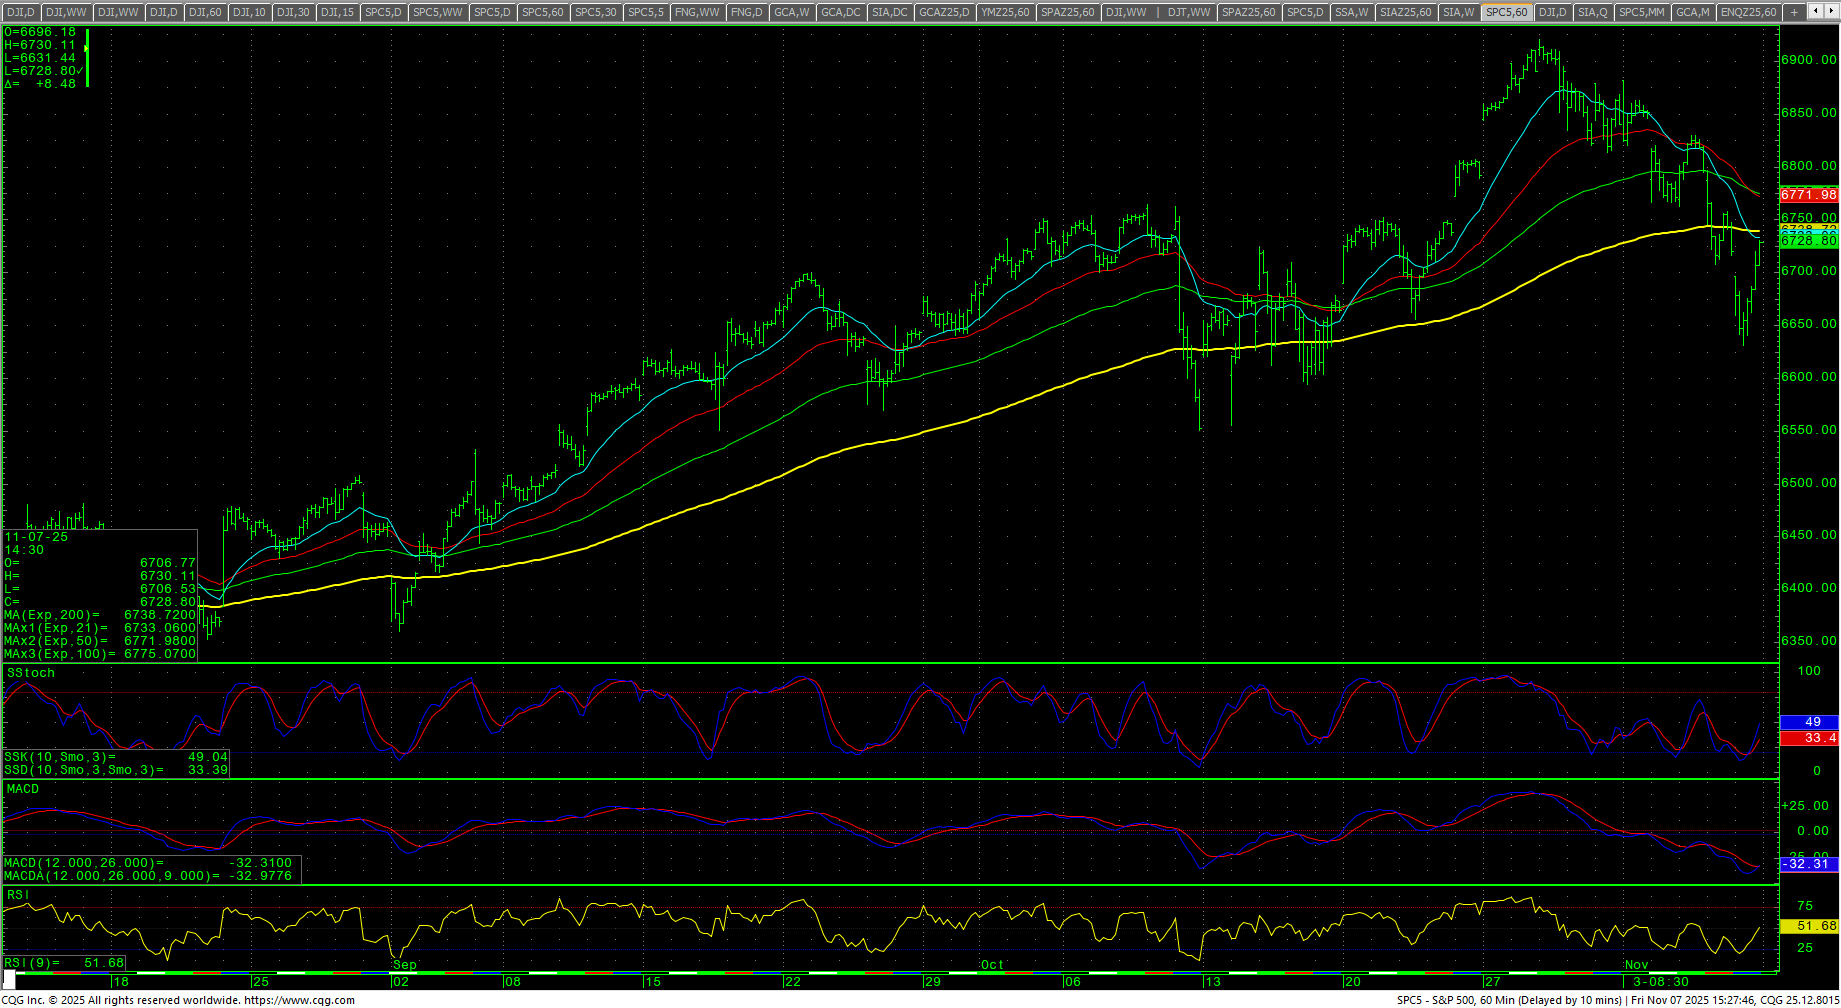 Resistance is 6741, 6775 and 6809/6811. A drive over 6811 should test 6848/6852 with counts back to 6880/6882. A drive over 6882 retest 6908/6920. Closes over 6920 open counts to 6944 and 6980 through 7016. A close over 7016 offers counts to 7088, 7160 and 7214. Closes over 7214 setup a drive to 7250 and 7286 while opening counts as high as 7448. Above 7488 counts to 7520 and 7592. A drive above 7592 can test 7664 with counts to 7736 and as high as 7808.
| Resistance | Support |
|
|
Charts courtesy of CQG, Inc., CNN, Koyfin, Trading View and AAII