
TECHNICAL ANALYSIS (by Intraday Dynamics)
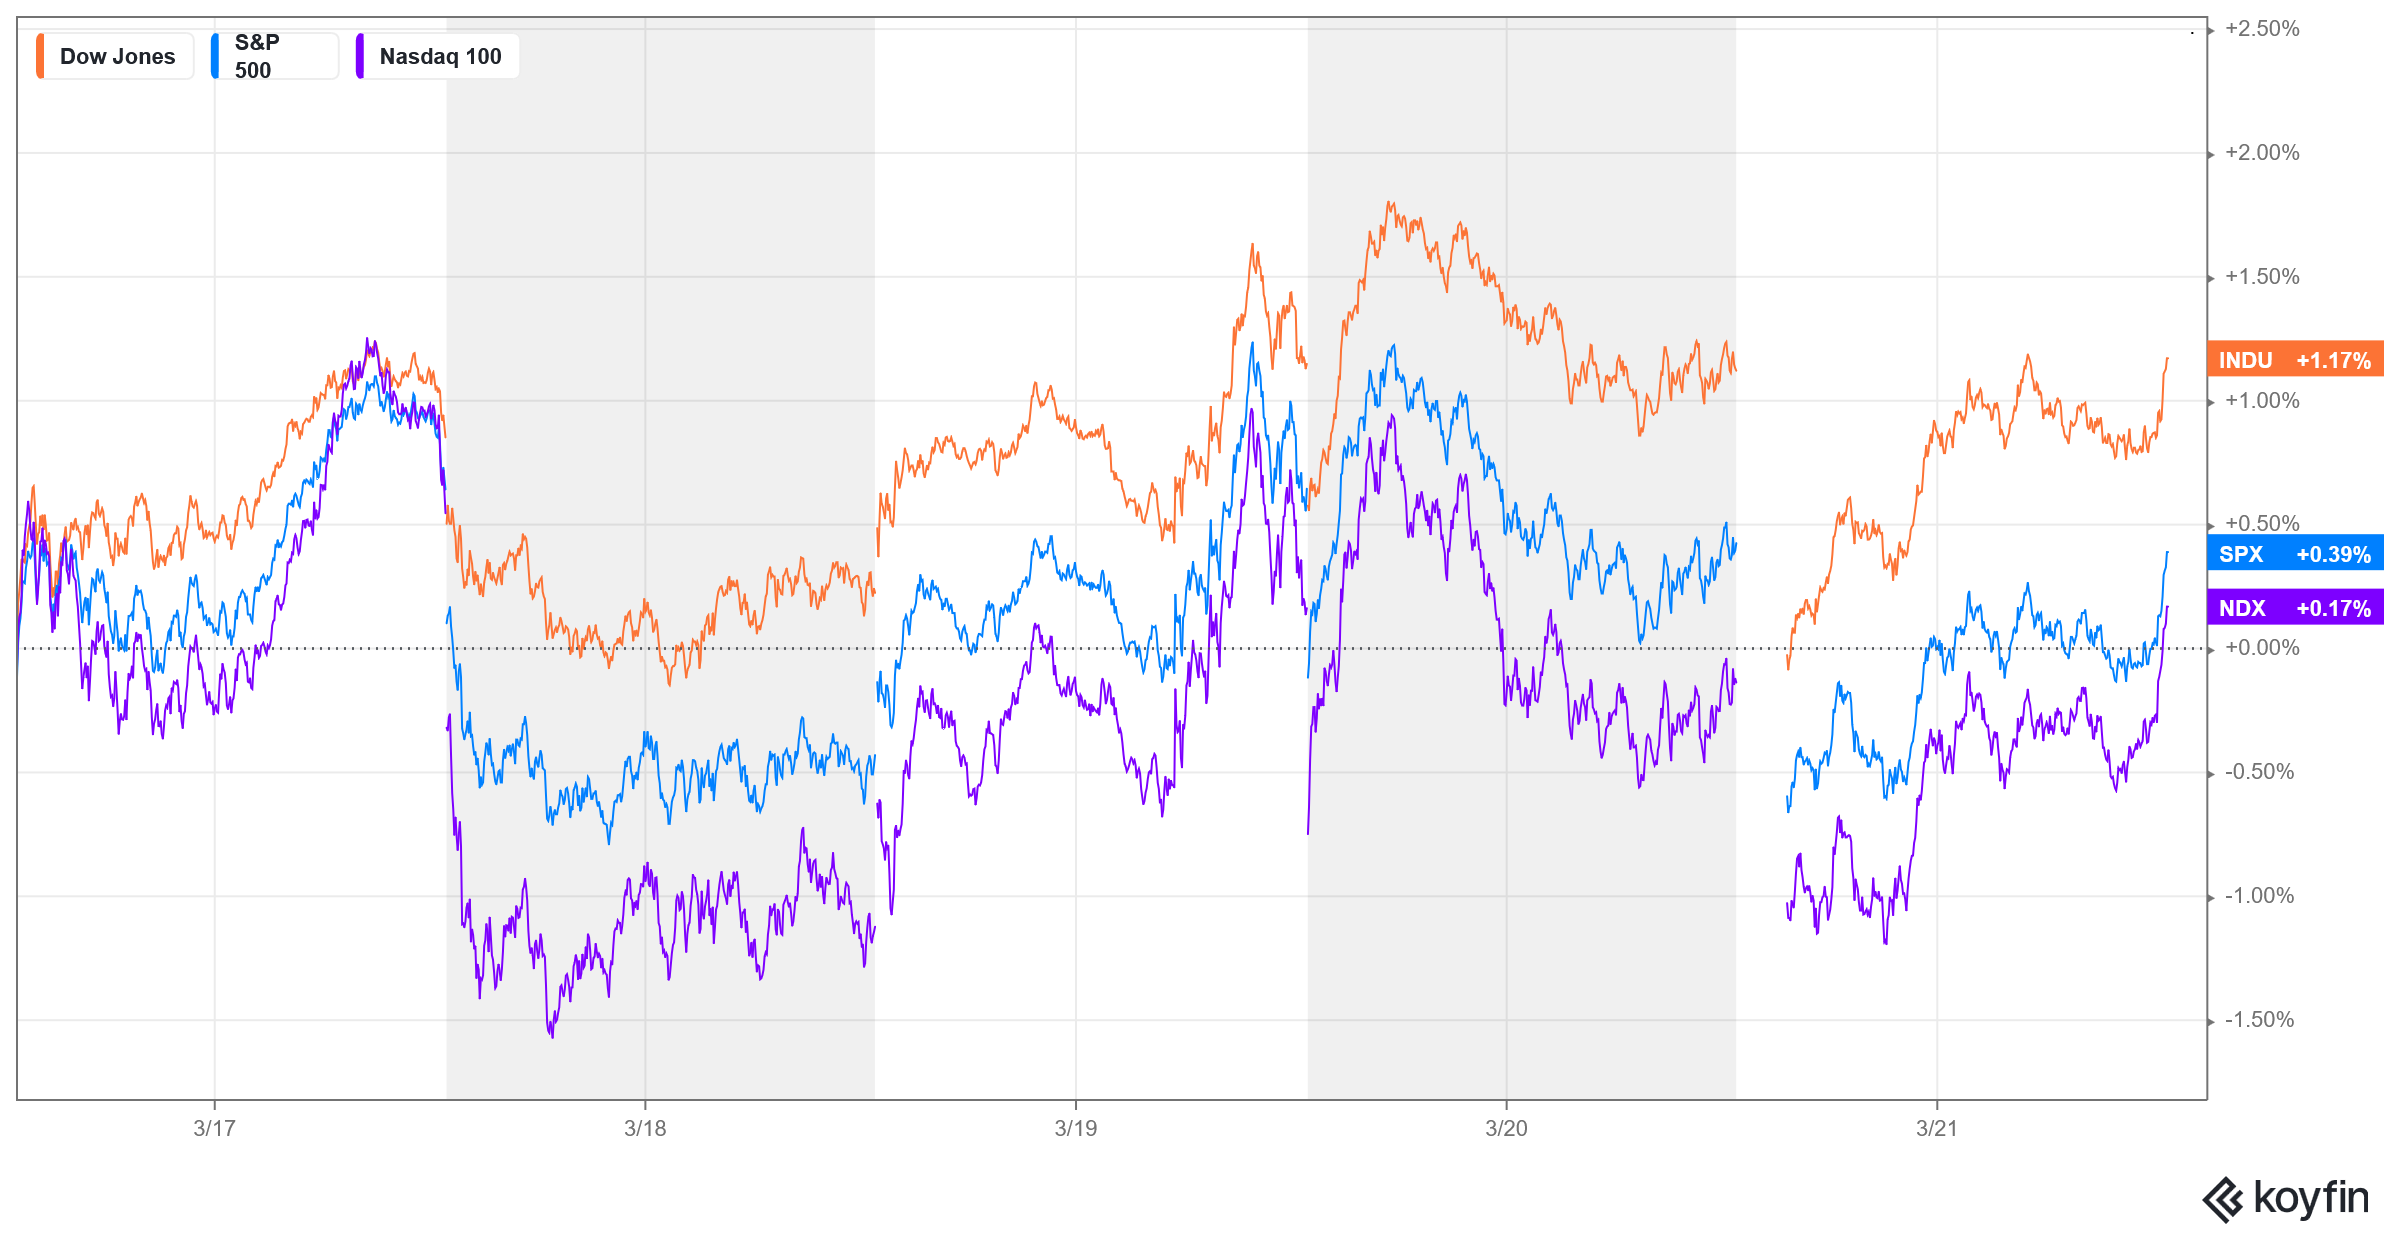
Major Indices Week of March 21, 2025
NYSE Volume
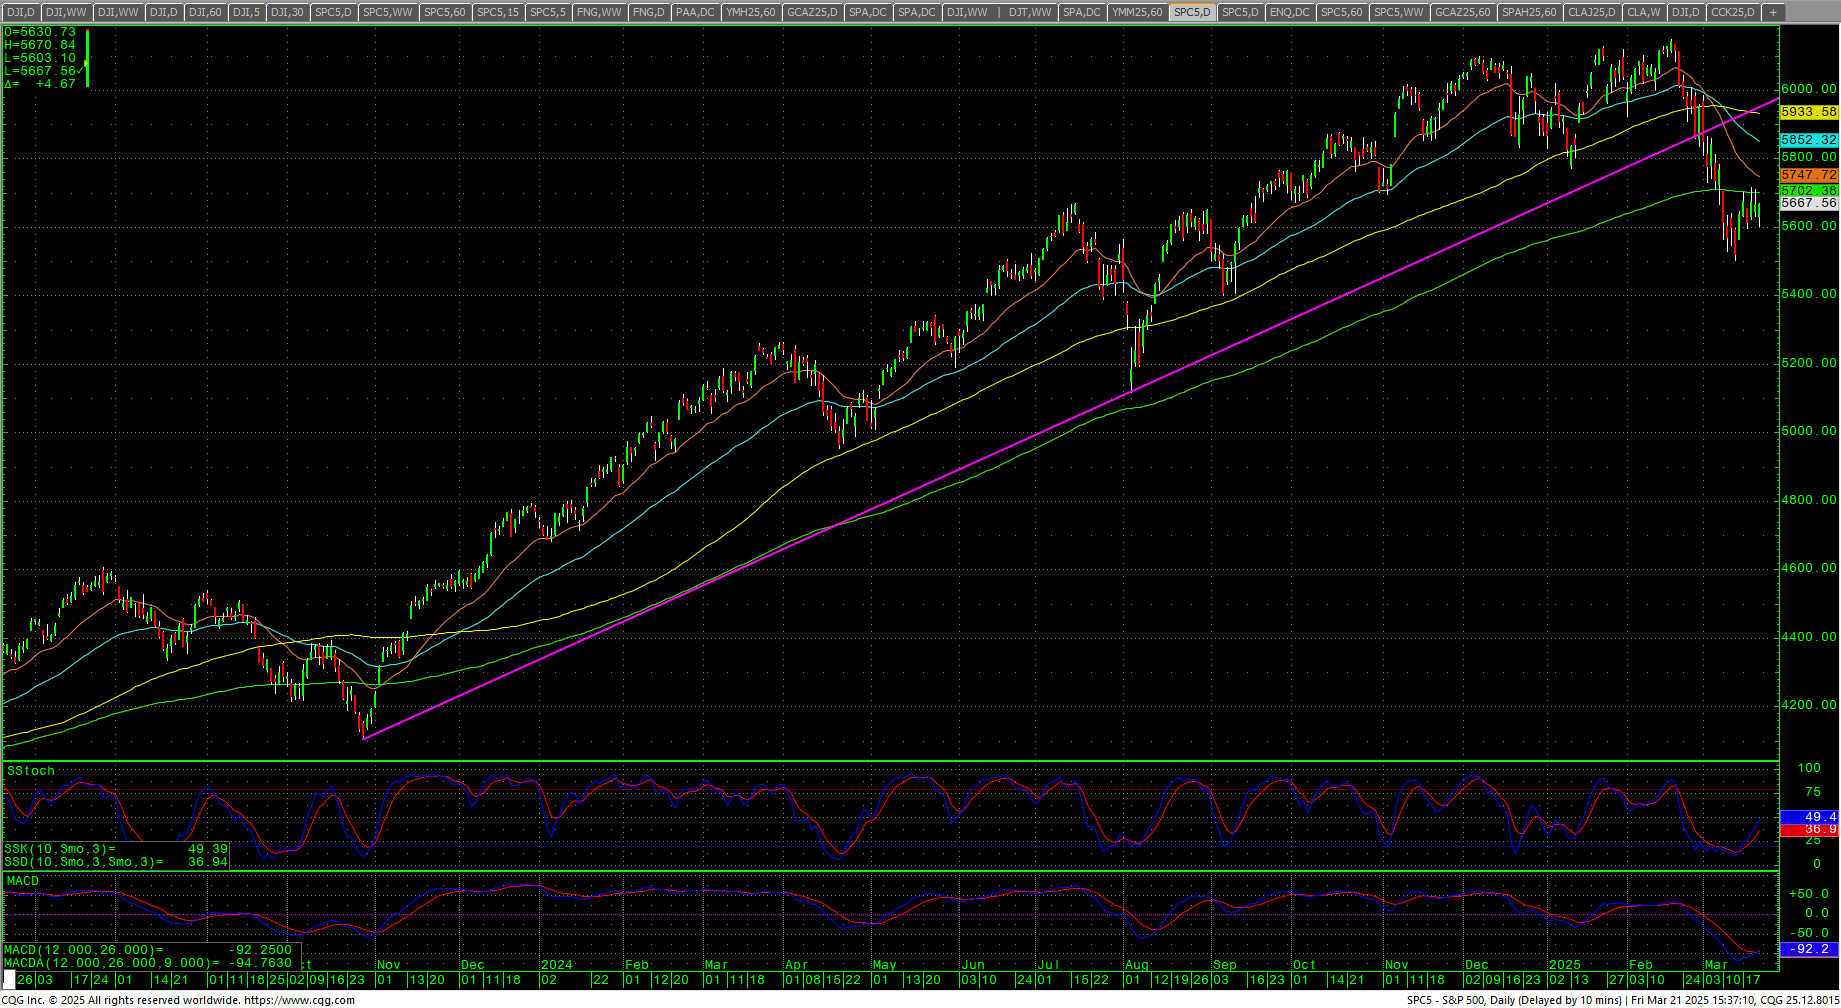
 SPX Daily Candles
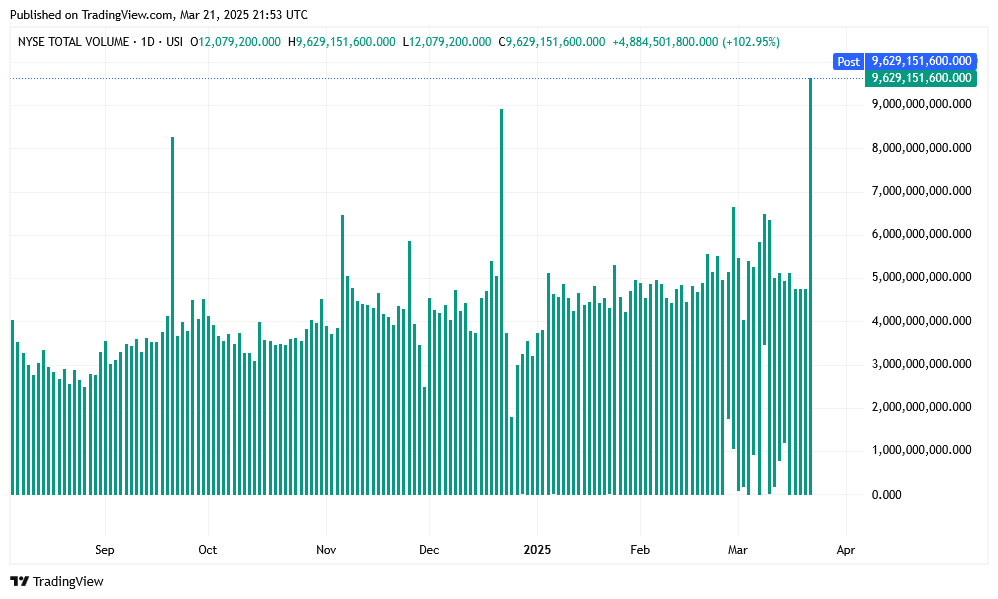
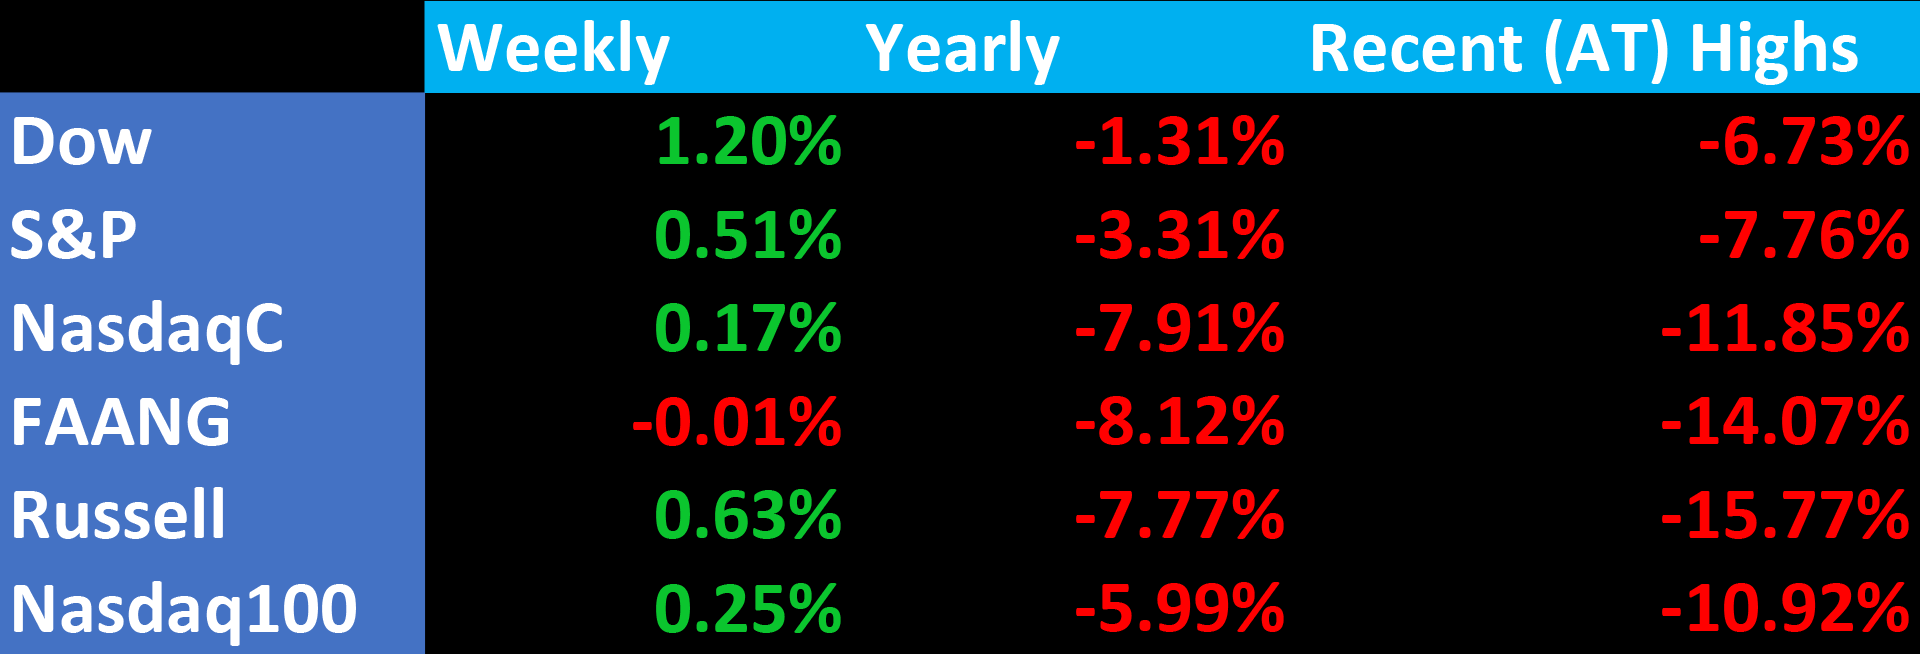
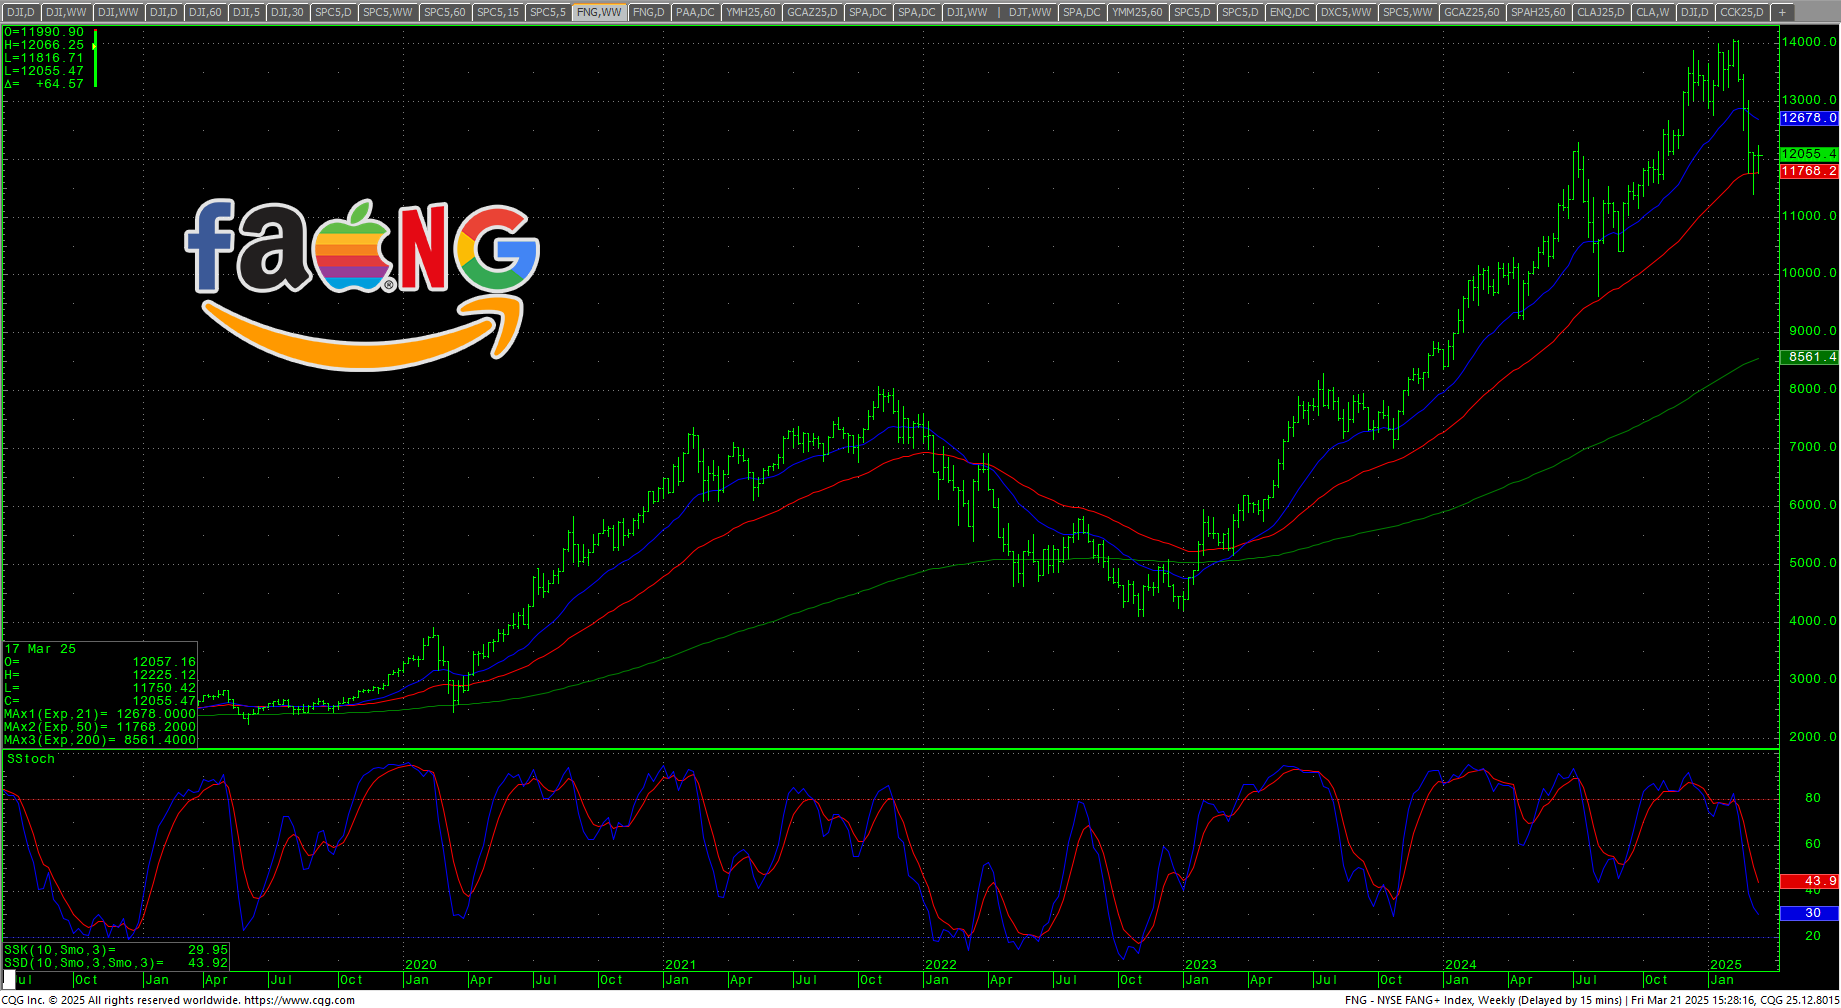
 Stocks had a recovery week, breaking a four-week losing streak. with a huge volume Triple Witching Friday where tech stocks readjusted to options late in the day. The Dow close was predictable for Triple Witching based on strike price volume on the options. All major indexes closed higher with the FANG settling unchanged on the week. Prices are building flags off to the side of the recent decline and sentiment remains overtly bearish and in extreme fear. We are heading into another critical week for stocks and the month of April continues a larger window where things should remain volatile.
Dow Jones October-December 2018
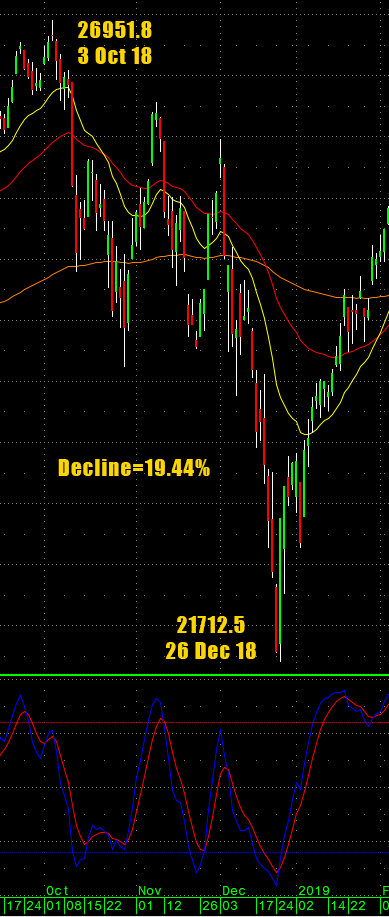 Most analysts are declaring that the correction is “over.” The -10% decline, coupled with an AAII reading of 58.1% bears to 21.6% bulls is a sign that prices are through. This, plus the “Years that end in 5 always…blah, blah, blah” crowd tells you to just sit tight, “Years that end in 5 ALWAYS, etc., etc. All of this is well and good if this is a ‘normal’ correction. The jury is still out on this as we remain in a window very similar (if not more powerful) than the late 2018 window where the Dow declined -20%. The coming week, even with extremes in sentiment, we will find out; “If it looks like a bear flag and acts like a bear flag, is it a bear flag?”
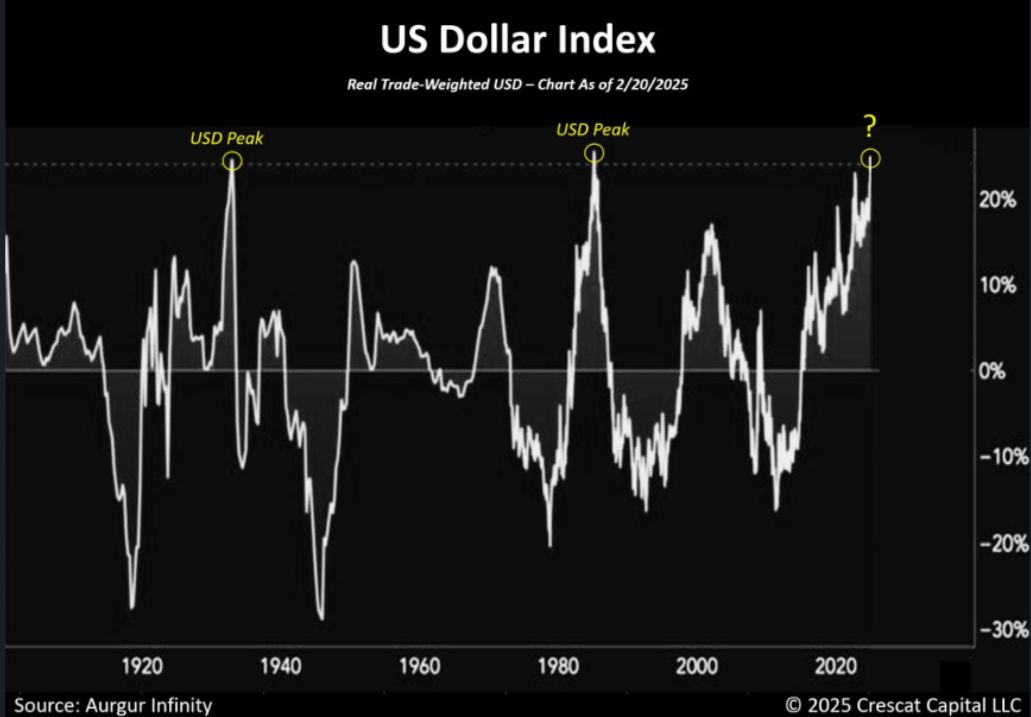
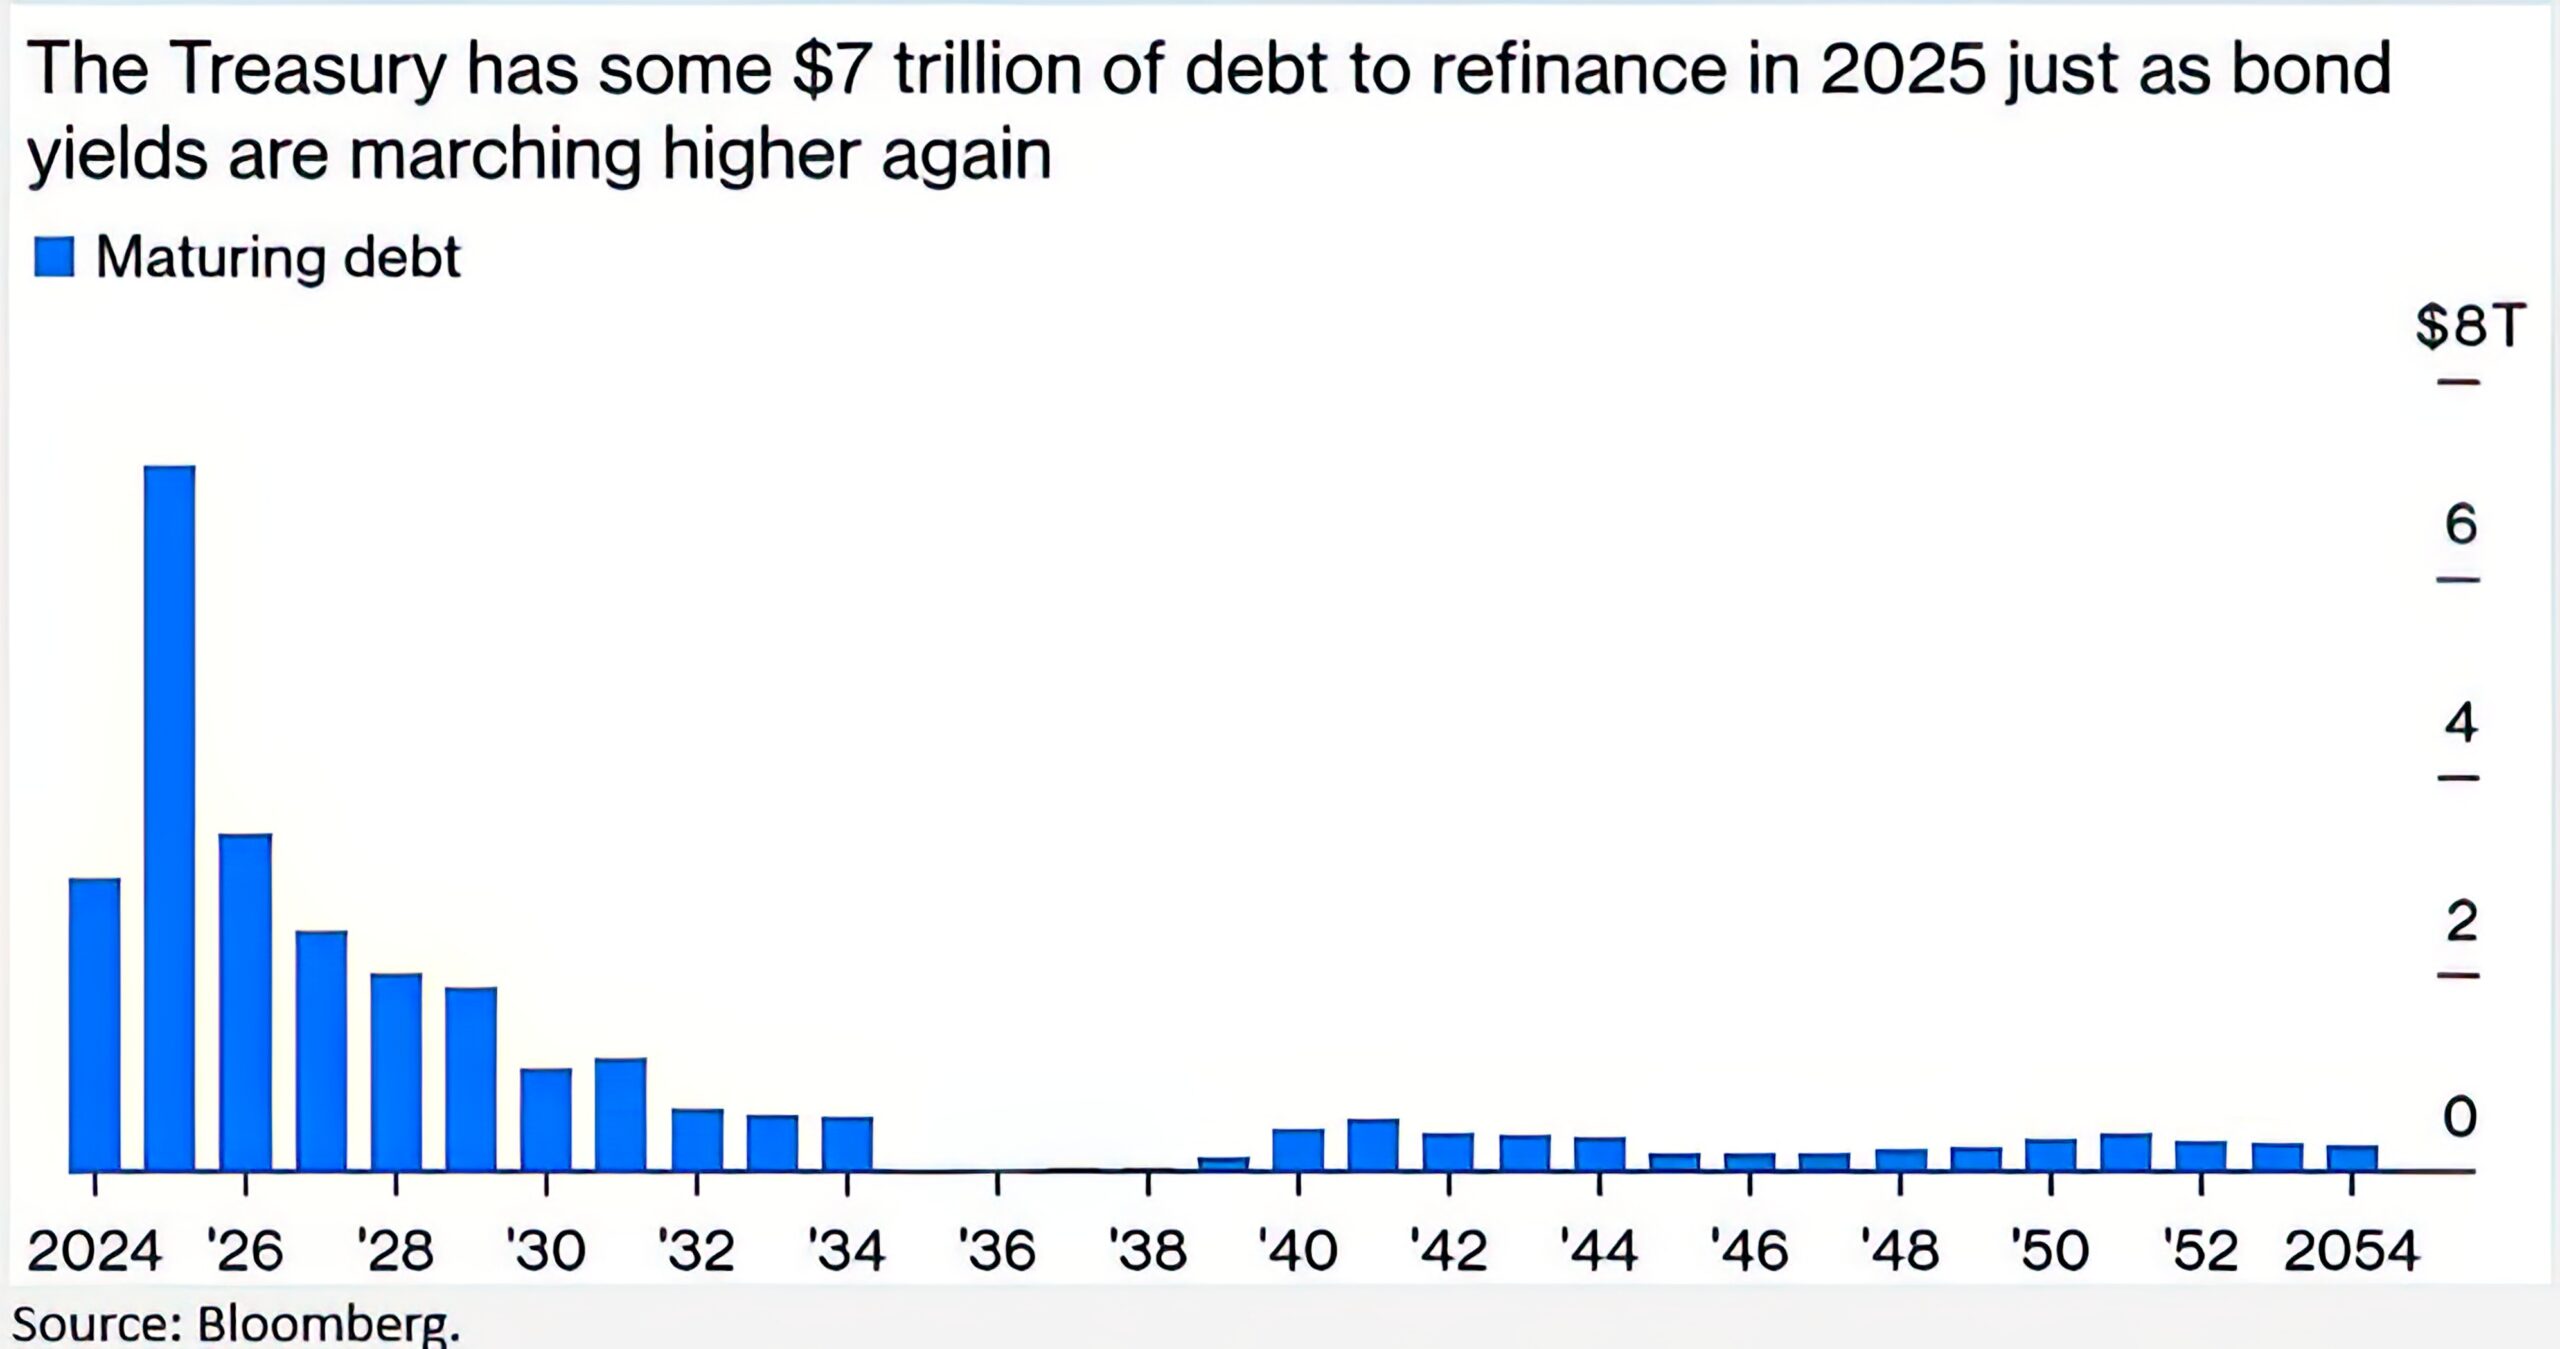
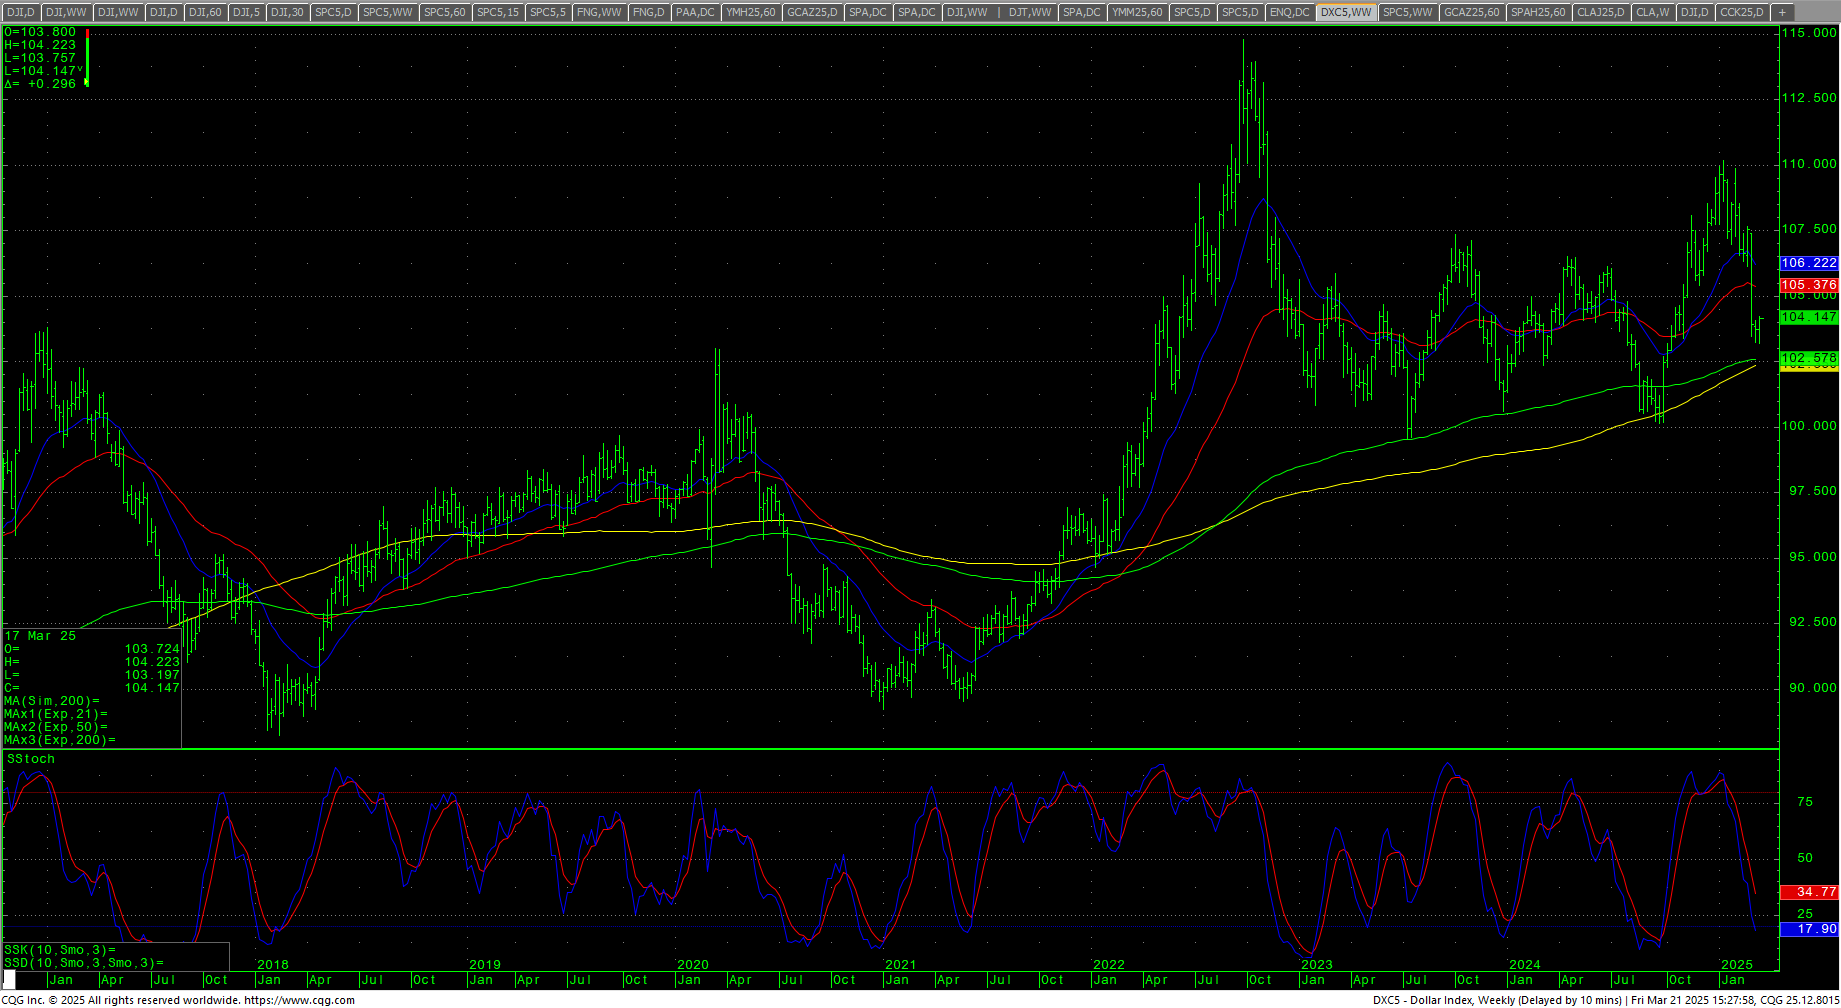
Two massive issues facing the markets. The first, and perhaps the biggest, is the Trade Weighted Dollar. Looking at that chart, we are at an extreme last seen at two major turning points. The first being 1929/1933 and second the mid-1980s, the birth of full-bore Neoliberalism in trade. The second is the debt. The U.S. needs to refinance over $7 trillion in debt this year while the 10YR stays stuck in the 4.25%/4.50% level. In other words, the U.S. needs rates to come down. One way to accomplish this is for equity prices to decline. Global banks are already in a “race to the bottom” on interest rates, regardless of inflationary concerns.
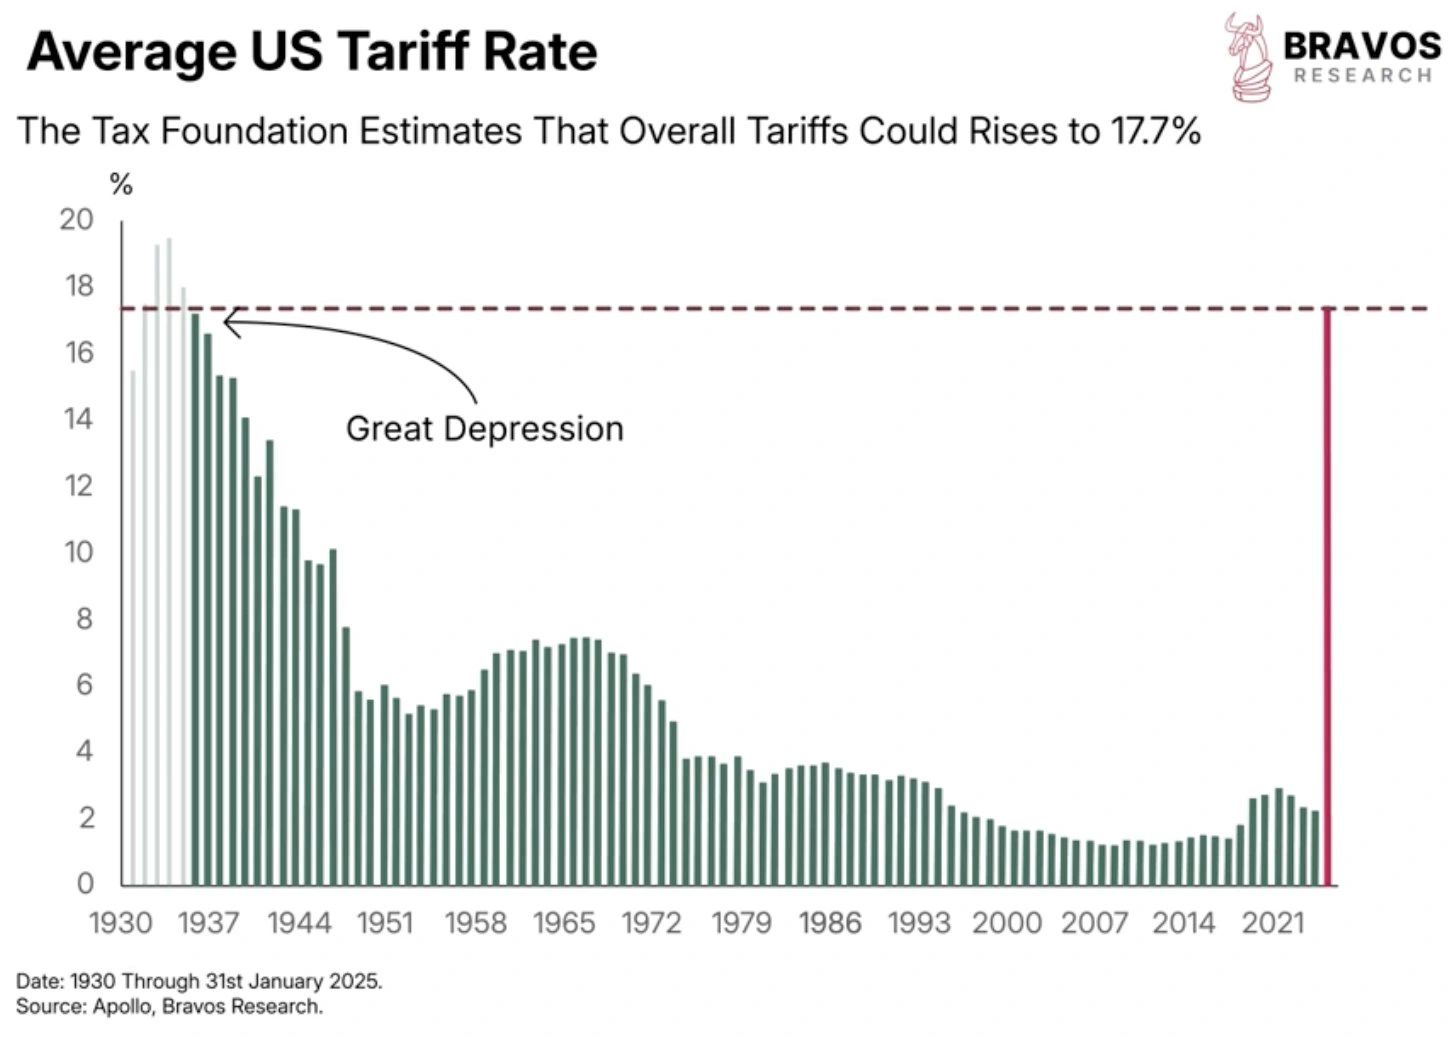
As we head into this CRITICAL timing week, it is likely that stocks will again be dealing with the reality of the Tariff Tantrums. As “Liberation Day” approaches on 2 April 2025, the markets will be negotiating the reality of more tariffs. If the proposed tariffs all take place as predicted, it will take tariffs to levels not seen since the Great Depression of the 1930s. Are we bottoming or are we in the “Gradually and then suddenly” stages?
 Consumer Sentiment remains depressed and the ‘policies,’ if there are any, are basically Neoliberalism on steroids. Cut taxes on corporations and deregulate. Again, see the Dollar chart above for 1985. The bill for this comes in at just under $6 trillion added to the current $36 trillion. All this is happening while the Atlanta Fed is still predicting a decline in Q1 GDP to -1.8%.
Dow Theory
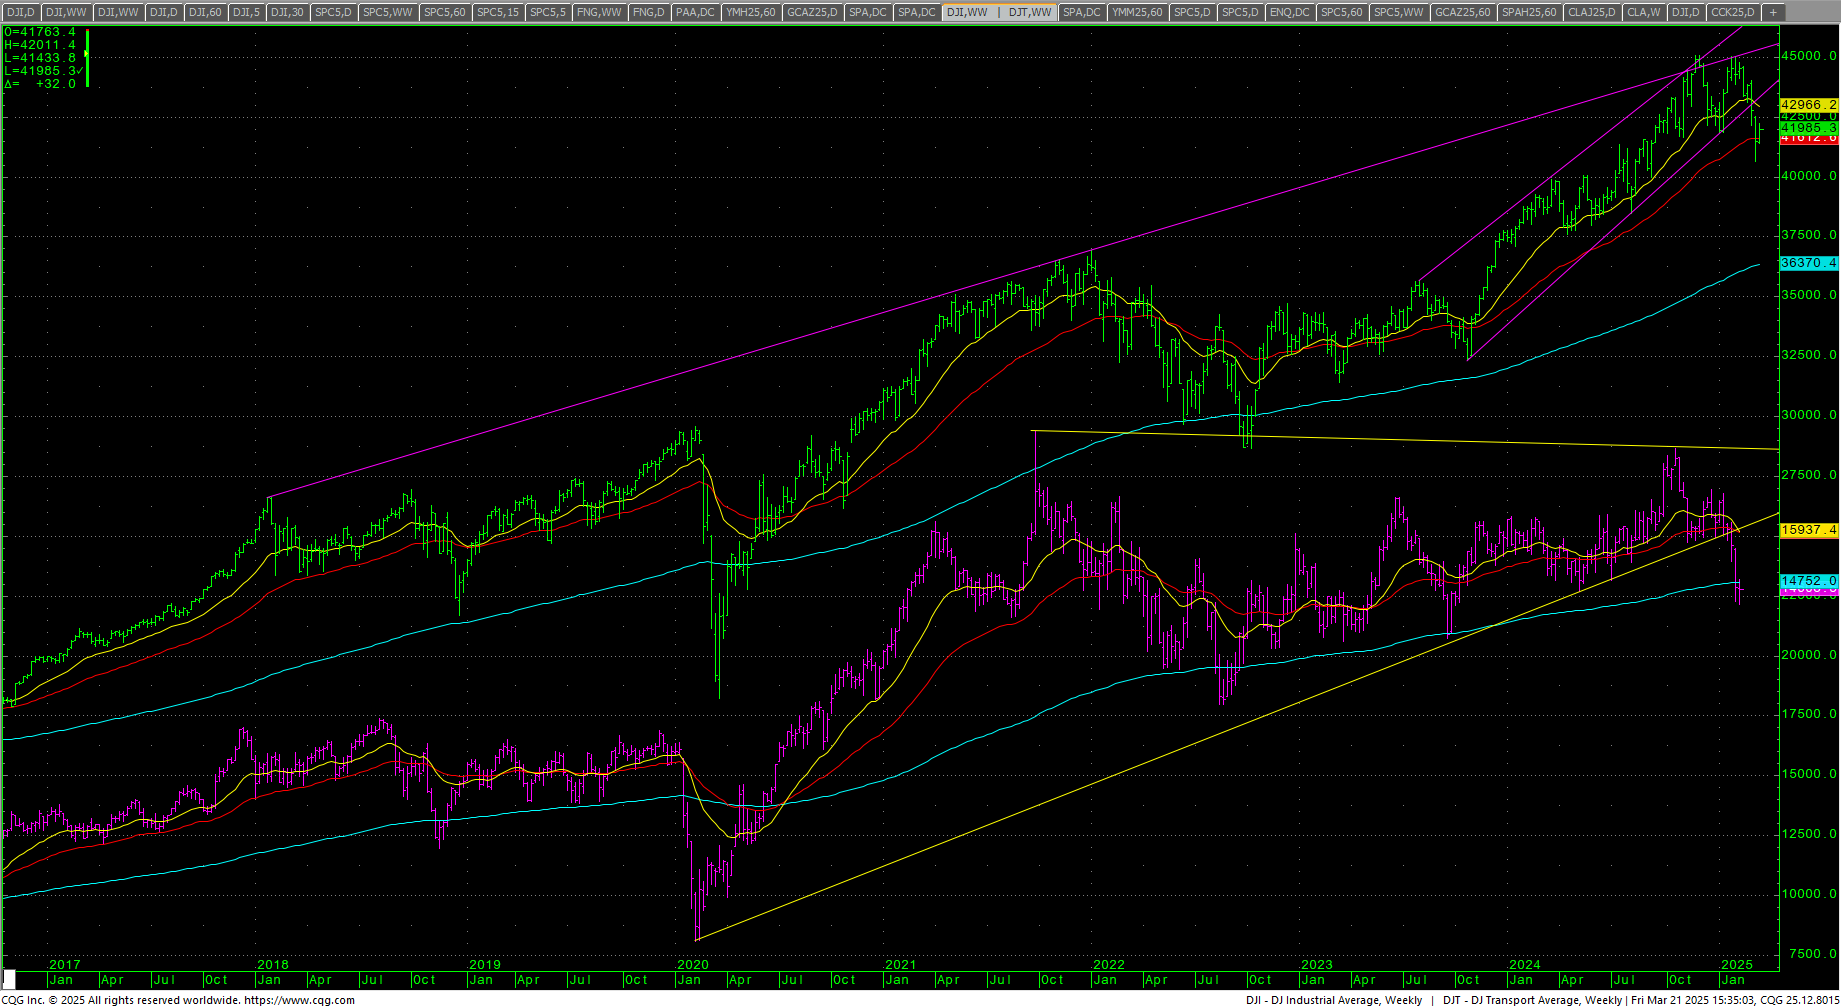 At the same time, Dow Theory is flashing a pretty bearish signal.
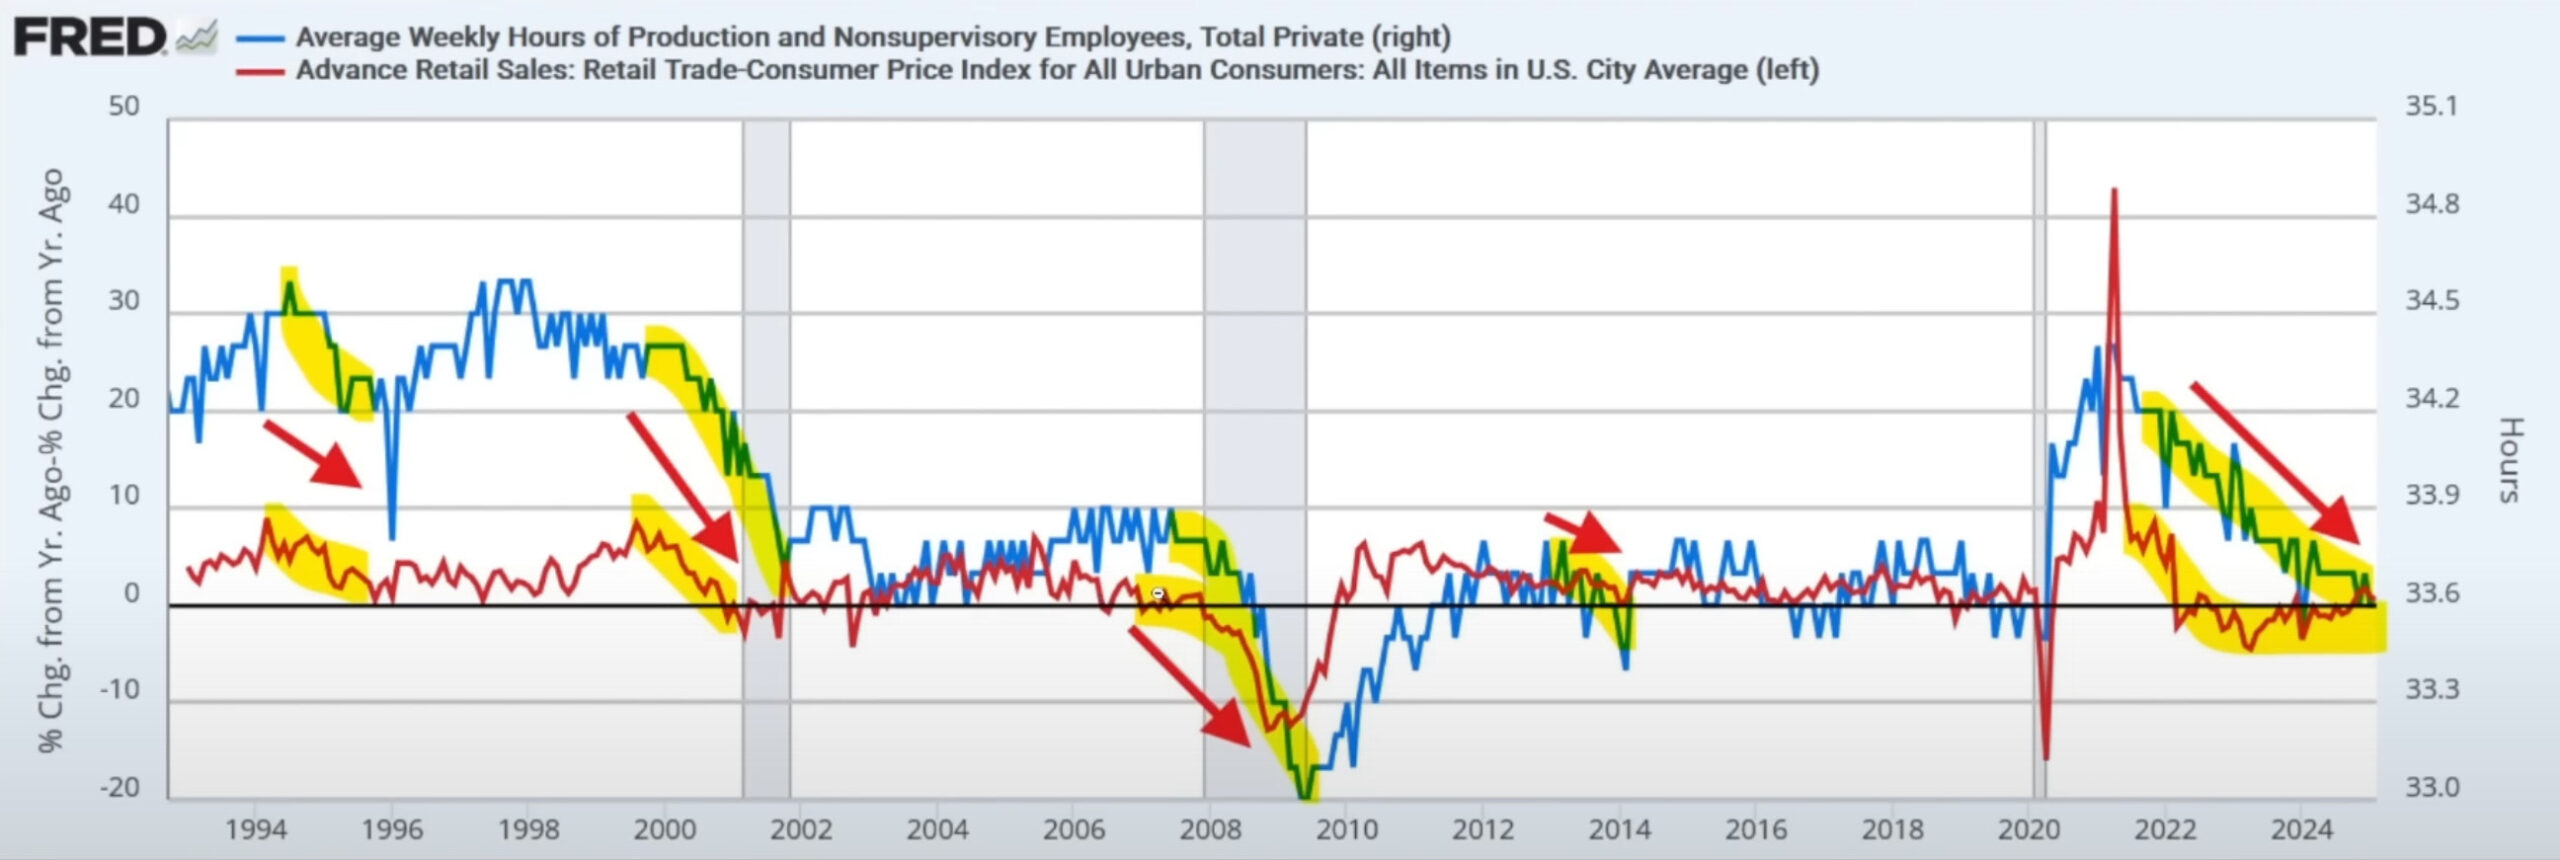
Is FedEx a canary in a coal mine? One chart that Fed seems to be ignoring is Hours Worked versus Retail Sales. Unless this chart turns around, it predicts a contraction.
 MAGS (Magnificent 7) Daily H-L-C
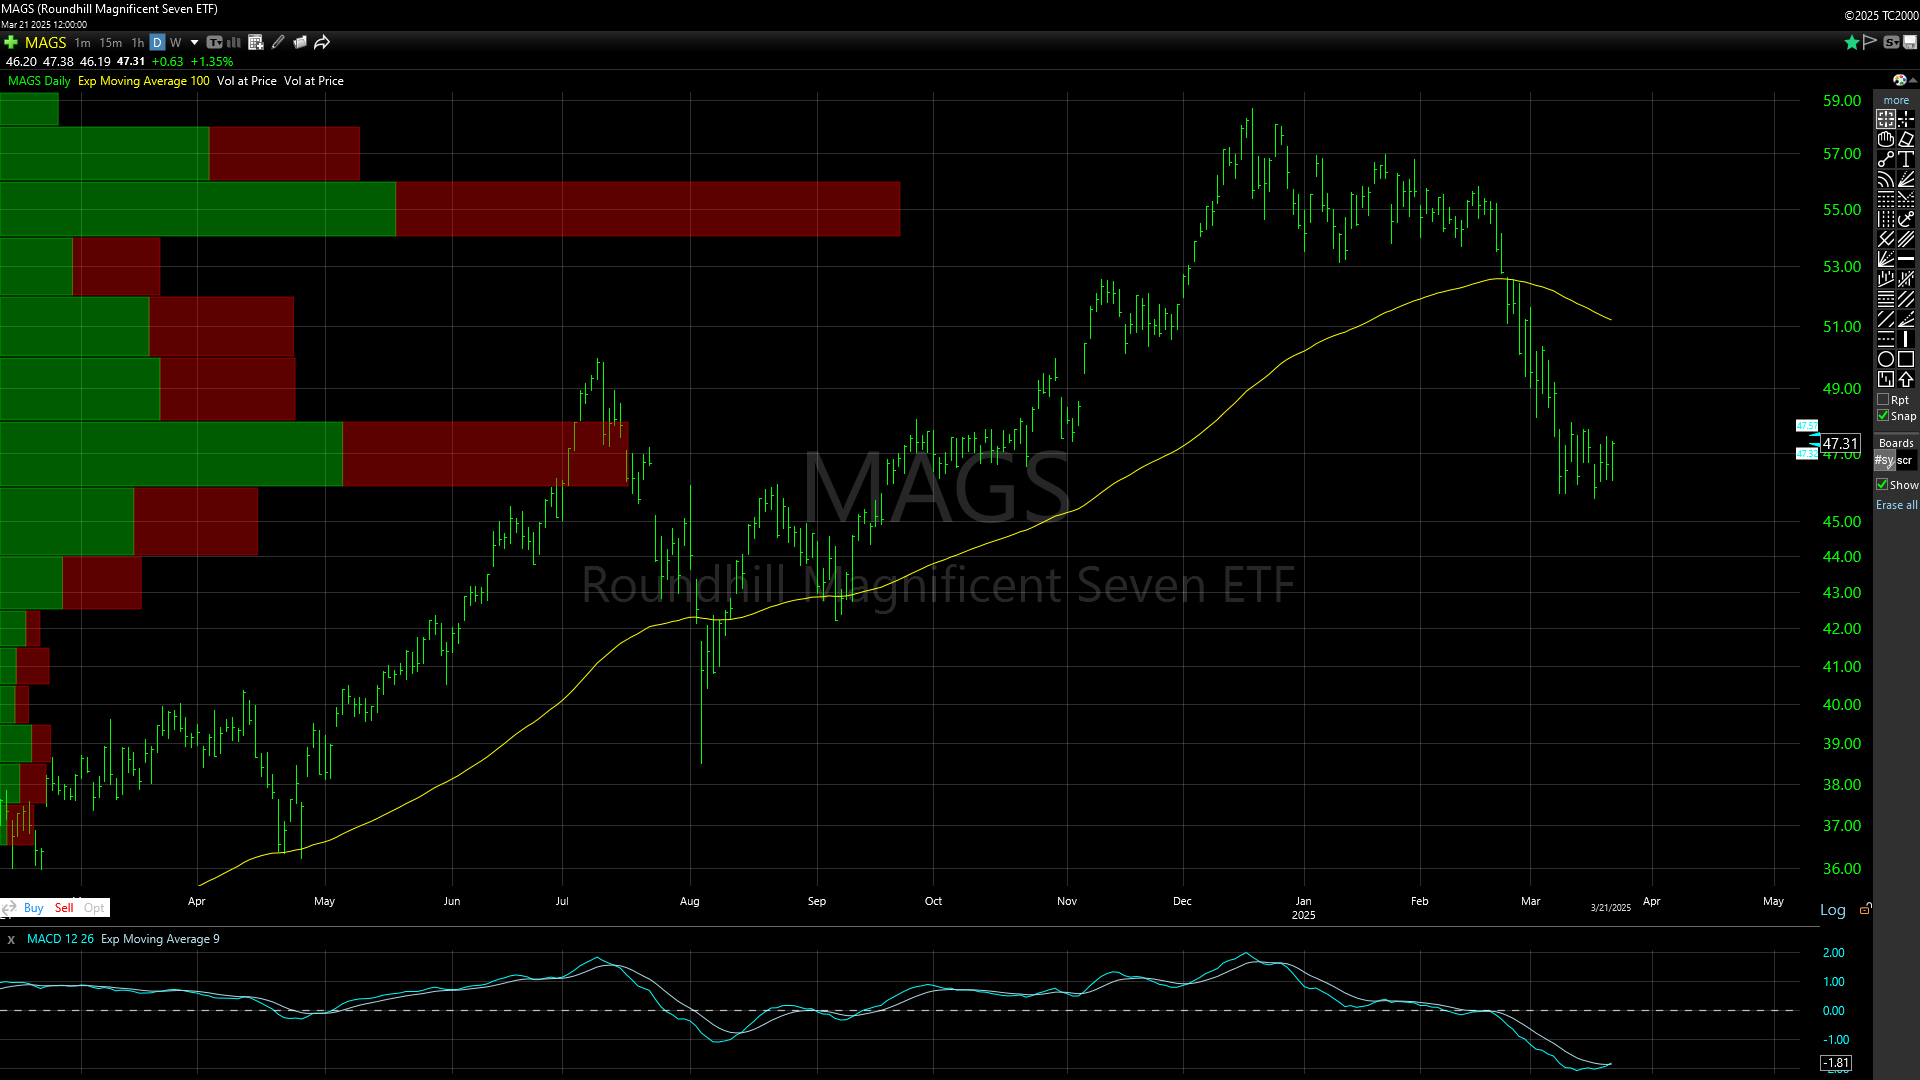 The MAGS (Magnificent 7) is now building a flag just under the critical 48 level. The MACD has reached low levels and the two-week congestion has shifted the Volume at Price off the extremely skewed reading of early March, where basically ALL the trade was the top. That said, you can see there is very little volume underneath this level and a further breakdown could potentially take this index toward the 2024 lows…minimally to 42-40 level. Until proven wrong, selling against the 48 level is the strategy.
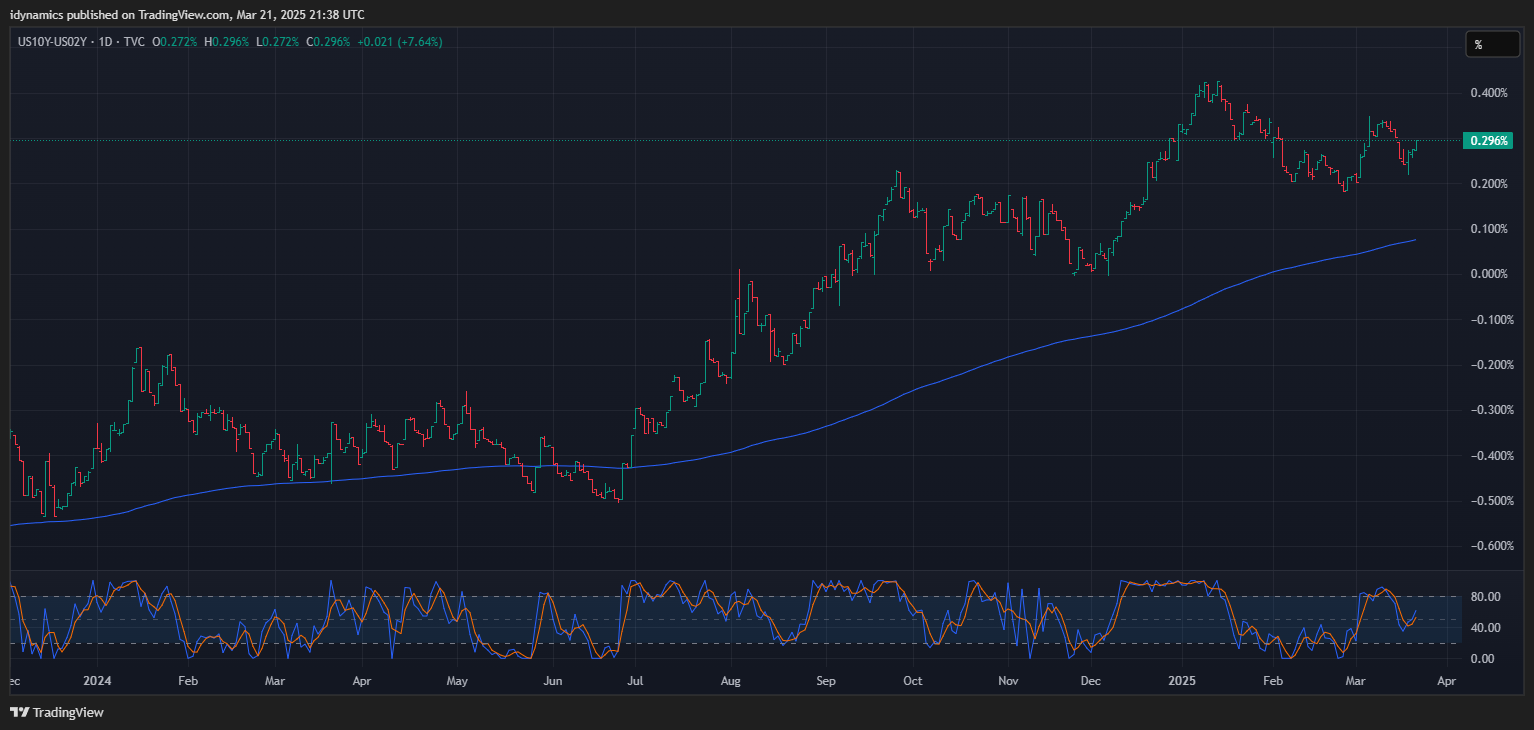
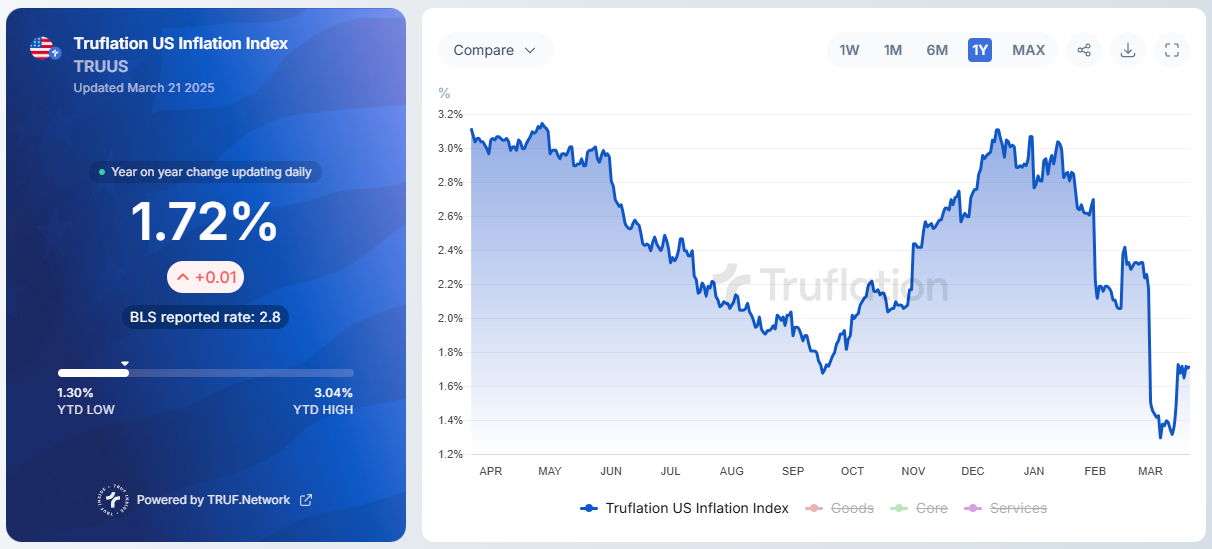
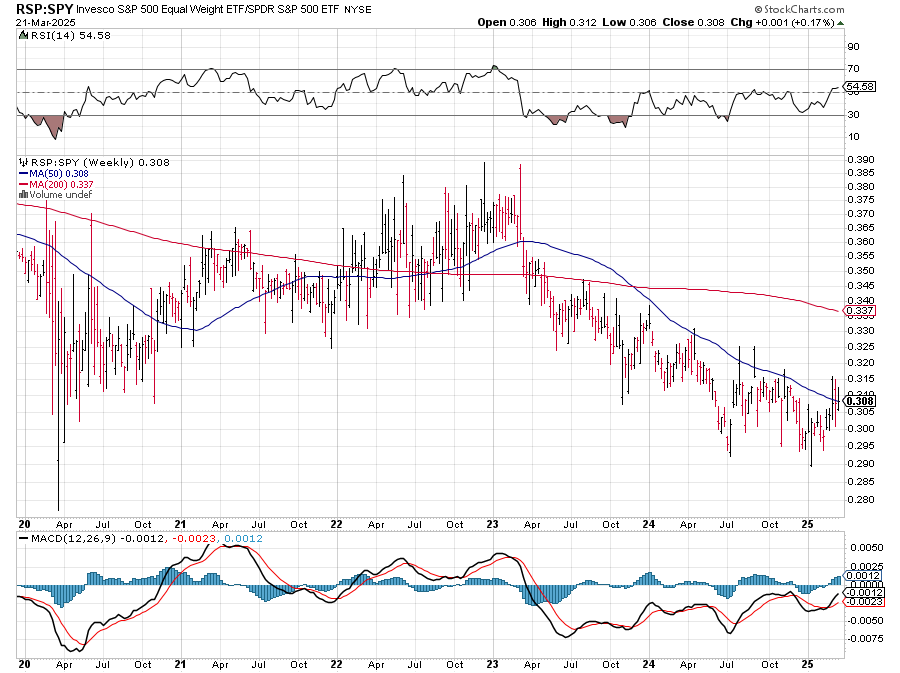
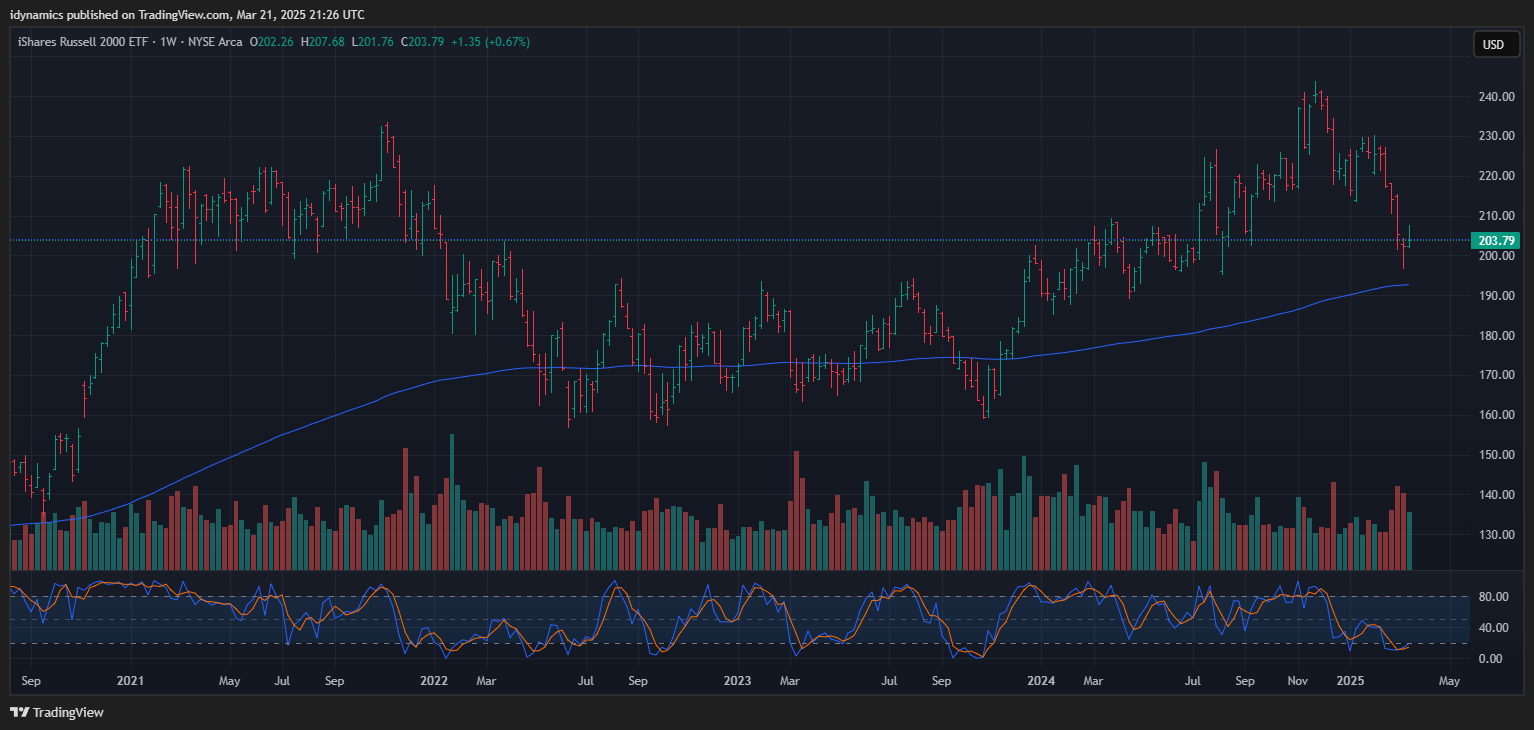
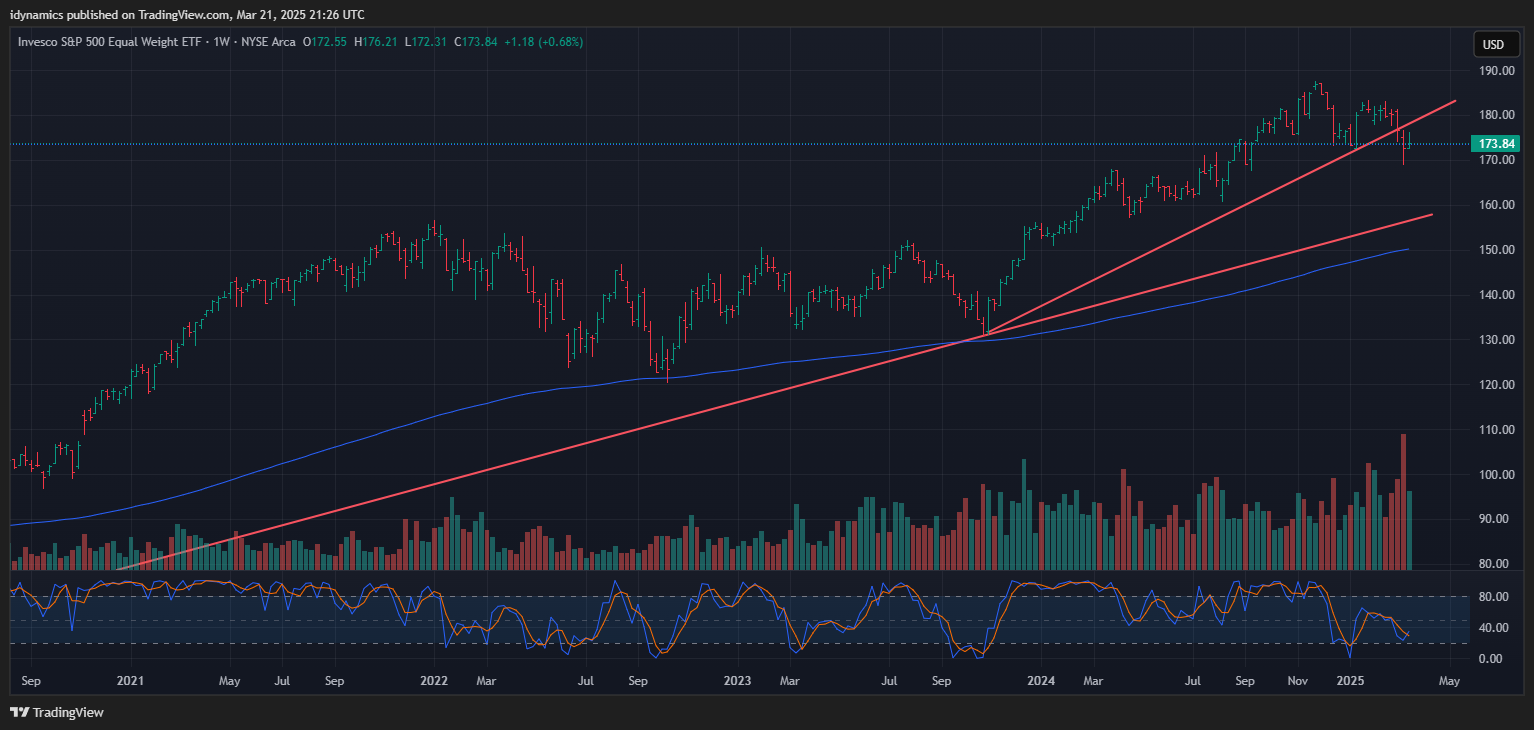
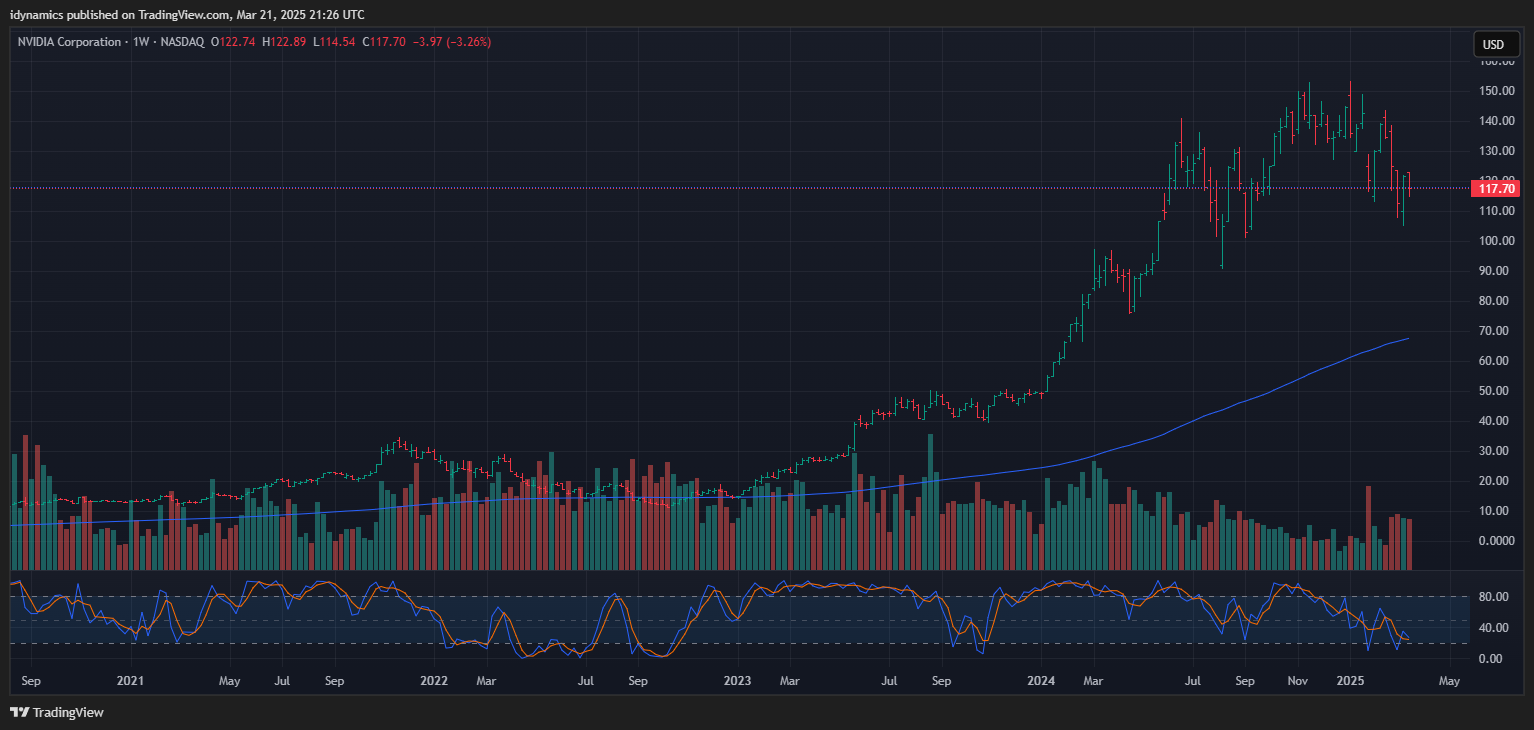
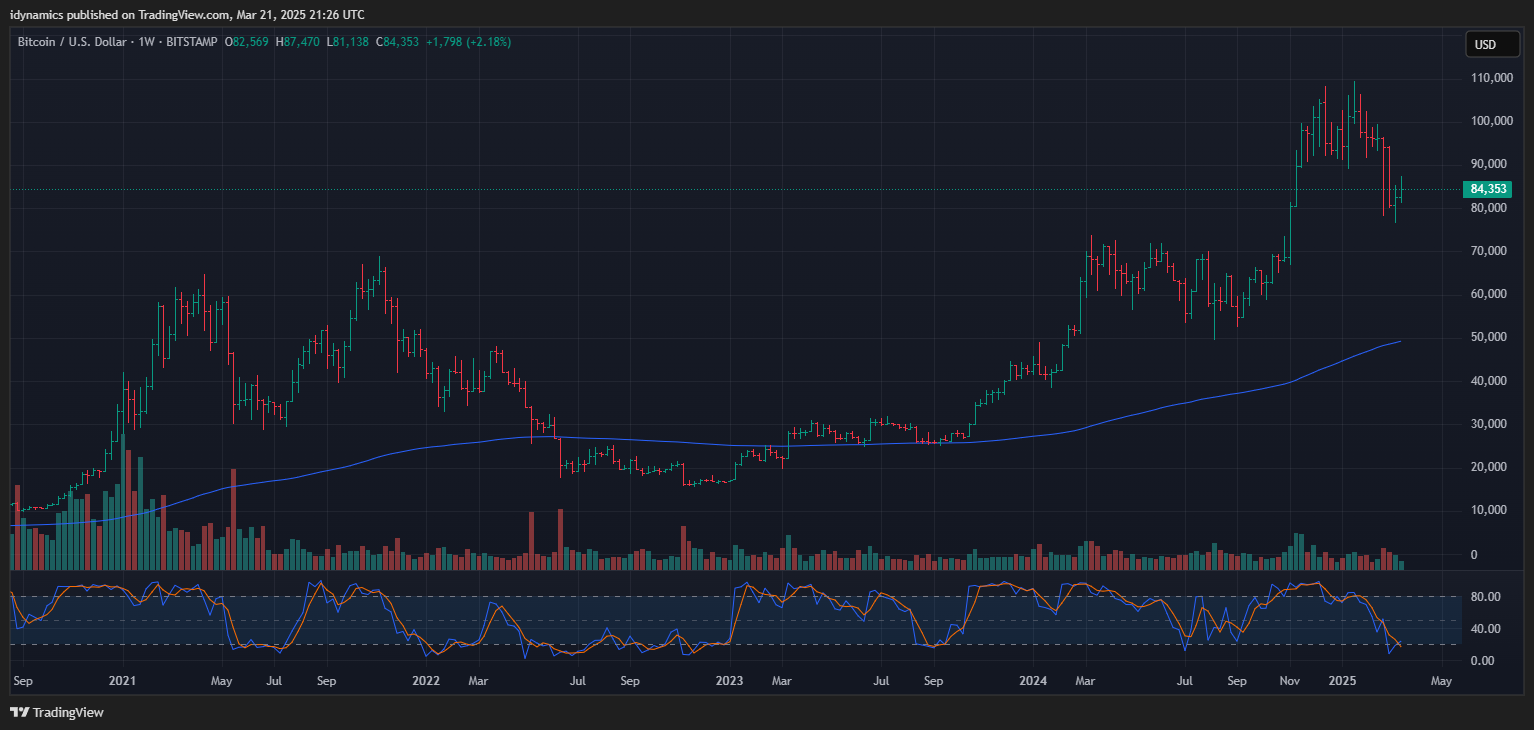
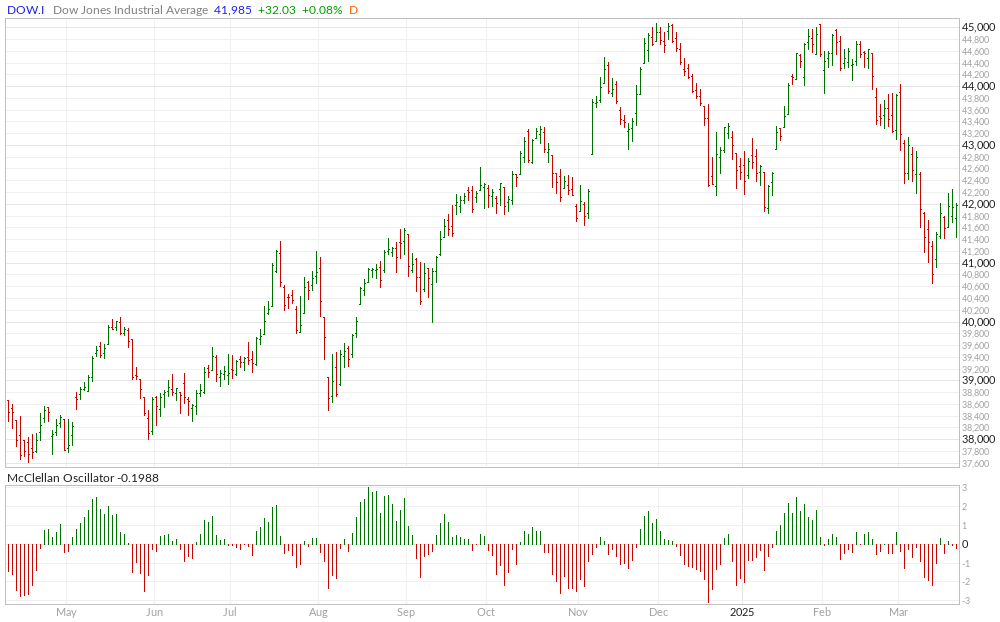
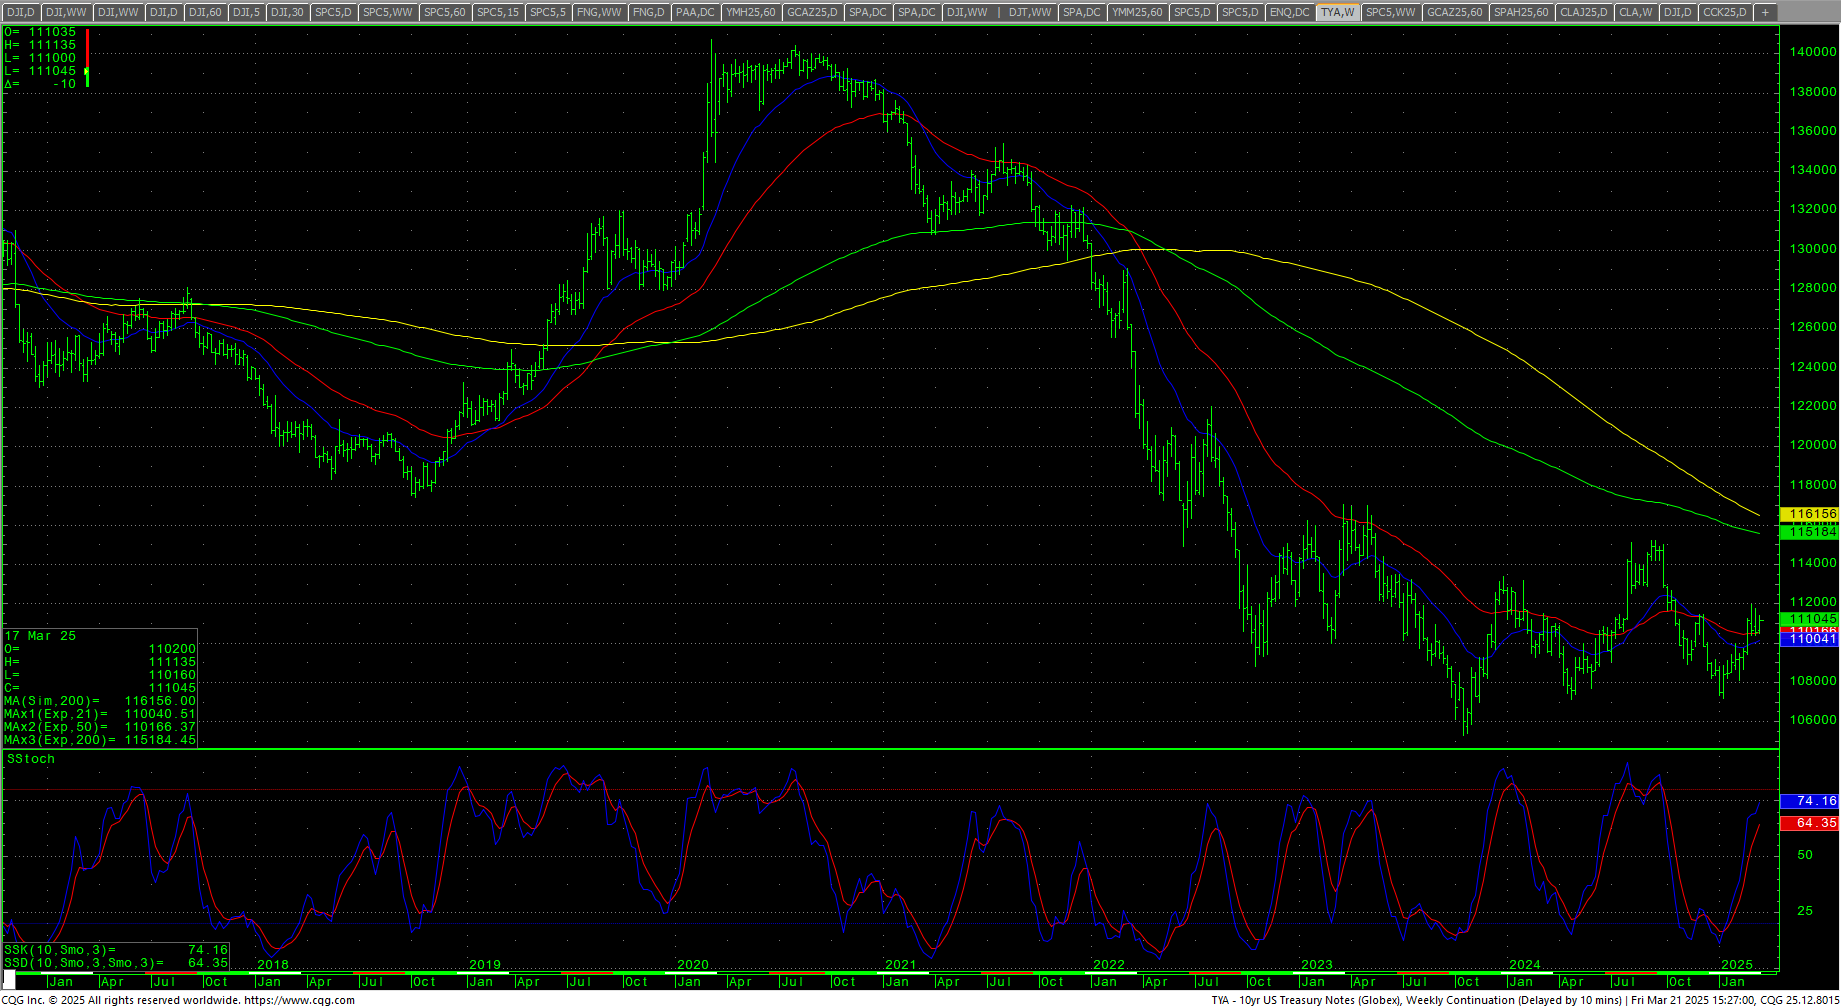
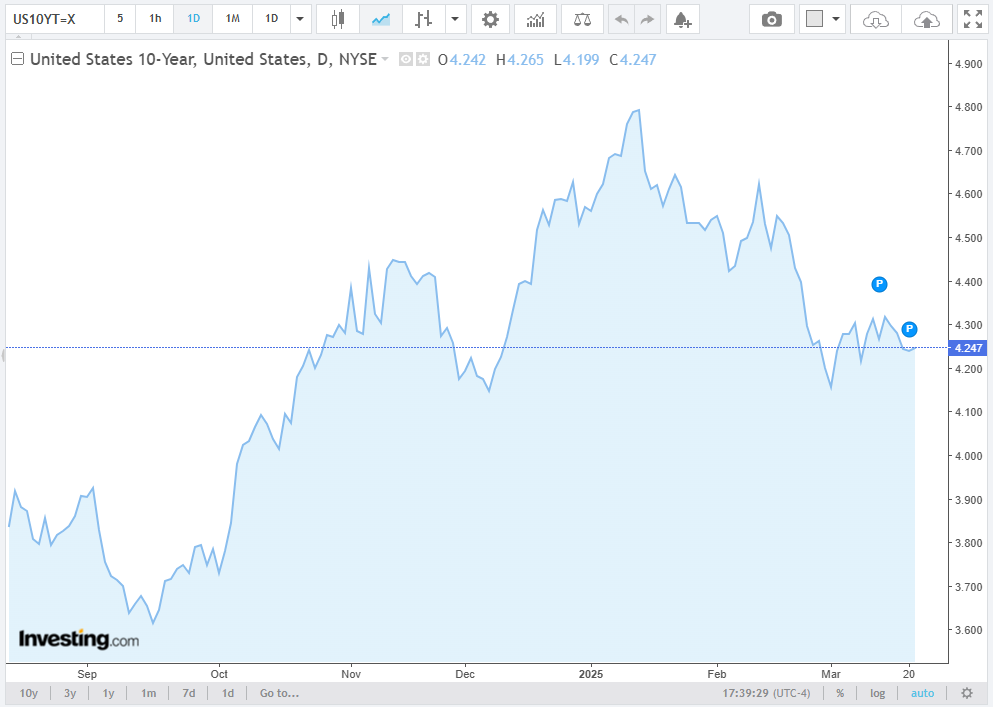
The RSP:SPY remains frozen in place for three weeks running. The IWM closed the week up slightly but on the bottom of the weekly range. The RSP traded an inside week and closed toward the middle of the range. NVDA reversed lower on the week and closed on the bottom of the weekly range. Bitcoin traded a tight range and settled toward the middle of the range as it builds a flagging pattern on the daily chart. McClellan Oscillators are neutral for the Dow. The Yield Curve closed higher on the week. The 10YR yield moved lower to 4.247%. Truflation increased to 1.72%.
10YR-2YR Yield Curve Daily

 VIX Weekly H-L-C
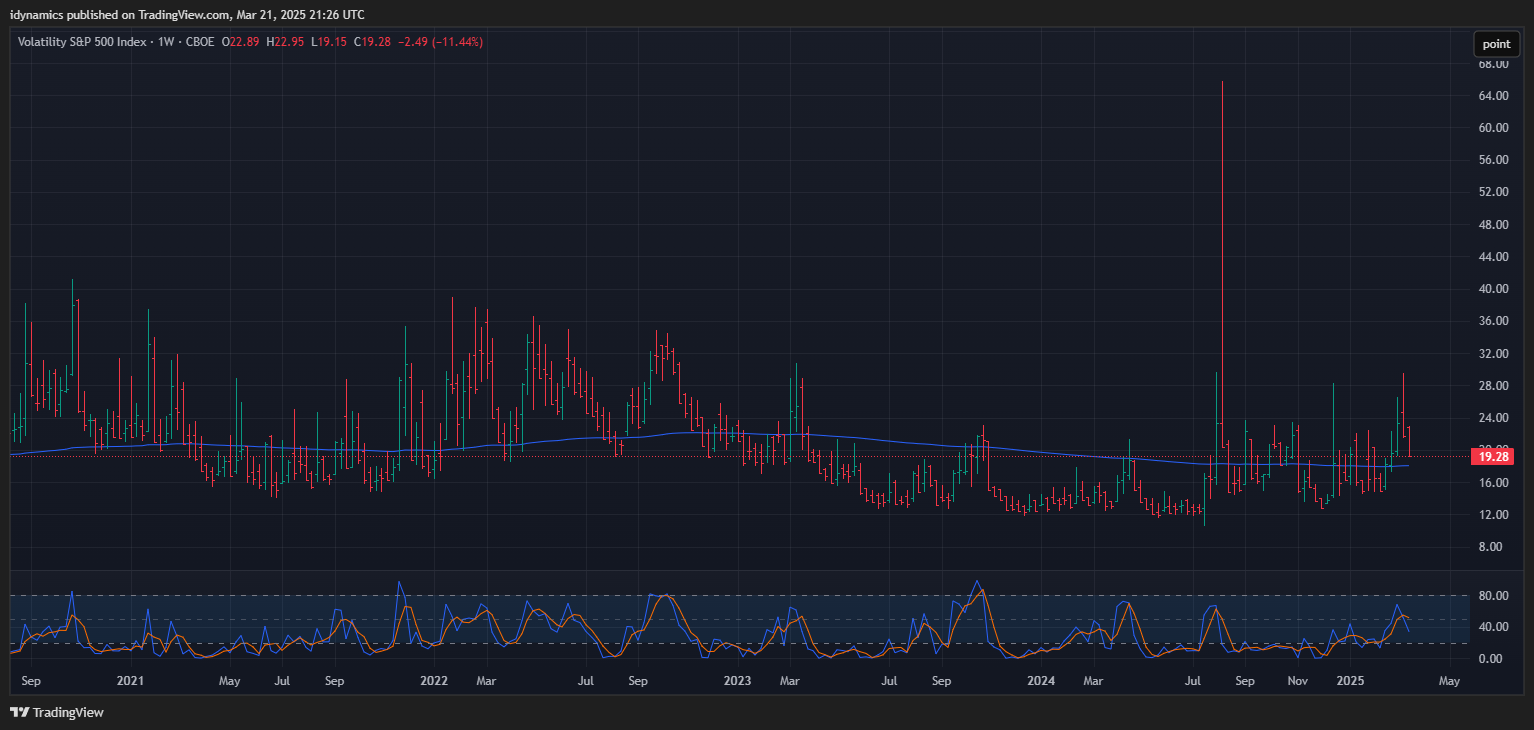
The VIX sold off all week and closed on the bottom of the range, back under the 20 level. The US Dollar traded an outside week up and closed on the top of the range.
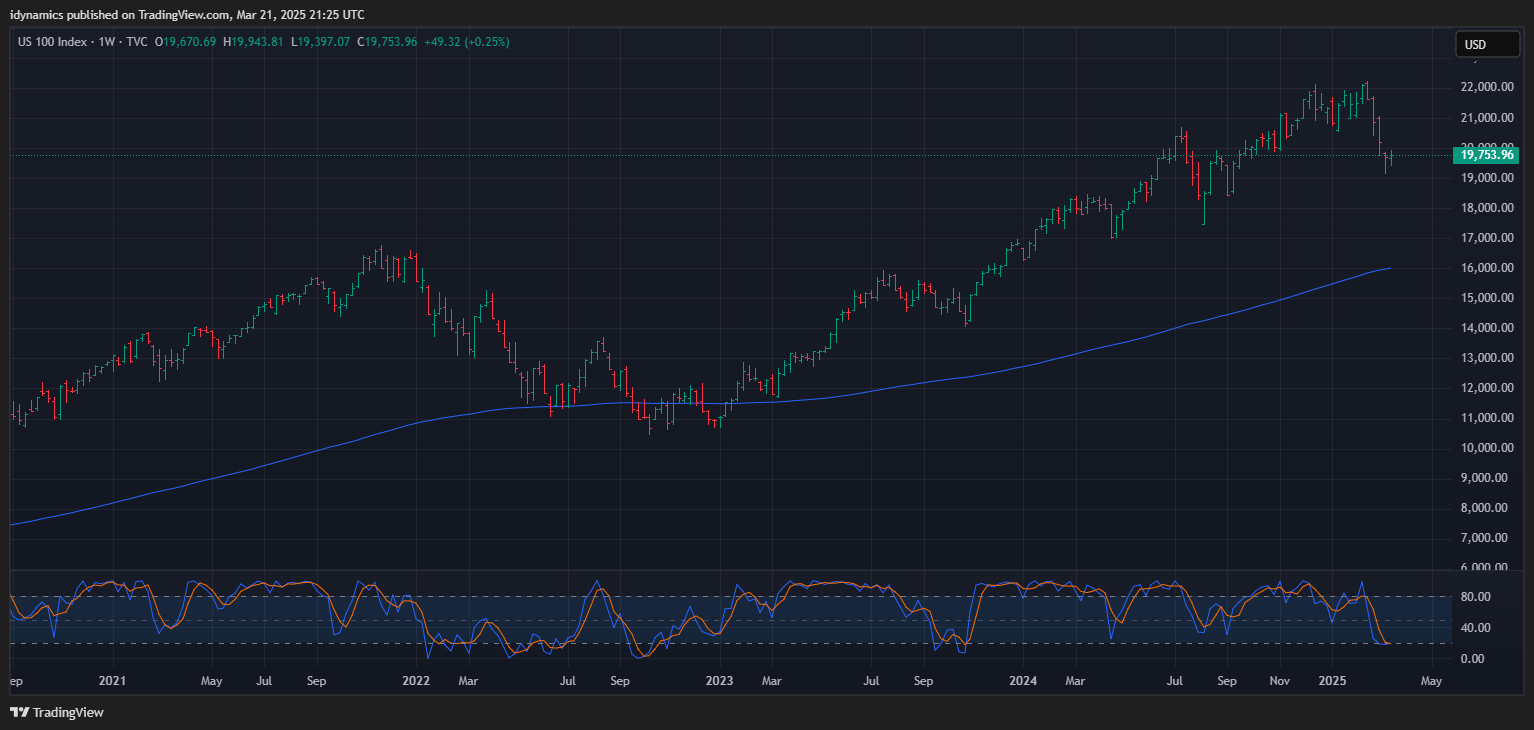
 Nasdaq 100 Weekly H-L-C
52-Week A/D Line
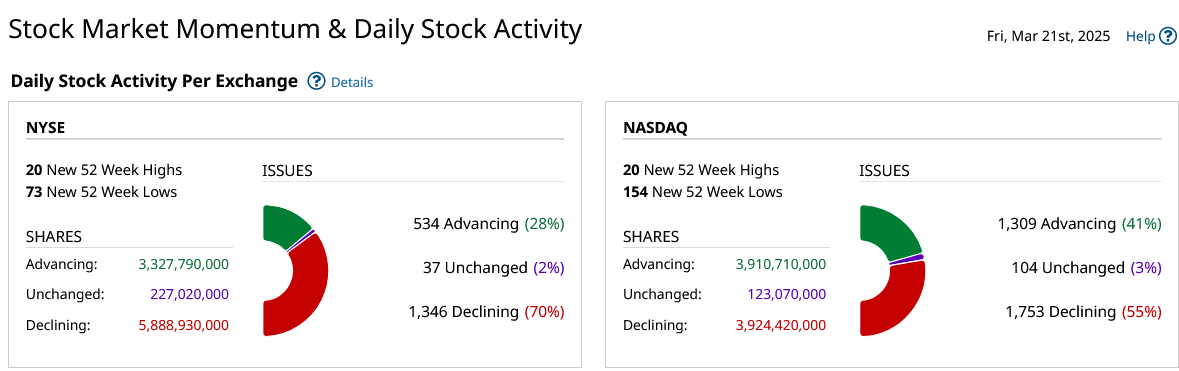
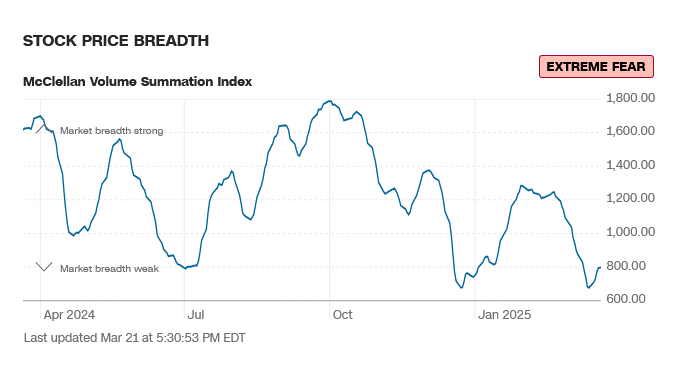
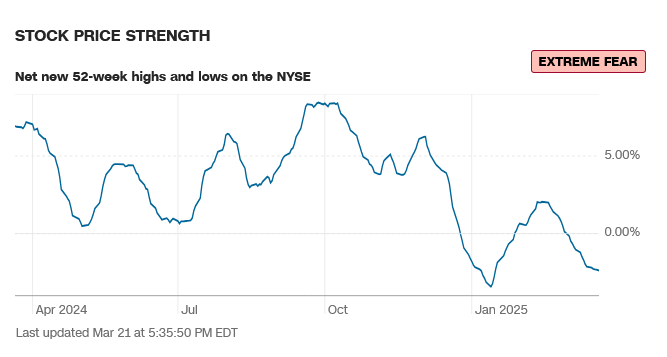
Breadth was mixed but weak on Friday, sentiment remains in extreme fear.
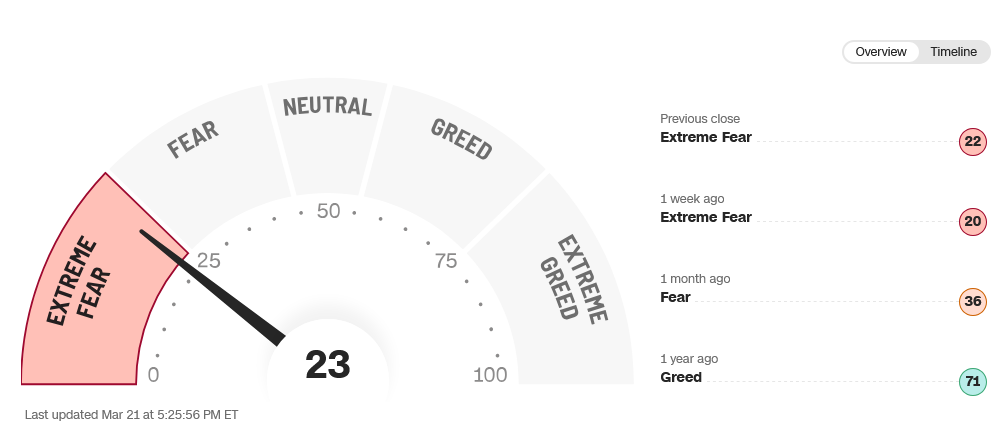
CNN Fear & Greed Index
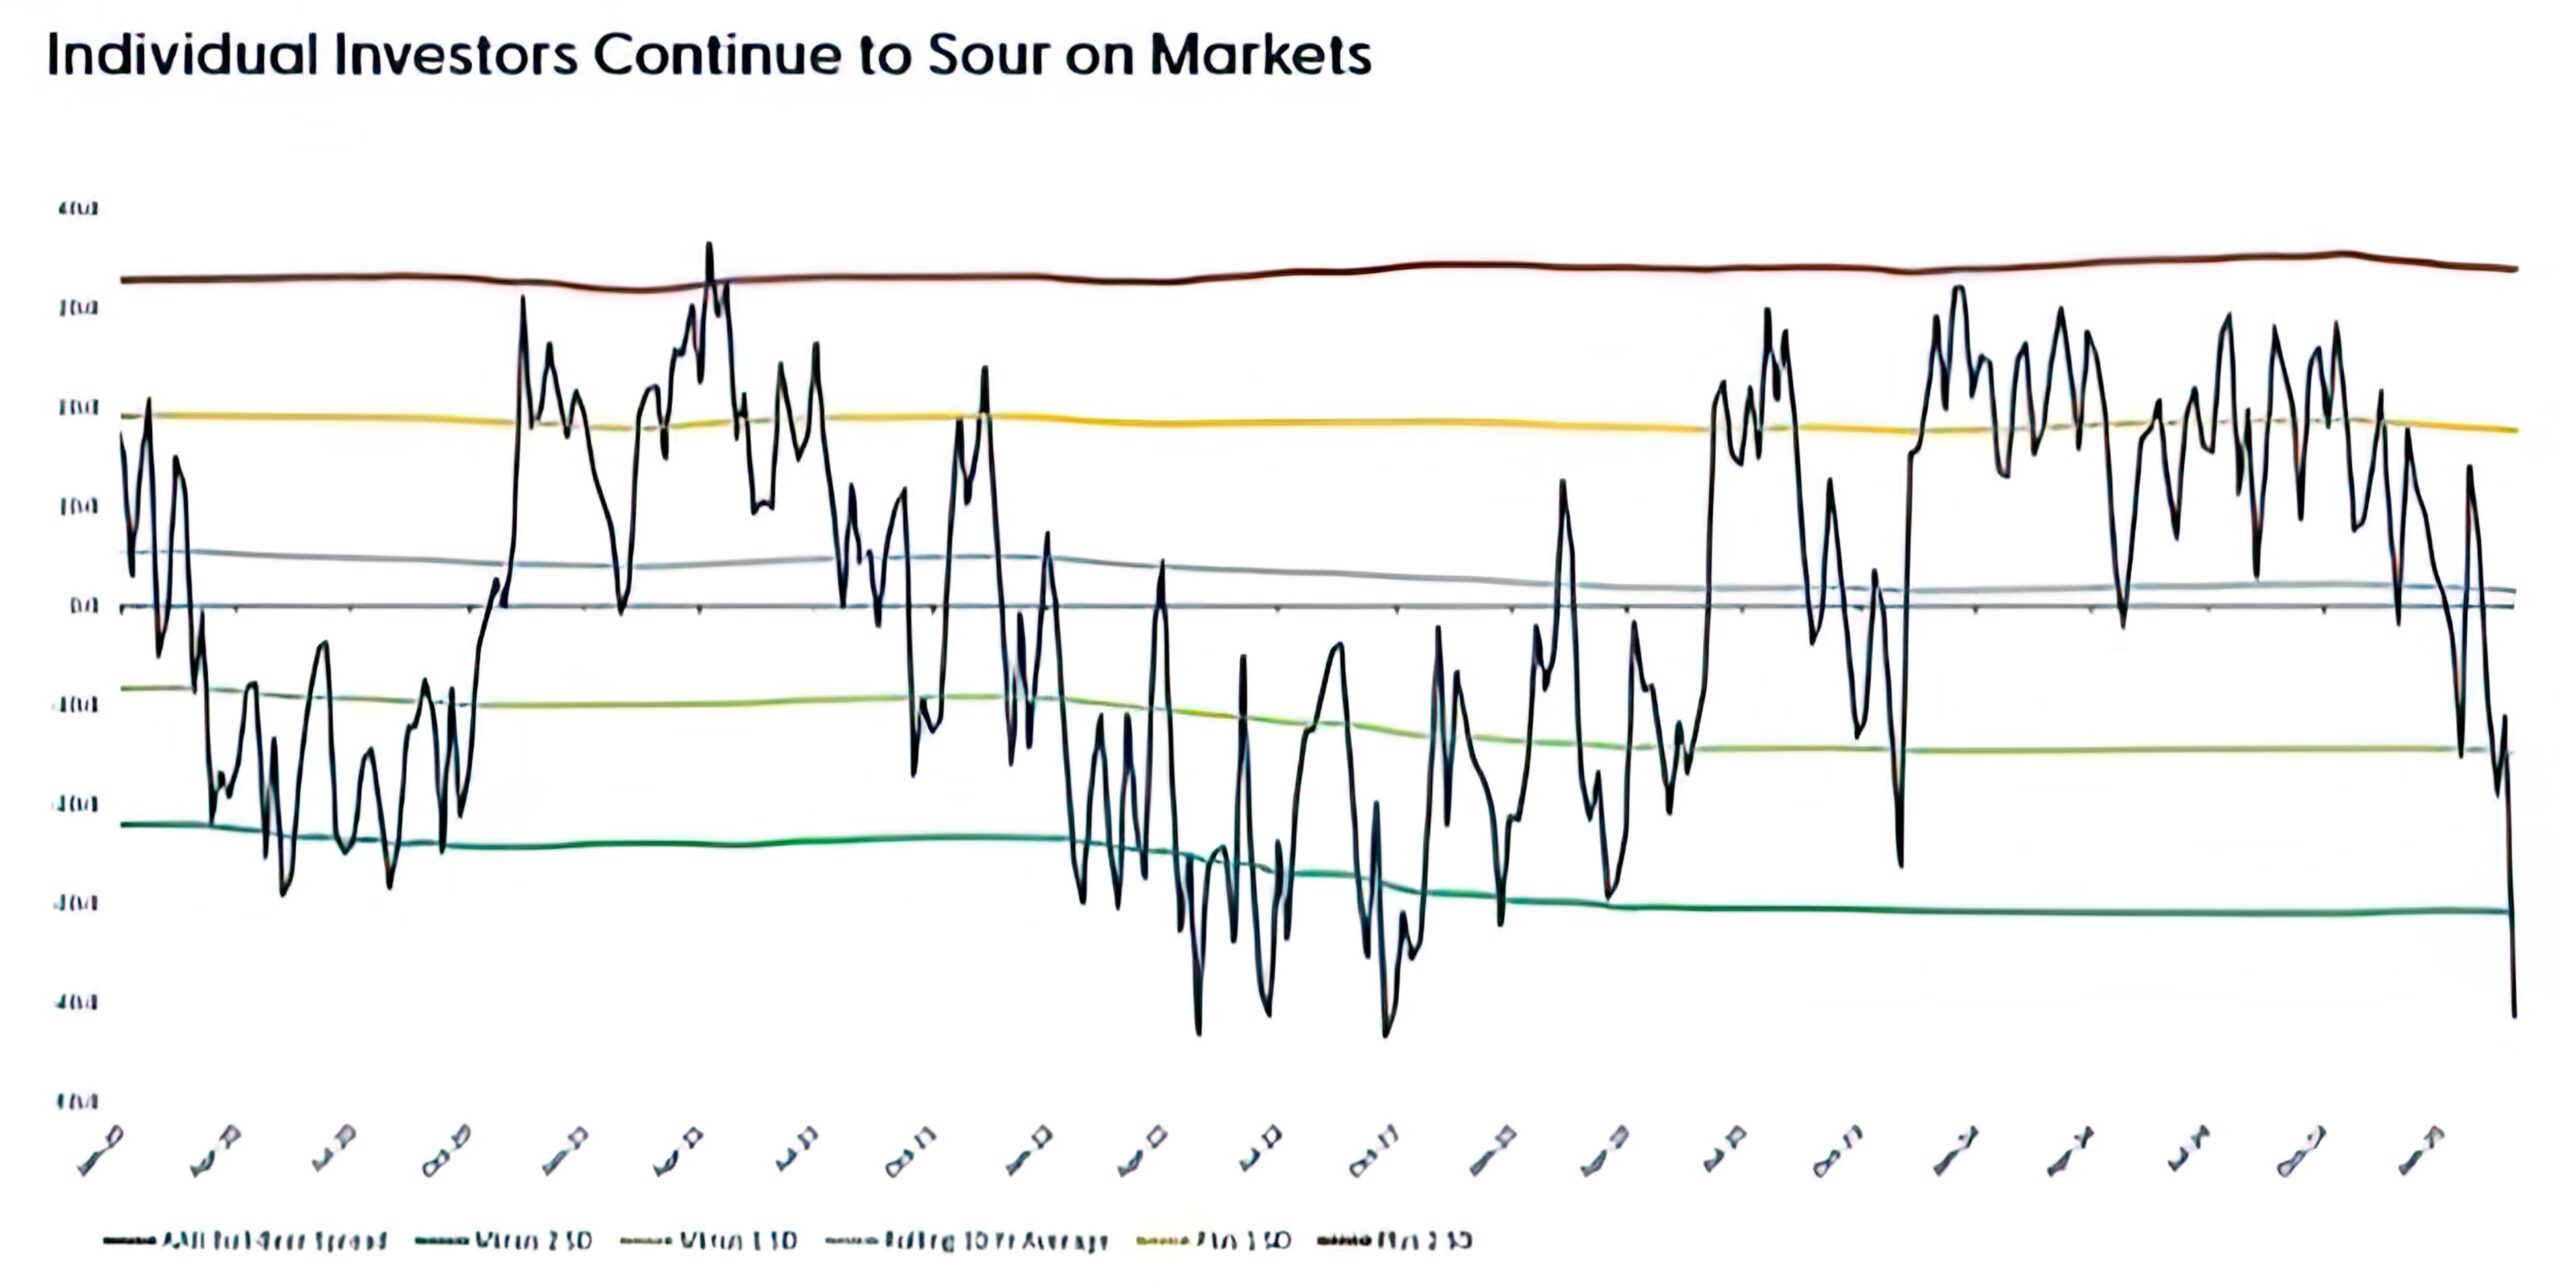
 AAII Investor Sentiment Survey
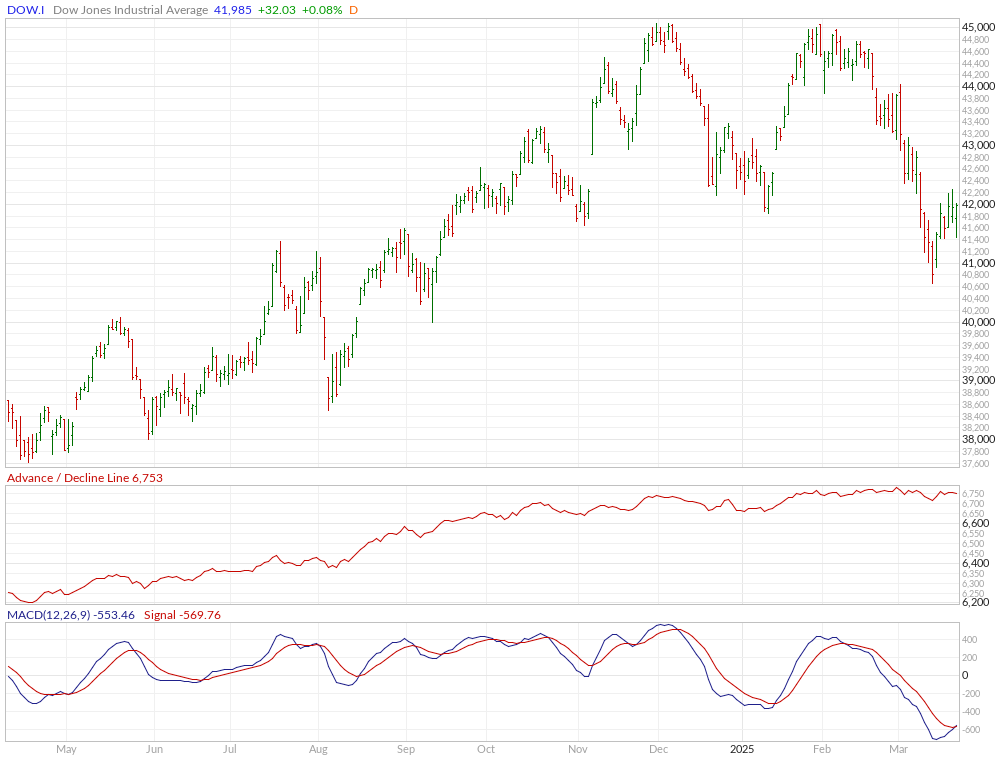
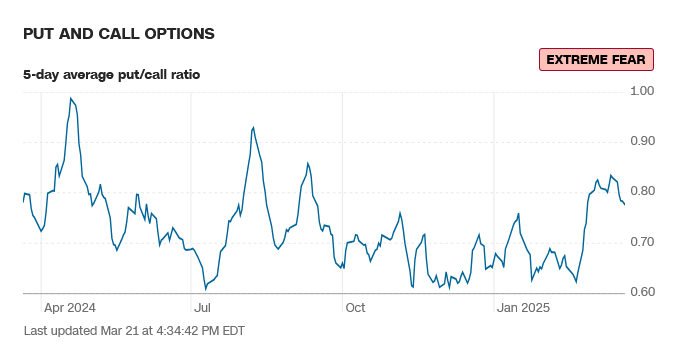
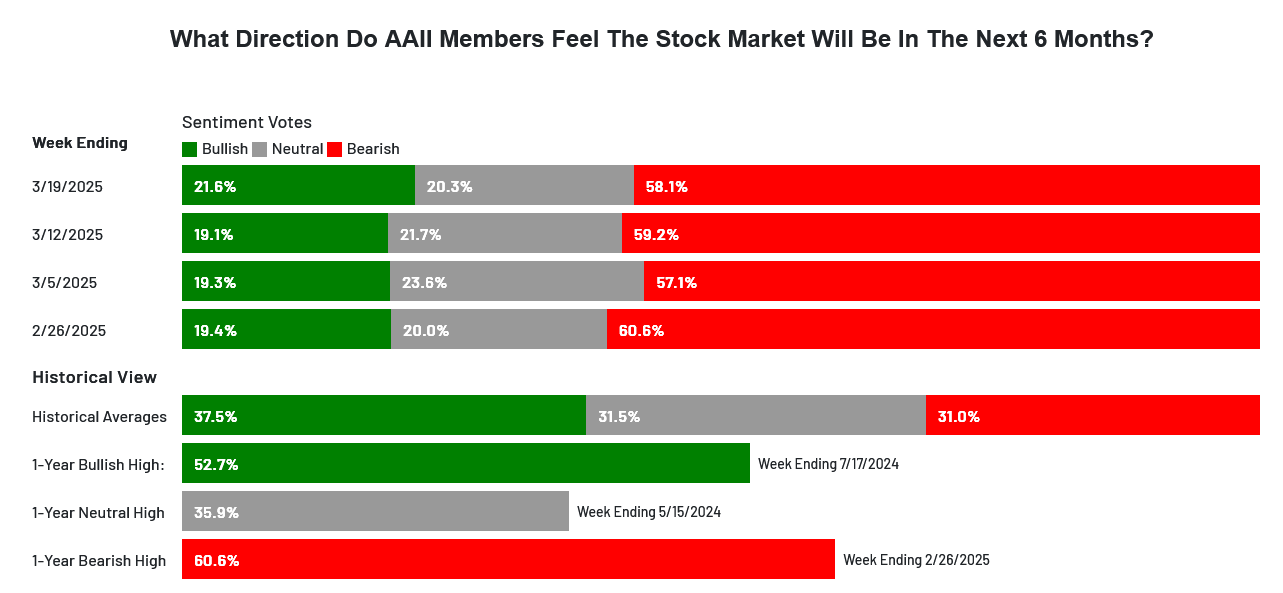 Sentiment remains in fear and extreme fear. The CNN Fear and Greed Index moved to 23 and still reads extreme fear. Breadth is mixed and reads extreme fear. Latest AAII Sentiment Survey: Optimism Creeps Up. The Dow A/D ended at 6753, the MACD remains down and is reaching oversold level. The VIX declined all week, closing on the low end of the week’s range. The Put/Call ended at 0.78 and reads extreme fear. The 52-week, A/D declined to -2.39% and reads extreme fear. The Dow closed the week up +1.20%, closing in the upper half of an inside week’s range. The S&P was up +0.51% in the middle of the range. The Nasdaq Composite closed up +0.17% and the Nasdaq 100 was up +0.25%. The FANG settled down -0.01% as it recovered in Friday’s trade. The Russell was up +0.63% in the middle of the range. The 10-year notes closed higher in the upper end of an inside week’s range. The yield on the 10YR decreased to 4.247%.
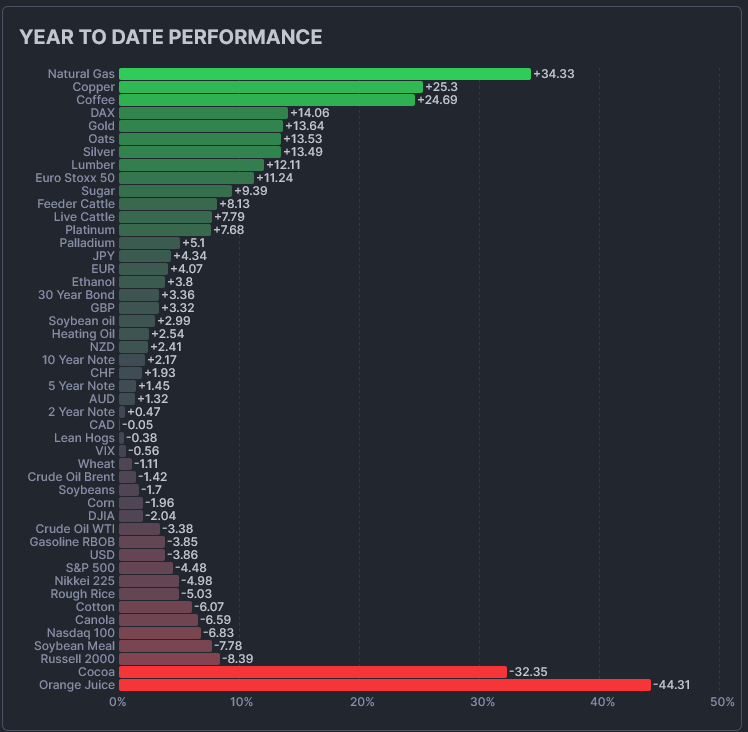
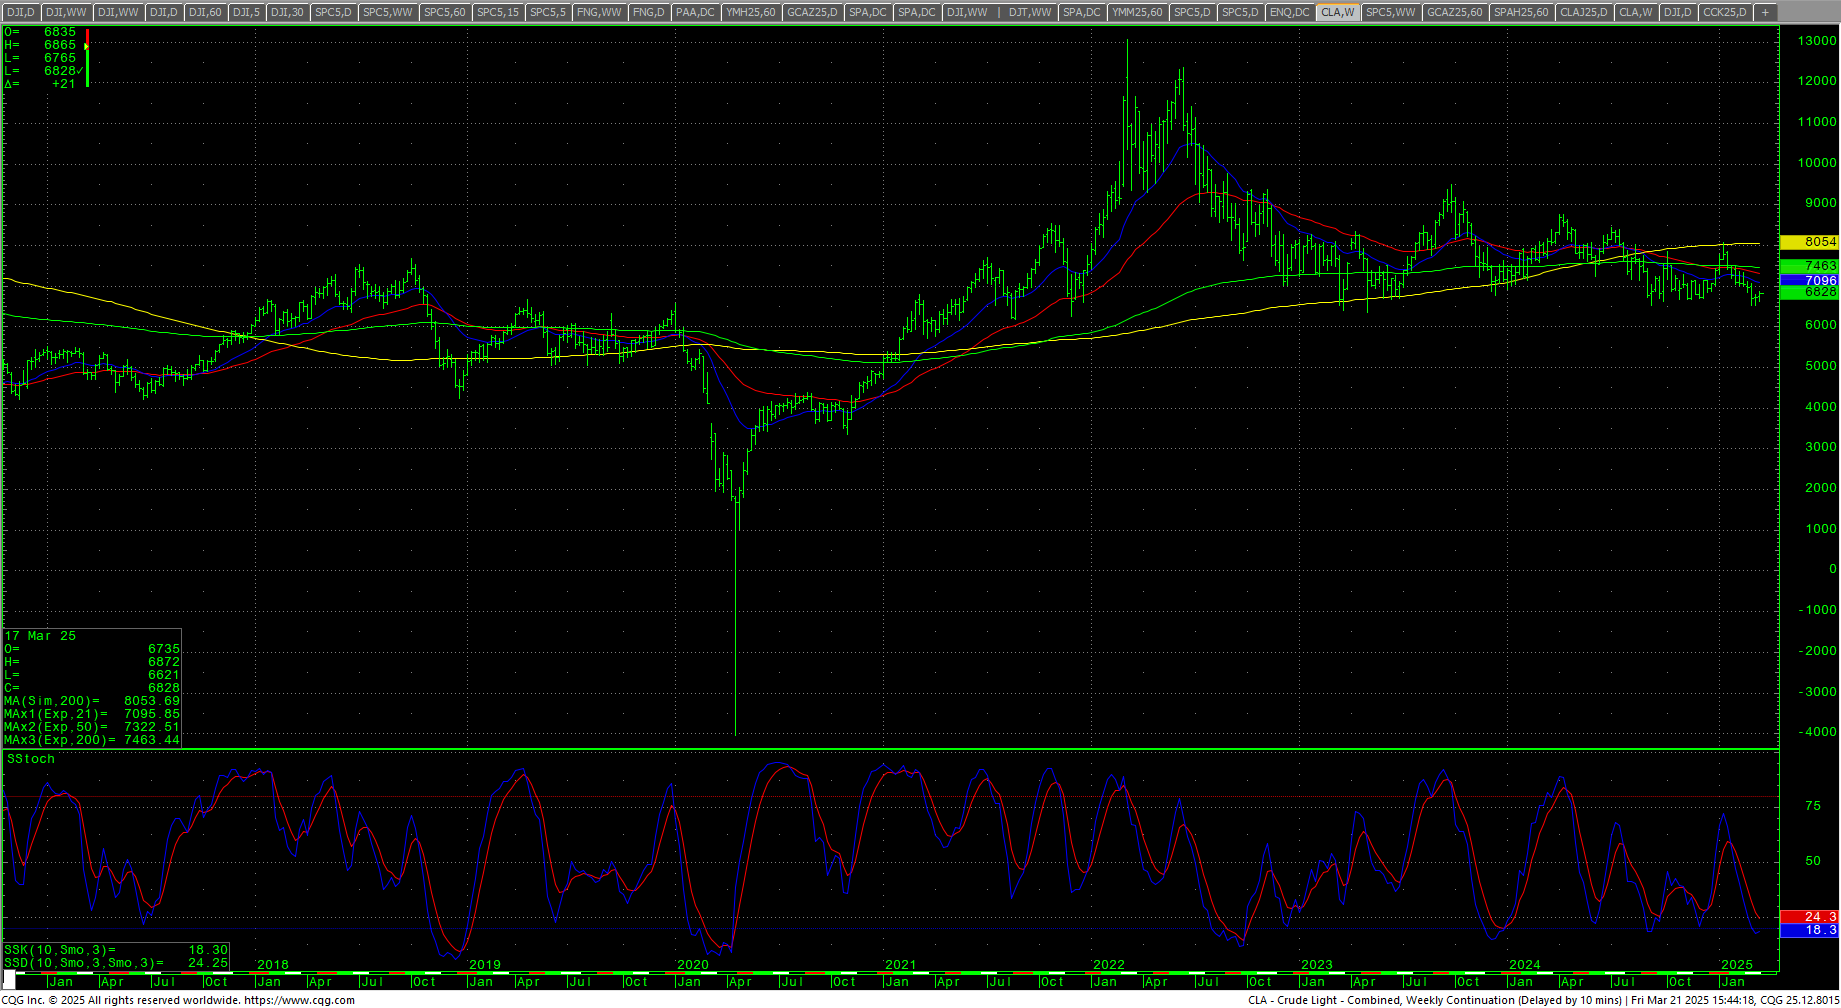
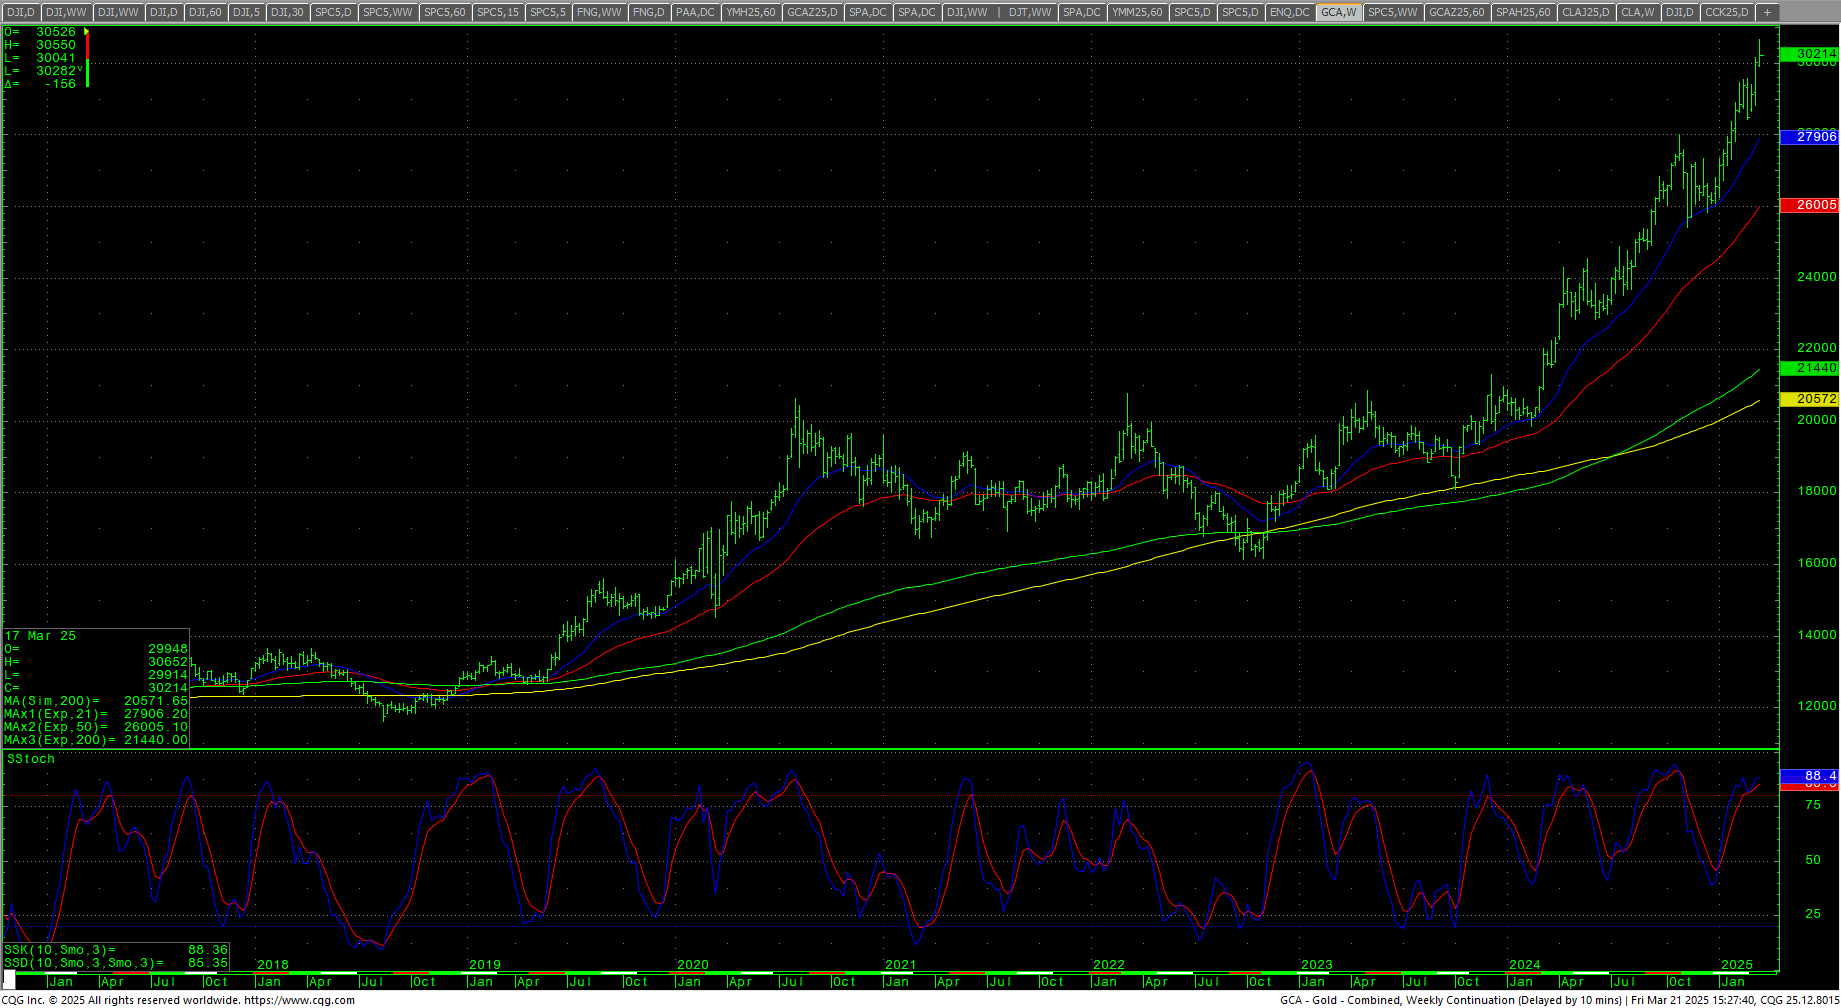
The CRB Index ended higher with gold moving above $3000, closing up +1.53%. Crude oil closed up slightly on the top end of another tight range as it remains under the $70 level. Gold rallied to record highs but sold off on Friday, closing a a record high weekly close above the $3000 level. The CoT for the S&P 500 saw non-commercials increasing their holdings while commercials sold. The CFTC S&P 500 Non-Commercial Net Positions ended at +68.3K and shows shorts exiting the market. Sellers still have a 6-day window.
Timing Points
This week marks CRITICAL timing all week with the focus on Thursday/Friday. Thursday we will get revised Q4 GDP, Balance of Trade and Pending Home Sales. Friday is the PCE report. 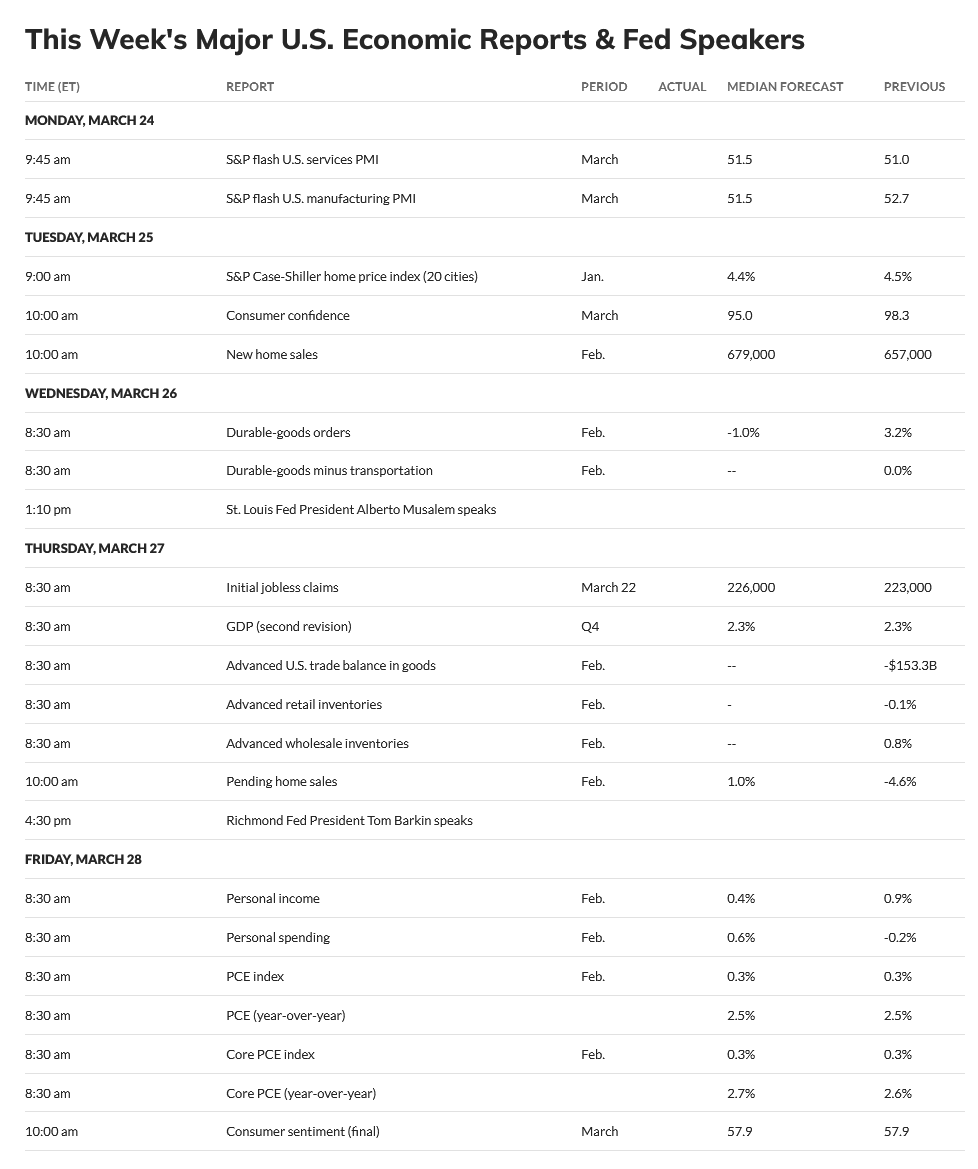
- 03/27-28 *** X critical week with potential for increased ranges/volatility
- 04/07 **
- 04/12 **
Dow Jones Industrial Average
Dow Jones Industrial Average Weekly Candles
 The Dow closed right on the 200-day MA in a reversal Friday as the daily maps out a flag off the recent declines. The current double-top pattern is offering lower targets in the 38634 level. RSI got back over 40 and the stochastics hooked up while the MACD reaches oversold levels. The 21-day MA is under both the 50-day MA and the 100-day MA and the 50-day MA has crossed under the 100-day MA. The weekly is in a sell signal. The hourly ended the week neutral with Friday’s rally. The 200-day MA starts the week at 41985. The action leaves most of the number basically the same.
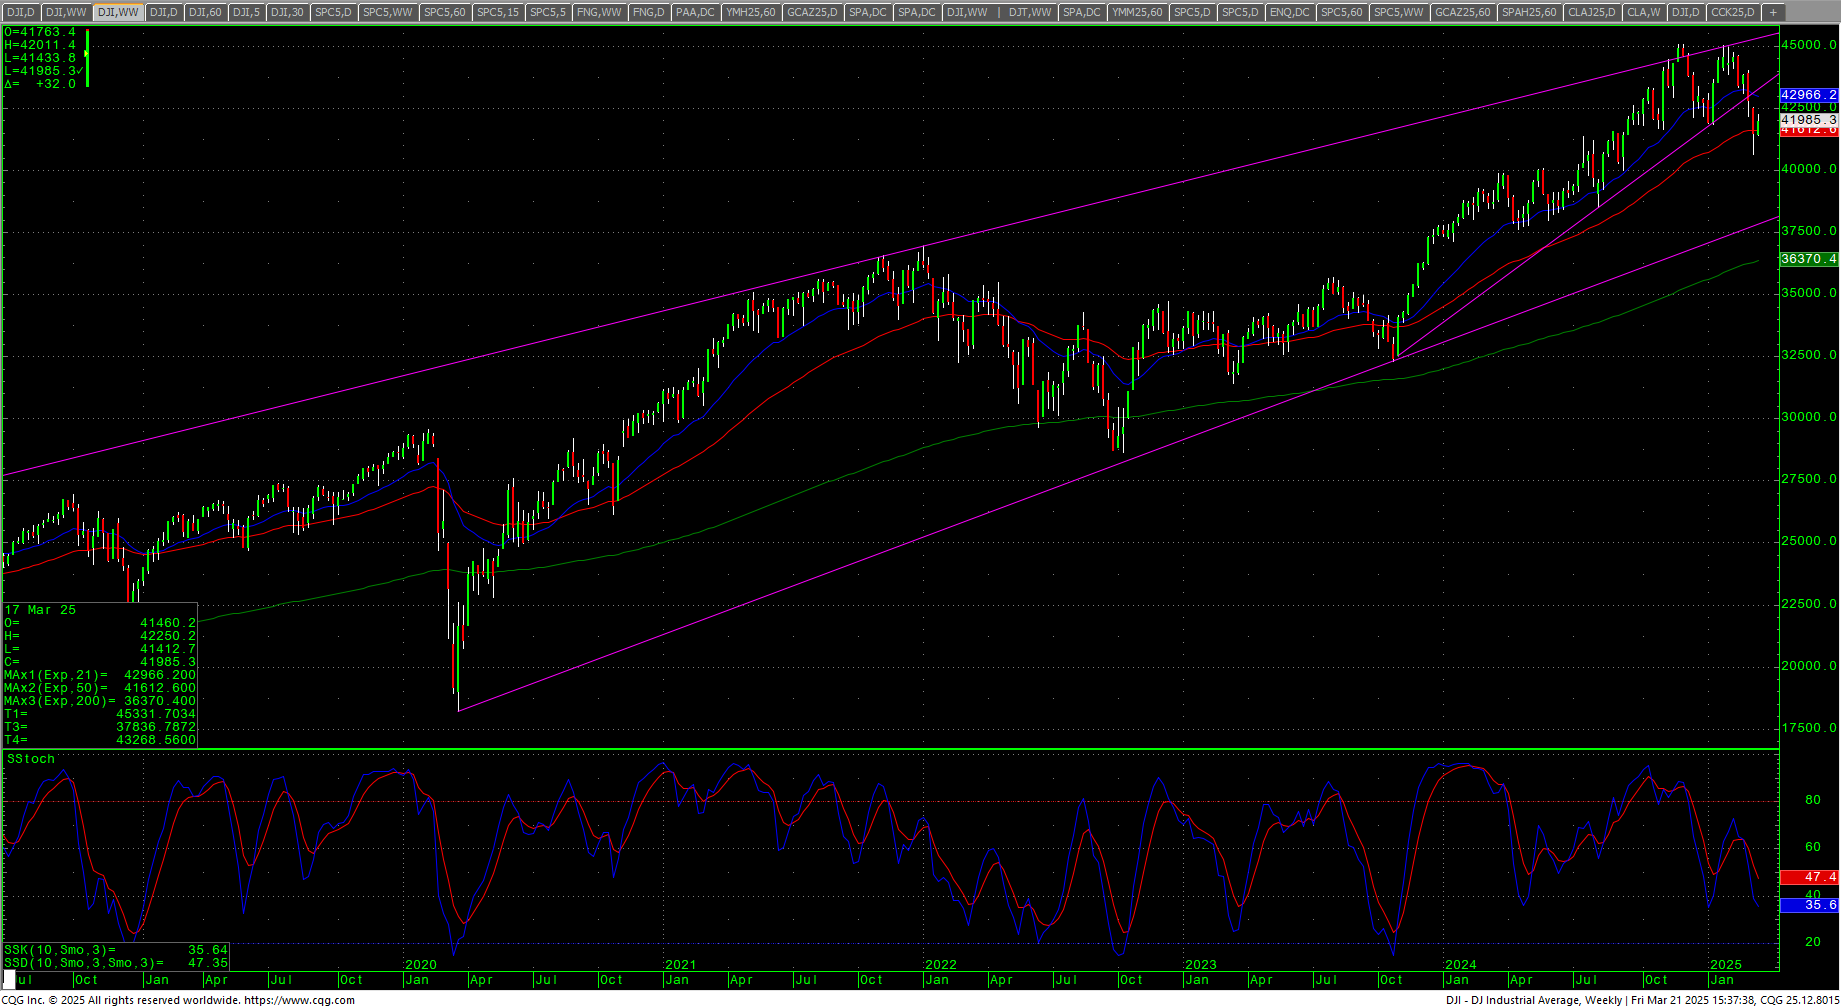
Dow Jones Industrial Average Weekly H-L-C
 Support is 41875 and 41643. Under 41643 can test 41455 with potential to 41268/41265. Under 41265 sets up 41058/41036. A breakdown under 41036 sets up 40824 with potential to retest 40665/40661. Closes under 40661 open counts to 40008/39993 area with key support at 40338 and 40204/40200. A breakdown under 39993 sets up a decline to 38734/38634 (targets) with support at 39737/39720. Closes under 38634 opens counts to 37196/37190 with support of 38499, 38400 and 37611.
Dow Jones Industrial Average Hourly H-L-C
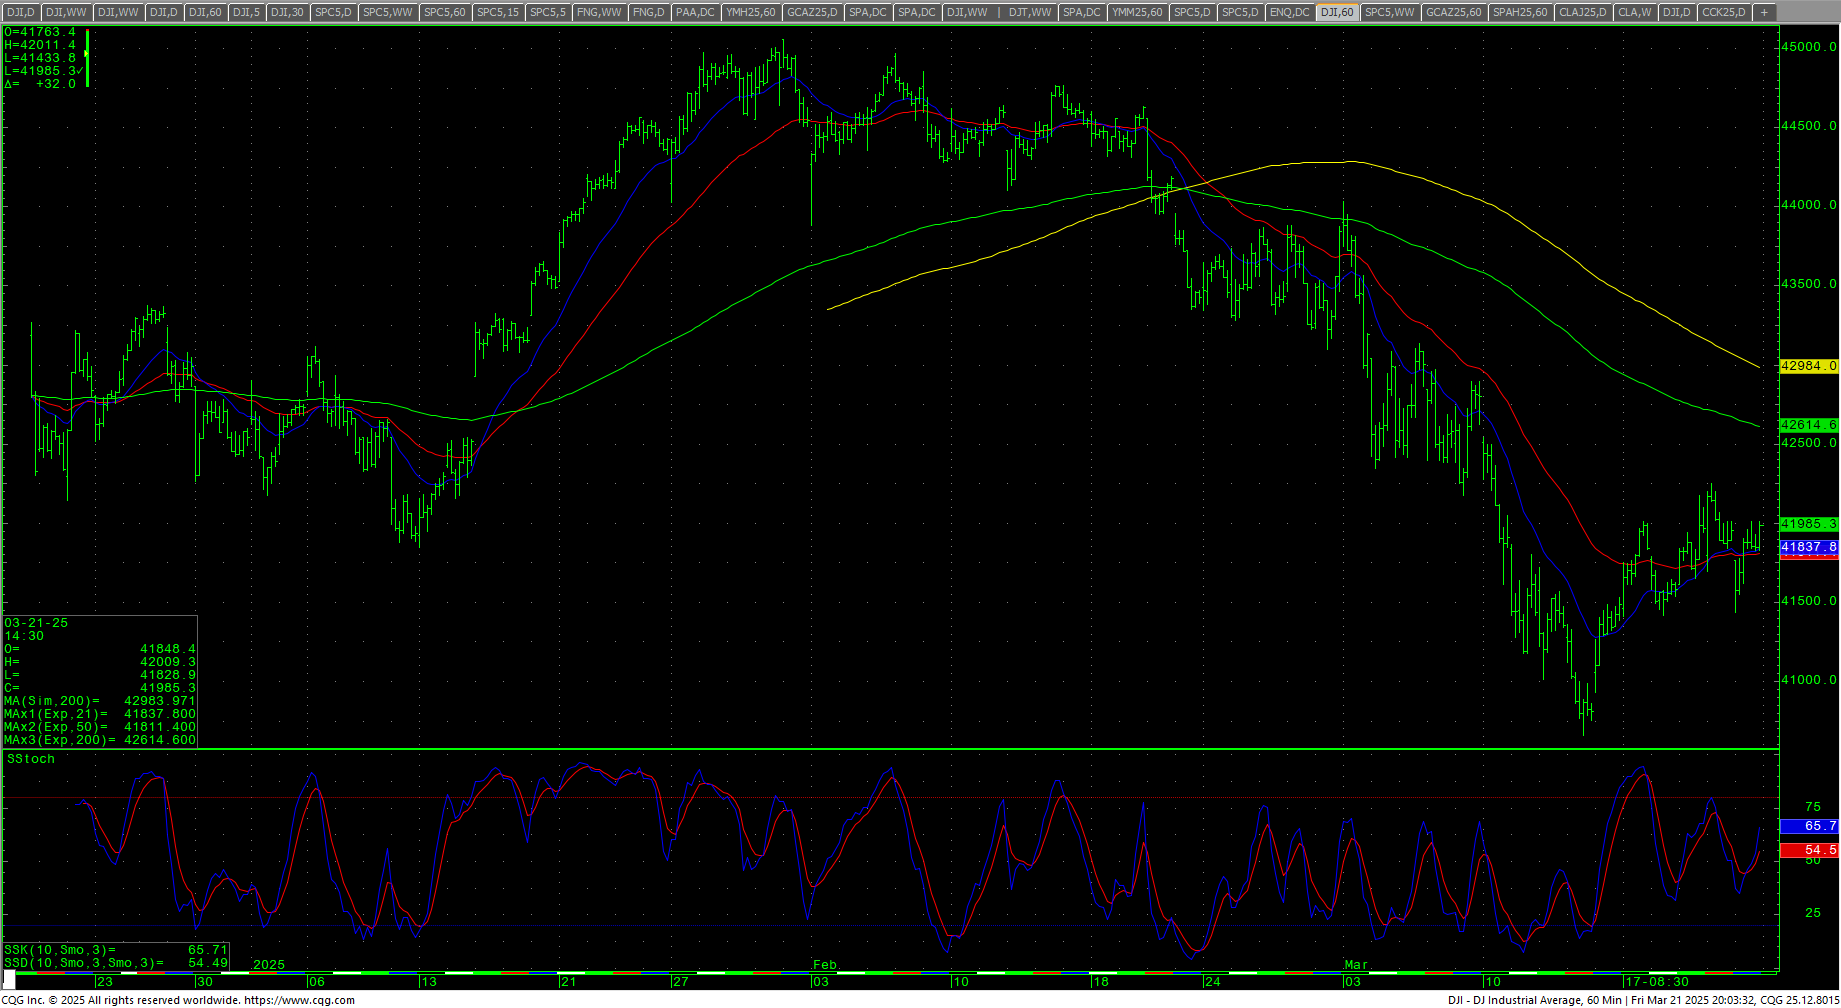 Resistance is pivotal short-term at 42339/42347. A breakout above the 42347 area sets up 42506 with counts to 42745/42750 and 42858. A drive above 42858 sets up 43190 and 43237 with critical resistance at 43376/43380. Closes over 43380 sets up 43956 through 44017. A breakout with closes over 44017 opens longer-term potential toward the intraday trading highs against the 45054/45074 level. Closes over 45074 opens counts toward 45244 and 45426 (Fibonacci target).
| Resistance | Support |
|
|
S&P 500 Cash Index: SPX
S&P 500 Index Weekly H-L-C
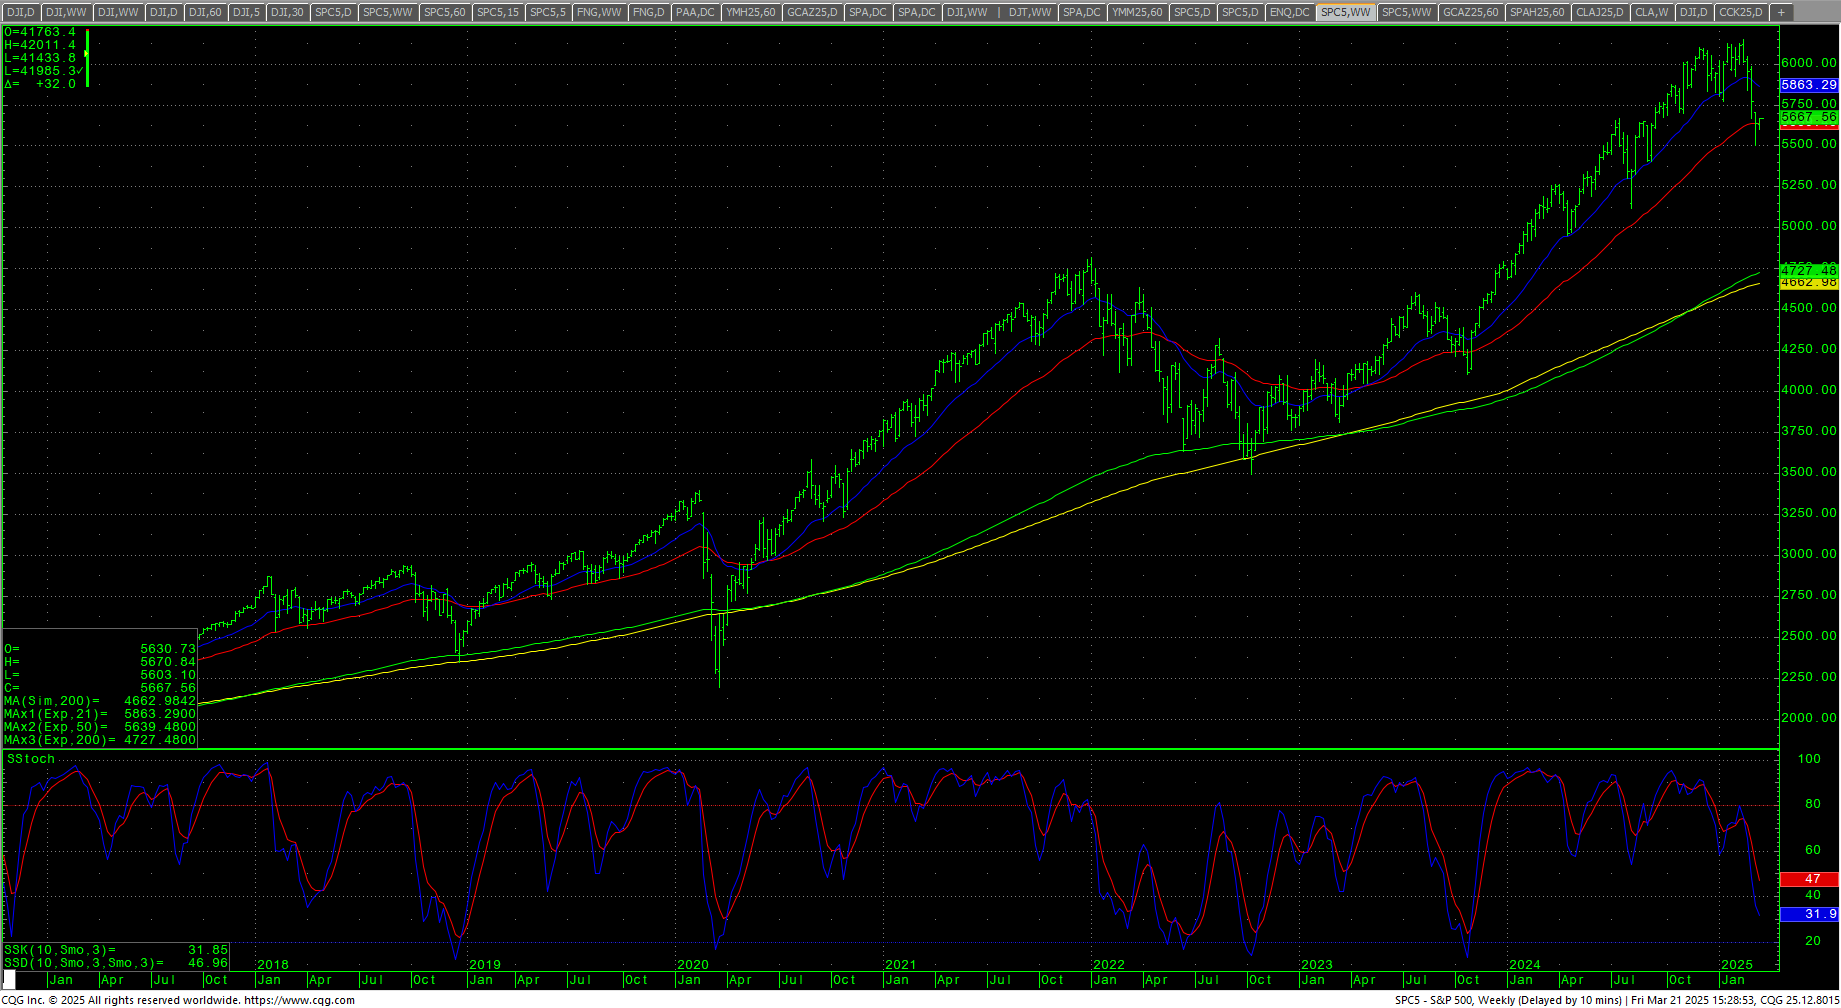 The S&P continues to flag off to the side of the recent selloff that took the market to a decline to -10% from the ATH. The daily stochastics have hooked up, the RSI is back over 40 and the MACD is oversold. The index remains under the 200-day MA. The weekly stochastics are in a sell signal. The hourly ended neutral with Friday’s rally. The 200-day MA is 5702.38 and is now trending down. The last time the 200-day was heading down was October 2023. Most of the number remain the same.
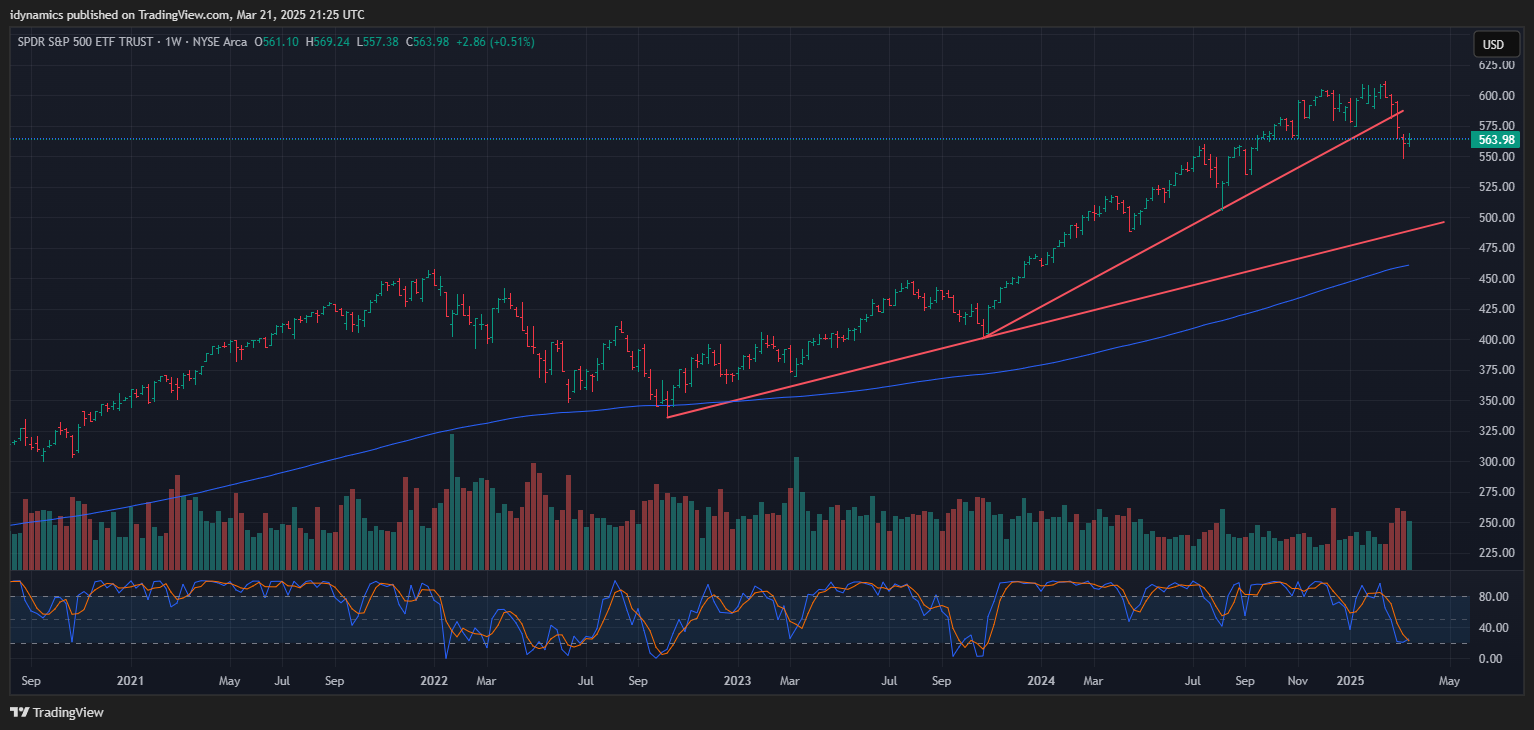
SPY Weekly
 The hourly ended the week neutral as prices test resistance of 5706/5715. A drive above 5715 can test 5745/5750. A breakout over 5750 sets up 5826 with counts to 5901/5904. Closes over 5904 count to 5987/5996. Daily closes over 5996 suggest 6043 and opens counts to 6112/6114 and full counts into critical resistance at the intraday high of 6147.43. Rallies through 6148 should test 6160 with a shot at a target of 6180.35. A drive with closes over 6181 can test 6206 with pivotal resistance at 6224. A drive over 6224 will open potential to the 6278.80 objectives with a shot at 6296. Above 6296 can carry to 6368 with counts into the 6440 area. Closes over 6440 will open counts to 6584.
S&P 500 Index Hourly H-L-C
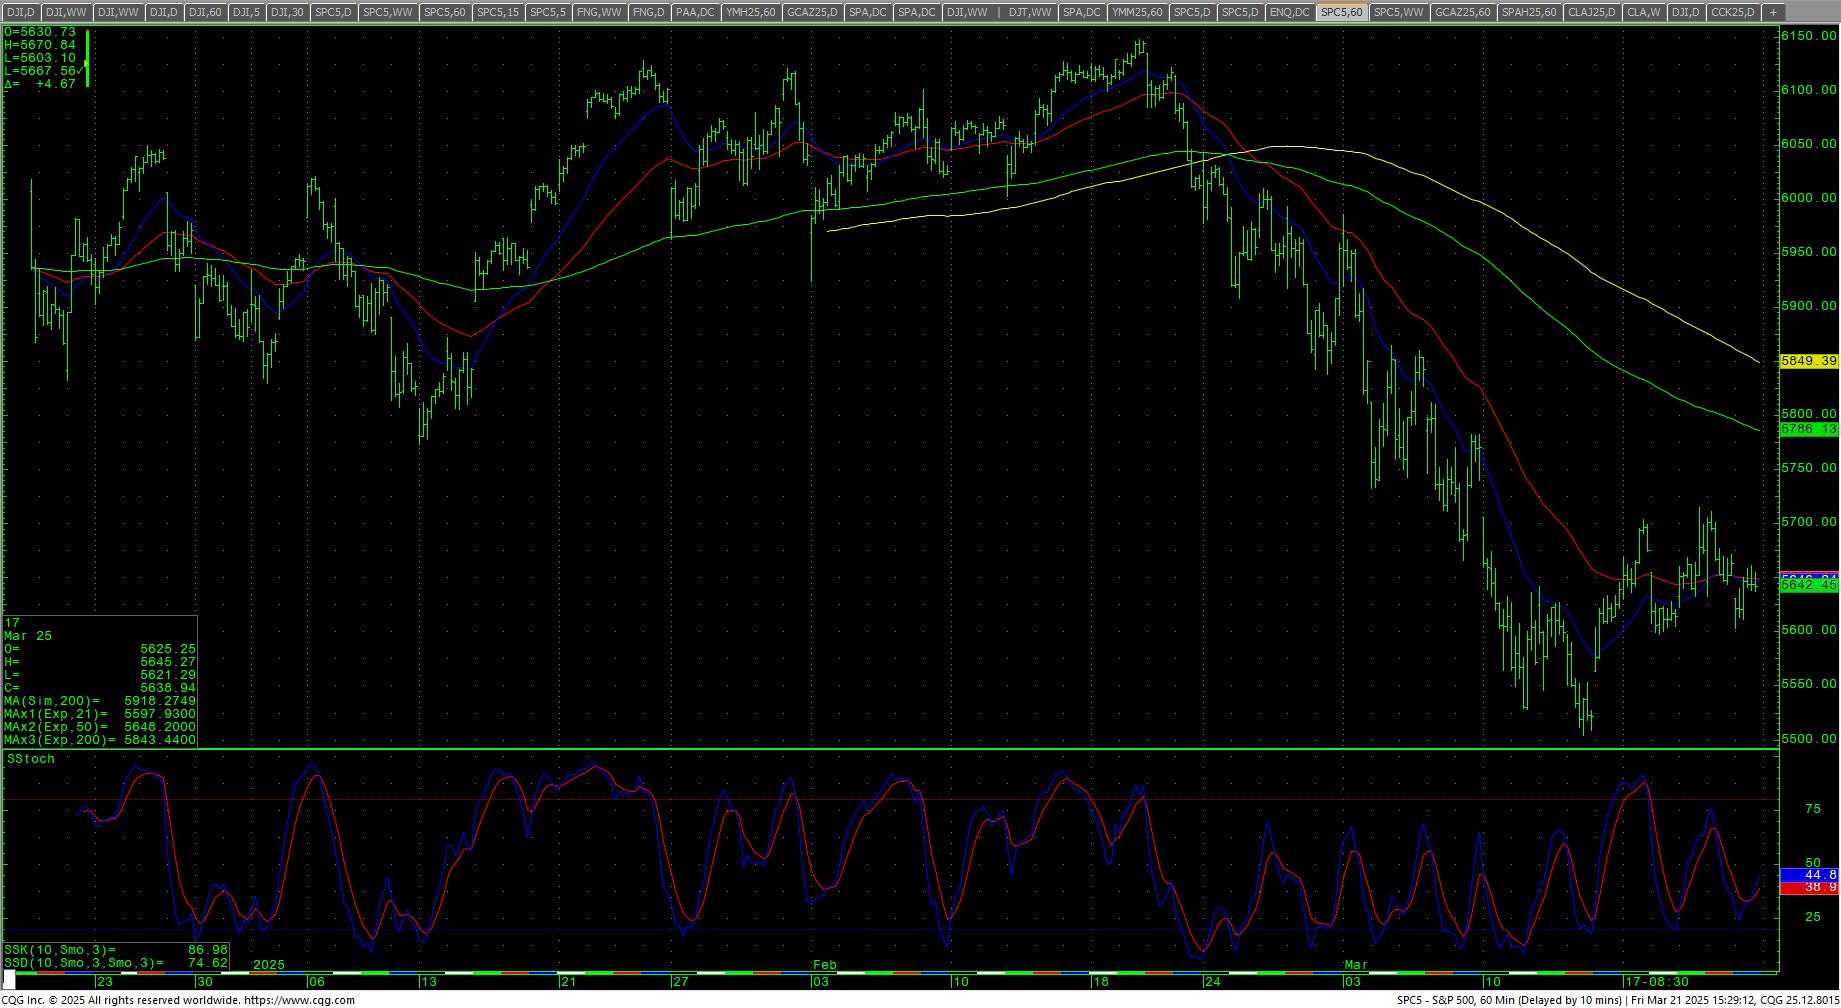 Support is 5634, 5610/5609 and pivotal short-term at 5585/5582. A breakdown under 5582 should test 5557/5554 with counts to 5505/5504. Closes under 5504 can test critical short-term support of 5367/5350 with support at 5493/5490. Daily closes under 5350 sets up 5289 and 5244/5240 with full counts to 5125/5119. Closes under 5199 will open counts into the 4884/4880 area. Closes under 4880 are bearish and open counts to 4614 through 4586.
| Resistance | Support |
|
|
Charts courtesy of CQG, Inc., CNN, Koyfin, Trading View and AAII