
TECHNICAL ANALYSIS (by Intraday Dynamics)
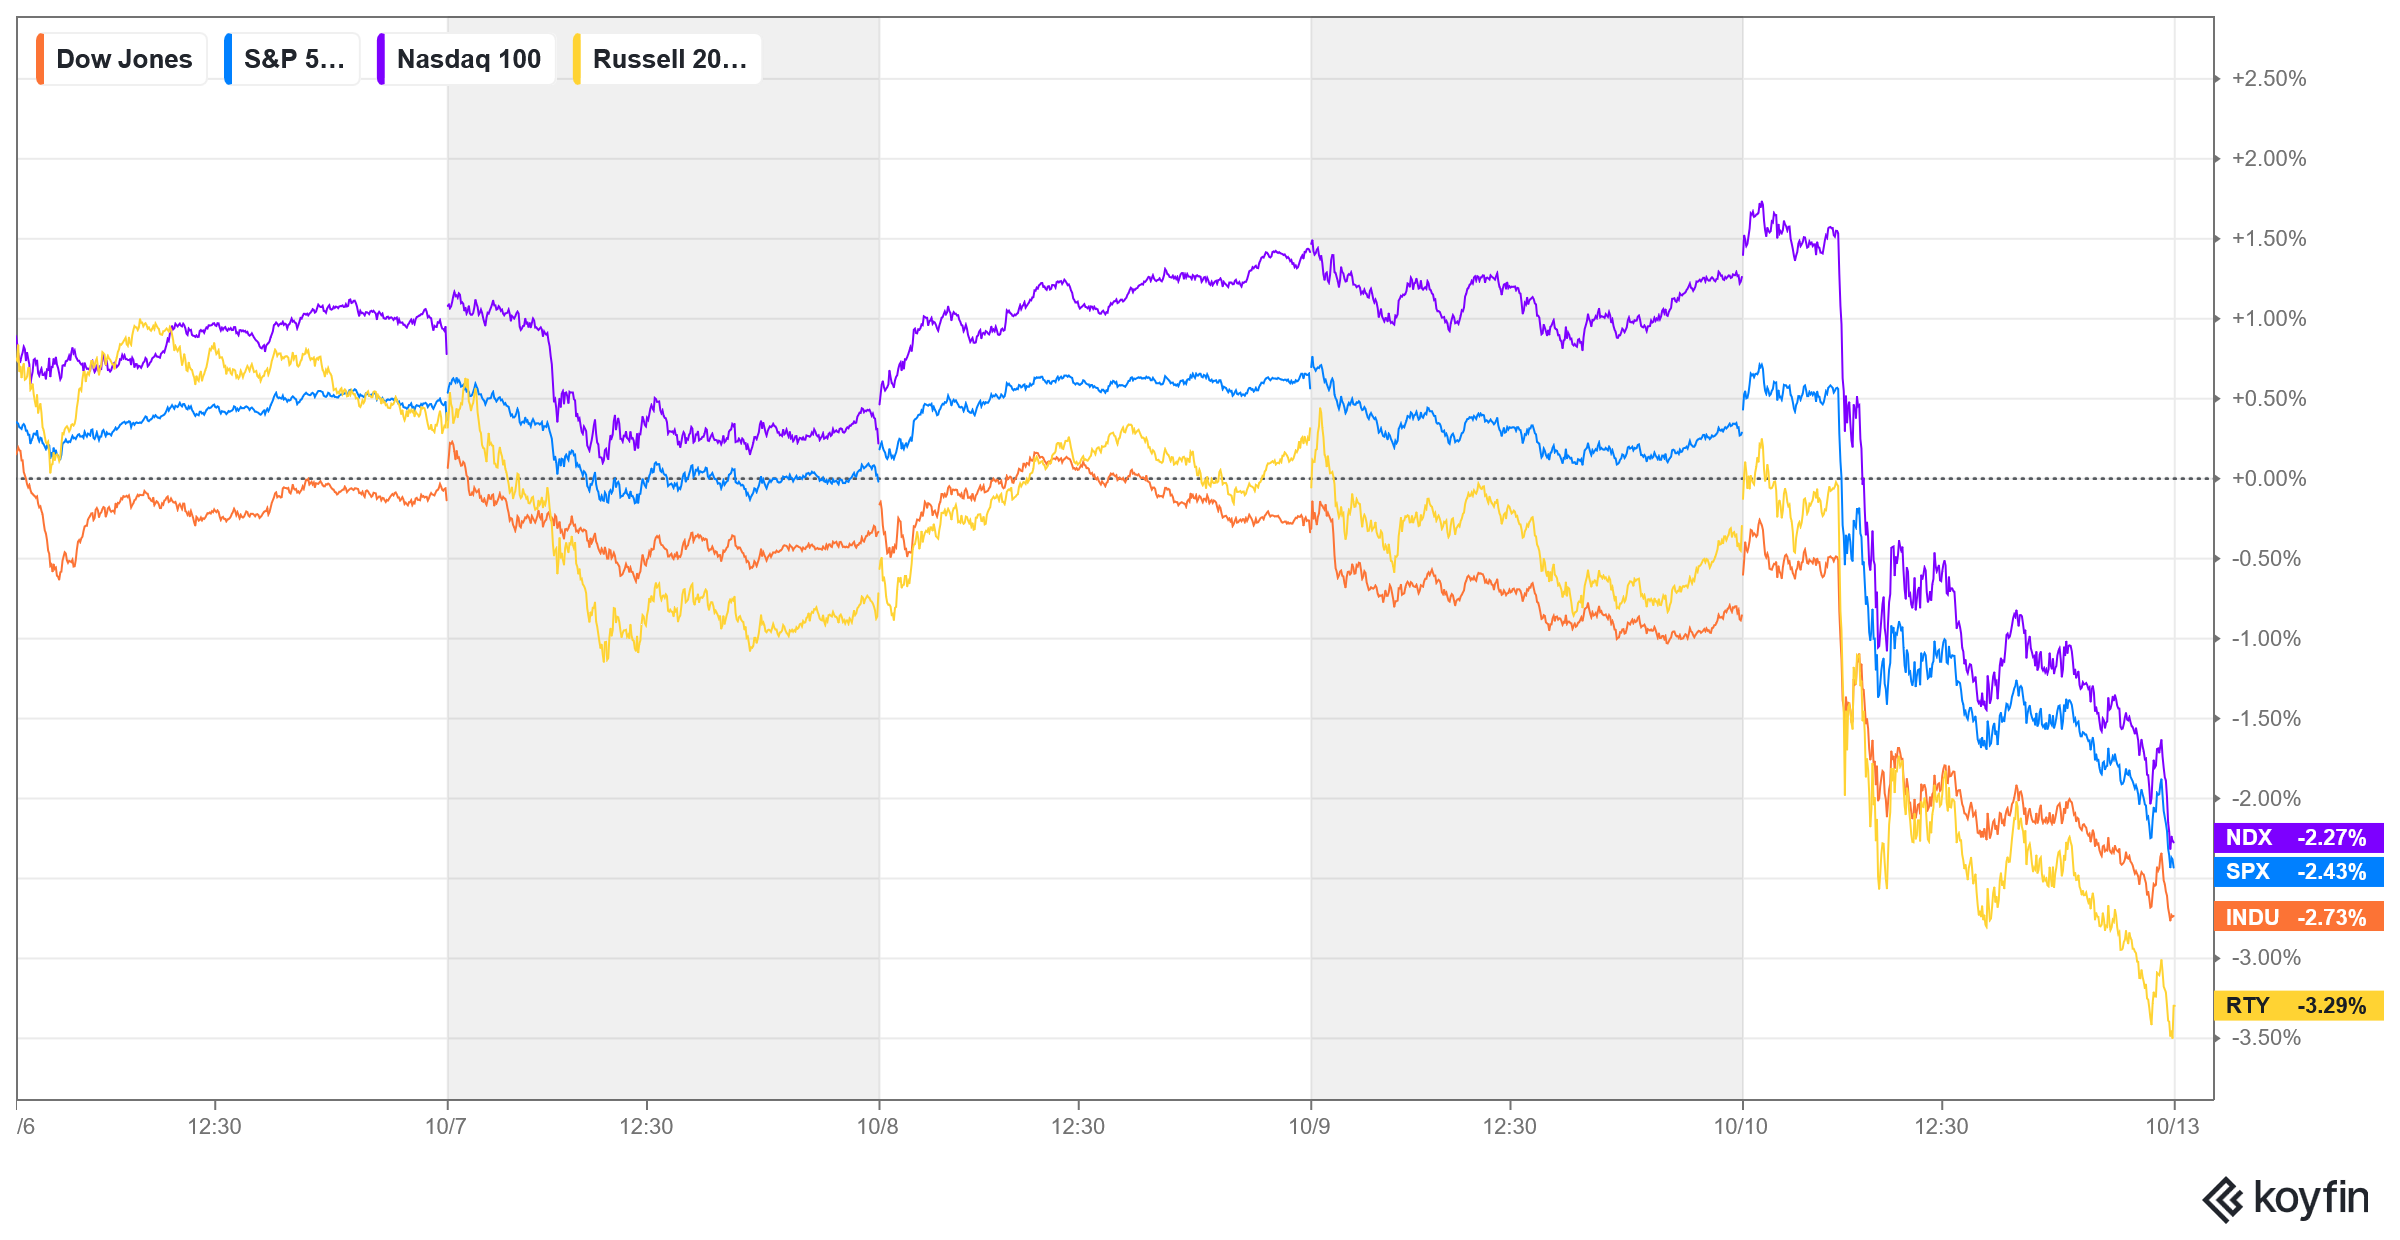
Major Indices Week of October 10, 2025
 NYSE Volume
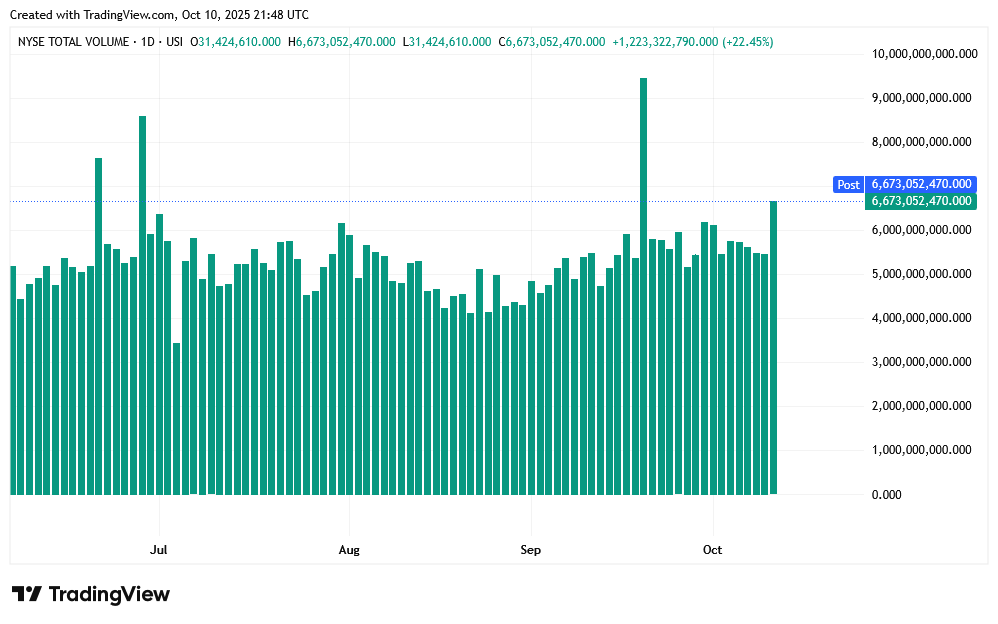
 As goes tech, so goes the market. The bears came out of the woodwork on Friday as stocks swooned on headlines about tariffs once again.
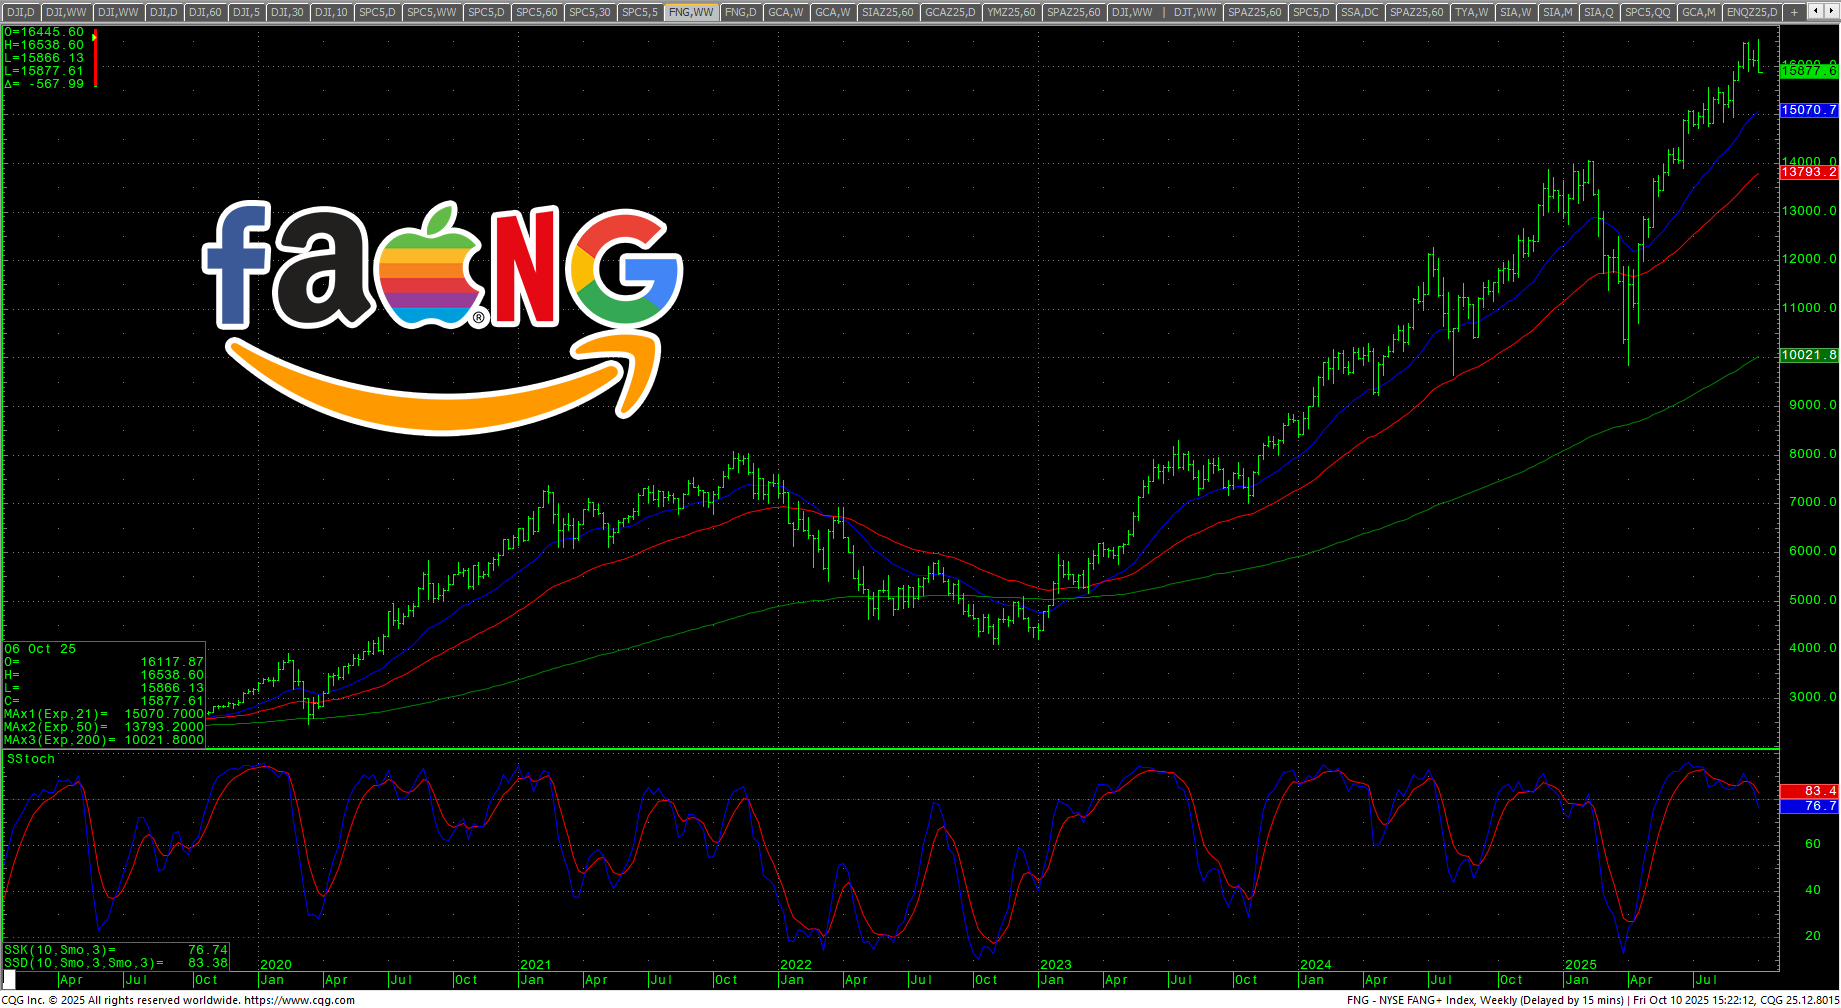
NYSE FANG Daily Close
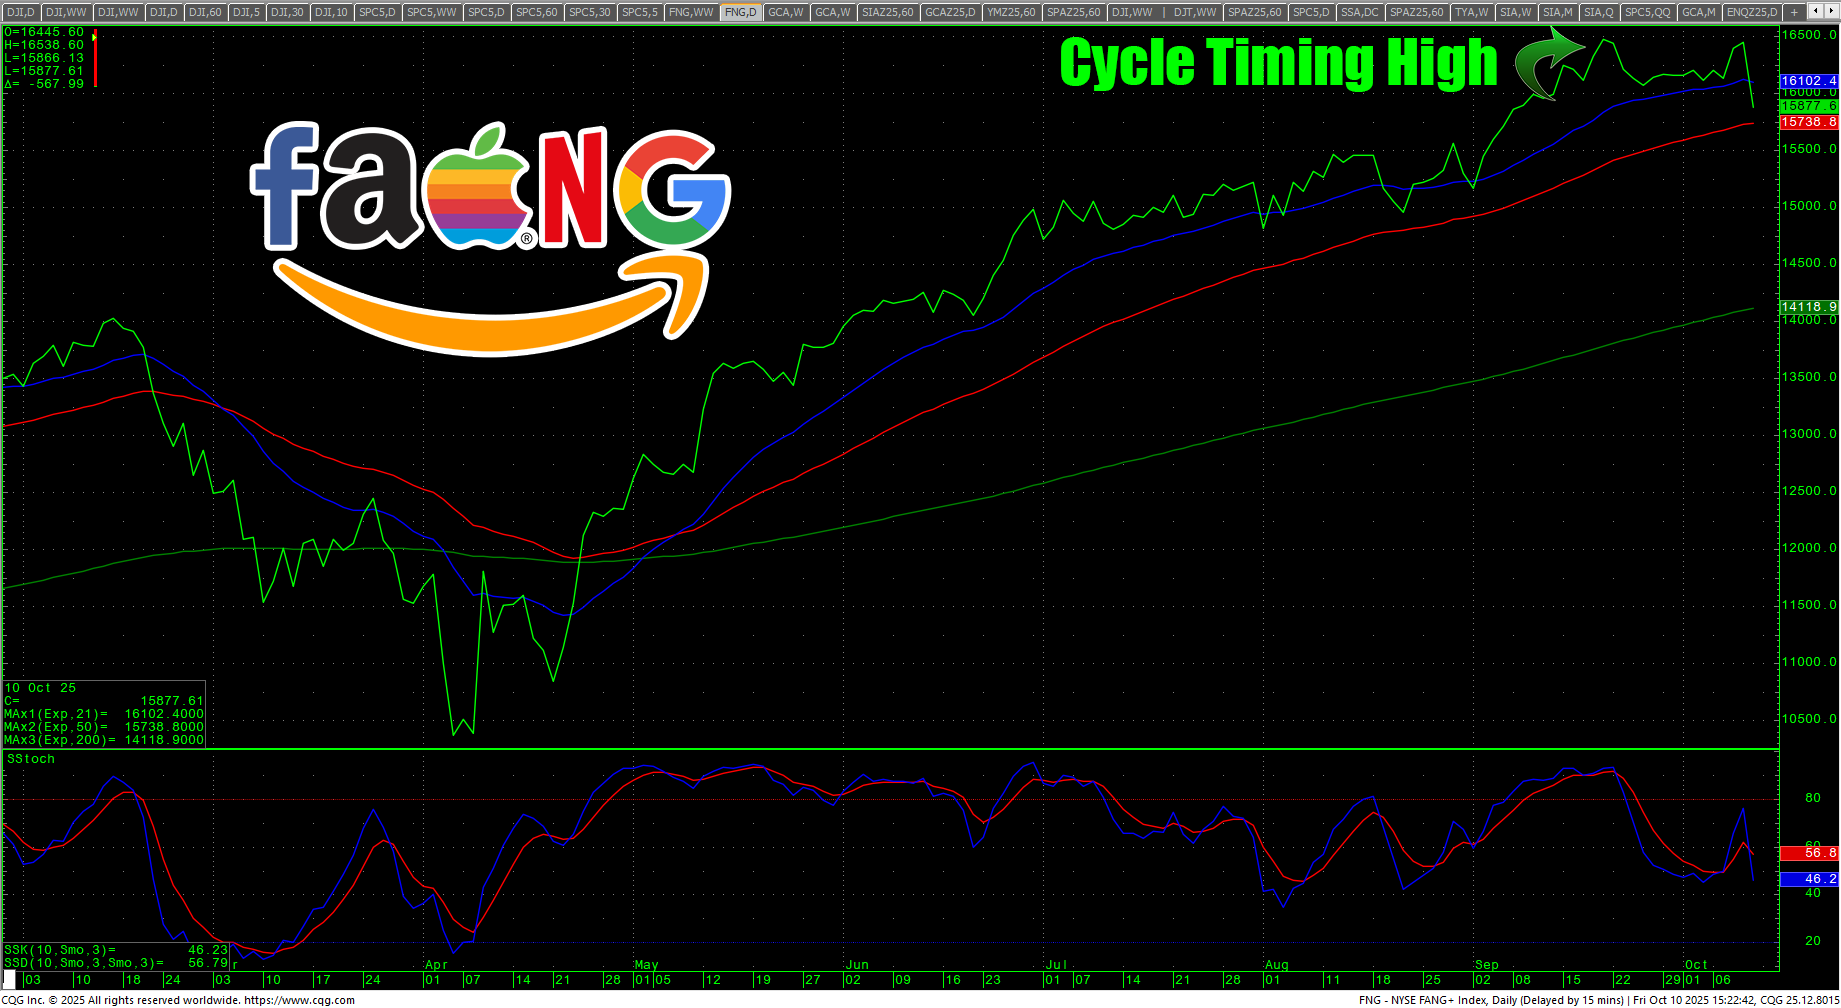 One interesting development is the critical cycle timing of the week ending September 19th has, thus far, caught the top in the FANG. How this continues to play out will be interesting with the SPX hitting a new ATH intraday high in Thursday’s trade as well as a new ATH close last week prior to the meltdown on Friday. If there is yet another quick lash back up, then it is likely prices continue their move into the first quarter of 2026. If this week’s bearish action is the start of something bigger, then the first quarter of 2026 could be brutal for stocks.
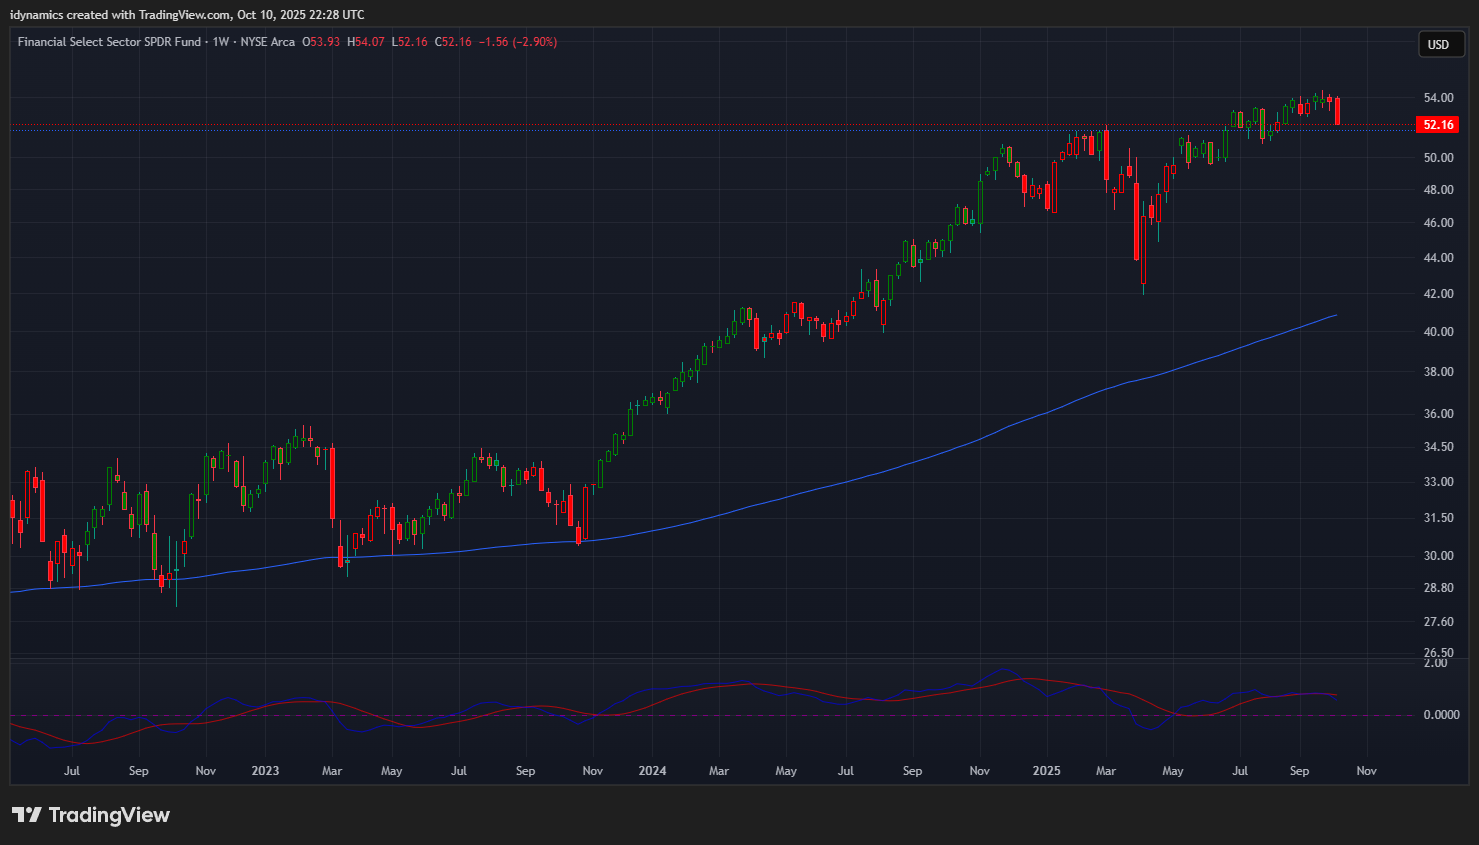 Last week I pointed out the XLF had stalled at record highs. The XLF also has its weekly closing high in the critical timing of the week ending 09/19/25 and is rolling over from the timing.
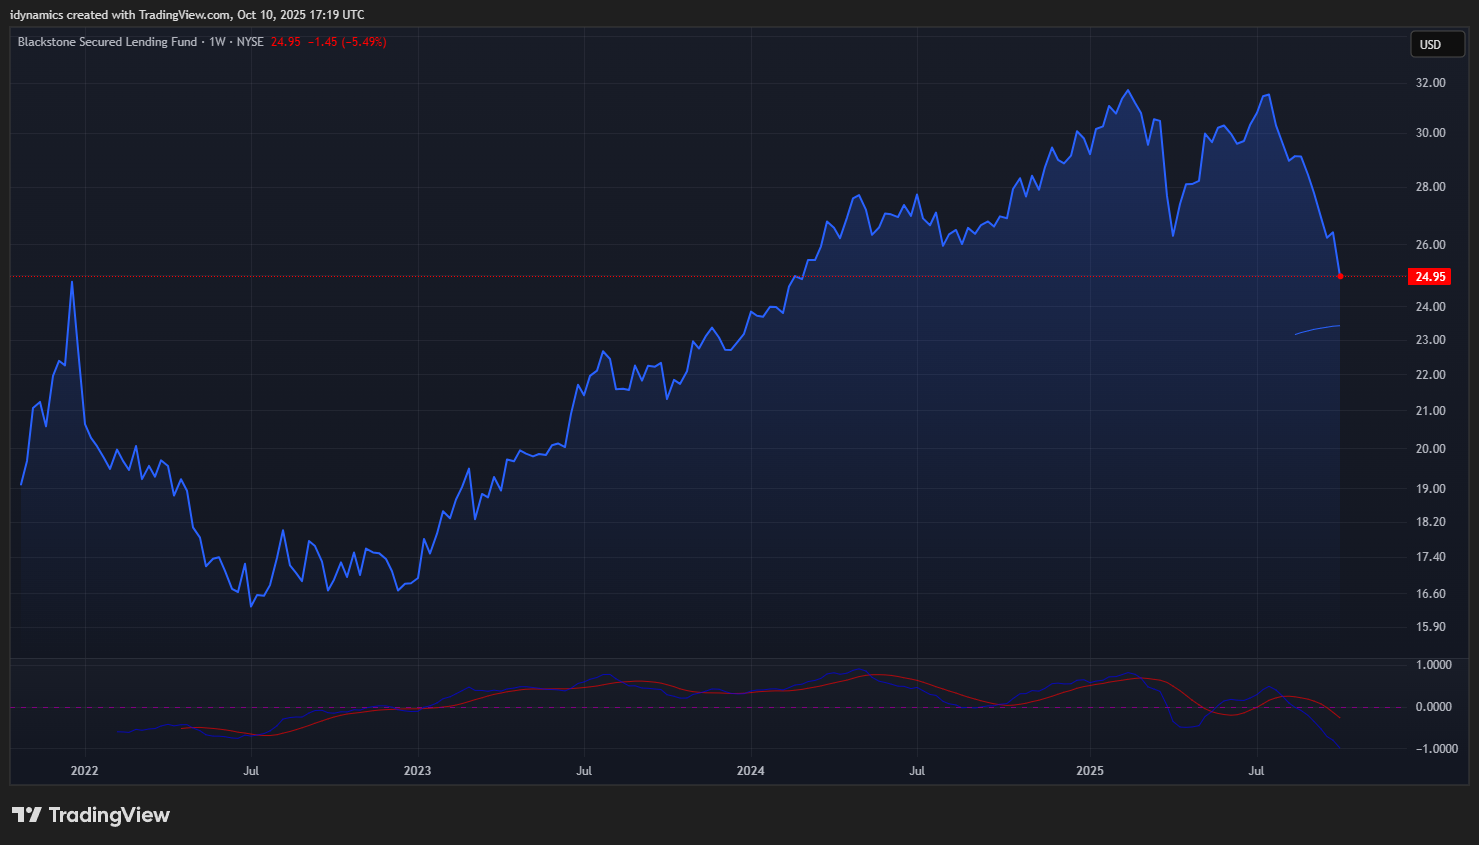 Another very critical chart is the Blackstone Secured Lending Fund (BXSL) which crashed under the April 2025 lows last week. BXSL is the grease on the AI Revolution wheels, e.g., the “bank.” With the crash in BXSL, it seems that some people are starting to wake up to the massive trillion-dollar shell game that the AI Bubble represents with its circular funding. 2025 is shaping up to be 14X larger than the Dot-Com circle of Nortel, Lucent and Cisco.
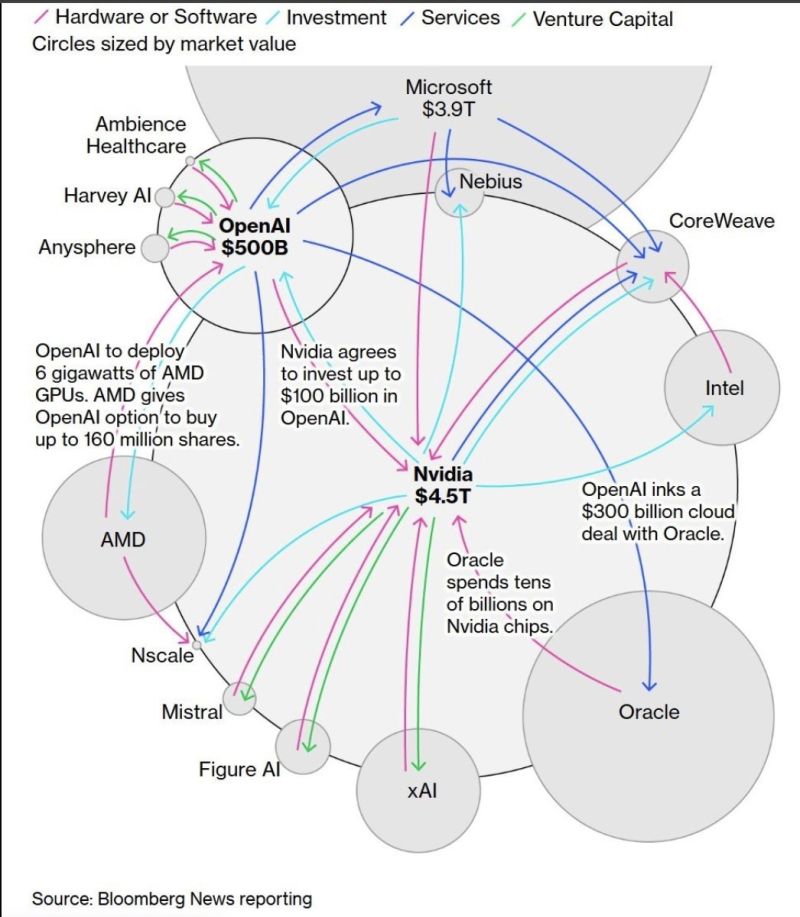
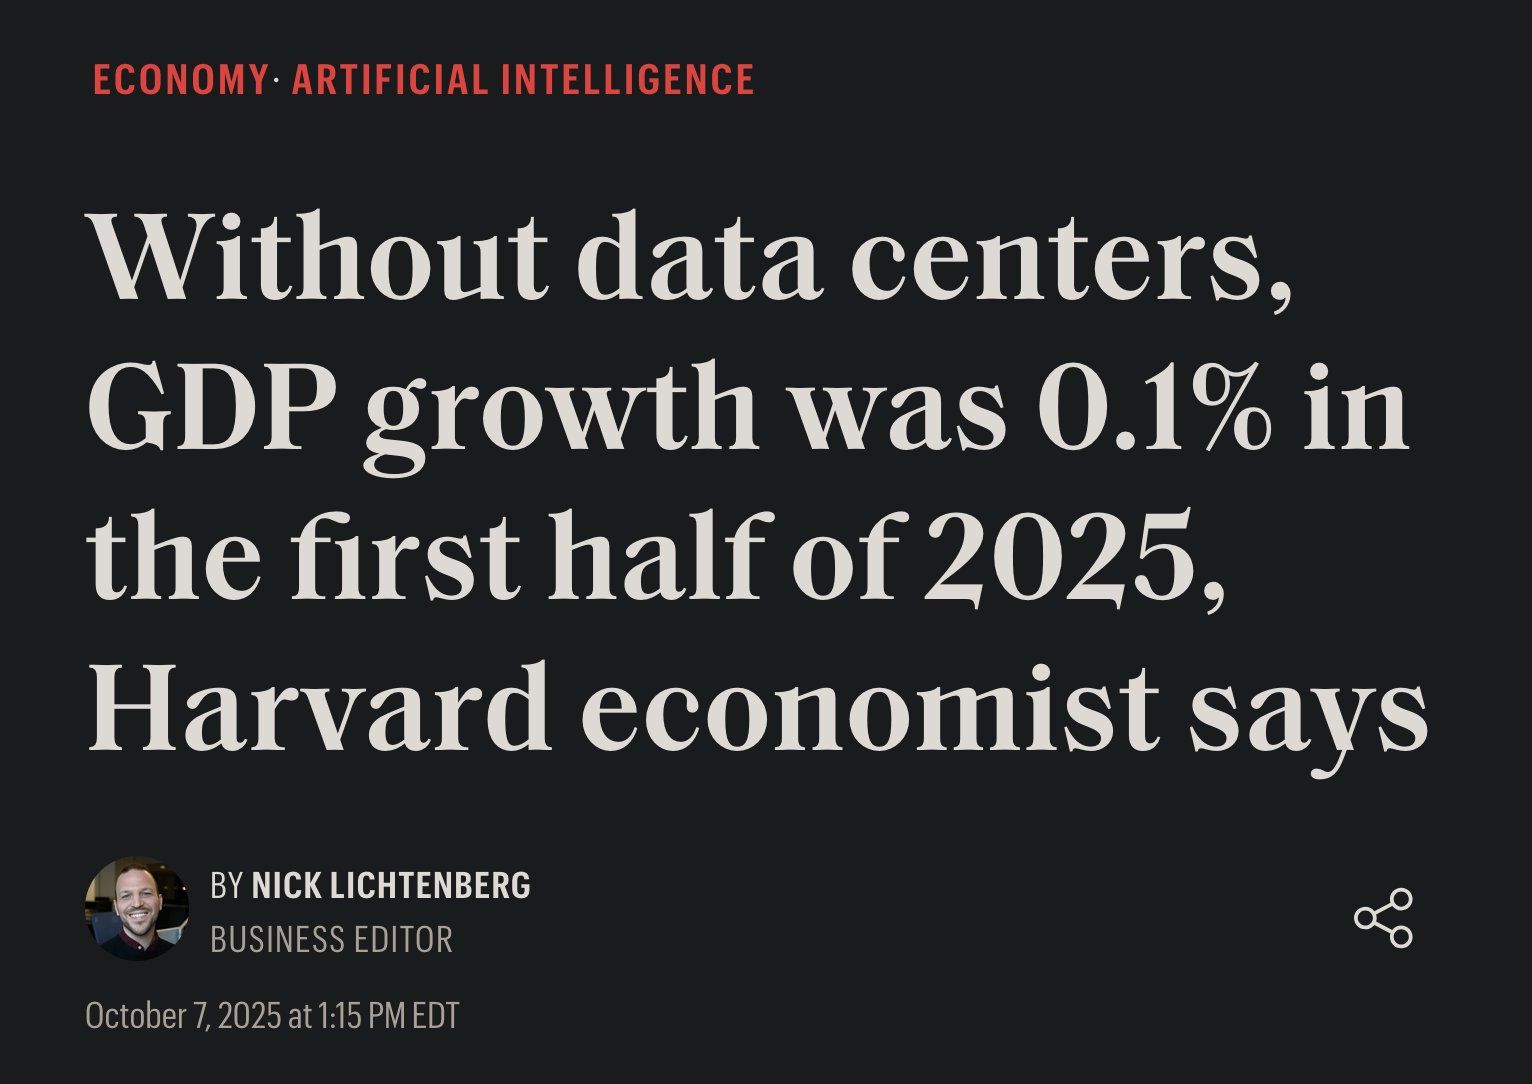 Bloomberg put out this chart last week showing the fiscal folly going on in the AI universe. In addition, it is reported that, without data center investment in 2025, the first half of 2025 GDP ran at 0.1%.
 This circular “self-dealing” is beginning to look more and more like the Dot-Com circle of Nortel, Lucent and Cisco as well as the famous Three Stooges skit on “How to pay off a debt.” “Hey, where’s the 20 bucks you owe me? Oh yeah, well I only got ten, so here’s 10, I owe you ten. Nice. Hey Moe, you owe me 20. Well here’s 10 I’ll owe you ten. Ah, you owe me 20. Here’s 10, I owe you ten. Here’s the 10 I owe you. Here’s the 10 I owe you. Here’s the 10 I owe you. Good, now we’re all even.” 🤦
Sentiment shifted quite a bit late in the week with the selloff with several indicators moving to fear. The AAII is behind this week’s trade, so it still reflects the higher bull reading from the previous week’s surveys.
SPX Quarterly H-L-C
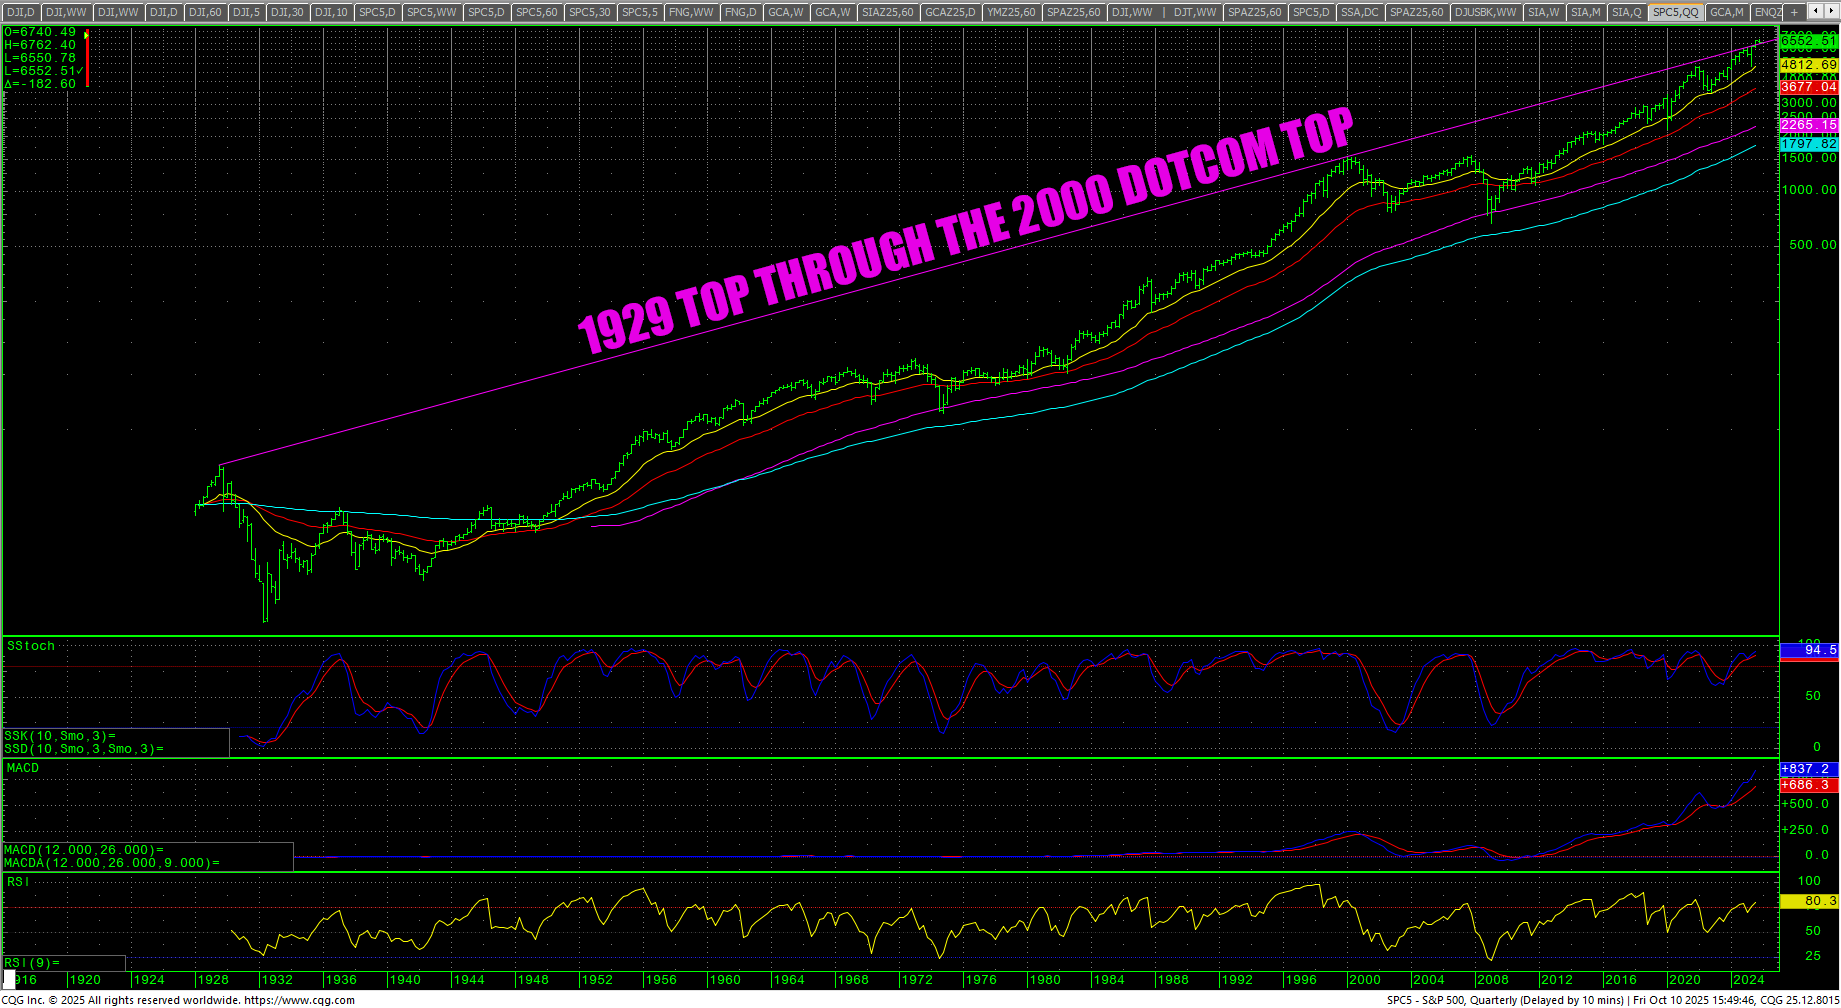 Now we need to keep an eye on the massive trendline on the SPX quarterly chart that connects the 1929 tops through the 2000 Dot-Com tops. If prices start to trade back under that trendline, it could signal further selling in equities.
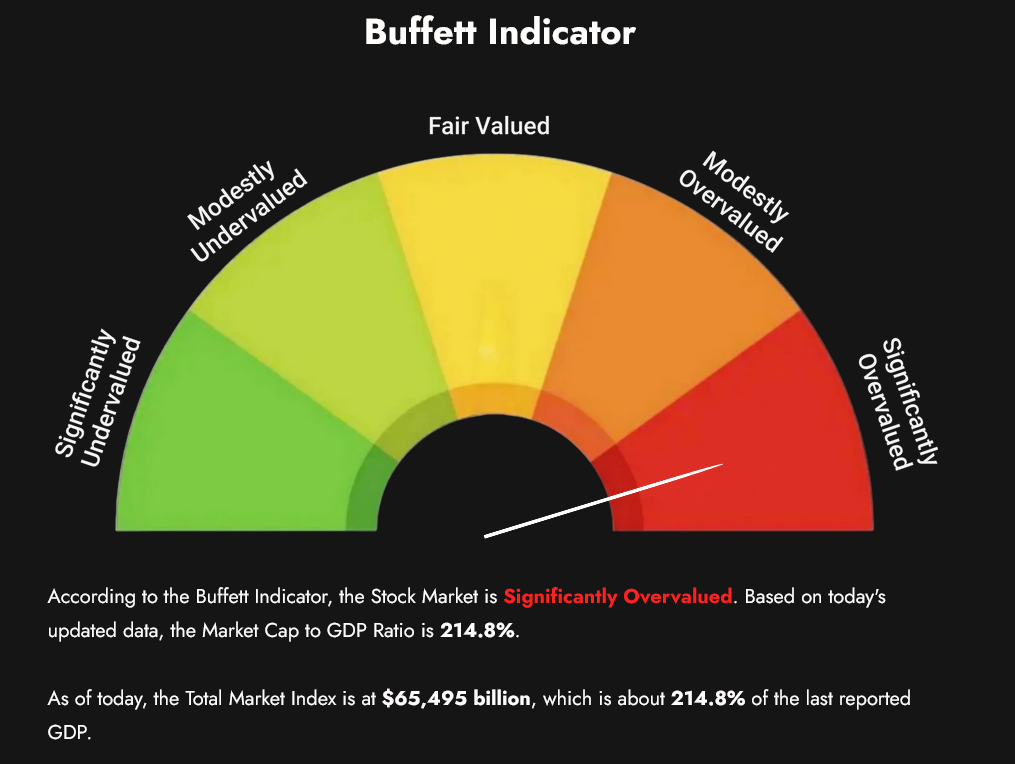
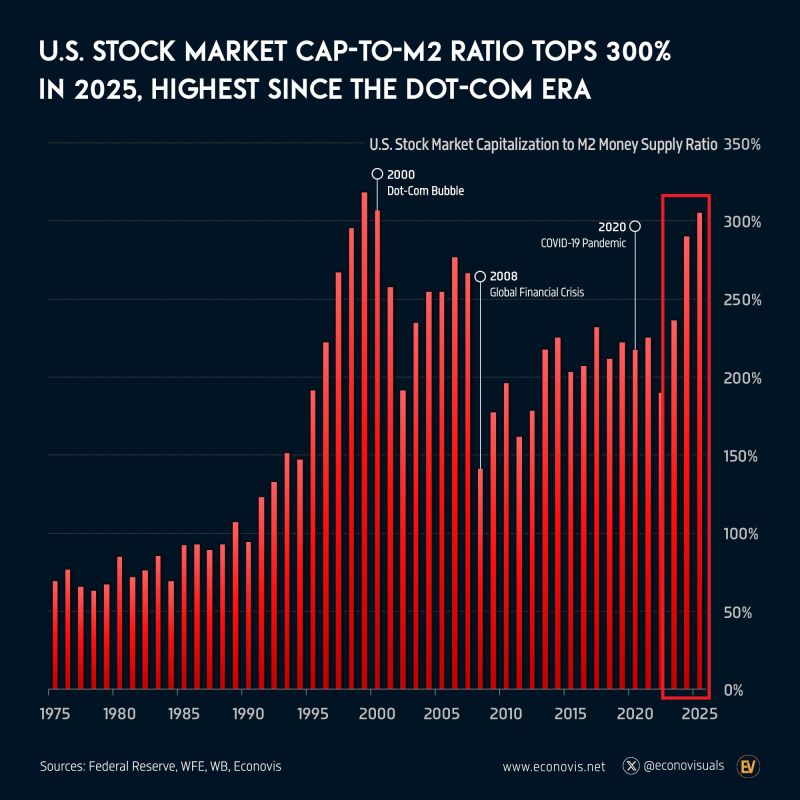 The Buffet Indicator moved off its ATH at 220.3%, dropping to 214.8%. The market cap to M2 has reached levels last seen at the Dot-Com highs.
S&P 500 Stocks Above the 200-day MA
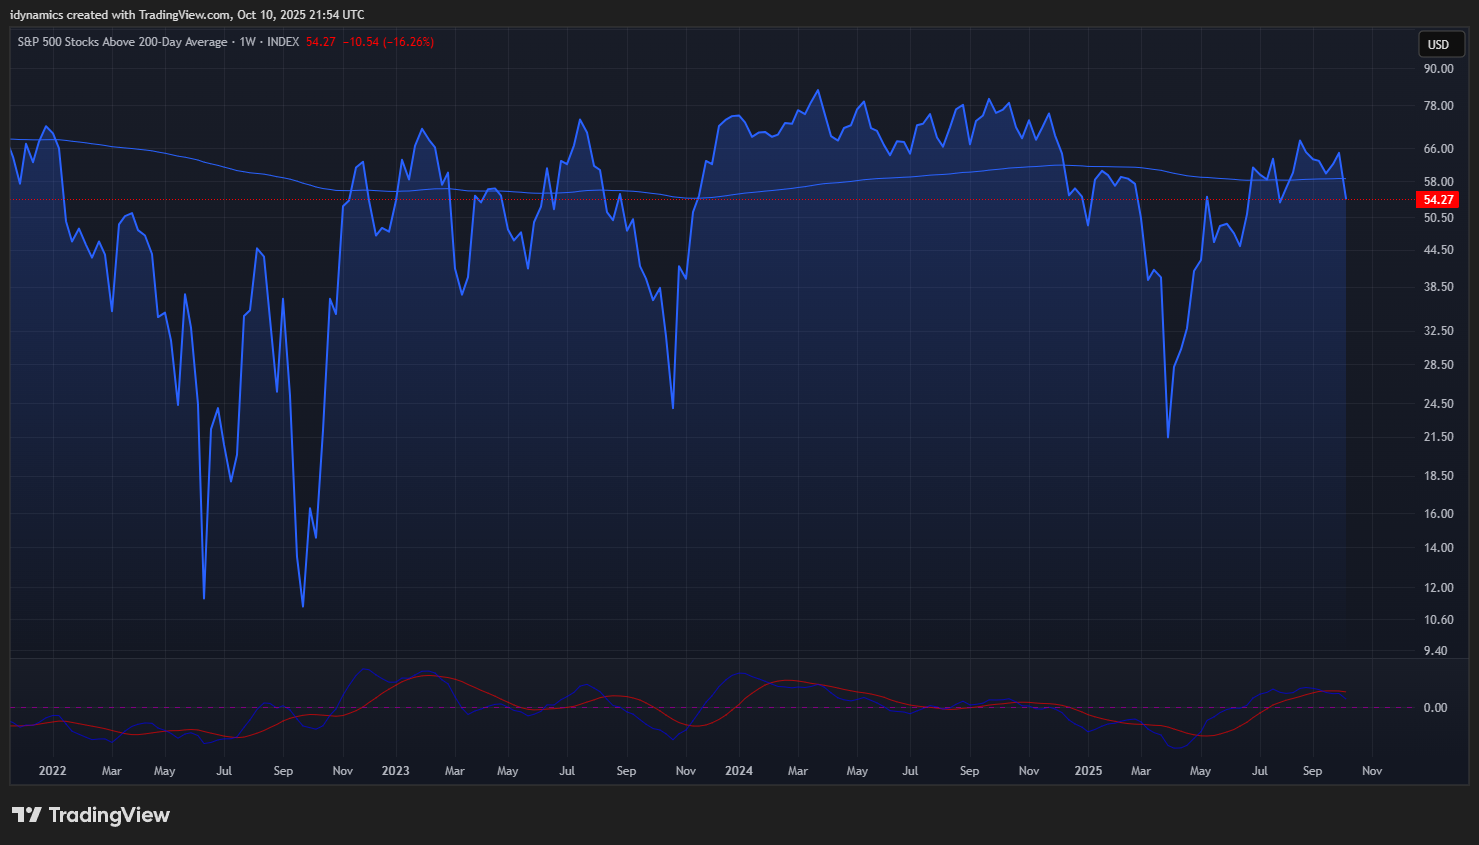 Breadth was torched late in the week with the share of SPX stocks above the 200-day MA dropping to 54.27%. The high in September 2024 was 72.92% and 82.70% in March of 2024. Divergence remains the name of the game.
SKEW Weekly
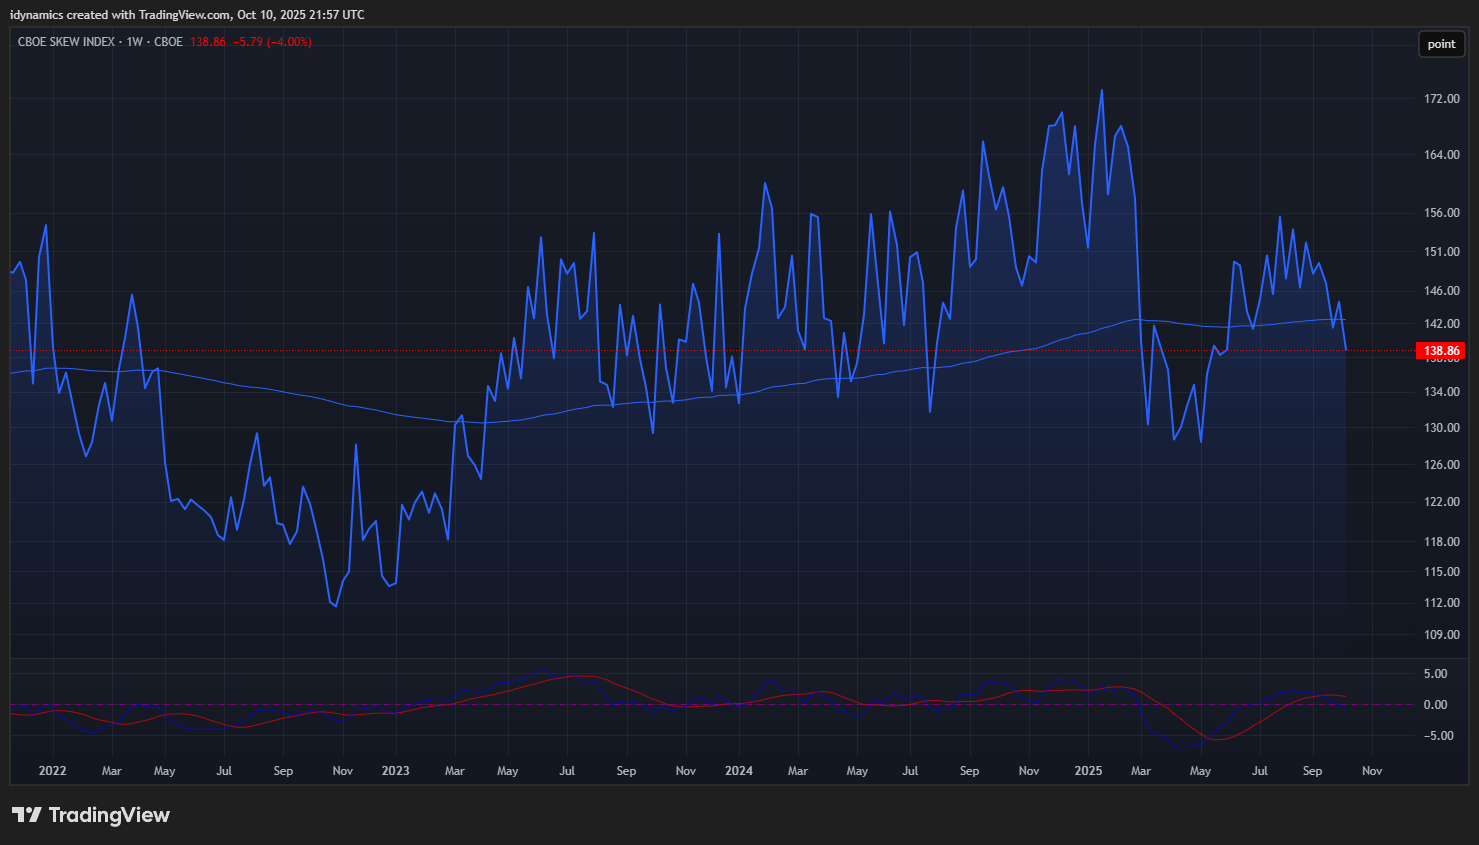 The SKEW is also in a massive divergence relative to the rest of the market.
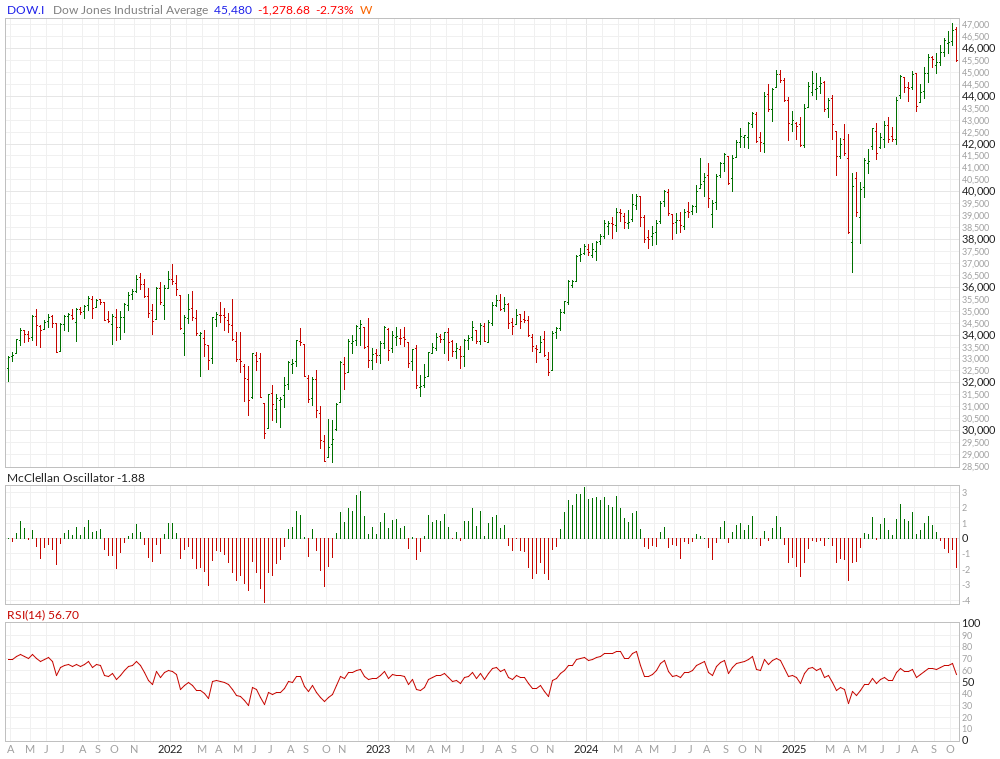
Dow Theory
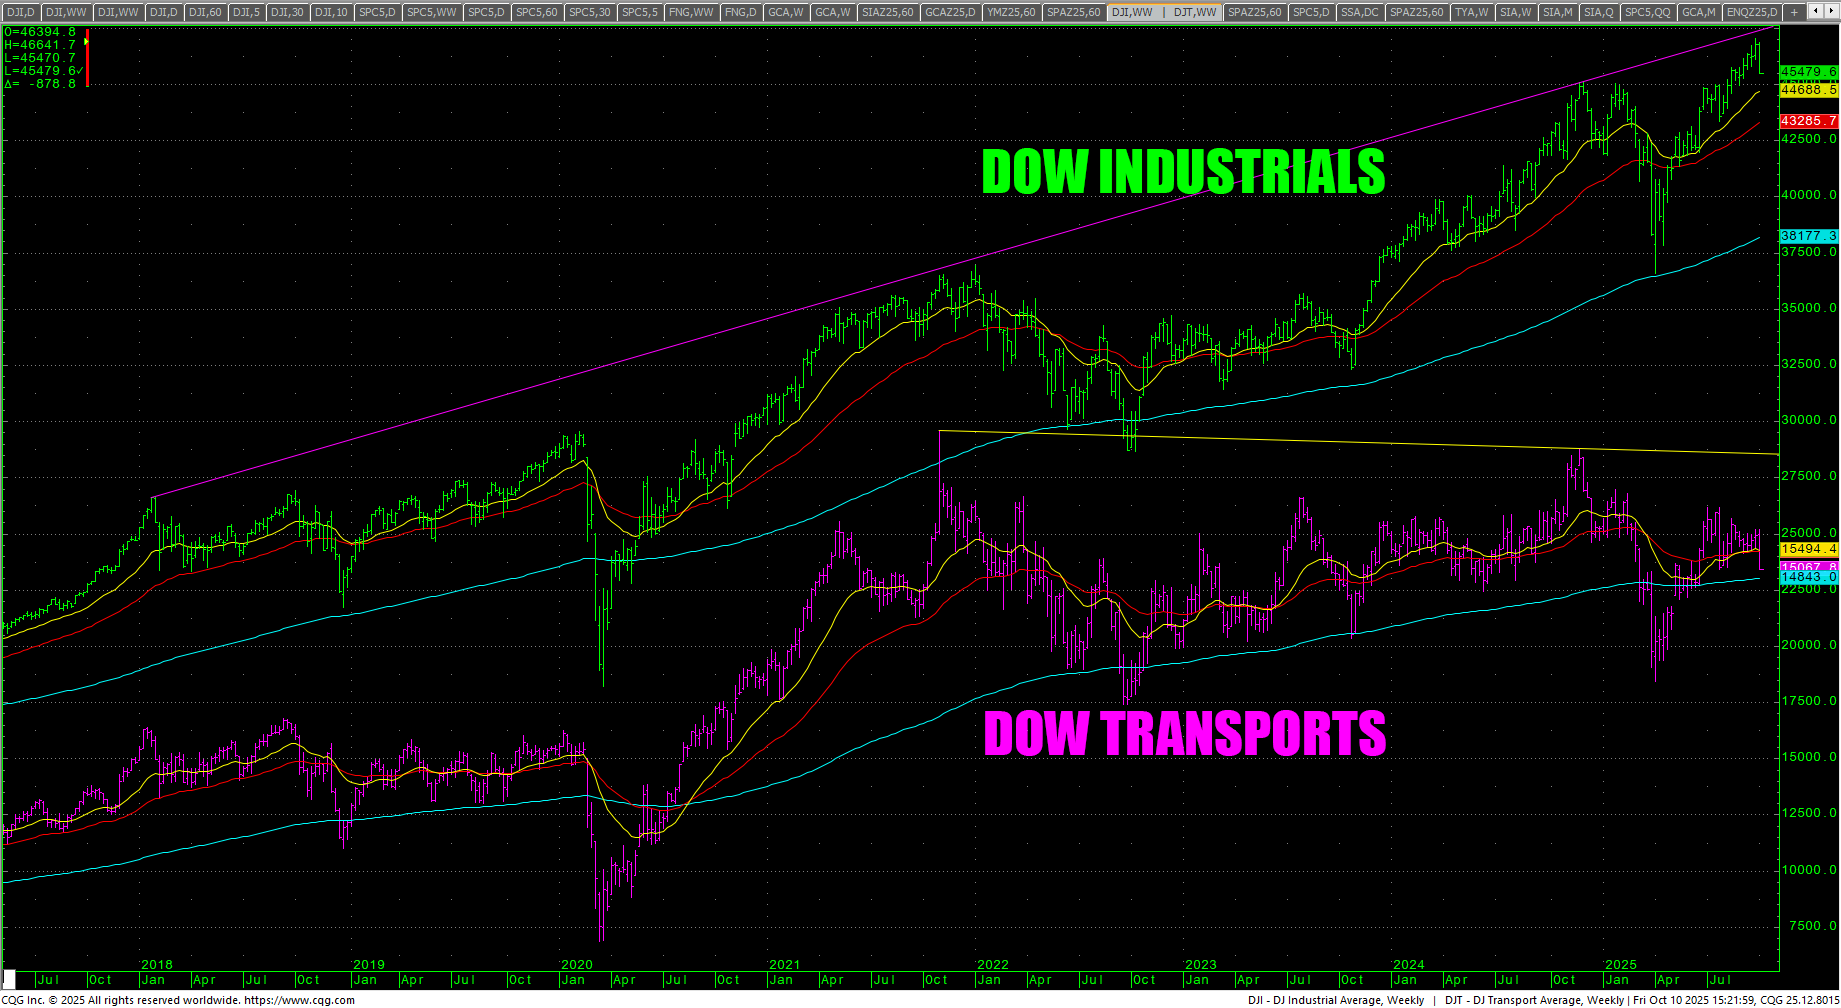 Dow Theory still shows a bearish divergence.
SPC Priced in Gold
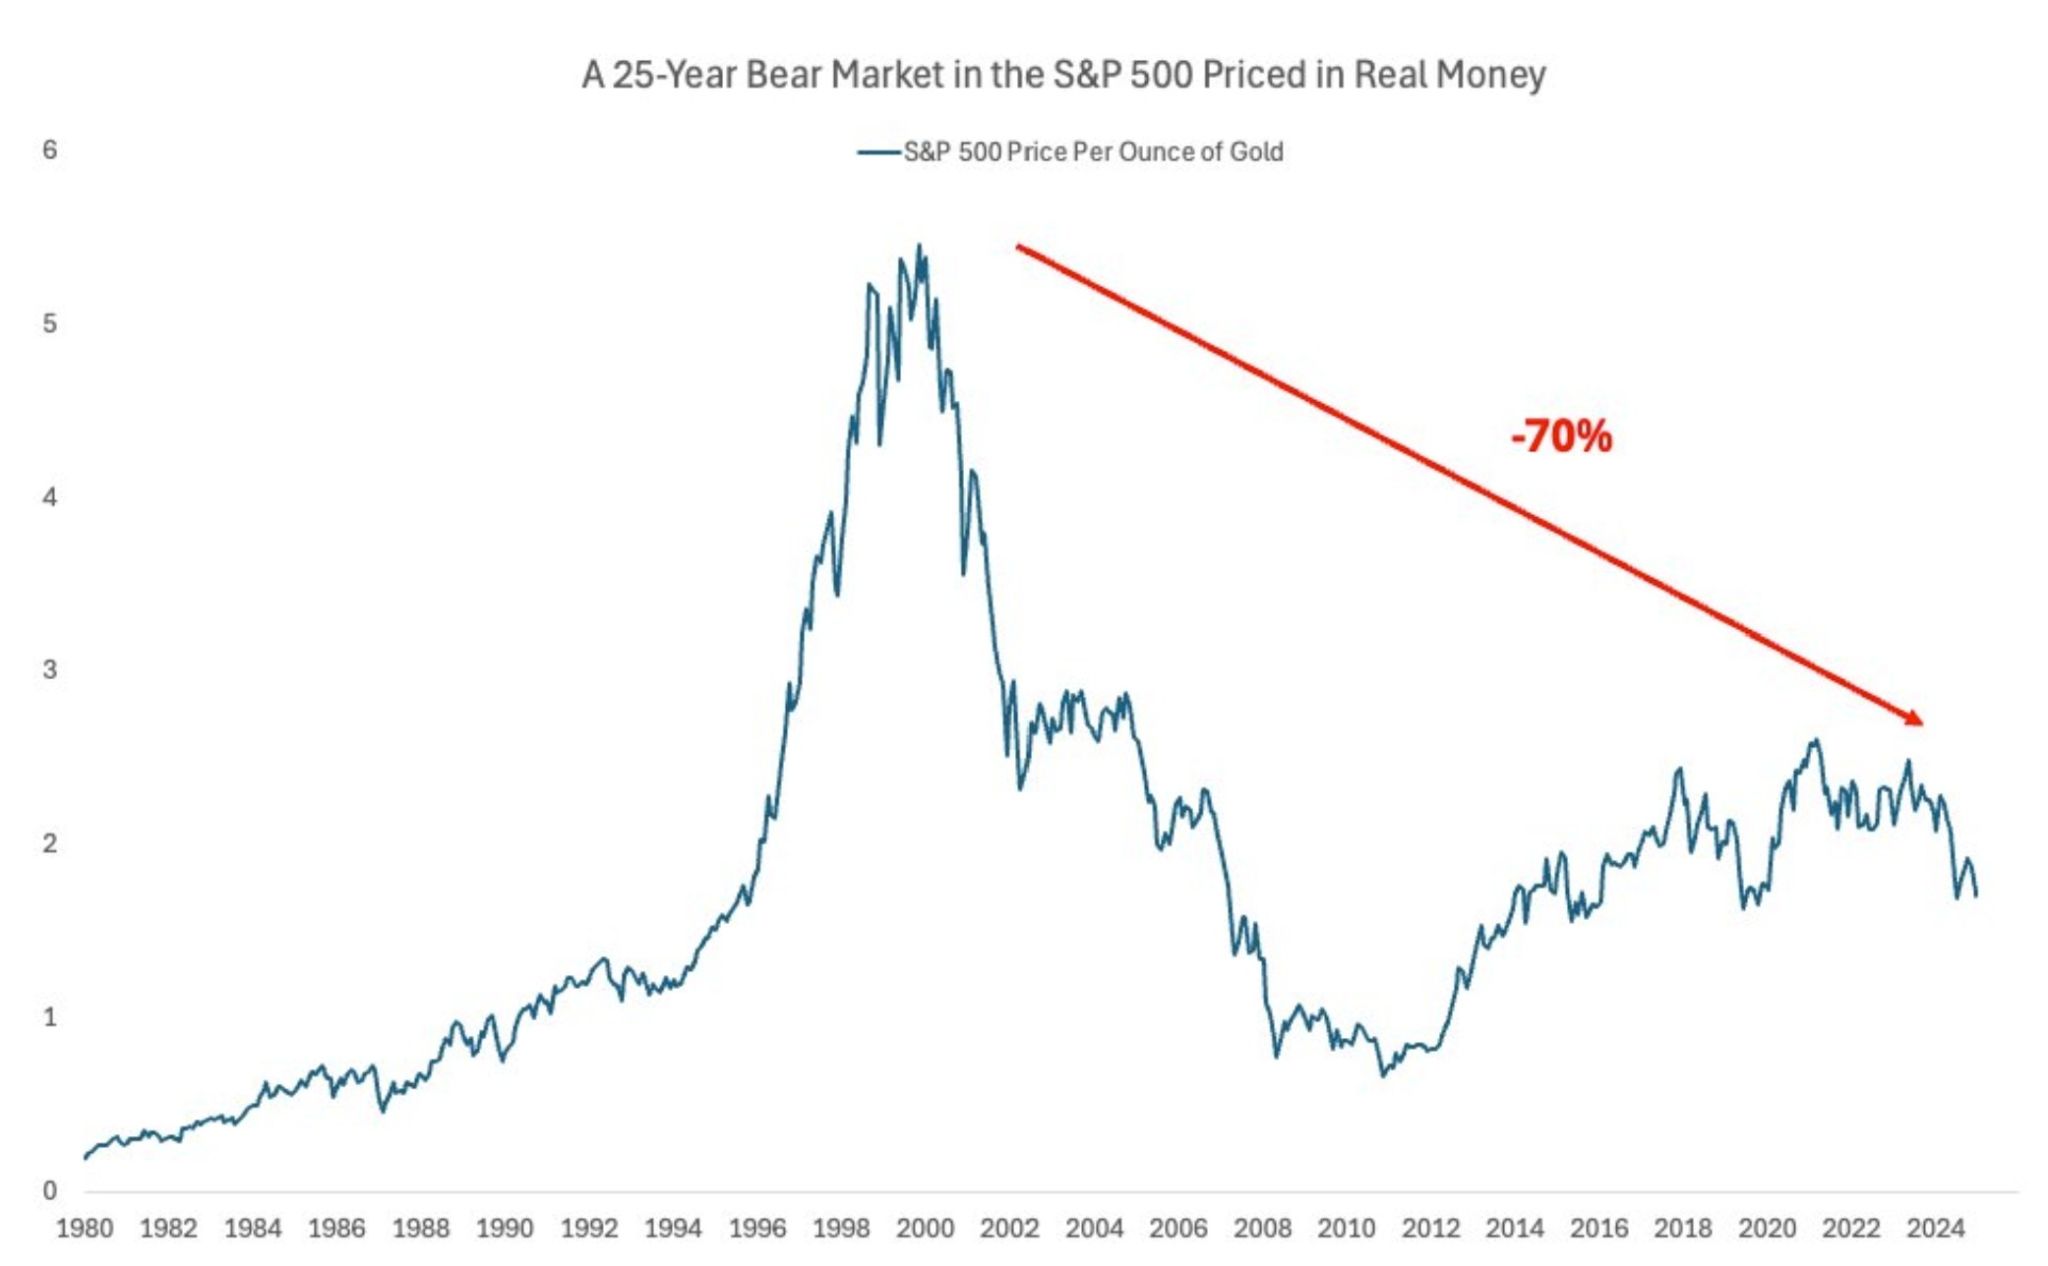
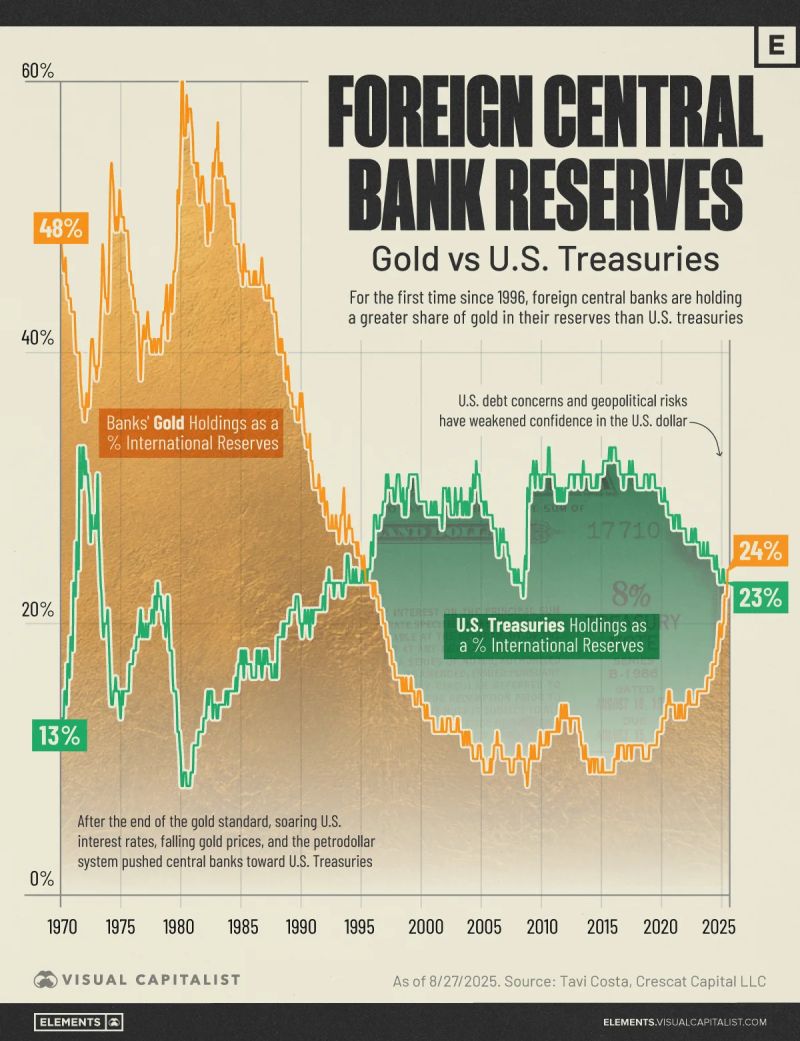 Another historic divergence is the SPC priced in gold. This is happening as gold reserves overtake U.S. Treasuries for the first time since the 1990s.
MAGS (Magnificent 7) Weekly Candles
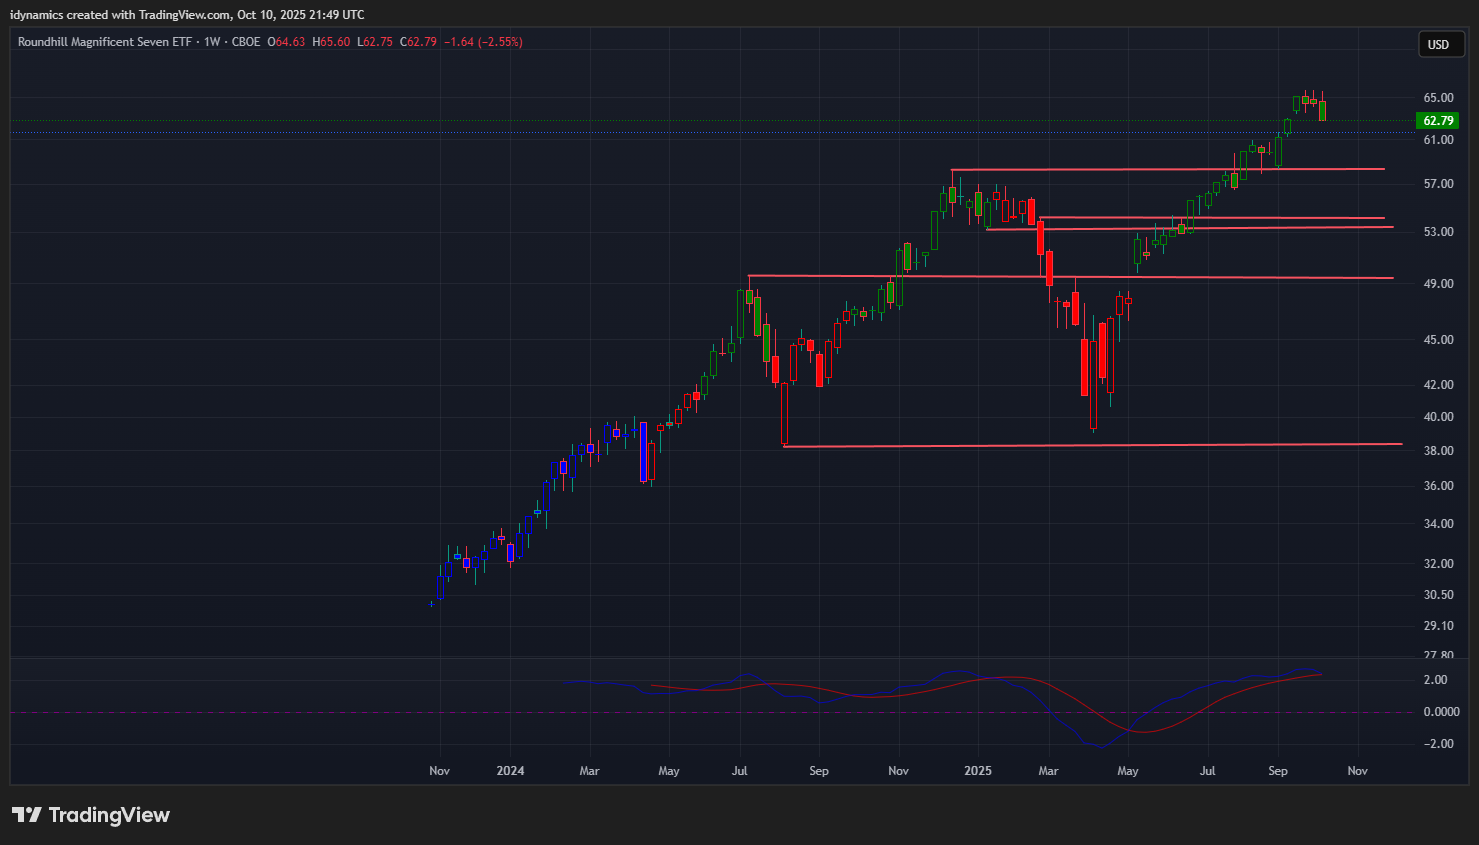 The MAGS collapsed back into the weekly gap area and settled the week down -2.55%. The index is reacting to resistance against the target of 64.50. The chart still has a higher target at 74.30. Support is still at 59.42/58.85 and 55.52. Under 55.52 can test 52.37 with critical support at 49.217/49.00.
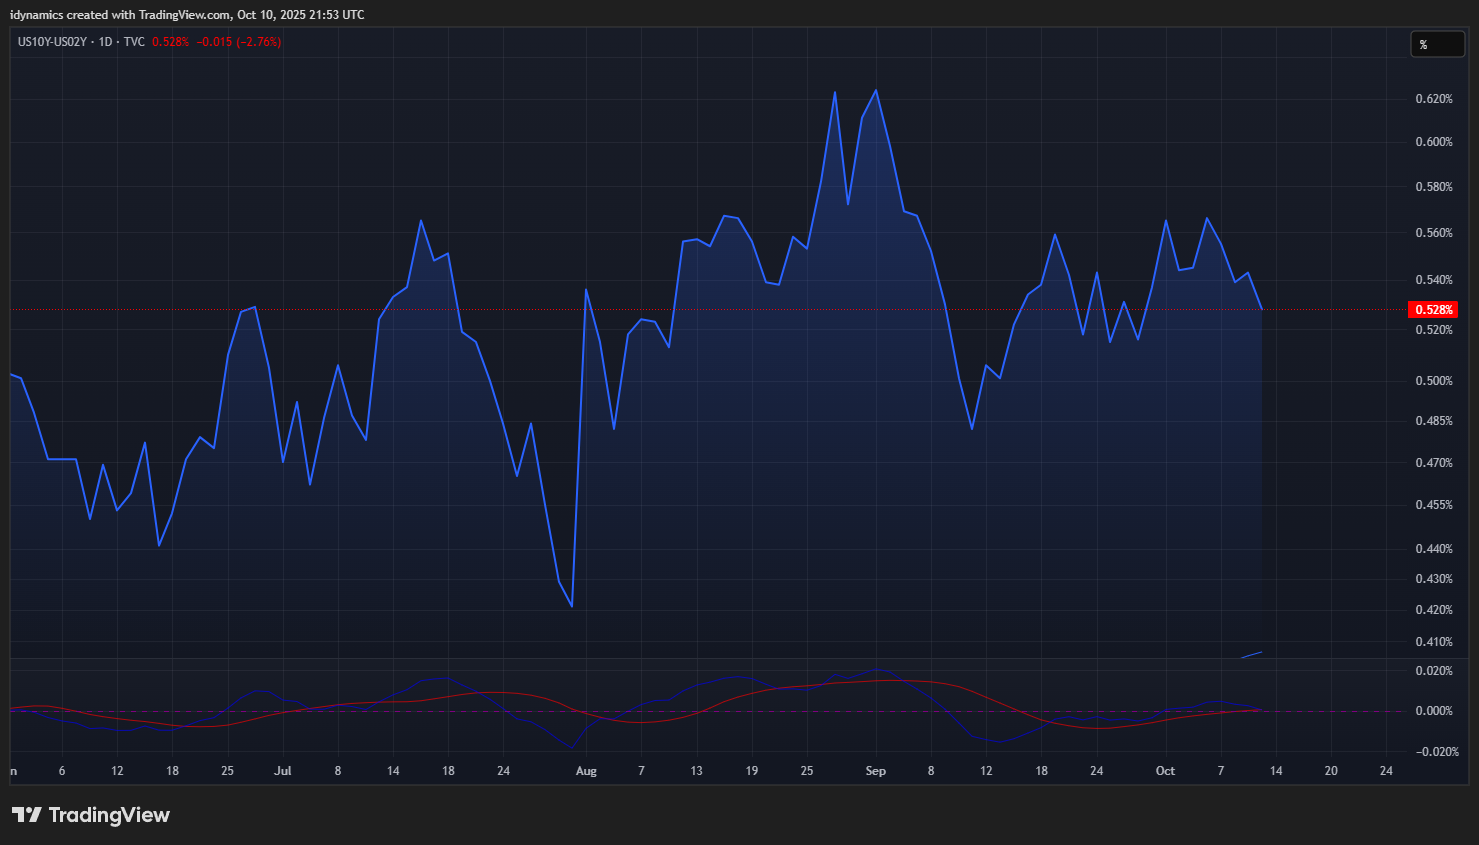
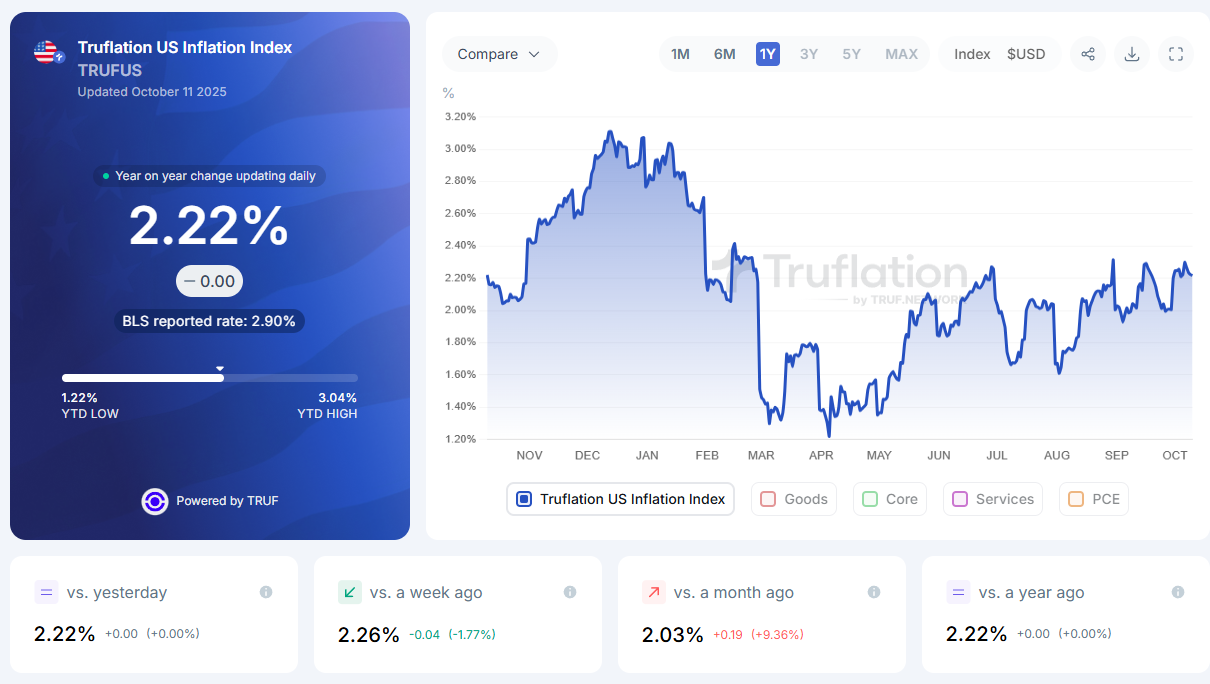
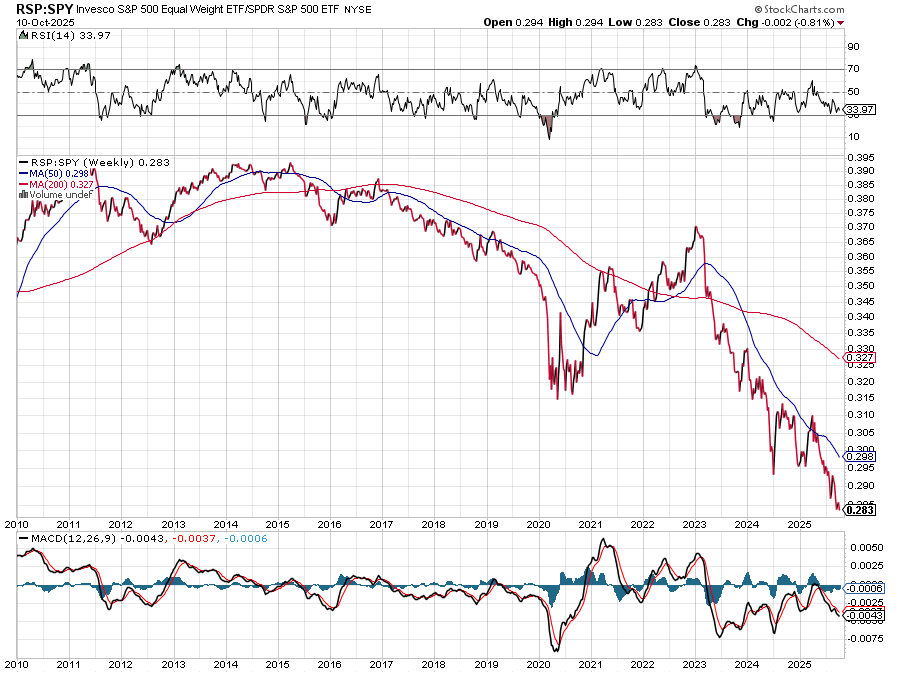
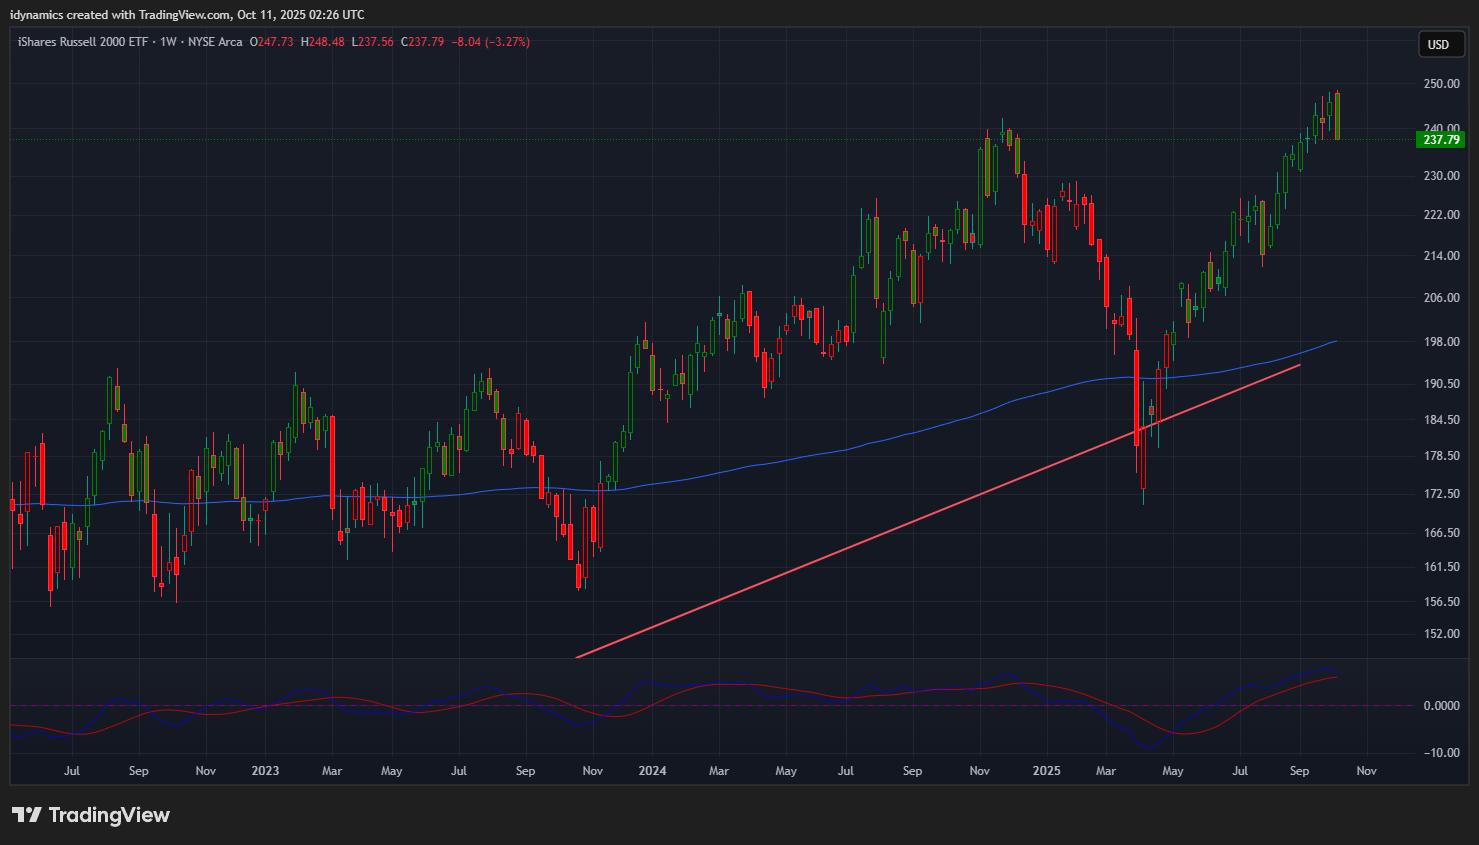
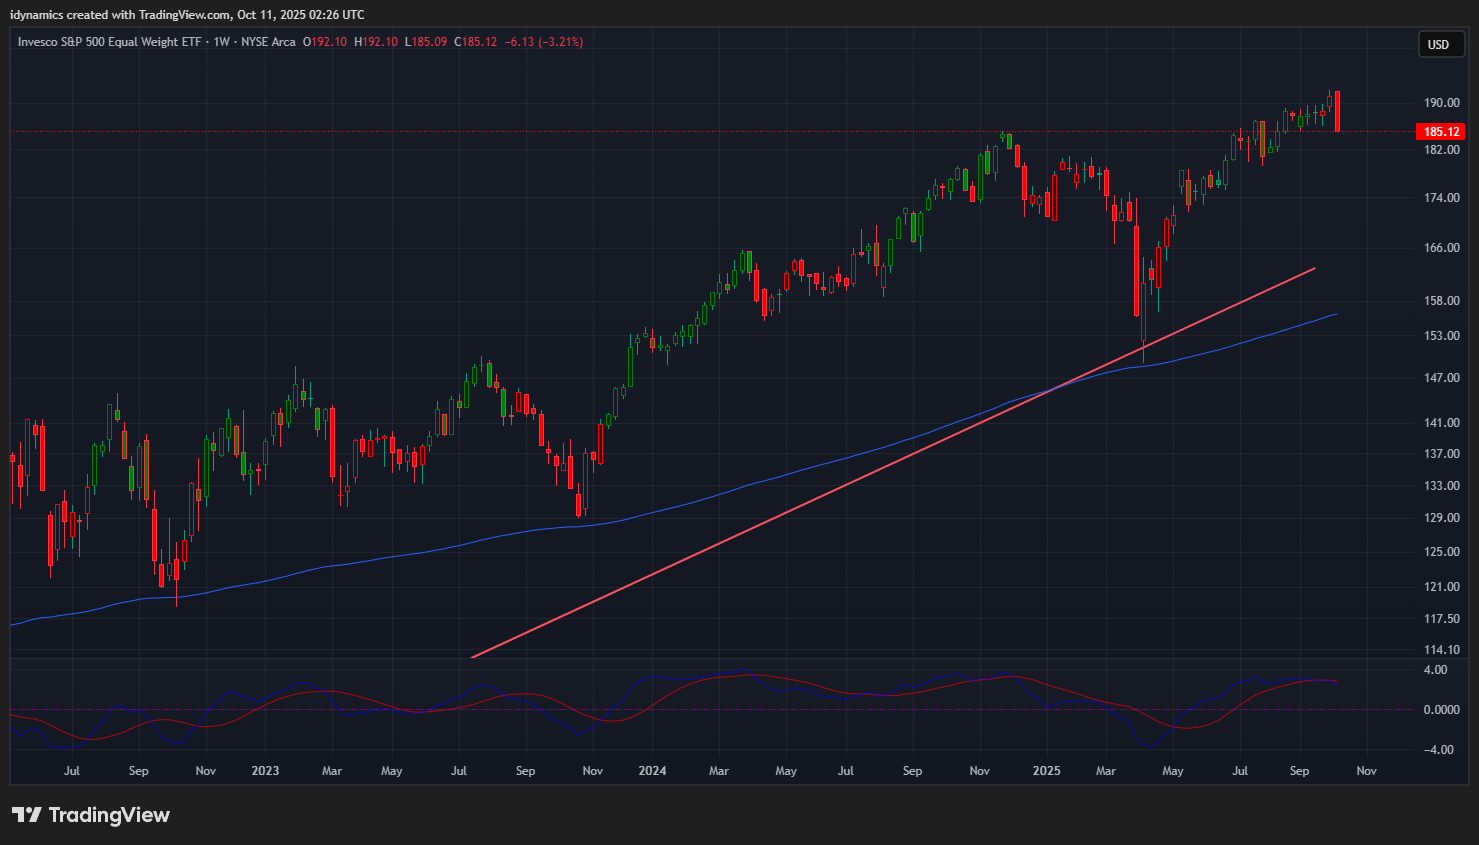
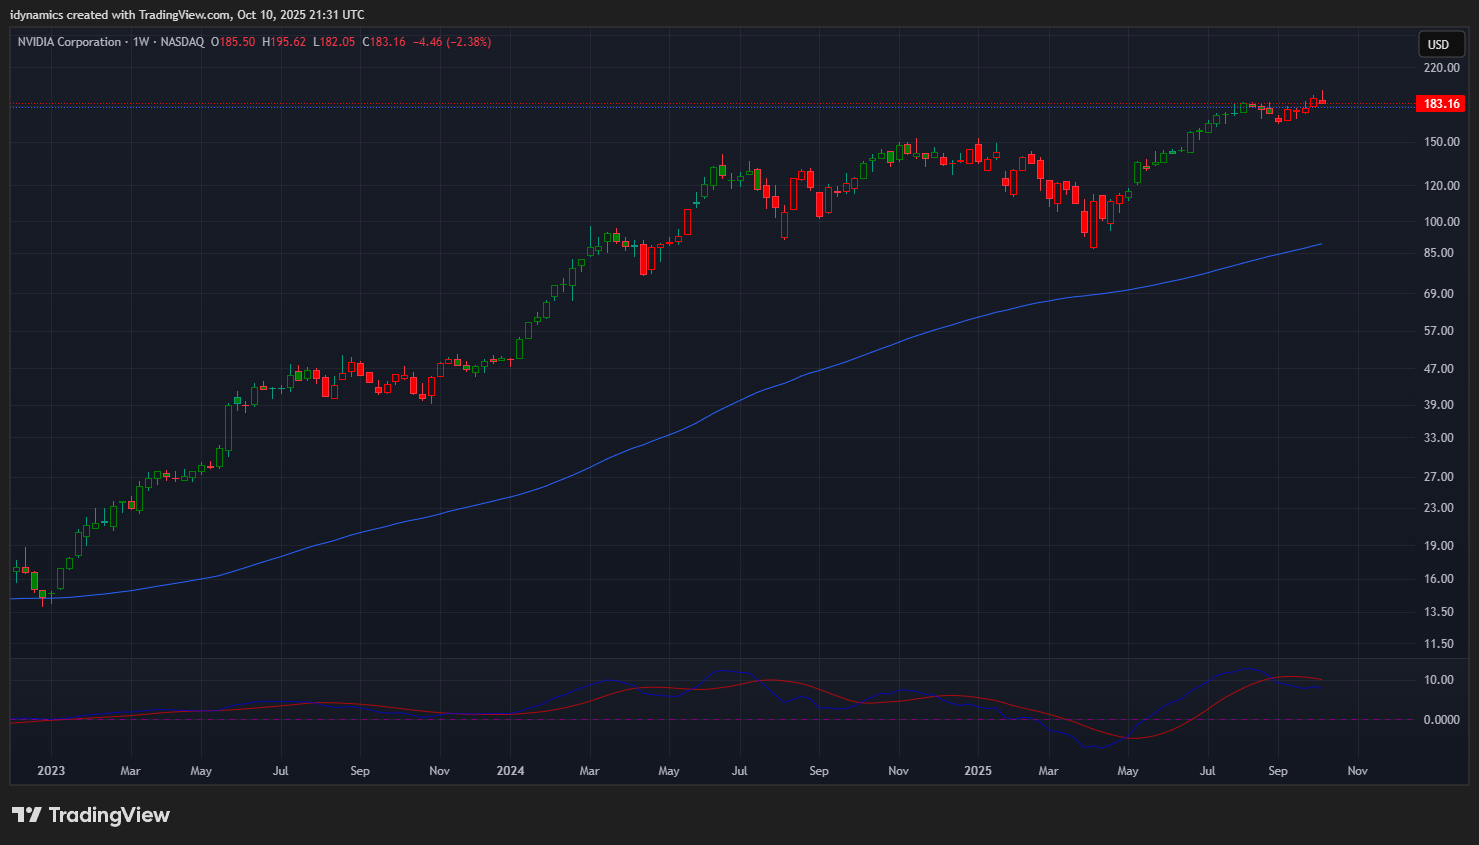
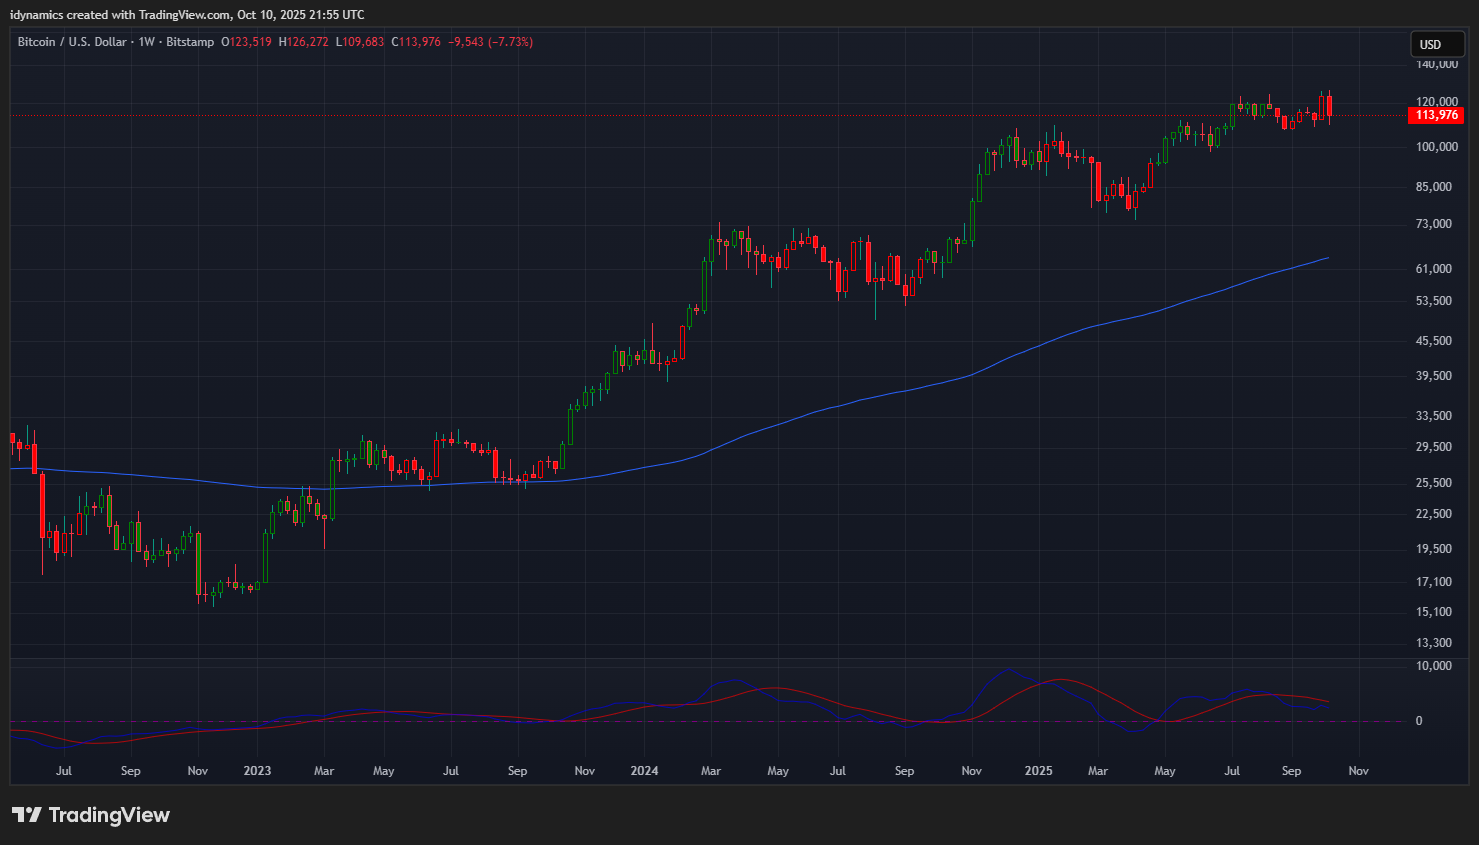
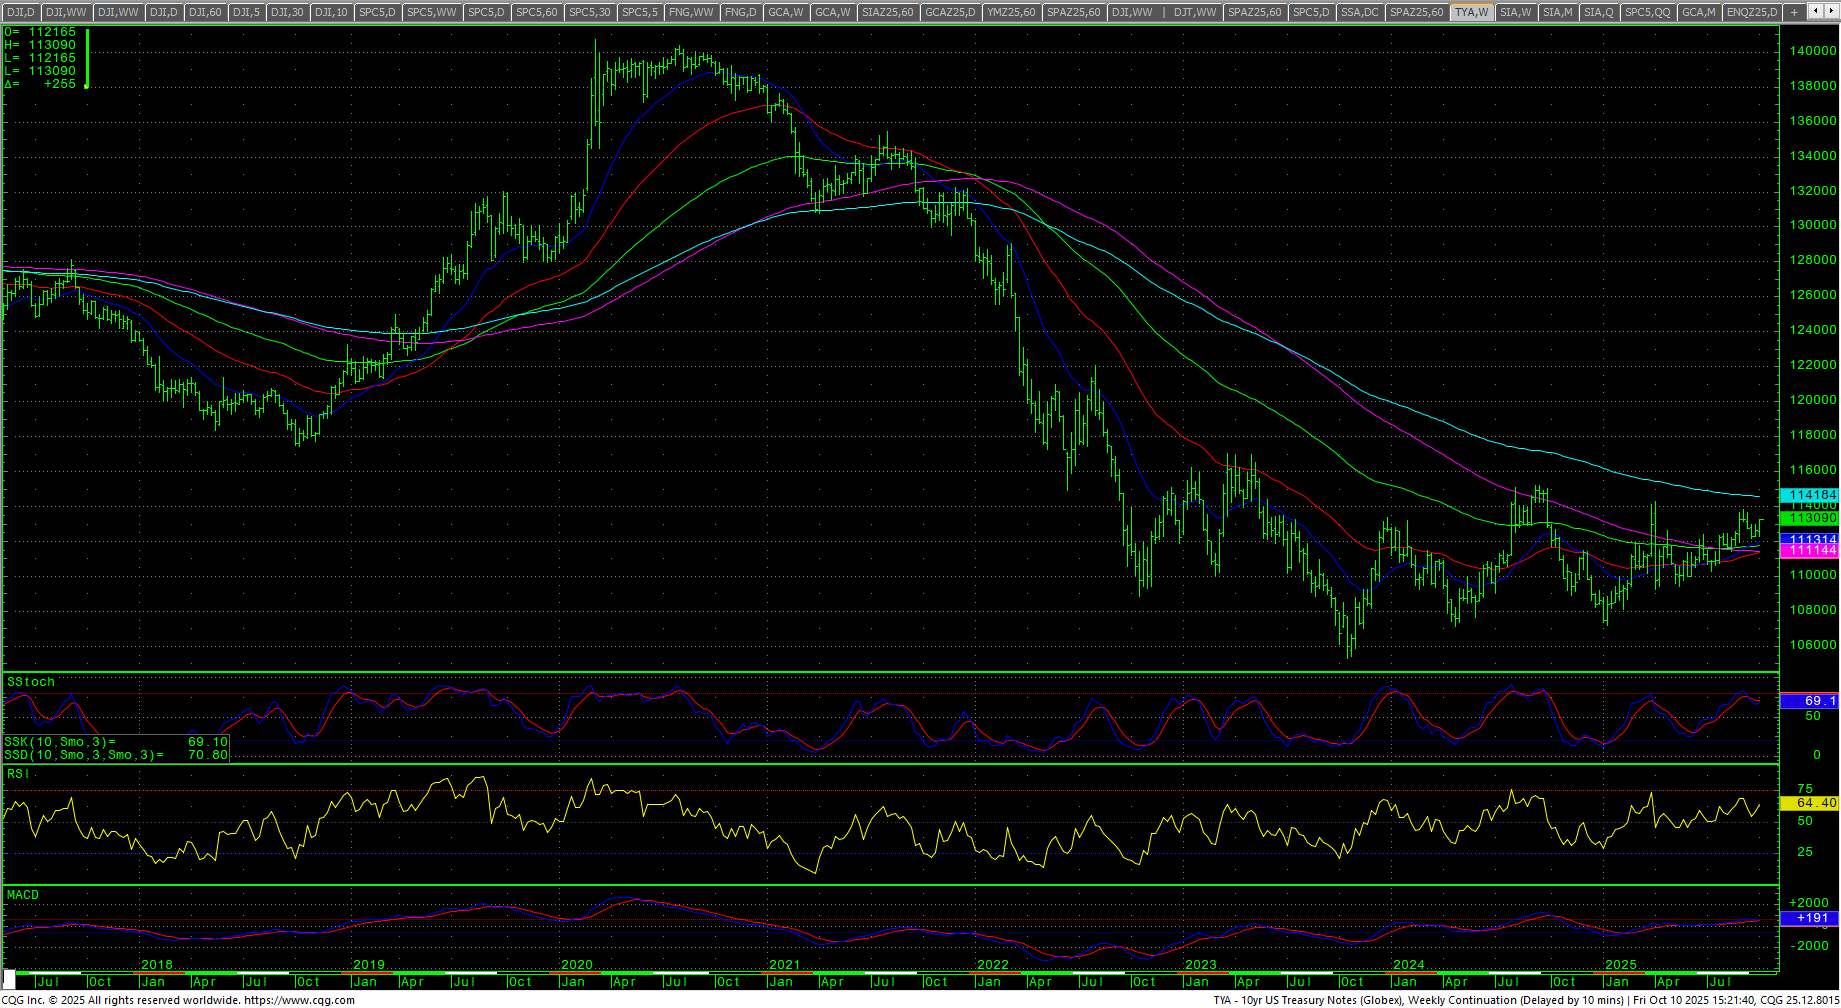
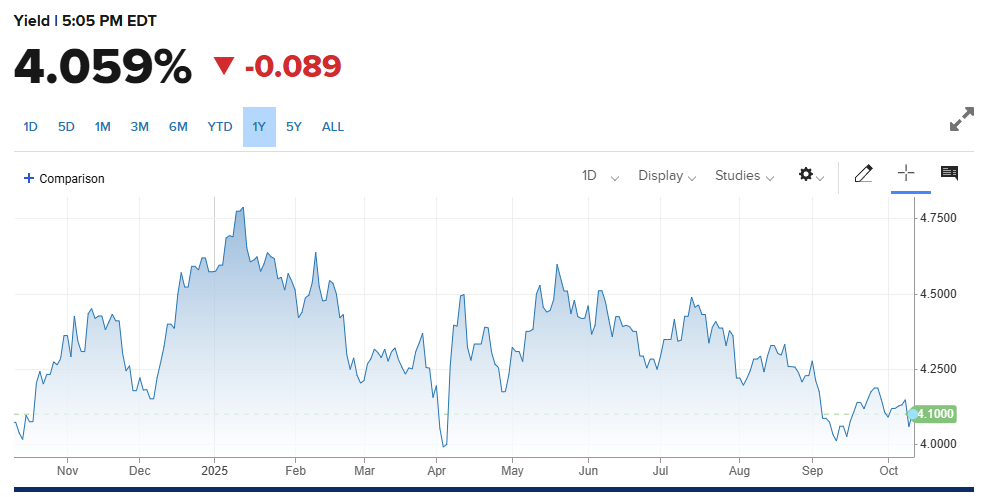
The RSP:SPY caved on the week, reversing from an intraweek rally and setting new multi-year lows. The weekly is trending lower in an oversold position and the MACD is down. Resistance remains at .294. The IWM staged an outside week down after setting new highs and closed down -3.27%. The RSP closed down -3.21% on the bottom of the weekly range. NVDA staged a reversal lower after setting record highs and closed down -2.38% on the bottom of the week’s range. Bitcoin set an ATH and then reversed lower, closing down -7.70% on the bottom of the range. Support remains at 112/110 and pivotal at 98.7. McClellan Oscillators are confirming Friday’s collapse in the Dow. The Yield Curve narrowed slightly, closing at +0.528%. The 10YR yield dropped, closing at 4.059%. Truflation was flat at 2.22%. Corporate bond spreads are at a 27-year low.
10YR-2YR Yield Curve Weekly

 VIX Weekly Candles
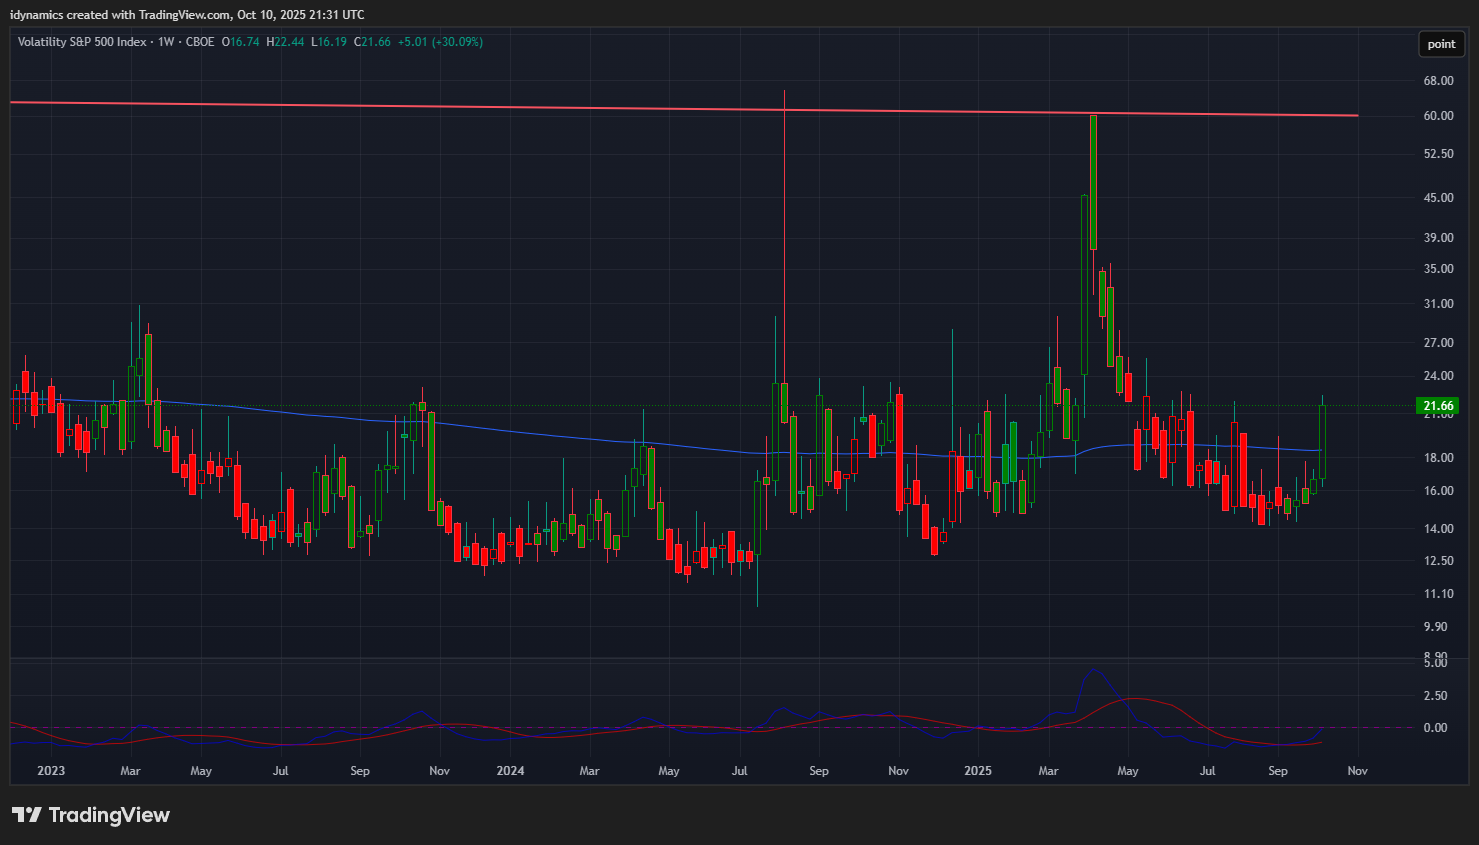
The VIX jumped sharply on Friday and closed out the week on the top of the range, up +30.09%, at the highest close since 19 May 2025. The US Dollar spent the week in higher territory but sold off Friday, ending the week up +1.17%.
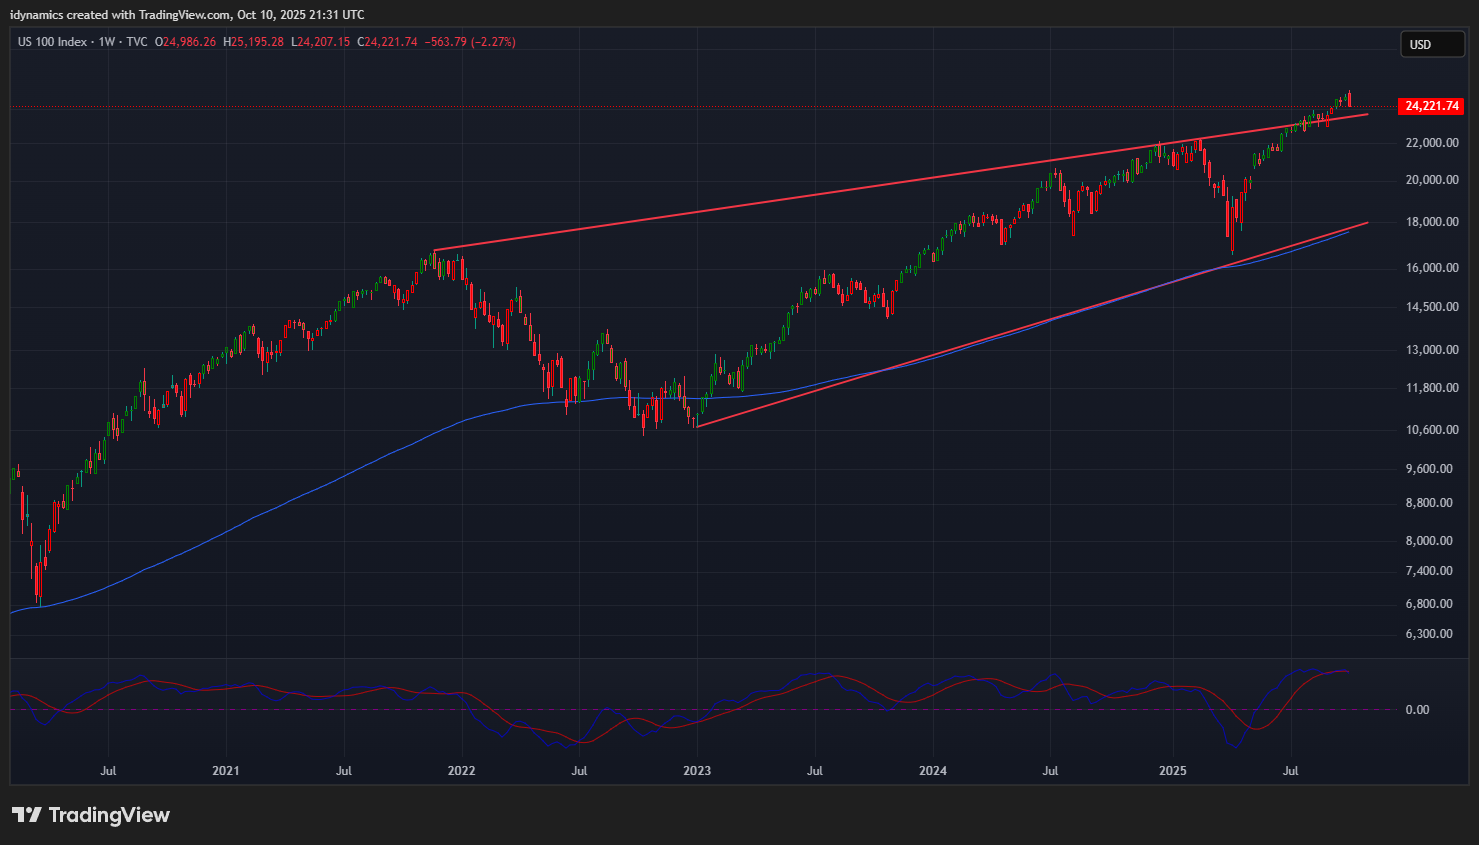
 Nasdaq 100 Weekly Candles
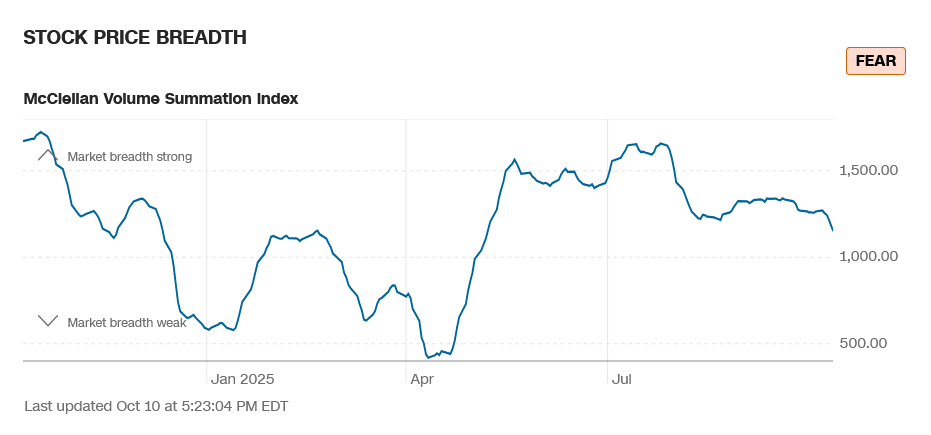
Daily Breadth 
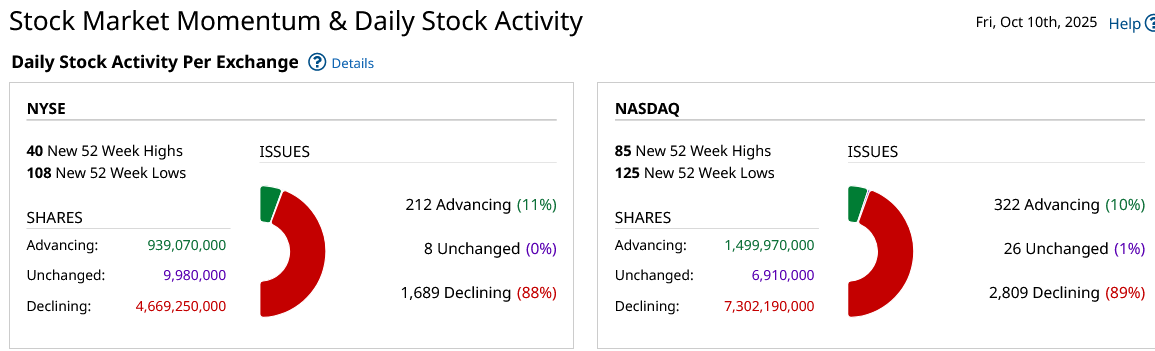
Breadth declined on the week and plunged Friday. Sentiment remains in fear.
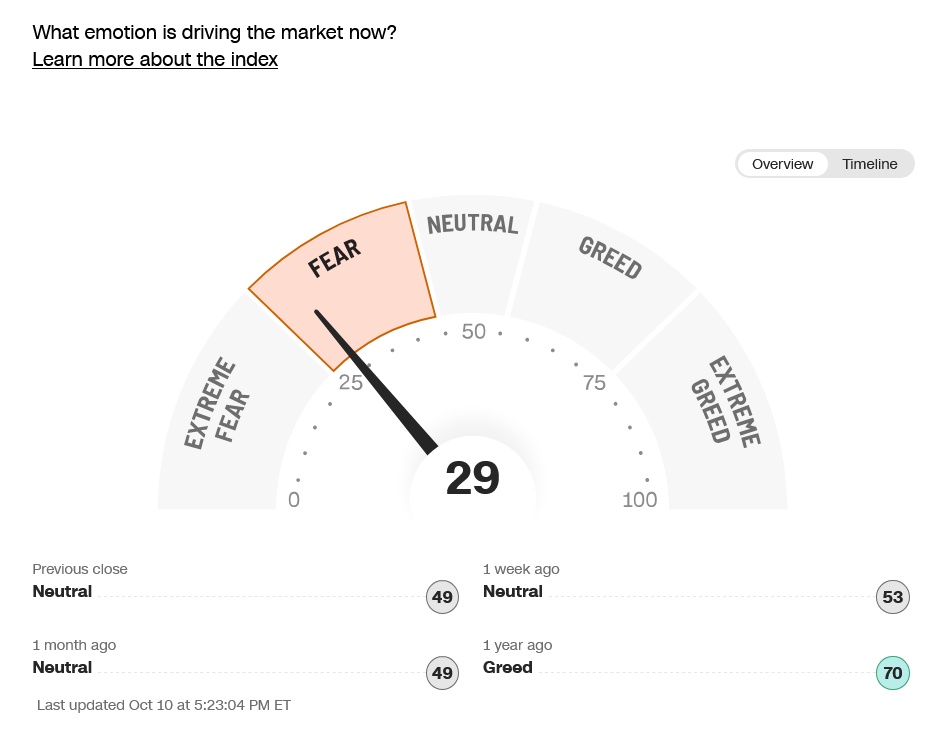
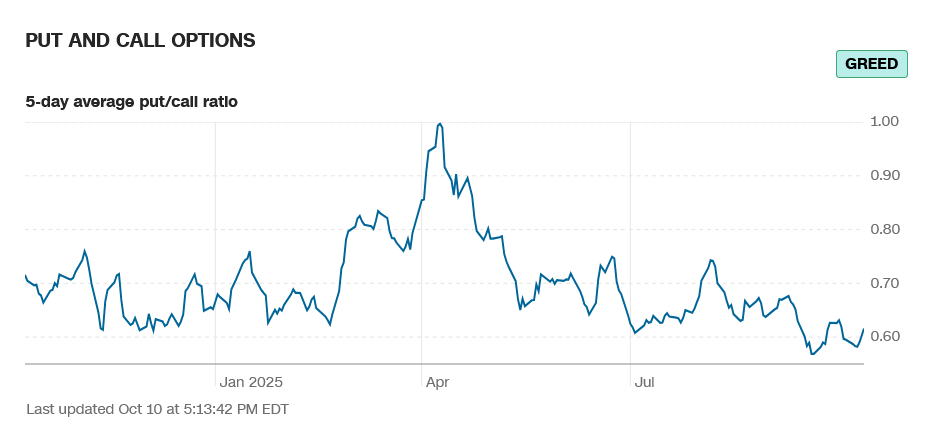
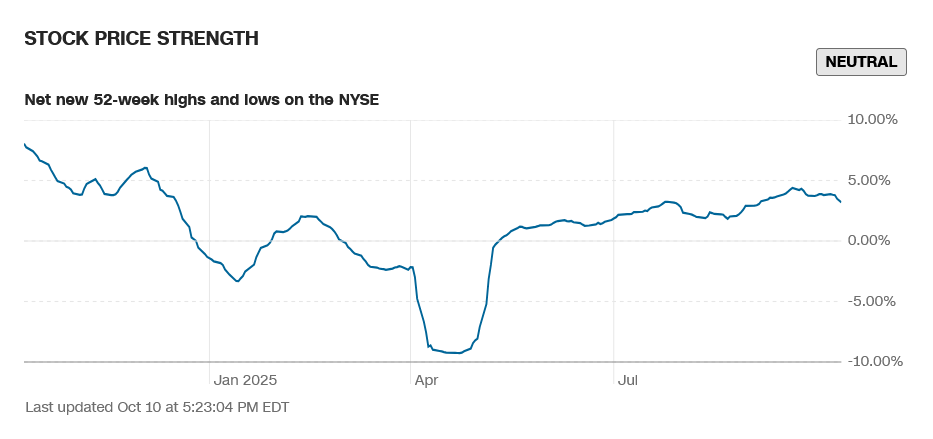
CNN Fear & Greed Index
 AAII Investor Sentiment Survey
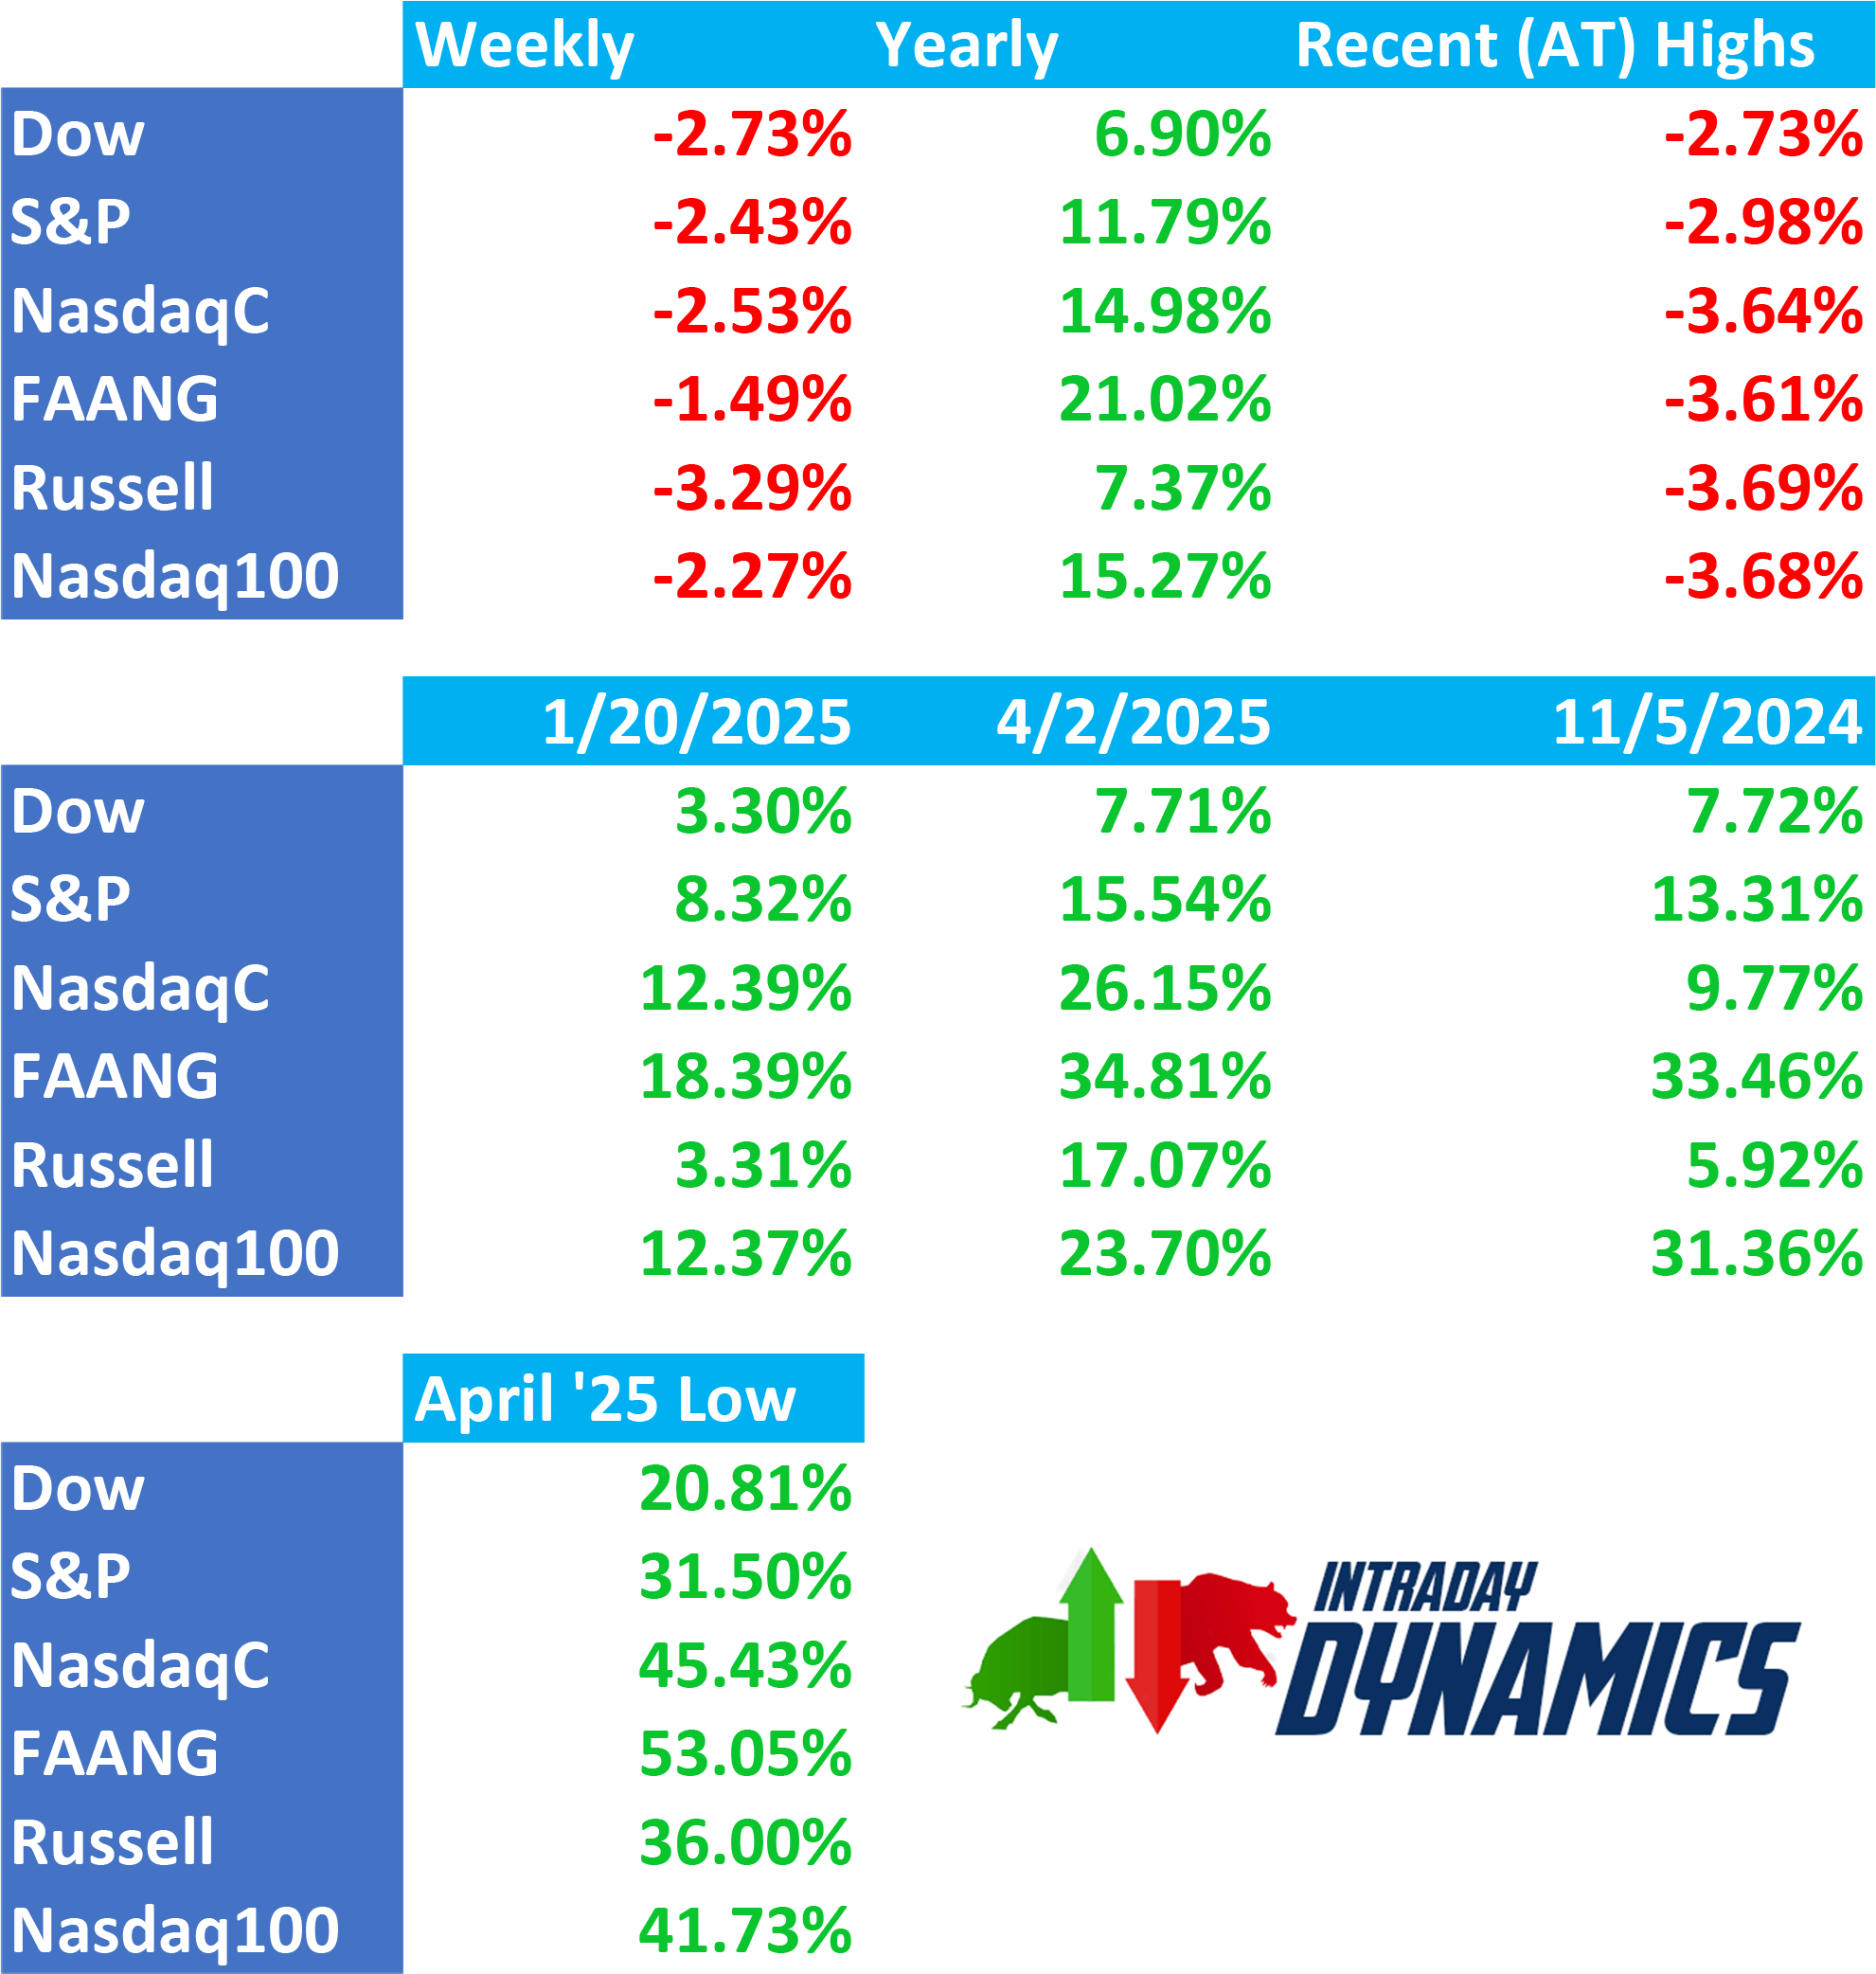
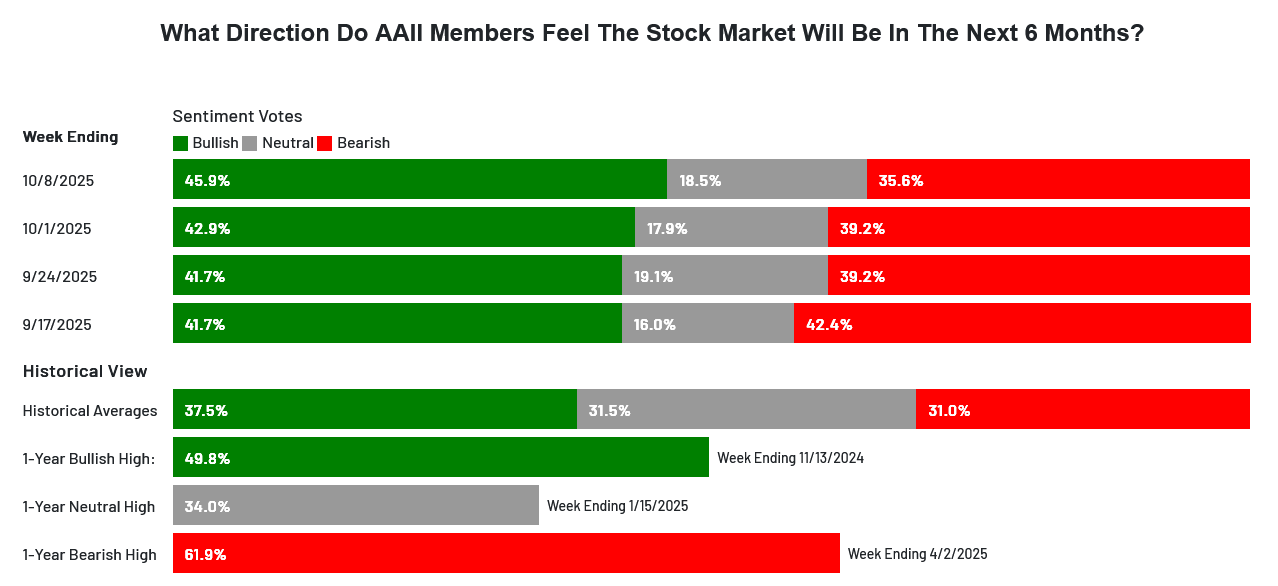 The CNN Fear and Greed Index is 29 and reads fear. Breadth declined on the week and reads fear. Latest AAII Sentiment Survey: Optimism Persists . The Dow A/D dropped to 6941. The VIX jumped sharply on Friday and closed out the week on the top of the range, up +30.09%, at the highest close since 19 May 2025. The Put/Call closed at 0.62 and reads greed. The 52-week, A/D dropped to +3.20% and reads neutral. The Dow closed the week down -2.73%, closing on the bottom of the week’s range. The S&P traded a record intraday high and closed down -2.43% on the bottom of an outside week down. The Nasdaq Composite was down -2.53% and the Nasdaq 100 was down -2.27%. The NYSE FANG closed down -2.53% on the low of the week’s range. The Russell was down -3.29% on the bottom of the range. The 10-year notes rallied and closed on the high of the week. The yield on the 10YR declined to 4.059%.
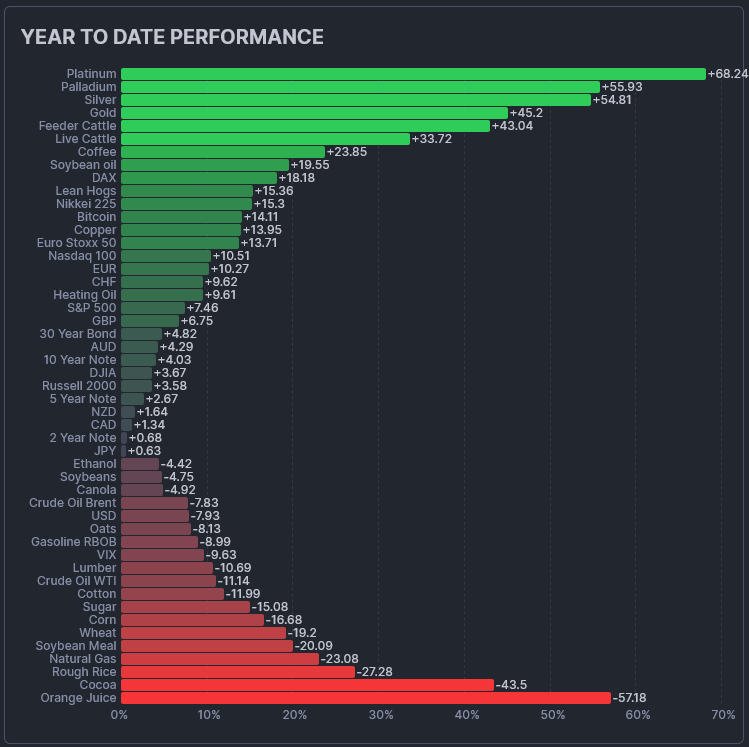
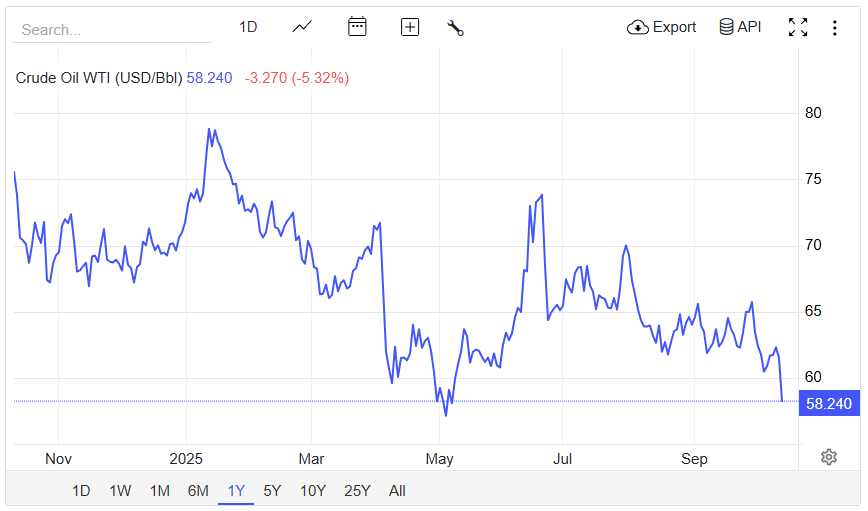
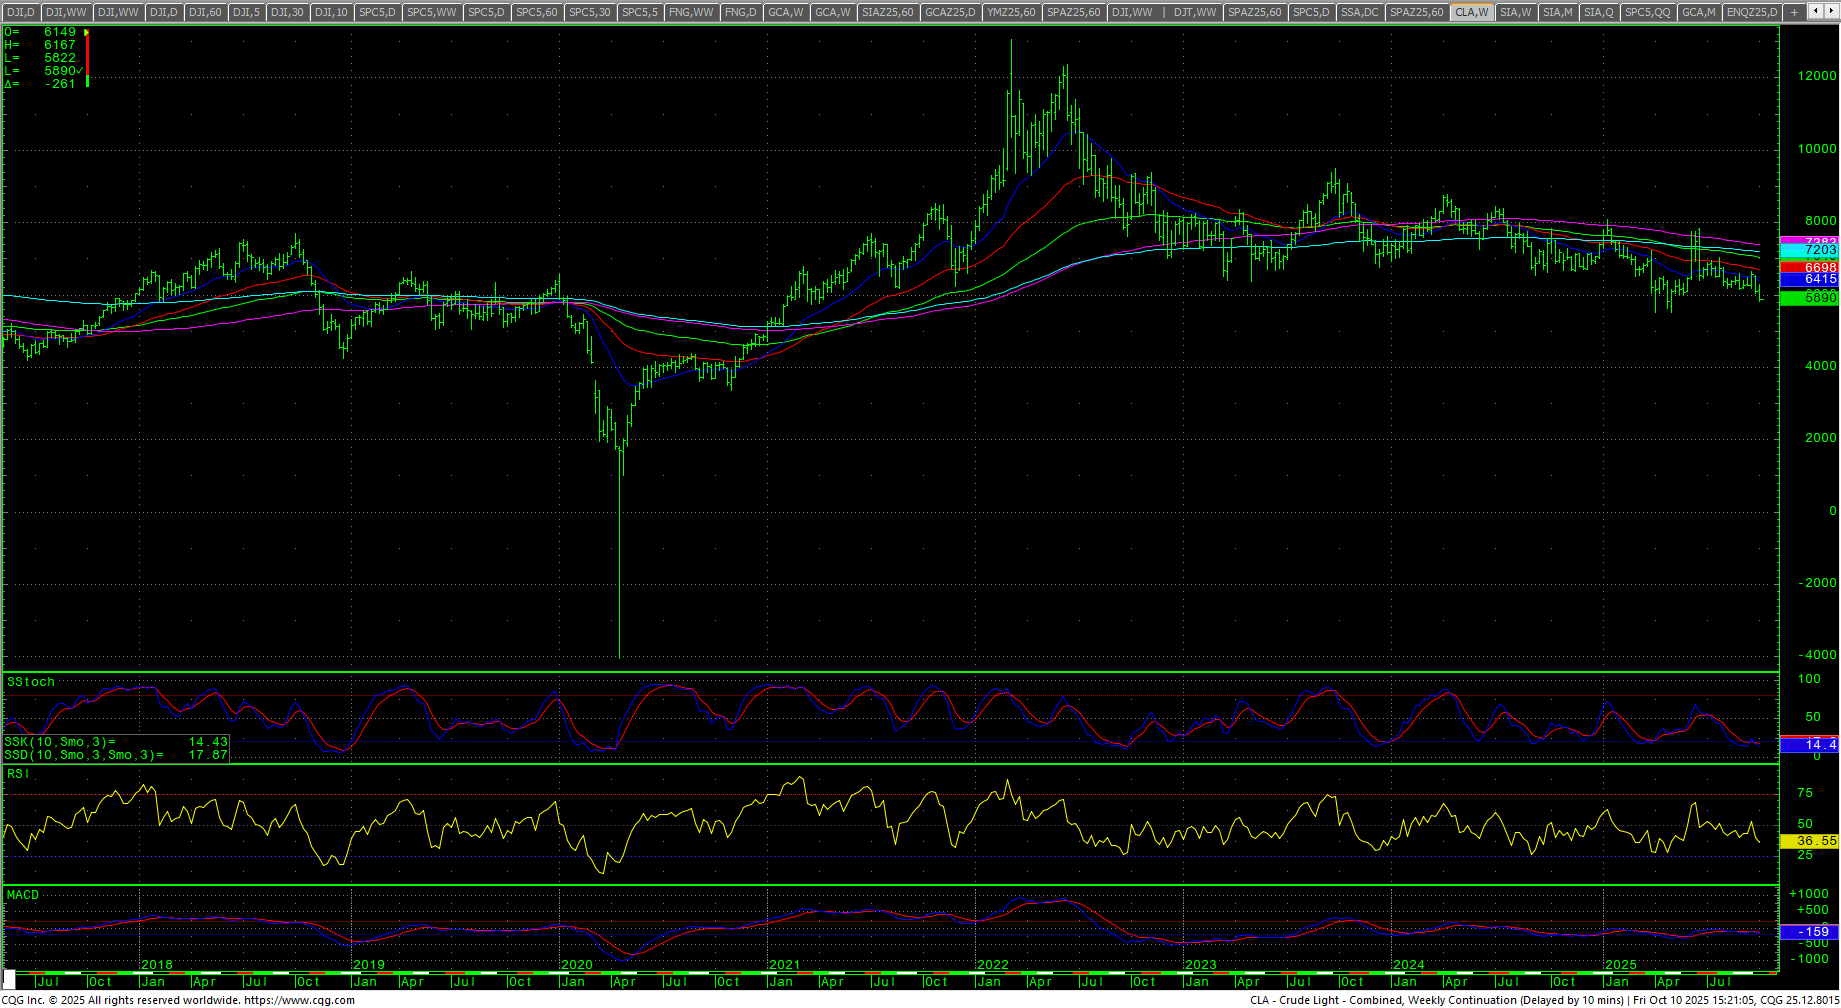
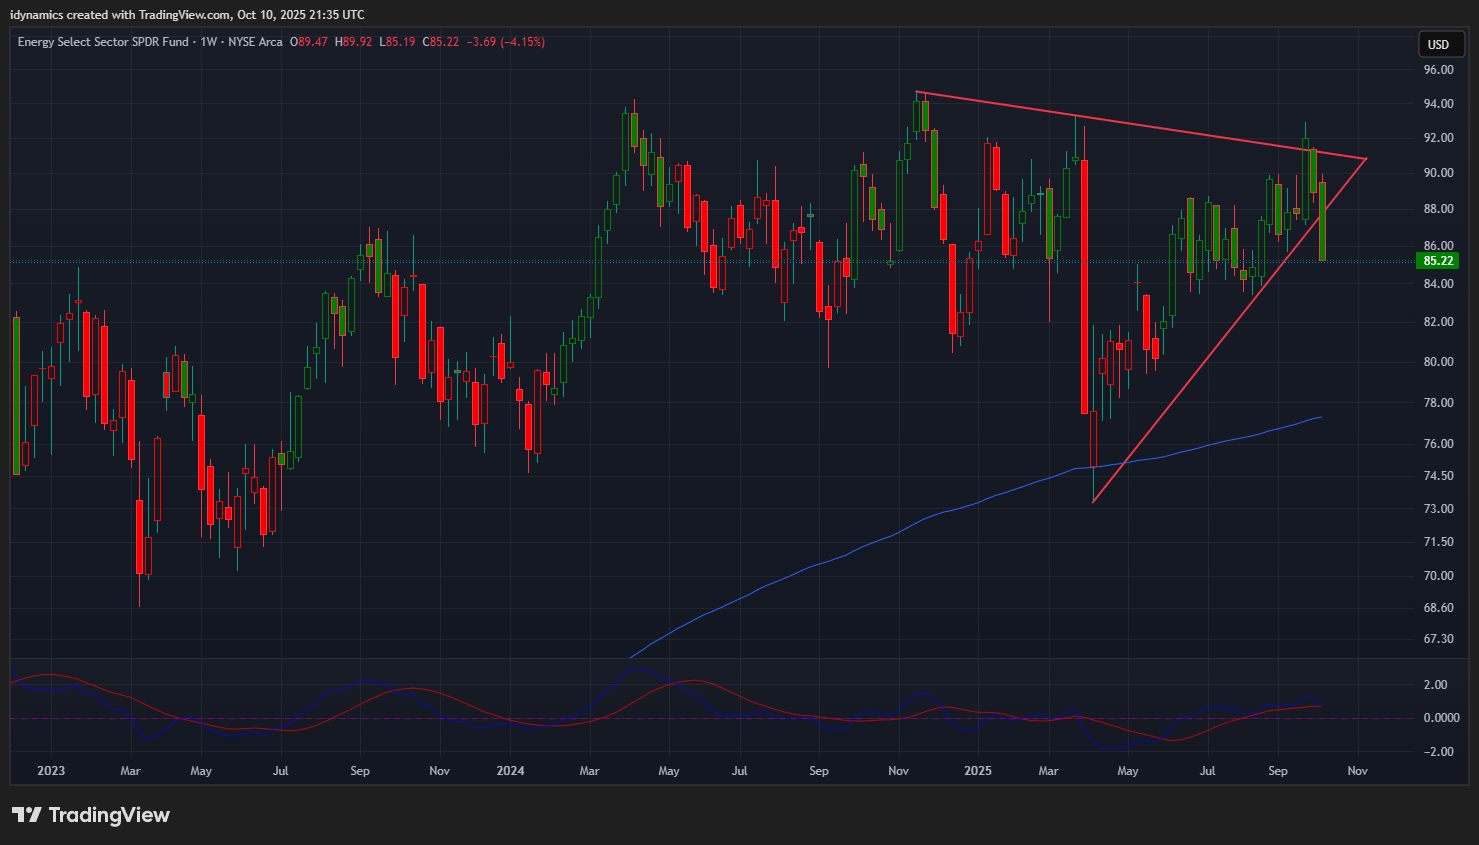
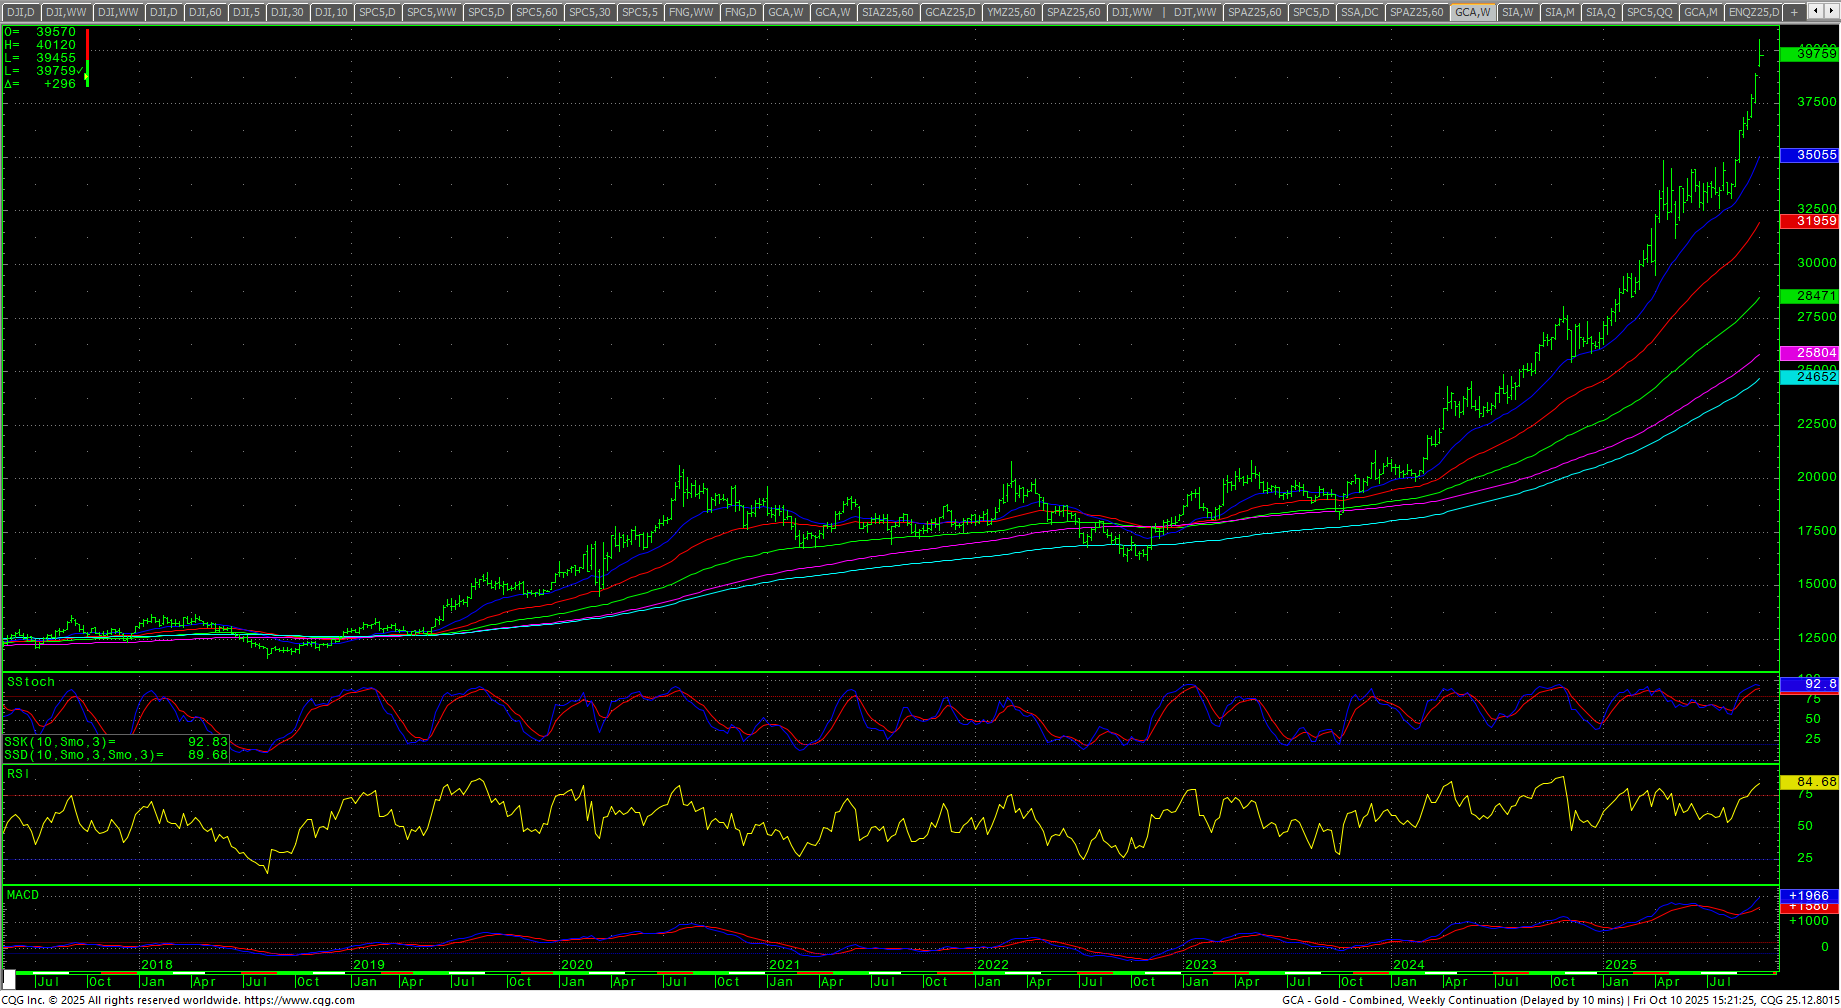
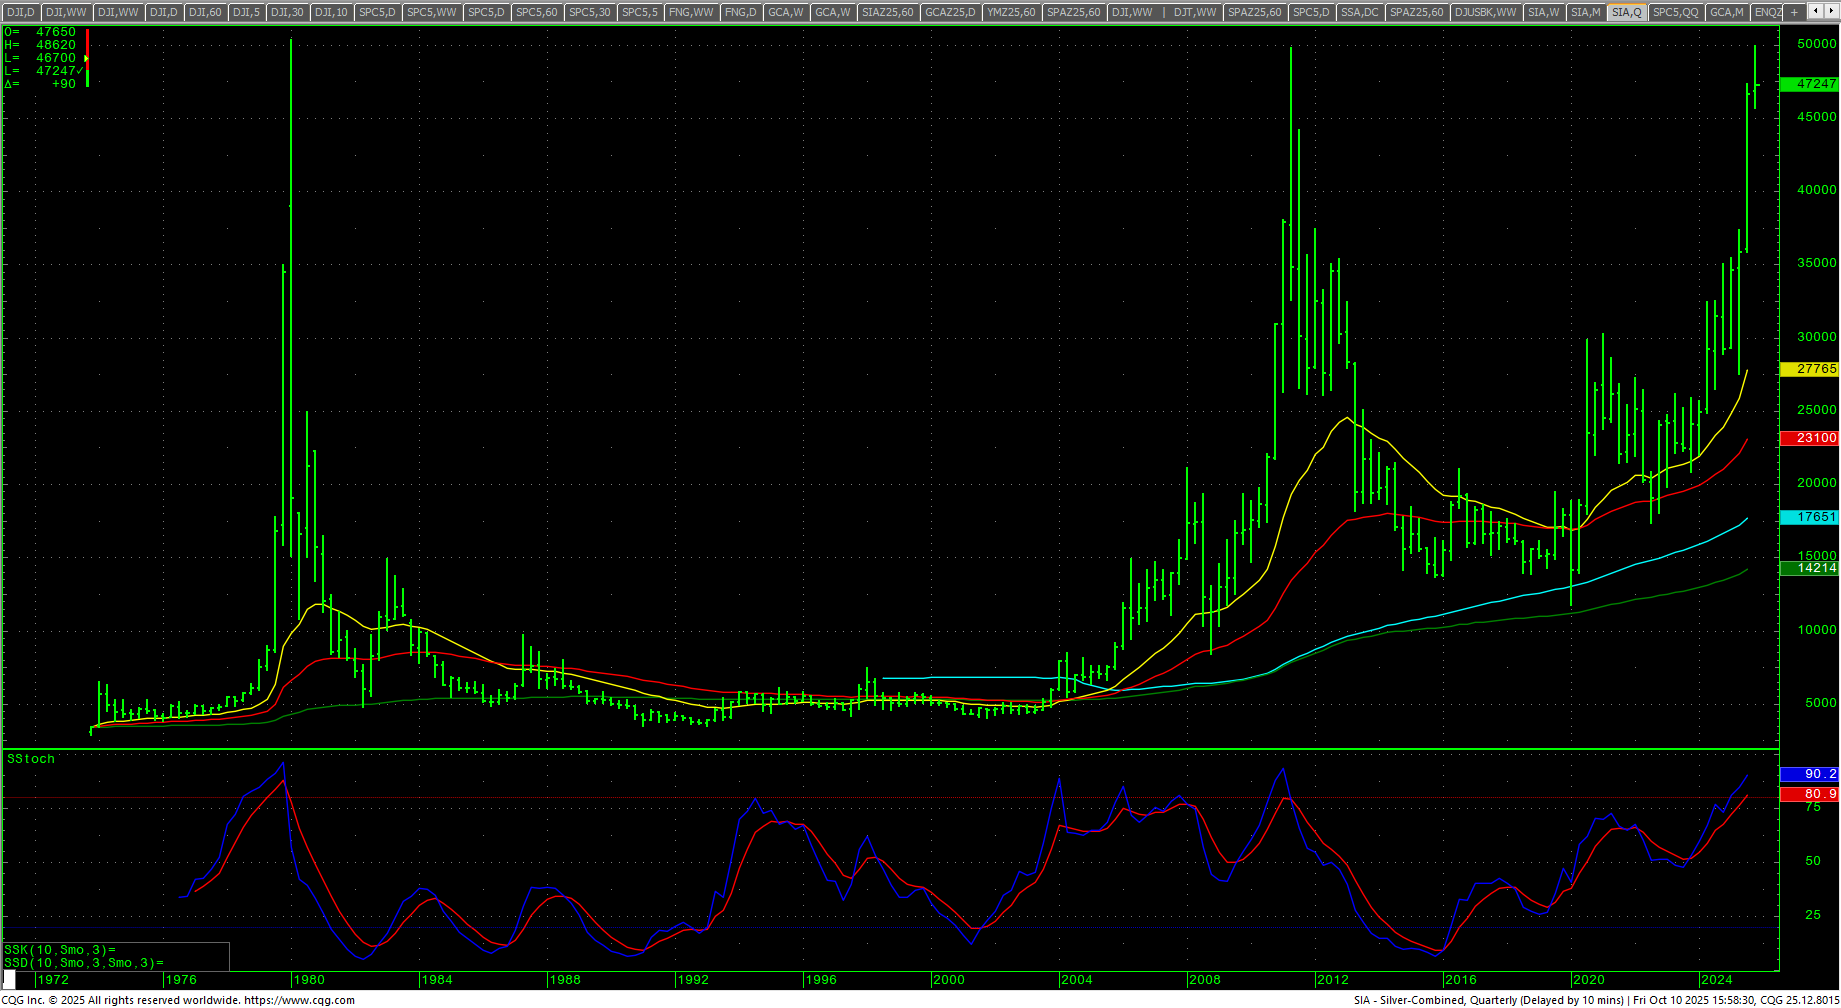 The CRB Index managed to close up +0.41% with the strength in metals. Crude oil crashed, taking out the $60 level and closing at the lowest weekly close since 28 April 2025. The XLE followed oil and plunged after a massive upside failure. Gold rocketed to record highs and traded above $4000 for the first time in history, which put it in the headlines and then brought in profit taking. Silver exploded with spot futures testing the ATHs above the $50 level. The CoT for the S&P 500 showed small speculators continuing to enter the market with asset managers selling to them. The CFTC S&P 500 Non-Commercial Net Positions did not report, last reading was -172.549K.
Timing Points
Today marks critical cycle timing. The next major dates are 10/28-29.
- 10/13 *** X
- 10/22 ***
- 10/28-29 *** X
Dow Jones Industrial Average
Dow Jones Industrial Average Weekly H-L-C
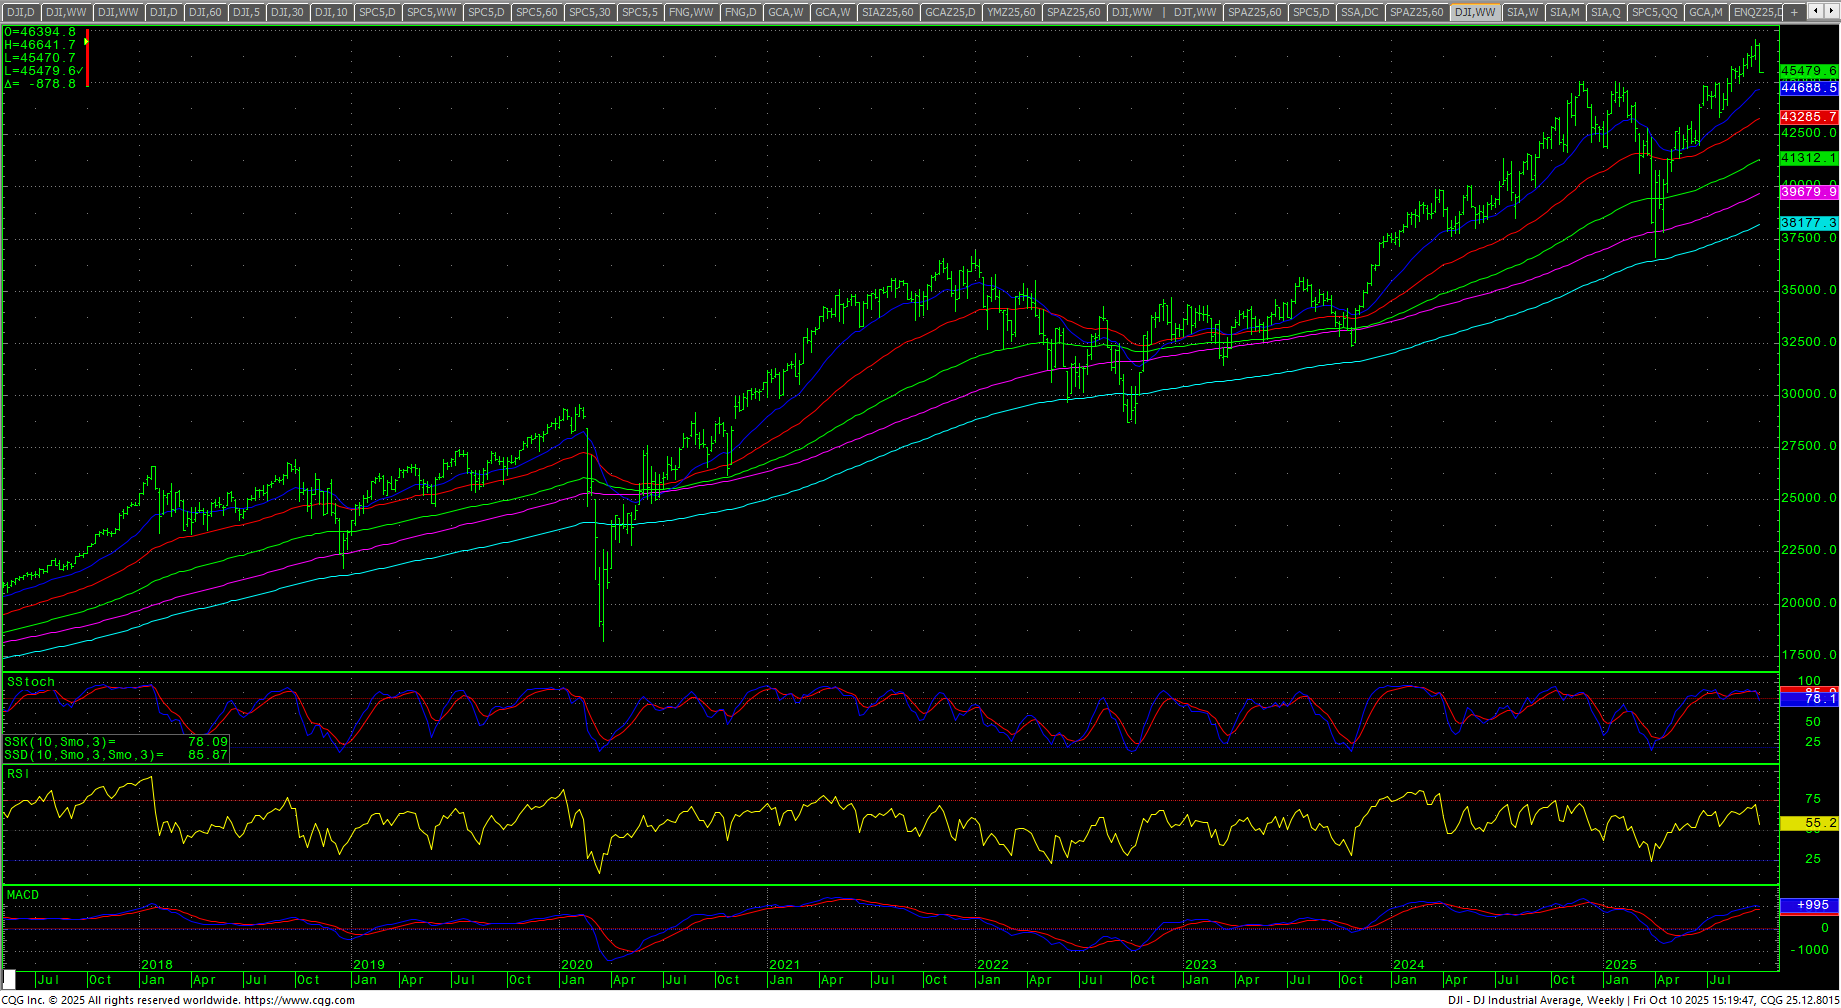 The Dow closed the week down -2.73% on the bottom of the range. The daily stochastics and MACD turned down as they react to numerous preliminary bearish divergences. The daily RSI plunged to 28.67. The 200-day MA starts the week at 43654.50 and is at record highs. As suggested last week, the trade under the previous Friday’s candle (Green Shooting Star), initiated short-term selling.
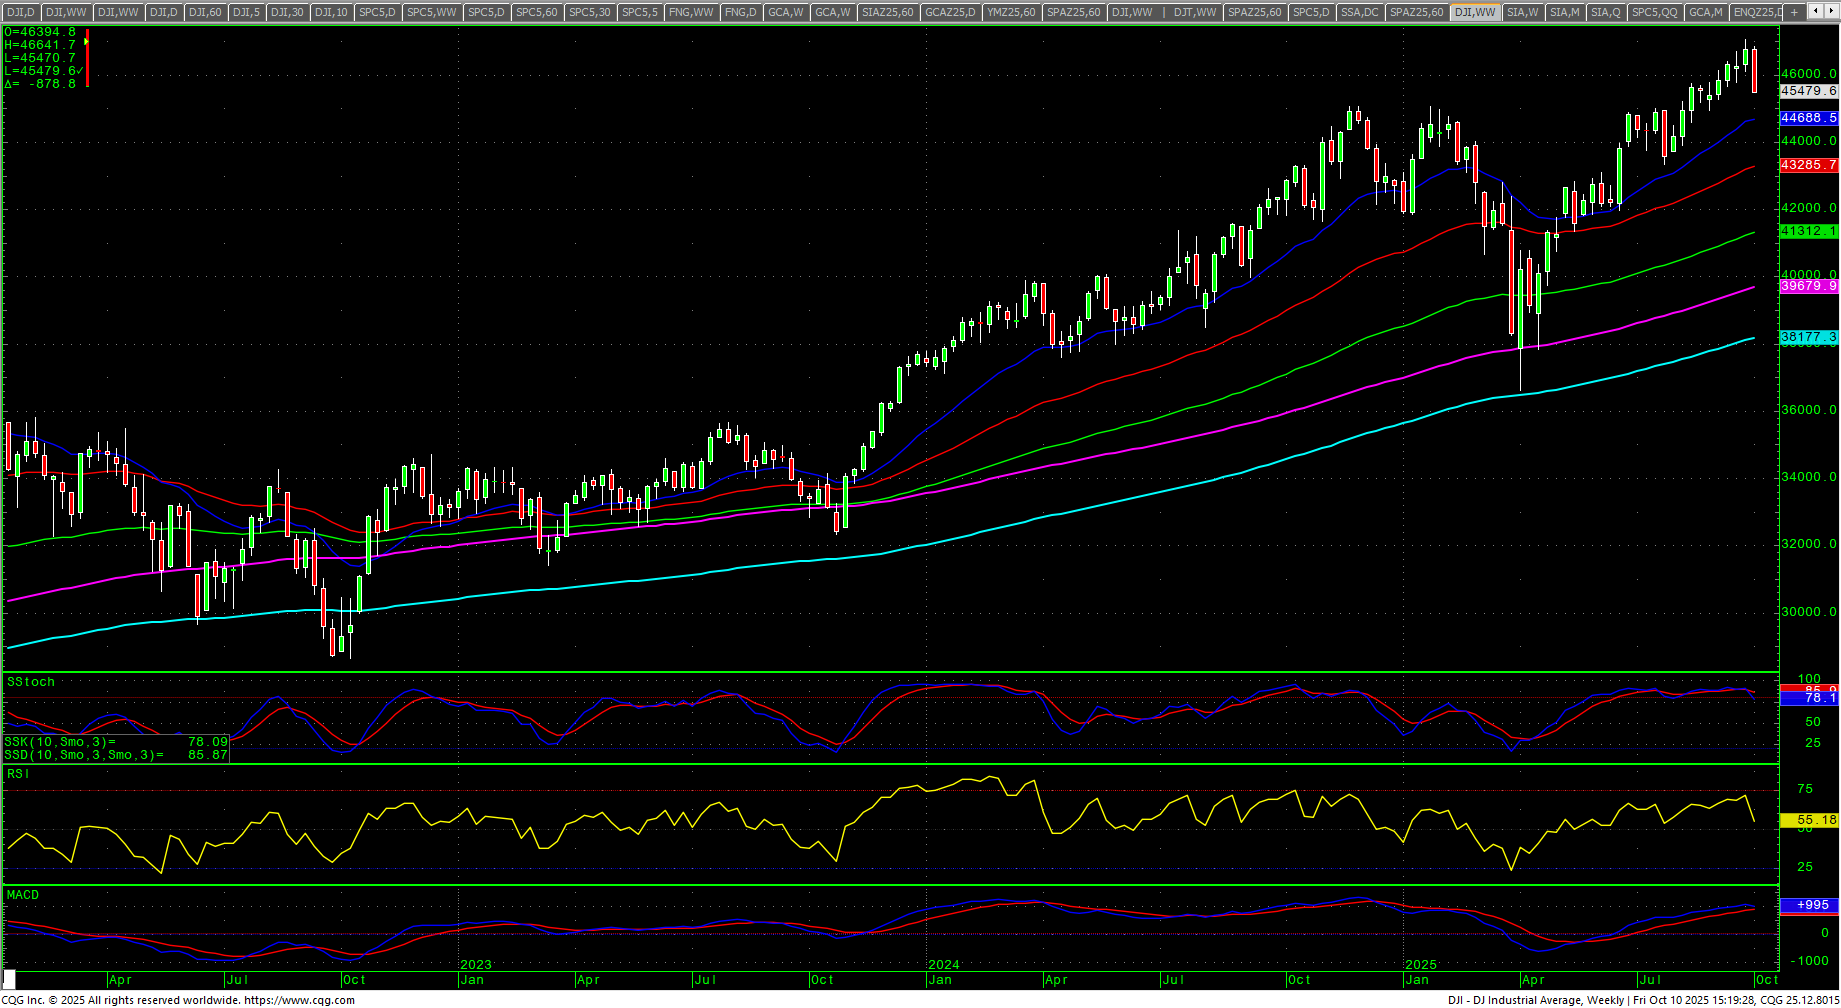
Dow Jones Industrial Average Weekly Candles
 The hourly is oversold on Friday’s close and prices cleared support at 45632. A further breakdown under 45632 sets up 45195 with counts to critical short-term support at 44757/44754 with support at 44976 and 44851/44948. Closs under 44754 opens counts to 44268 through 44215. Under 44215 sets up a retest of the 43340 area.
Dow Jones Industrial Average Hourly H-L-C
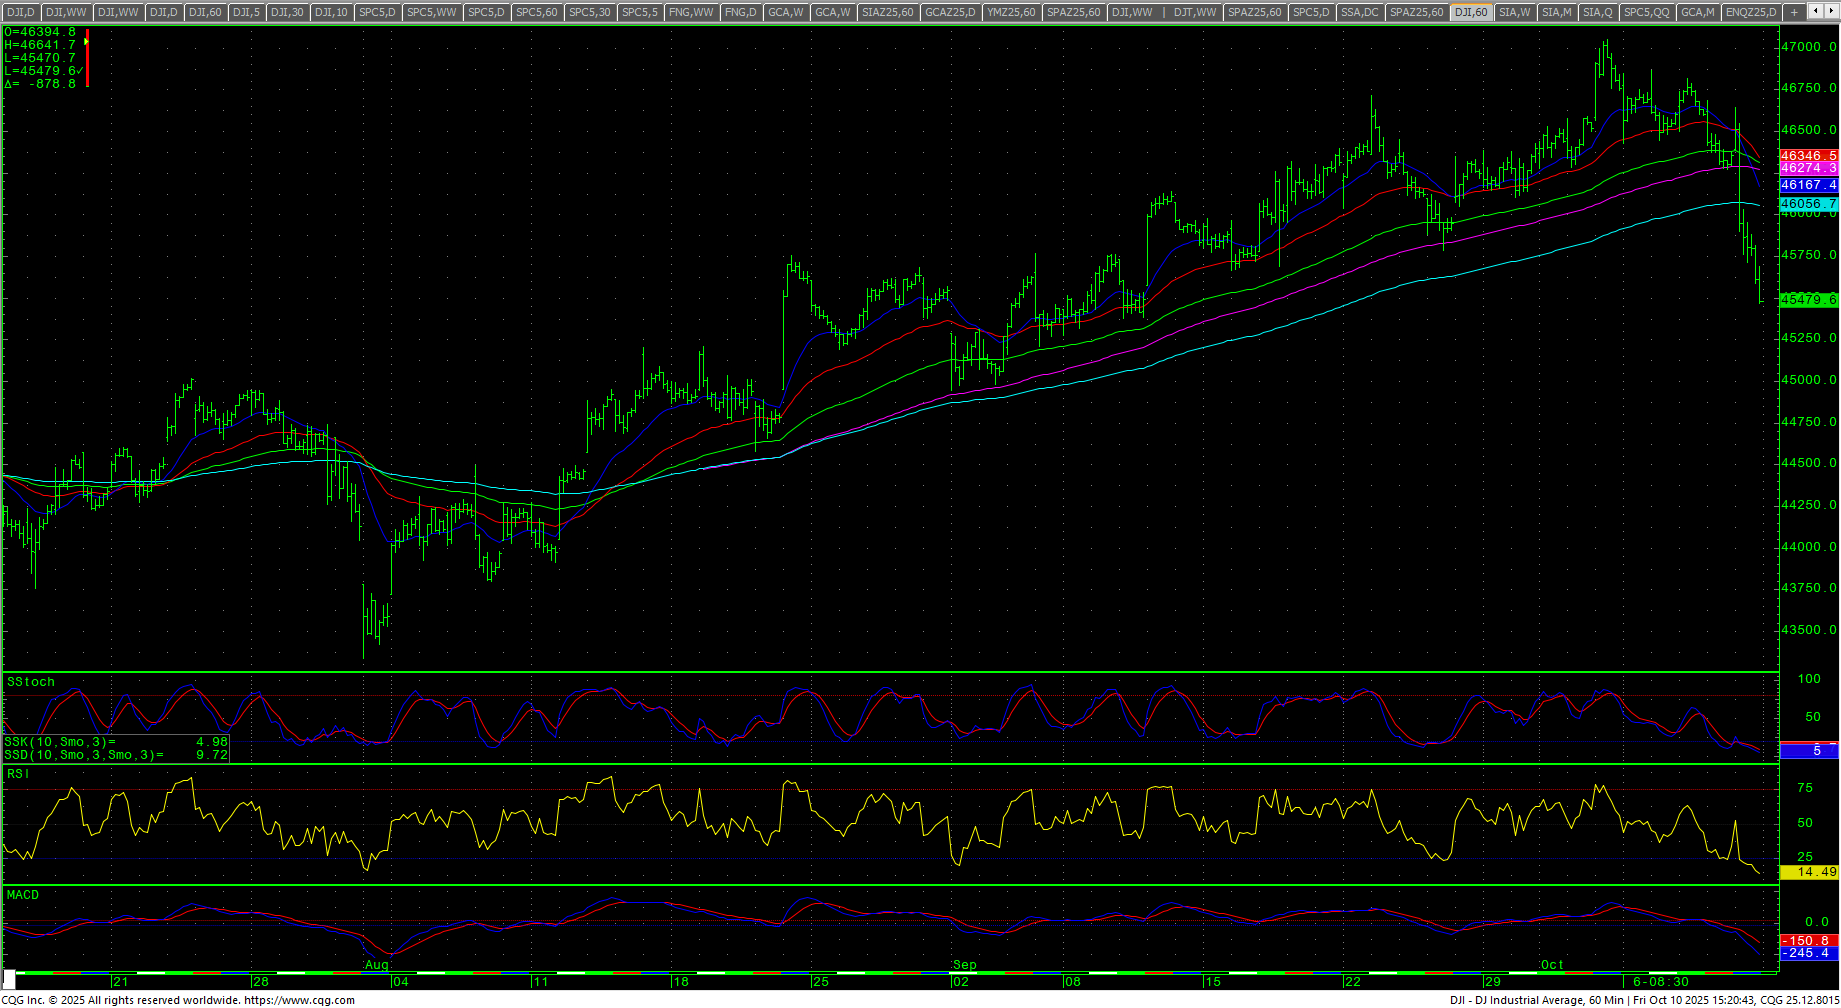 Resistance is 45843 and 46073. A drive above 46073 count to 46260 and pivotal hear-term resistance at 46446/46450. Closes over 46450 should minimally test 46854/46876 and opens counts to retest the record intraday highs at 47048/47070. Closes over 47070 set up 47142 with counts to 47214. Closes over 47214 should test 47286 with full counts toward critical resistance of 47400/47430. Closes over 47430 will open counts to 47520 and 47610.
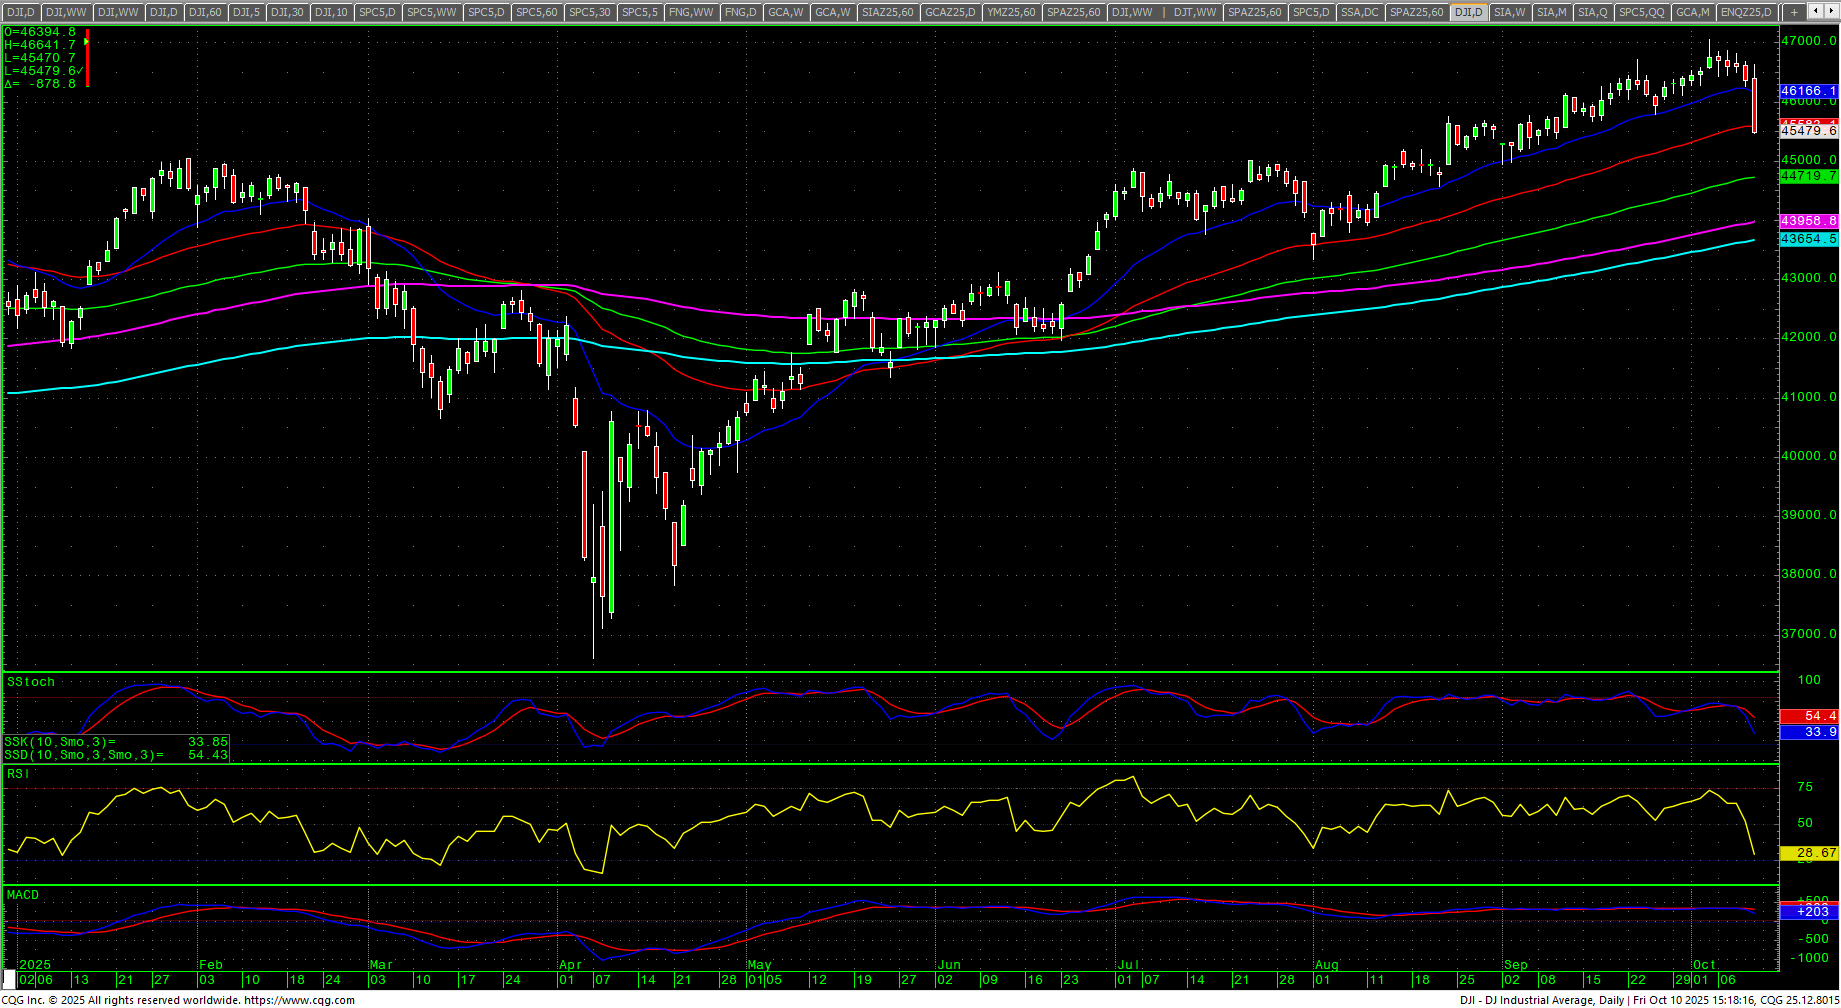
Dow Jones Industrial Average Daily Candles
| Resistance | Support |
|
|
S&P 500 Cash Index: SPX
S&P 500 Index Weekly H-L-C
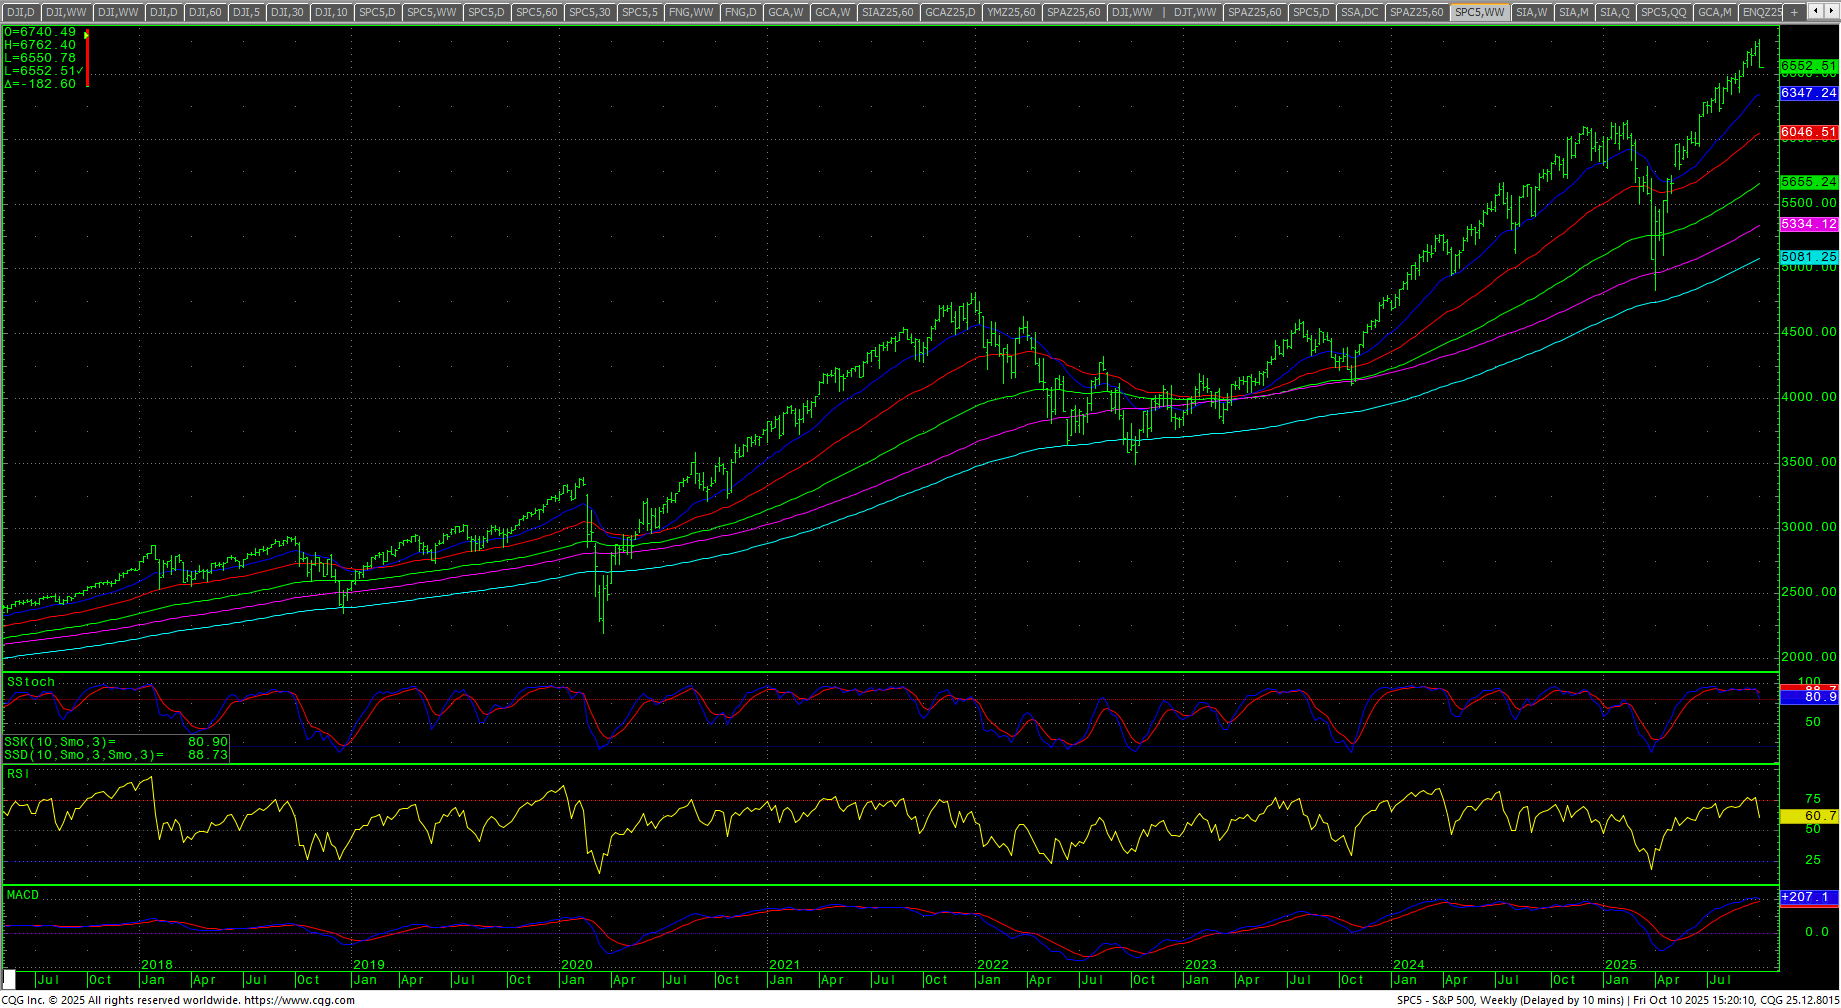 The S&P traded a wide outside week down and closed on the bottom of the range, down -2.43% after trading into new intraday highs mid-week. The daily is down as the stochastics and MACD react to multiple bearish divergences. The weekly is up and threatening a hook lower with a bearish divergence. The daily RSI plunged to 33.28. The hourly is oversold with Friday’s collapse. The 200-day MA is 6123.91 and at record highs.
SPY Weekly Candles
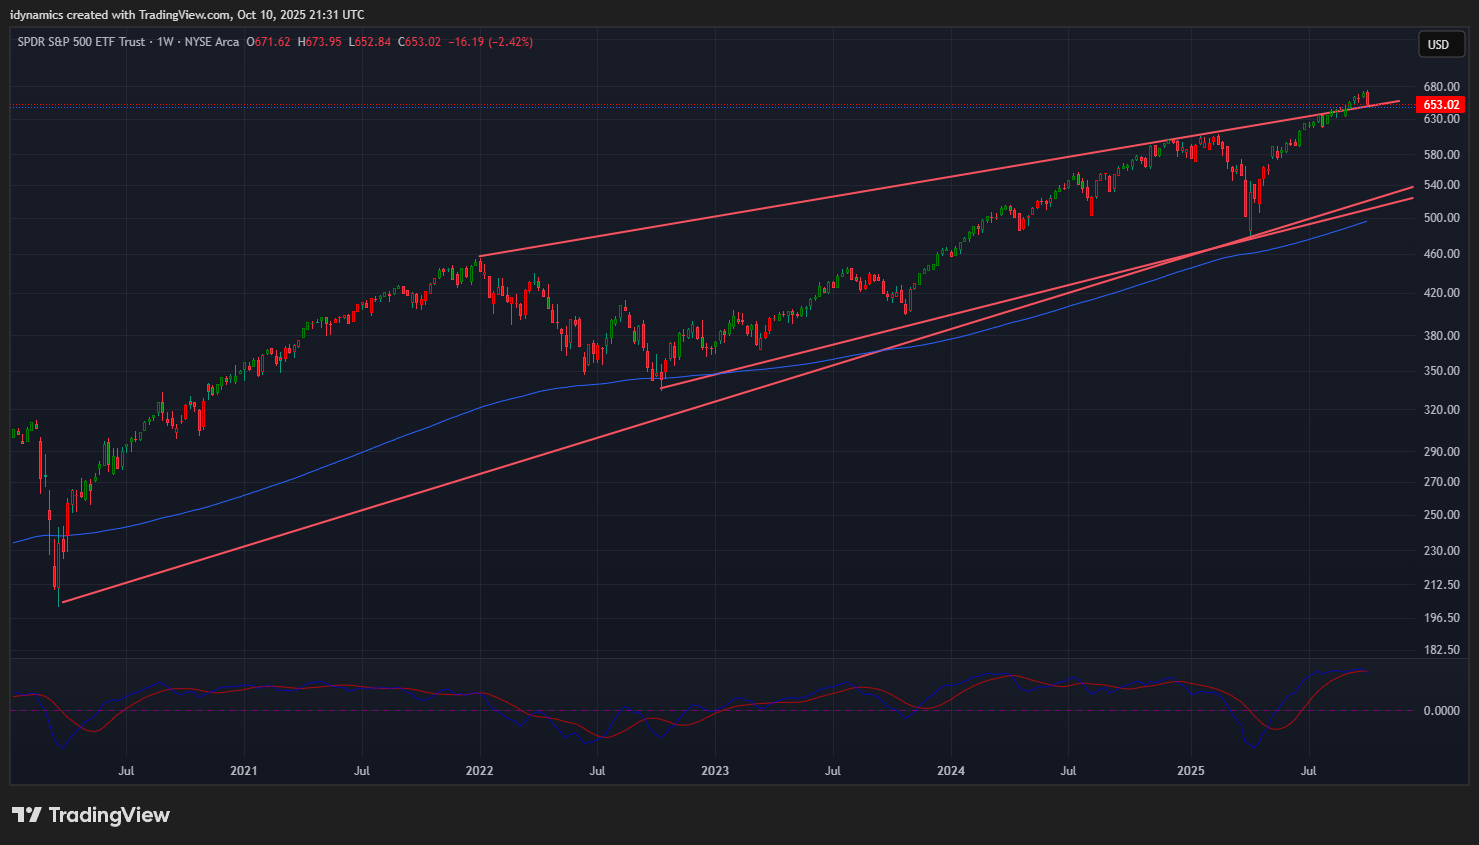 The market took out a key level of support at 6562 and closed blow that area and the action suggests a test of pivotal near-term support at 6514/6510. Closes under 6510 open counts to key support at 6361/6360. A breakdown under 6360 should test 6307 with full counts into the 6027/6026 level with critical hourly support at 6212/6201. Daily closes under 6026 should minimally test 5952 and 5799/5798 with counts to 5571/5568.
S&P 500 Index Hourly H-L-C
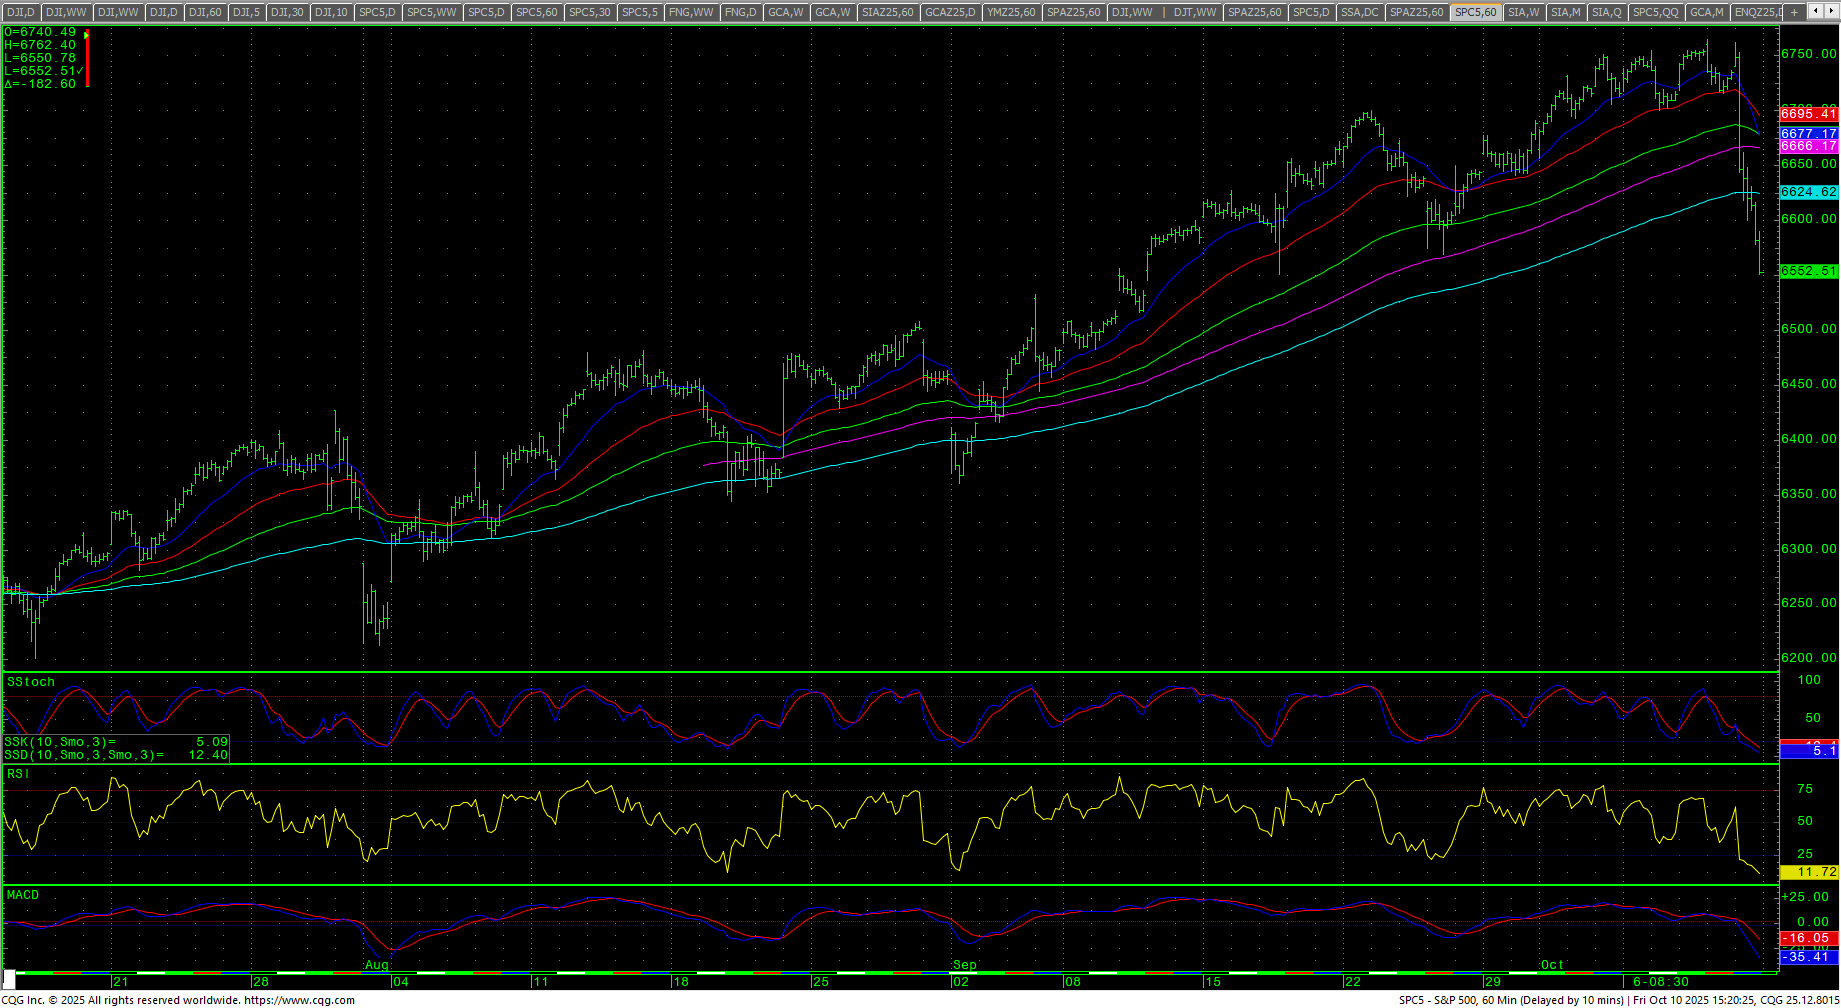 Resistance is 6601 and 6632/6633. A drive above 6633 sets up 6658 with counts to near-term pivotal resistance at 6682/6685. Rallies over 6685 should test 6711/6714 and opens counts to the intraday highs at 6762/6764. A move above 6764 should test 6800. Closes over 6800 can carry to 6872 and 6908. Closes over 6908 have counts to 6944 and 6980 through 7016. A close over 7016 offers counts to 7088, 7160 and 7214. Closes over 7214 setup a drive to 7250 and 7286 while opening counts as high as 7448.
| Resistance | Support |
|
|
Charts courtesy of CQG, Inc., CNN, Koyfin, Trading View and AAII