
TECHNICAL ANALYSIS (by Intraday Dynamics)
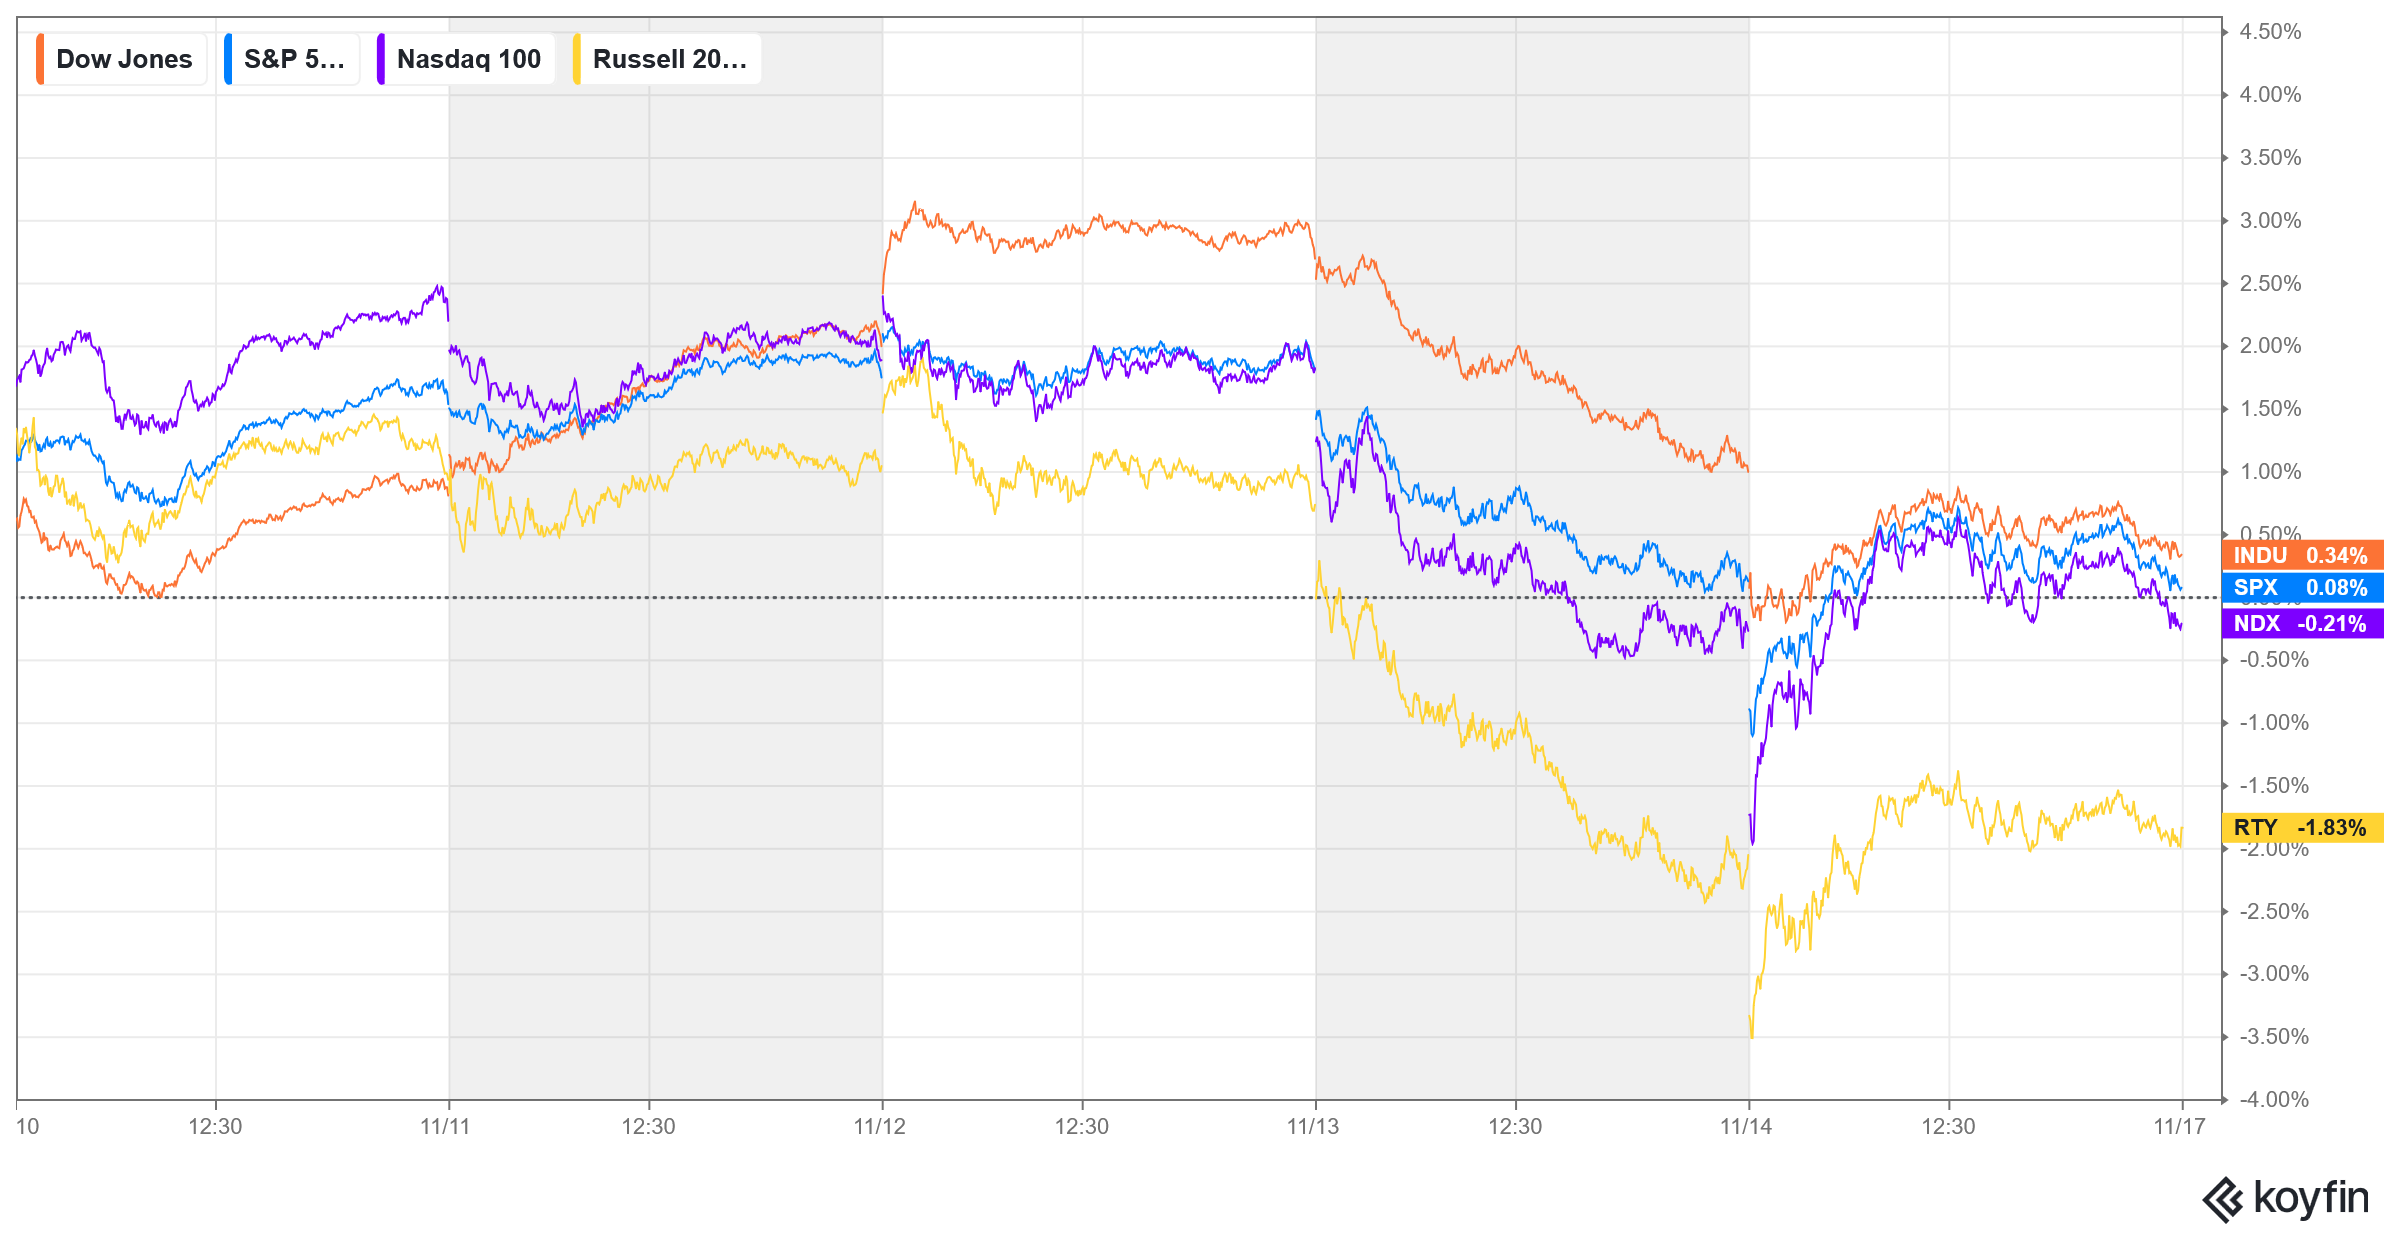
Major Indices Week of November 14, 2025
 NYSE Volume

 Call Volume
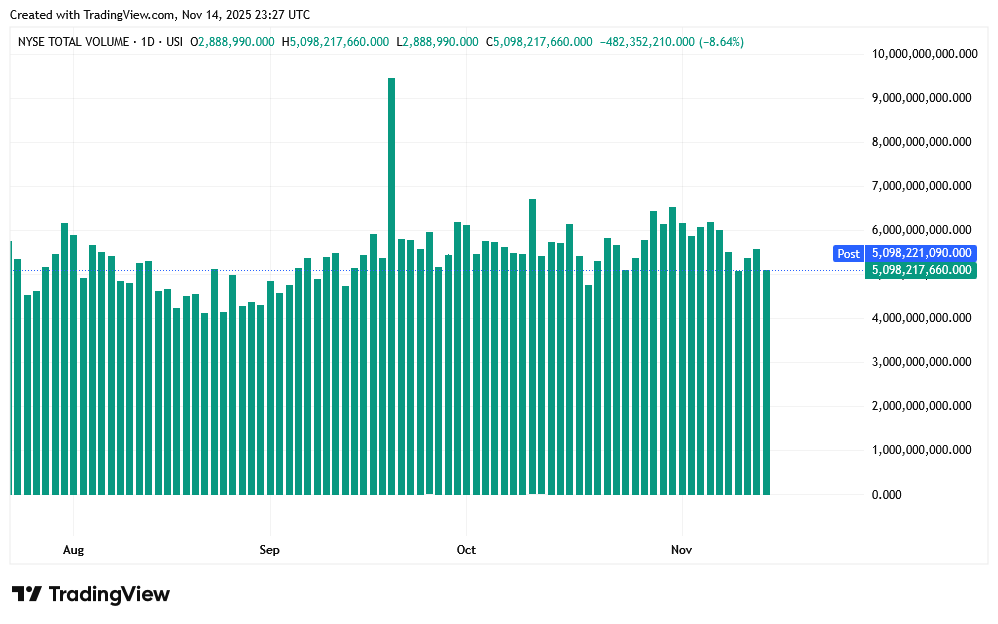
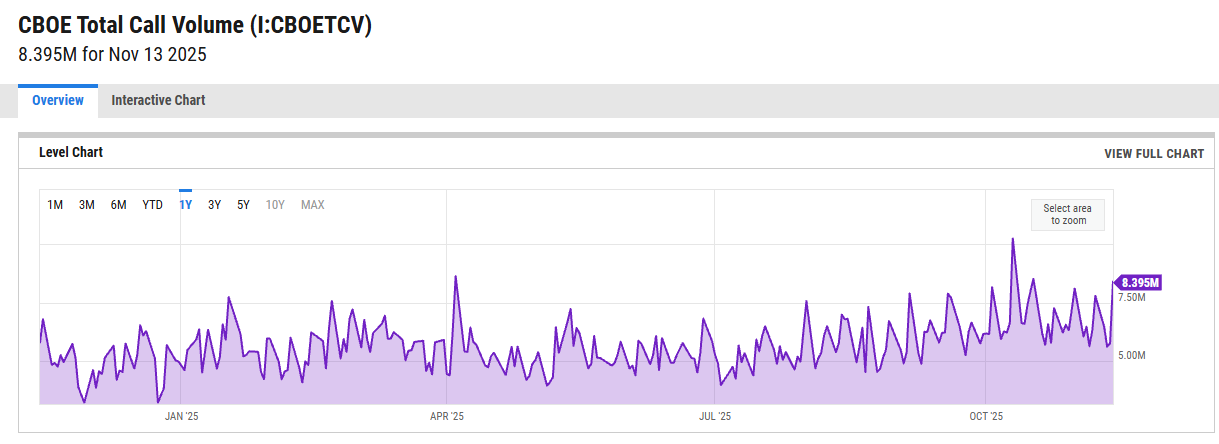 As goes tech, so goes the market. Stocks traded another wildly volatile week, although volume diminished slightly overall. Secondaries and tech led the way lower. Sentiment is still widely divergent with most pedestrian metrics in extreme fear and the retail trade ebullient and feeling bullet-proof as call volume remains elevated. (Rise Of Retail Traders, 0DTE Options) Along with the recent cluster of Hindenburg Omens, we are getting the volatility that often accompanies shifts in trends. It was a crazy week and here are just a few of the occurrences this past week.
- Dow Hits ATH +$48K
- Michael Burry Quits
- Solar flares (CMEs) C5.1 flare in the top 39 all-time, traveling at 1500 miles per second. A geomagnetic superstorm causing R3 level blackouts and GPS disruptions. Forecasts for a double peak solar maximum now.
- U.S. Government Shutdown Ended
- Silver Hits ATH +$54 and Collapses
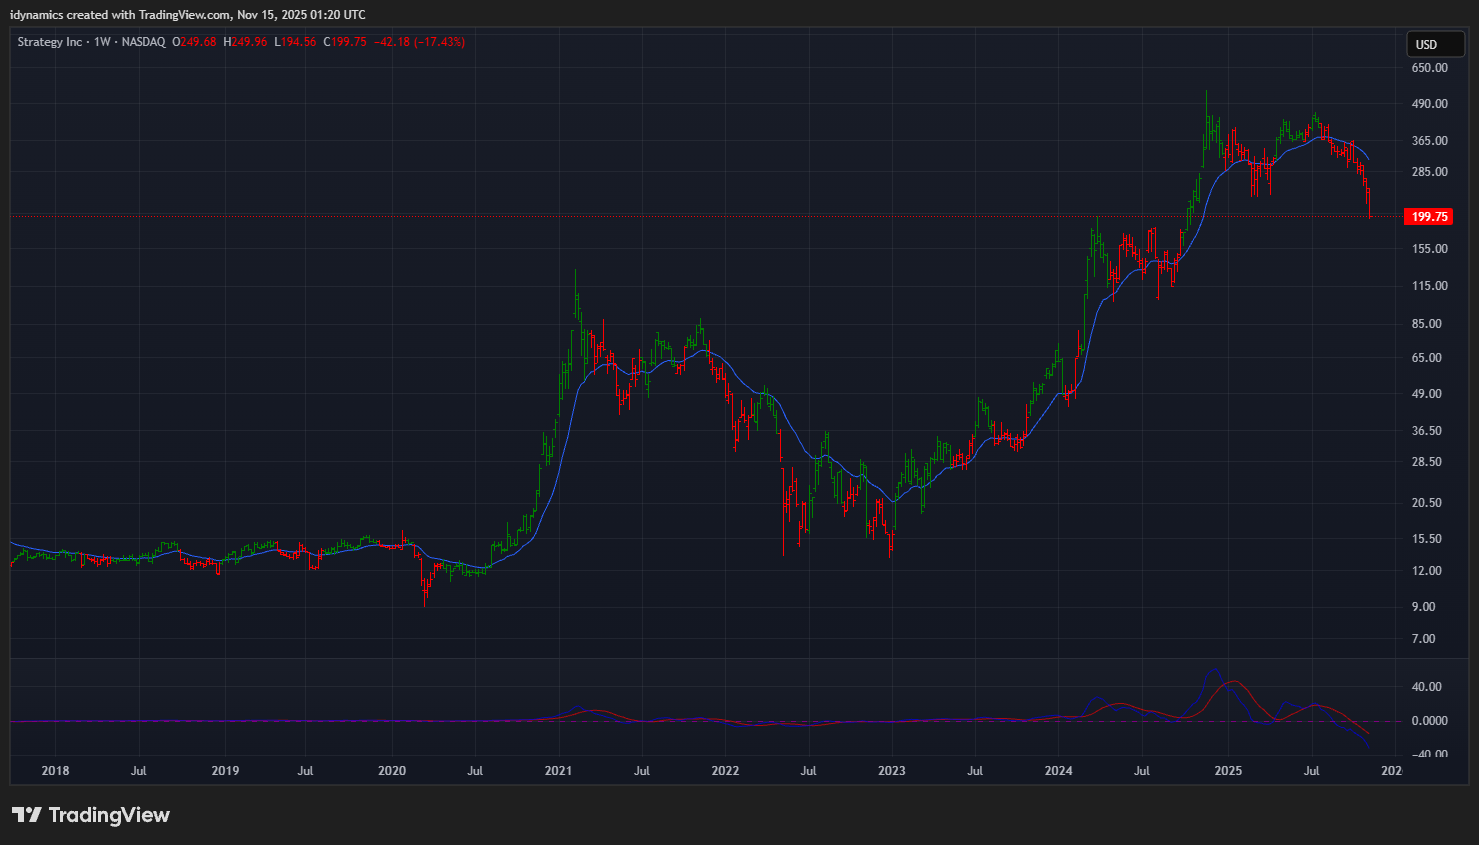
- OG Satoshi Whales dump BTC and Strategy (MSTR) plunged toward a one-year low
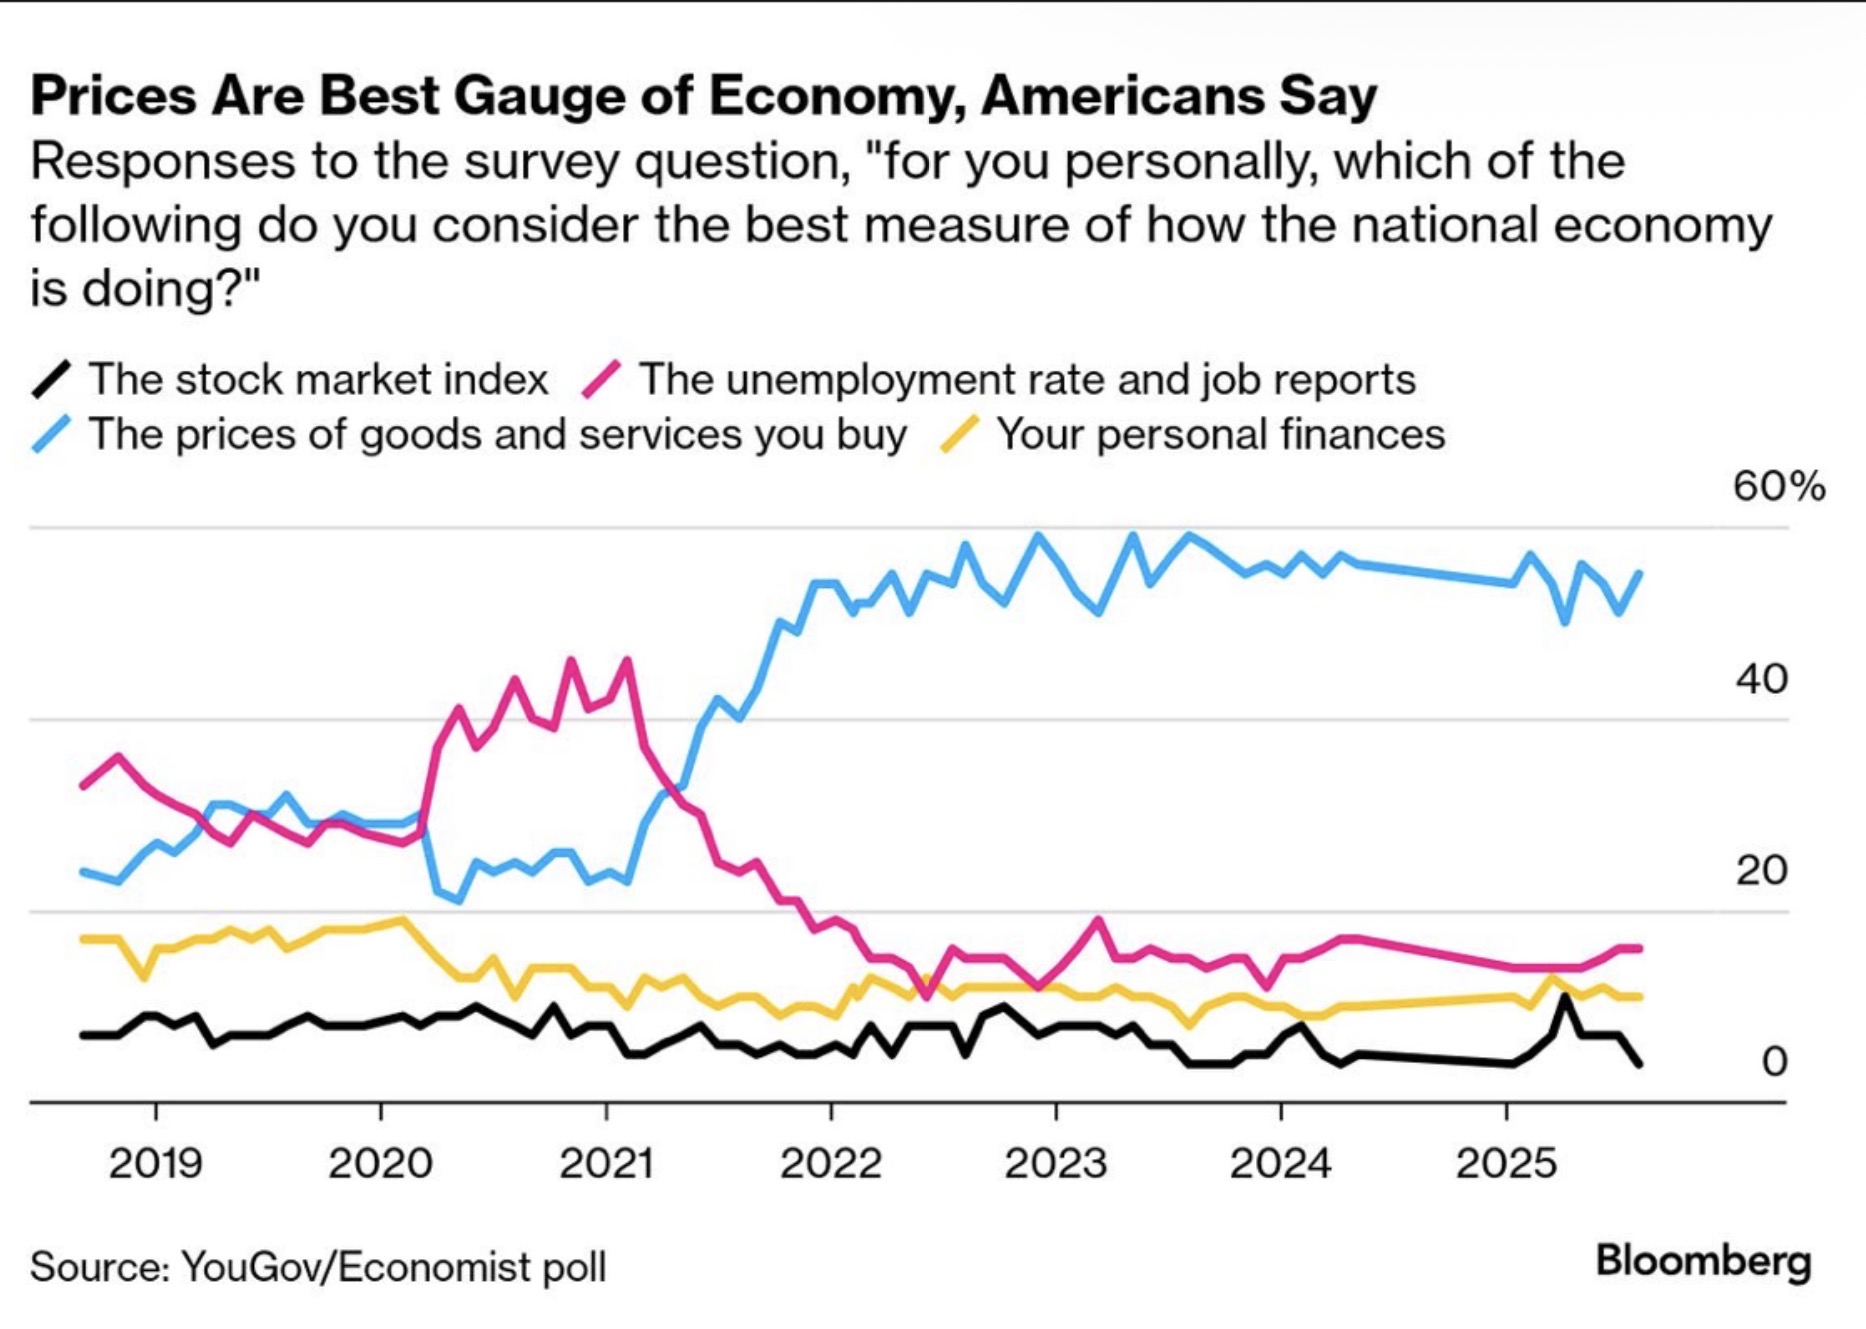
Pessimism is ruling the average American at the bottom of the K-Shaped Economy. The biggest perceived threat to consumers is inflation.
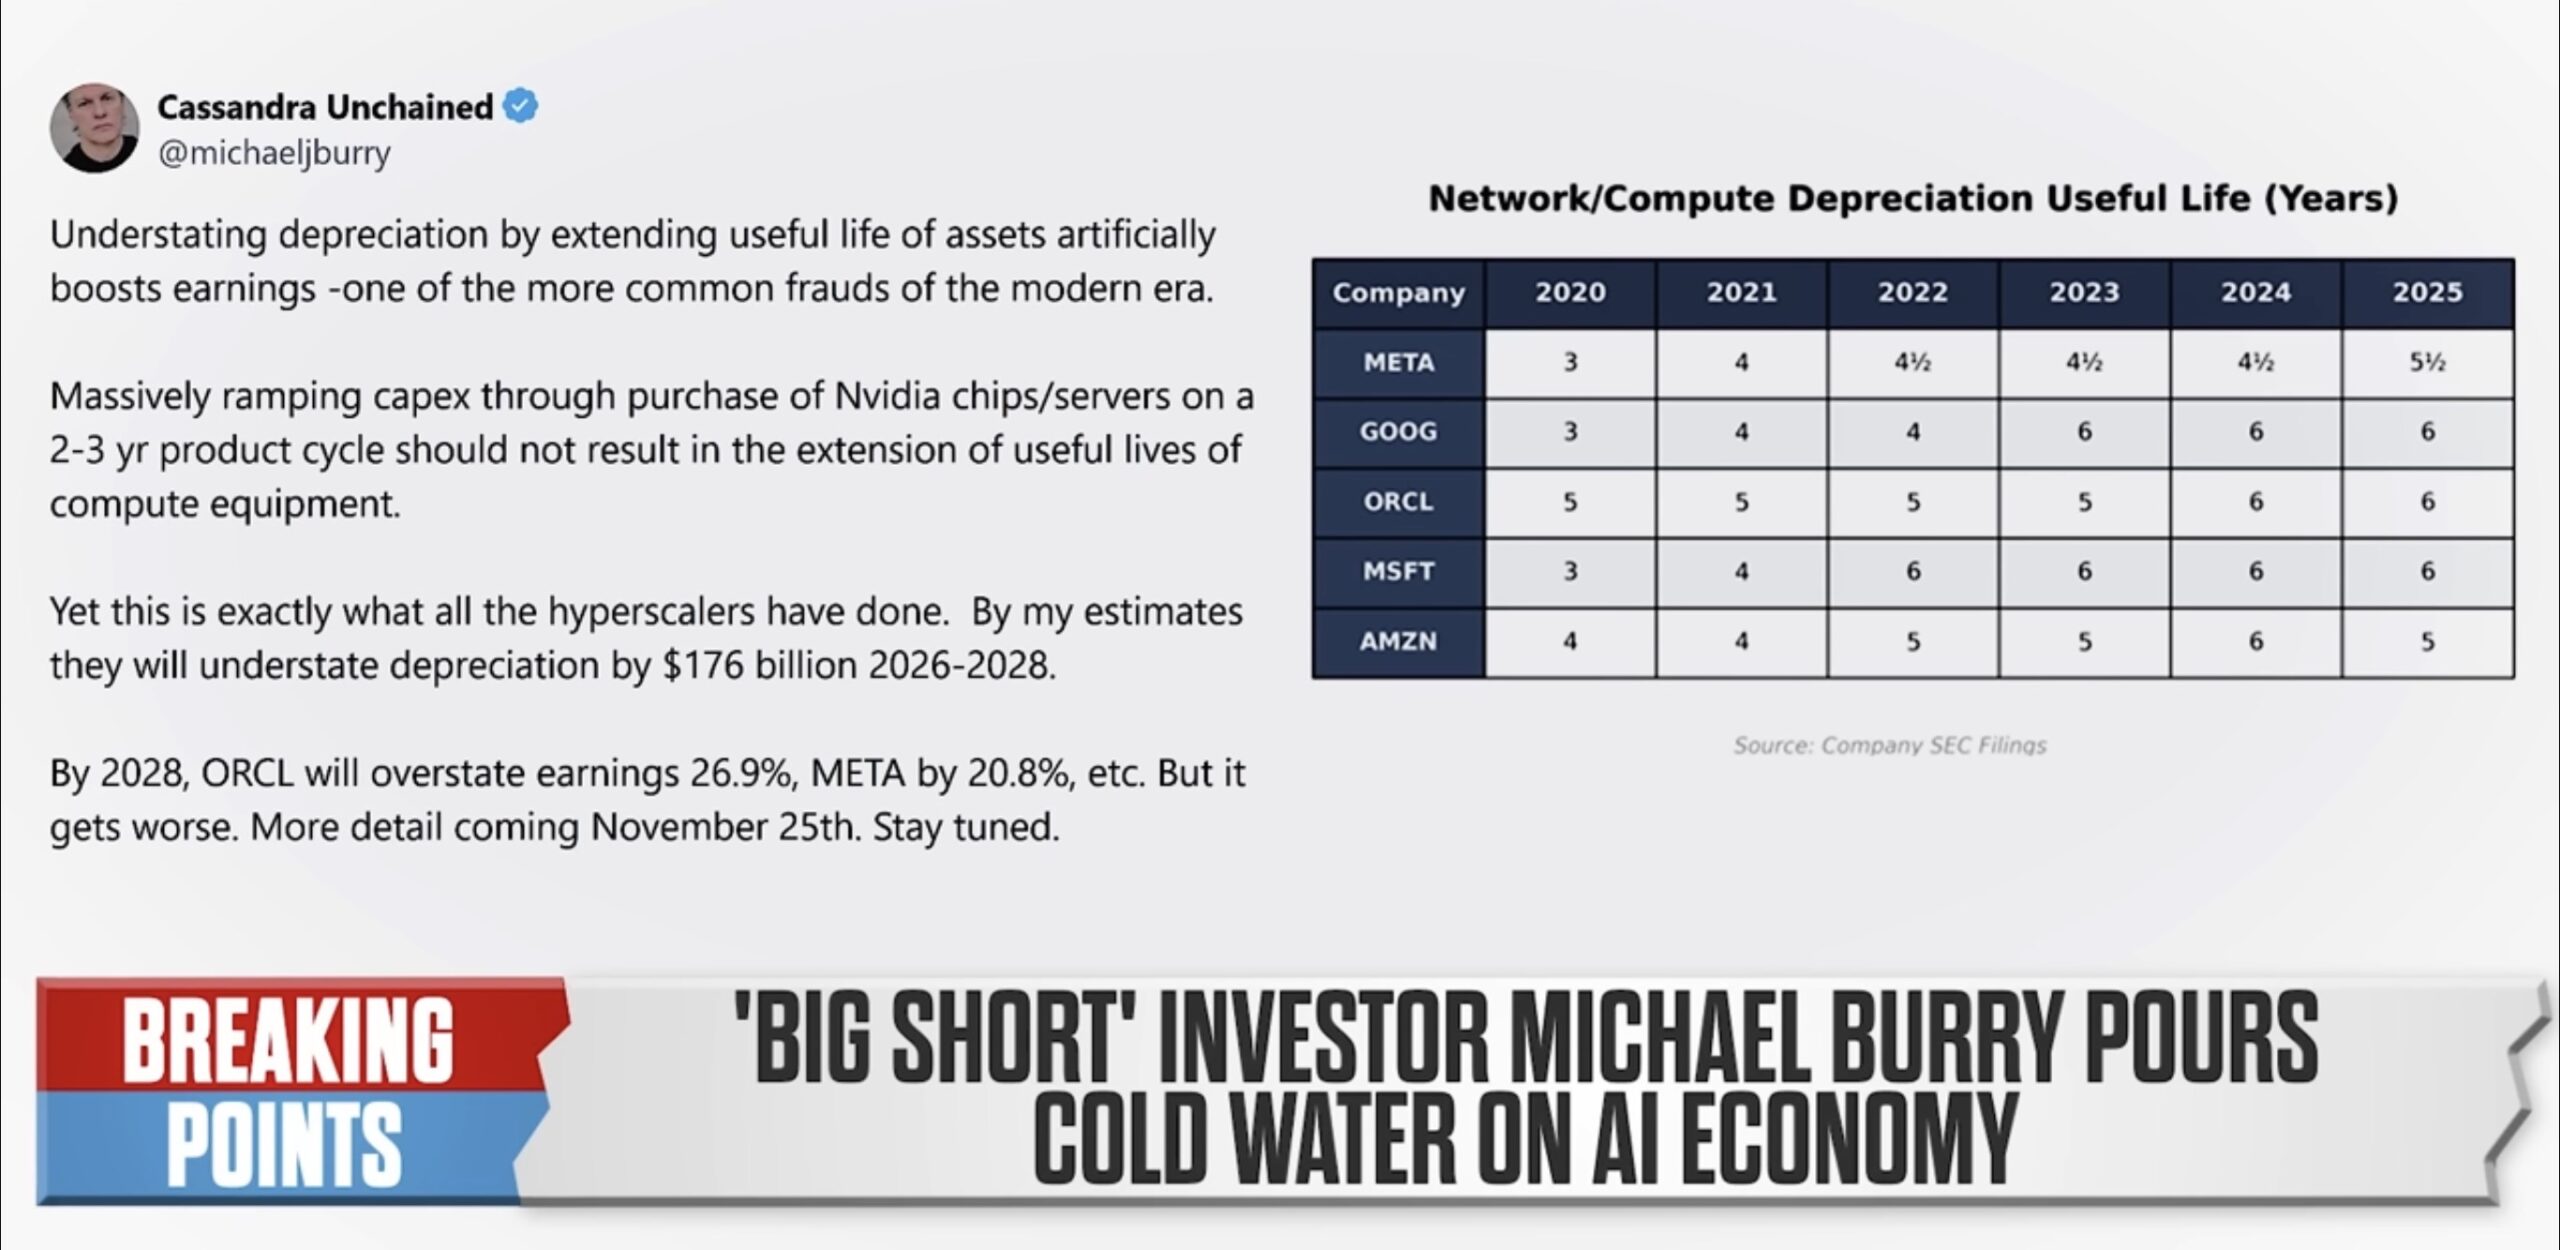
Shortly after announcing short trades on NVDA and PLTR, Michael Burry de-registered his Scion Asset Management company. Having a long-time bear throwing in the towel right here is a major signal for the markets. Looks like 25 November 2025 can be defined as “more to come.”
Jobs, Jobs, Jobs
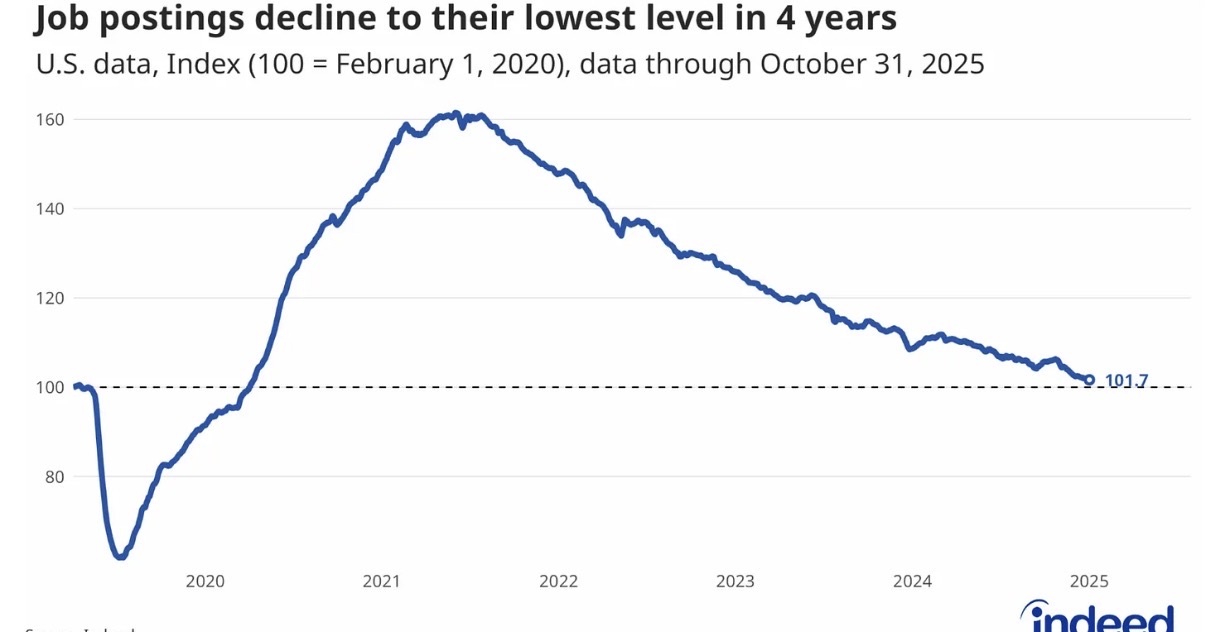
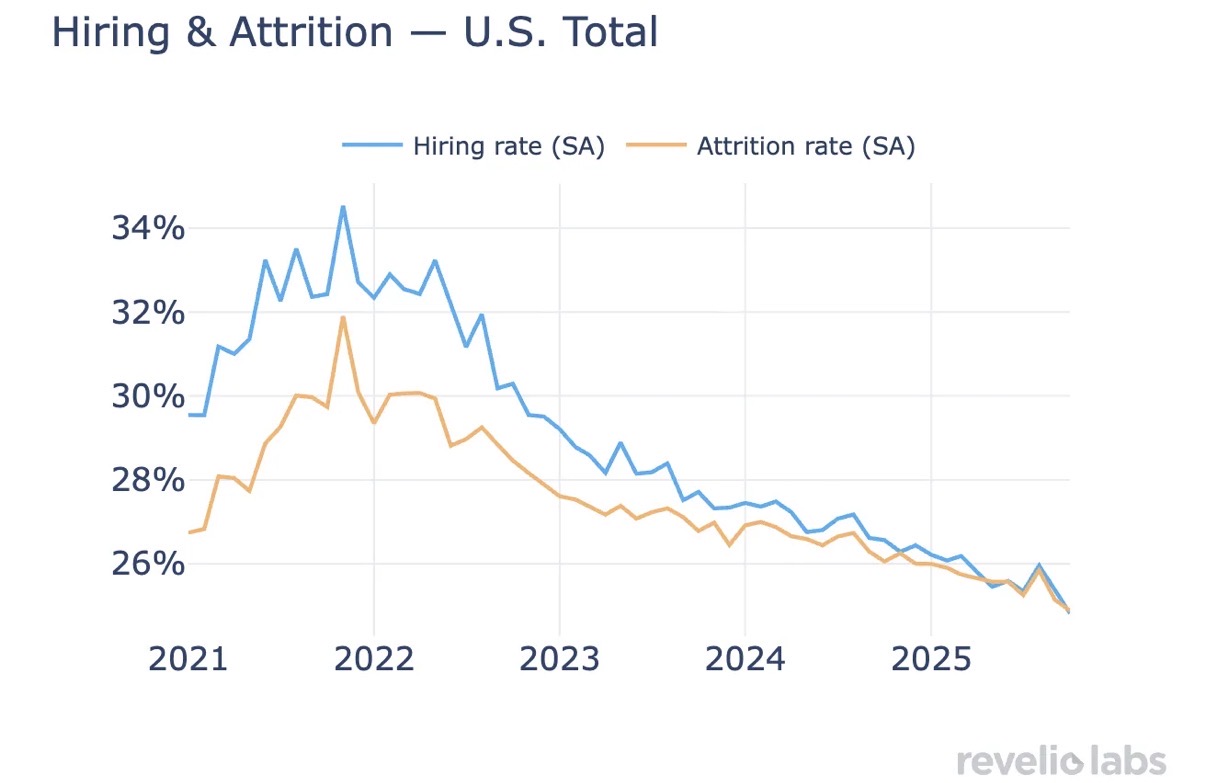
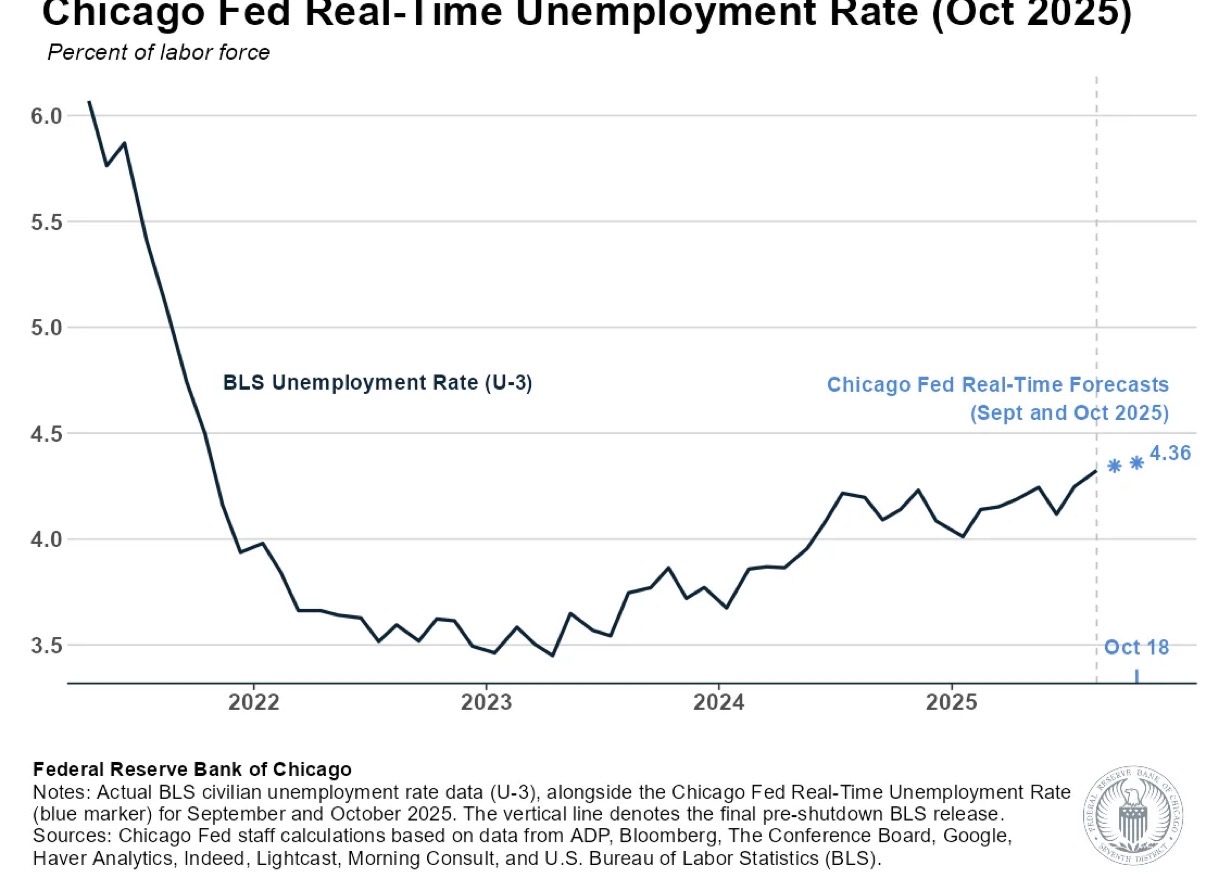
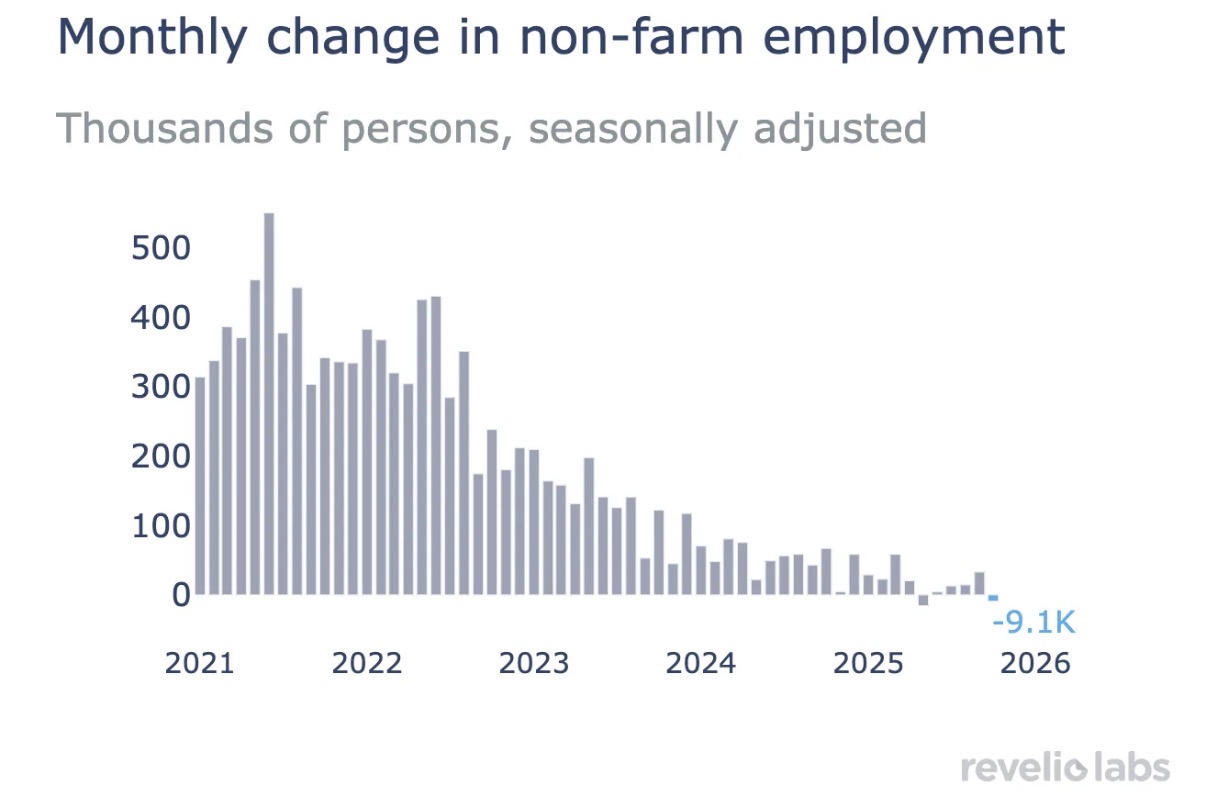
The real threat to consumers is the jobs market. Right now, the data will be covered up. How long they can get away without releasing actual data remains to be seen. The downside of hiding the data is the crimp it puts on the Fed to make decisions. QE is coming, but the December rate cut is seemingly off the table currently.
Last week saw another registering of the Hindenburg Omen and we now have at least five occurrences in the past couple of weeks. None of these means that the markets cannot spin back around and surge to new record highs.
“I believe that we are looking at the bottom of the 9th inning now for stocks and that the end of this move will come in this long window we are in…most likely before or by the first month or two of 2026. Certainly, by the 1st quarter. The market has now issued a number of Hindenburg Omens, and a Nasdaq Titanic Syndrome which can be a preliminary red-flag that prices are within a couple months of a major turning point. which fits with the current timing data.”
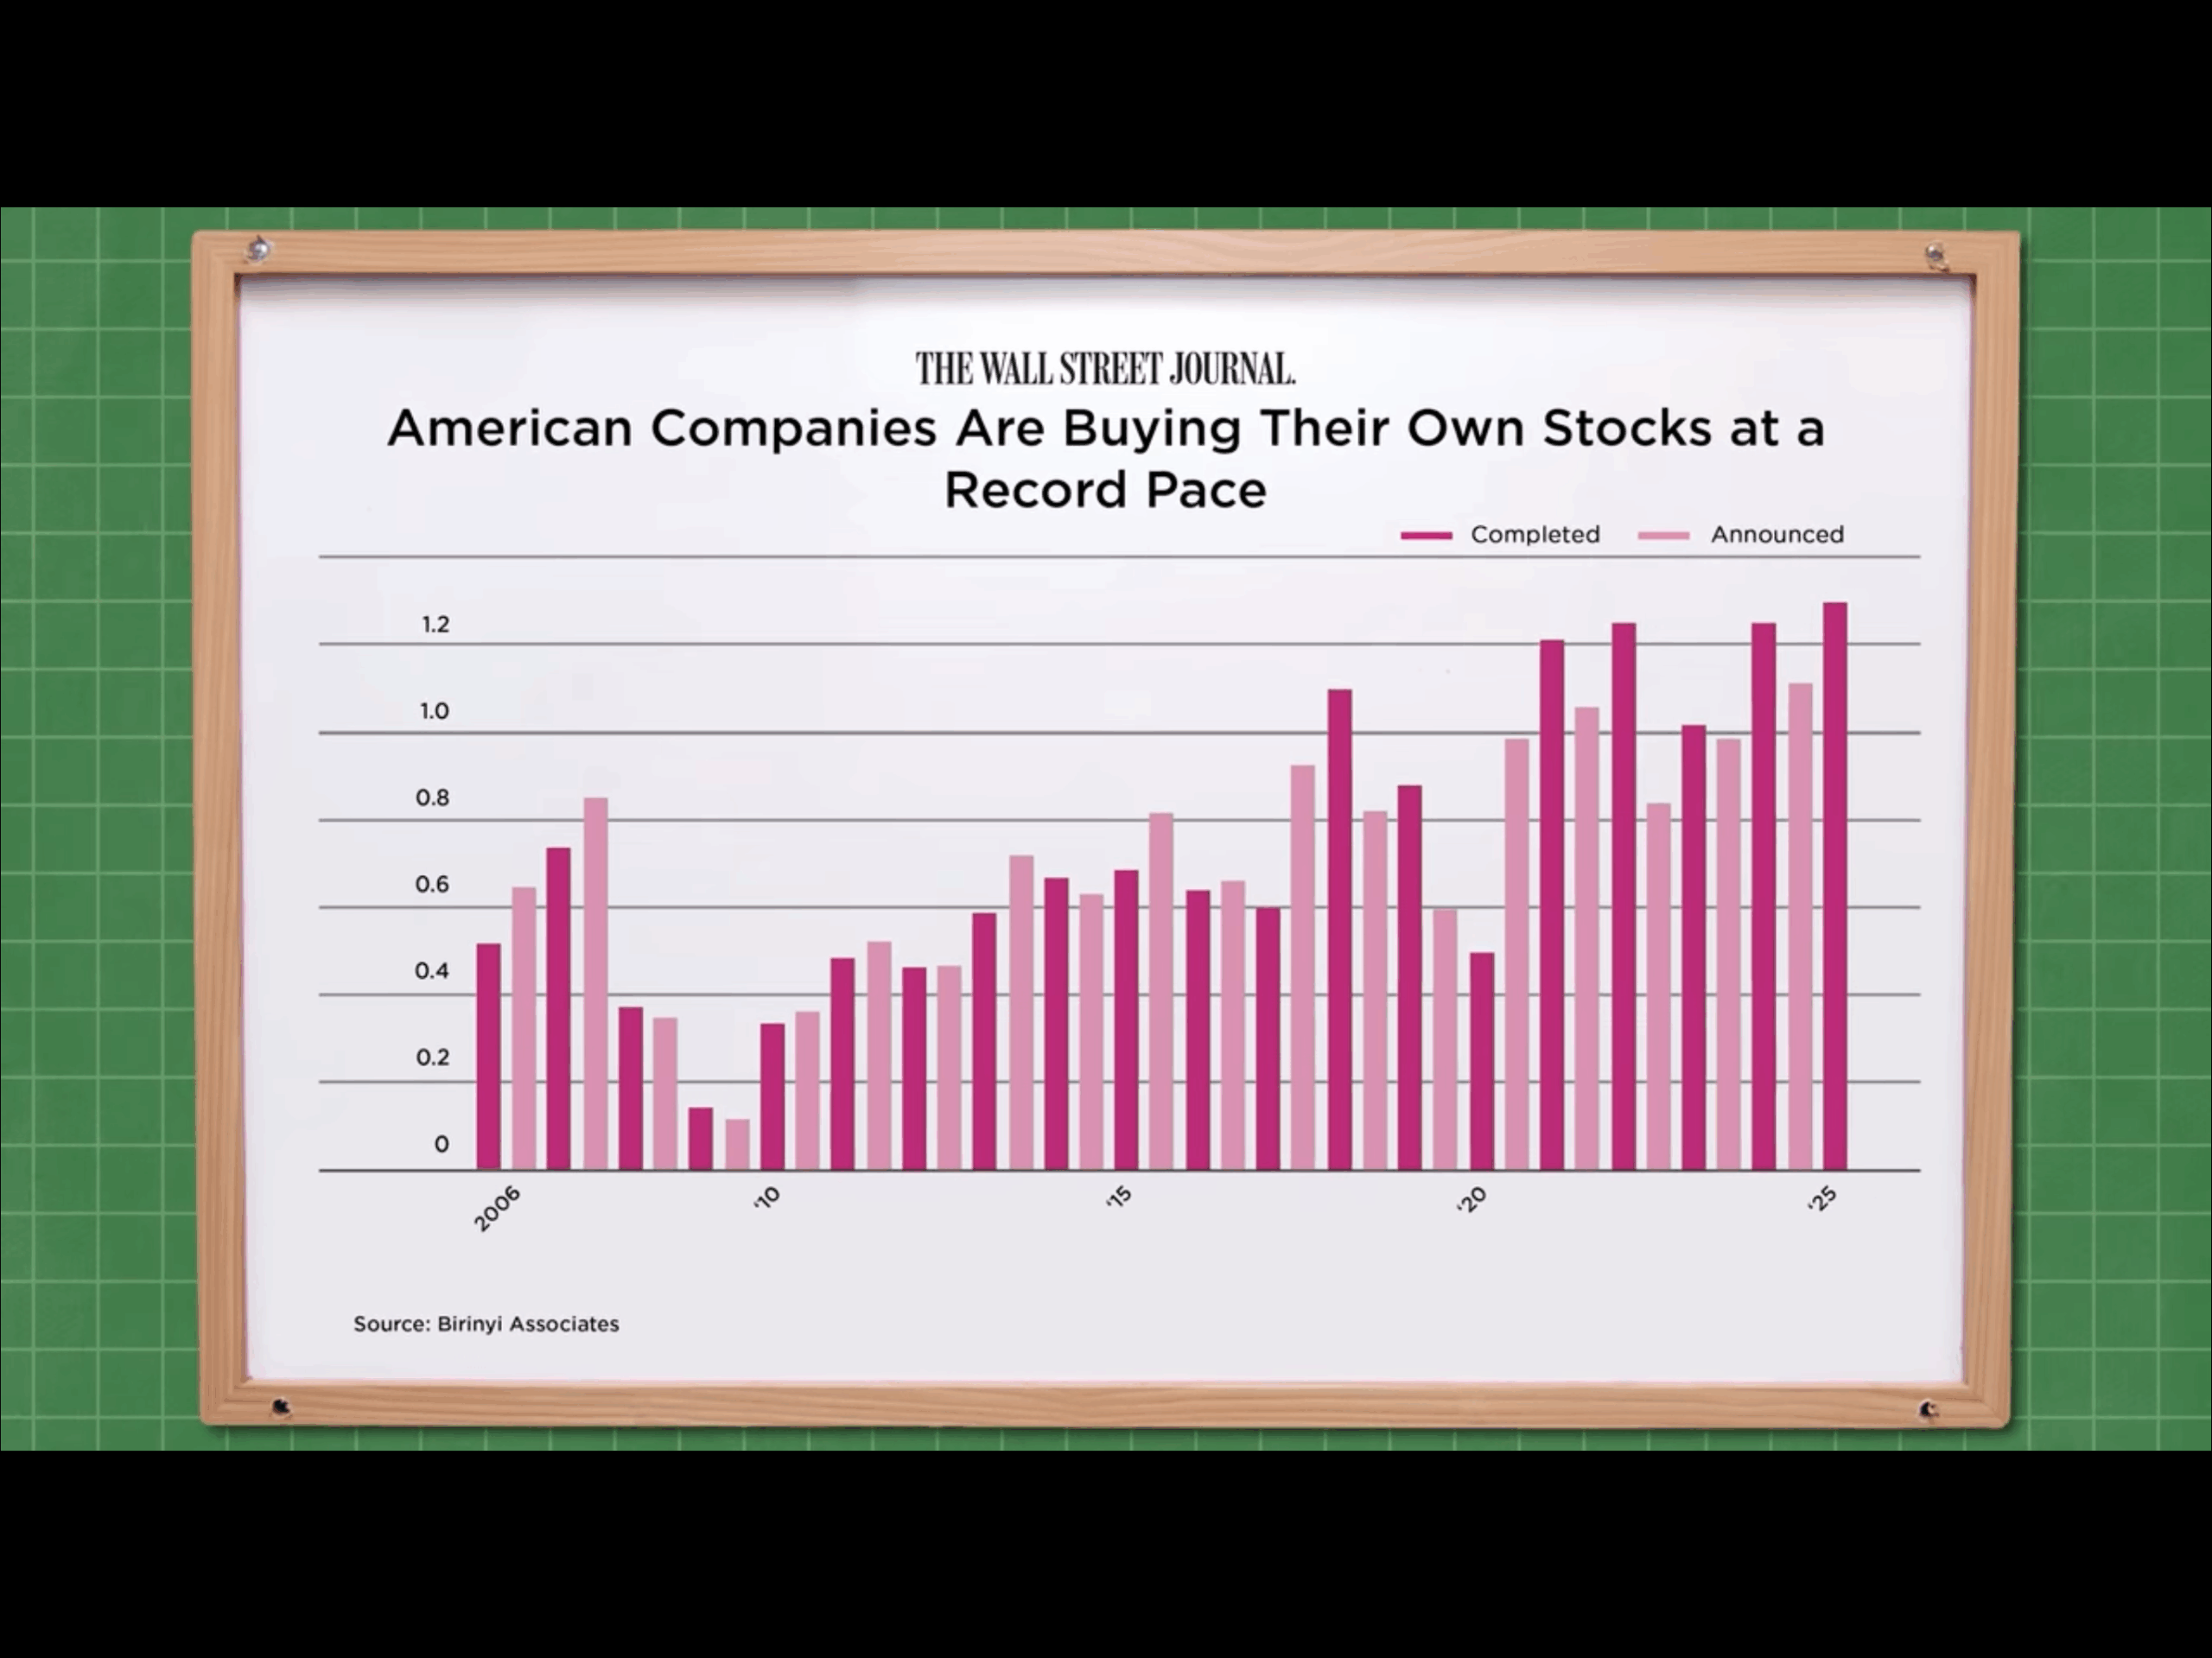 Insiders have been selling stocks at an accelerated pace in 2025 while buy-backs have also increased.
SPX Monthly H-L-C
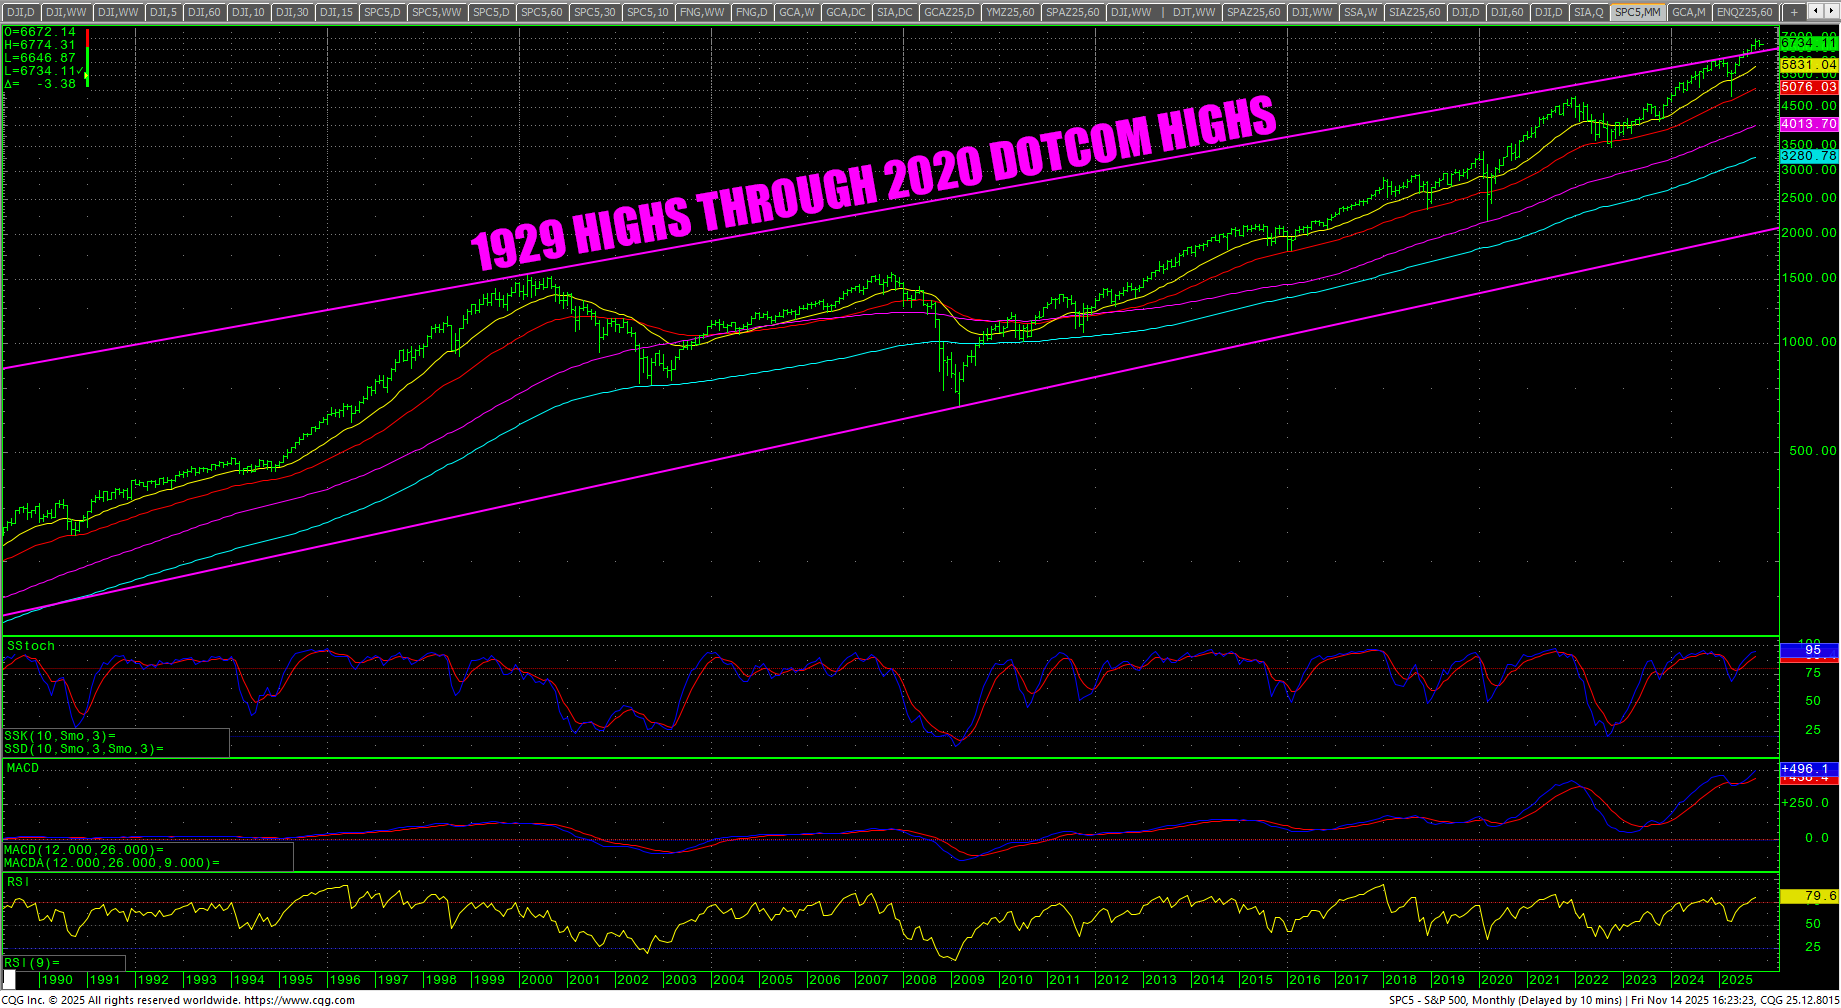 The SPX monthly still offers the super bull scenario as prices trade above the overhead trendline that connects the 1929 tops through the 2000 Dot-Com tops. If prices start to trade back under the trendline, it could signal selling in equities. It still holds potential for a continued blowoff move.
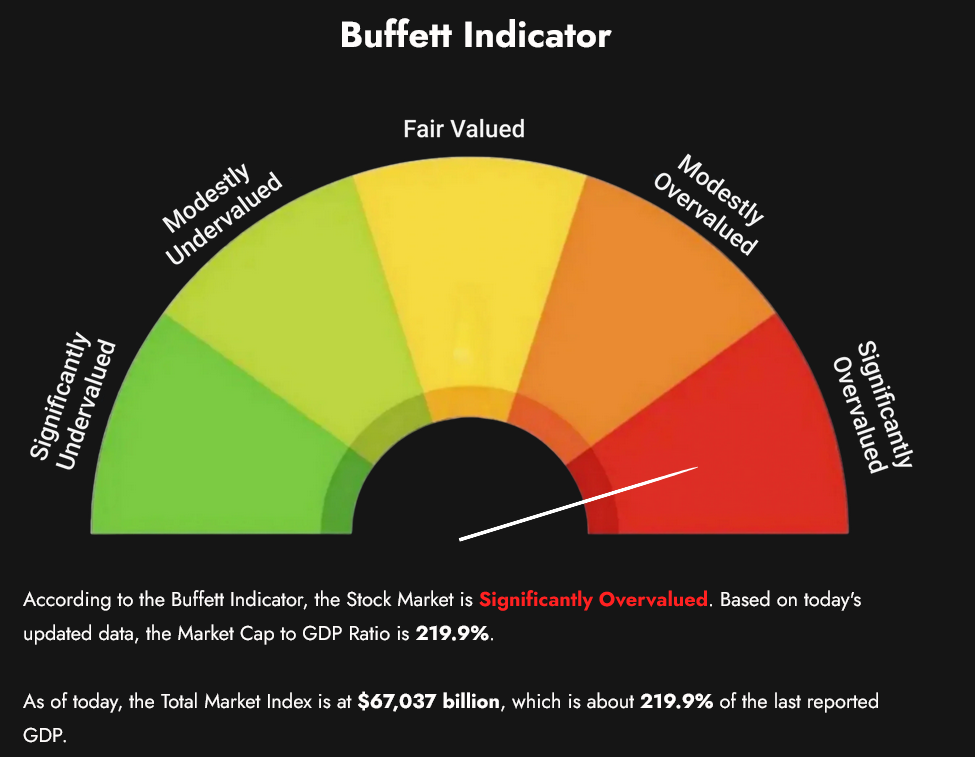 The Buffet Indicator sits near ATHs, now reading at 219.9%.
Dow Theory
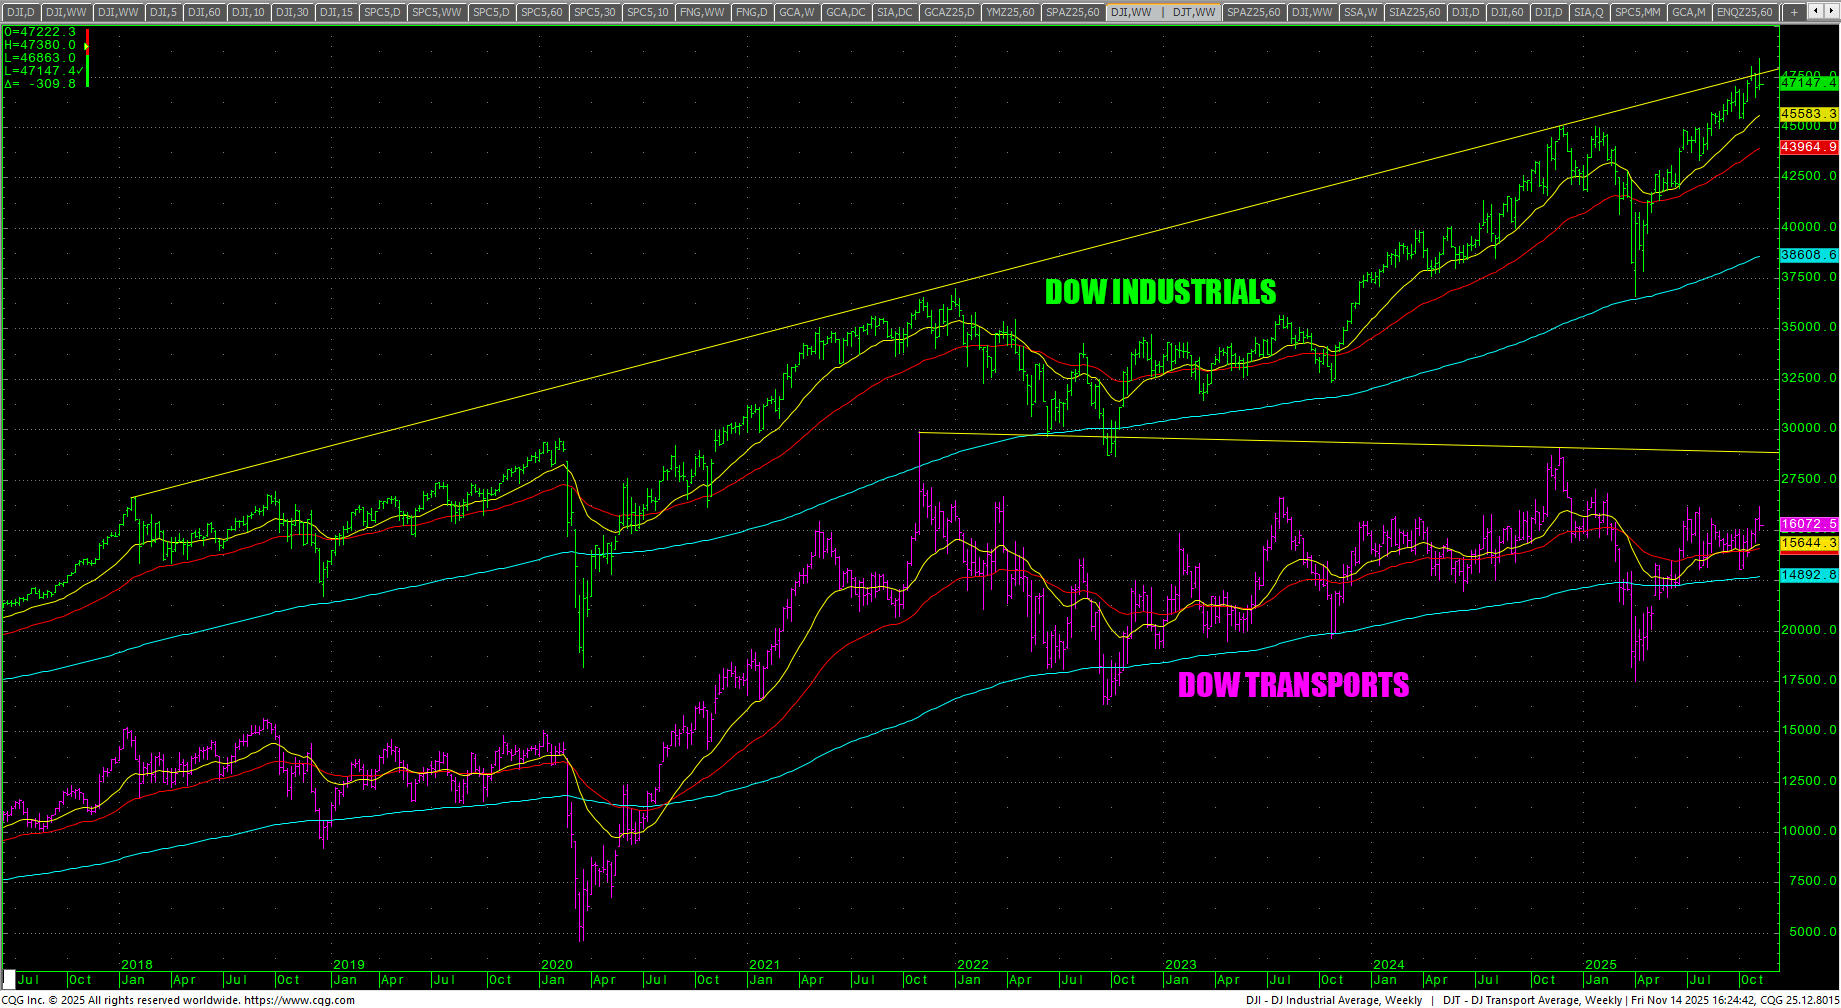 Dow Theory still shows a bearish divergence.
S&P 500 Stocks Above the 200-day MA
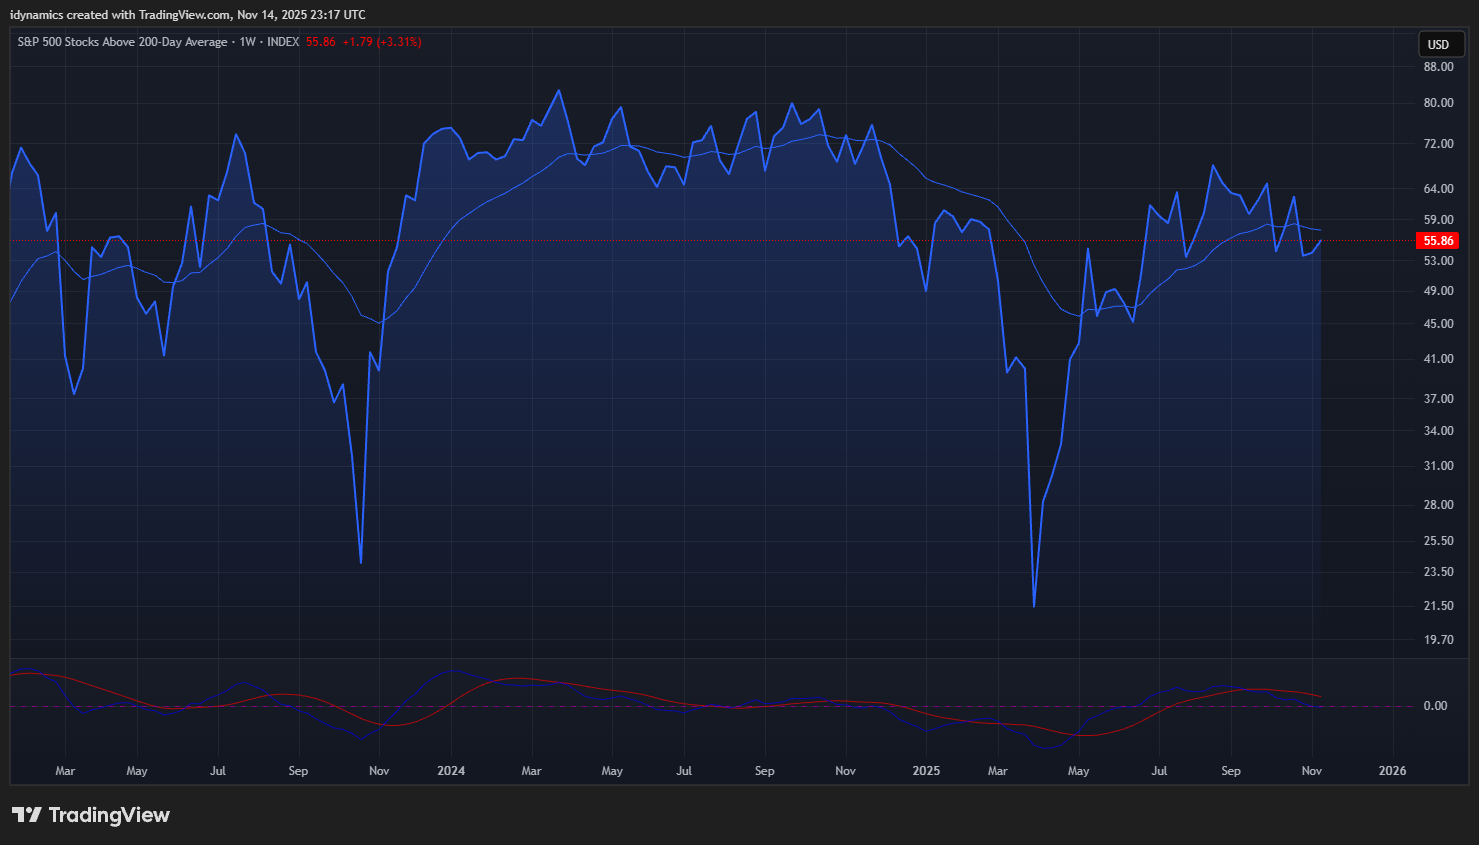 Breadth is still deteriorating (ala the Hindenburg Omen). The share of SPX stocks above the 200-day MA improved to 55.86%. The high in September 2024 was 72.92% and 82.70% in March of 2024. Divergence remains the name of the game. 10 stocks make up 40% of the SPX.
MAGS (Magnificent 7) Weekly Candles
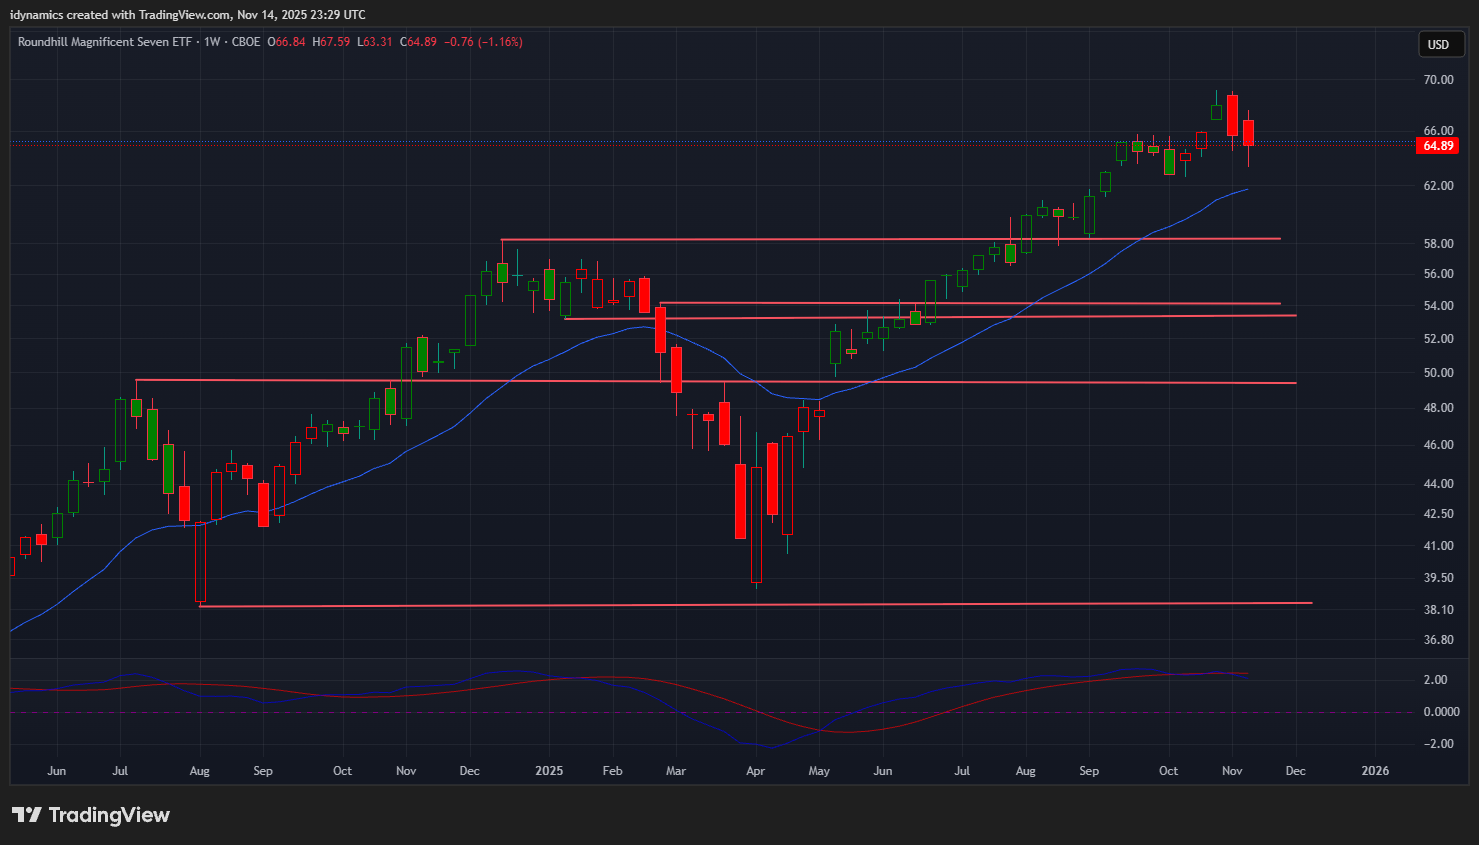 The MAGS plunged to a four-week low and settled in the bottom half of the range, down -1.16%. Resistance is 67.50, 69.09 and 74.00/74.30. Support is 61.99 and 57.60. Under 57.60 can test 54.05 with critical support at 50.49/50.00.
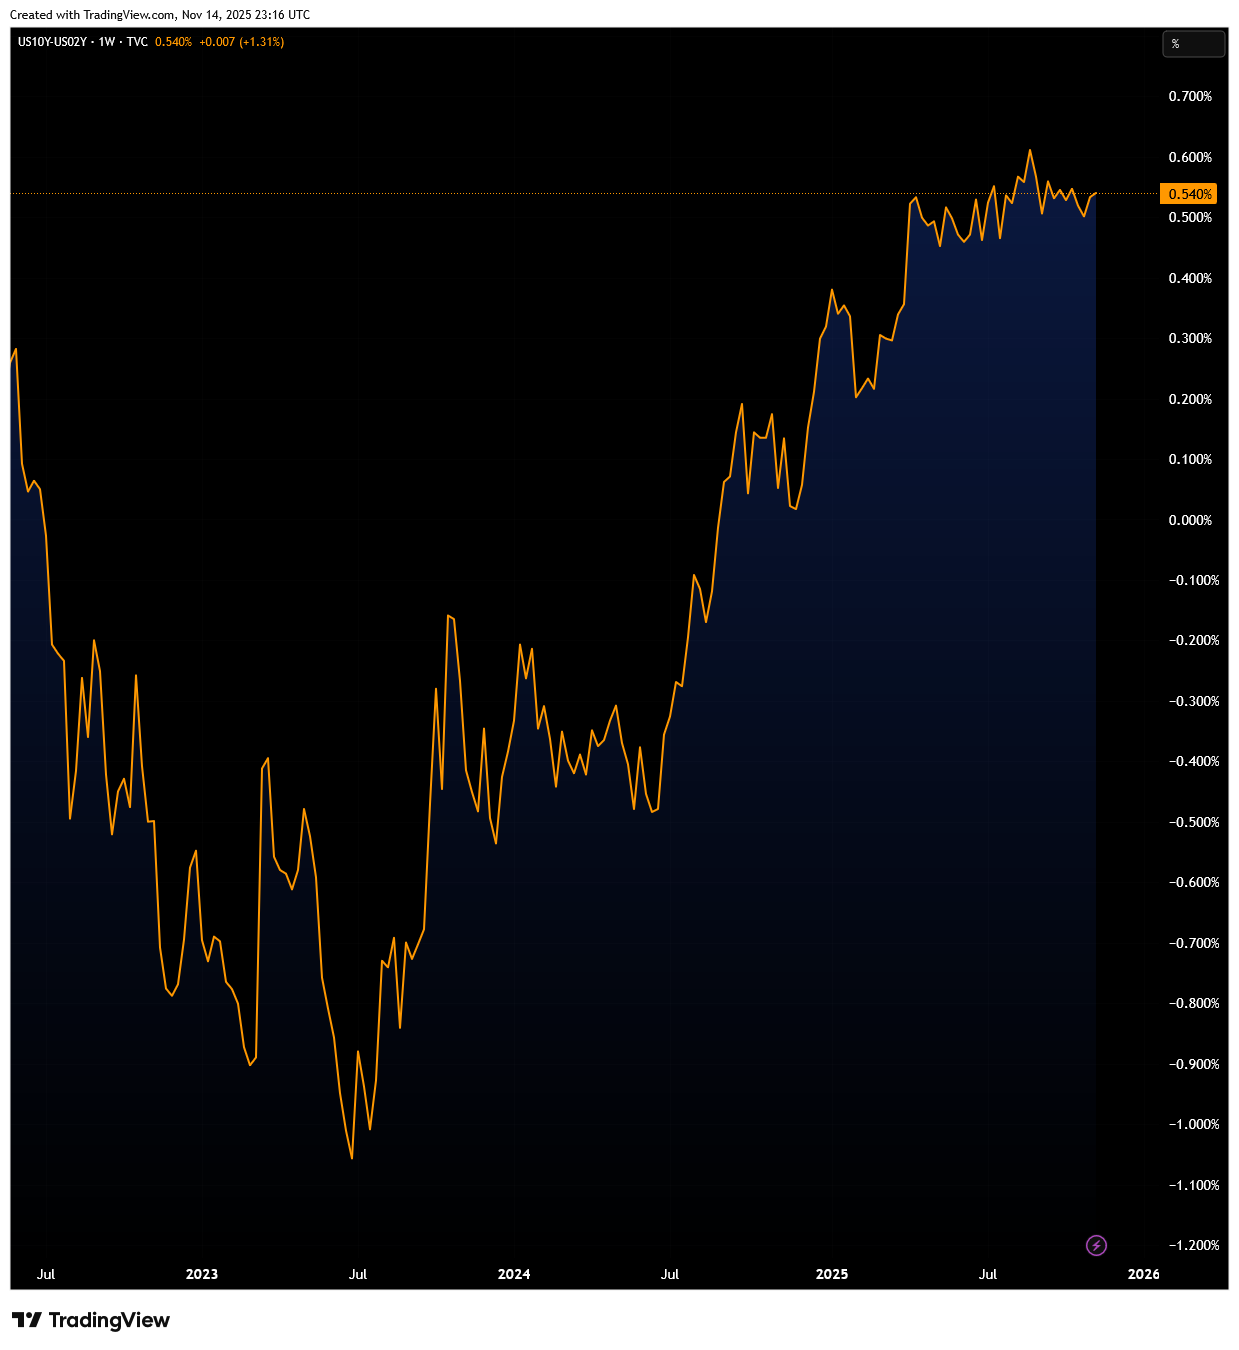
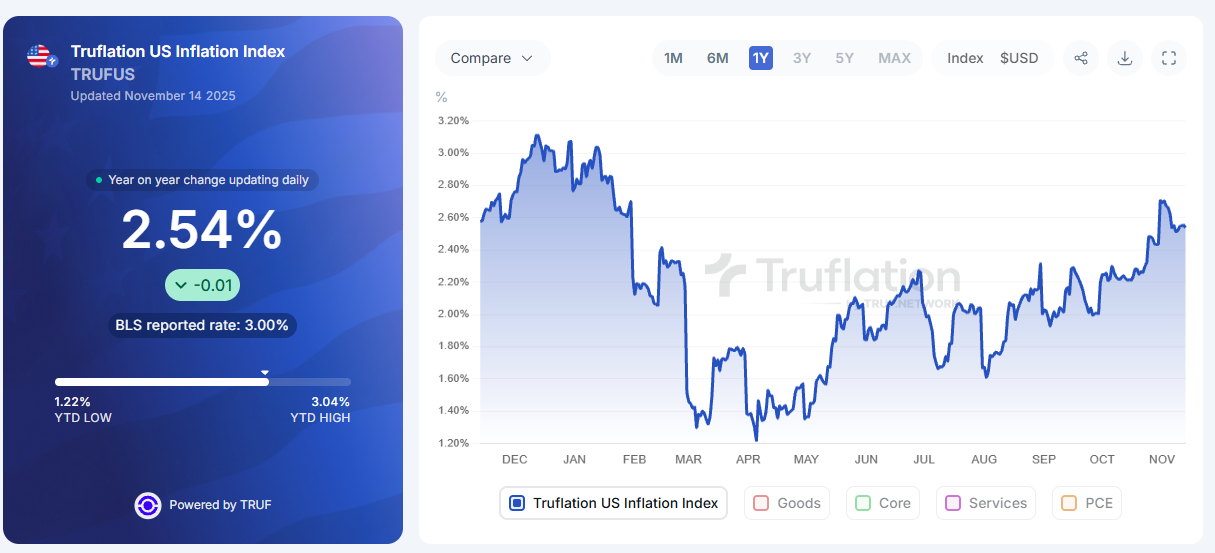
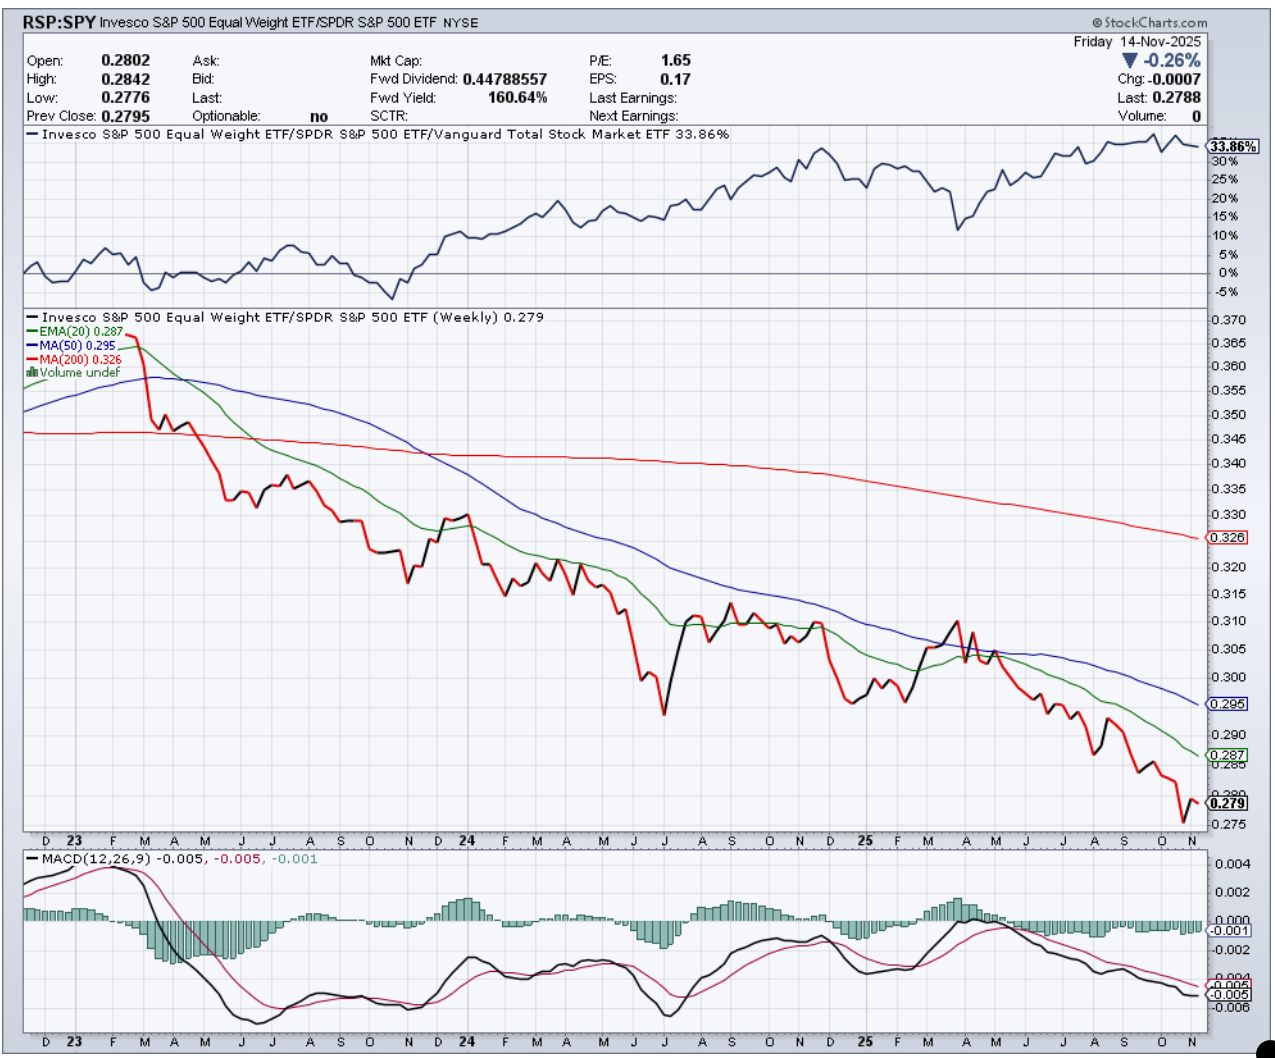
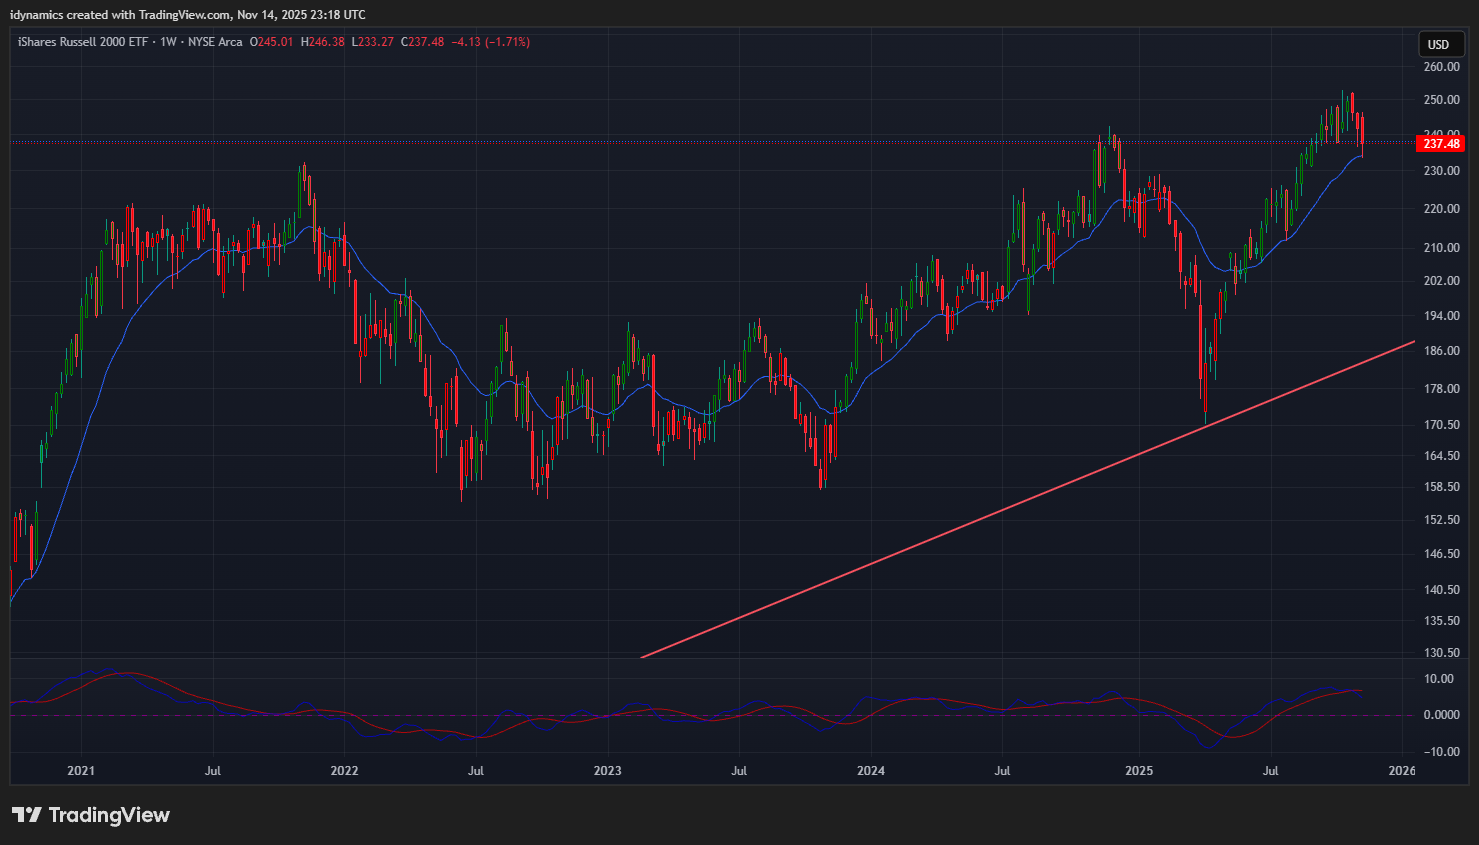
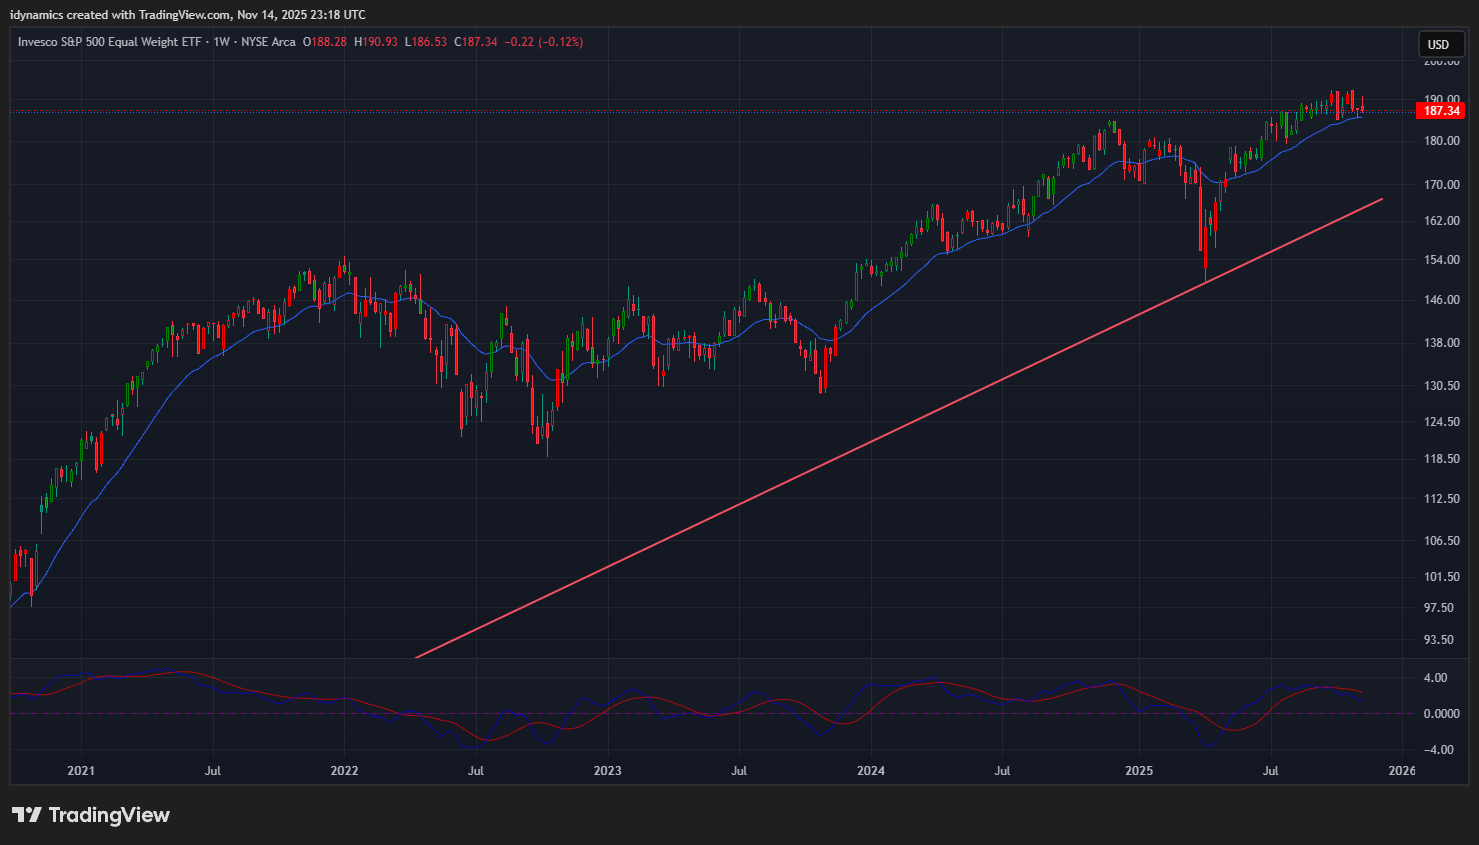
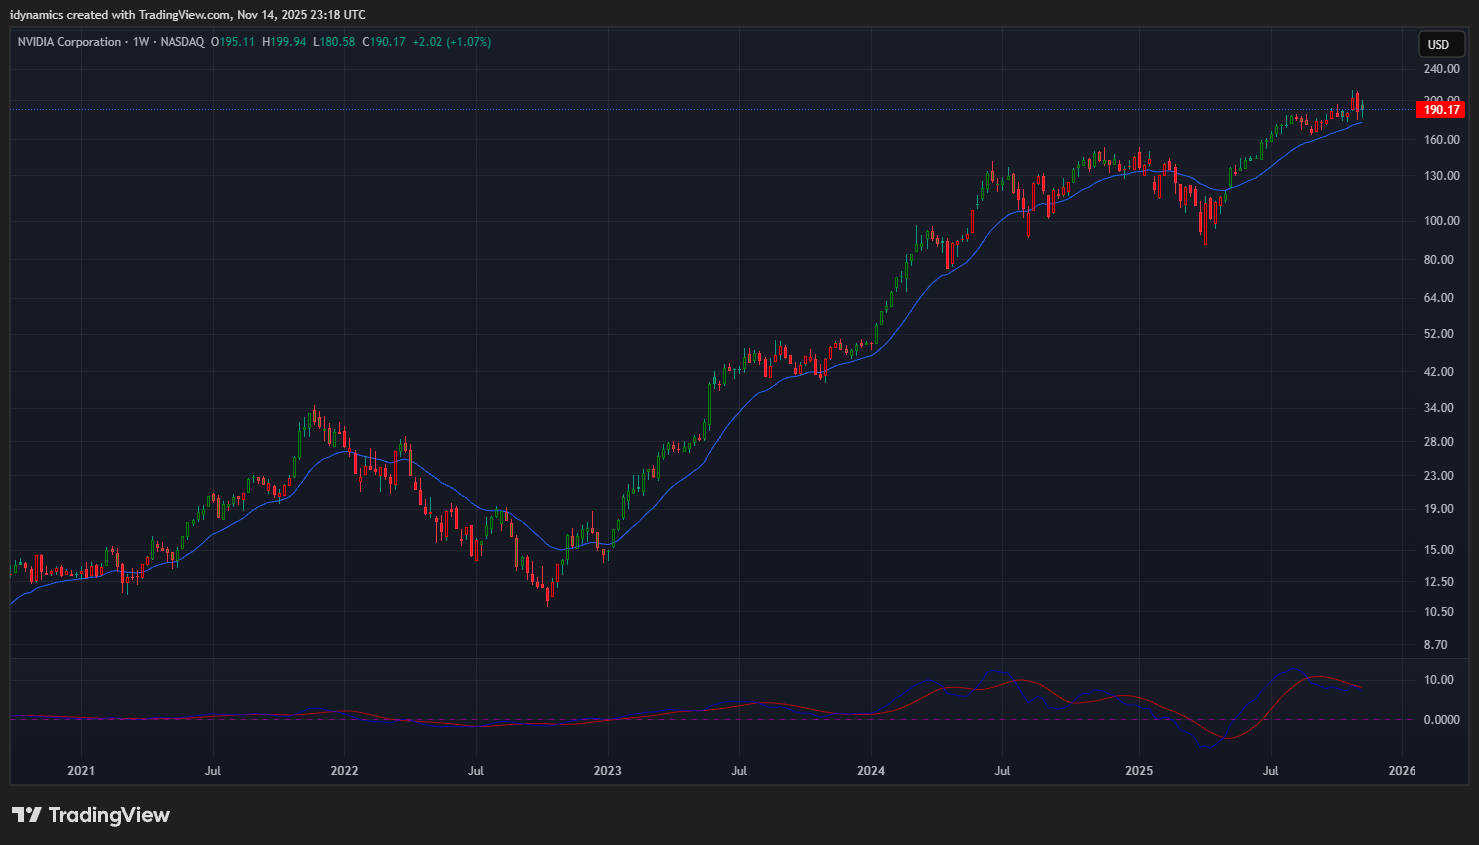
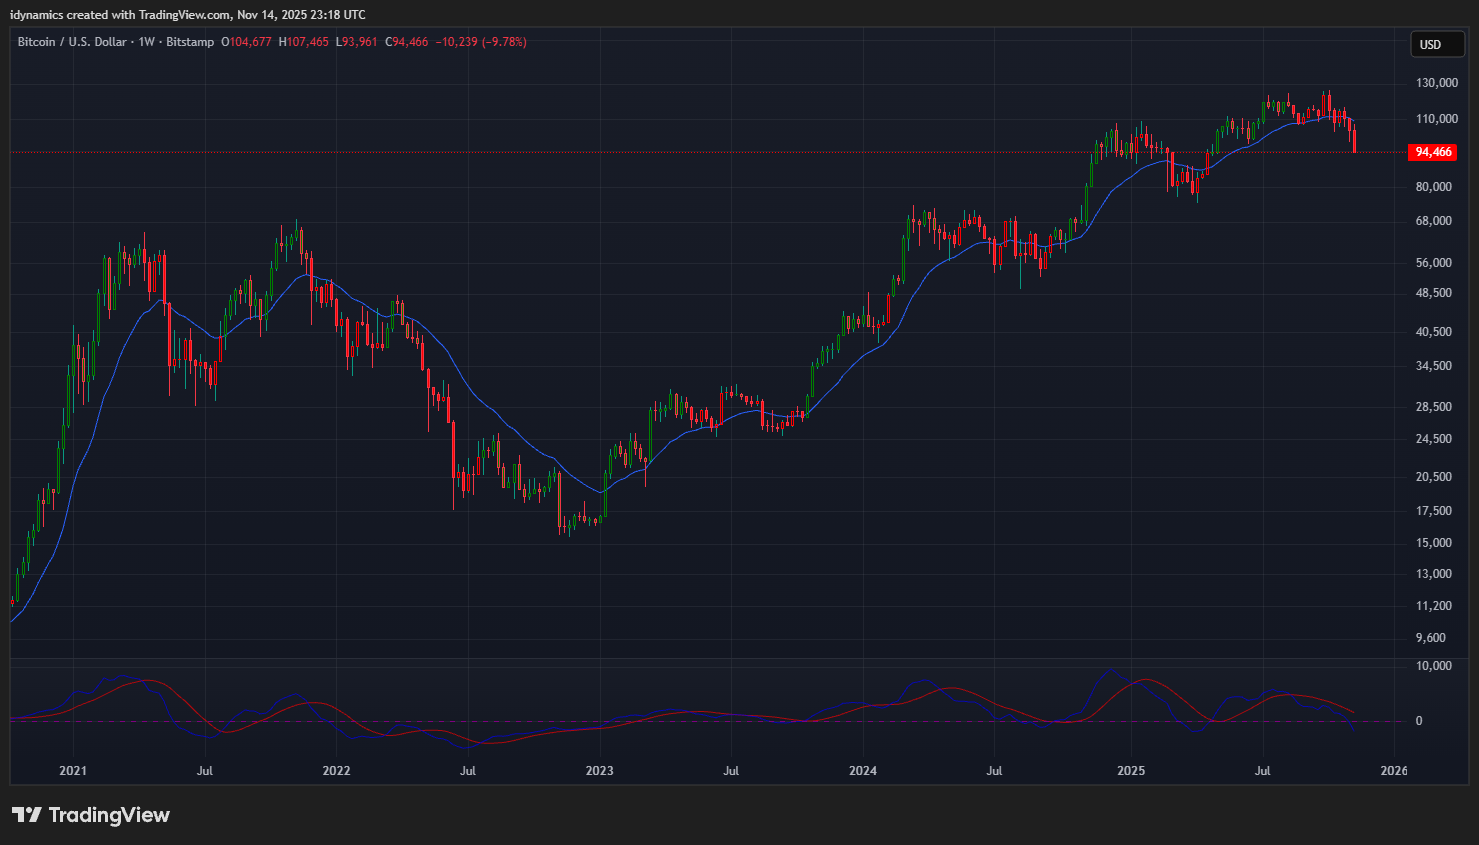
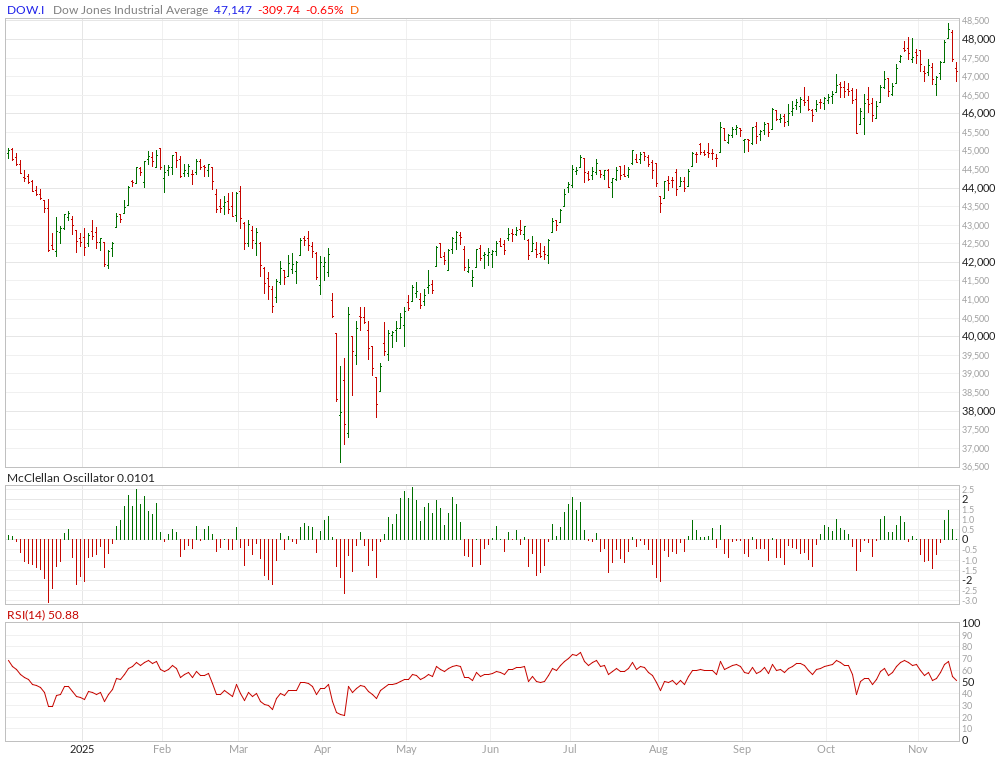
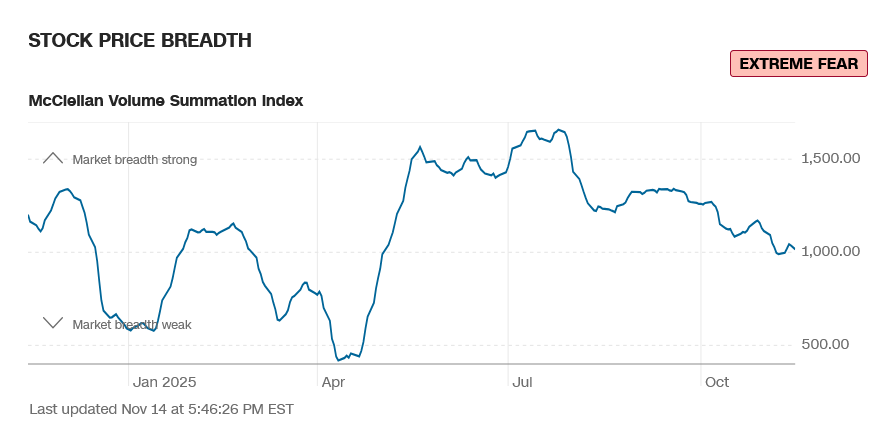
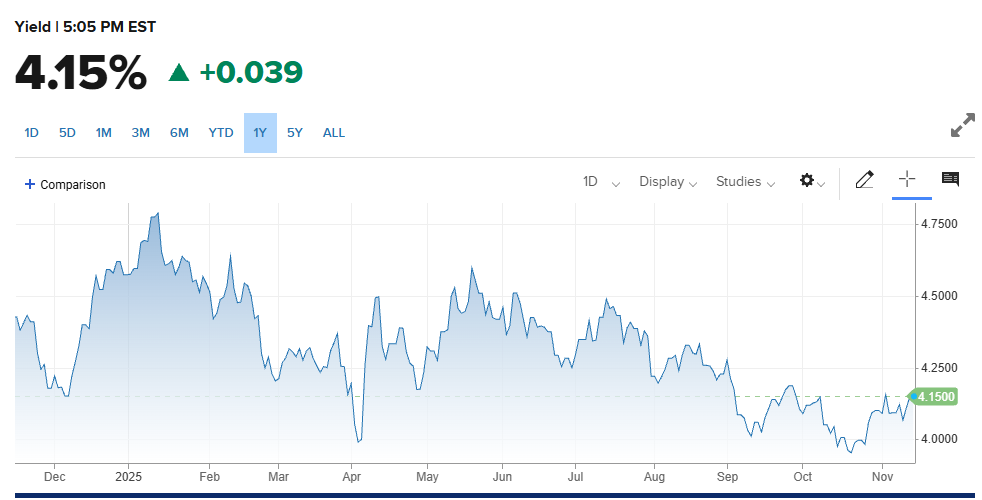
The RSP:SPY remains under pressure at multi-decade lows. The weekly is trending lower in an oversold position and the MACD is down. Resistance remains pivotal at .294. The IWM traded a two-month low and settled in the bottom of the range, down -1.71%. The RSP reversed lower and closed on the bottom of the week’s range, down -0.12%. NVDA traded a volatile inside week and closed in the middle, up +1.07%. Bitcoin plunged as some OG Satoshi HODLrs dumped billions in BTC above $100K. Prices moved to the lowest levels since May closing near the lows, down -8.95%. Support is pivotal at 94.26/94.00. Under 94.00 can test 83.90. Resistance is 100.90 and 106.40. McClellan Oscillators support the selloff in the Dow. The Yield Curve expanded slightly on the week closing at +0.540%. The 10YR yield increased to 4.15%. Truflation was flat at 2.54%.
10YR-2YR Yield Curve Weekly

 VIX Weekly Candles
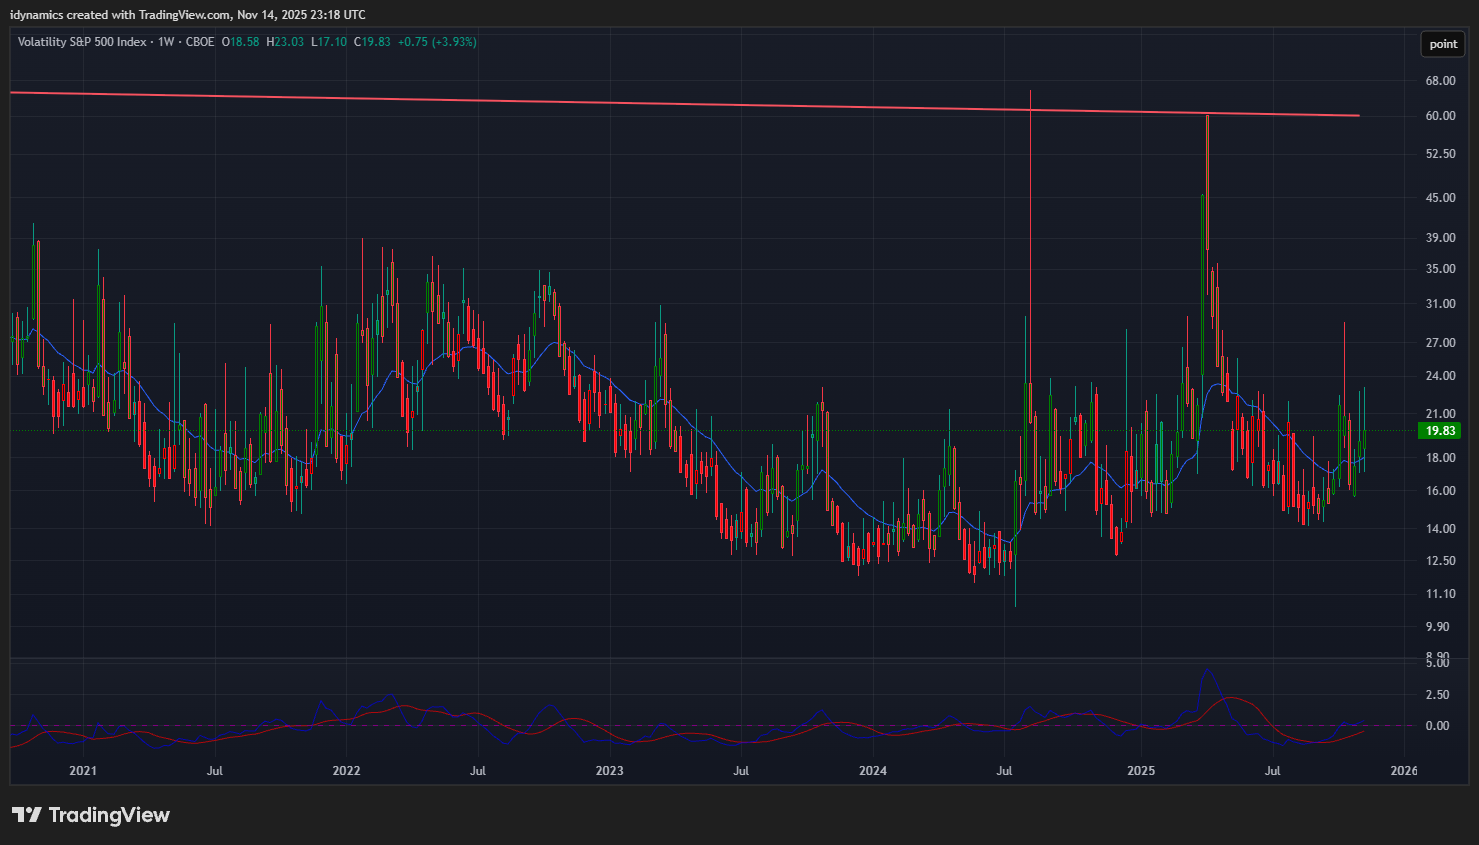
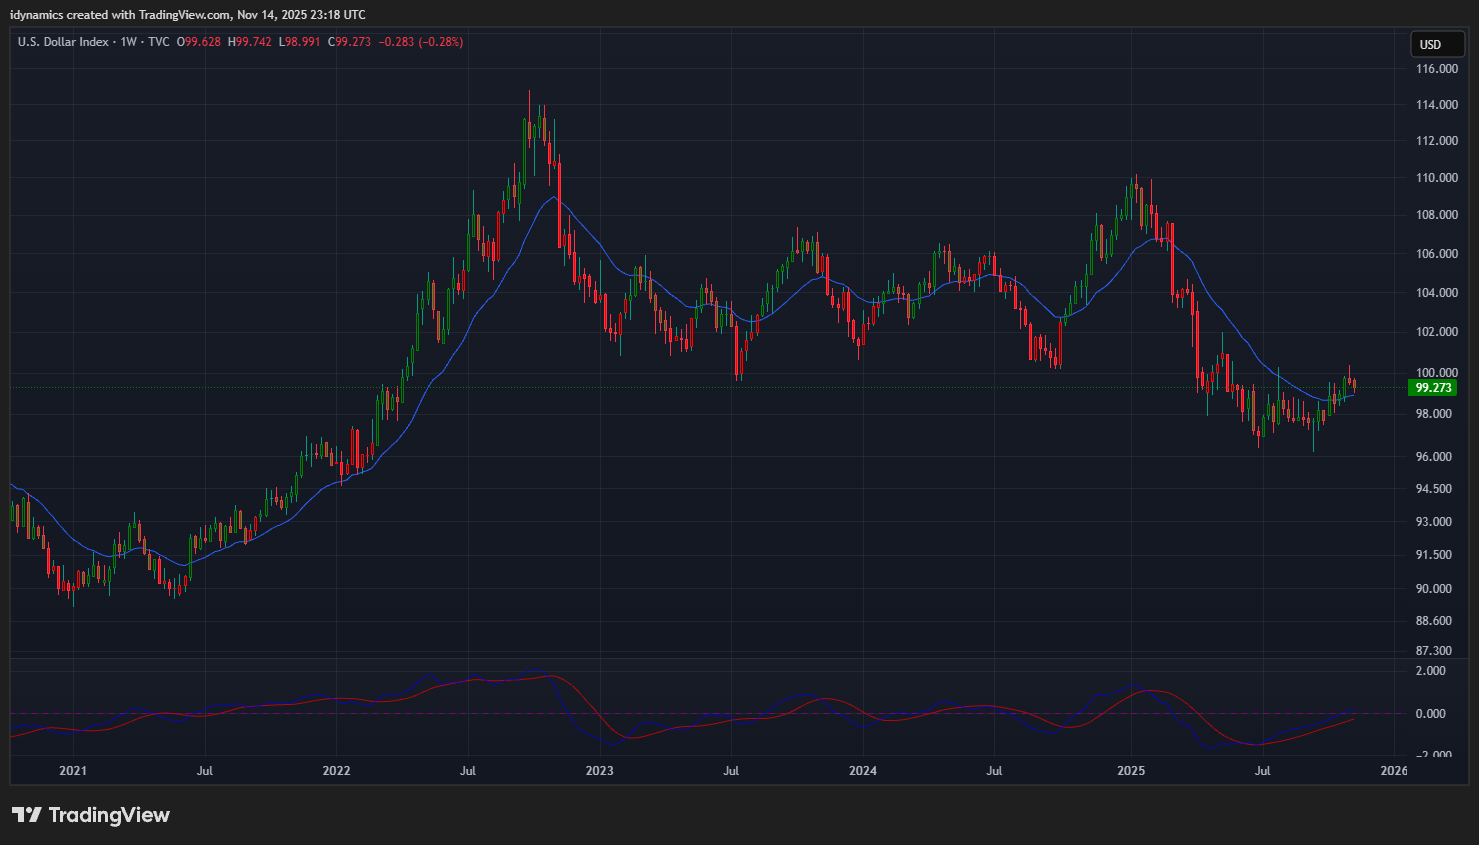
The VIX swung between 17/23 and closed just under 20, up +3.93% near the middle of the week’s range. The US Dollar sold off and closed in the bottom half of the range, down -0.28%.
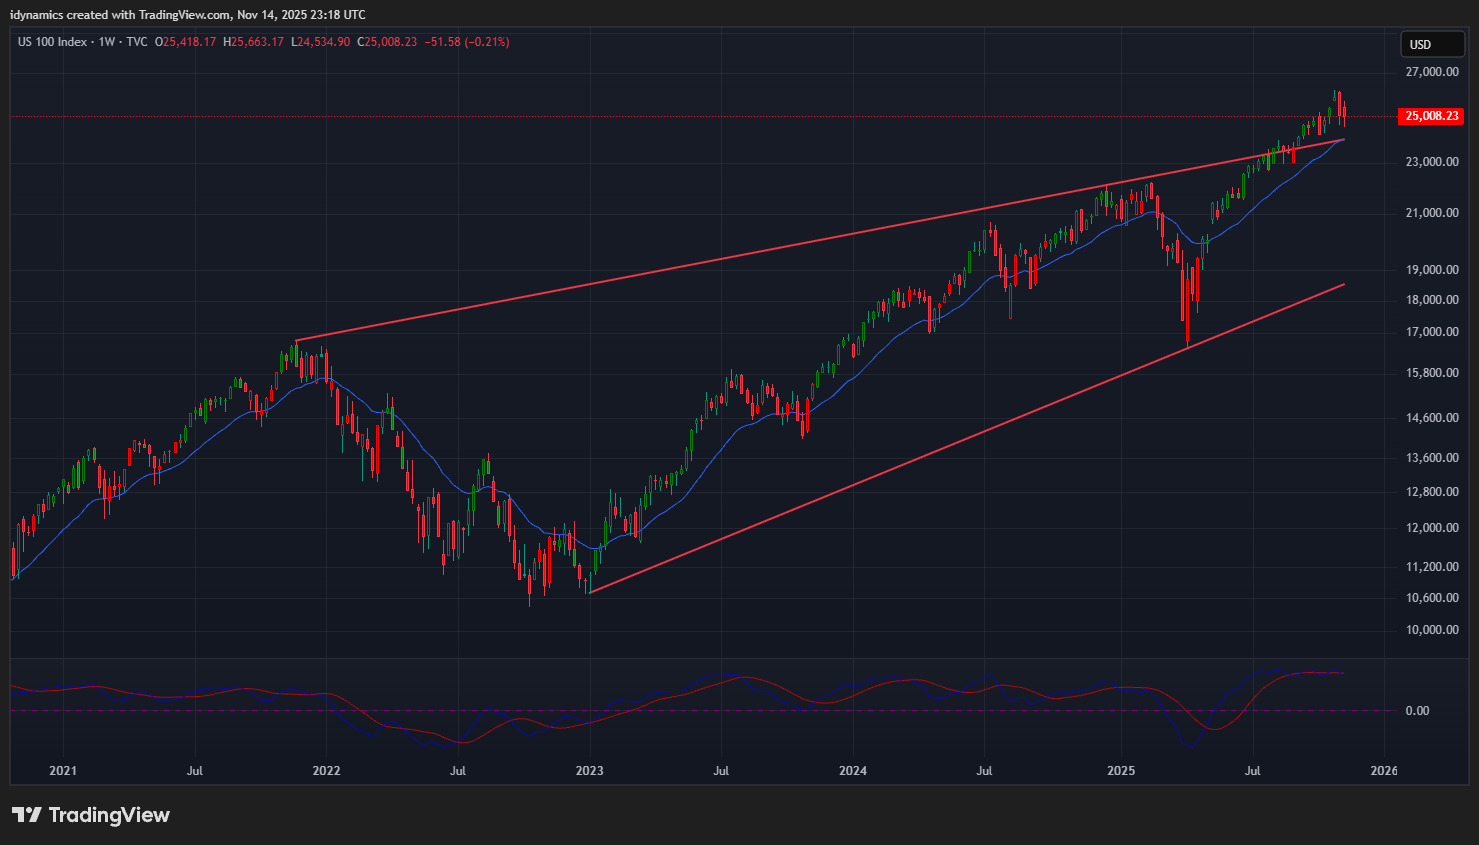
 Nasdaq 100 Weekly Candles
Daily Breadth 
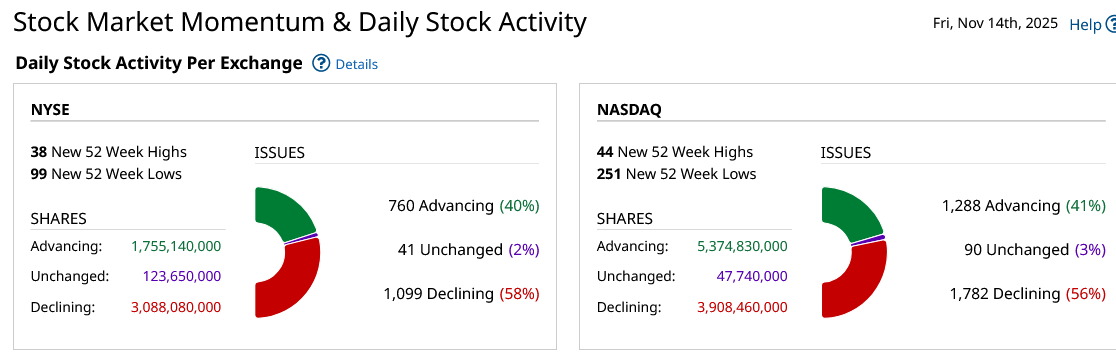
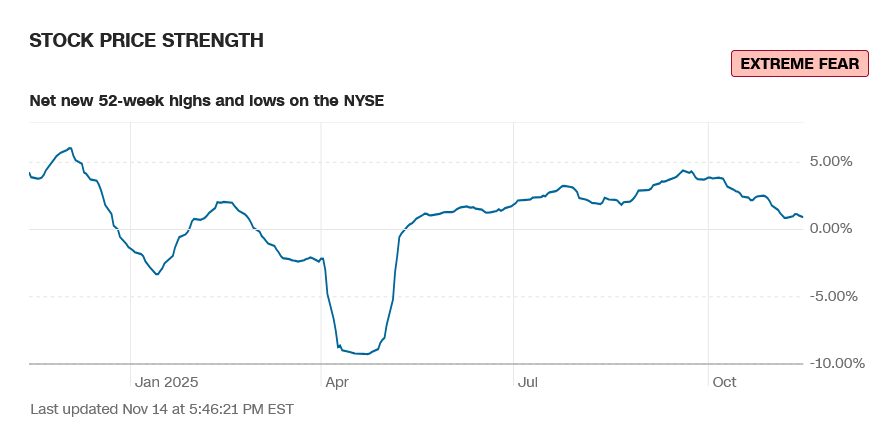
Breadth flattened on the week, and sentiment still reads extreme fear.
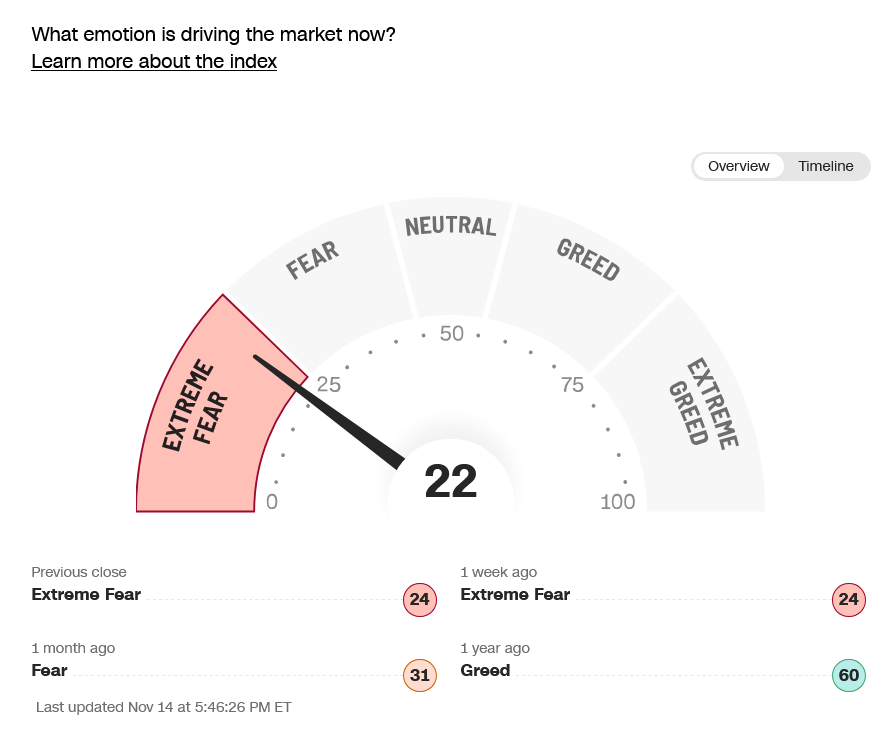
CNN Fear & Greed Index
 AAII Investor Sentiment Survey
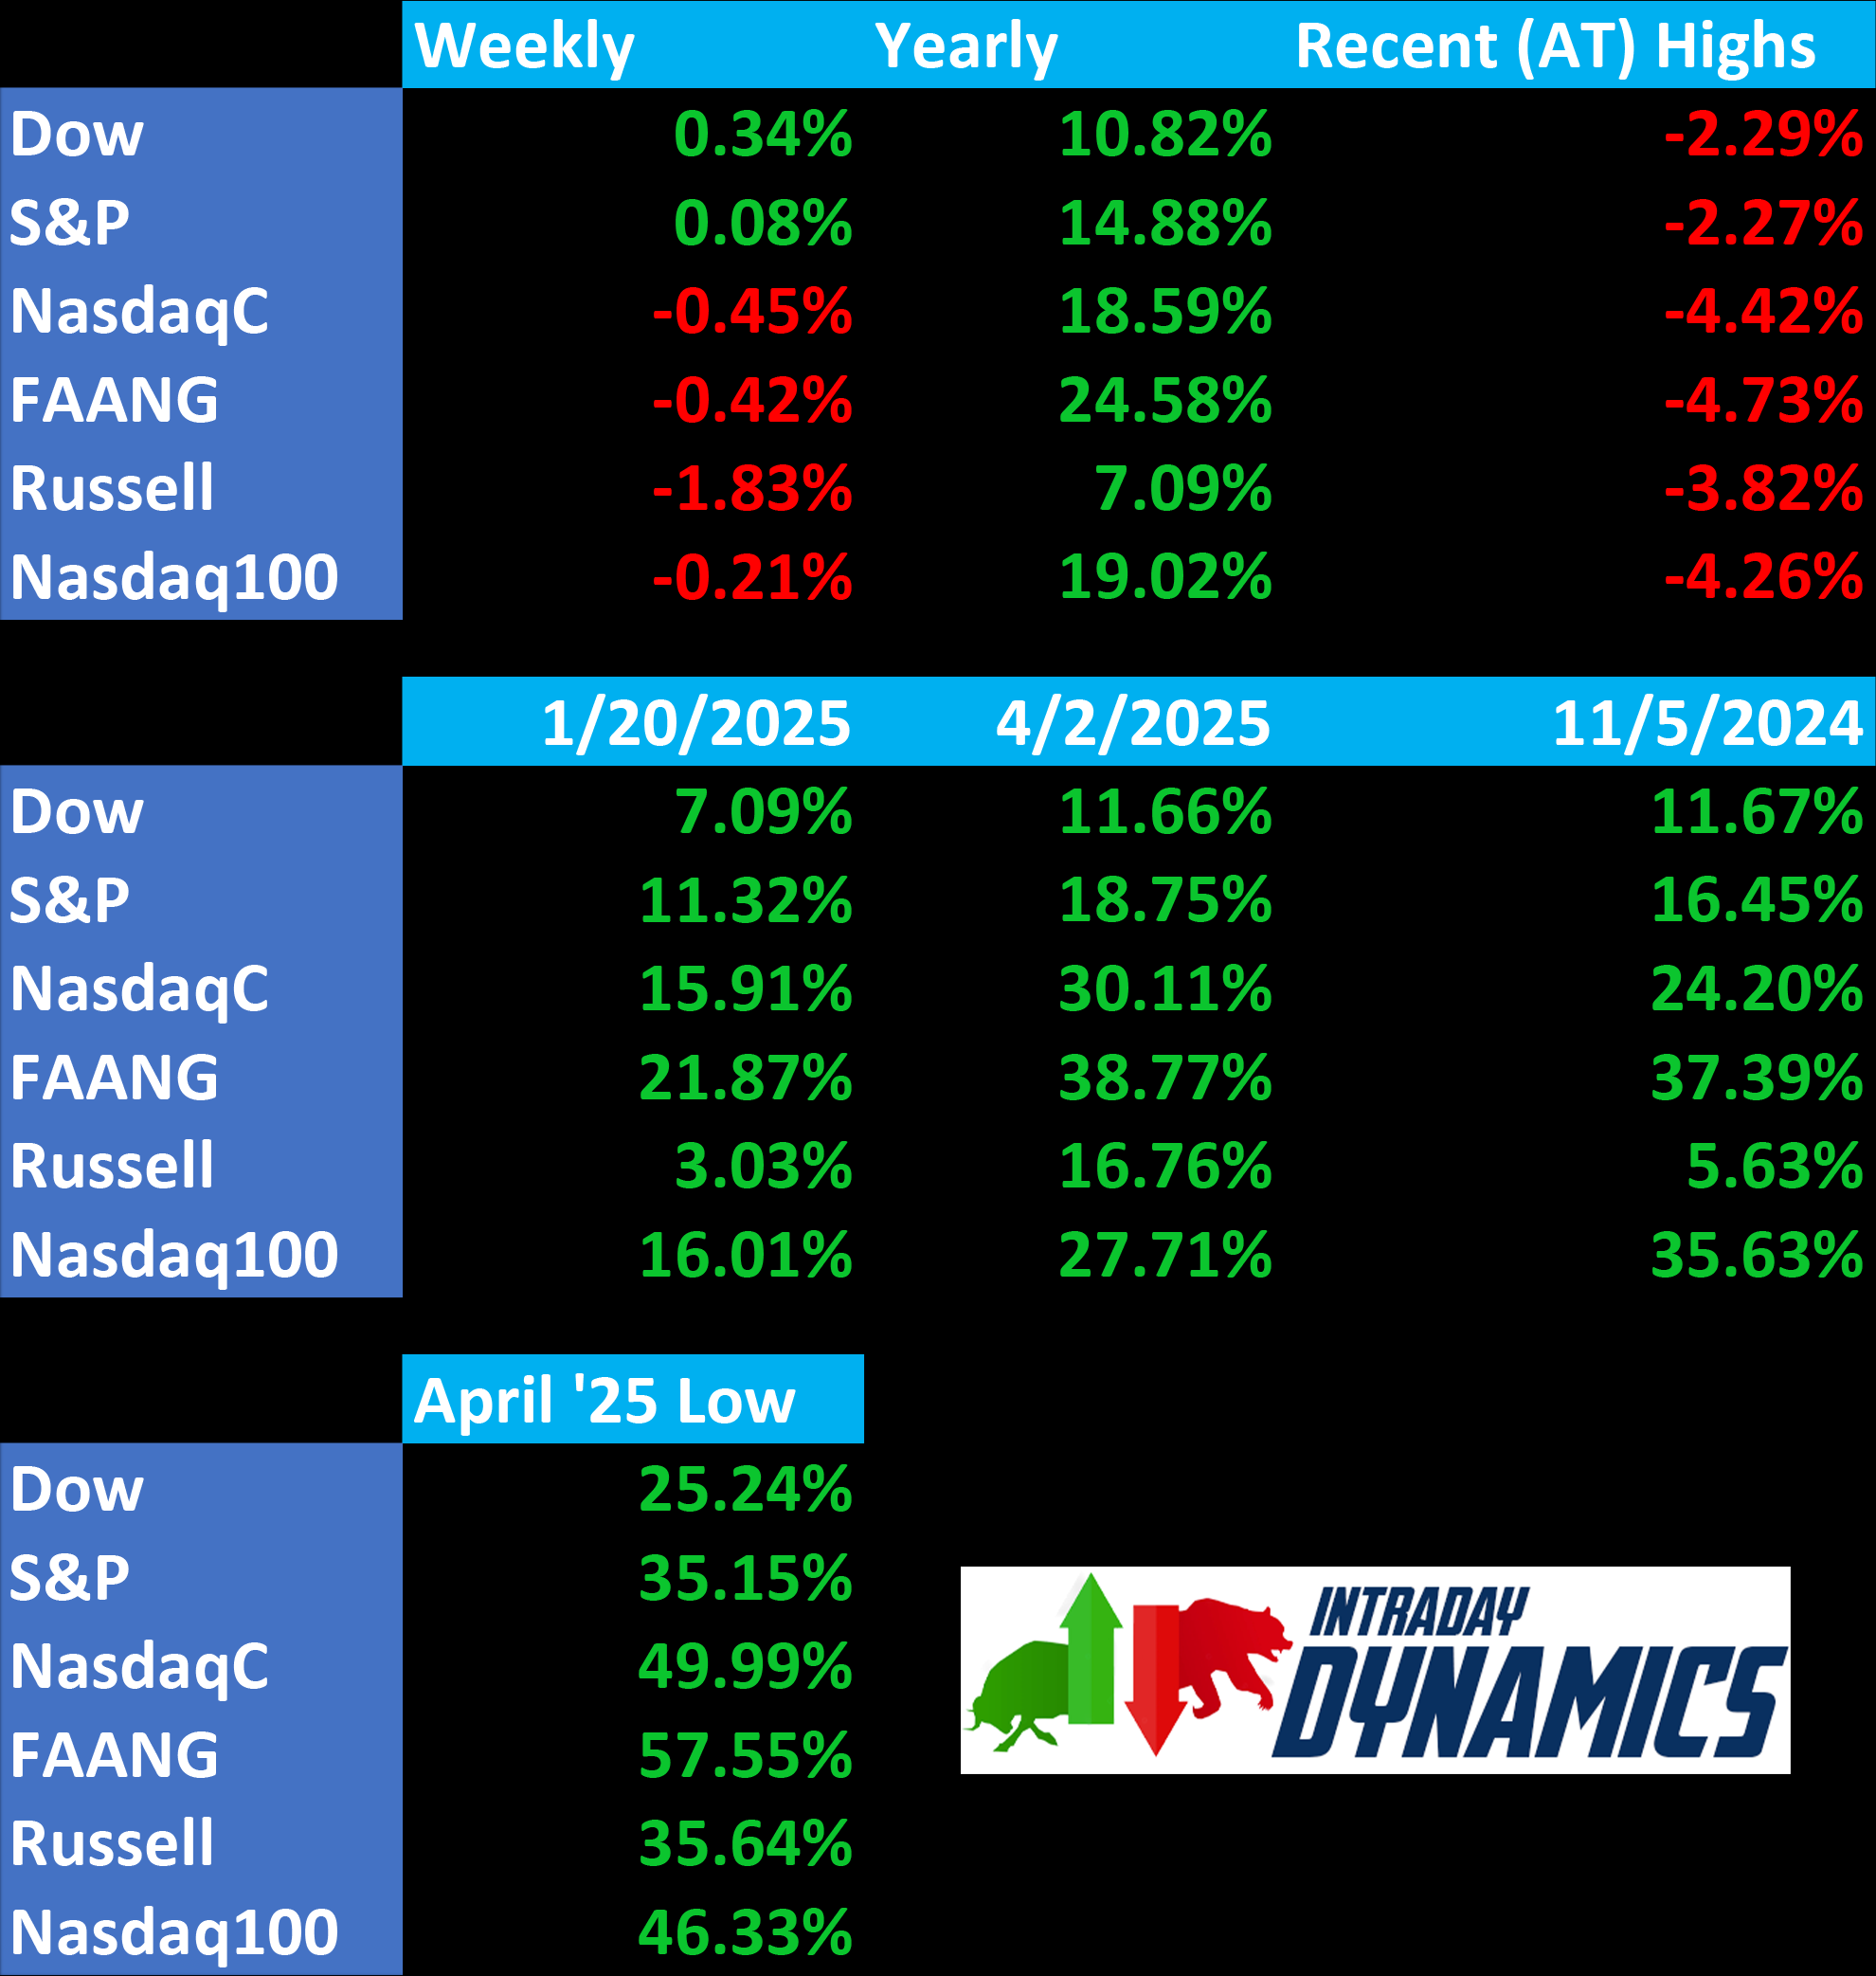
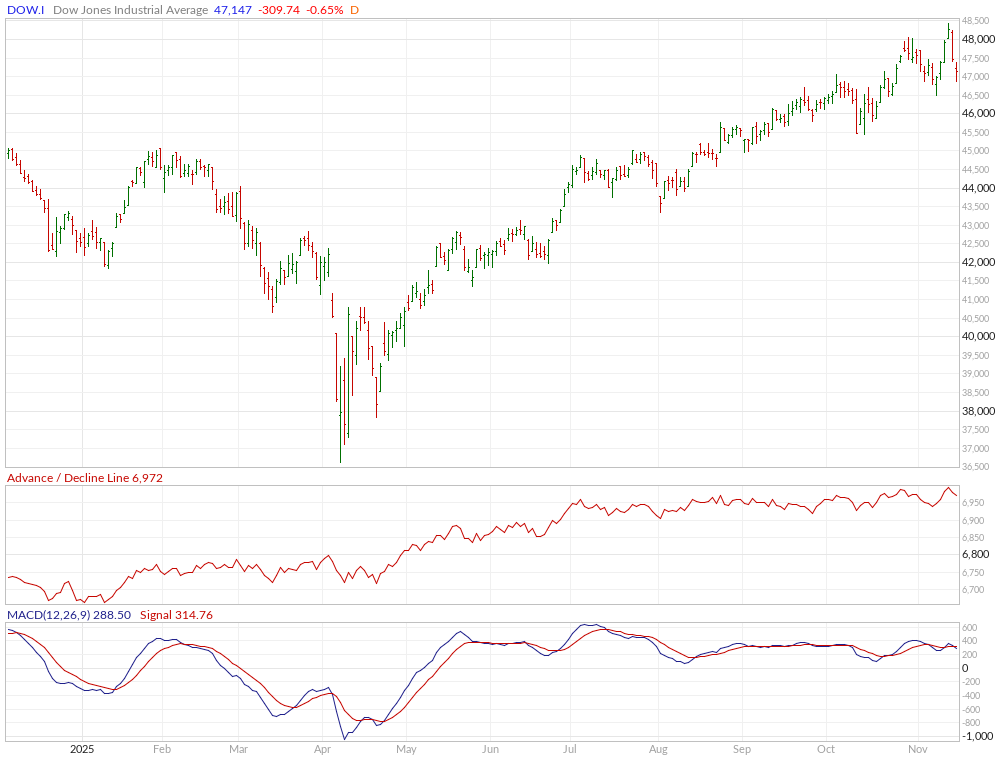
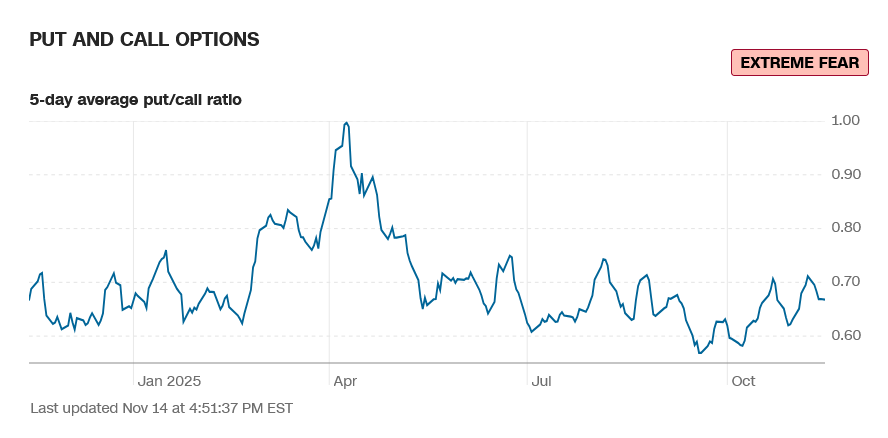
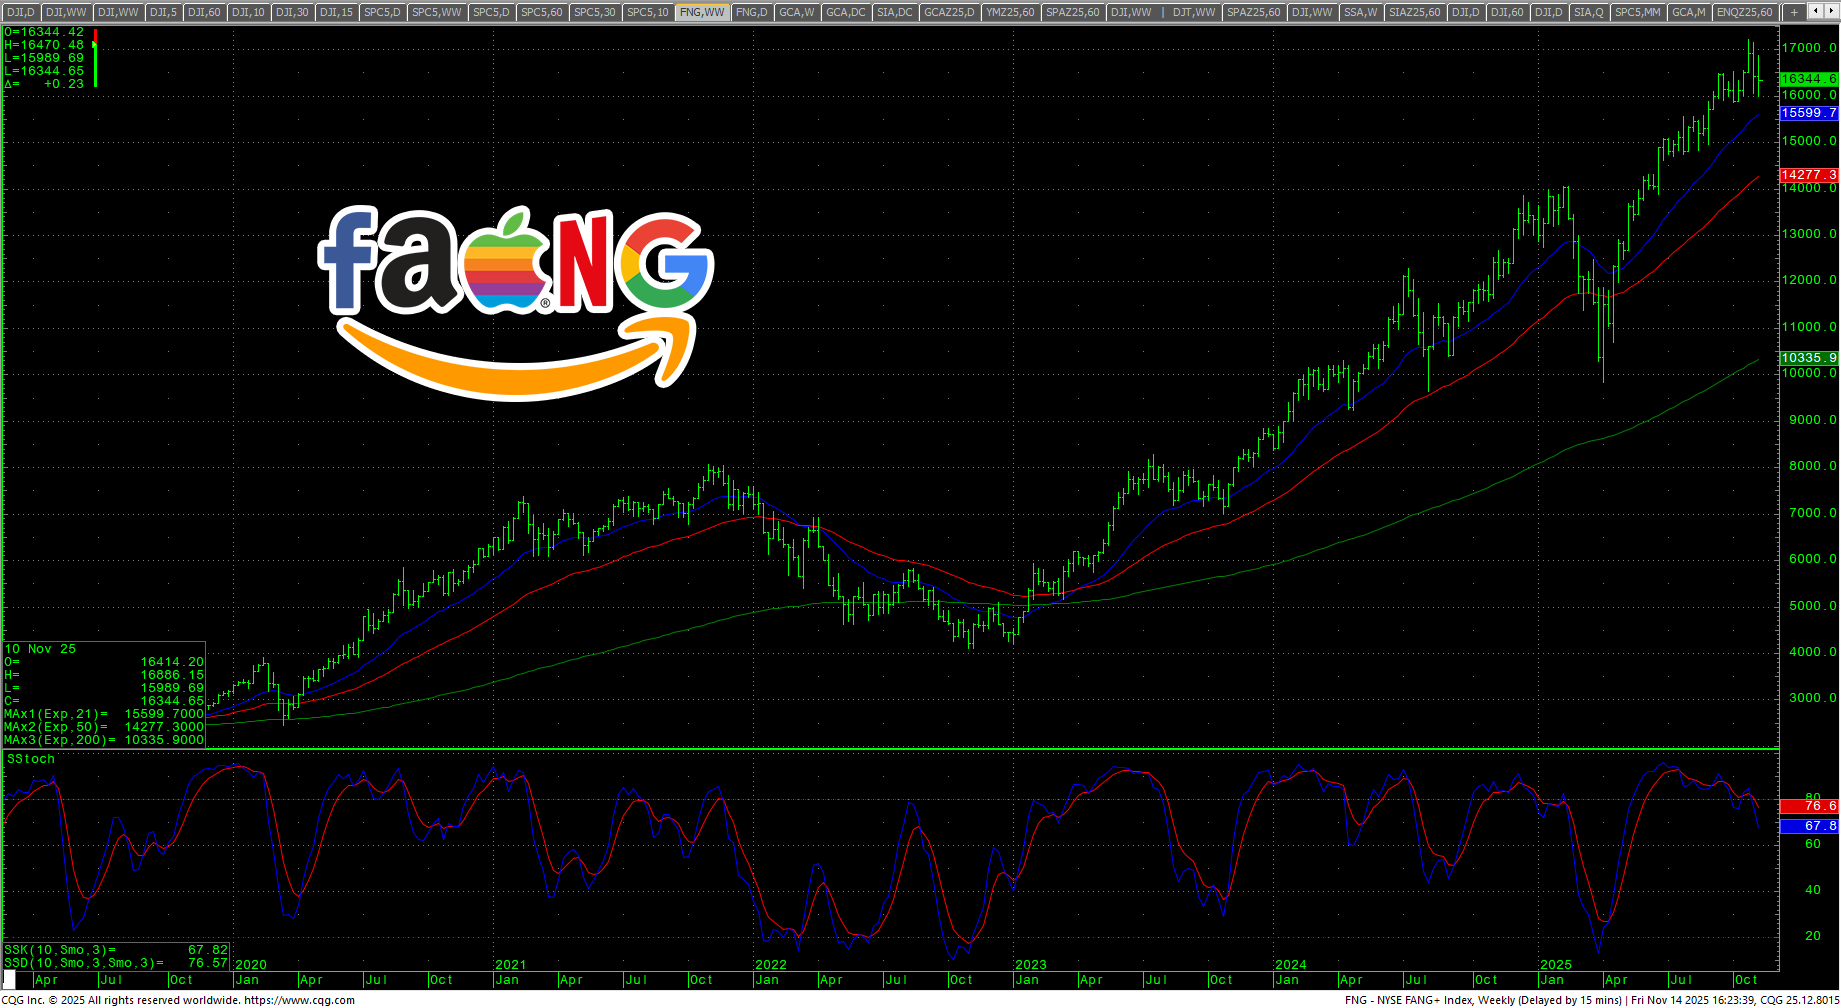
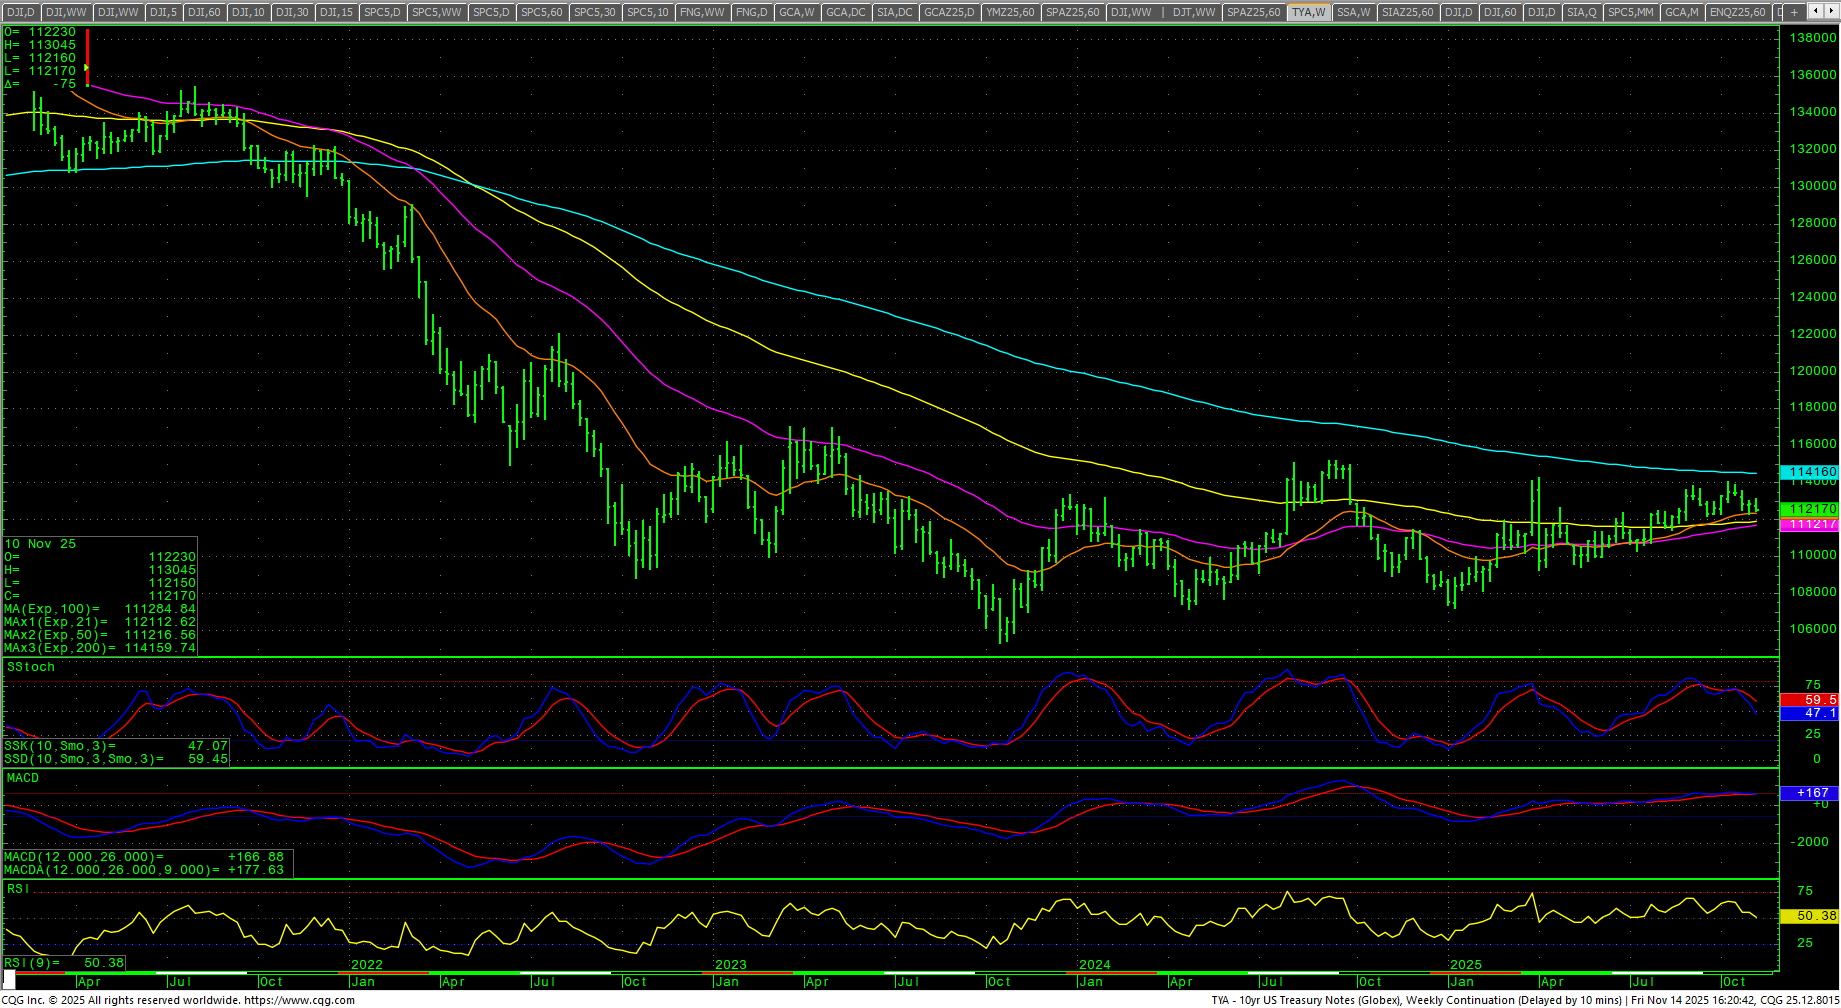
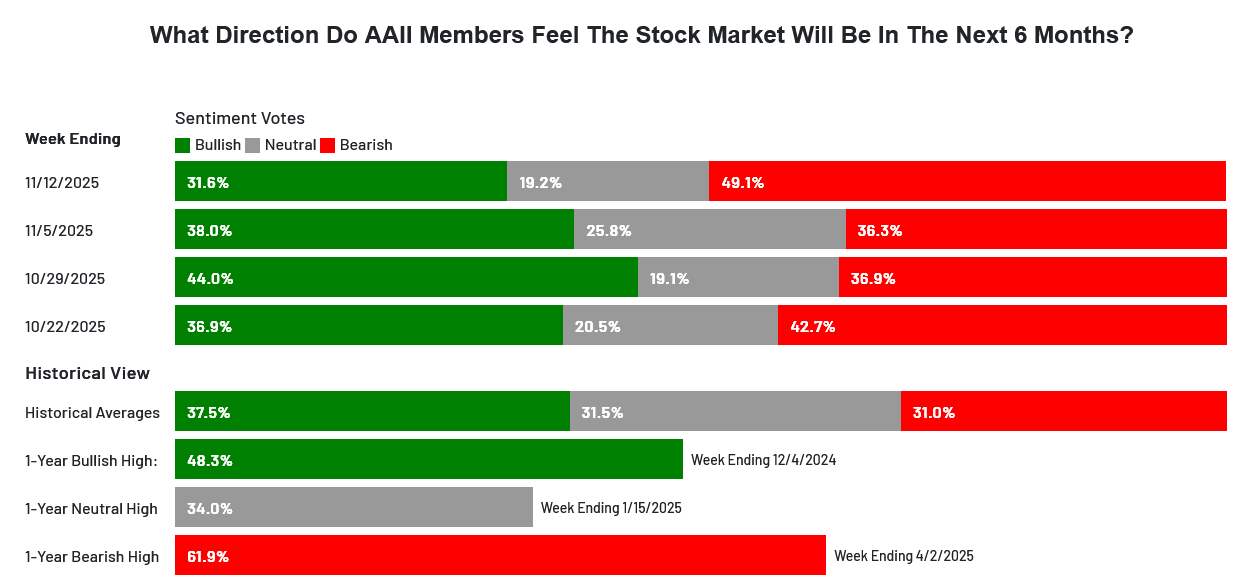 The CNN Fear and Greed Index is 22 and reads extreme fear. Breadth flattened on the week and sentiment still reads extreme fear. Latest AAII Sentiment Survey: Pessimism Takes Flight. The Dow A/D ended at 6972 after hitting a record on Wednesday. The VIX swung between 17/23 and closed just under 20, up +3.93% near the middle of the week’s range. The Put/Call closed at 0.67 and reads extreme fear. The 52-week, A/D ended at +0.92% and reads extreme fear. The Dow closed the week up +0.34%, closing in the bottom of the range. The S&P was up +0.08% closing in the lower half of an inside range. The Nasdaq Composite was down -0.45% and the Nasdaq 100 was down -0.21%. The NYSE FANG closed down -0.42% near the lower end of the range but well off the intraday lows on Friday. The Russell was down -1.83% in the bottom of the range. The 10-year notes closed lower in the bottom of a reversal range. The yield on the 10YR increased to 4.15%.
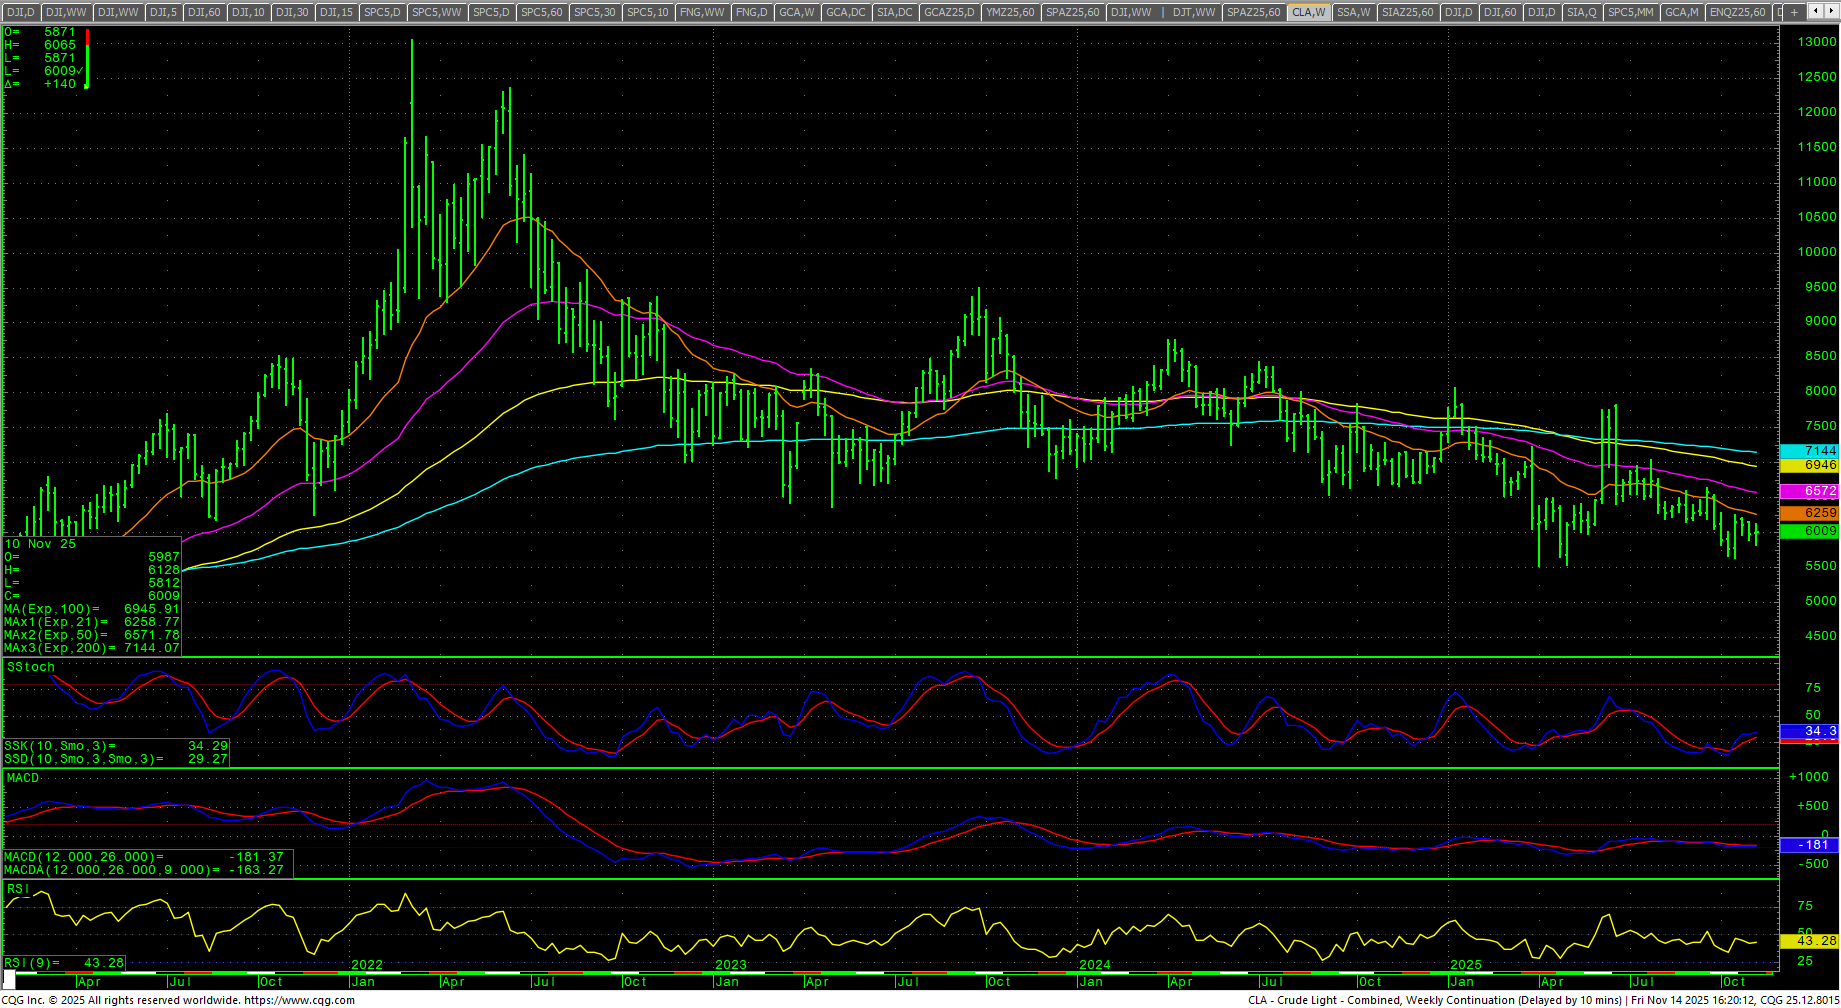
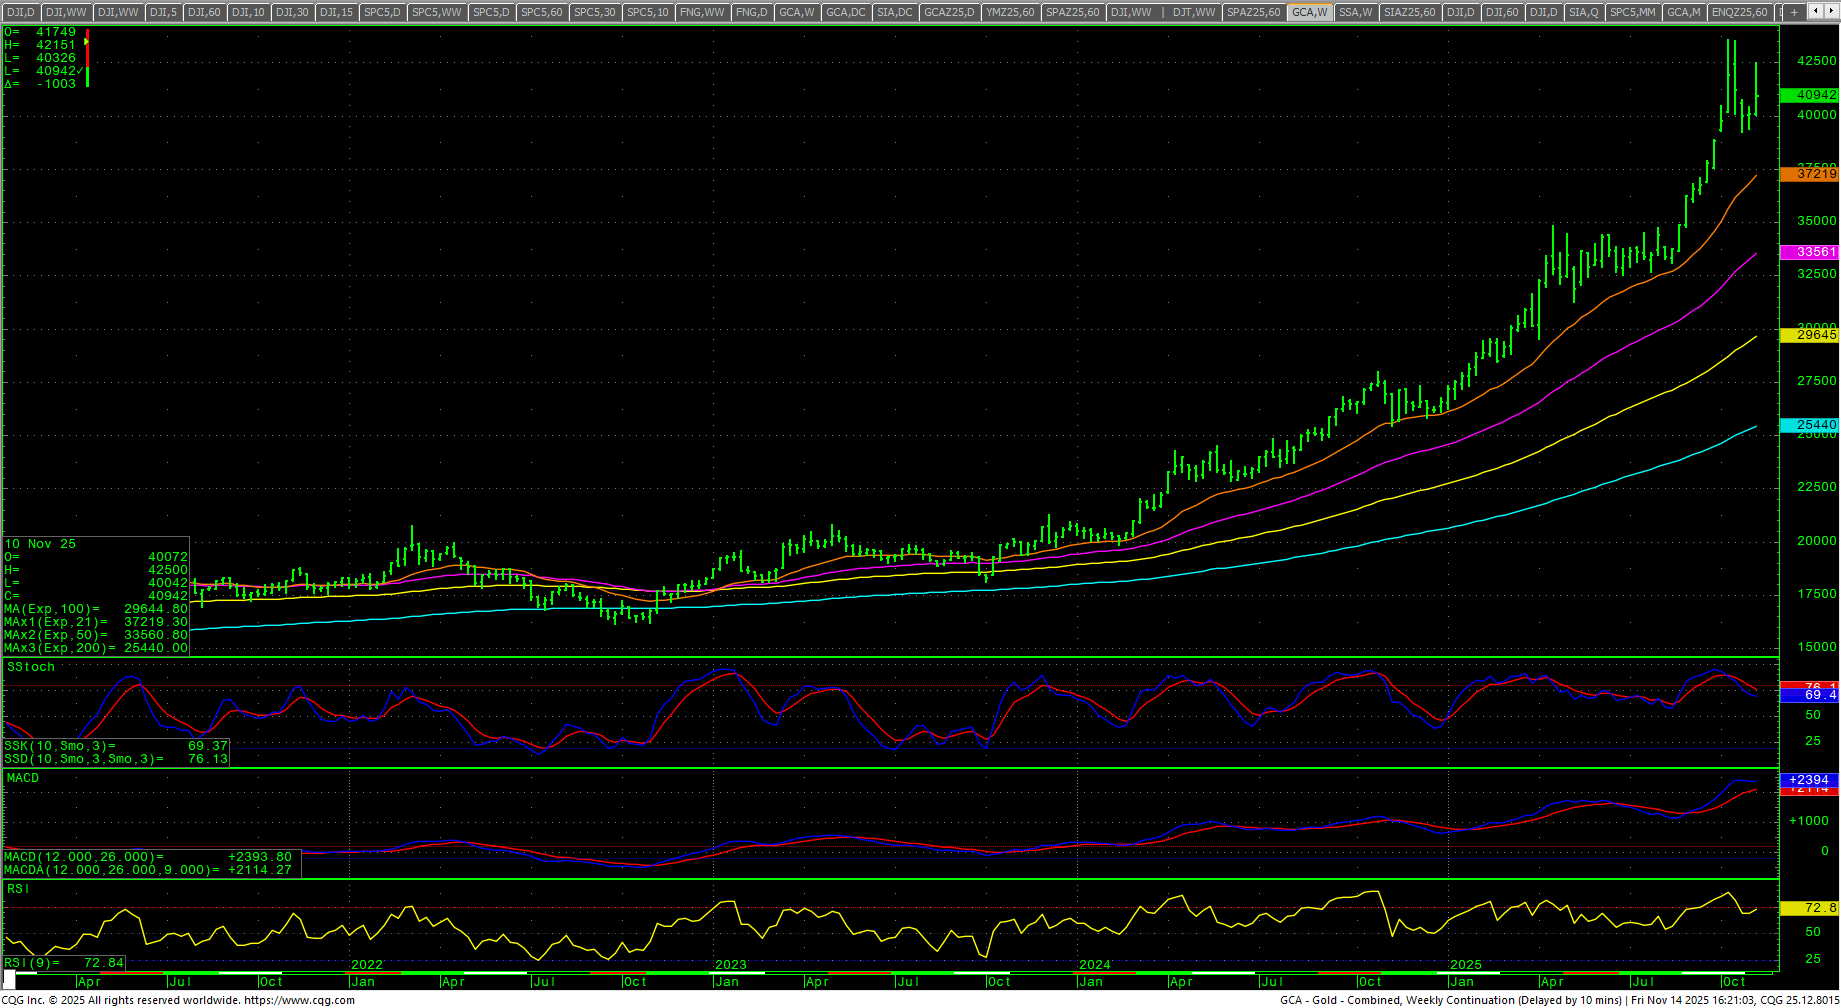
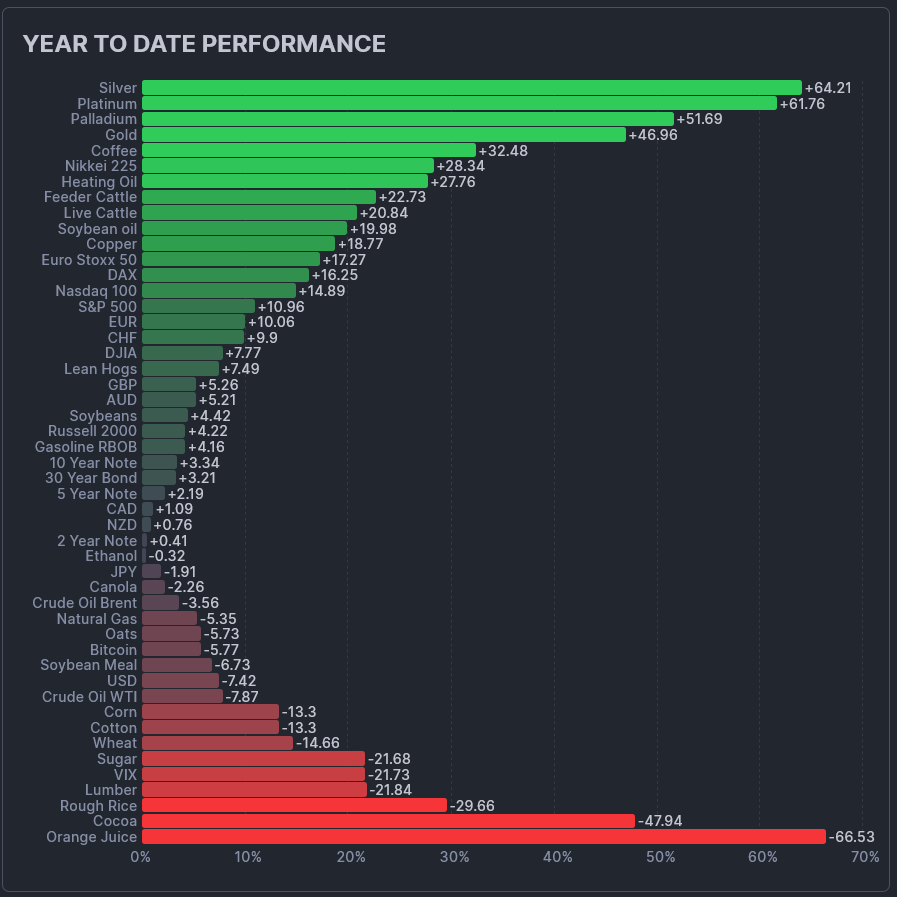 The CRB Index was up +0.57%. Crude Oil was up fractionally as it continues to find support against the artificial floor at the critical $60 level. Gold traded a highly volatile week, surging sharply intraweek and then plunging Friday, but closing above the $4000 level. Silver rocketed to an ATH above $54 and then plunged $2.49 in Friday’s trade, but setting a new all-time high weekly close.
Timing Points
Wednesday and Thursday mark critical cycle timing on the 19th/20th. For a longer-term look at the timing, see the Special Report issued on 9 November 2025.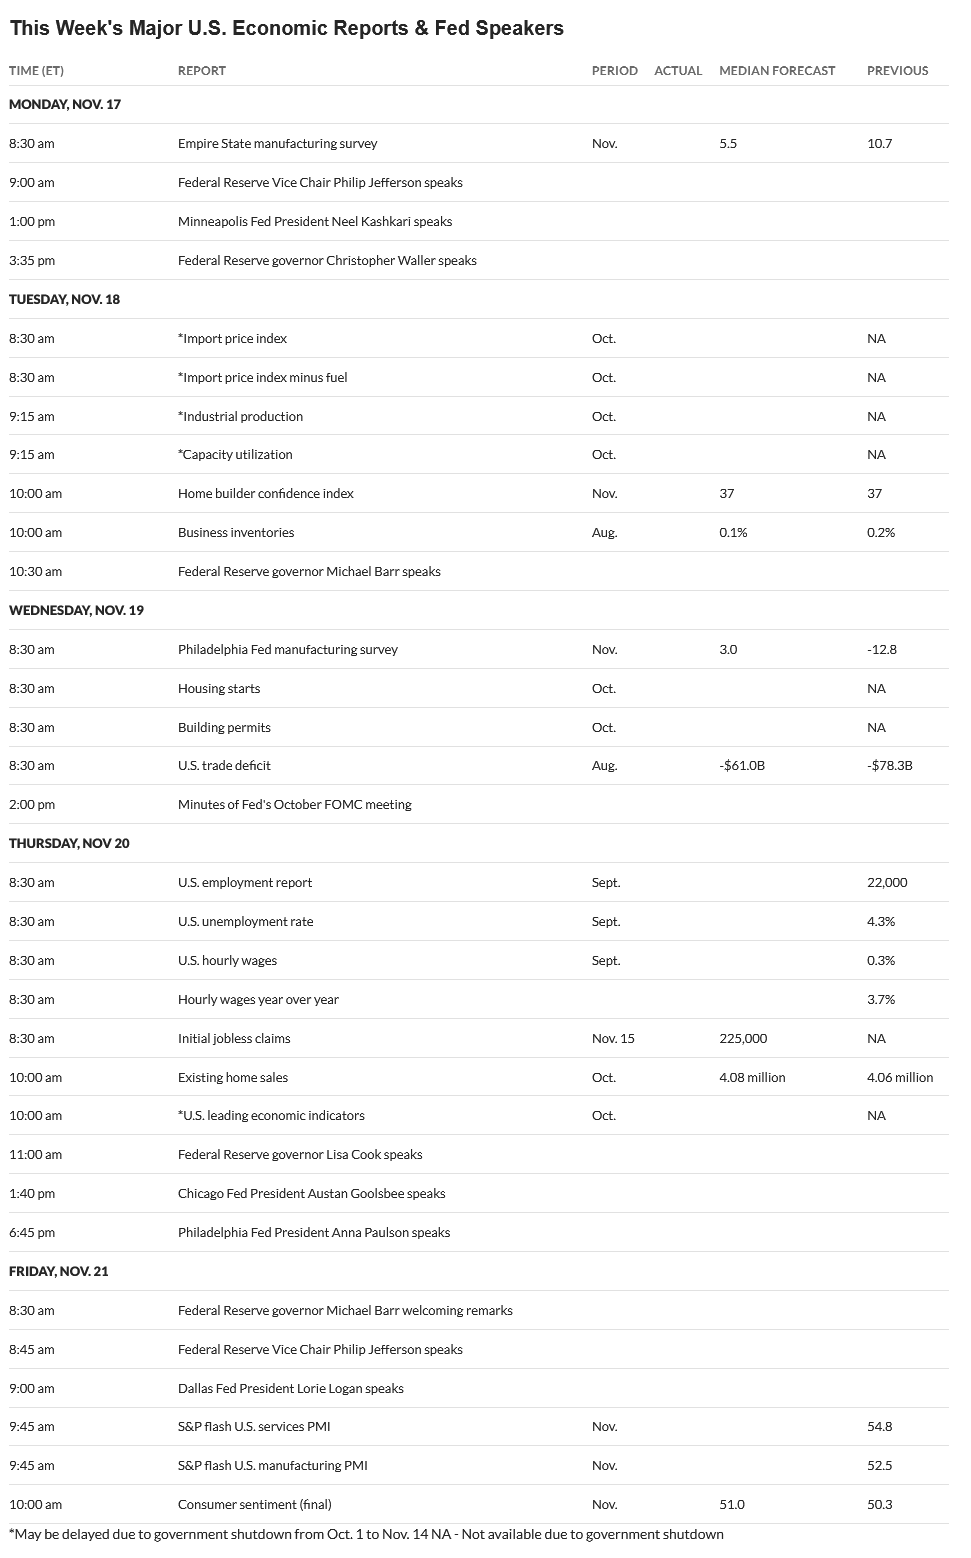
- 11/19-20 ***
- 11/25 **
- 12/04 ***
- 12/15 *** X may run through
- 12/17 *** X key to bonds/interest rates
Dow Jones Industrial Average
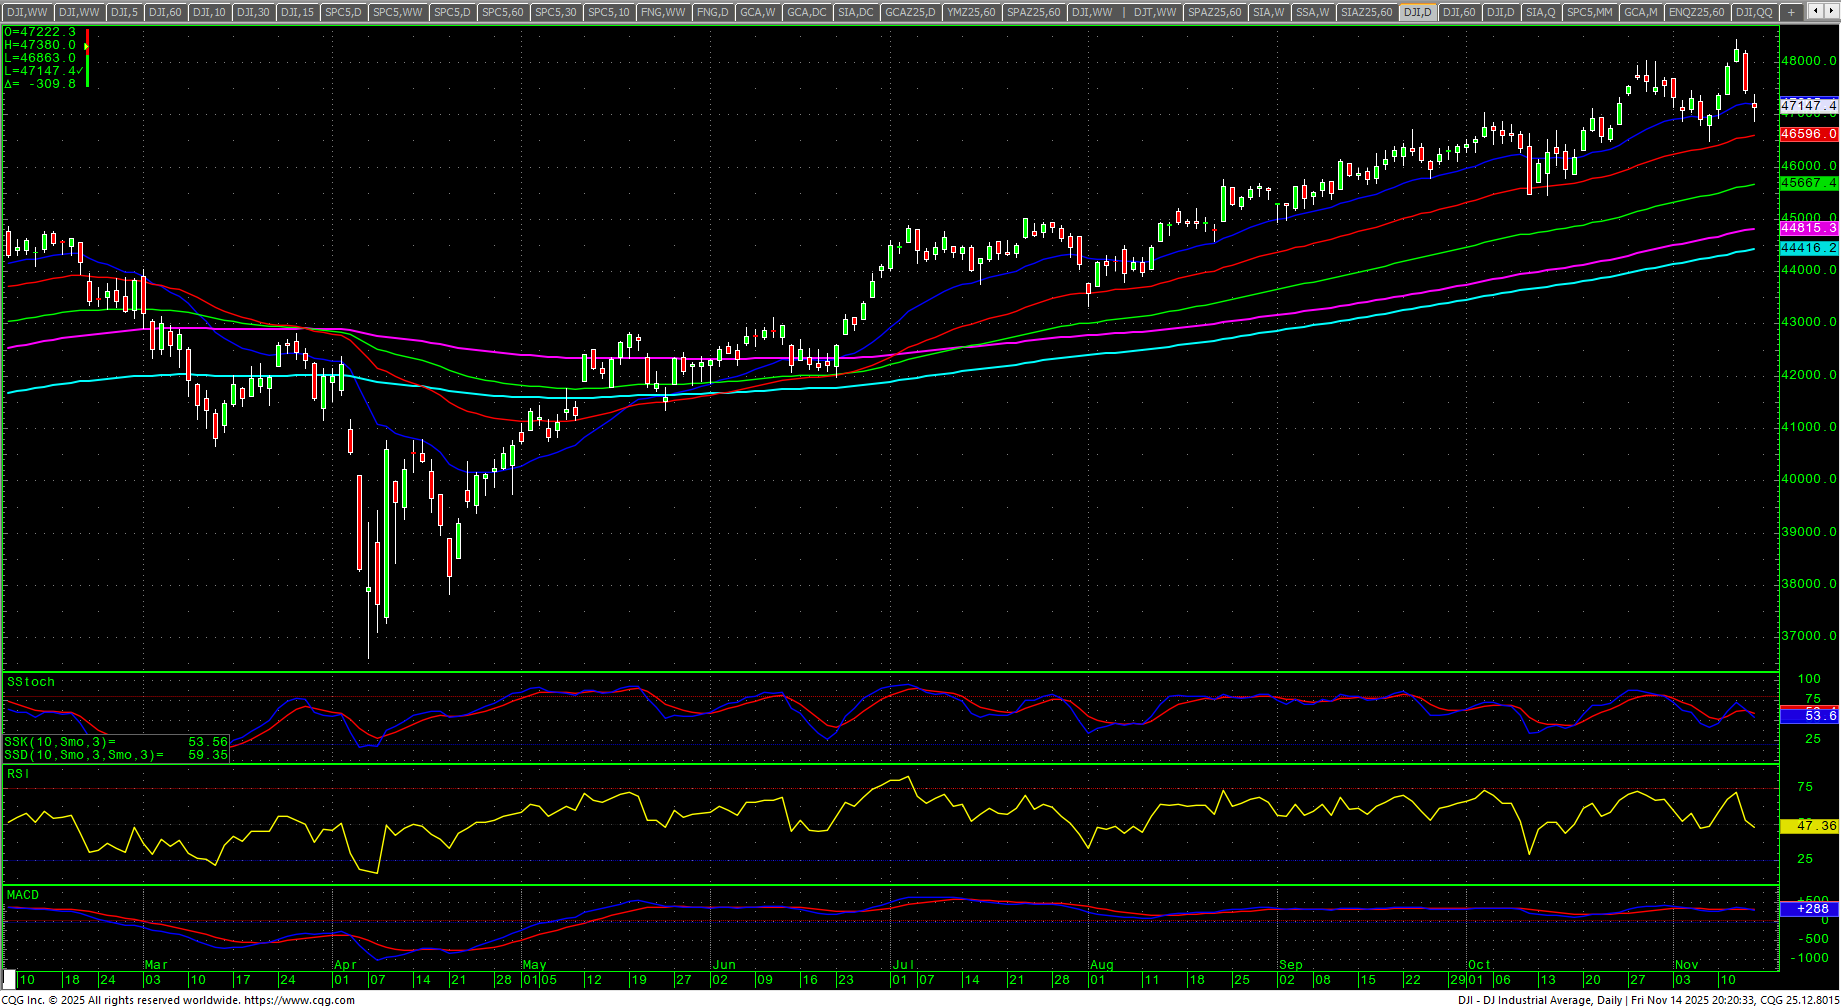
Dow Jones Industrial Average Weekly H-L-C
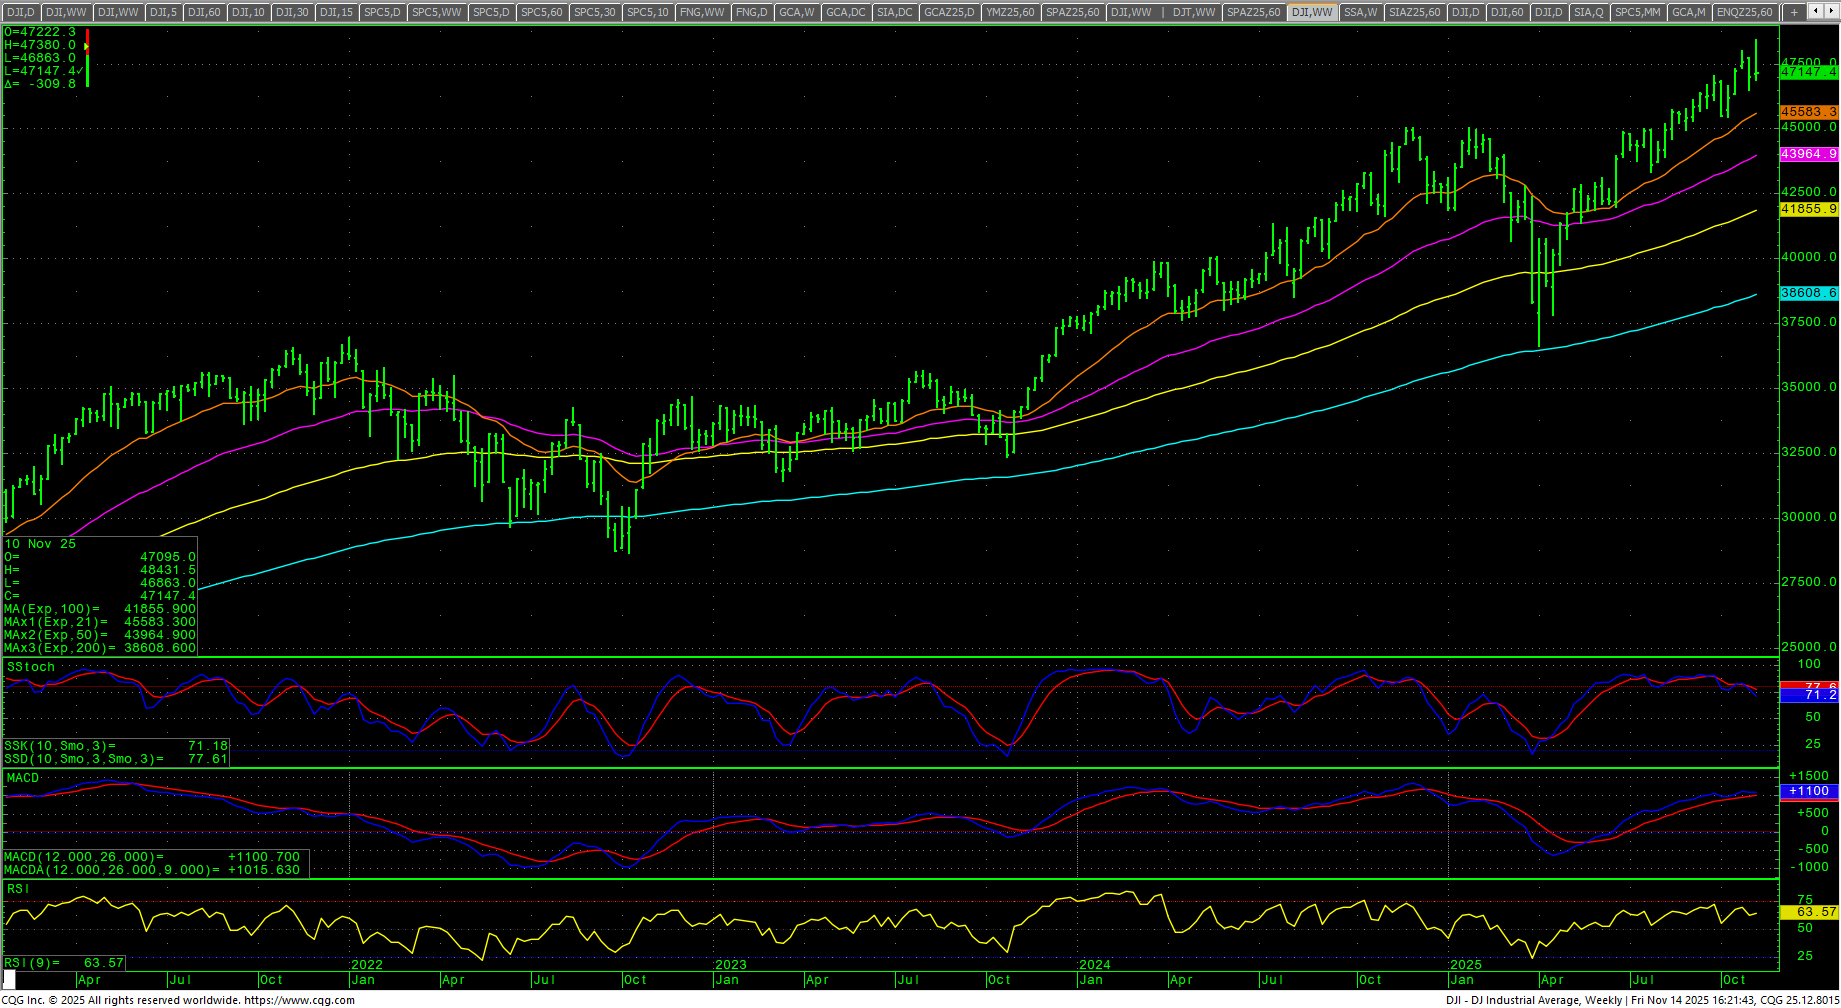 The Dow closed the week up +0.34% but near the lower end of the week’s range after prices surged to an ATH and close above the 48,000 level earlier in the week. The daily stochastics are down. The MACD is flat and in a preliminary bearish divergence. The daily RSI is 48.40. The 200-day MA starts the week at 44416.20 and is at record highs. The weekly is down with now multiple bearish divergences.
Dow Jones Industrial Average Weekly Candles
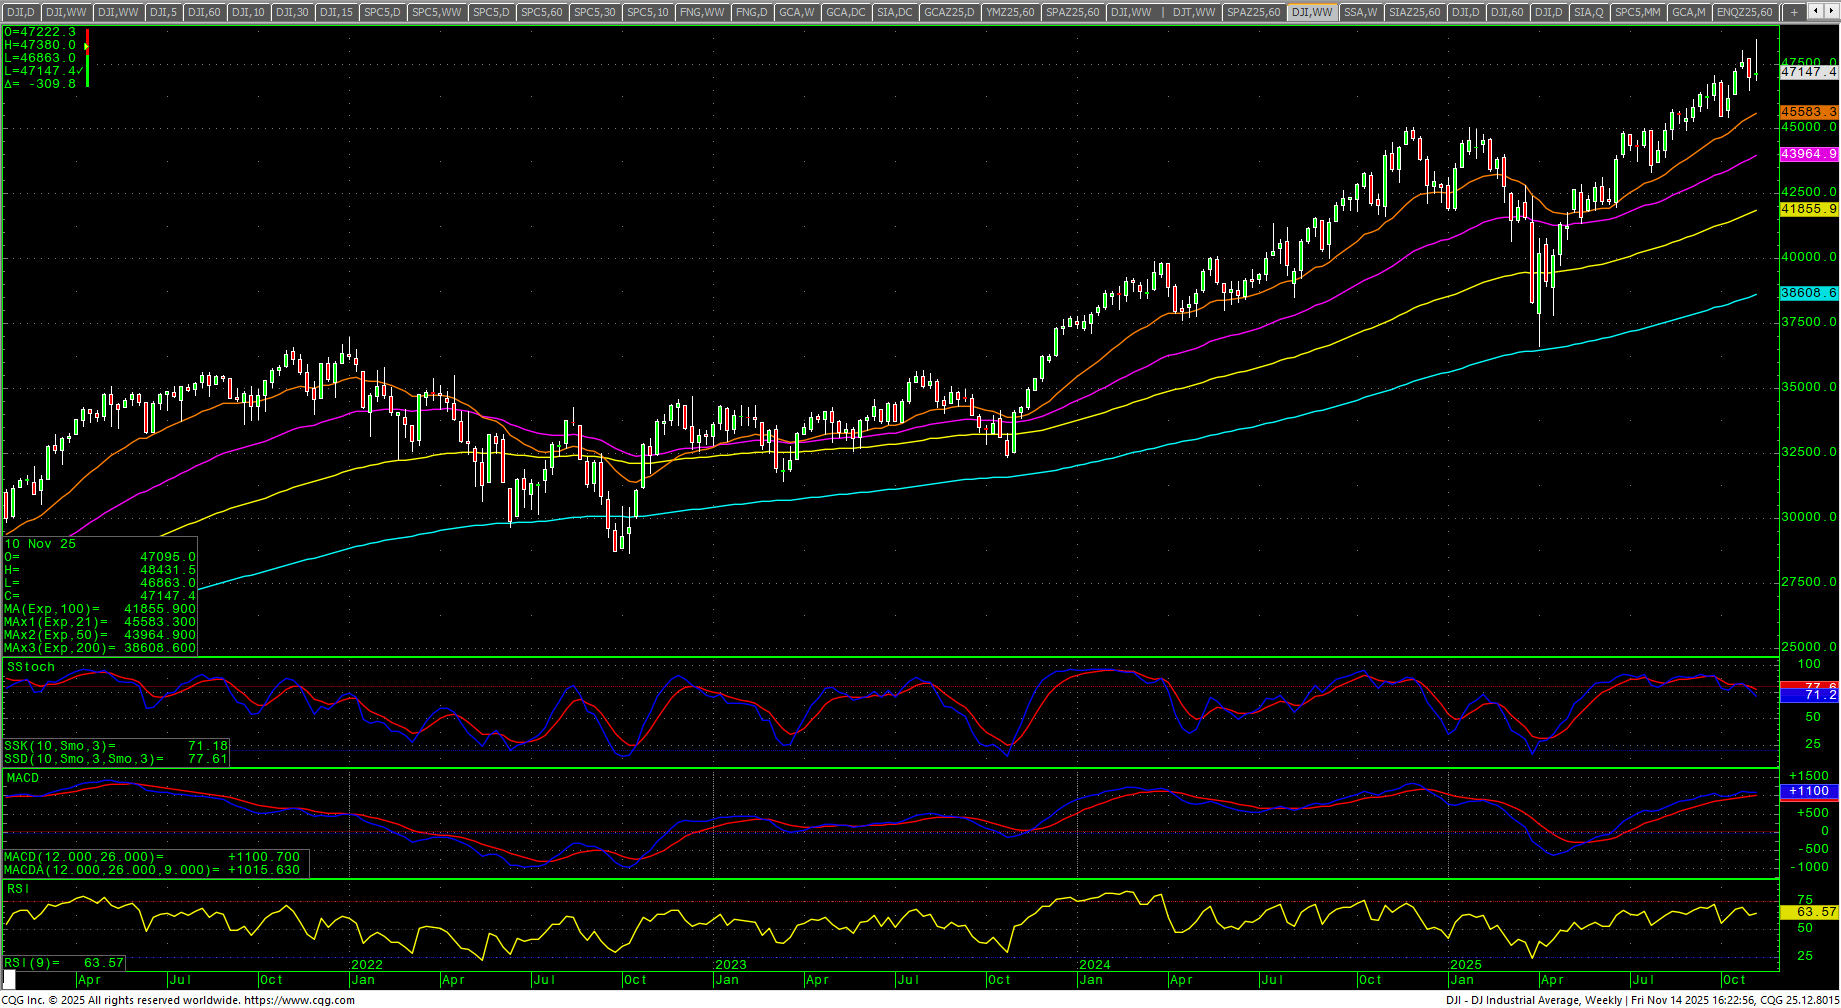 Support is 46941, 46863 and 46590/46585. A breakdown under 46595 should minimally test 46490/46461 with counts to 46195 through 46155. Closes under 46155 setup a retest of 45452 with trading support at 45642. Under 45452 is a bearish signal and opens counts to 43916. Closes under 43916 setup critical support of 43340 with trading support at 43467. Under 43340 (before the end of the quarter) would be an extremely bearish signal and minimally suggest 42521 and would open long-term counts to 41126/41120.
Dow Jones Industrial Average Hourly H-L-C
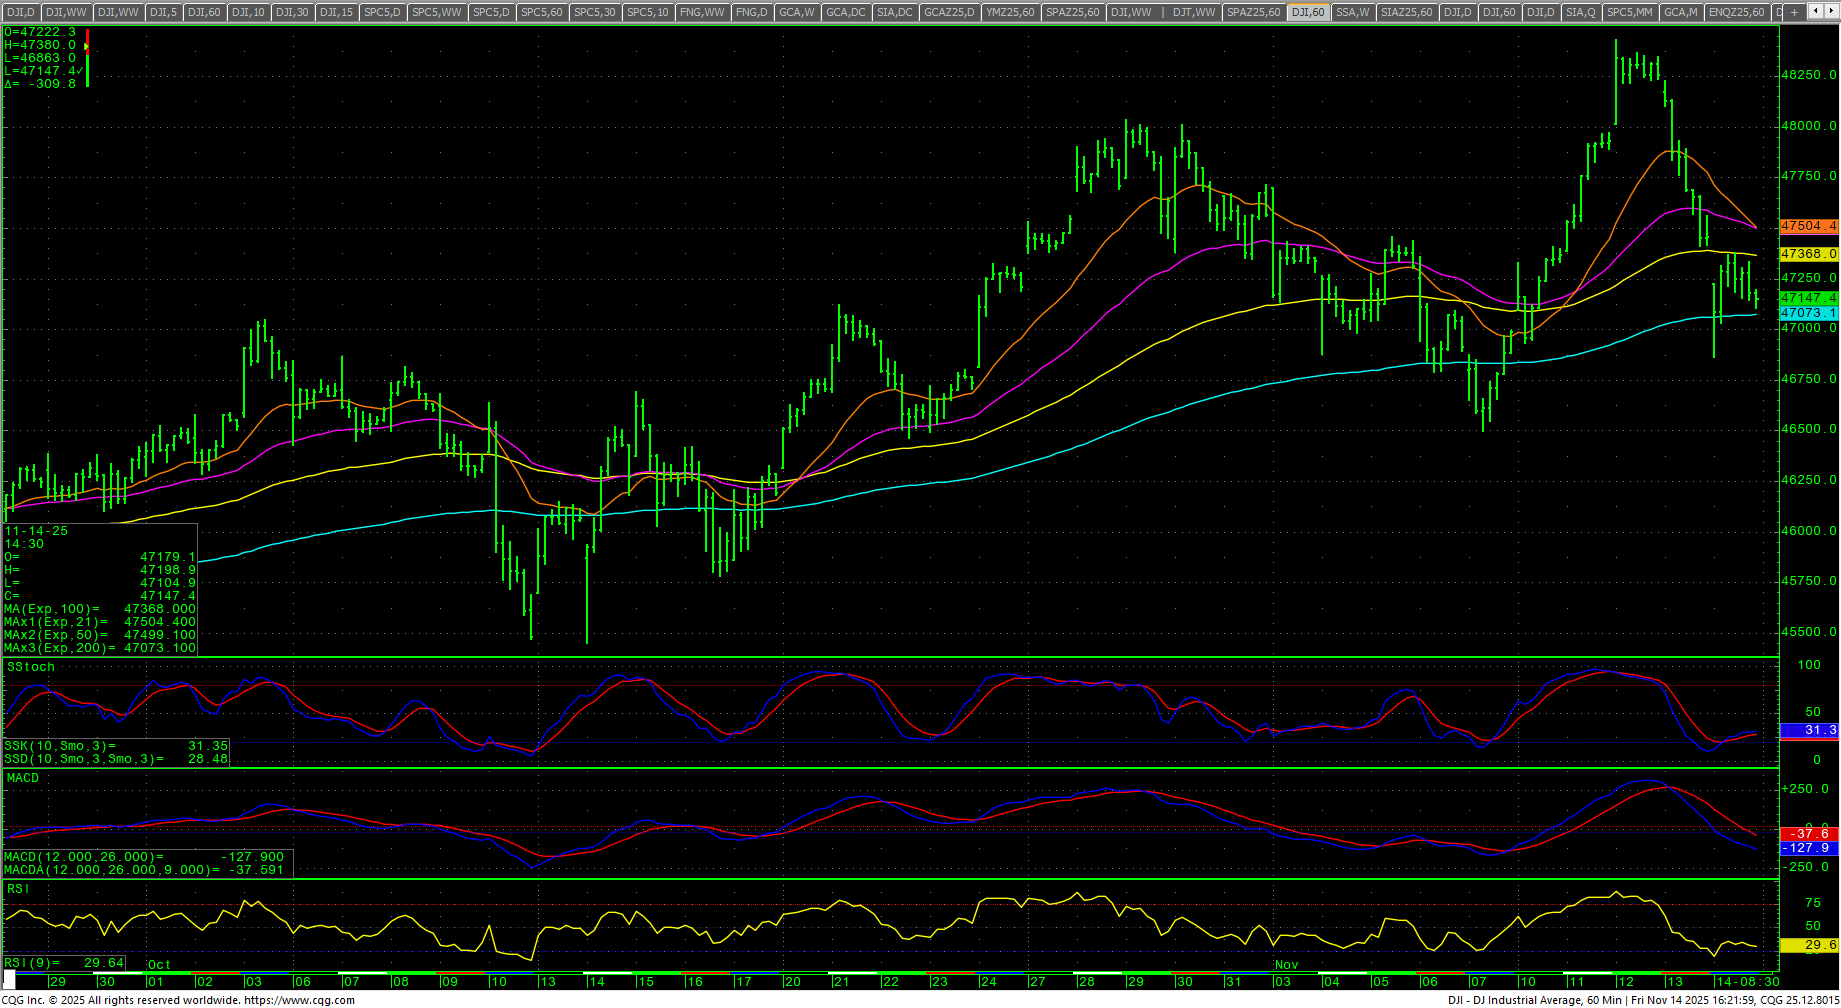 The hourly is slightly oversold on Friday’s close. Resistance is 47233 and 47462. A breakout above 47462 sets up 47647 with full counts to 47832/47835. Closes above 47835 should minimally test 48040/48061 and will open potential for a retest of the record highs at 48430/48431. Daily closes over 48431 have potential to 48510. Closes over 48510 will open counts toward 48654 with potential to 48798. Above 48798 opens counts to 48942 and 49086.
Dow Jones Industrial Average Daily Candles
| Resistance | Support |
|
|
S&P 500 Cash Index: SPX
S&P 500 Index Weekly H-L-C
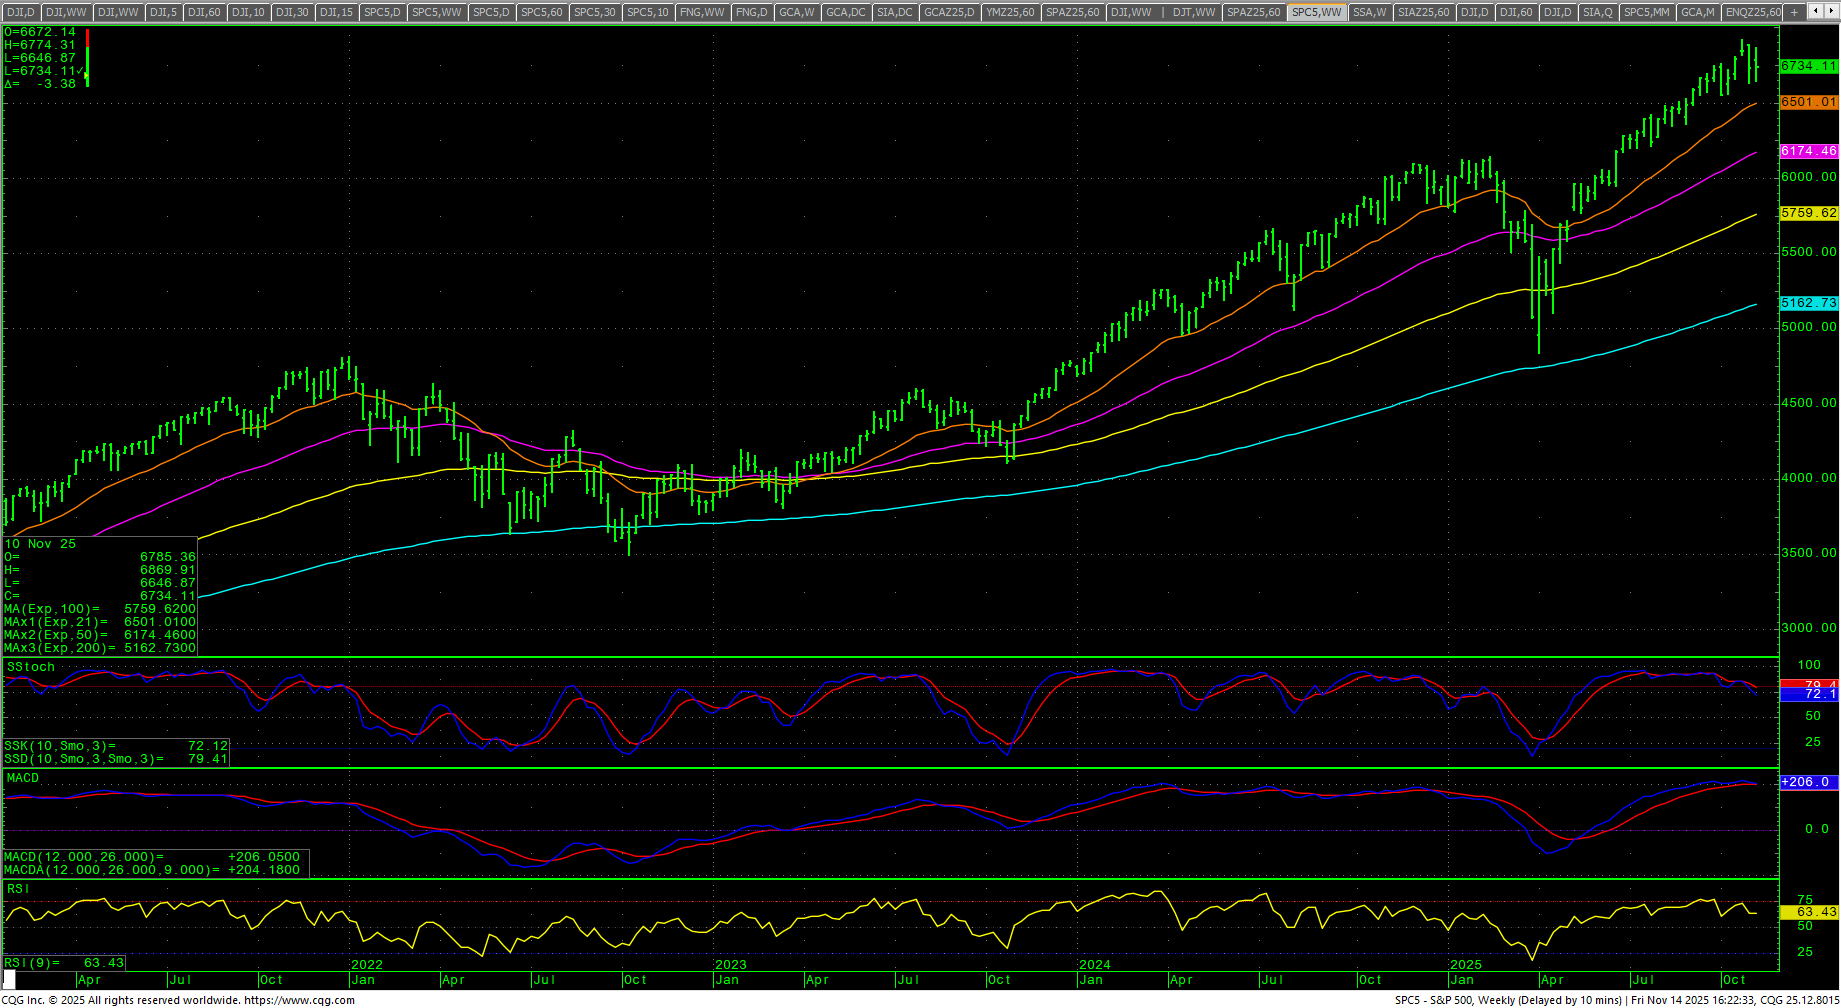 The S&P traded a volatile inside week and closed basically flat, +0.08%, in the lower 50% of the weekly range. The daily has hooked lower in the stochastics and MACD is flat as they both react to recent bearish divergences. The daily RSI closed at 43.27. The weekly is down with a significant bearish divergence. The hourly is neutral with Friday’s close and coming off oversold conditions. The 200-day MA is 6266.62 and at record highs.
SPY Weekly Candles
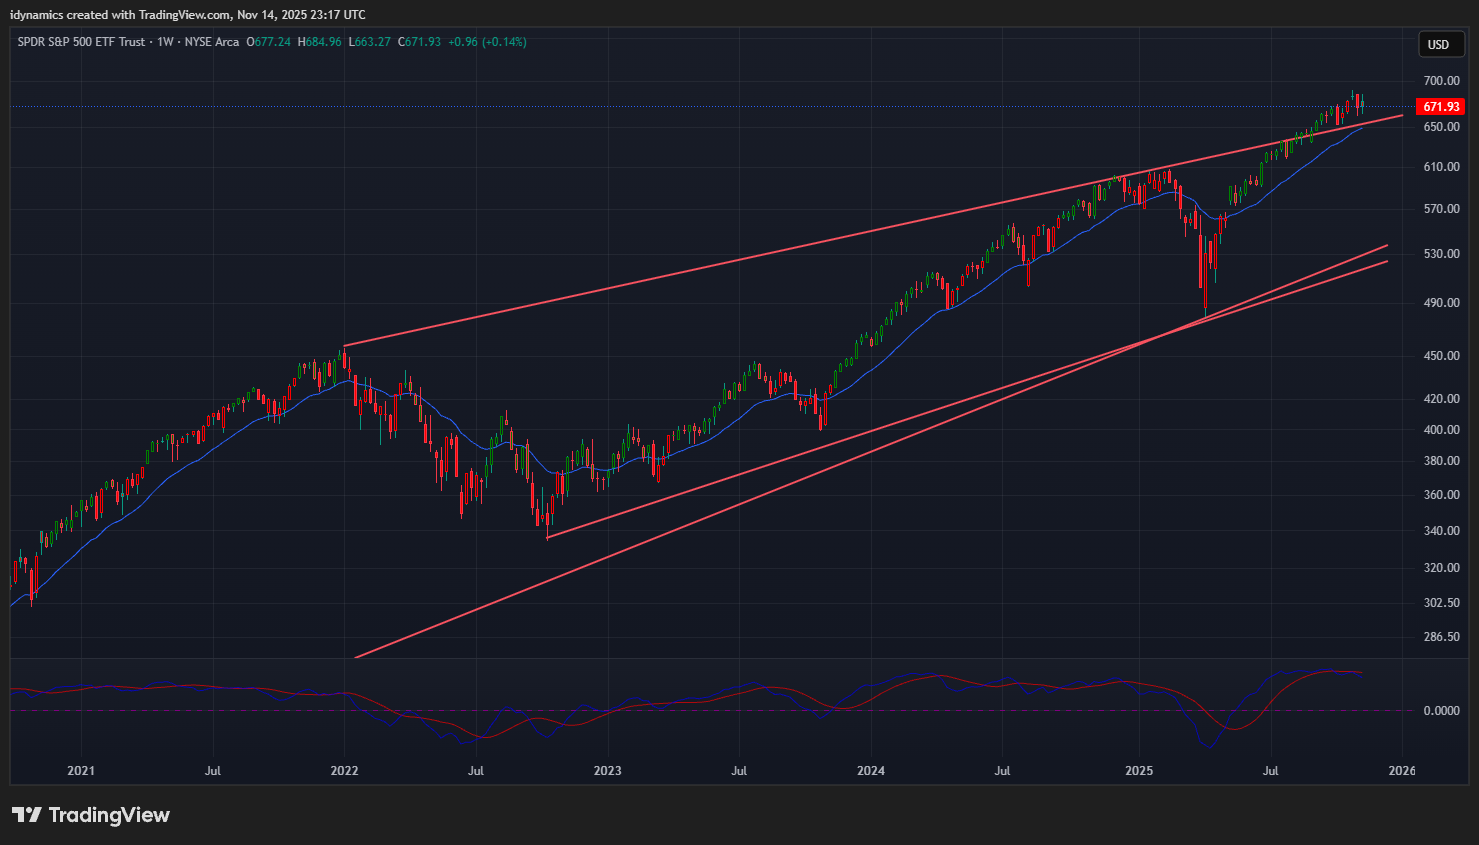 Prices retested a key zone of support at 6660 through 6643. Support is 6710 and 6695/6692 with this pivotal band of key support through 6643/6631. A breakdown with closes under 6631 can retest the swings at 6555/6550. Closes below 6550 suggest a test of 6360 through 6643. pivotal near-term support at 6514/6510. Closes under 6510 open counts to key support at 6361/6360. A breakdown under 6360 should test 6123 with full counts into the 6044 level with critical hourly support at 6212/6201. Daily closes under 6044 should minimally test 5877 and 5799/5798 with counts to 5631/5628.
S&P 500 Index Hourly H-L-C
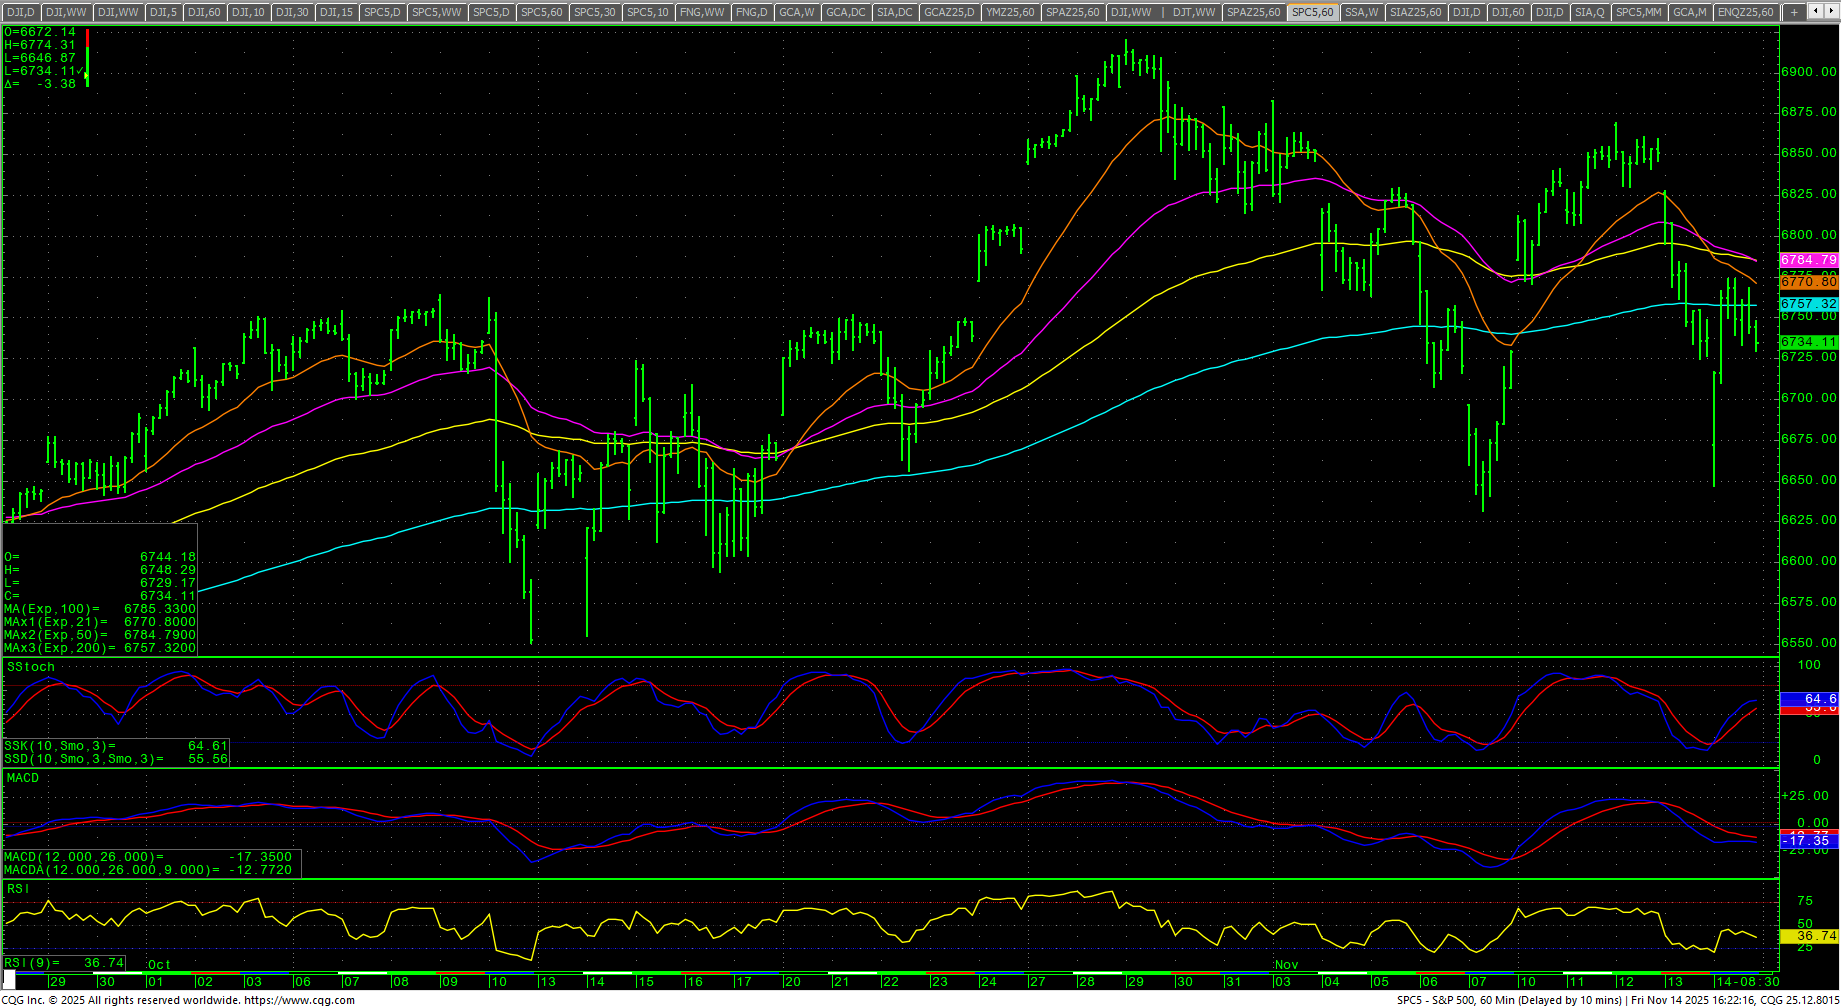 Resistance remains at 6775 and 6809/6811. A drive over 6811 should test 6848/6852 with counts back to 6880/6882. A drive over 6882 retest 6908/6920. Closes over 6920 open counts to 6944 and 6980 through 7016. A close over 7016 offers counts to 7088, 7160 and 7214. Closes over 7214 setup a drive to 7250 and 7286 while opening counts as high as 7448. Above 7488 counts to 7520 and 7592. A drive above 7592 can test 7664 with counts to 7736 and as high as 7808.
| Resistance | Support |
|
|
Charts courtesy of CQG, Inc., CNN, Koyfin, Trading View and AAII