
TECHNICAL ANALYSIS
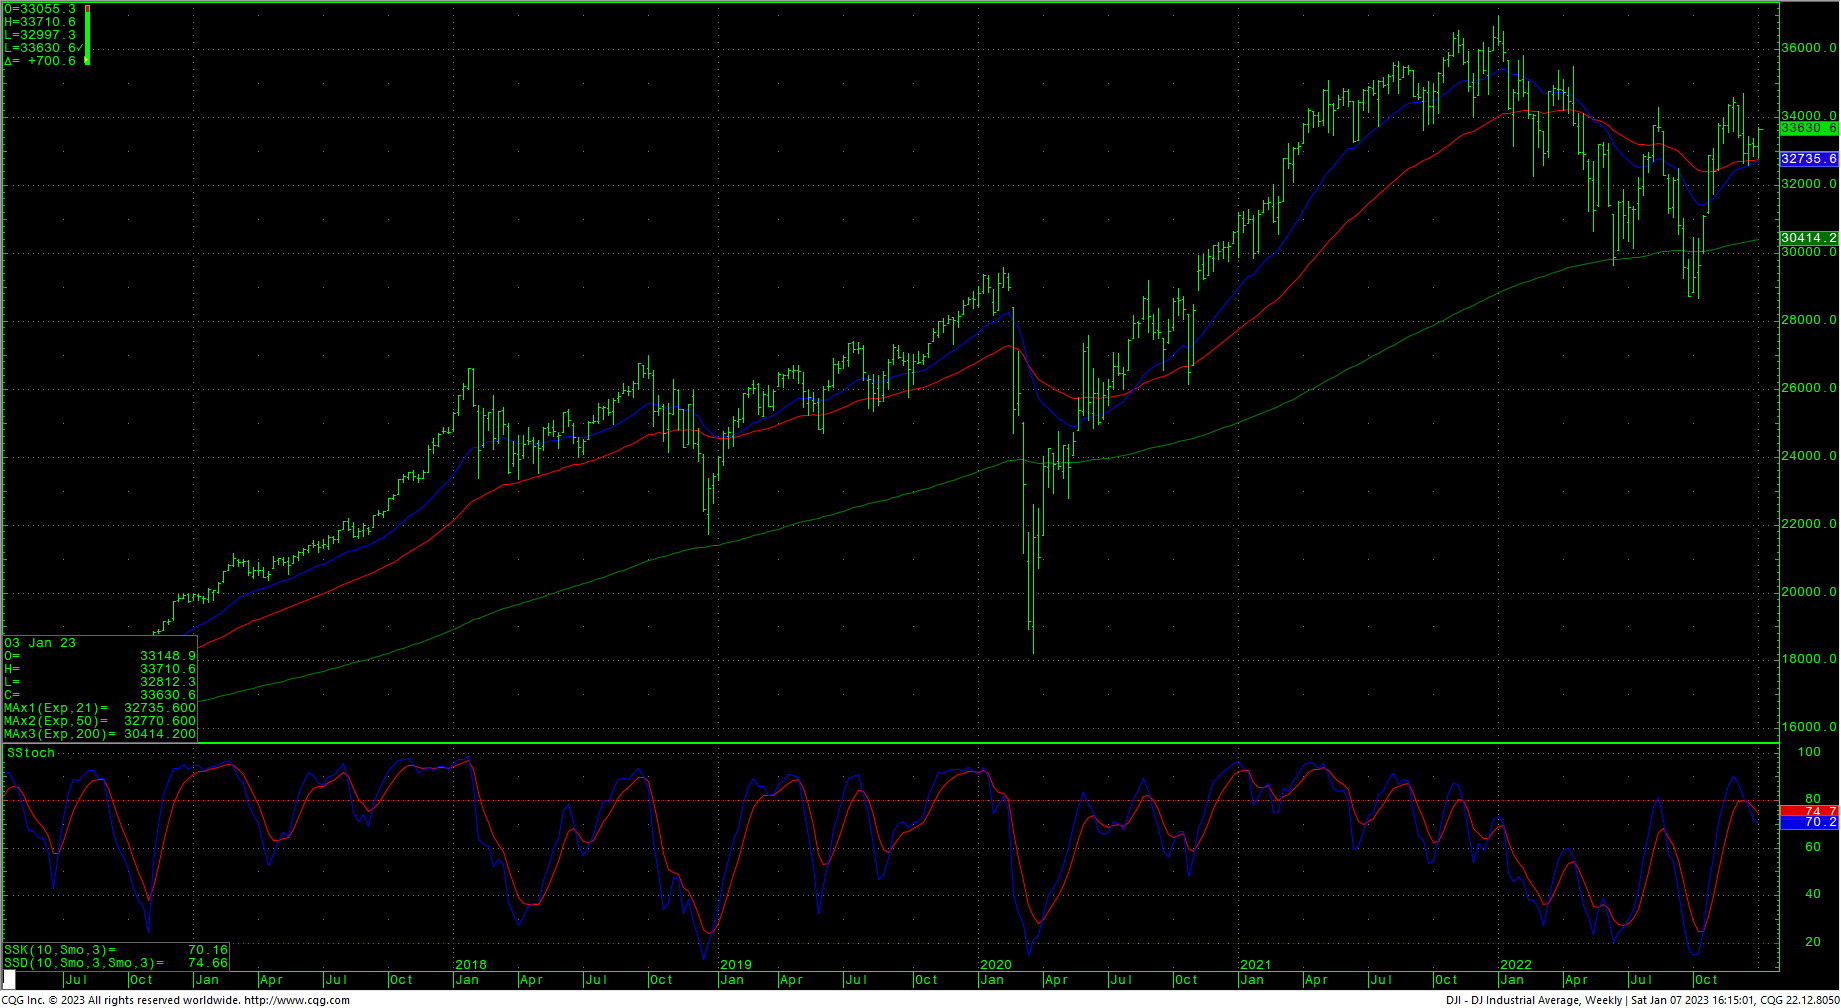
The DJIA saw a whipsaw trade last week, ending with a surge on Friday that carried the market to a four-week high and an upside breakout of the flagging pattern that had developed to the side of the recent selloff. The action took a slight edge off the fear and greed indices while leaving short-term charts slightly overbought. The 52-week High/Low moved a little higher and remains frothy…closing at -1.64%. On the weekly chart, the 21-week moving average is close to hooking above the 50-week moving average. The DJIA closed right at a 50% retracement of the recent down swing and this 33642/33650 area remains as near-term pivotal resistance.
Dow Jones Industrial Average Weekly HLC
Dow Jones Industrial Average Daily Candles
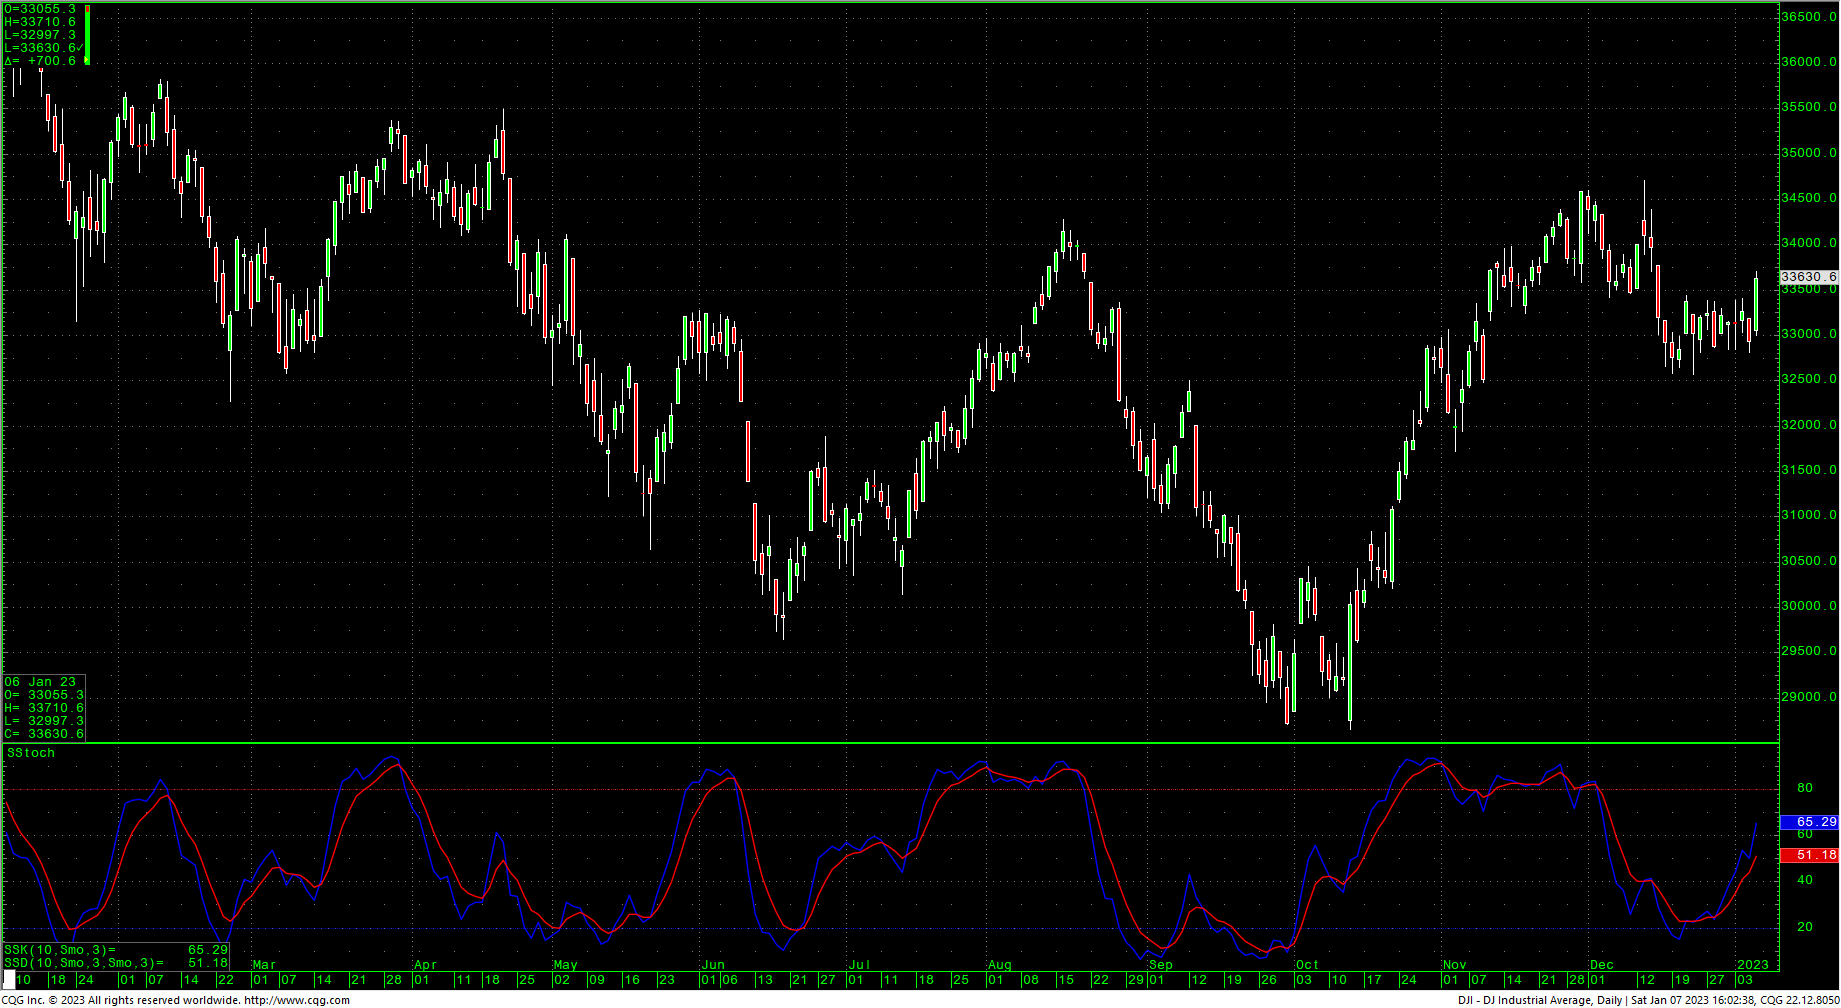
As mentioned above, resistance remains short-term key at 33642/33650. Daily closes back over 33650 are near-term friendly and suggest a drive to critical short-term resistance at 33895/33910. Note that there is an hourly gap that runs from 33773 to 33812…and 33785 represents a 62% retracement of the entire decline from the early 2022 highs. Closes over 33785 would fuel rallies and daily closes above 33910 are bullish and set up a move to 34177/34207. Above 34207 will test 34400 with a shot at the recent highs at 34712 and will open potential to a band of long-term resistance at 34879 through 34995/35000.
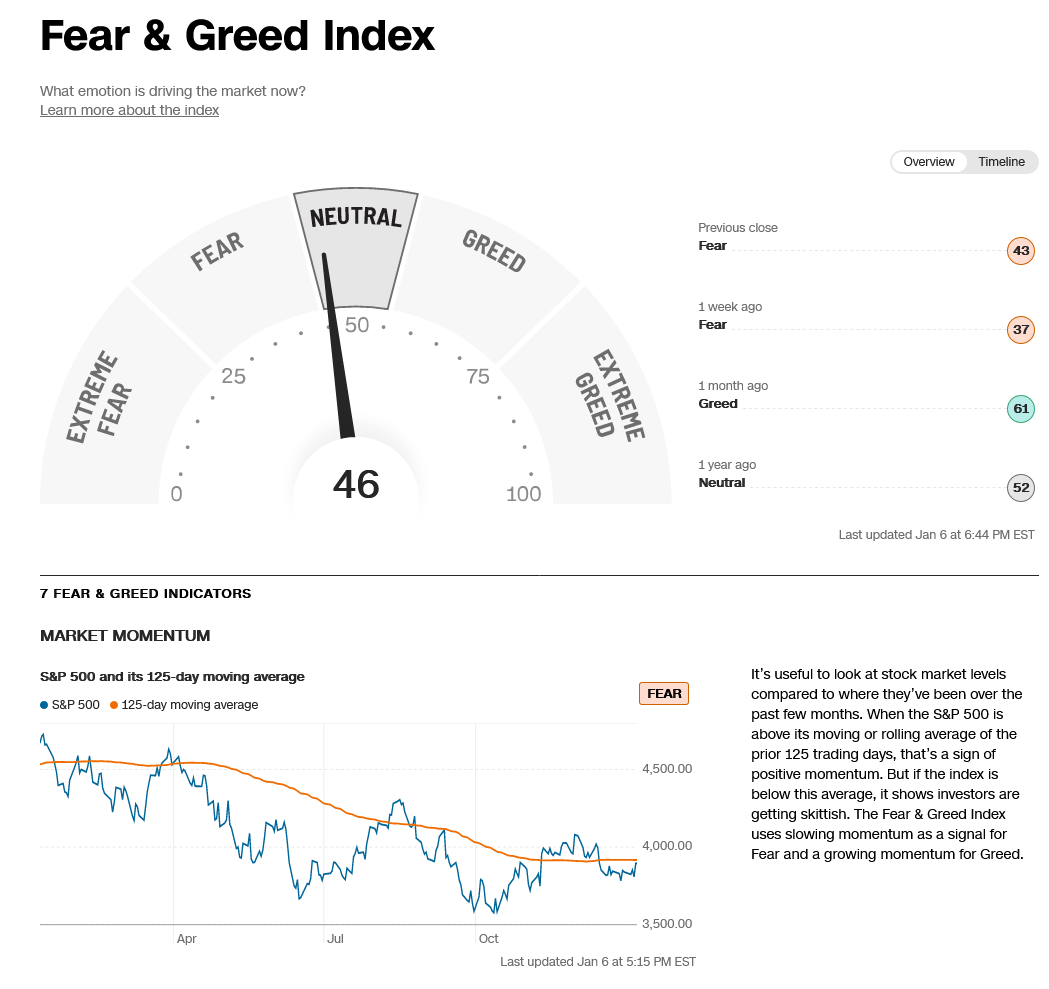
CNN Fear & Greed Index
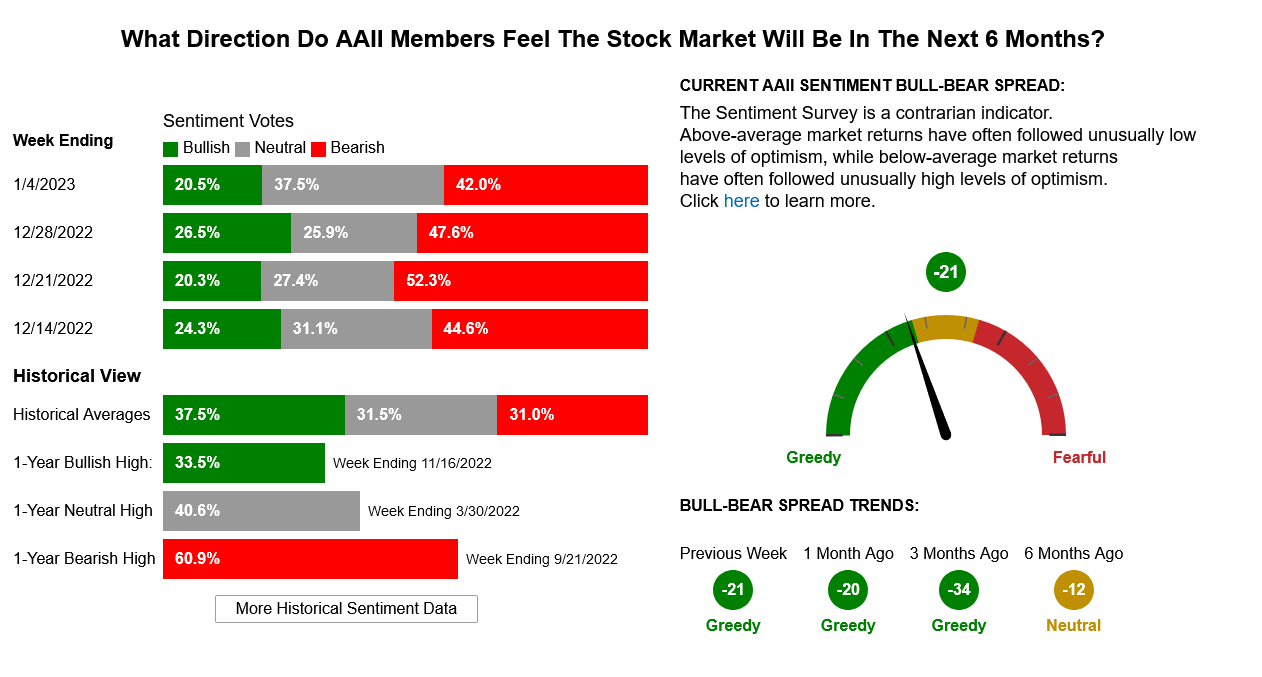
AAII Investor Sentiment Survey
Support is short-term key at 33444/33430. A breakdown under 33430 would put prices on the defensive short-term and setup 33279 with a shot at 33146. Closes under 33146 can test pivotal near-term support at 33013/33000. Below 33300 sets up another test of 32867/32850 with critical short-term support just under the recent swing lows at 32473 through 32400.. with one more minor spot at 32343. A breakdown under 32343 opens counts to key short-term support of 32170. A breakdown with closes under 32170 sets up 32099 with longer-term potential toward 31727/31686. Closes under 31686 will open counts into the 30972/30960 level with support of 31423 and 31160.
Resistance
- 33642/33650 *** ↑
- 33773/33785 *** ↑
- 33812 **
- 33895/33910 *** ↑
- 34040 **
- 34177/34207 *** ↑
- 34300 **
- 34395/34400 ***↑
- 34589 **
- 34700/34712 *** ↑
- 34879 **
- 34995/35000 *** ↑
- 35190 **
- 35360 **
- 35493 *** ↑
Support
- 33444/33430 ** ↓
- 33330 **
- 33279 ***
- 33146 *** ↓
- 33013/33000 *** ↓
- 32967 **
- 32867/32850 *** ↓
- 32800 *** ↓
- 32654 **
- 32573 *** ↓
- 32473/32400 *** ↓
- 32343 **
- 32324 *** ↓
S&P 500 Cash Index
The S&P index also moved into a four-week high last week with a rally from oversold daily conditions and a near-term breakout of the flag pattern on the daily. The cash reclaimed the 21-day and 50-day moving averages (which are negative sitting at 3871.5 and 3885 respectively). The close is short-term friendly and leaves a minor pivot point just above the Friday close at Friday’s high of 3906. A further drive above the 3906 level should take the index to 3932 with potential to 3972/4000. Closes over 4000 are near-term bullish and suggest 4048 with potential toward 4100 and possibly 4155. A breakout over the 4155 level gives counts to a gap area at 4203 to 4218 and longer-term counts to critical resistance of 4311/4315.
S&P 500 Index Daily HLC
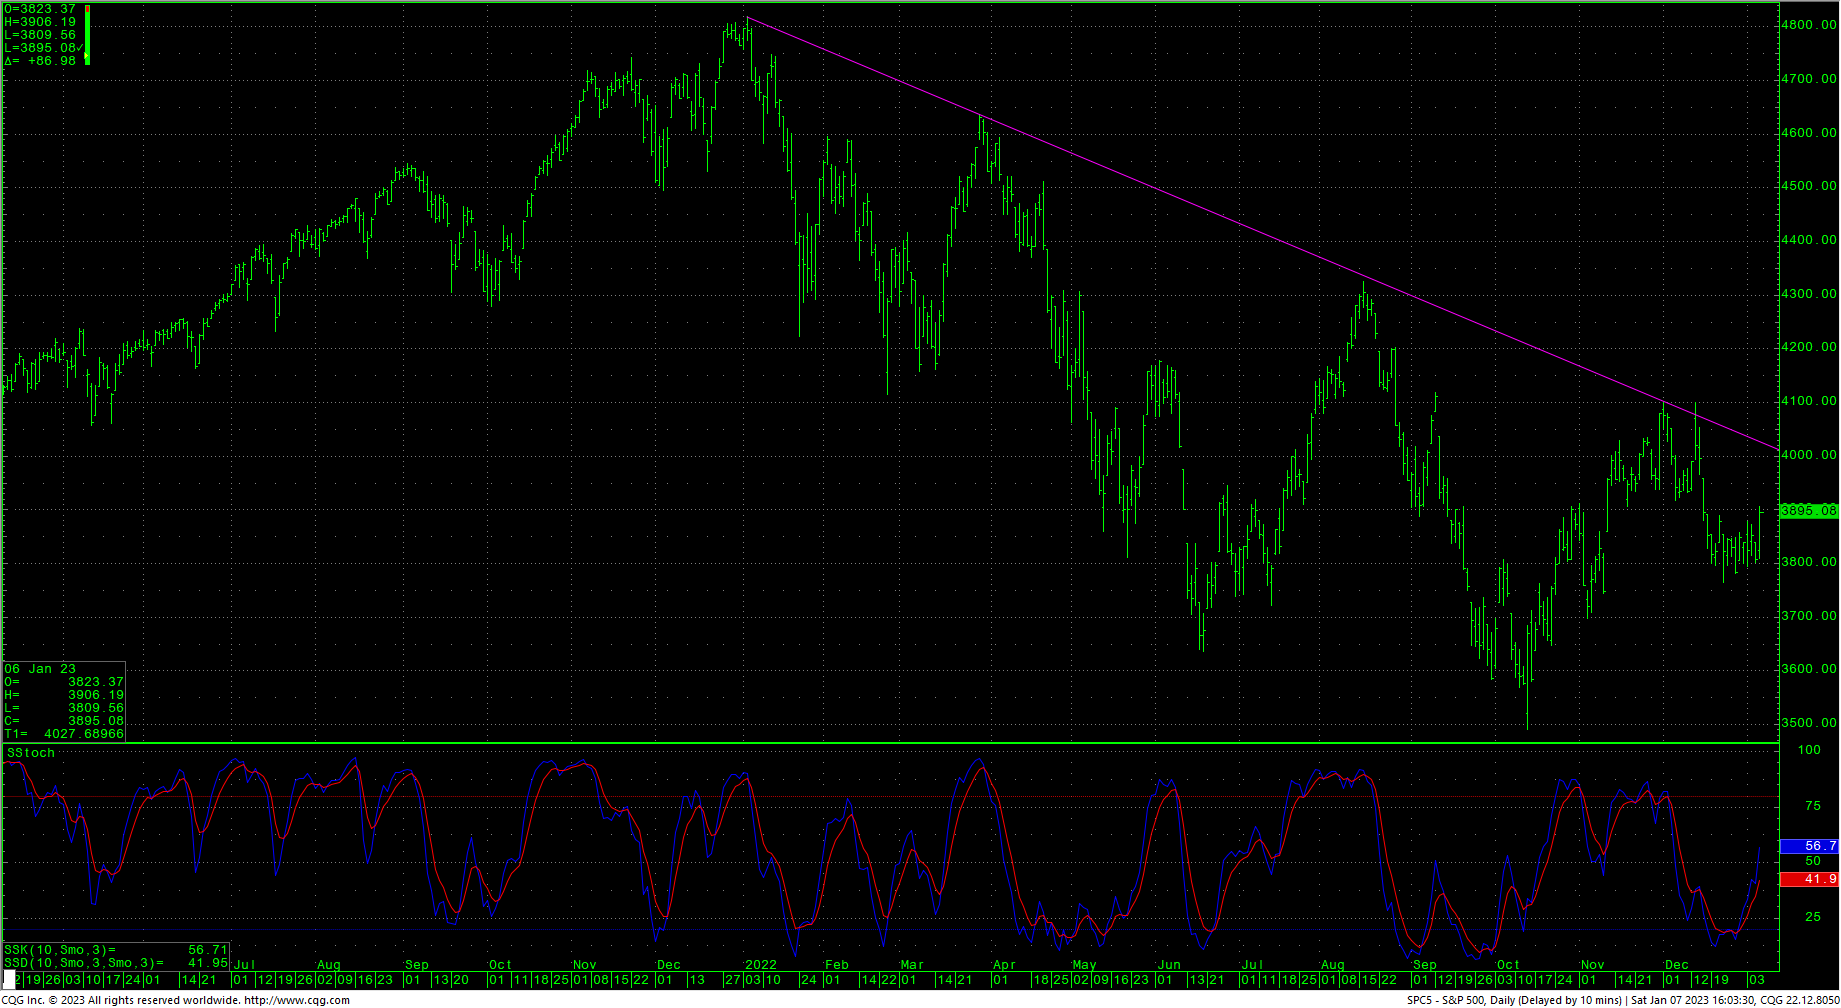
The market ended in overbought short-term conditions on Friday and support is at 3872. Closes back under 3872 puts the market on defense and sets up 3852 with potential to 3835. Closes under 3835 minimally should test pivotal short-term support of 3818/3815. Daily closes under 3815 suggest 3799/3797 with potential to 3764. Support is critical against the 3724/3720 area. Closes under 3720 open counts to 3643/3635. Under 3635 is bearish and signals a test of the lows at 3491.
Resistance
- 3906 *** ↑
- 3932 ***
- 3972 ***
- 4000 *** ↑
- 4048 ***
- 4100 ***
- 4155 *** ↑
- 4203/4218 ***
- 4311/4315 *** ↑
Support
- 3872 **
- 3852 ***
- 3837/3835 *** ↓
- 3818/3815 *** ↓
- 3799/3797 *** ↓
- 3764 ***
- 3724/3720 *** ↓
- 3643/3635 *** ↓
- 3584 **
- 3565 **
- 3495/3491 *** ↓
Spot Gold Futures
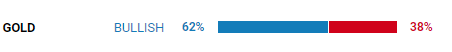
The Gold market has moved into six-month highs in extremely manic trade. Last week the daily chart signaled a Golden Cross as the 50-day moving average moved above the 200-day moving average. Near-term futures high on Friday tested the weekly swing at 1875.60 set in June last year. The daily is stretching into overbought region, but short-term patterns seem to suggest that a test of monthly resistance of 1900/1903. Closes over 1903 are bullish and suggest a move to 1921.3 with potential to 1962.20/1968.80. That zone represents the last area of long-term resistance and closes over 1968.80 suggest 1997.10 while opening counts to the record highs of 2708.80. Sentiment is at an exact Fibonacci ratio.
Gold Daily IG Sentiment Index
Spot Gold Daily HLC
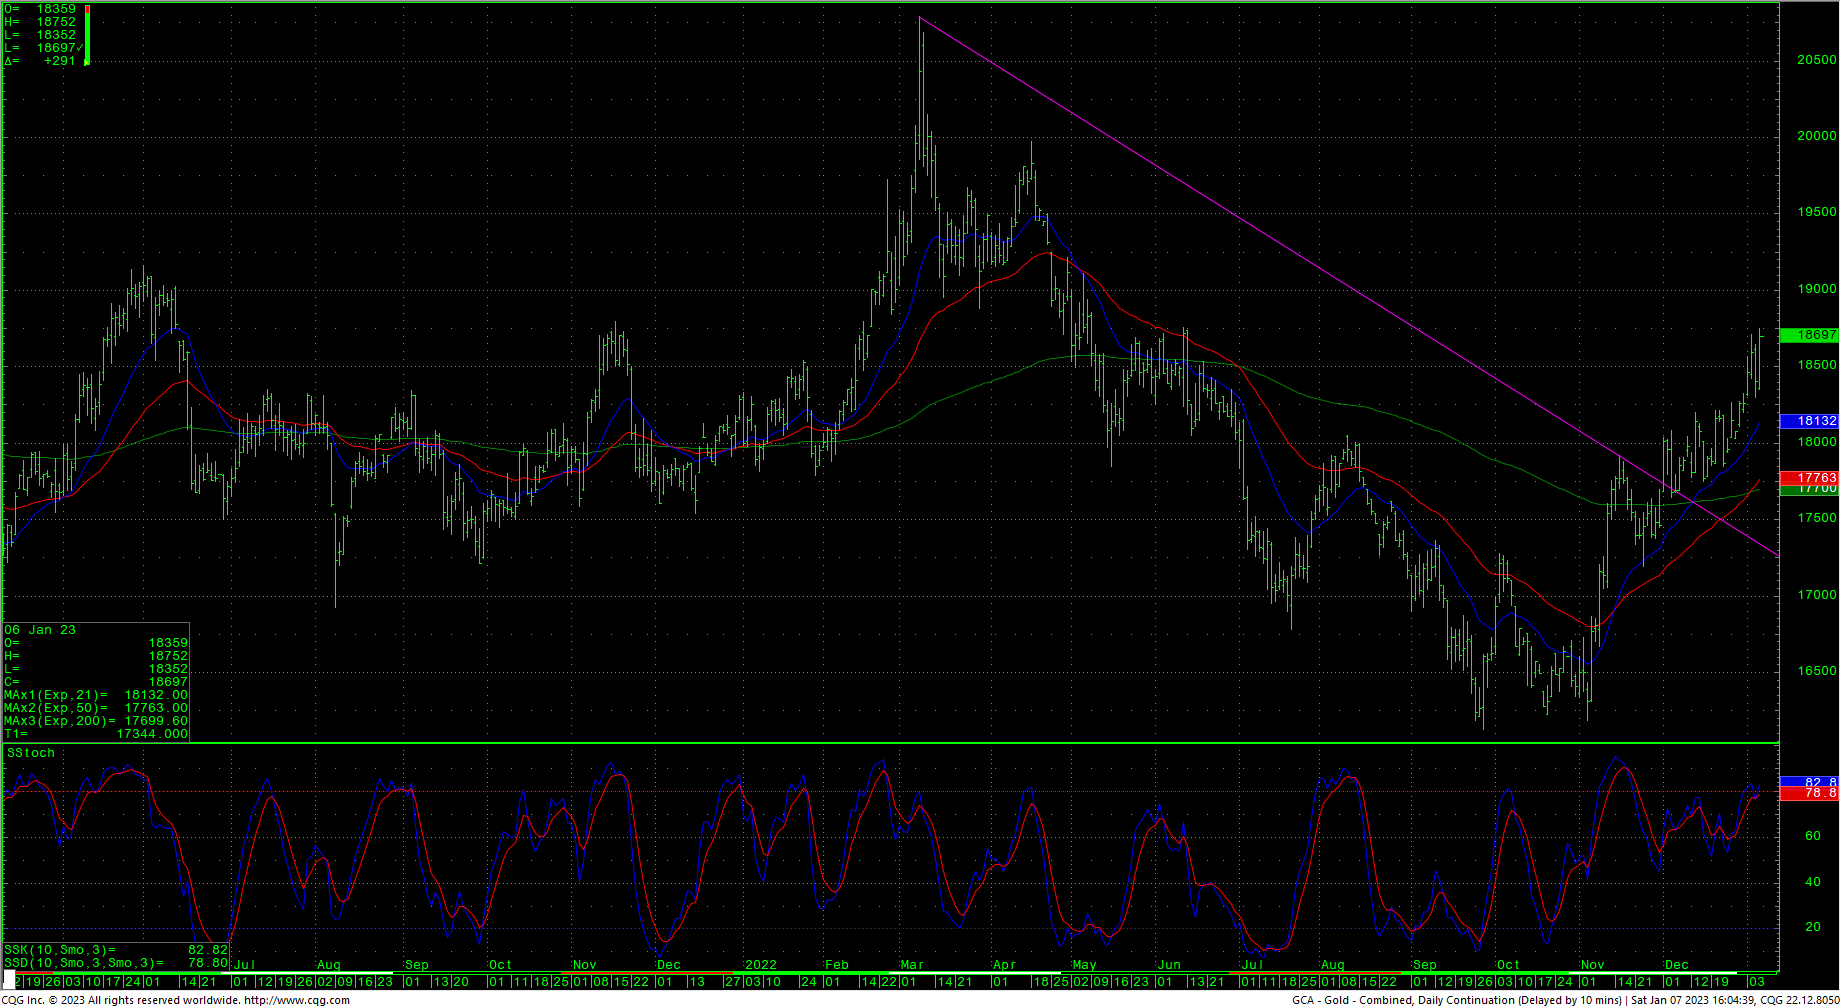
The hourly is overbought and support near-term is at 1864.50 and 1857.80. A breakdown under 1857.80 puts the near-term picture back into the recent ‘maniacal’ trade and should see 1852.50 with counts to 1847.20/1846.00. Daily closes under 1846.00 suggest 1829.90/1828.60 with a band of support at 1841.20/1840.50. Closes under 1828.60 set up a move to 1817.60/1815.50 with support of 1820.80. Support is key at 1804.20 and pivotal/critical short-term t 1787.50/1786.00.
Support
- 1864.50 **
- 1857.80 *** ↓
- 1852.50 ***
- 1847.20/1846.00 *** ↓
- 1841.20/1840.50 **
- 1829.90/1828.60 *** ↓
- 1820.80 **
- 1817.60/1815.50 *** ↓
- 1804.20 *** ↓
- 1787.50/1786.00 *** ↓
Resistance
- 1875.60 ** ↑
- 1900.00/1903.00 *** ↑
- 1921.30 ***
- 1962.20/1968.80 *** ↑
- 1997.10 *** ↑