
TECHNICAL ANALYSIS (by Intraday Dynamics)
This weeks post is a FREEMIUM POST
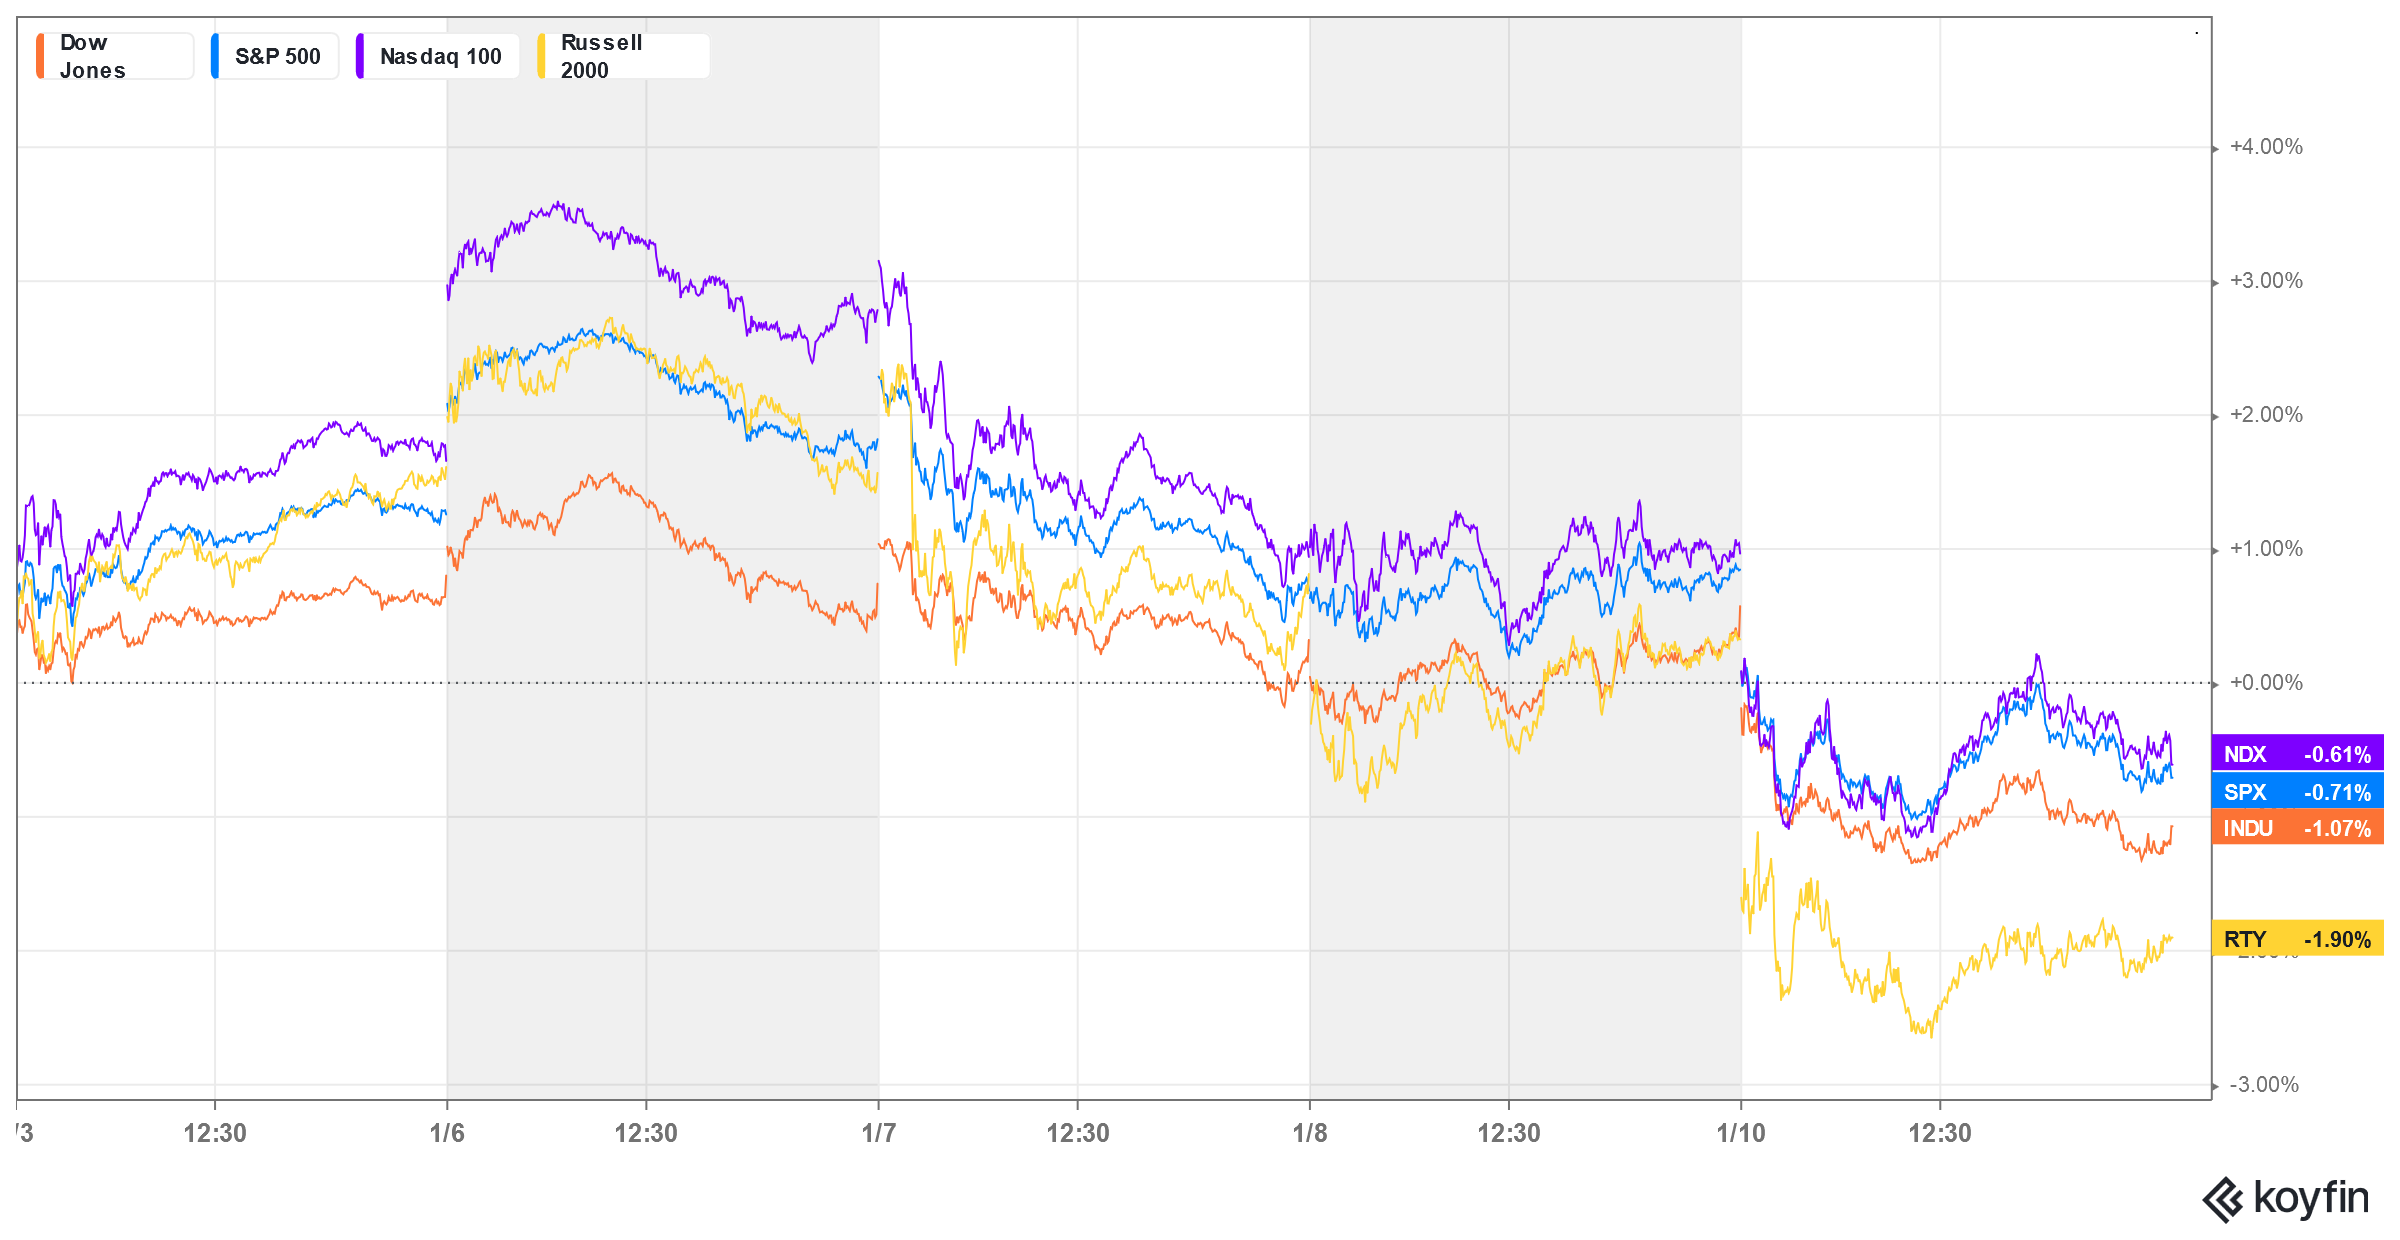
Major Indices Week of January 10, 2025
 Dow Jones Industrial Average Daily Candles
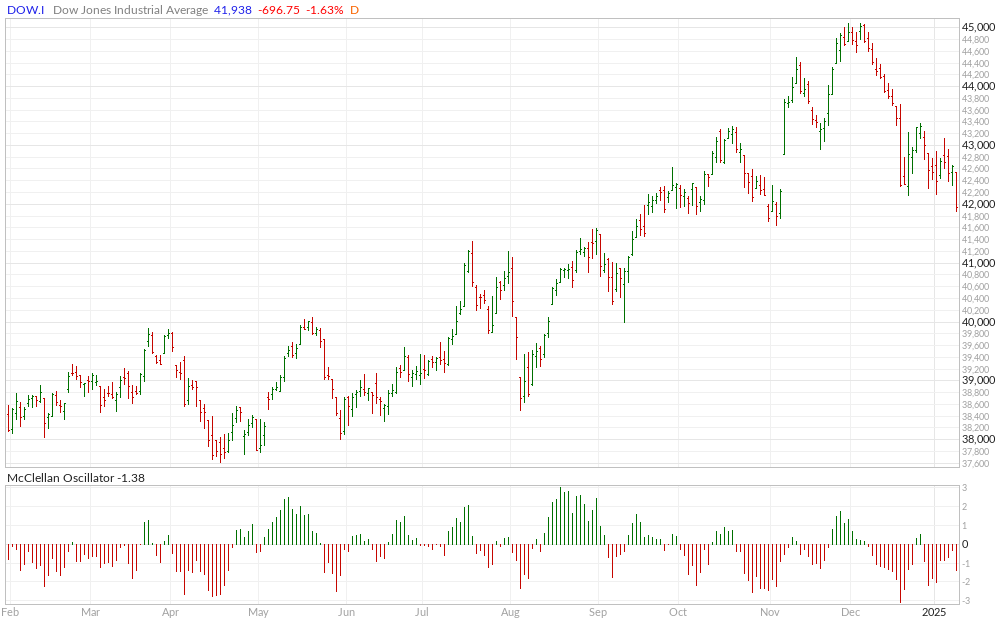
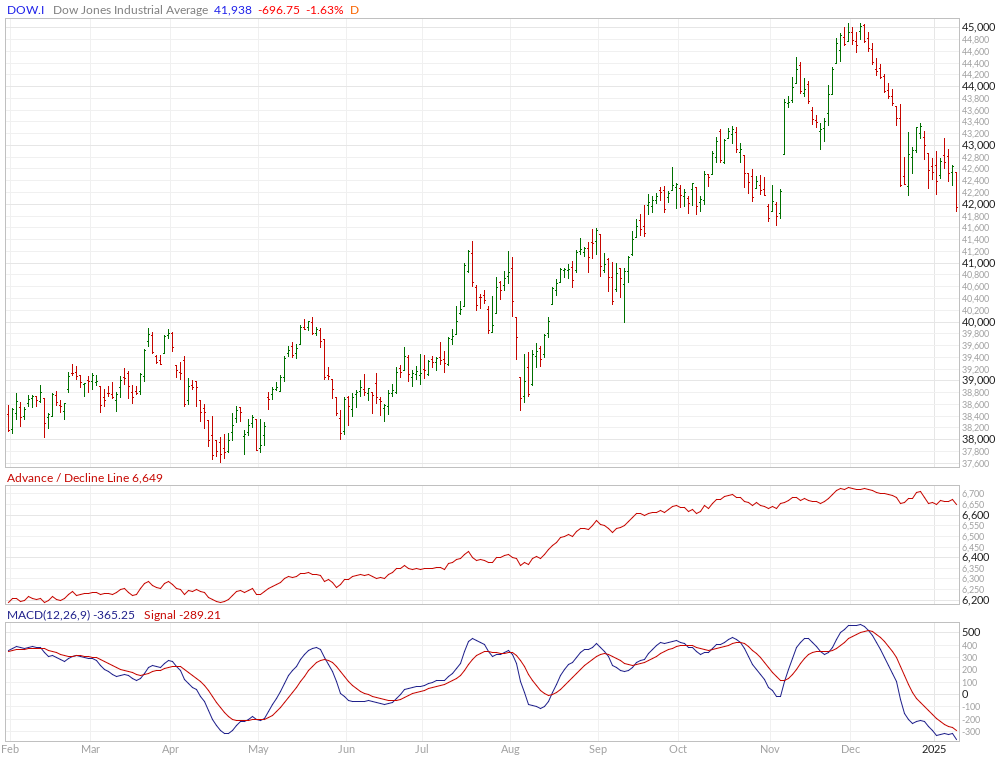
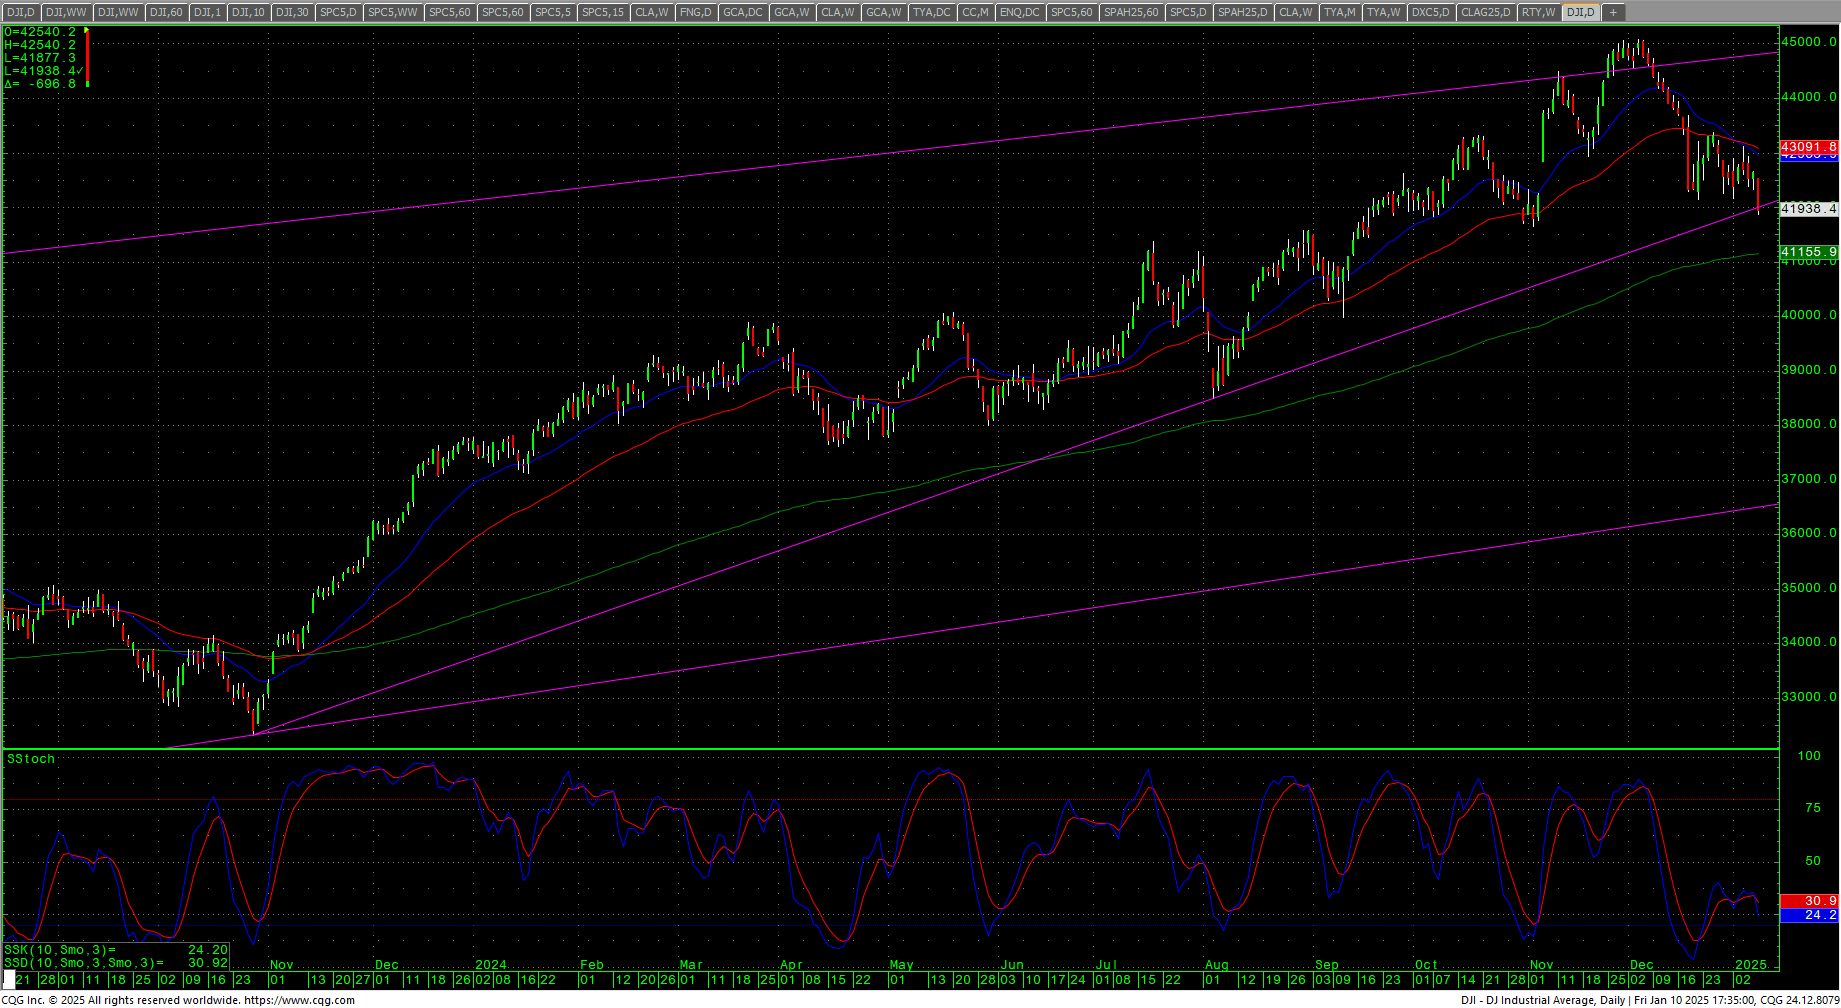 Stocks closed out the week sharply lower with most indices staging outside week down patterns and the Dow taking out a major trendline on the daily chart and closing under that trendline. The action is giving credence to the idea that the impulse move of 18 December 2024 is indeed signaling a trend change. This is especially true now that the Dow closed under that level. The daily is hooking lower again and the close on Friday has now removed the entire post-election rally off the charts. Sentiment leans toward fear and extreme fear.
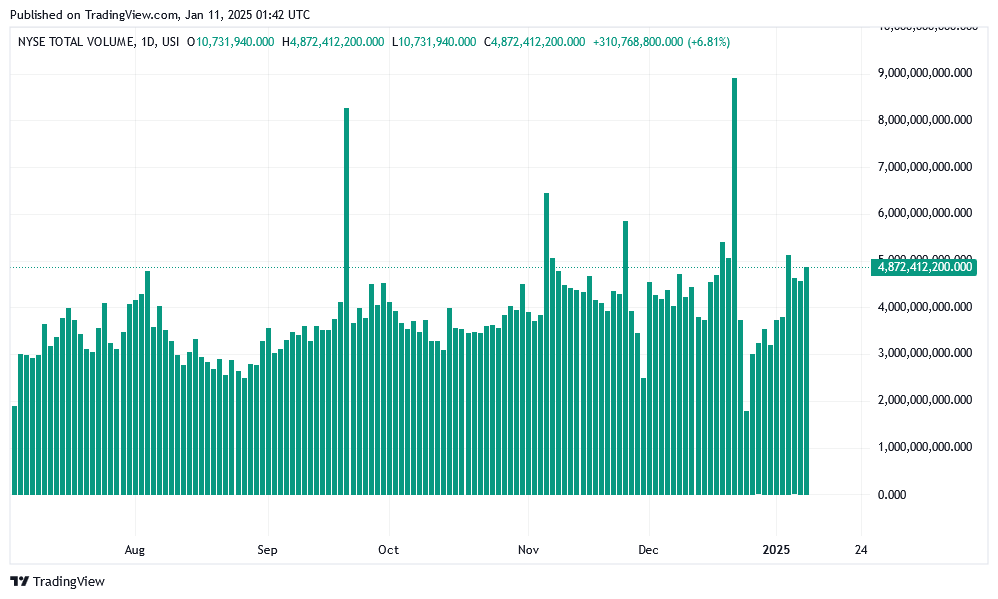
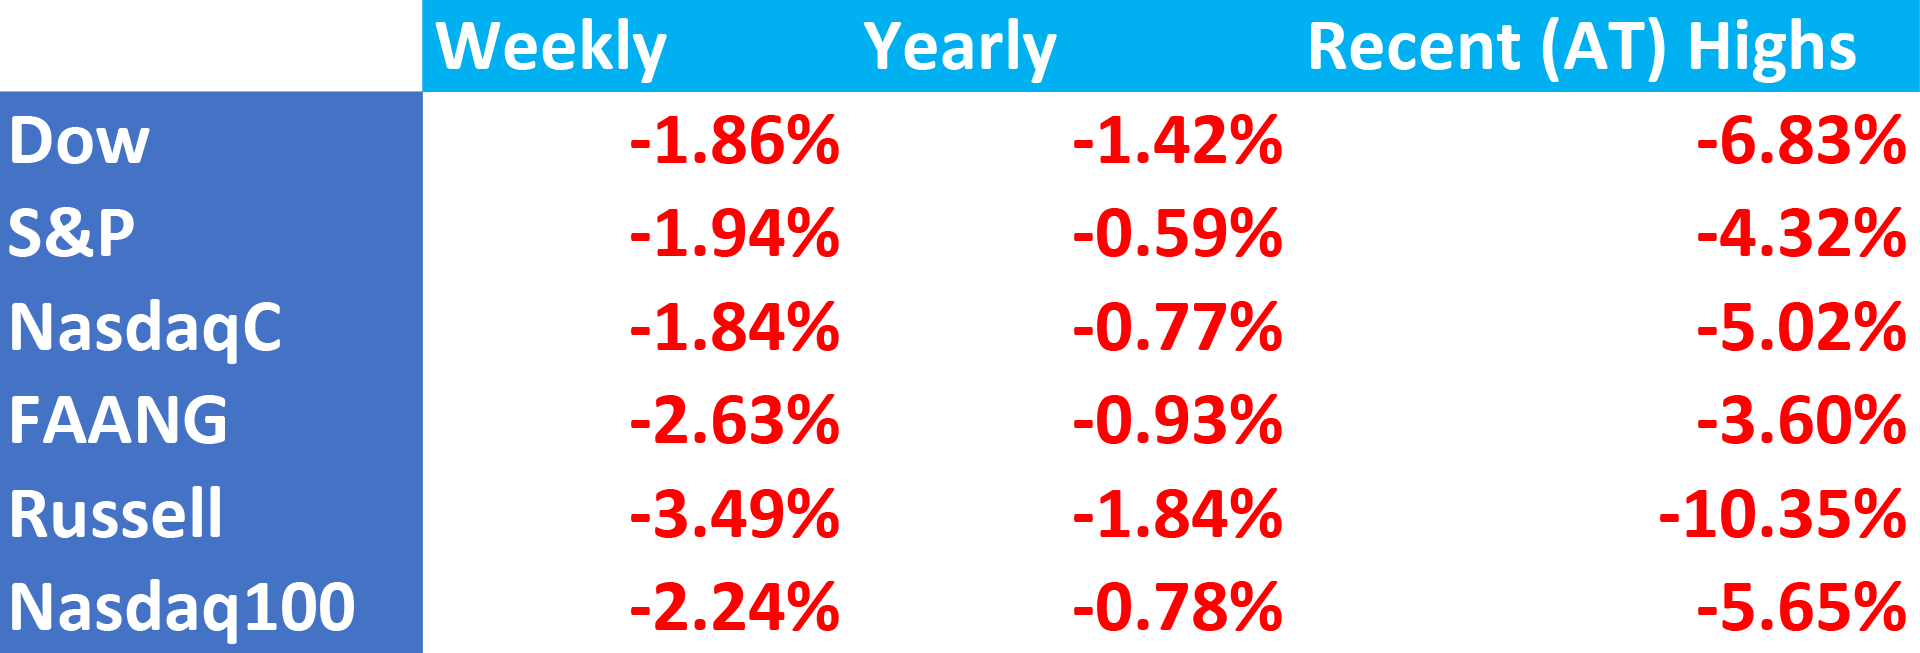
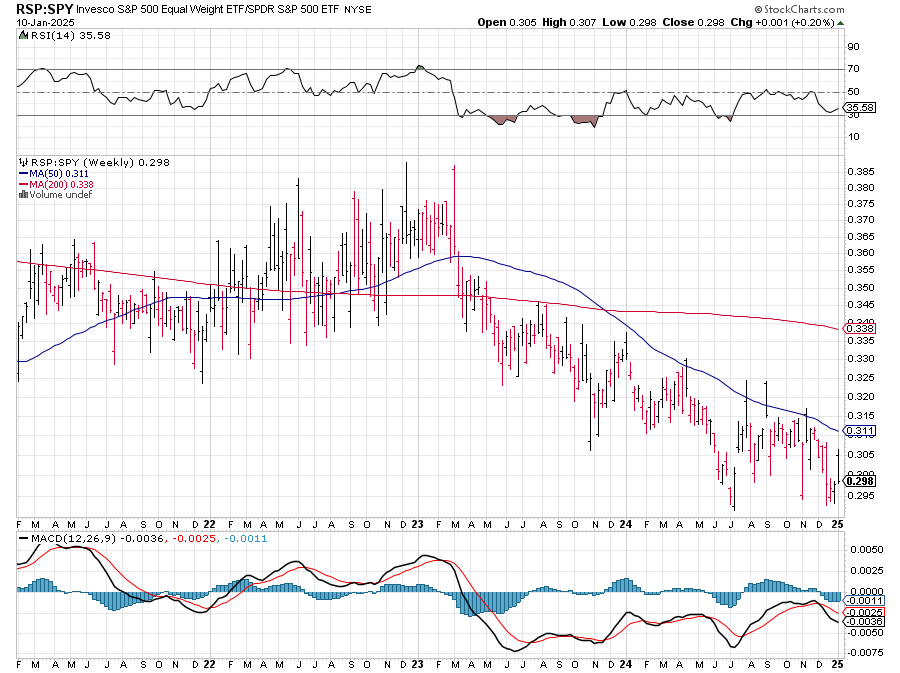
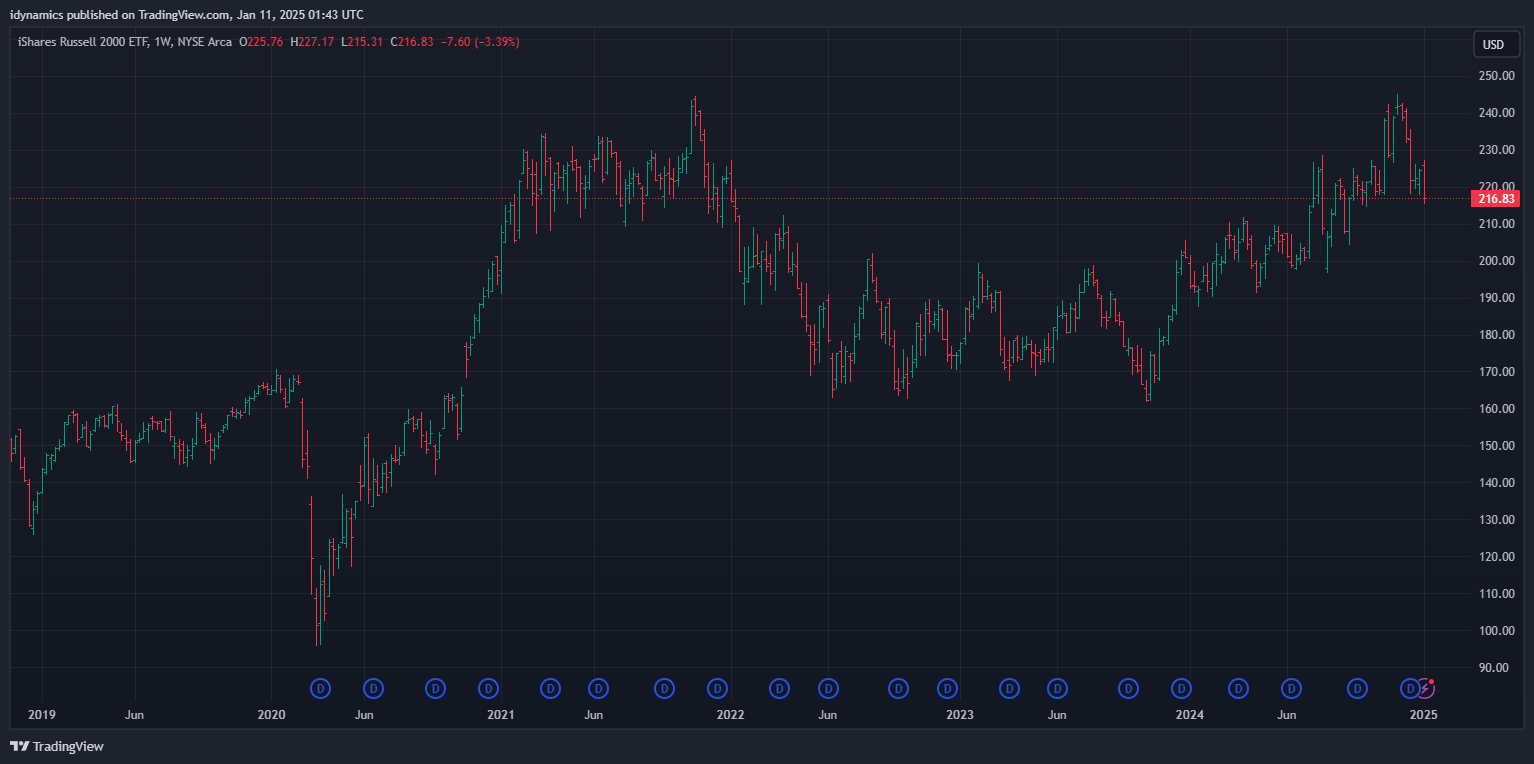
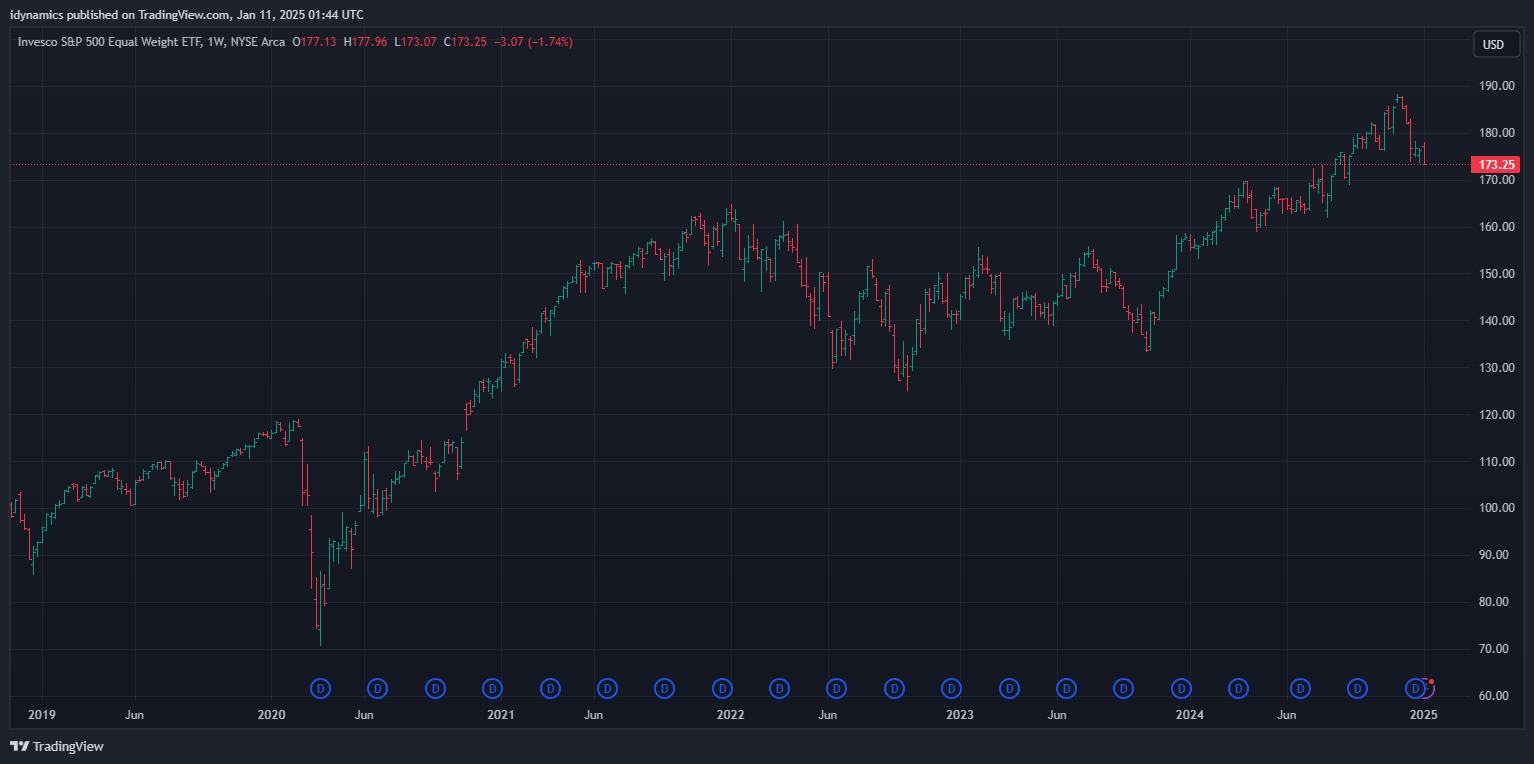
All the indexes closed lower and were led lower by the secondary markets and tech. The RSP:SPY has a positive week but ended at the low of the weekly range. The IWM and RSP both staged reversal weeks in outside week ranges. Volume is modest and slightly elevated. All of the major indexes are now lower for 2025. The Dow is -6.83% from its peak close with the S&P 500 off -4.32%.
NYSE Daily Volume
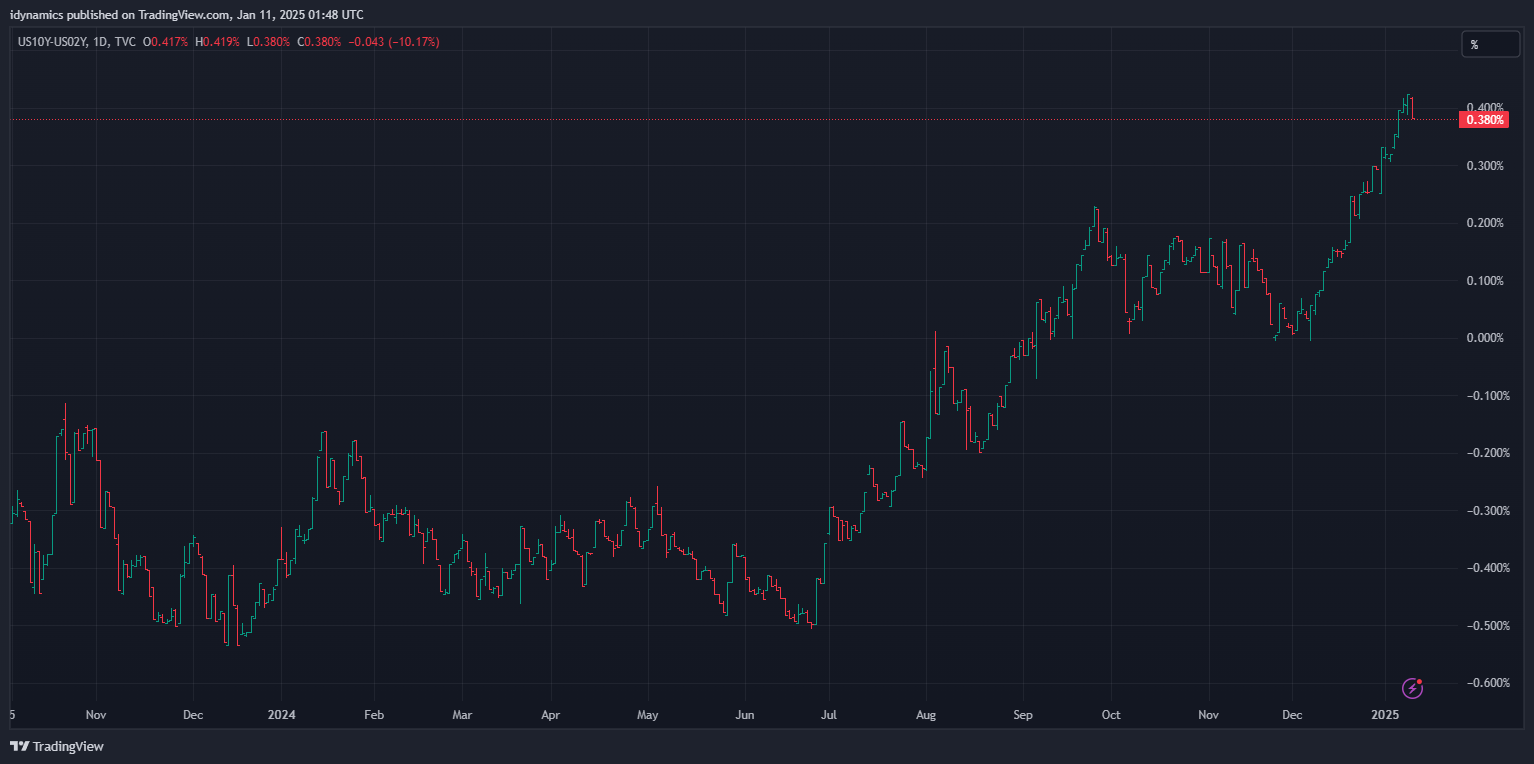
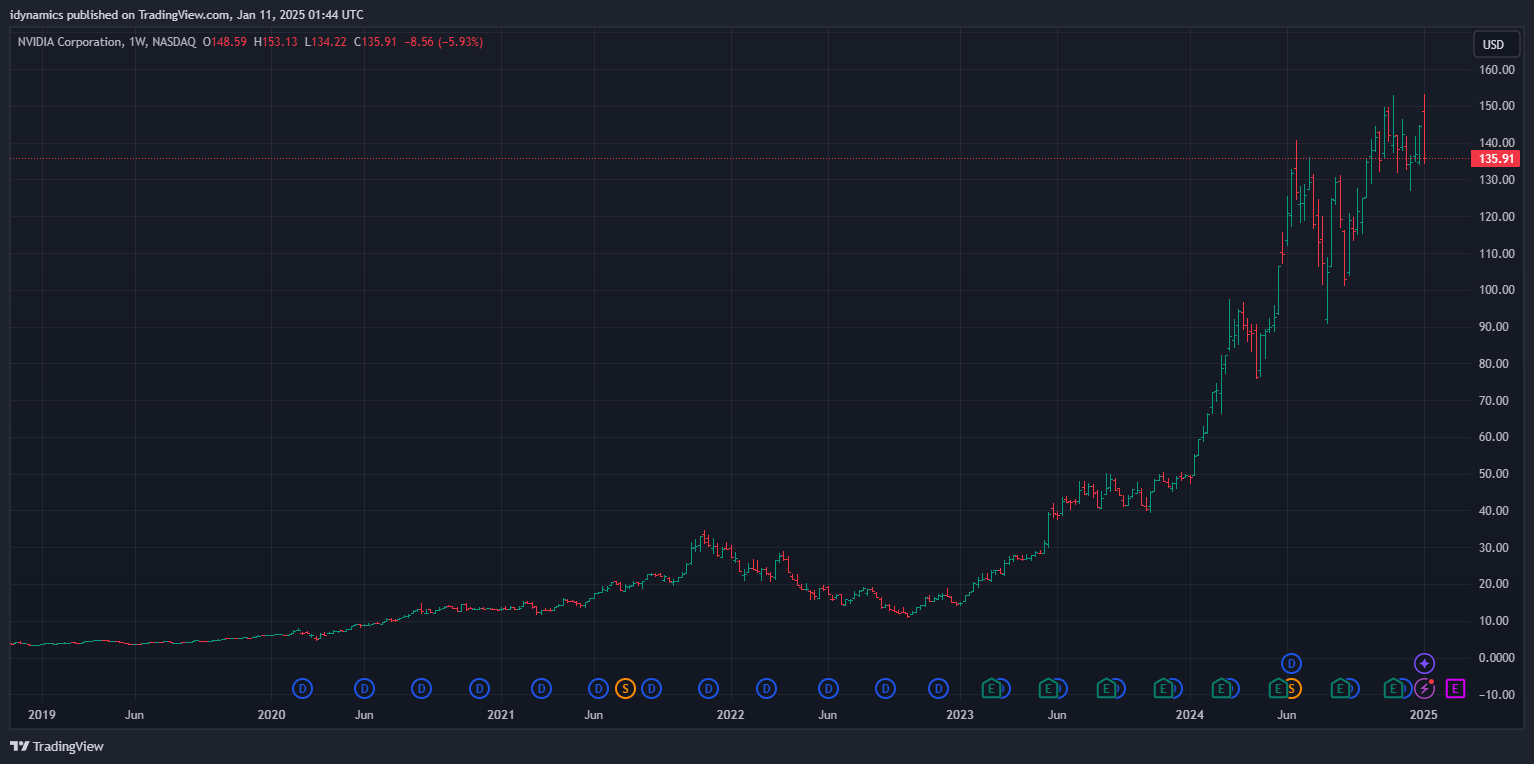
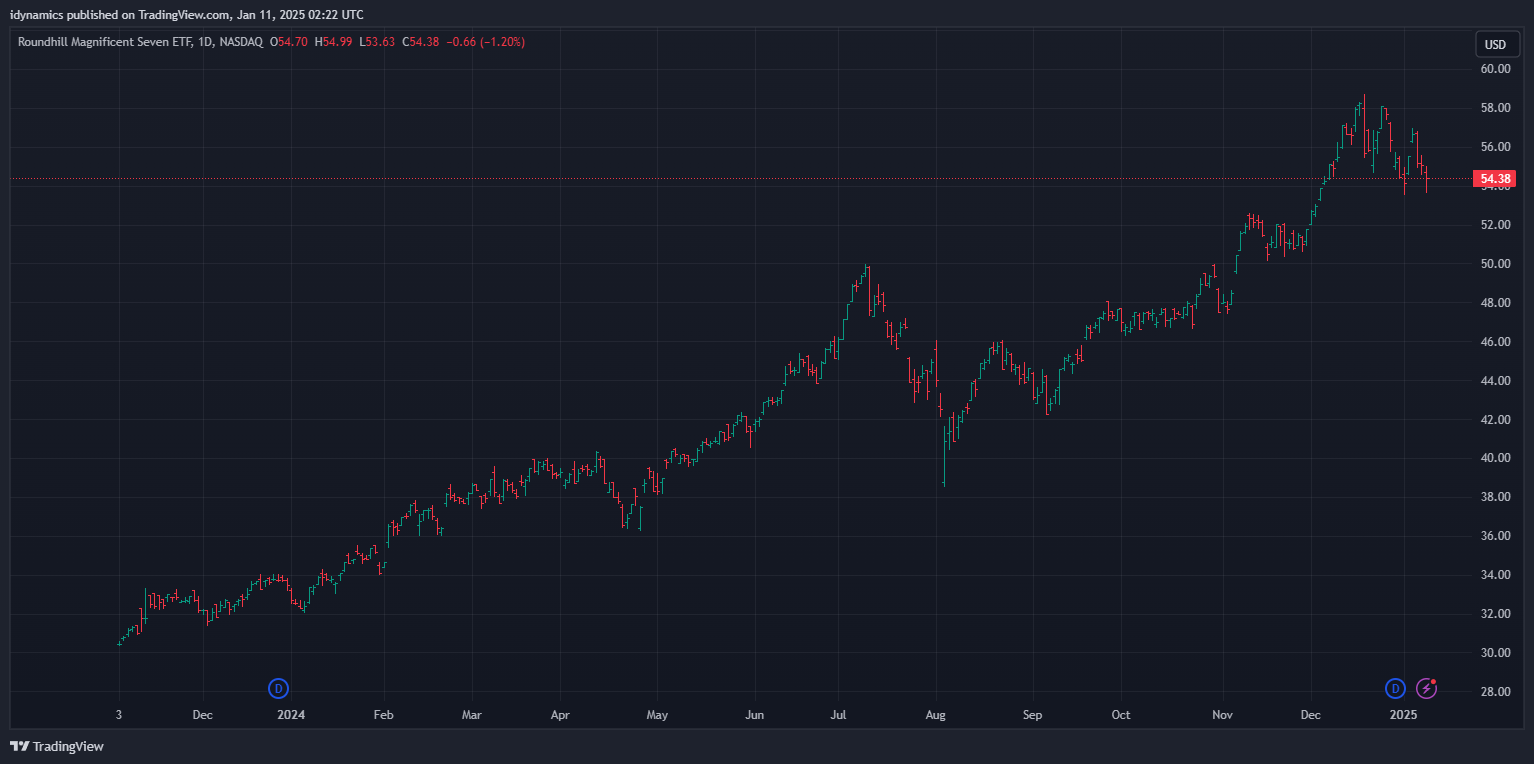
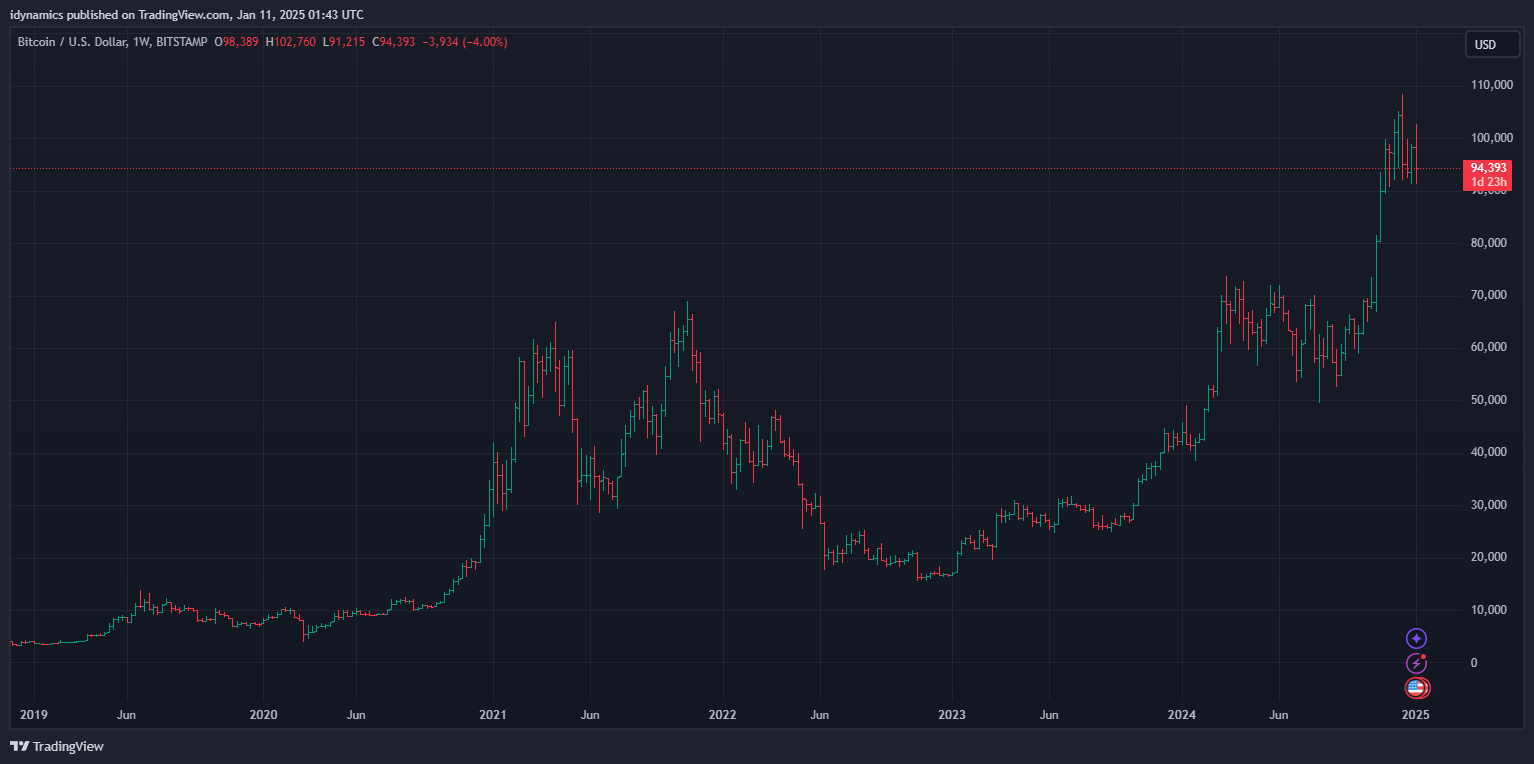
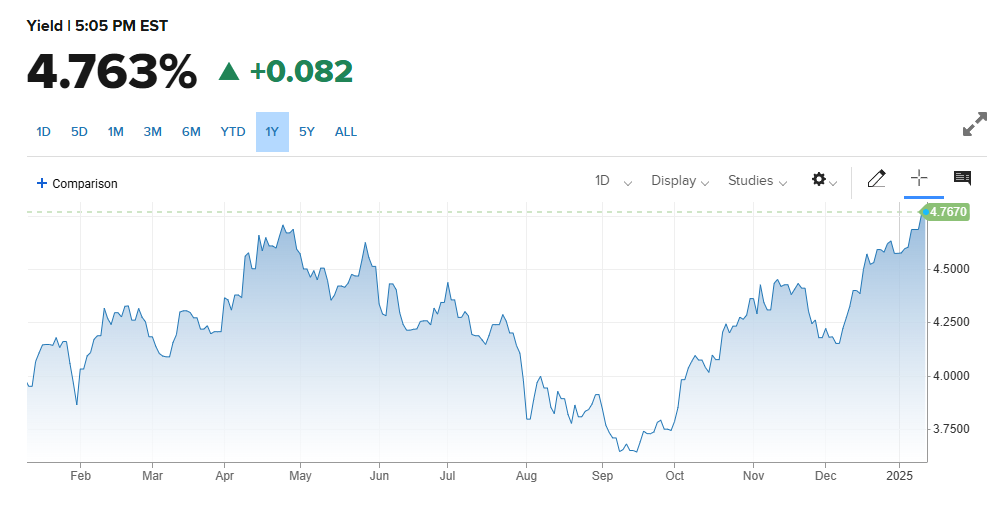
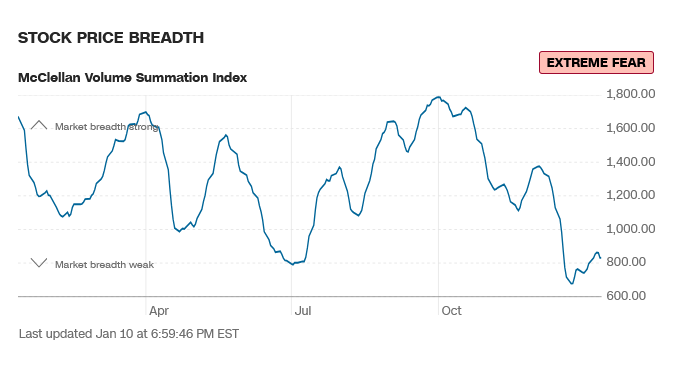
 NVDA traded to a double top and then swooned to close on the bottom of the week’s range. Key support remains at 126.86 and closes under this area would signal targets in the -100 area (the summer lows. The MAG7 is building a wedge off the spike top set on 18 December 2024. Bitcoin tested critical support midweek and found a bounce and the 91000/90700 level remains critical. A breakdown under 90700 with closes will setup the sub 74000 level. McClellan Oscillators confirm the recent weakness in the Dow and the A/D line is sitting at a one-year low. The Yield Curve moved to the highest weekly close since turning positive, ending the week at +0.380% while the 10YR yield closed above 4.75%. Truflation moved back up to 2.96%.
10YR-2YR Yield Curve Daily
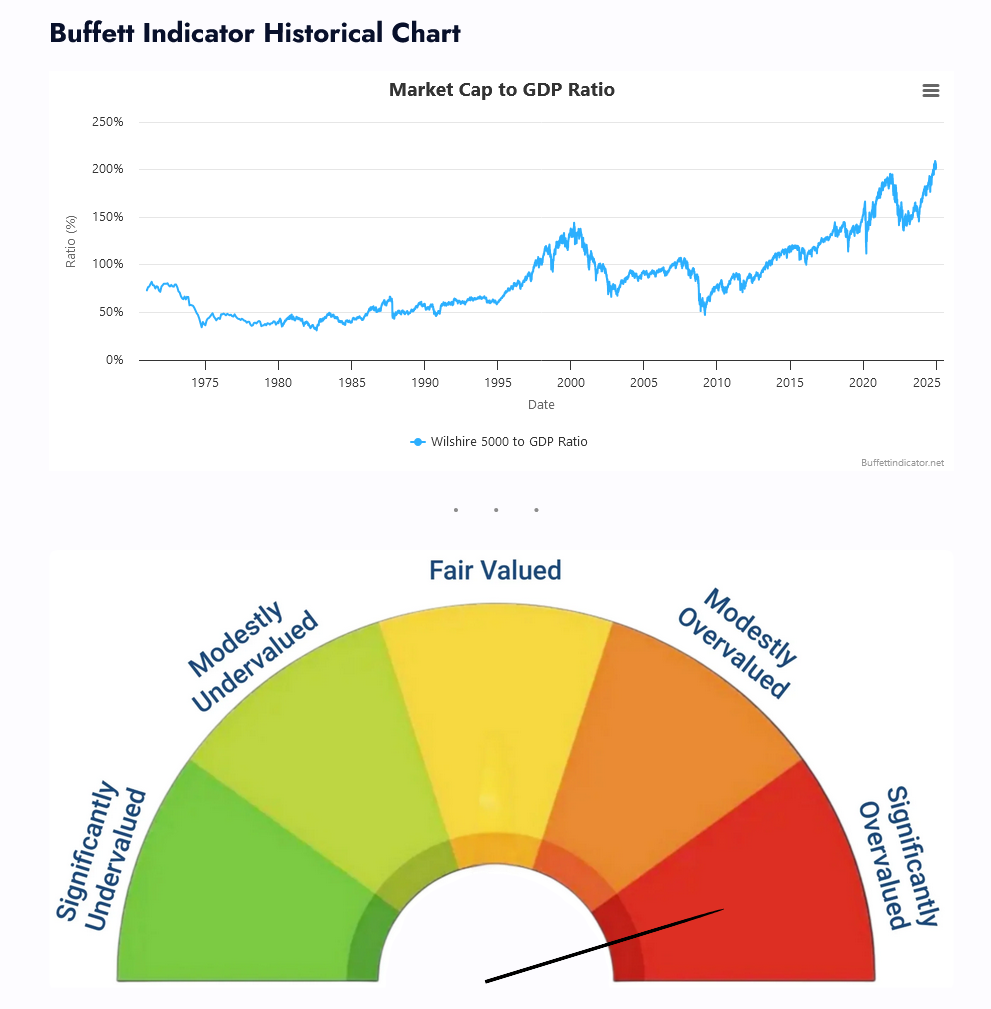
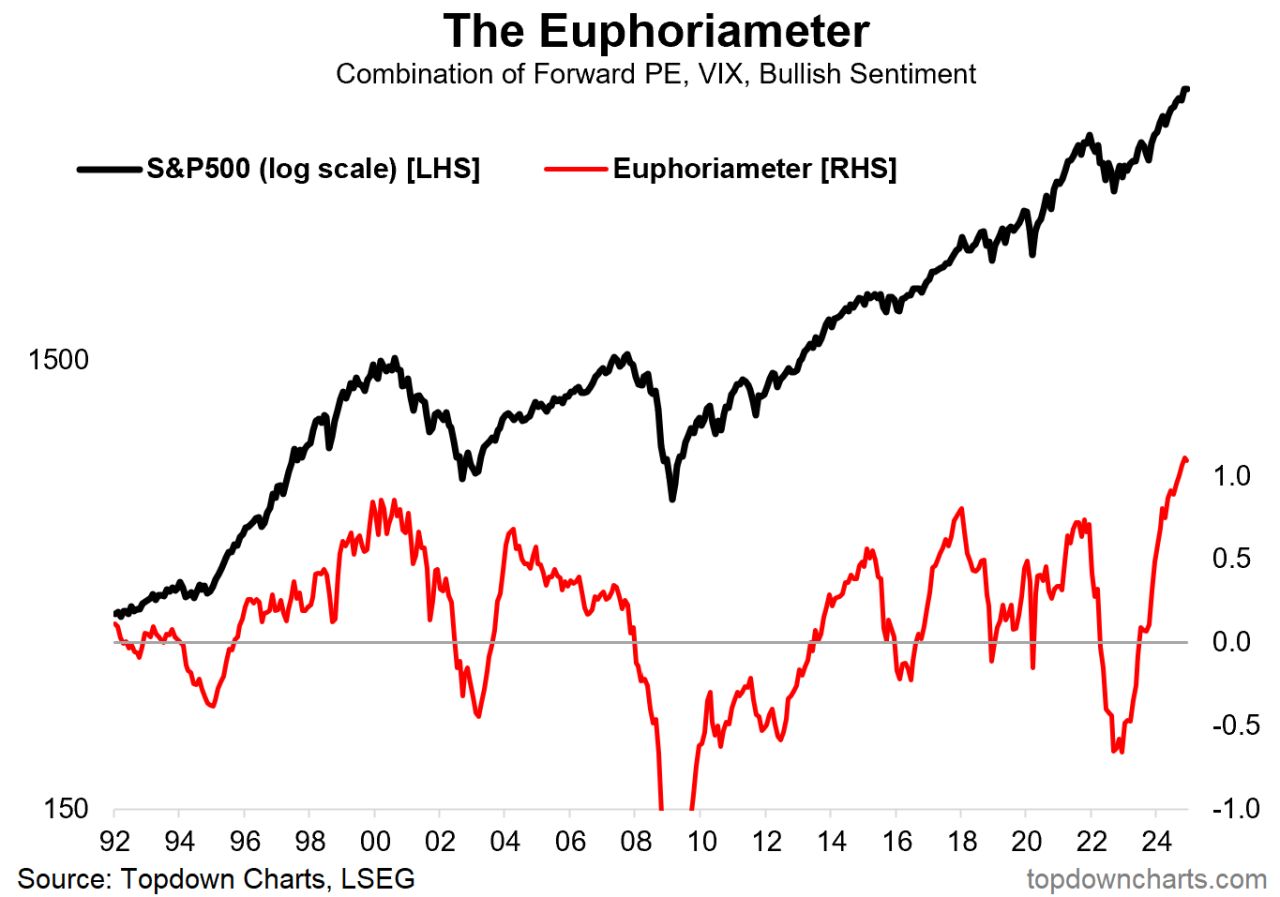
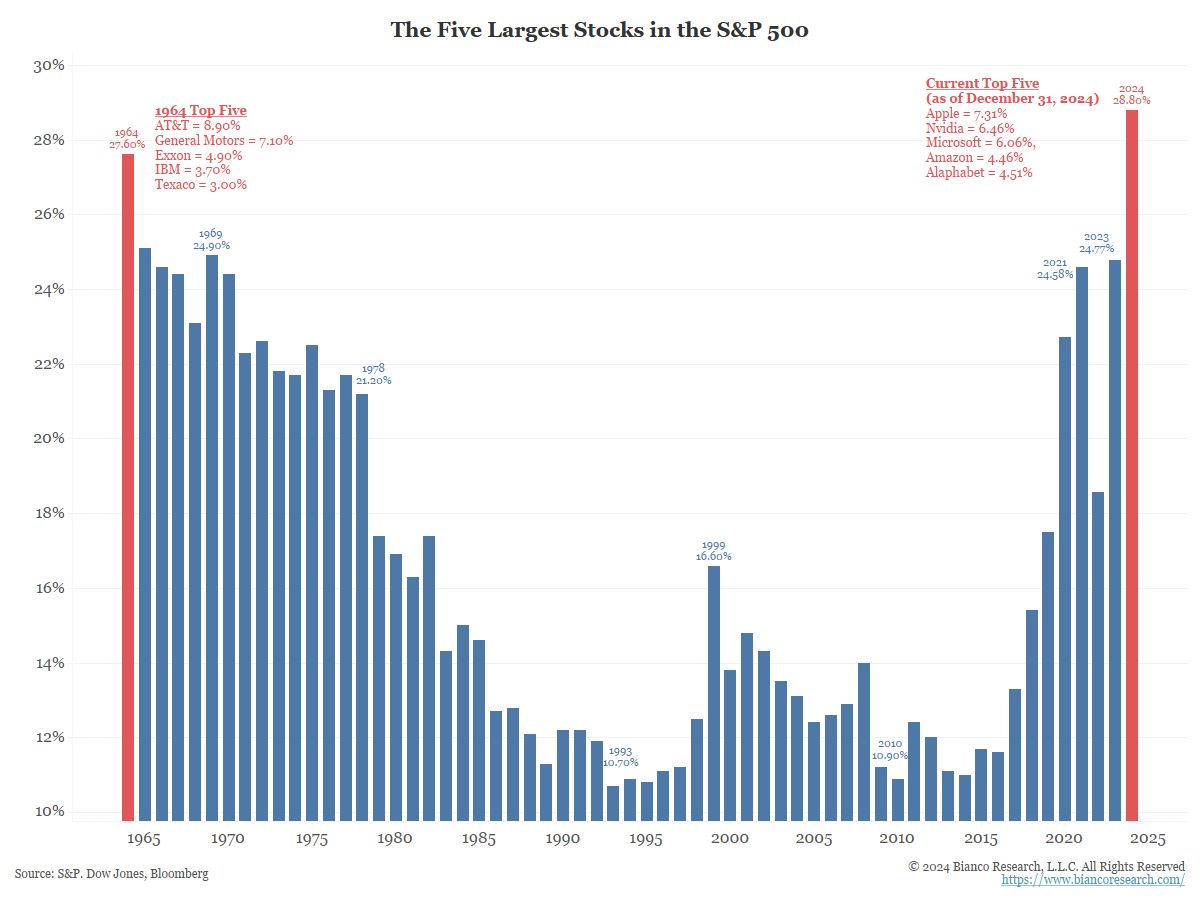
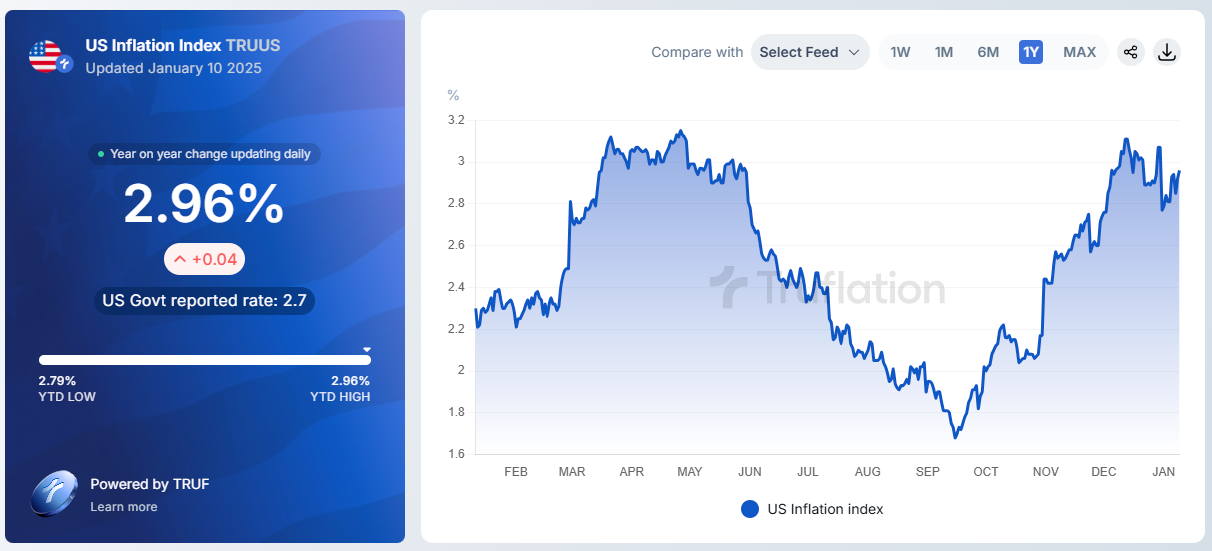 The “Buffet Indicator” has reached a record high of 205% of GDP, which could explain why Berkshire is holding record amounts of cash. Topdown Charts has indicated that the Euphoriameter has also set a record high on the last surge. The reality we all know is that the market is super concentrated, with just a small basket of tech stocks that have been holding the rest of the market up. How concentrated? The current top five stocks have also set a record high for market cap.
 VIX Weekly H-L-C
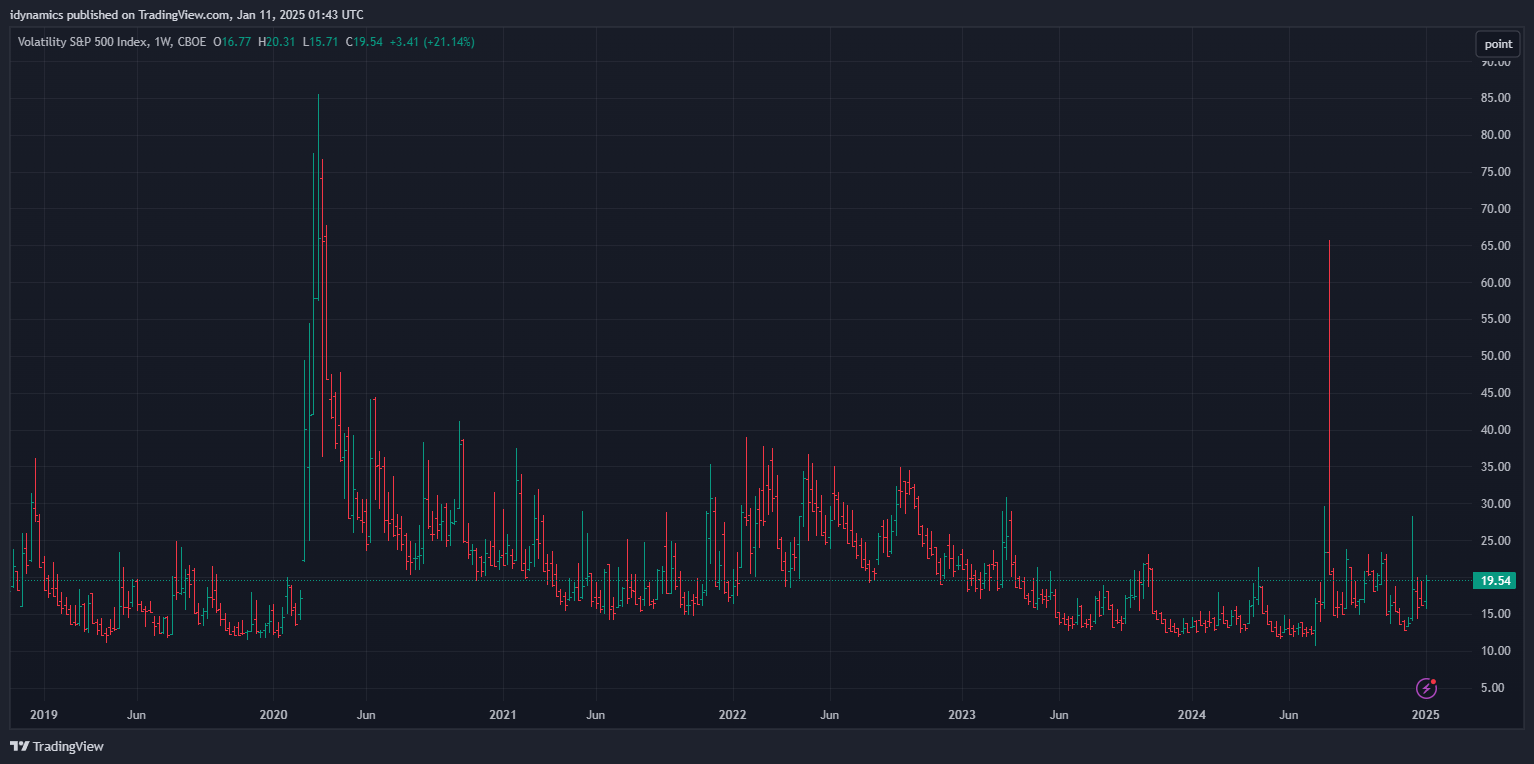
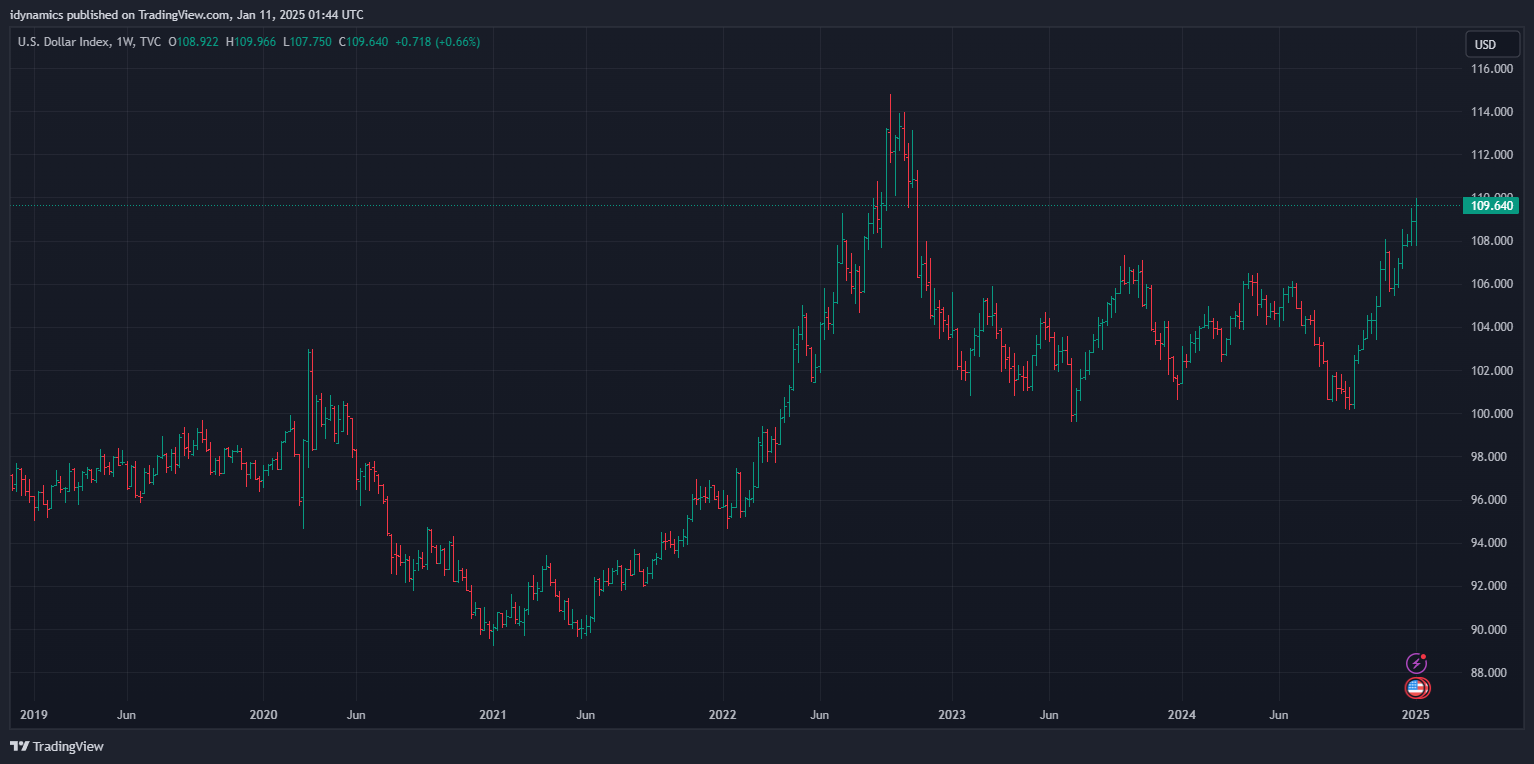
The VIX also traded an outside week and closed at the top of the range, at the highest weekly close since 28 October 2024. The US Dollar rallied to new highs for the move and closed at the highest weekly level since 31 October 2022.
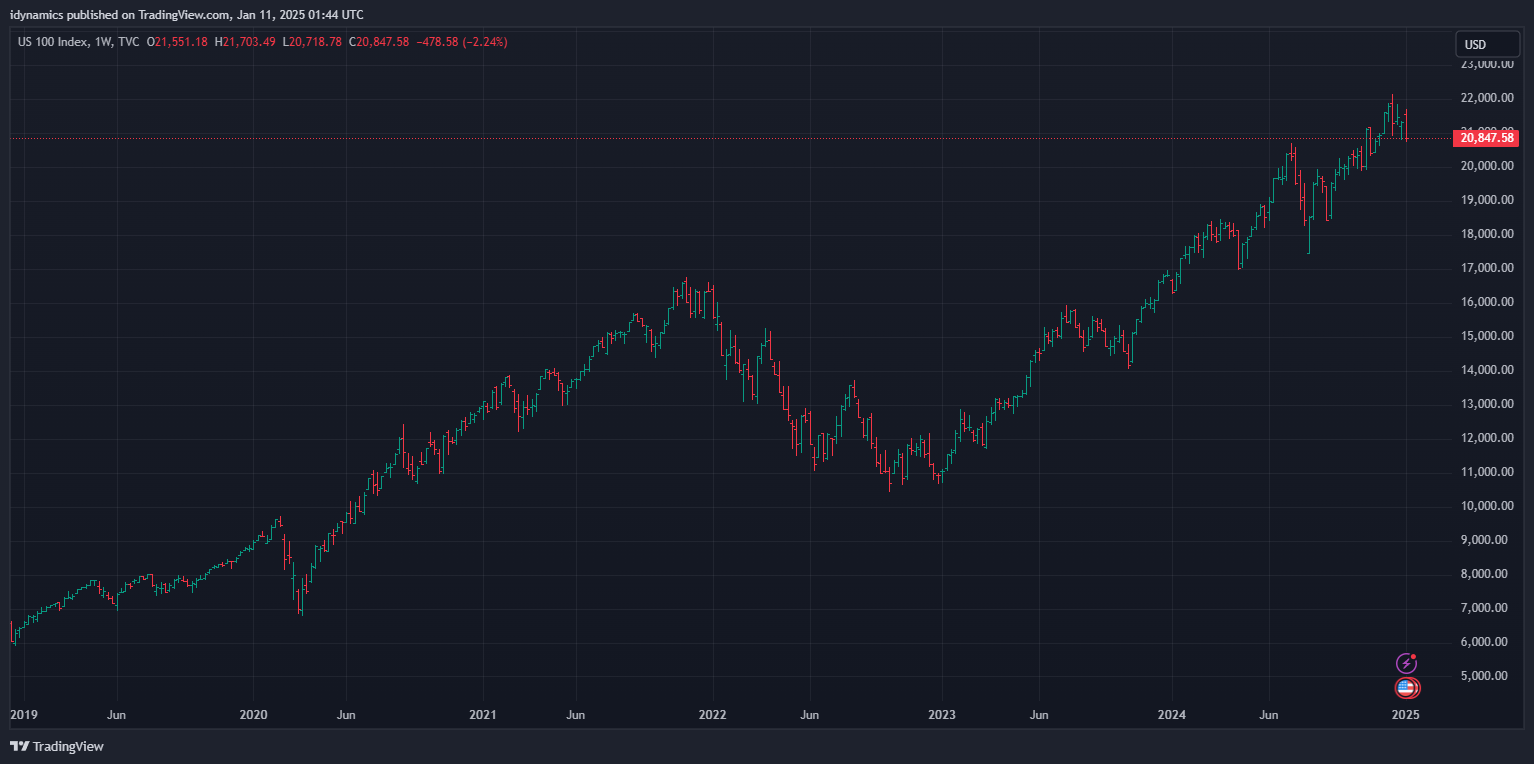
 Nasdaq 100 Weekly H-L-C
 52-Week A/D Line
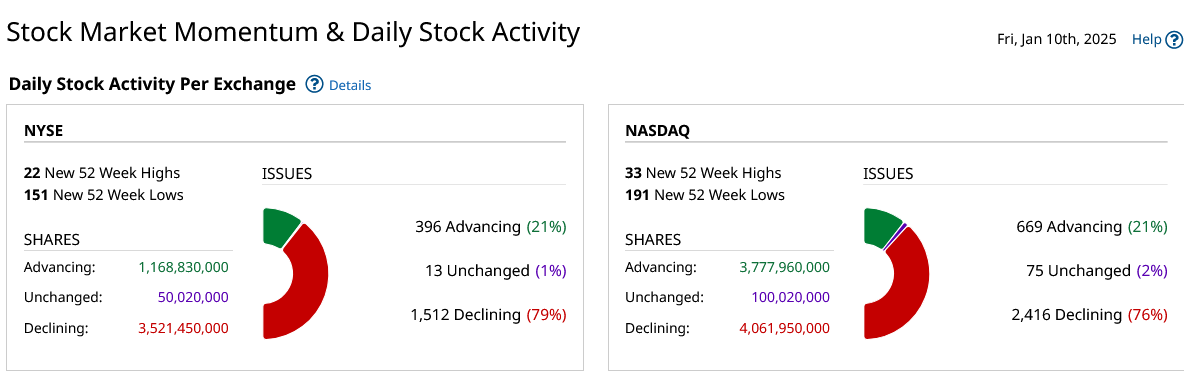
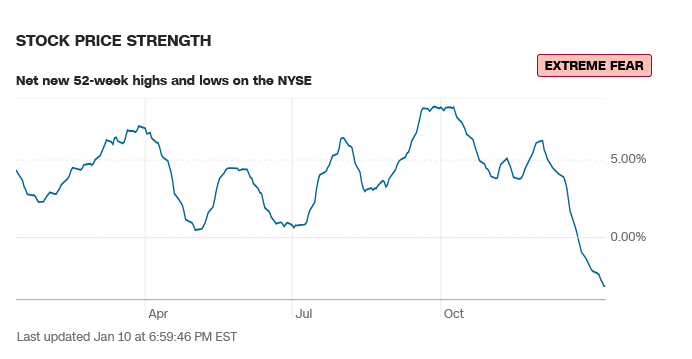
Breadth took a hit with the overall weakness last week and the sentiment is showing extreme fear.
CNN Fear & Greed Index
 AAII Investor Sentiment Survey
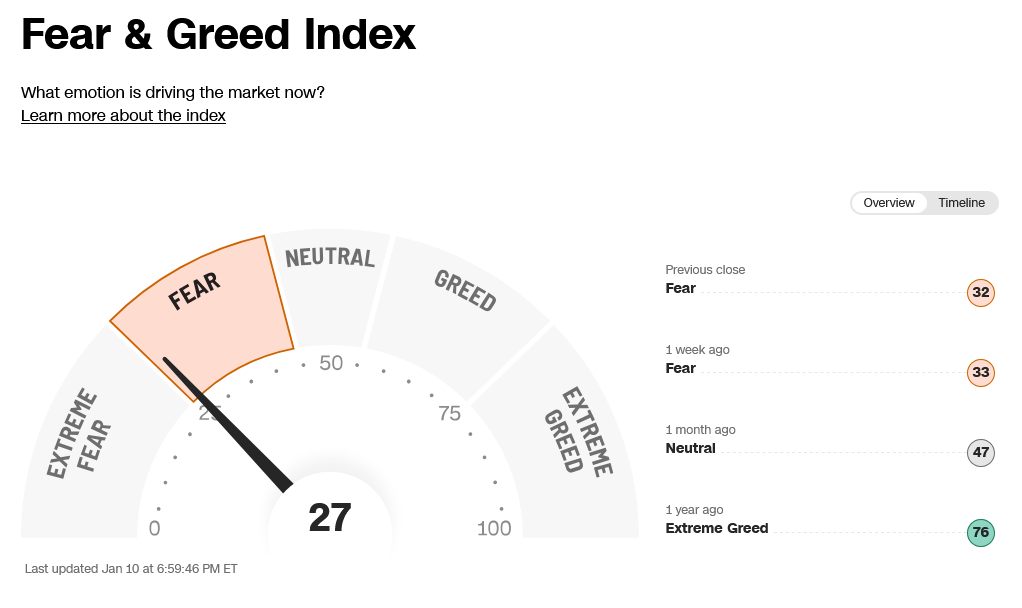
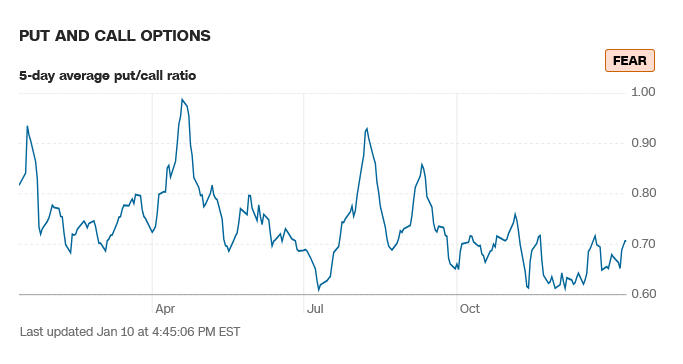
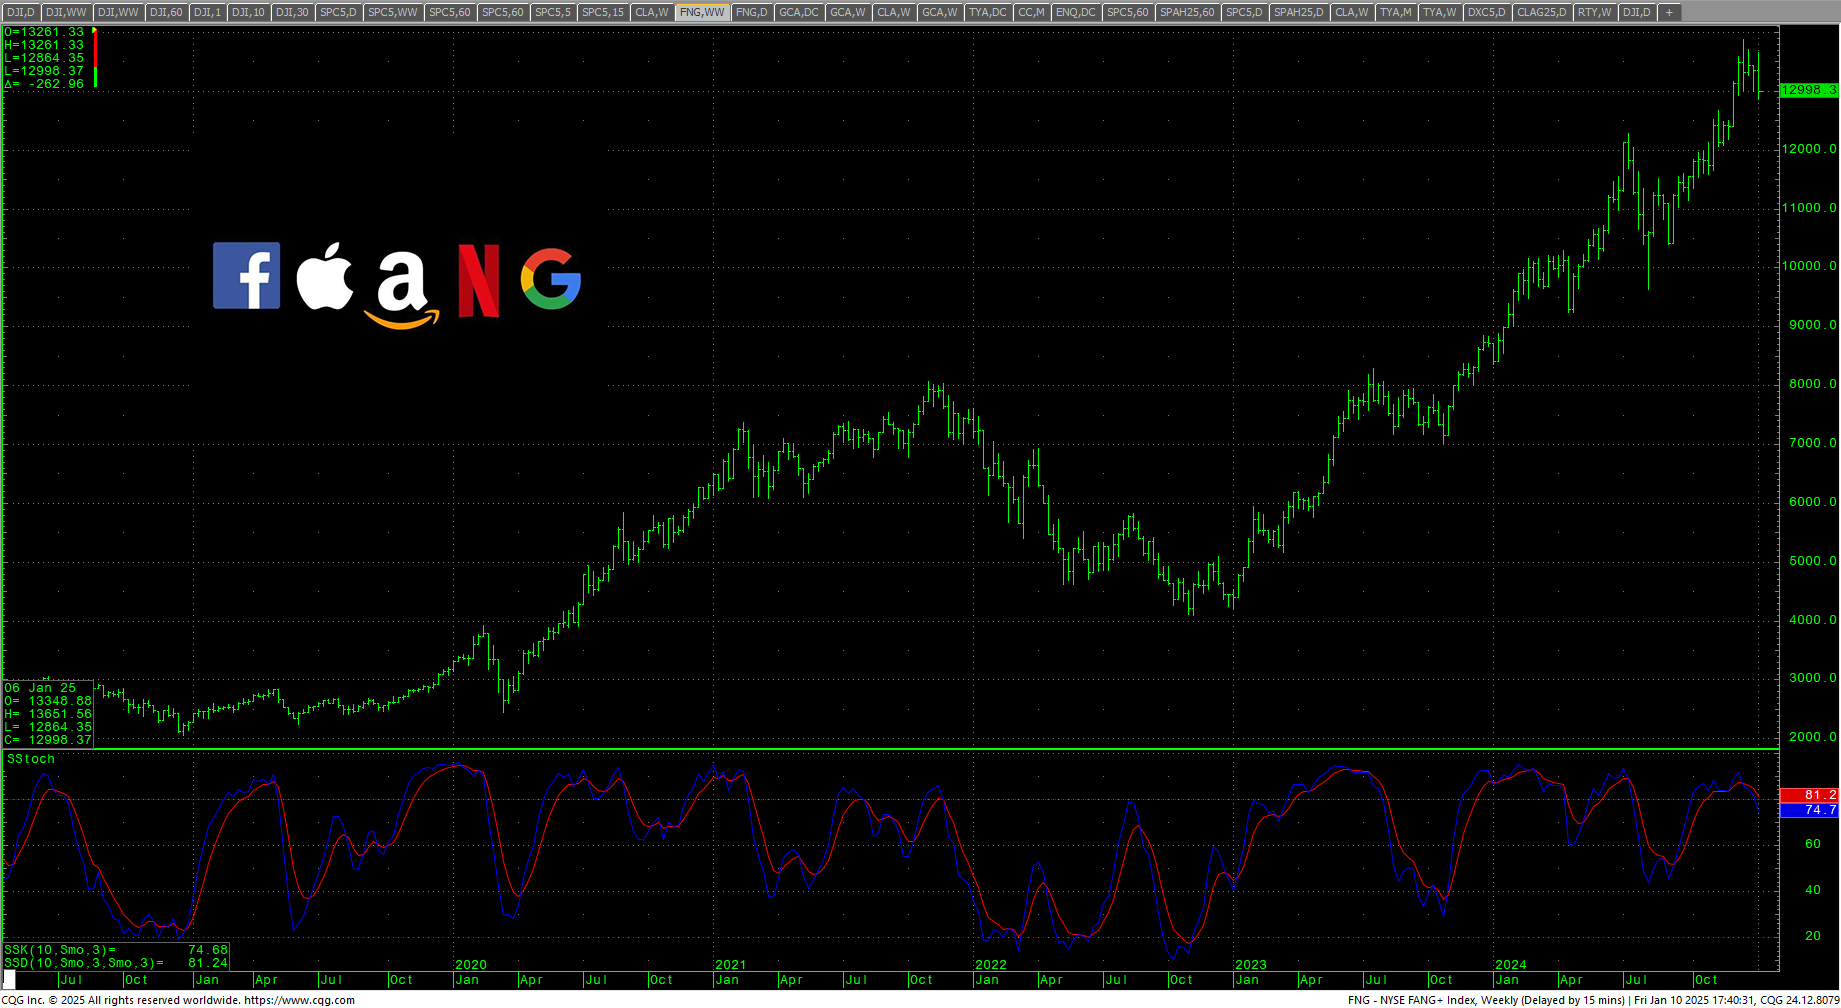
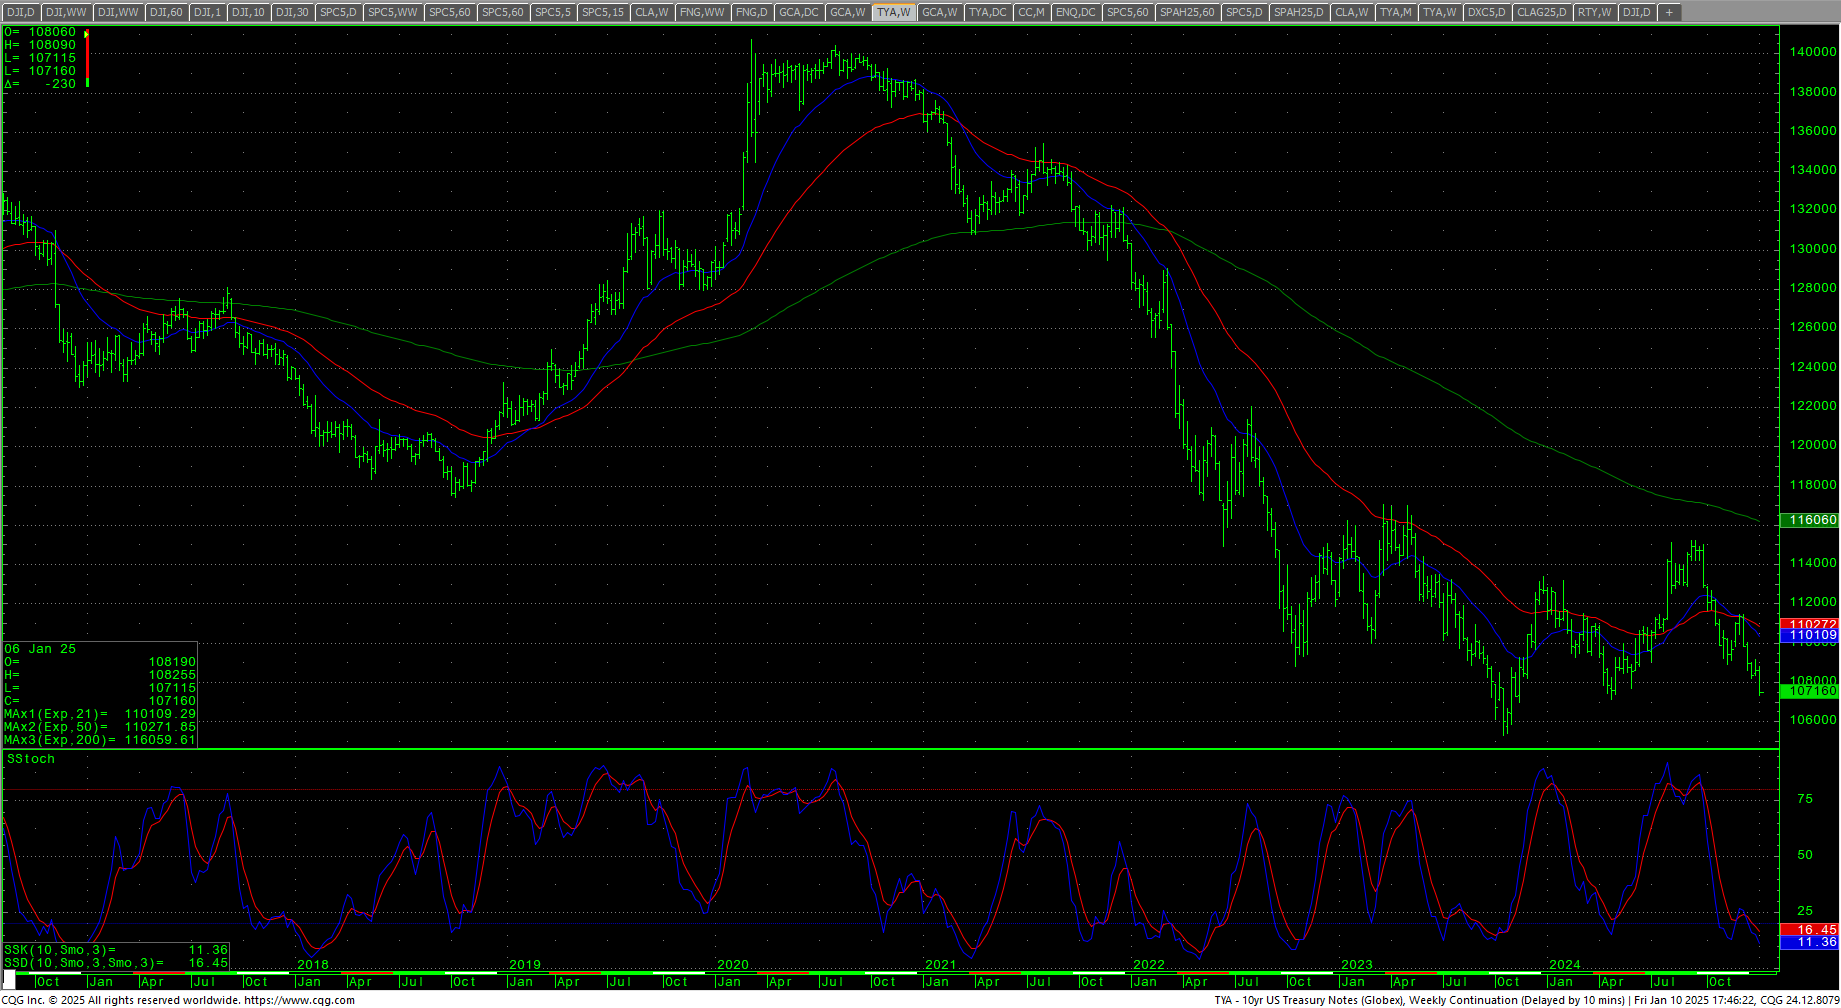
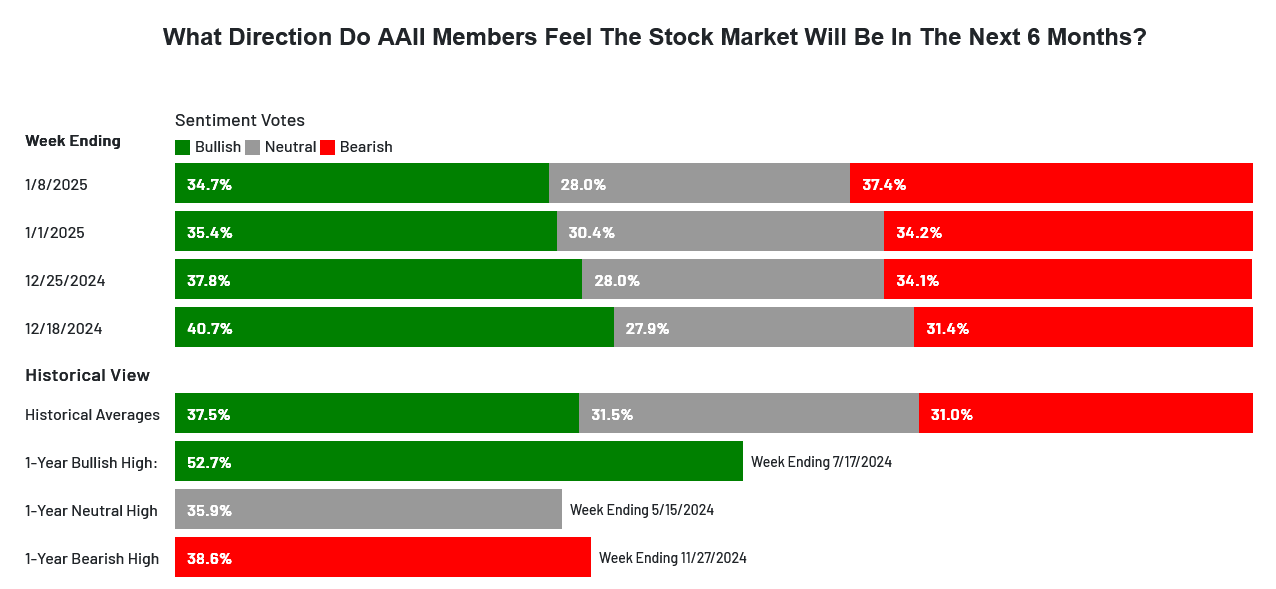 Sentiment leans toward fear and extreme fear. The CNN Fear and Greed Index remains in Fear at 27. Breadth remains weak but off the late 2024 lows and shows extreme fear. Latest AAII Sentiment Survey: Pessimism Expands. The Dow A/D ended at 6659 with the MACD reaching low levels. The VIX ended higher on the top of an outside week up. The Put/Call is at 0.70 and reads fear. The 52-week, A/D has moved to new one-year lows and is now negative at -3.13% and reads extreme fear. The Dow closed the week down -1.86%, closing on the bottom of an outside week down. The S&P was down -1.94% on the low end of the week’s range. The Nasdaq Composite was down -1.84% and the Nasdaq 100 was down -2.24%. The FANG was down -2.63% on the bottom end of the. The Russell closed sharply lower, down -3.49% on the bottom of an outside reversal down. The 10-year notes sold off and closed on the bottom of the week’s range at a new low close for the move and setting the lowest weekly close since 6 November 2023. The yield on the 10YR moved higher, closing the week at 4.763% at the highest weekly close since 29 October 2023.
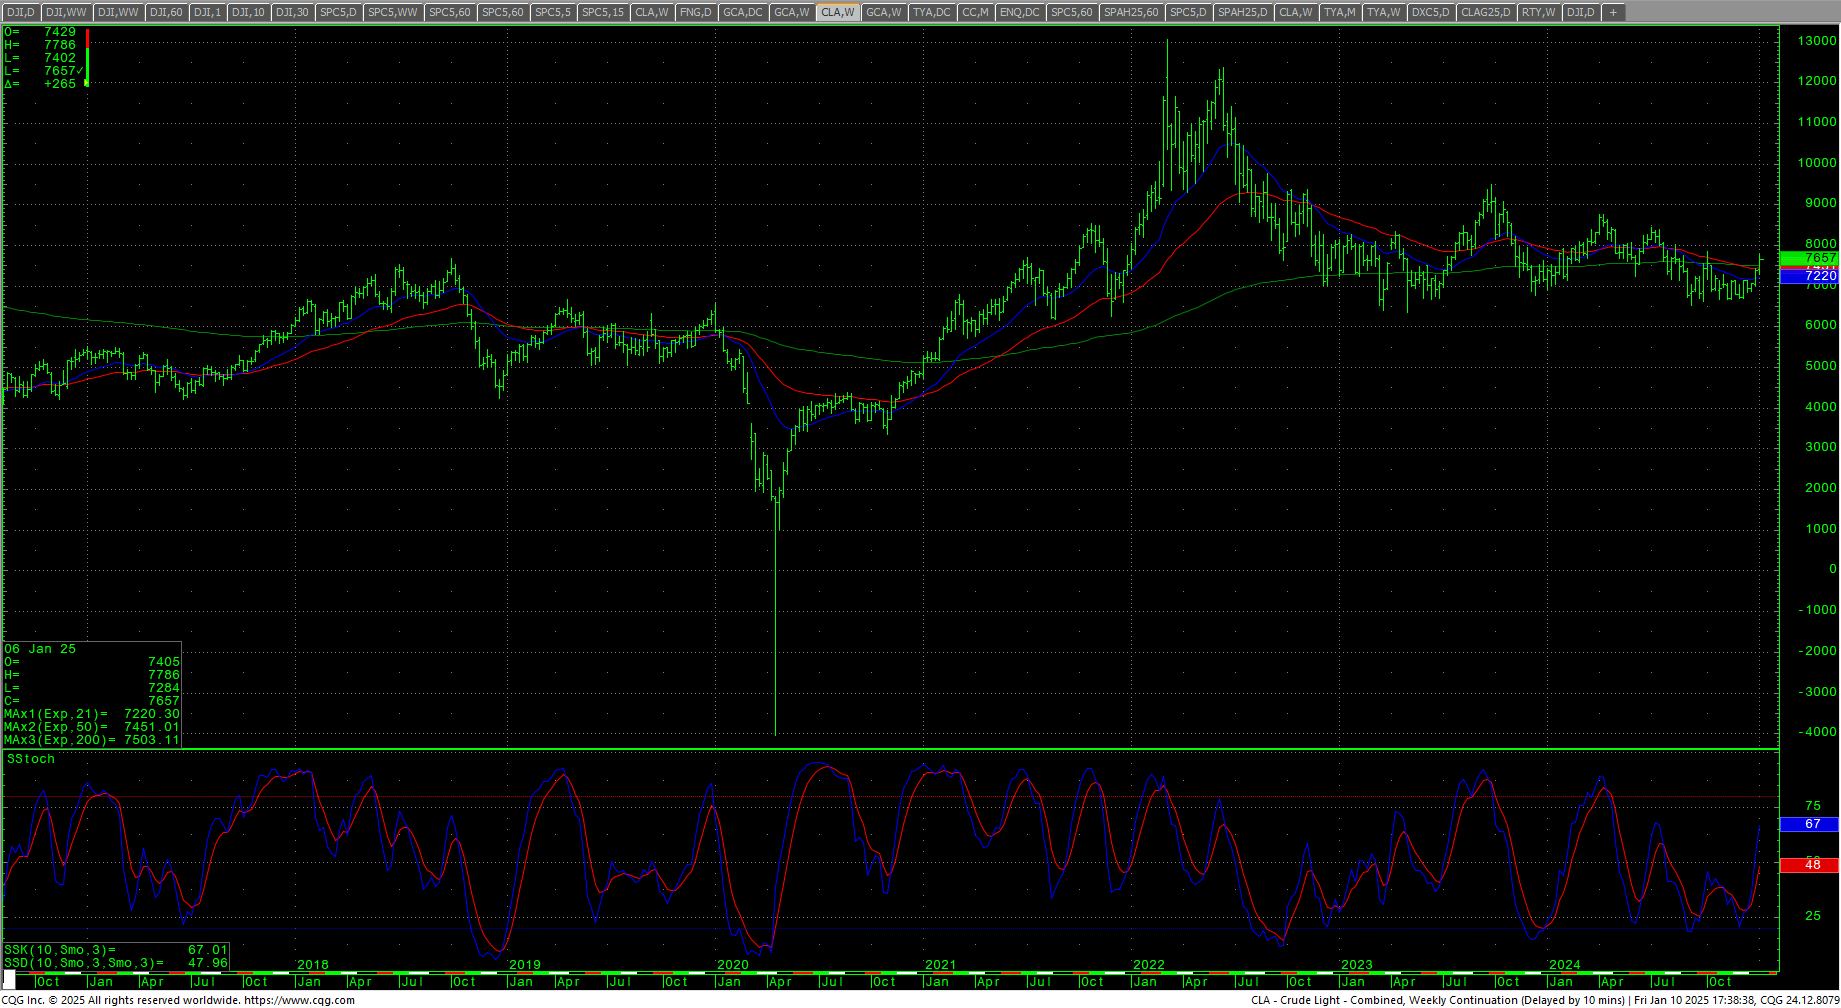
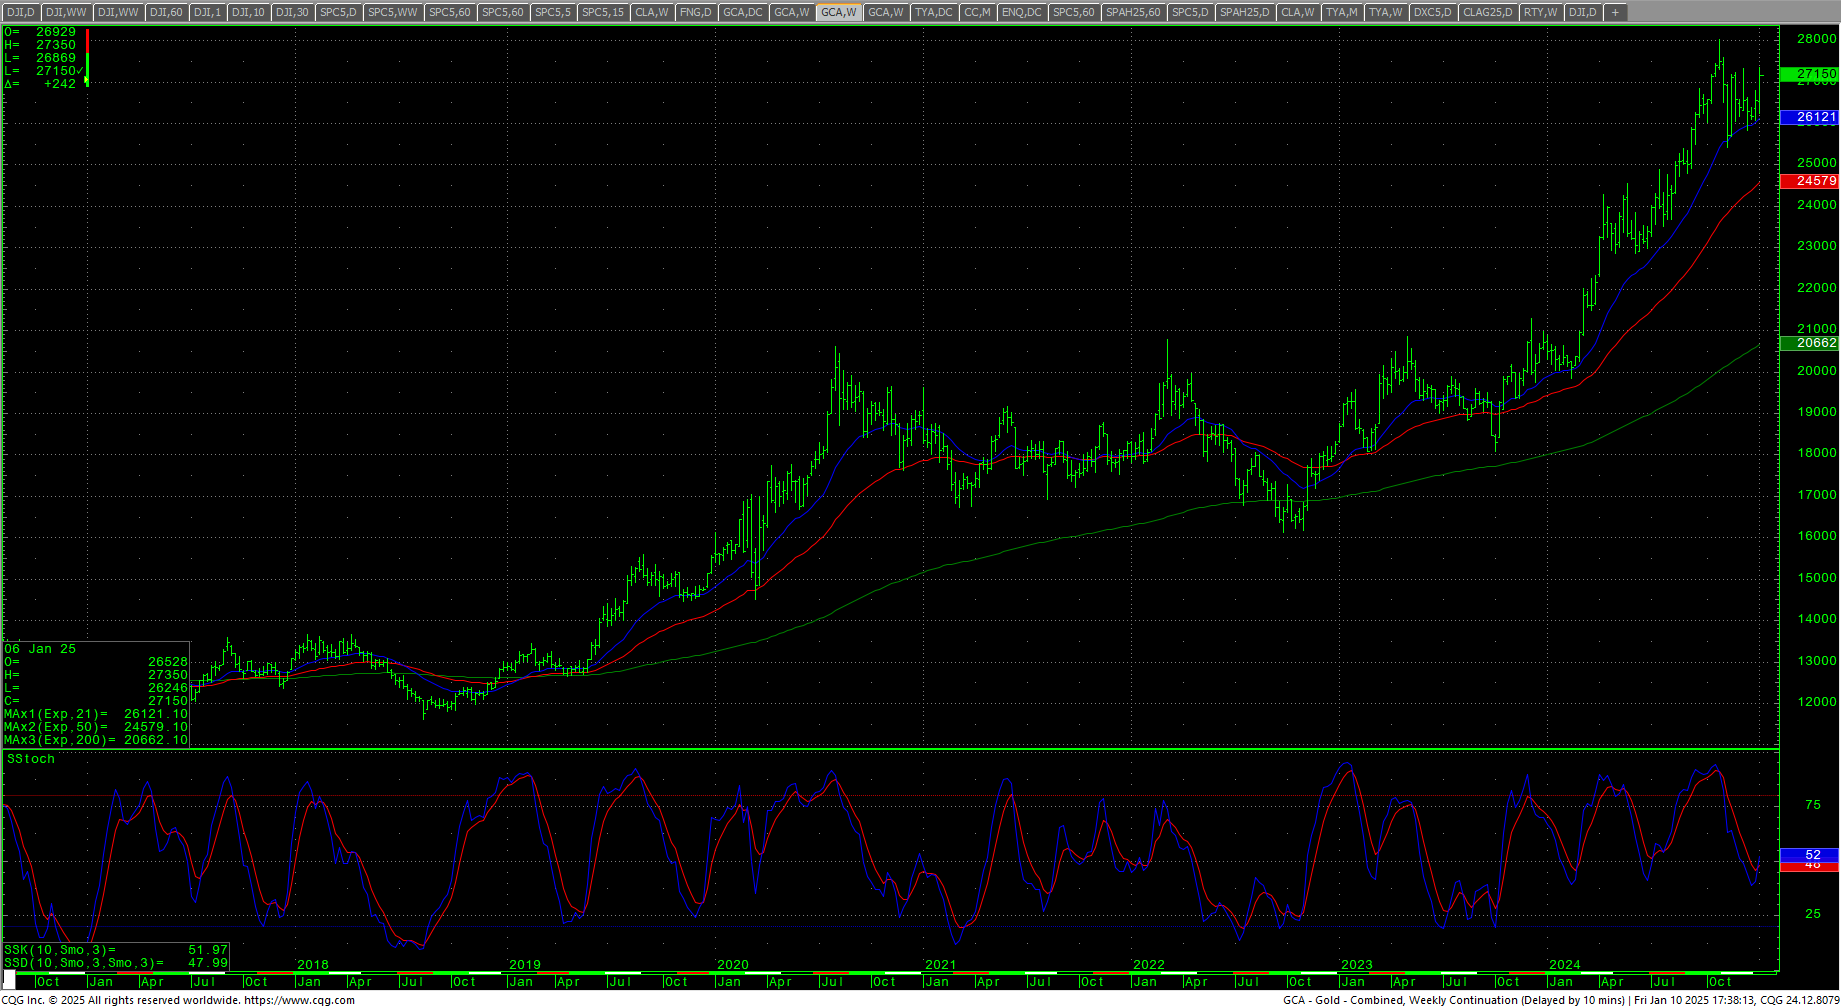
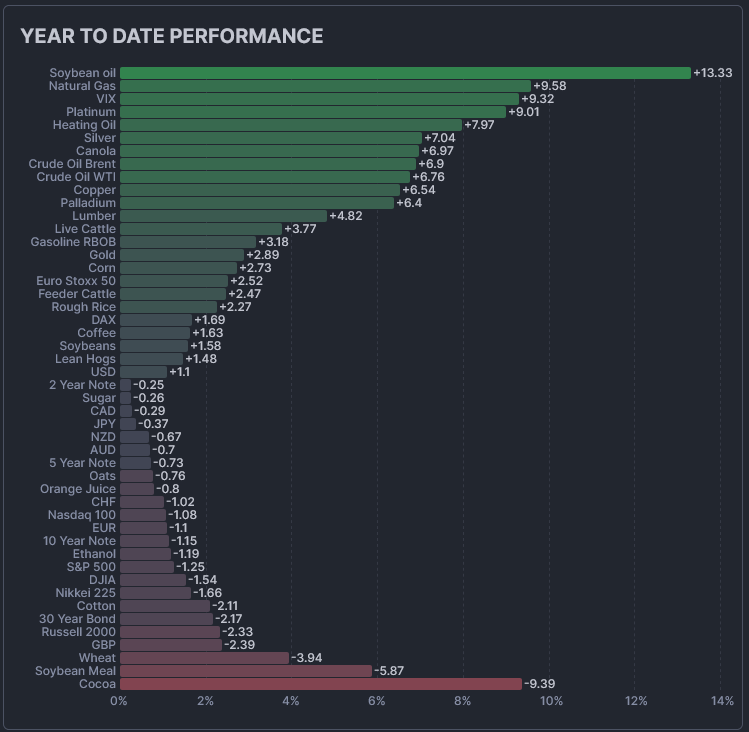 The CRB Index settled at a new high for the drive led by both gold and crude, ending up +0.59%. Crude oil stayed in the upside breakout and rallied to the highest weekly close since 12 August 2024. Gold rallied and closed back above the $2700 area at one of the highest weekly closes in history. The CoT for the S&P 500 shows asset managers continuing to flatten a bit while dealers are buying. Small specs dropped a bit late in the week and probably reflects short-covering. The CFTC S&P 500 Non-Commercial Net Positions ended at -56.8K which reflects continued short selling.
Timing Points
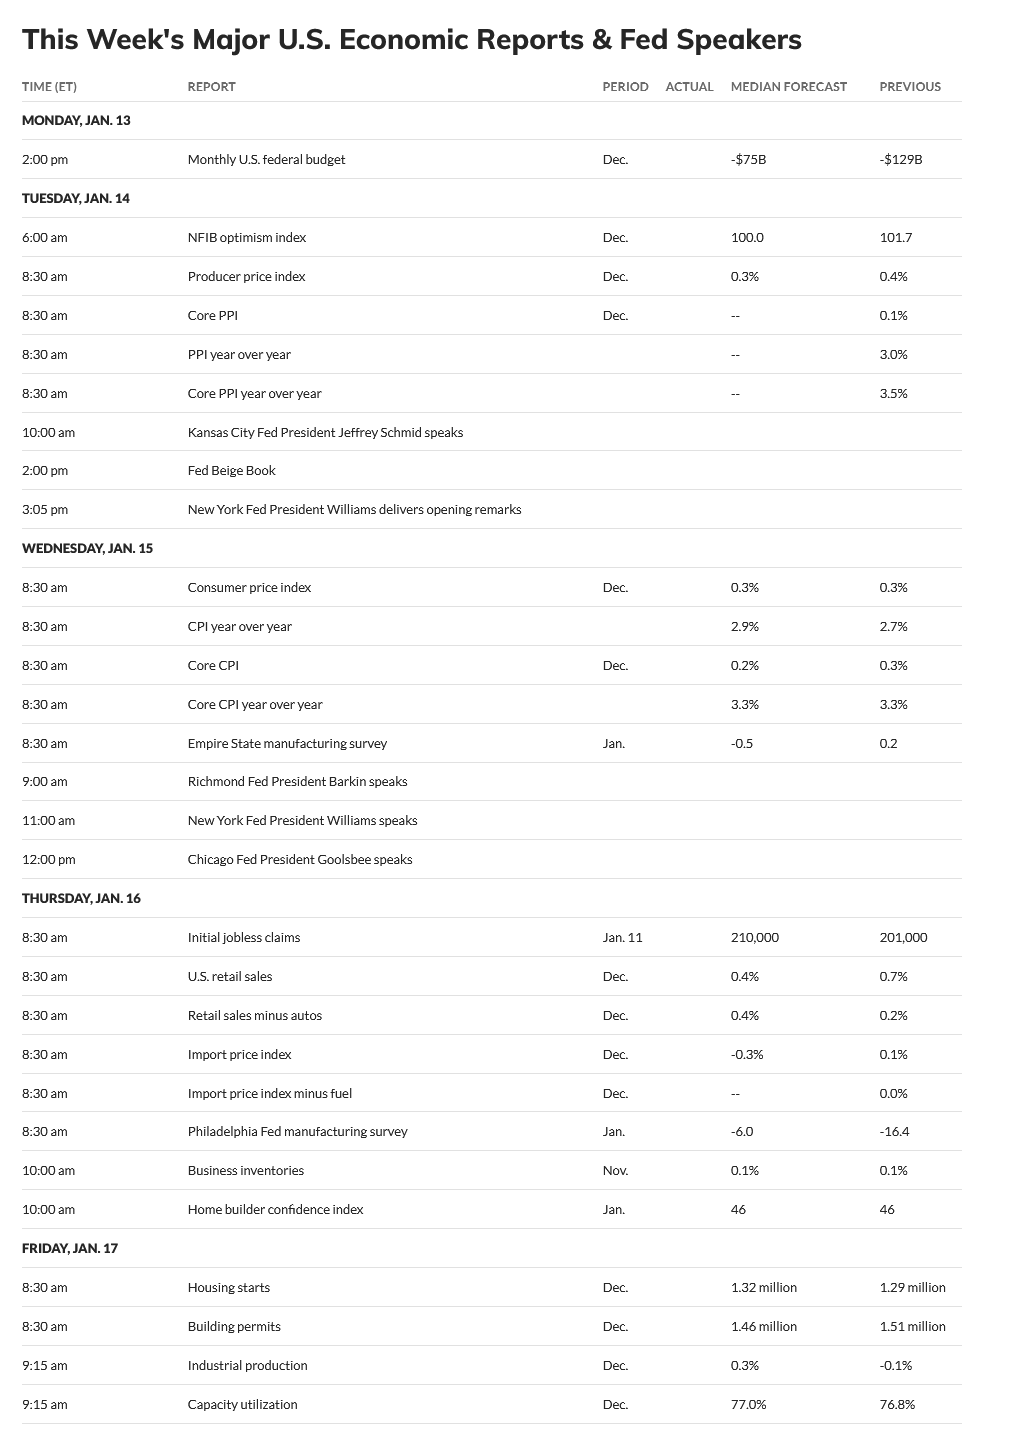
Today and tomorrow mark critical timing with the potential for higher volume and wide swings. CPI and Core CPI are released on Tuesday, estimates are 0.3% and 2.9% YOY with core at 0.2% and 3.3% YOY.
- 01/13-14 *** X critical
- 01/23 **
- 01/30-31 *** X critical
- 02/06 **
- 02/12 **
- 02/19 ***
- 03/03-05 *** X critical
Dow Jones Industrial Average
Dow Jones Industrial Average Weekly Candles
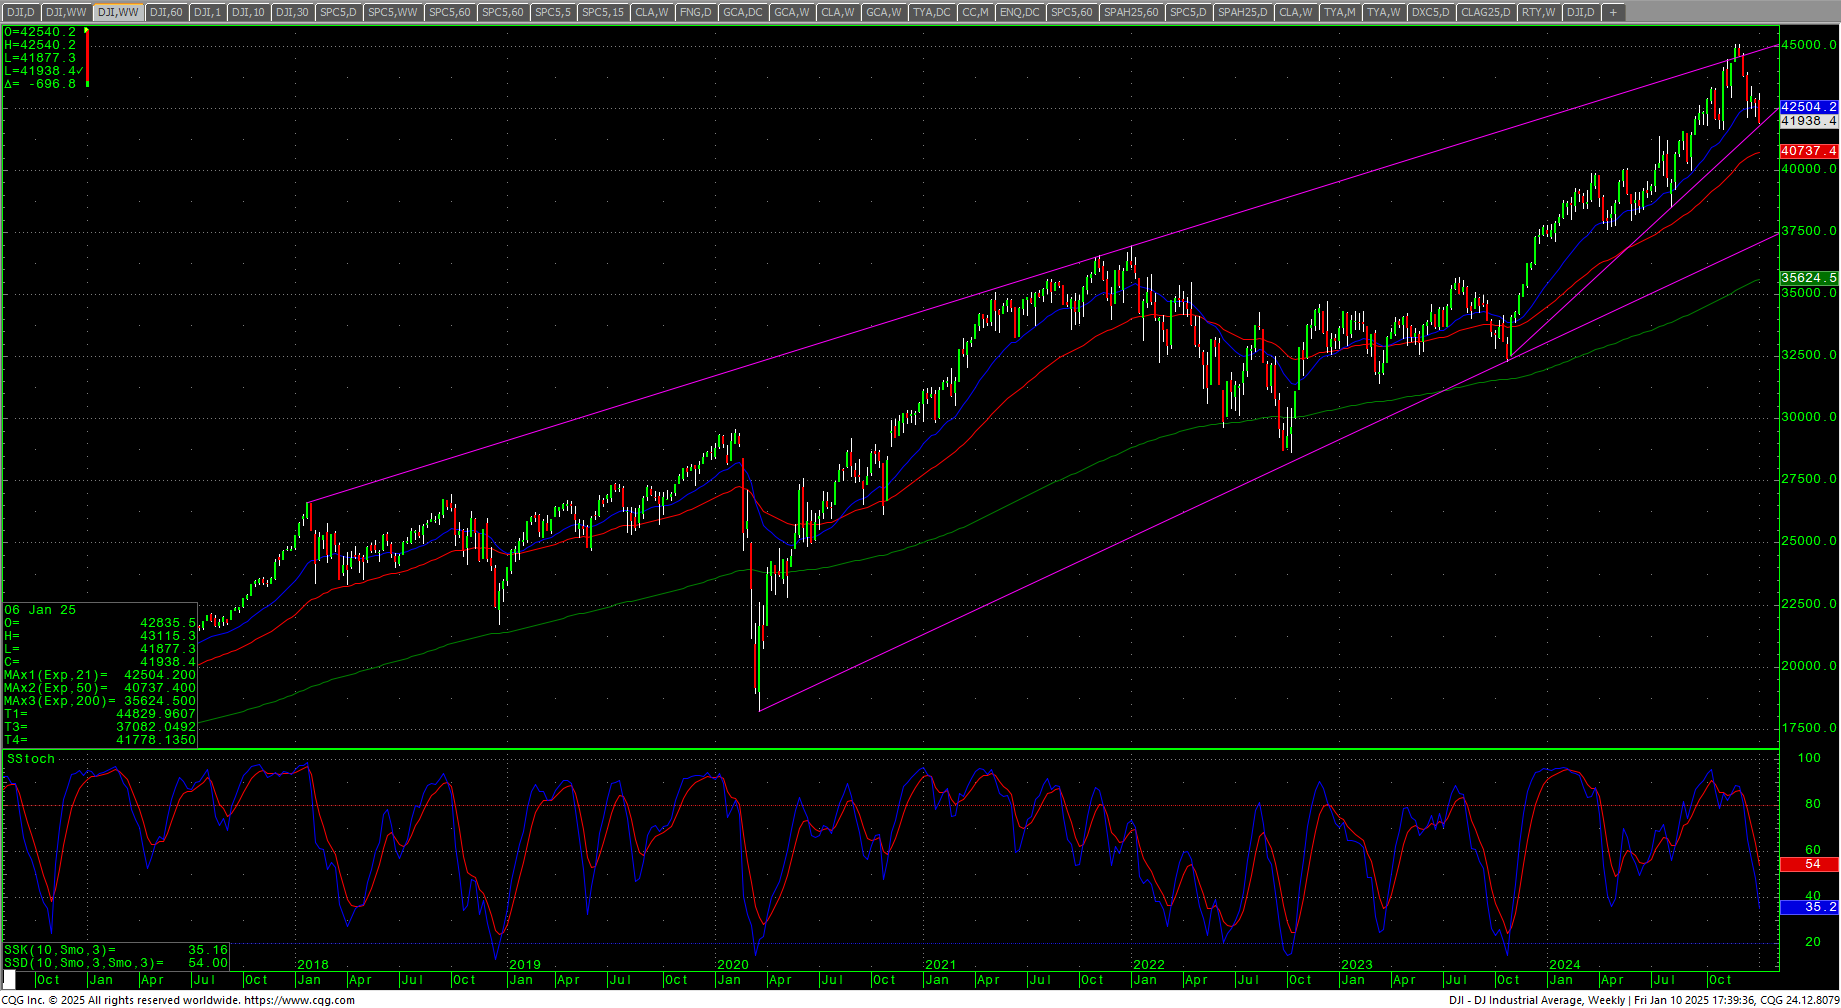 The Dow ended the week lower by almost -2% and took out a major trendline on the daily, closing under that trendline and setting the lowest daily close since 4 November 2024. The daily stochastics are rolling over once again as prices traded a 2 ½ month low. Prices remain trading below the 50-day MA and the 21-day has been under 50-day since the first few days of trade in 2025. The weekly is in a sell signal. The hourly ended the week in oversold with prices sitting right on critical support. The 200-day MA starts the week at 41156.
Dow Jones Industrial Average Weekly H-L-C
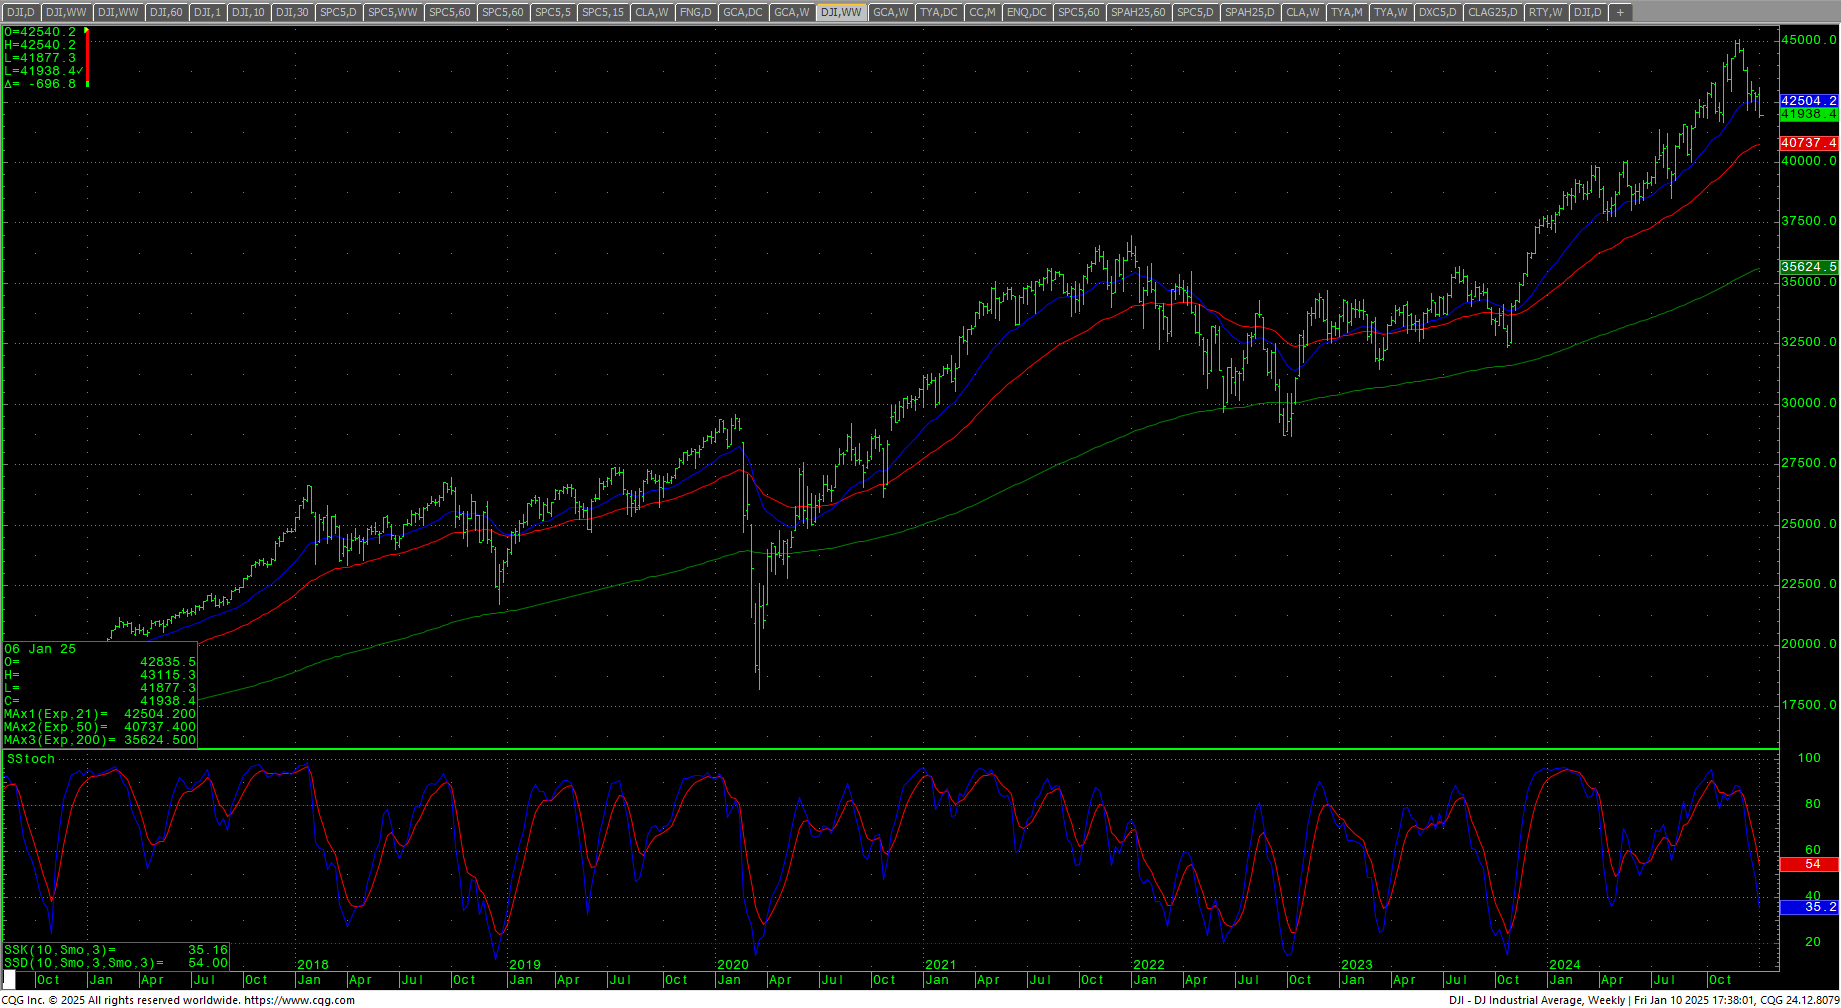 Prices traded under and then closed right on top of critical short-term support at the 41933/41925 level. A further breakdown with closes under 41925 should test 41647 (November low) and 41263 through 41192. Taking out the November low of 41647 would be a bearish signal. Closes under 41192 opens counts toward the 40008/39993 area with key support at 40665, 40338 and 40204/40200. A breakdown under 39993 sets up a decline to 38734.
Dow Jones Industrial Average Hourly H-L-C
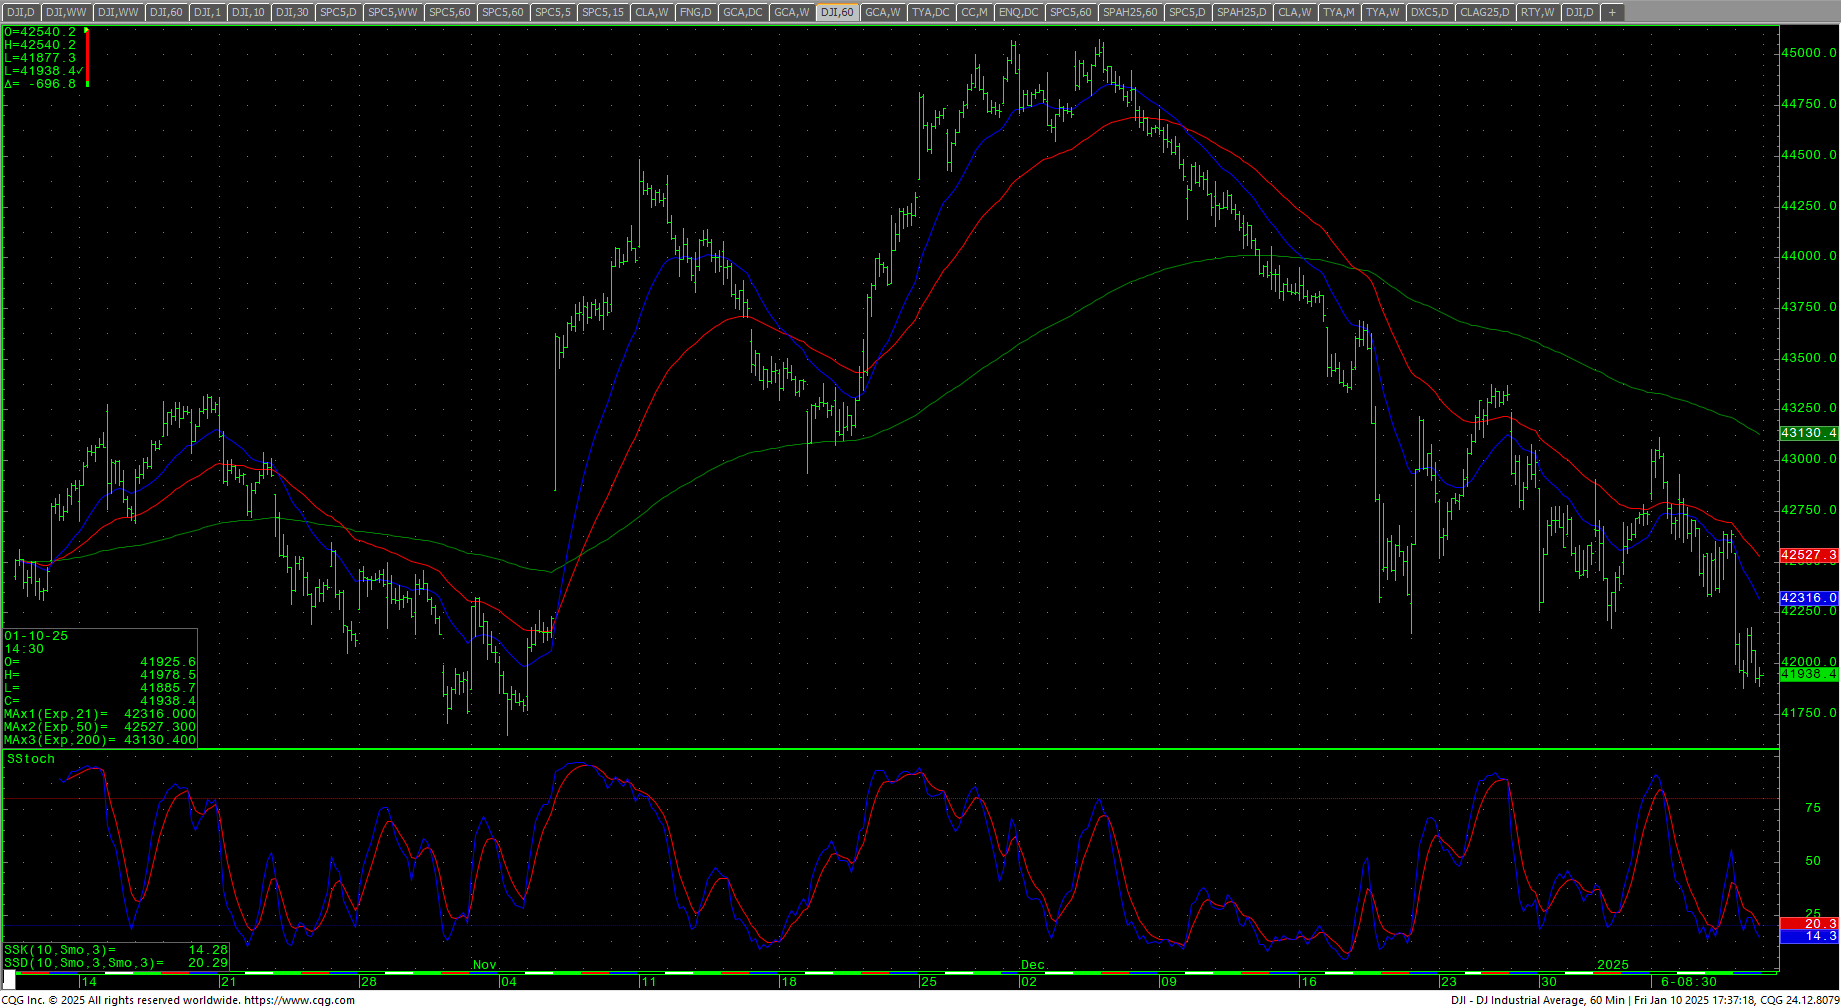 Resistance is 42169/42179 and 42350. A drive back above 42350 can open counts to 42496 with potential to pivotal near-term resistance at 42631/42645. Closes over 42645 set up 43098/43115 with resistance of 42805/42823. A breakout over 43115 setup 43475 with potential to critical short-term resistance of 43852/43855. Daily closes over 43855 count to 44274 and 44320 with full potential to carry to the intraday trading highs against the 45073/45074 level. Closes over 45074 opens counts toward 45244 and 45426 (Fibonacci target). Rallies with closes over 45426 will reopen longer-term monthly targets in the 47400 level with targets of 46568 and 46954.
| Resistance | Support |
|
|
S&P 500 Cash Index
S&P 500 Index Weekly H-L-C
 S&P 500 Index Daily Candles
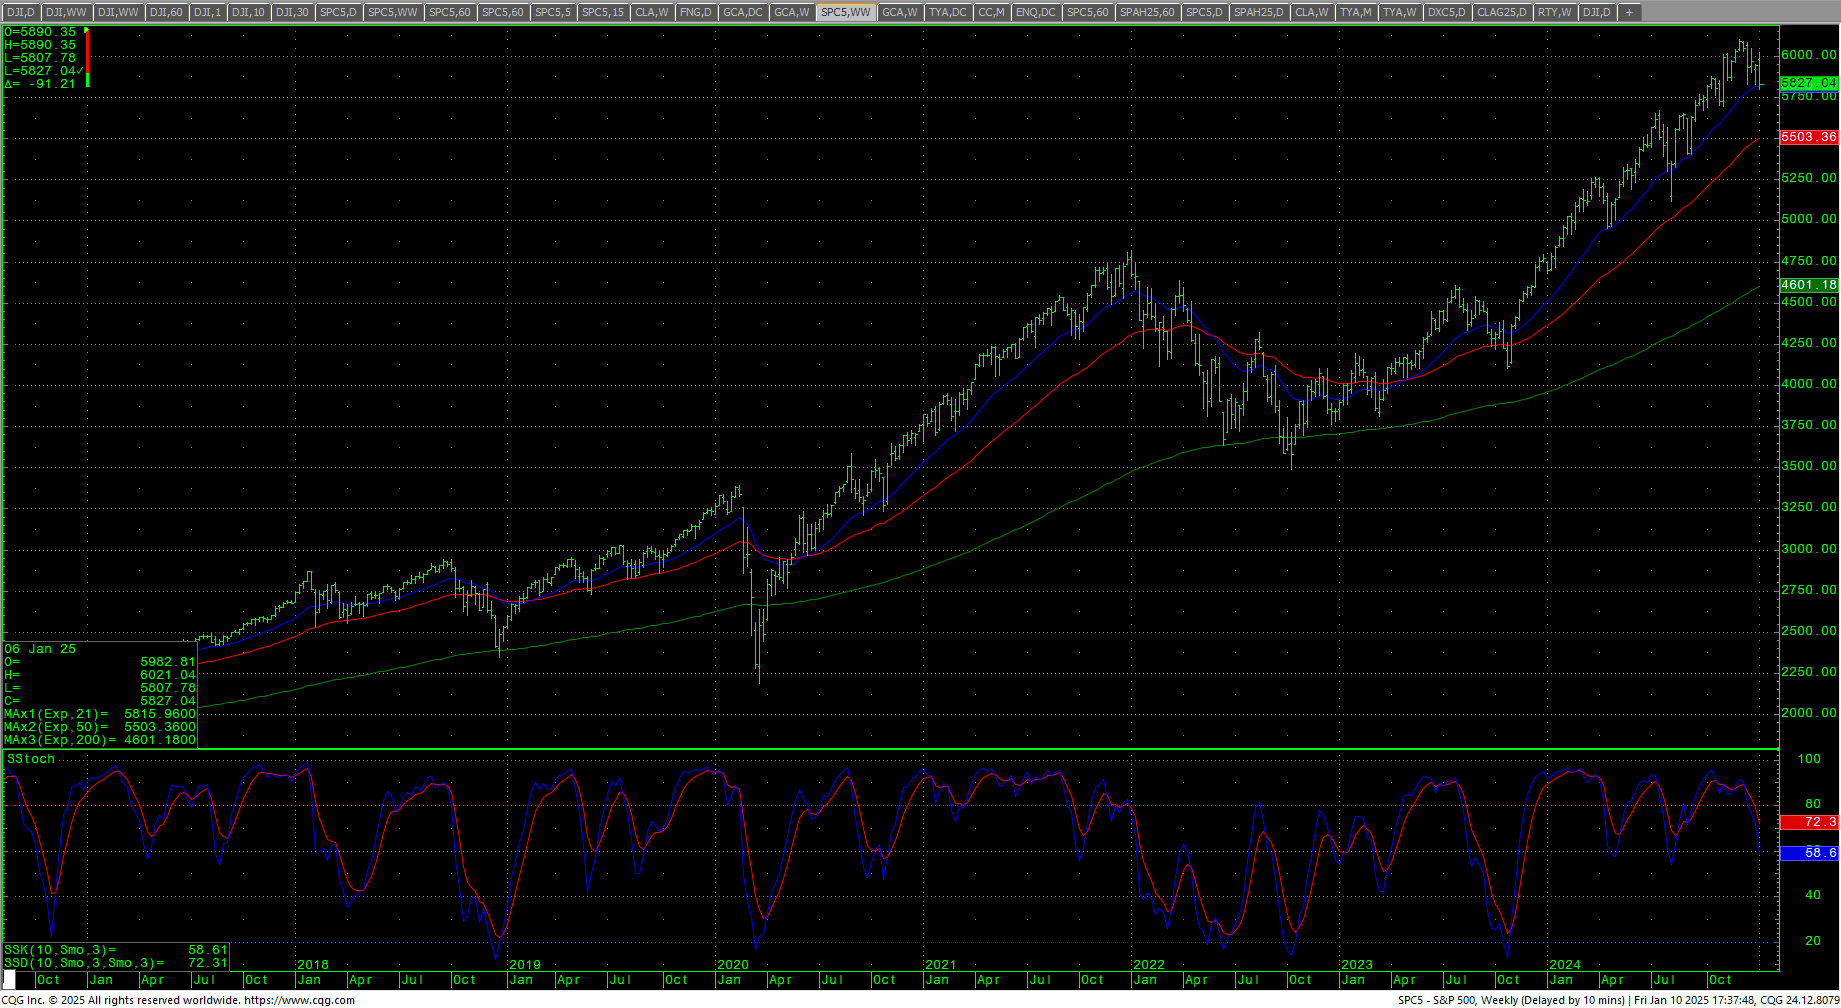
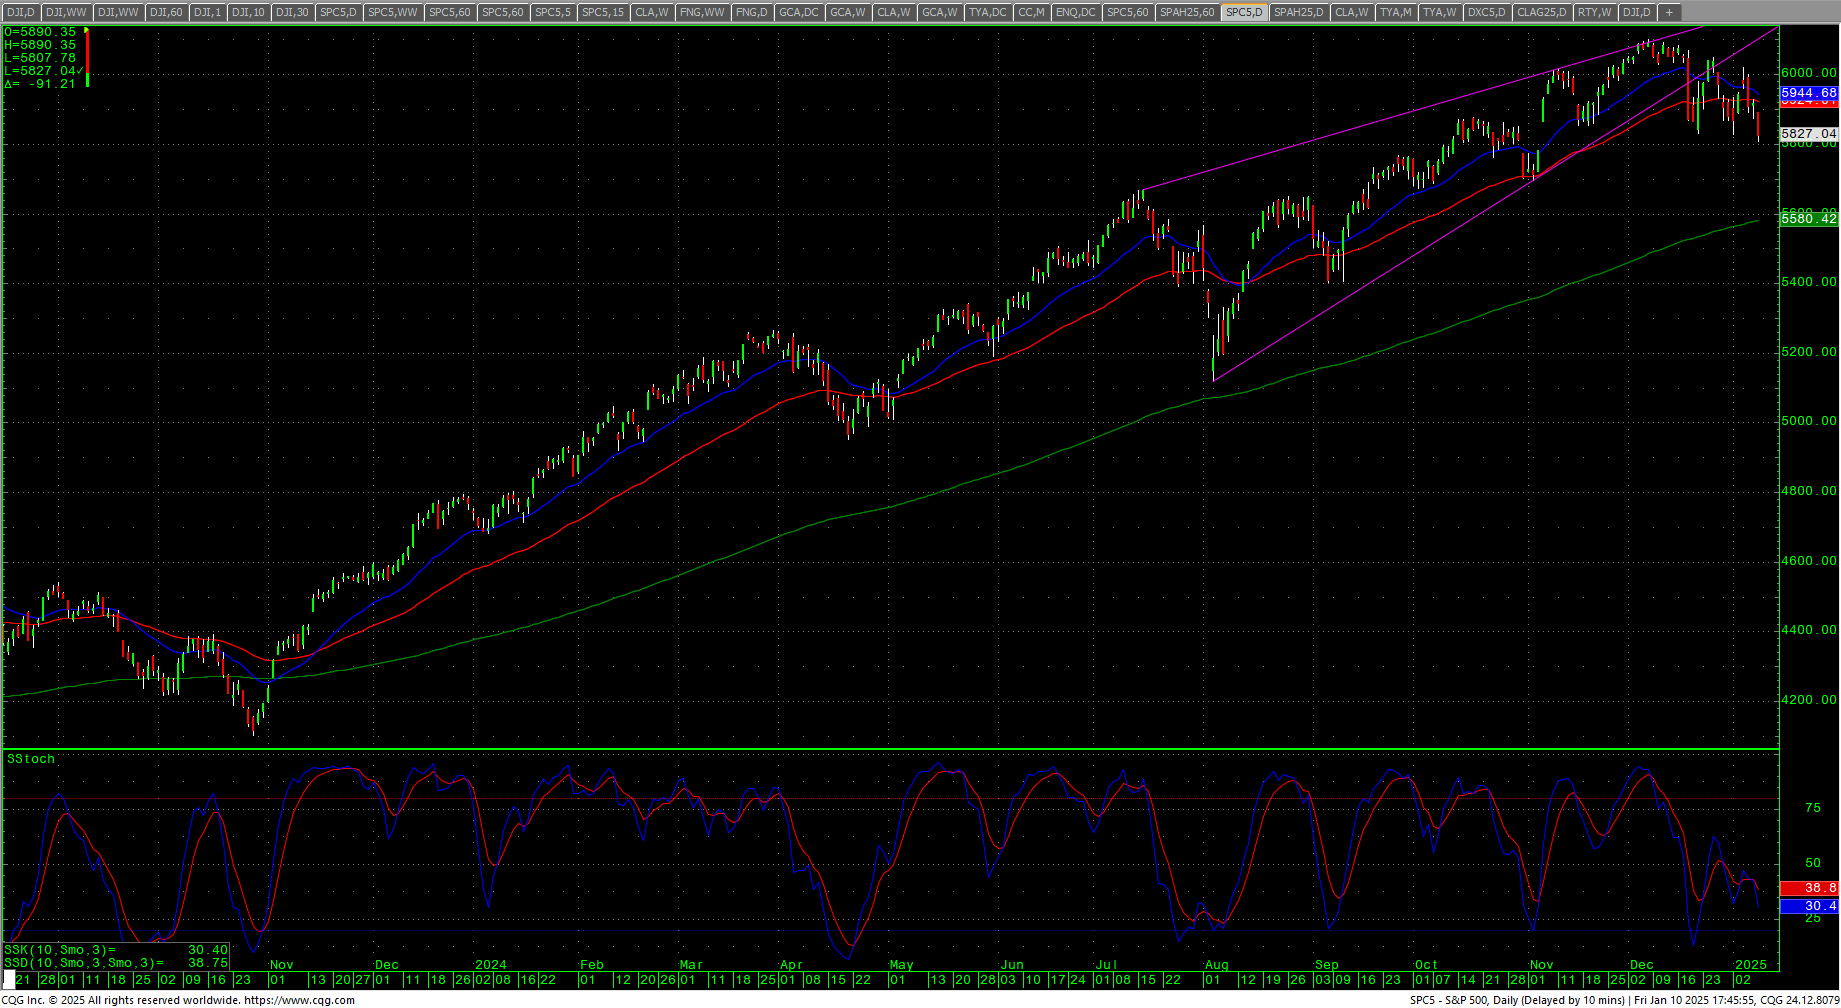 The S&P staged a wide outside week down and closed on the bottom of the weekly range as prices entered, and closed into, the gap area left on 6 November 2024 at the lowest daily close since 5 November 2024. The intraweek swing from high to low was -3.60% and the market ended the week down -1.94%. The daily stochastics have hooked lower once again and the daily chart looks like a rounded top pattern now. The close on 5 November 2024 was 5782.76, so any trade under that level will wipe out the entire port-election move. A lower gap in this week’s early critical cycle timing could be devastating to the charts from a technical perspective as it would leave the entire trade since early November as an island on the daily. The weekly is showing a sell signal from a bearish divergence. The 200-day MA is 5581/5580. The November low of 5696 is critical intermediate-term.
S&P 500 Index Hourly H-L-C
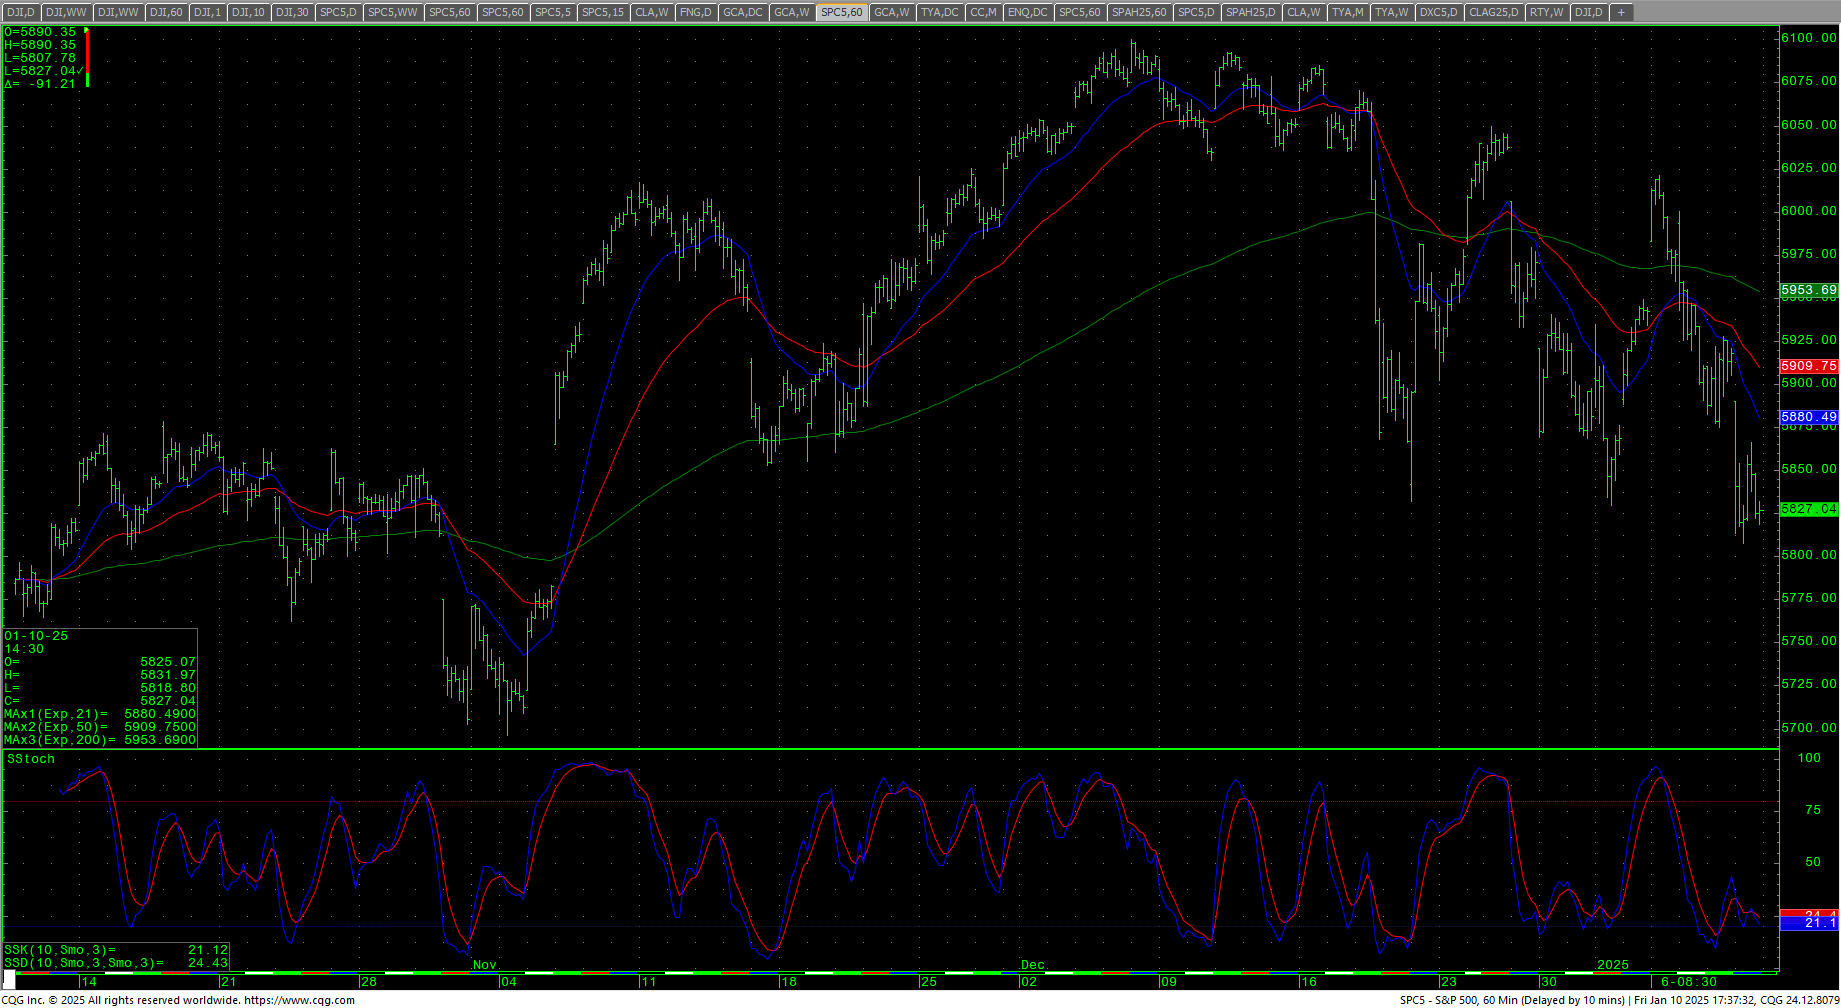 The hourly ended the week oversold and has a small bullish divergence with Friday’s trade. Prices ended right on top critical short-term support at 5832/5825. A continued breakdown with closes under 5825 have potential to carry toward the 5609 level with support of 5725 and 5709. Closes under 5609 setup critical short-term support of 5493/5490. Daily closes under 5490 sets up 5364 to 5350. Under 5350 can test 5244/5240 with full counts to 5120/5100. Closes under 5100 will open counts into the 4866/4860 area.
SPY Weekly
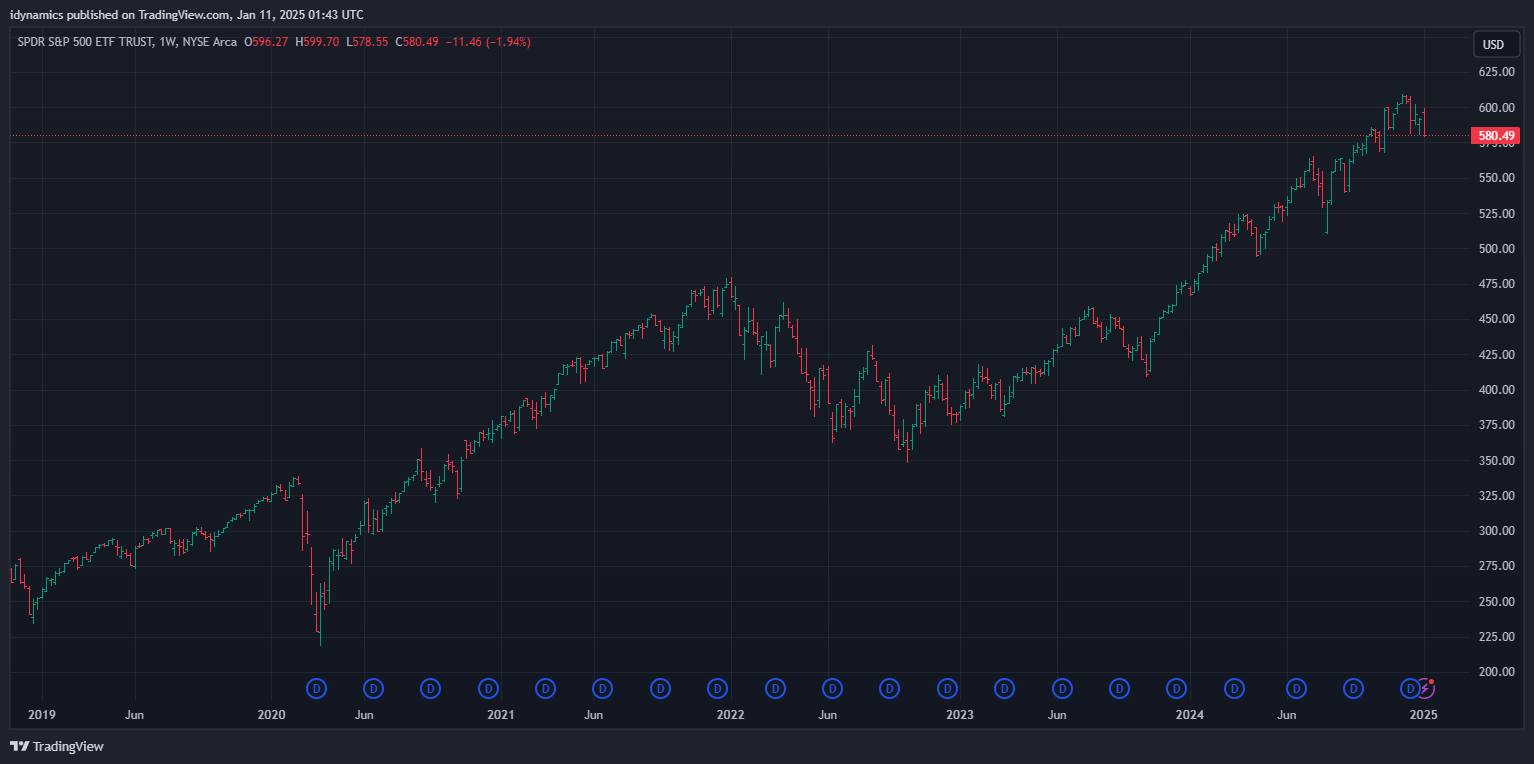 Resistance is 5851 and 5876/5878. A rally above 5878 sets up 5898 with counts to 5919/5922. Closes over 5922 should test 5954 with potential to critical short-term resistance at 5988/5992. Daily closes over 5992 should see 6026/6031 with potential to carry back to the intraday highs at 6095/6100. Above 6100 should see 6115 and ultimately 6152. Closes over 6152 open counts to 6224 and 6296. Above 6296 can carry to 6368 with counts into the 6440 area. Closes over 6440 will open counts to 6584. A breakout over 6584 sets up 6638 and 6692.
| Resistance | Support |
|
|
Charts courtesy of CQG, Inc., CNN, Koyfin, Trading View and AAII