TECHNICAL ANALYSIS (by Intraday Dynamics)
Major Indices Week of January 12, 2024
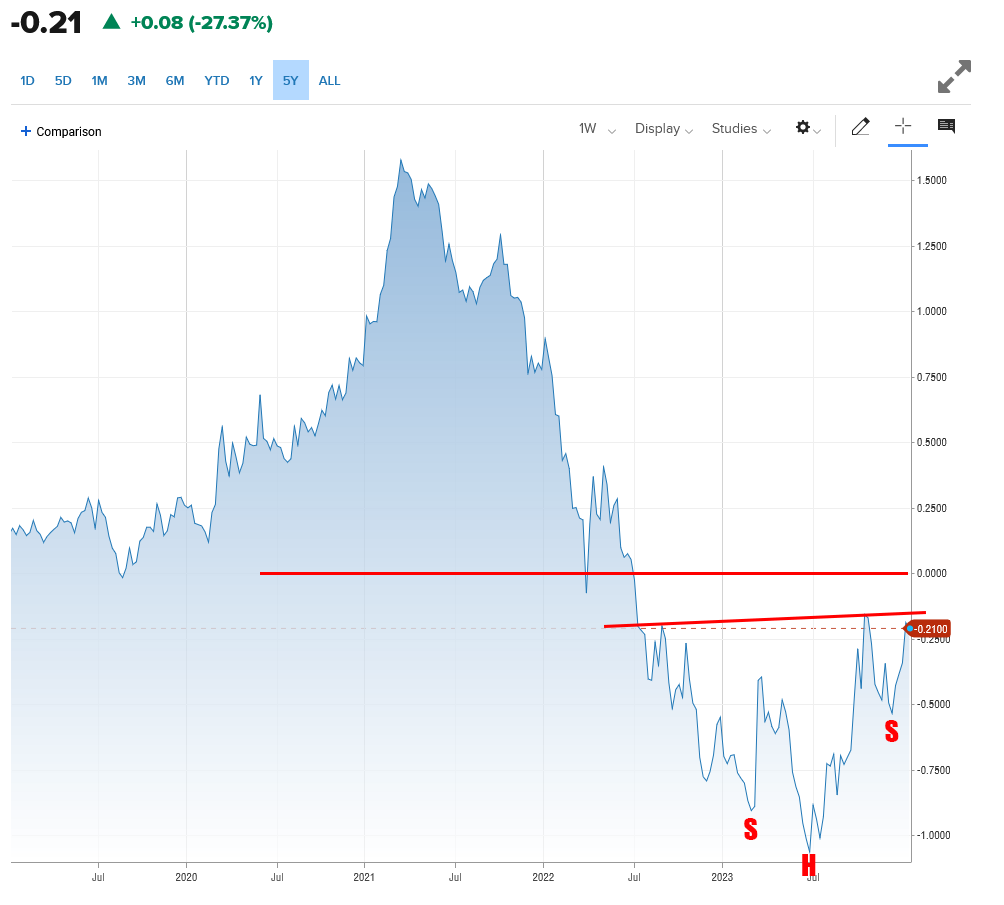
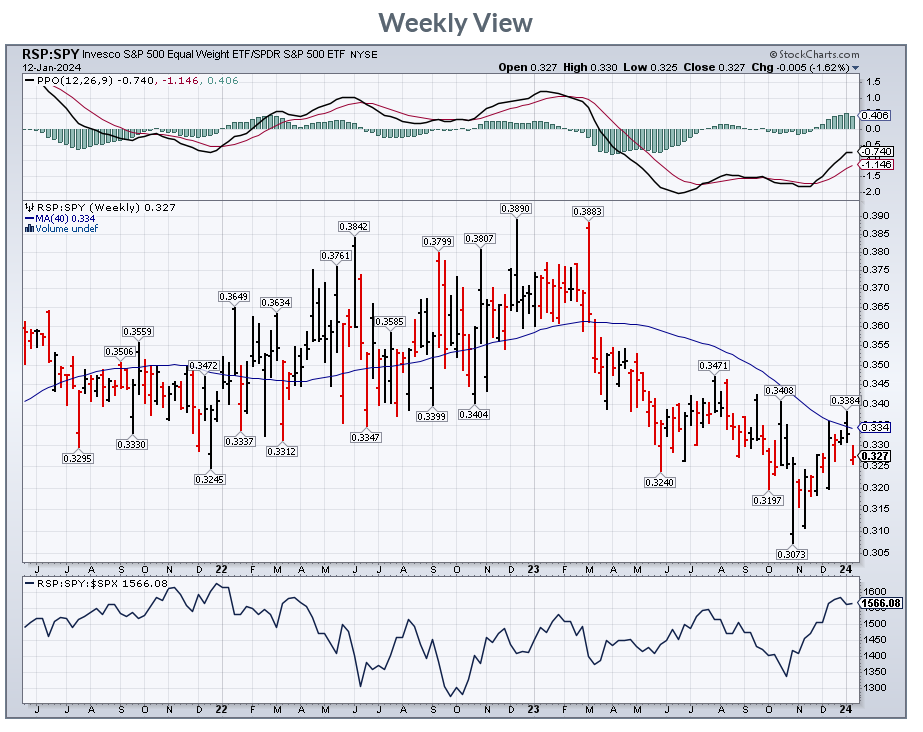
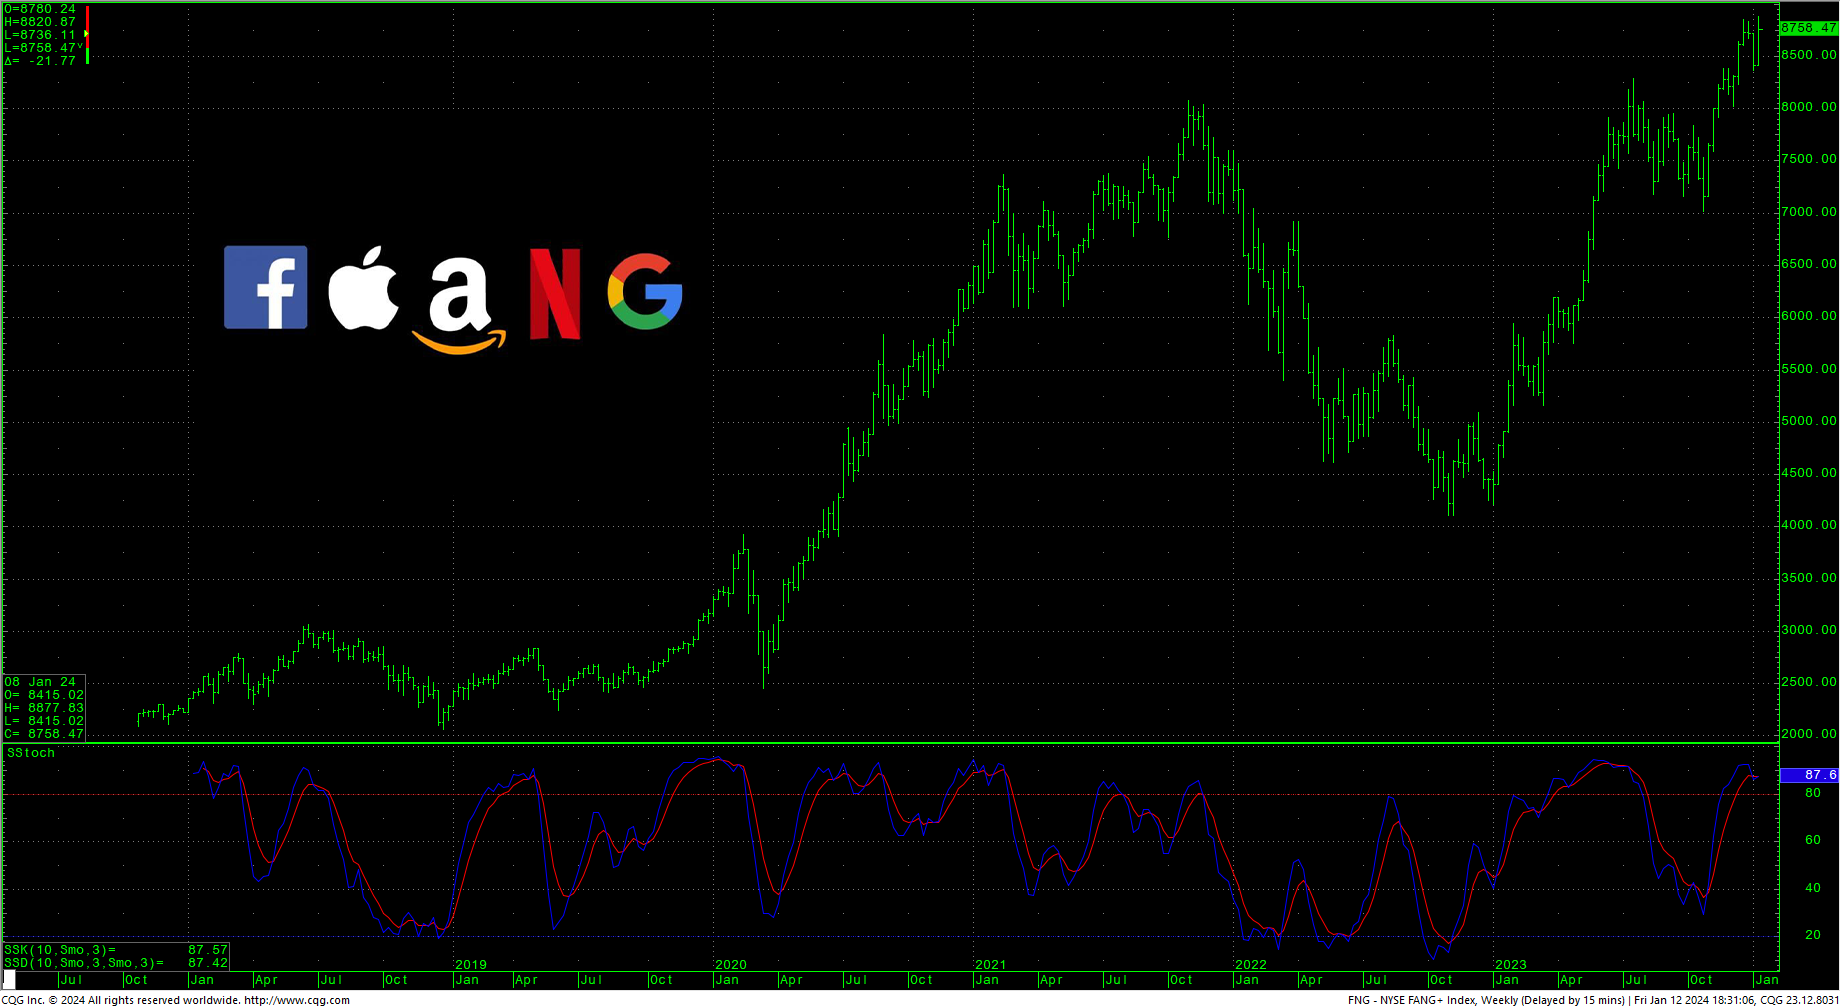
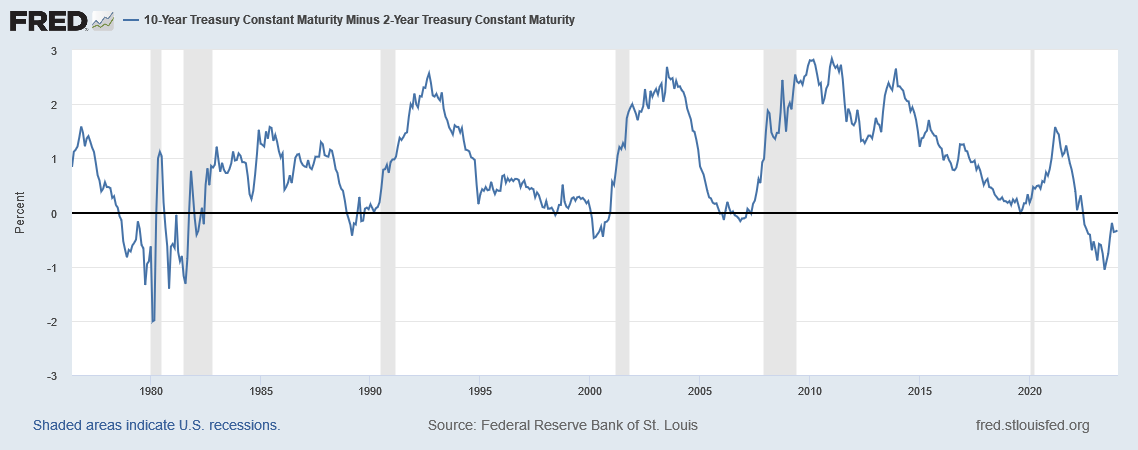
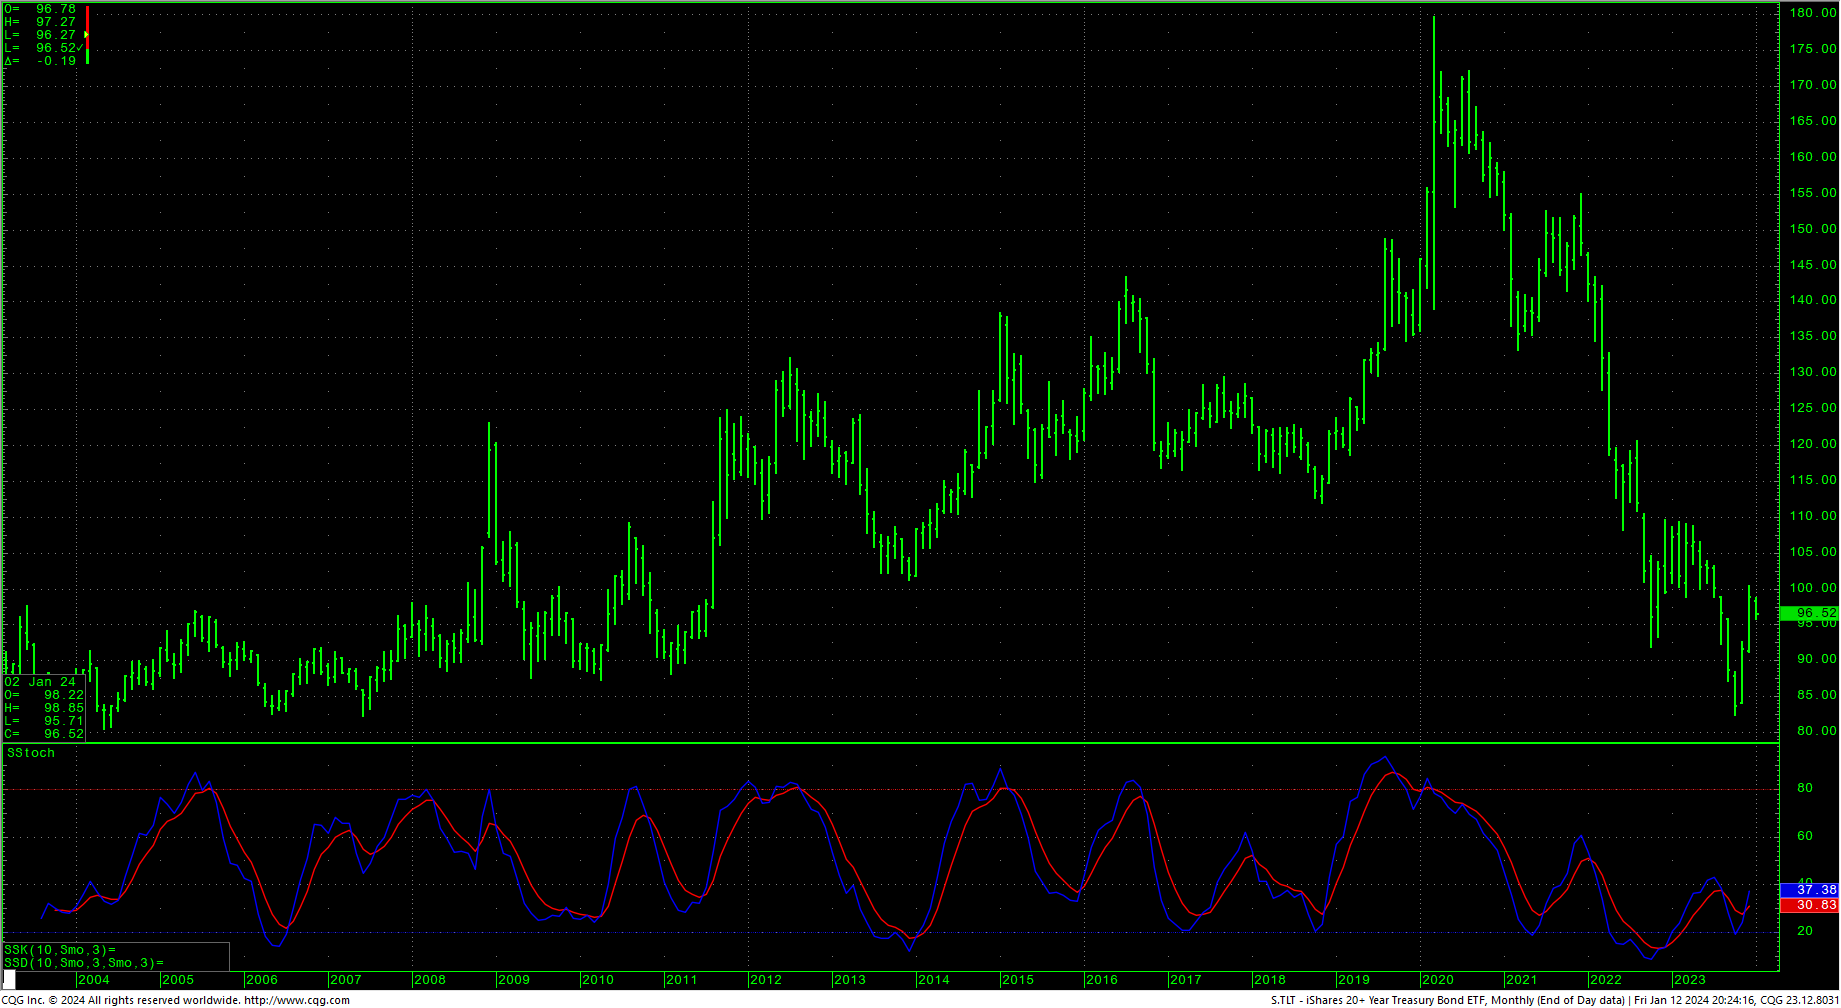
 Stocks continued the ‘running correction’ action that marks 2024 thus far with tech stocks leading the charge for the week. So far, the activity this year can be construed as bullish action that marks the end of the first impulse wave of this move. That said, the US stock market is running hot (The US is now 54% more expensive than the rest of the world…) compared to all other global markets and earnings are just starting to come out. The past week’s trade does little to the sentiment indicators as they remains mostly greed/extreme greed. Both the Dow and the S&P hit new intraday trading highs for this drive on Friday and both those markets have worked off the overbought condition on the daily charts with each trying to show a hook higher in the slow stochastics. The hourlies are neutral. The FANG hit a new record high as that index led all the markets for the week. The weeklies are all moving into overbought territory. Timing-wise, the critical timing of Monday-Tuesday was marked by some sharp volatility which made for great short-term options trading. Secondary markets continue to dog, following the larger trend of the past few years and the RSP/SPY took a big hit on the weekly chart. One chart being given a zombie rebirth in 2024 (particularly after the past week’s CPI report) is the “inverted yield curve” between the 2YR and 10YR. A few notes, the first is that the curve has been inverted since mid-2022, the second is that the chart looks to be forming an inverted H&S pattern that suggests the curve will turn positive again this year. Finally, it seems that if we learn anything from last year, it is that long held prediction tools have flopped tremendously and it does not seem smart to bank on what may become an outdated indicator in this new world. Also note that the TLT Monthly has a large bullish divergence on it and further trade above 100 should minimally test 105.38 and 109.68.
10Y2YS Yield Curve
 RSP/SPY Weekly
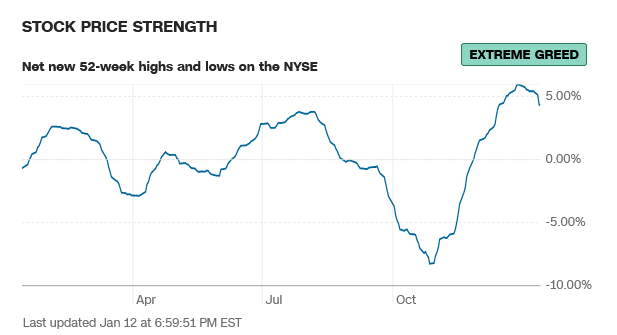
 52-Week A/D Line
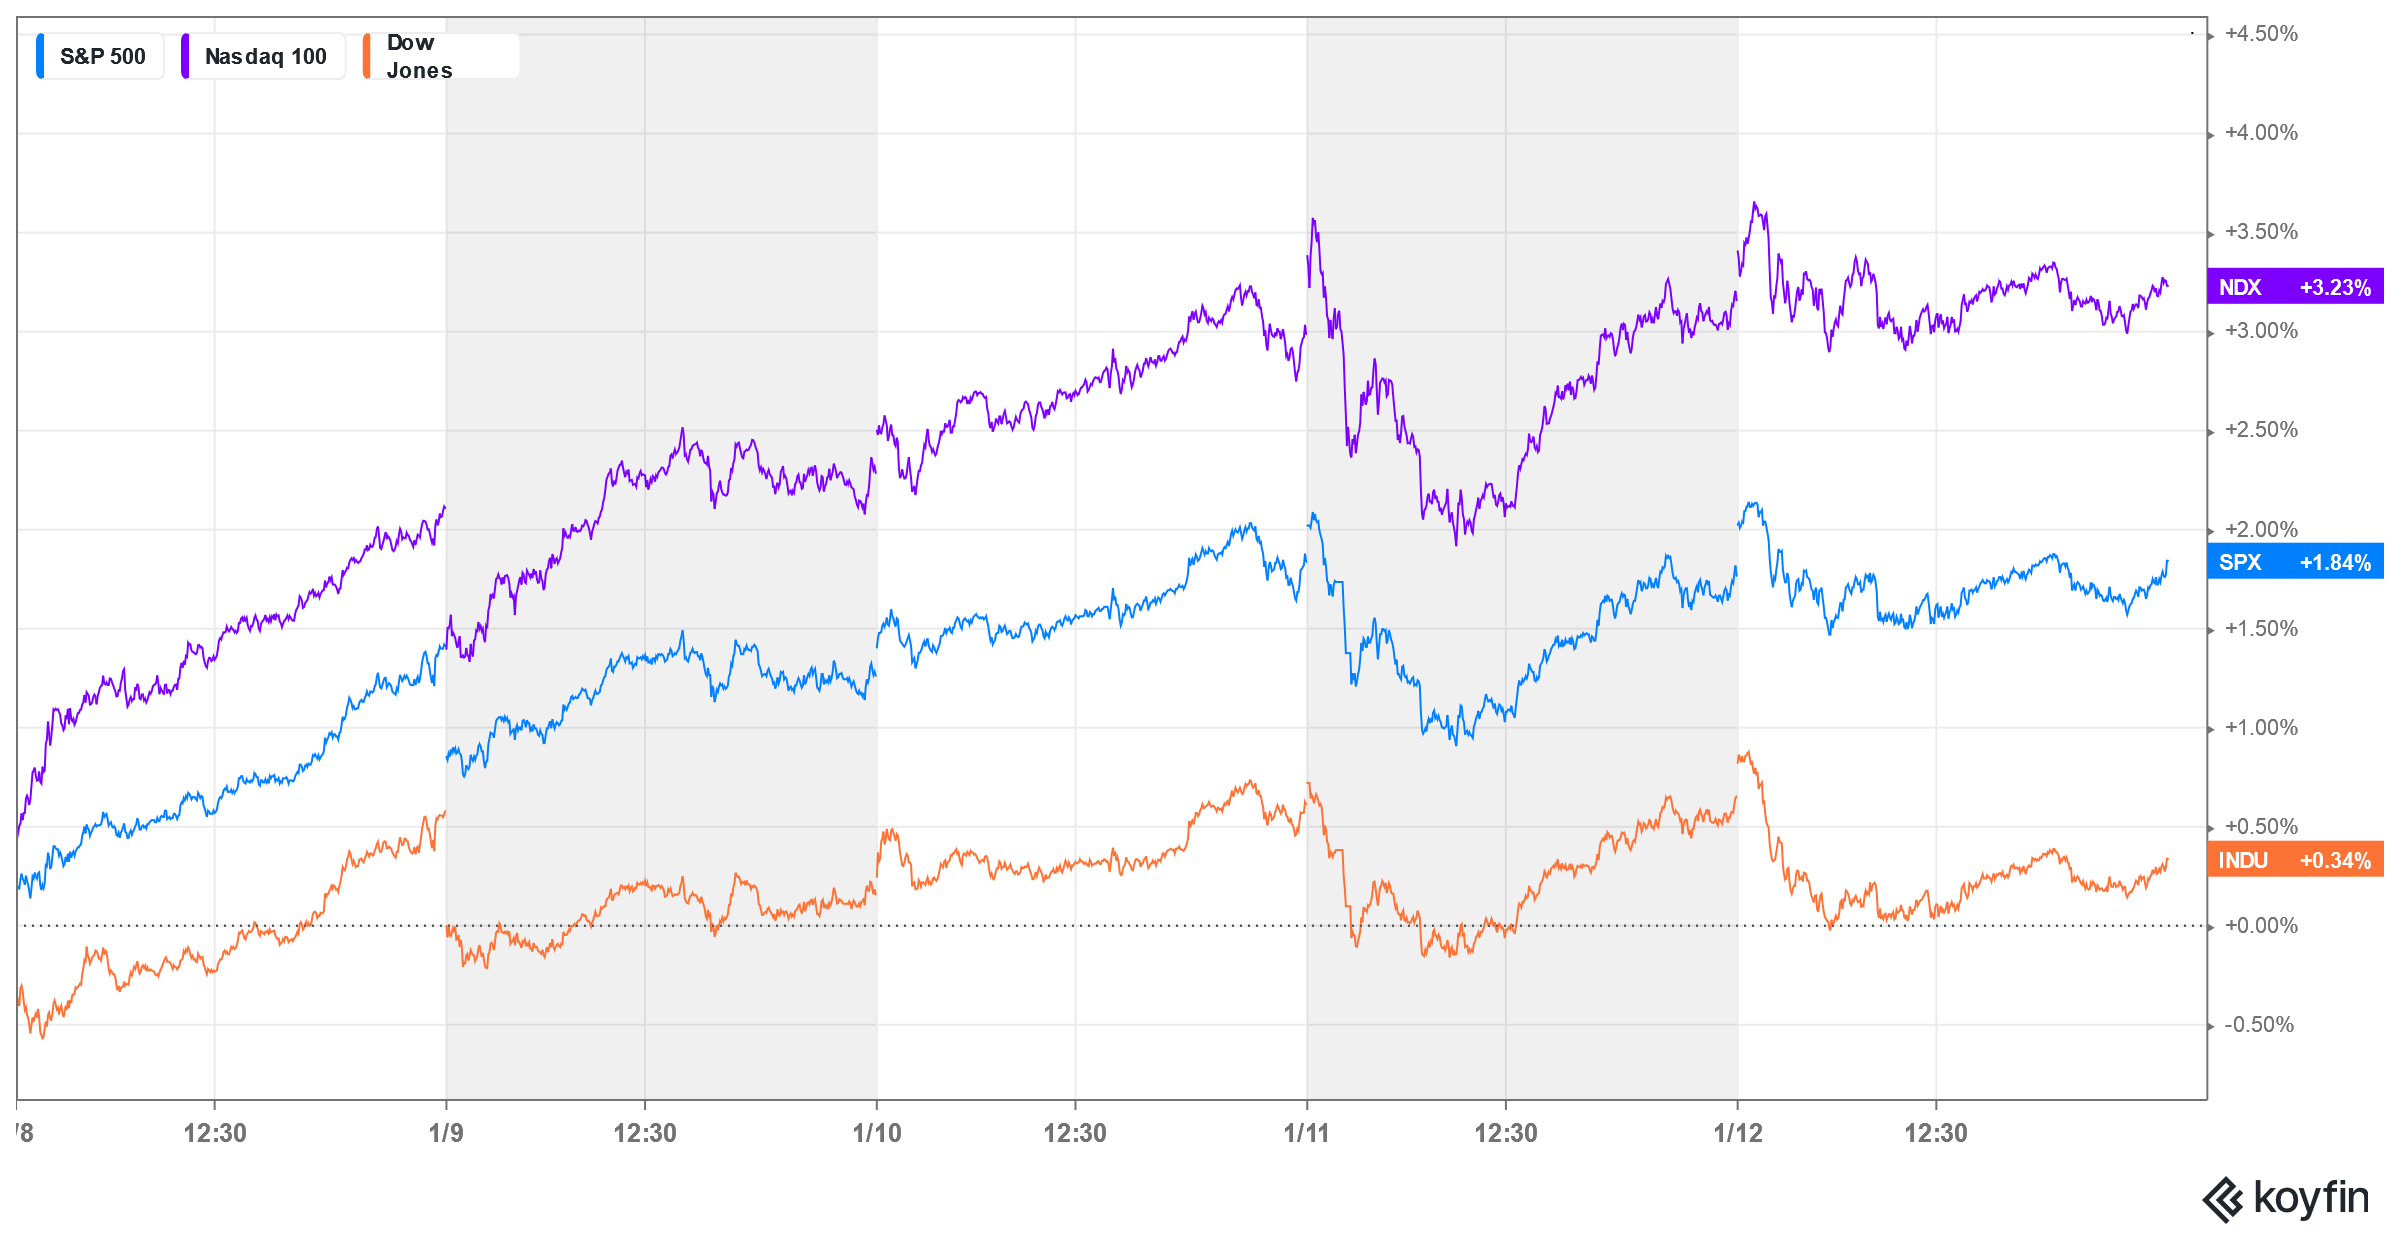
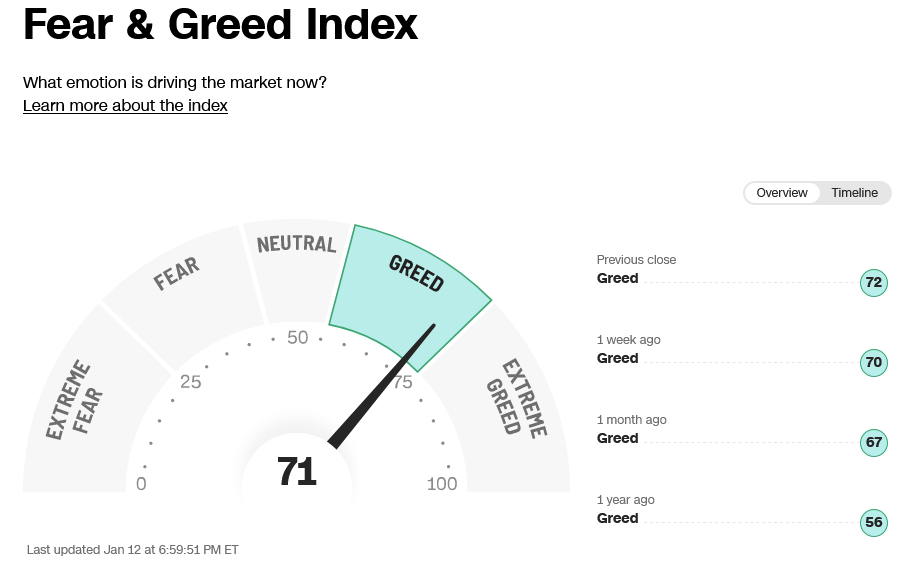
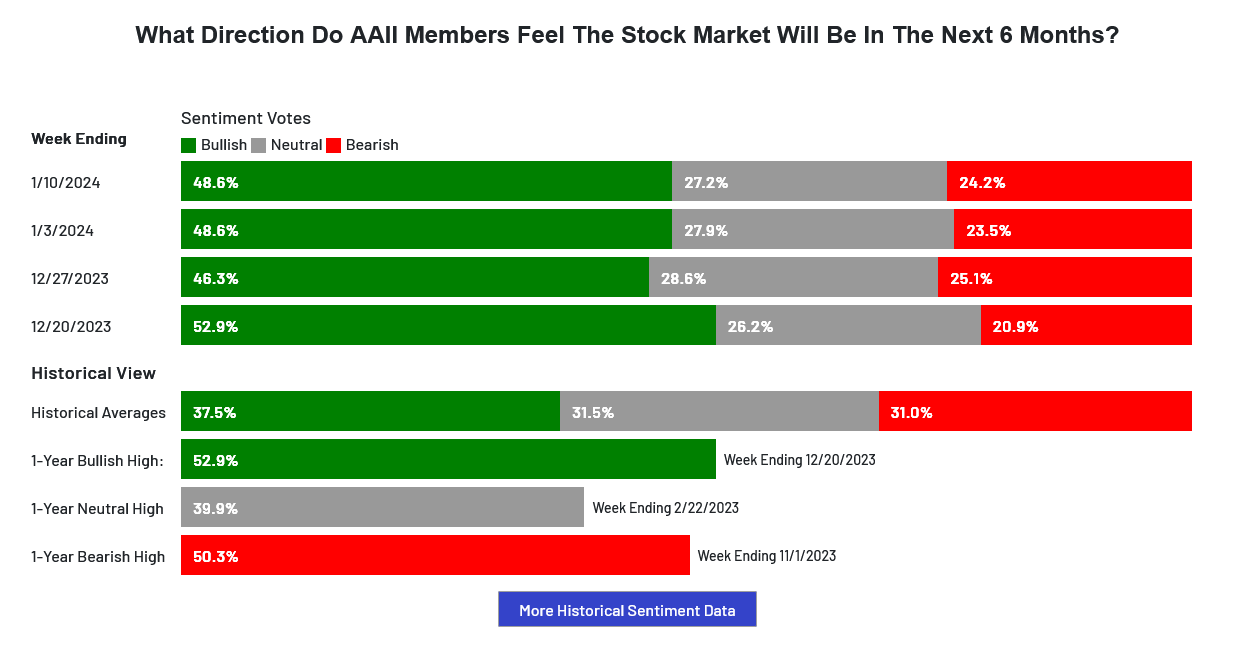
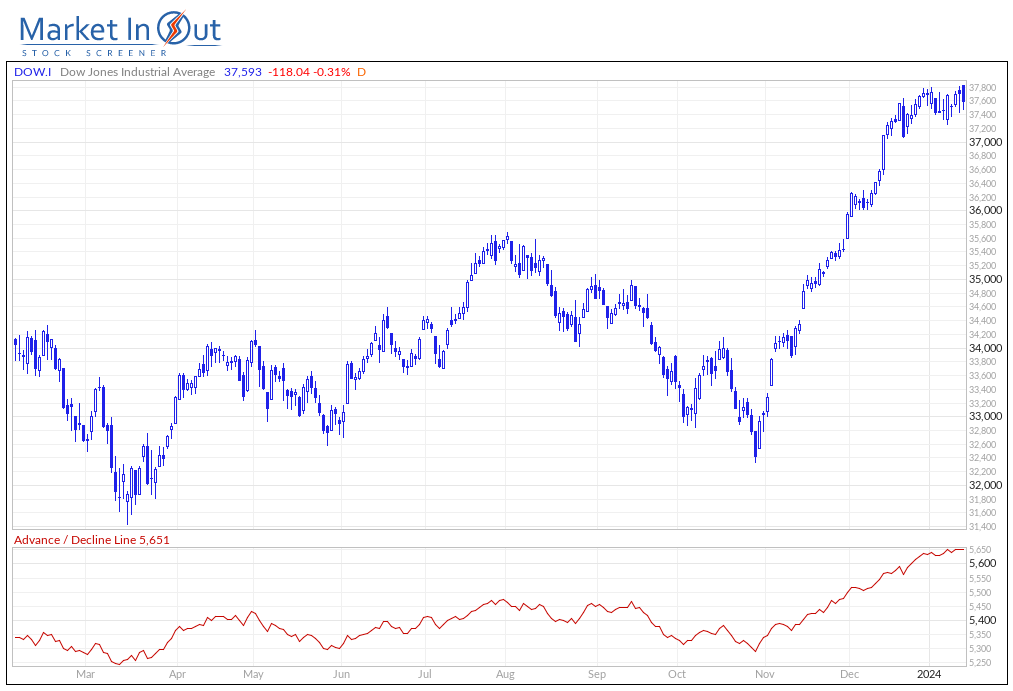
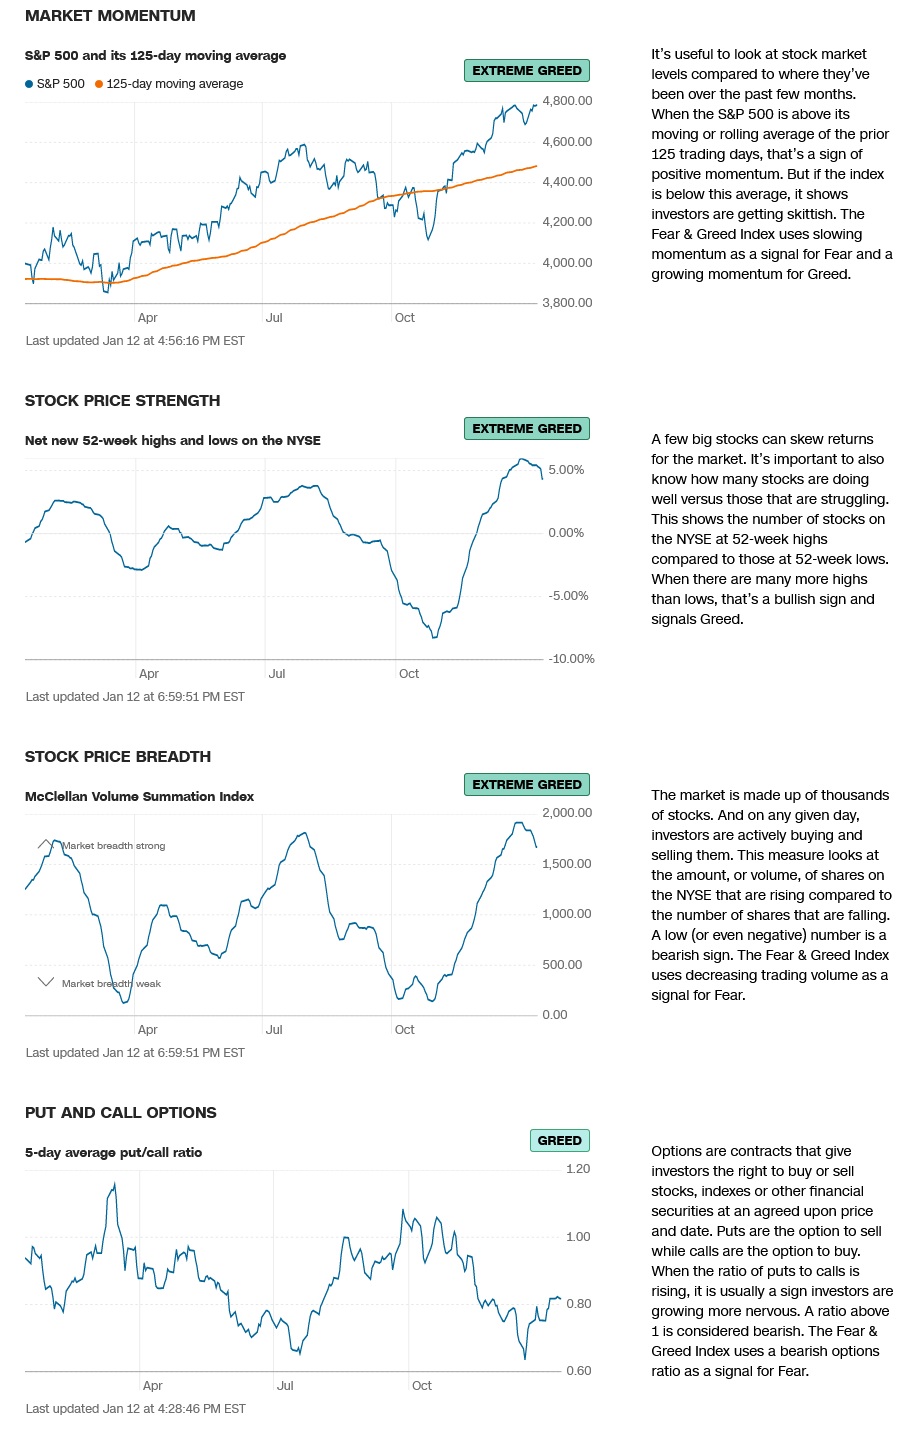
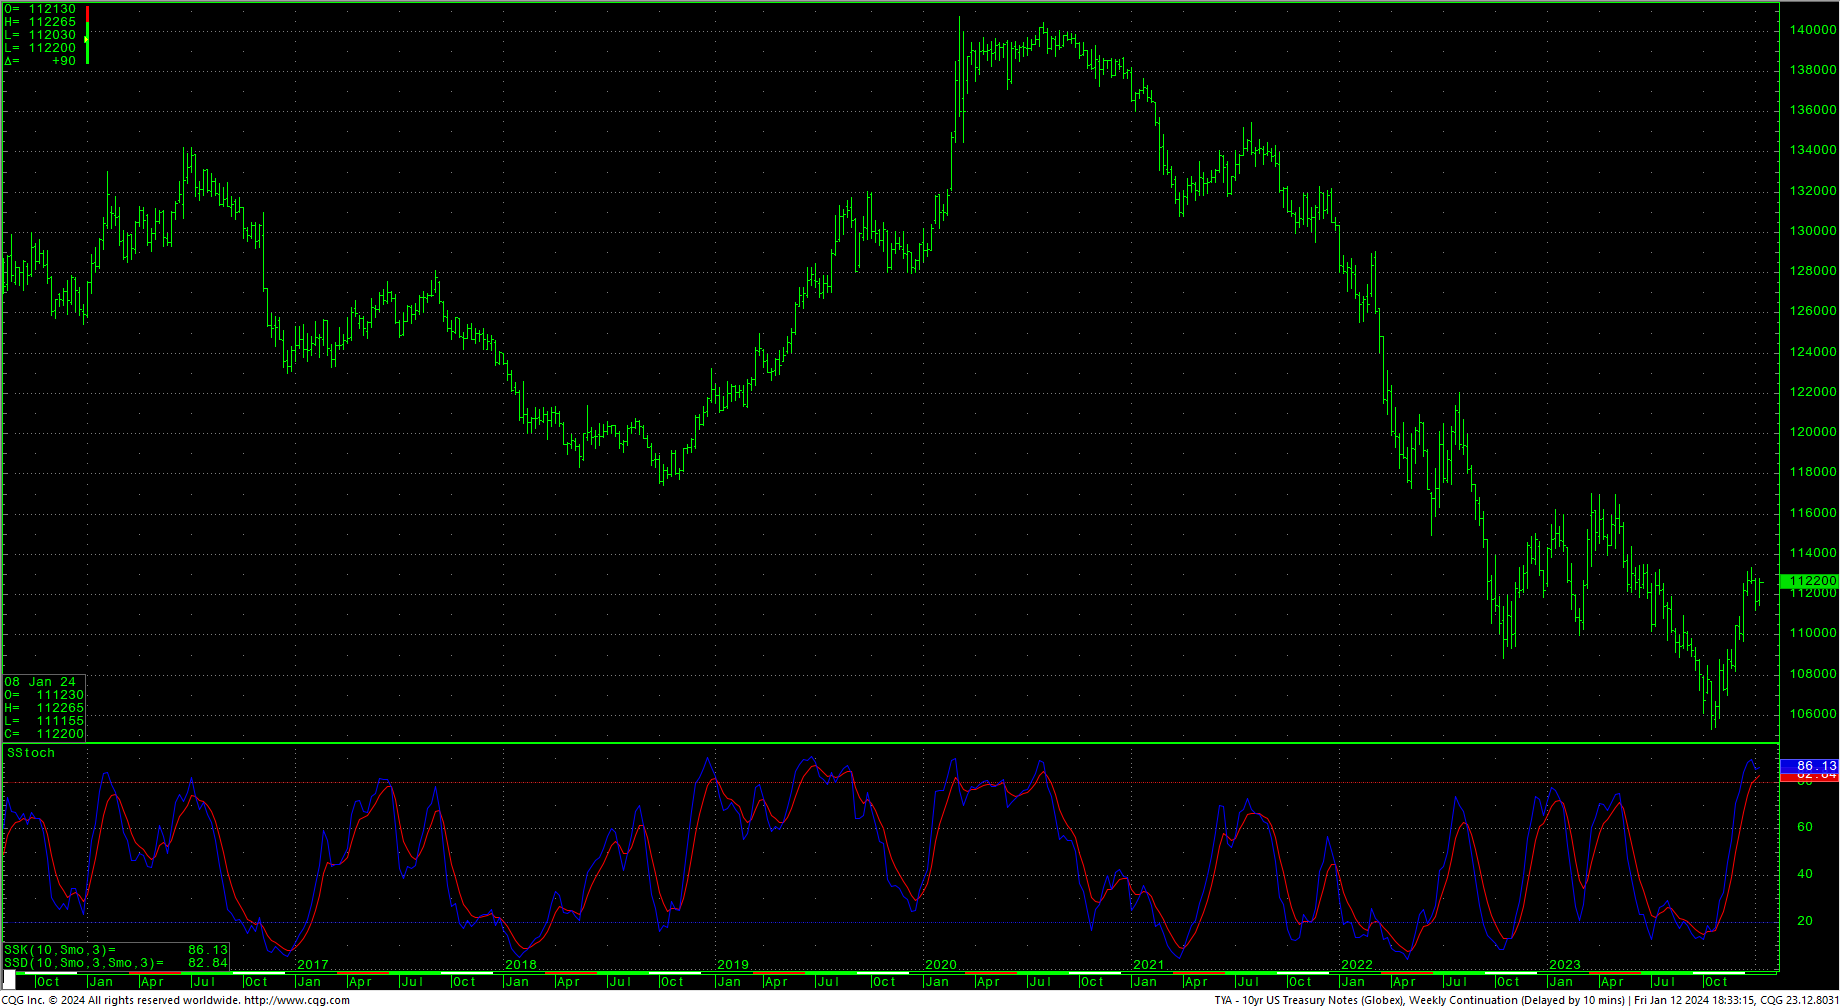
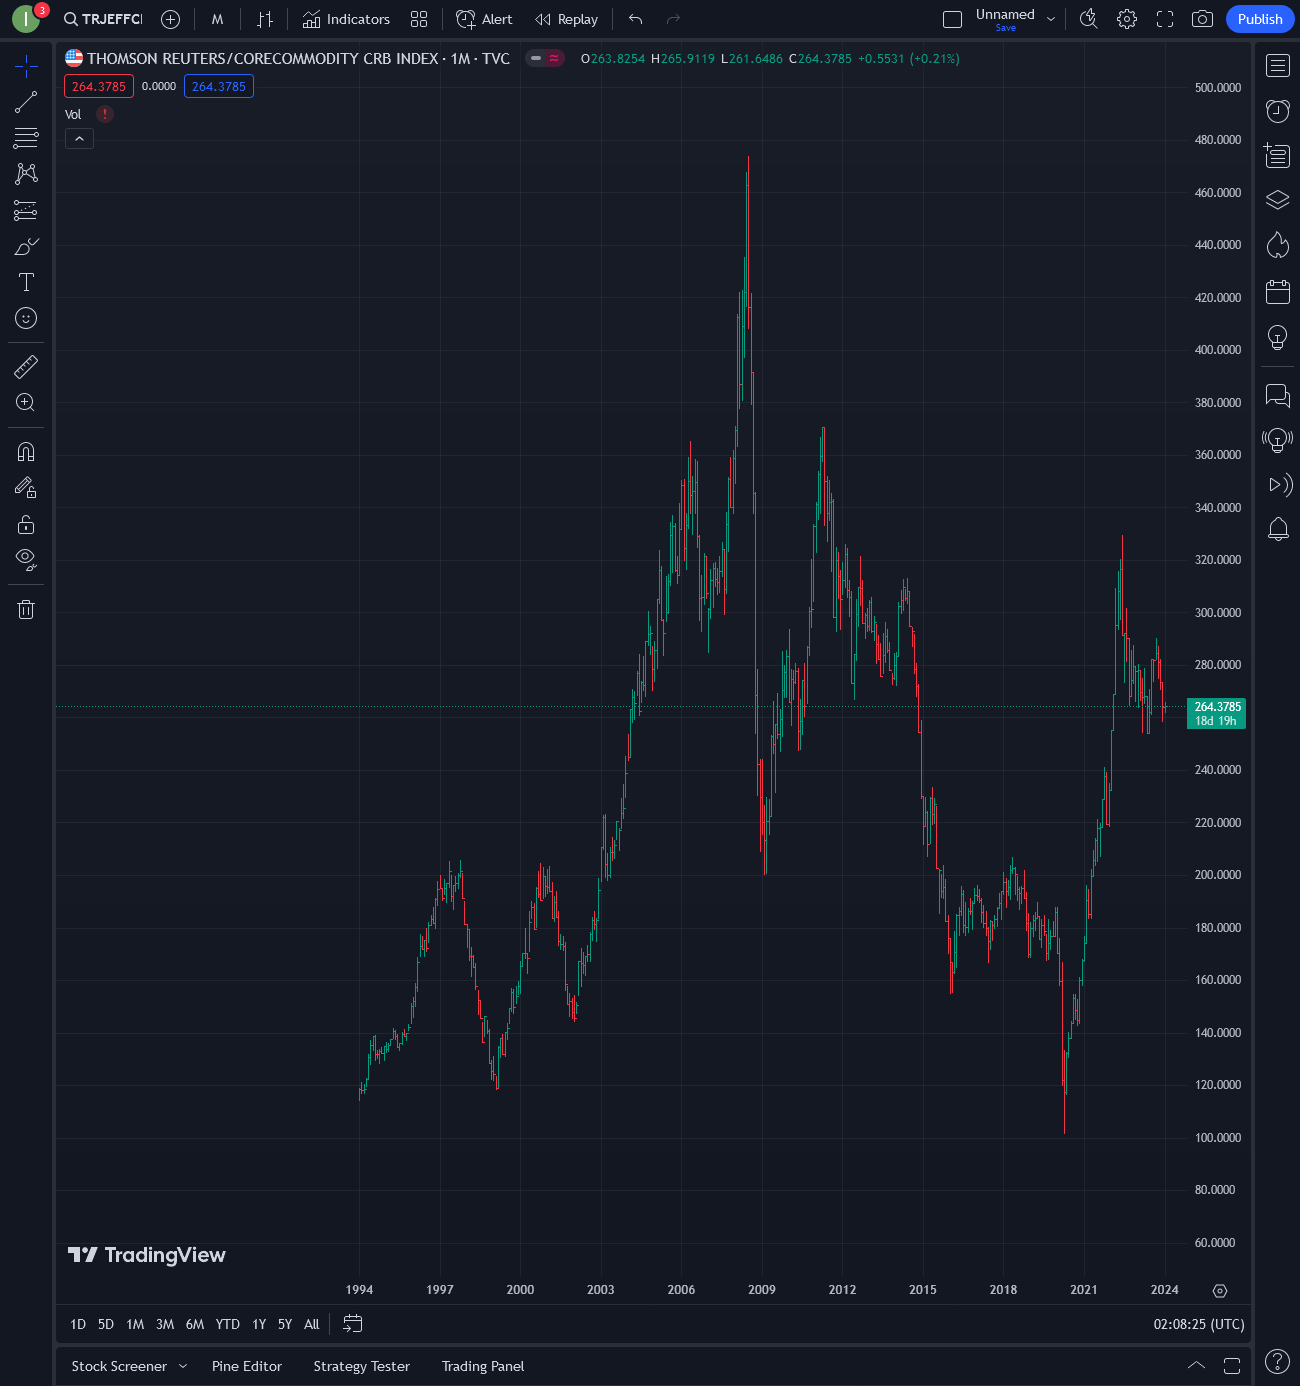
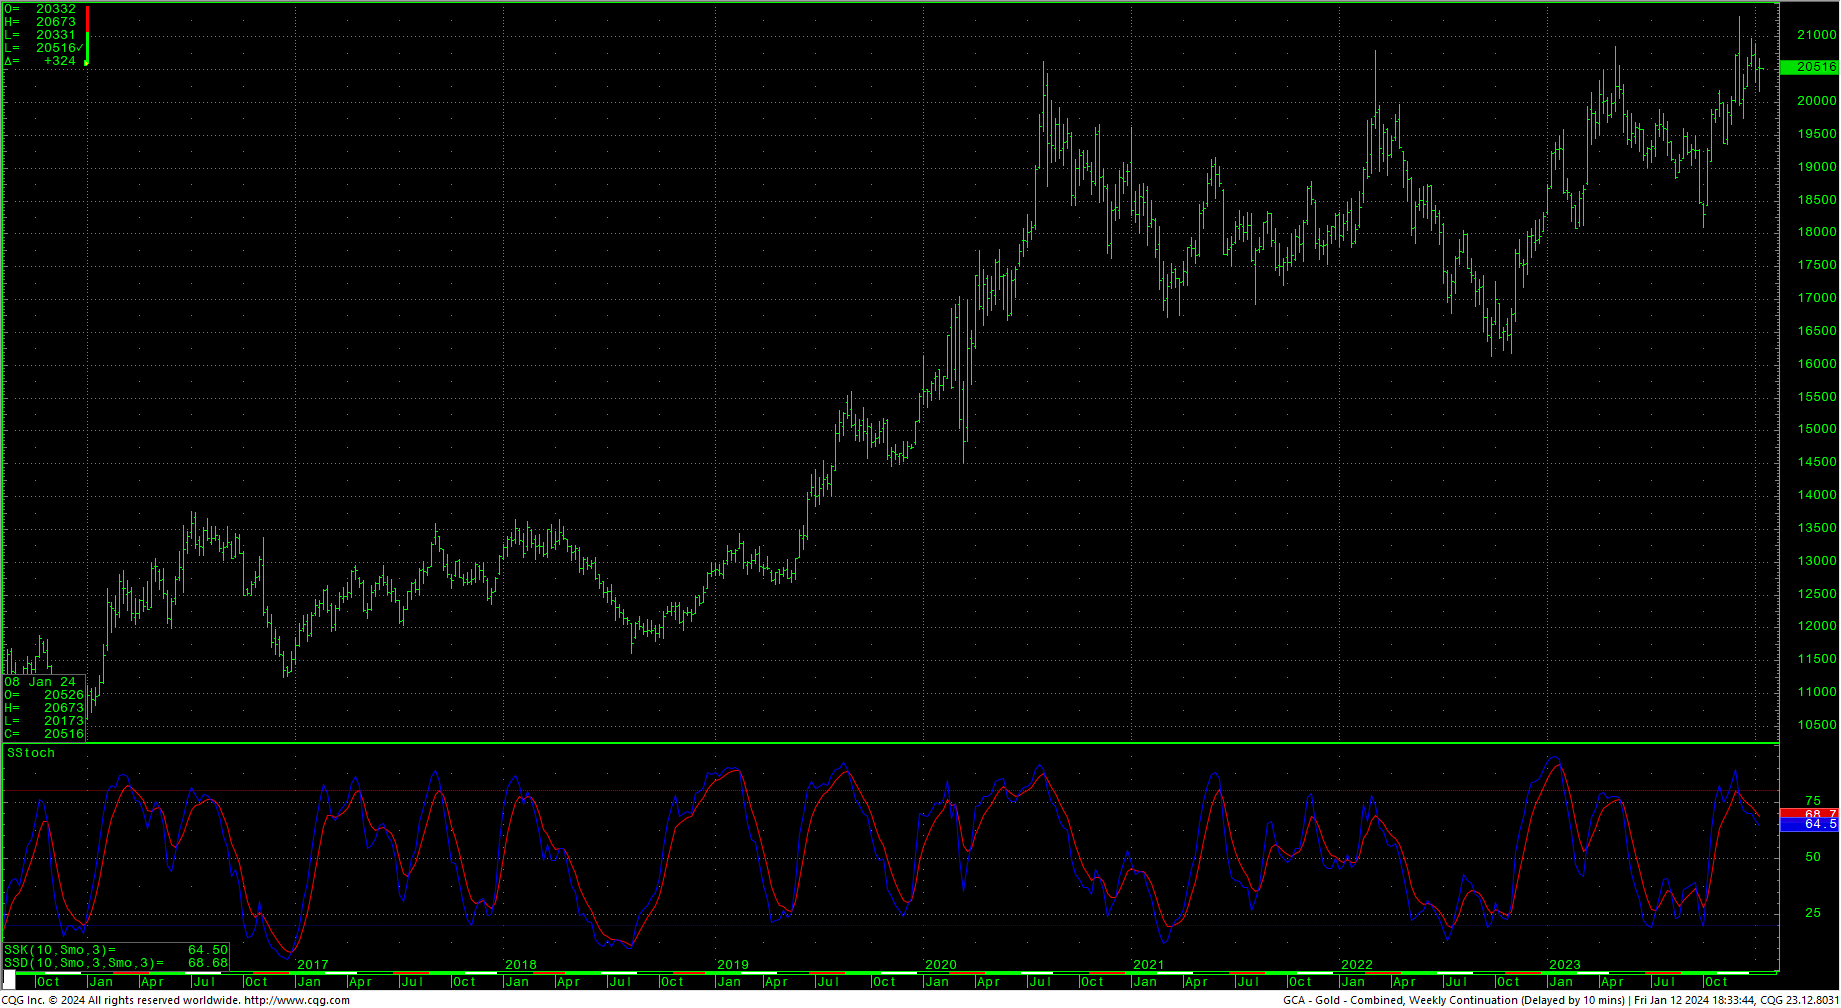
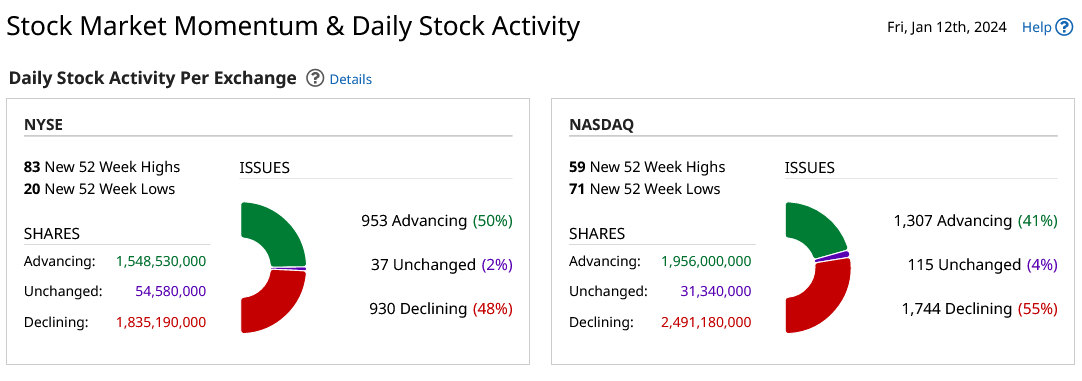 Sentiment indicators remain in greed/extreme greed readings and flattened out a bit last week. Last week in the AAII Sentiment Survey, Optimism Stays Flat. The Dow A/D line sits at 5651, a multi-year high. The VIX closed lower on the bottom of the week’s range. The Put/Call ratio stayed at 0.82, reflecting greed. The 52-week, A/D dropped to +4.35% which indicates extreme greed. The Dow closed the week up +0.34%. The S&P was up +1.84%. The Nasdaq ended the week up sharply, +3.02%, the FANG was sharply higher into record highs, up +4.02% and the Russell ended flat as it lags overall, settling -0.01% lower. The 10-year notes regained most of the previous week’s losses, see the most recent Special Report. The CRB was down -0.47%…crude oil closed slightly lower in the middle of the week’s range, gold settled fractionally higher in the upper half of the range and grains sold off hard. The CoT saw commercials selling while speculators and asset managers continued buying with dealers selling.
Timing Points
The next timing point is this Tuesday. The next critical timing is January 23-24.
- 01/16 **
- 01/23-24 *** X Key week for financials
CNN Fear & Greed Index
 AAII Investor Sentiment Survey
 Dow Jones Industrial Average Hourly HLC
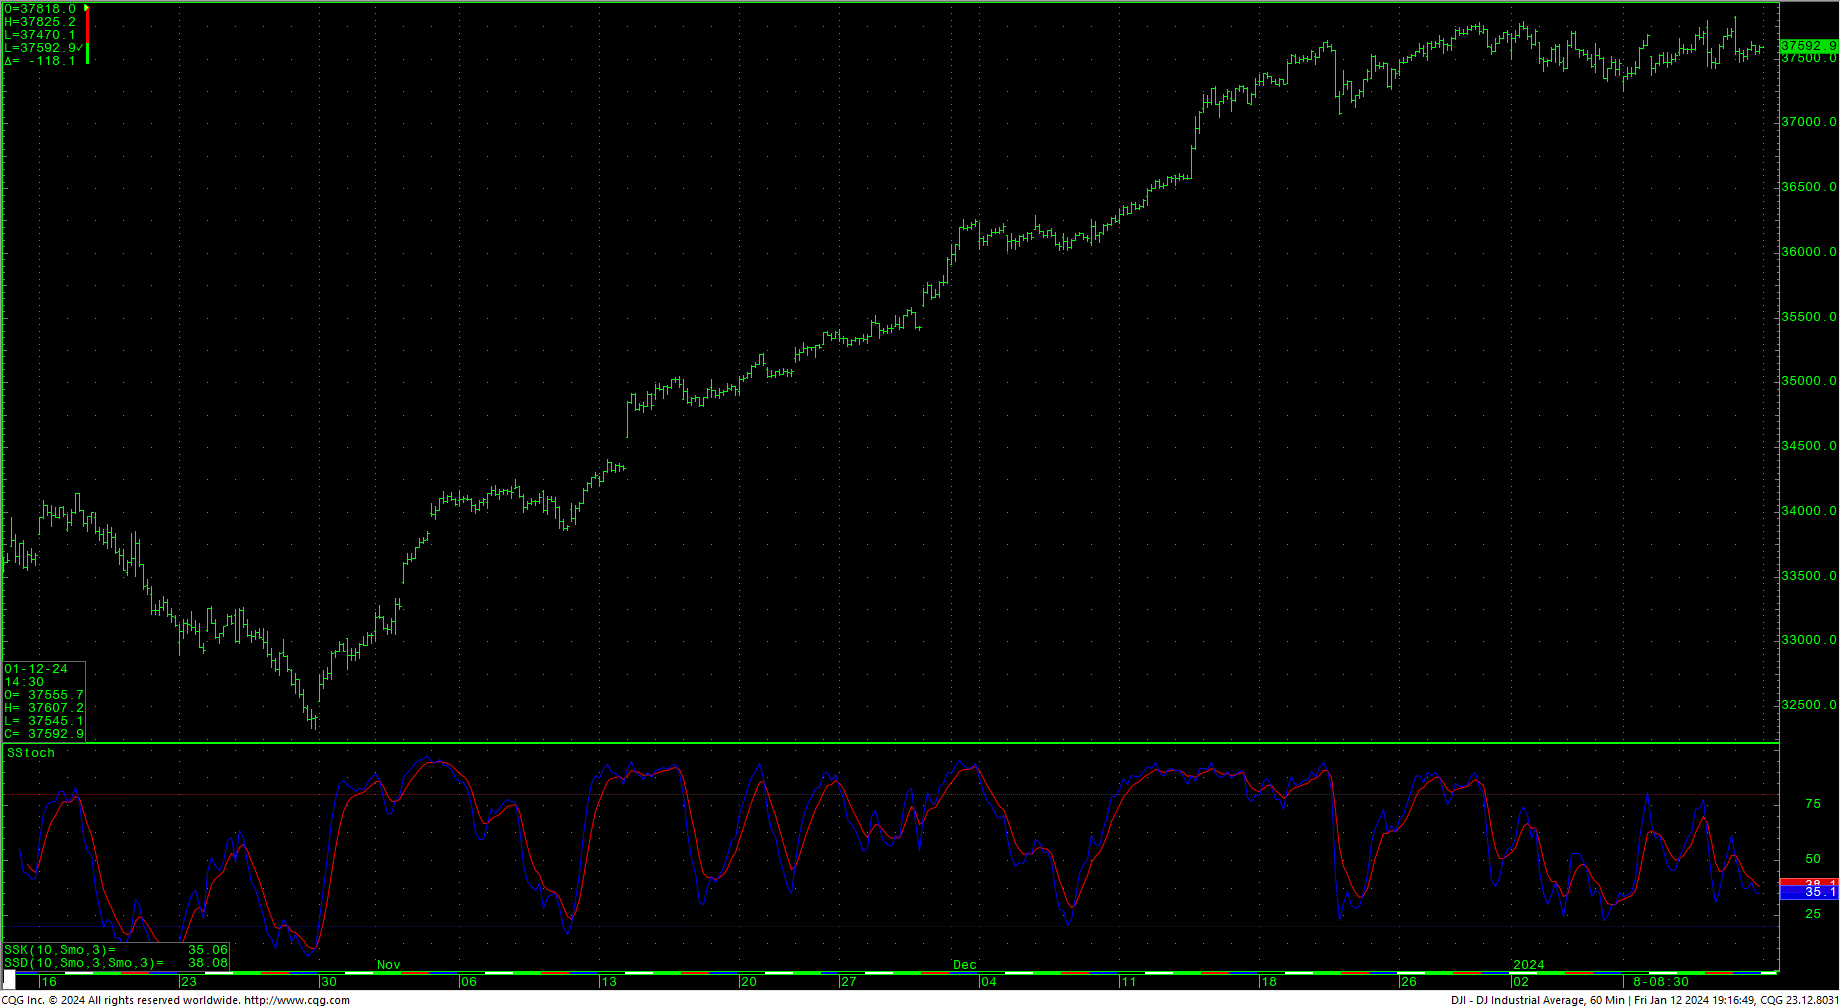 The Dow hourly ended the week in neutral territory with prices continuing a congestion-type ‘correction’ off to the side of the recent record highs. Resistance is 37605, 37647 and 37689/37692. A drive above 37692 should minimally test 37736 with potential to 37825. A breakout rally over 37825 should renew momentum toward the upside targets of 38378.5 and 38454.7. Closes over 38454.7 suggest a move to long-term targets at 37095. Closes over 37095 offer counts to targets at 40245.4.
Support is at 37470 and 37323. Under 37323 can carry to 37016. Closes under 37016 setup 36769 and pivotal near-term support of 36522/36518. Closes under 36518 opens counts toward 35724. A breakdown under 35724 can carry to 35076 with potential to critical short-term support of 34427/34420 through 34324. Closes below 34324 open counts to 33955 with potential to 33243. Closes under 33243 open counts to critical long-term support of 32161/32155 with support at 32327. A breakdown with closes under 32155 is bearish and opens counts into the 31565/31555 area.
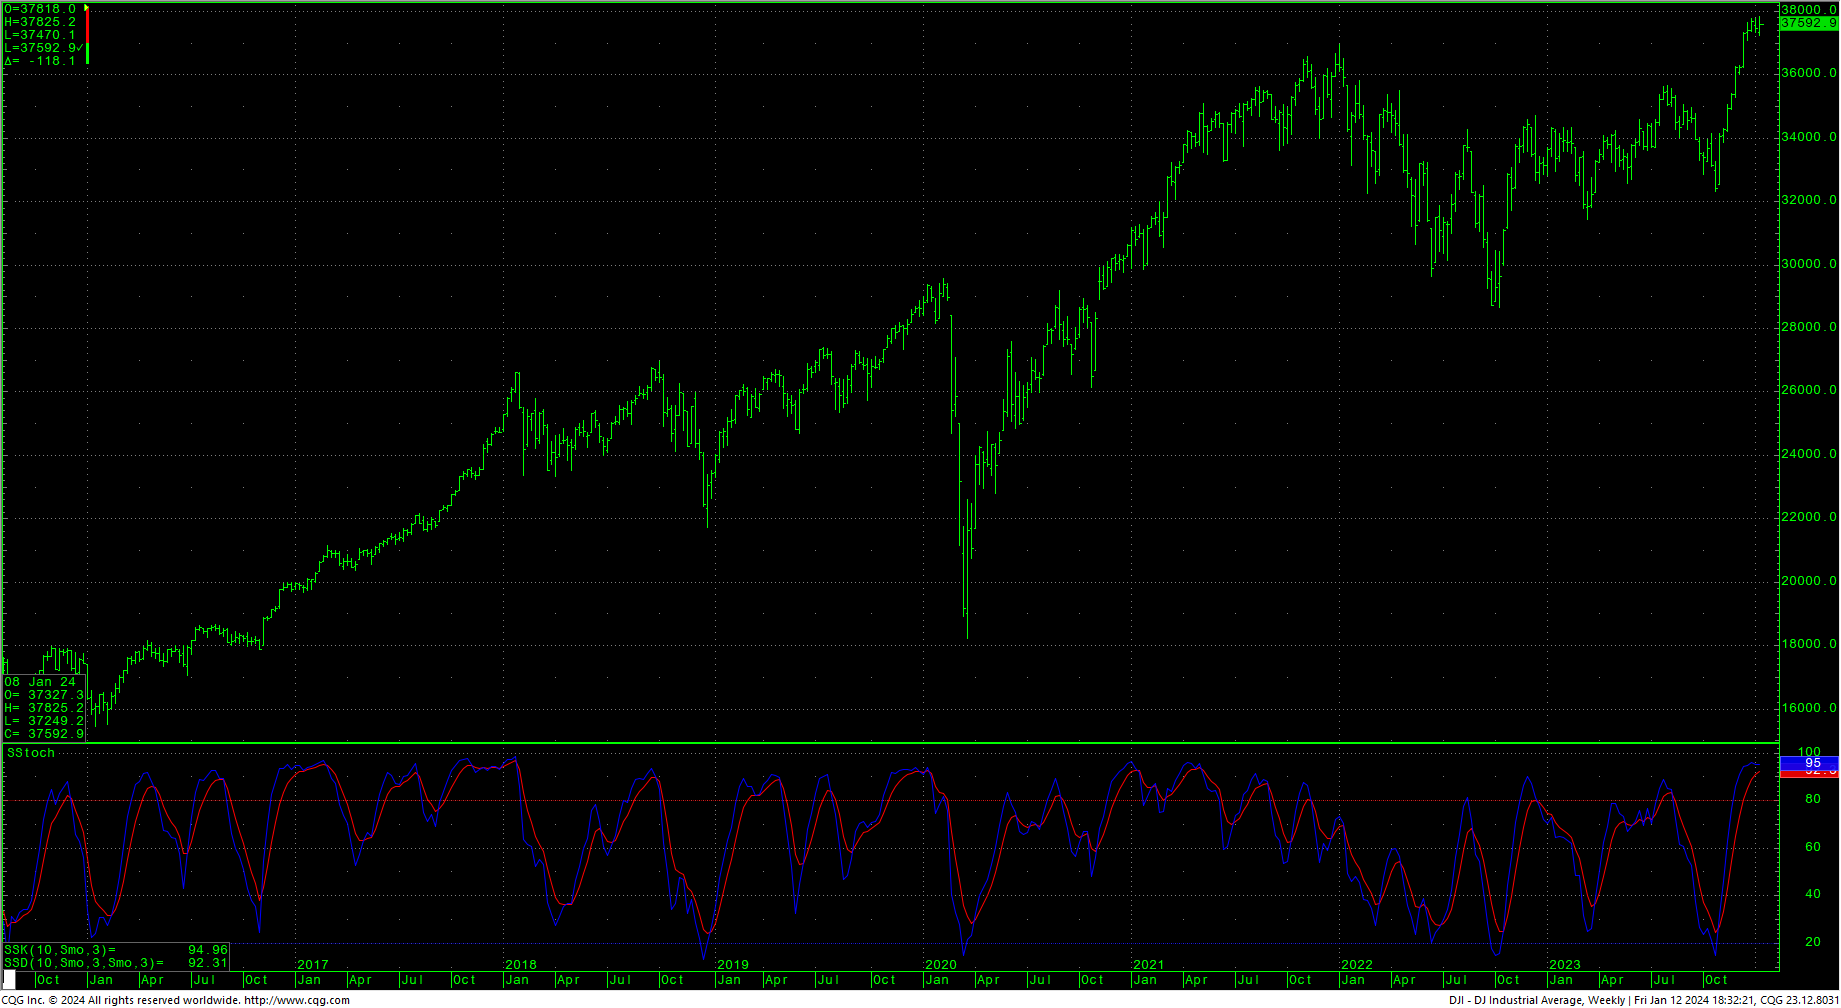
Dow Jones Industrial Average Weekly HLC
Resistance
|
Support
|
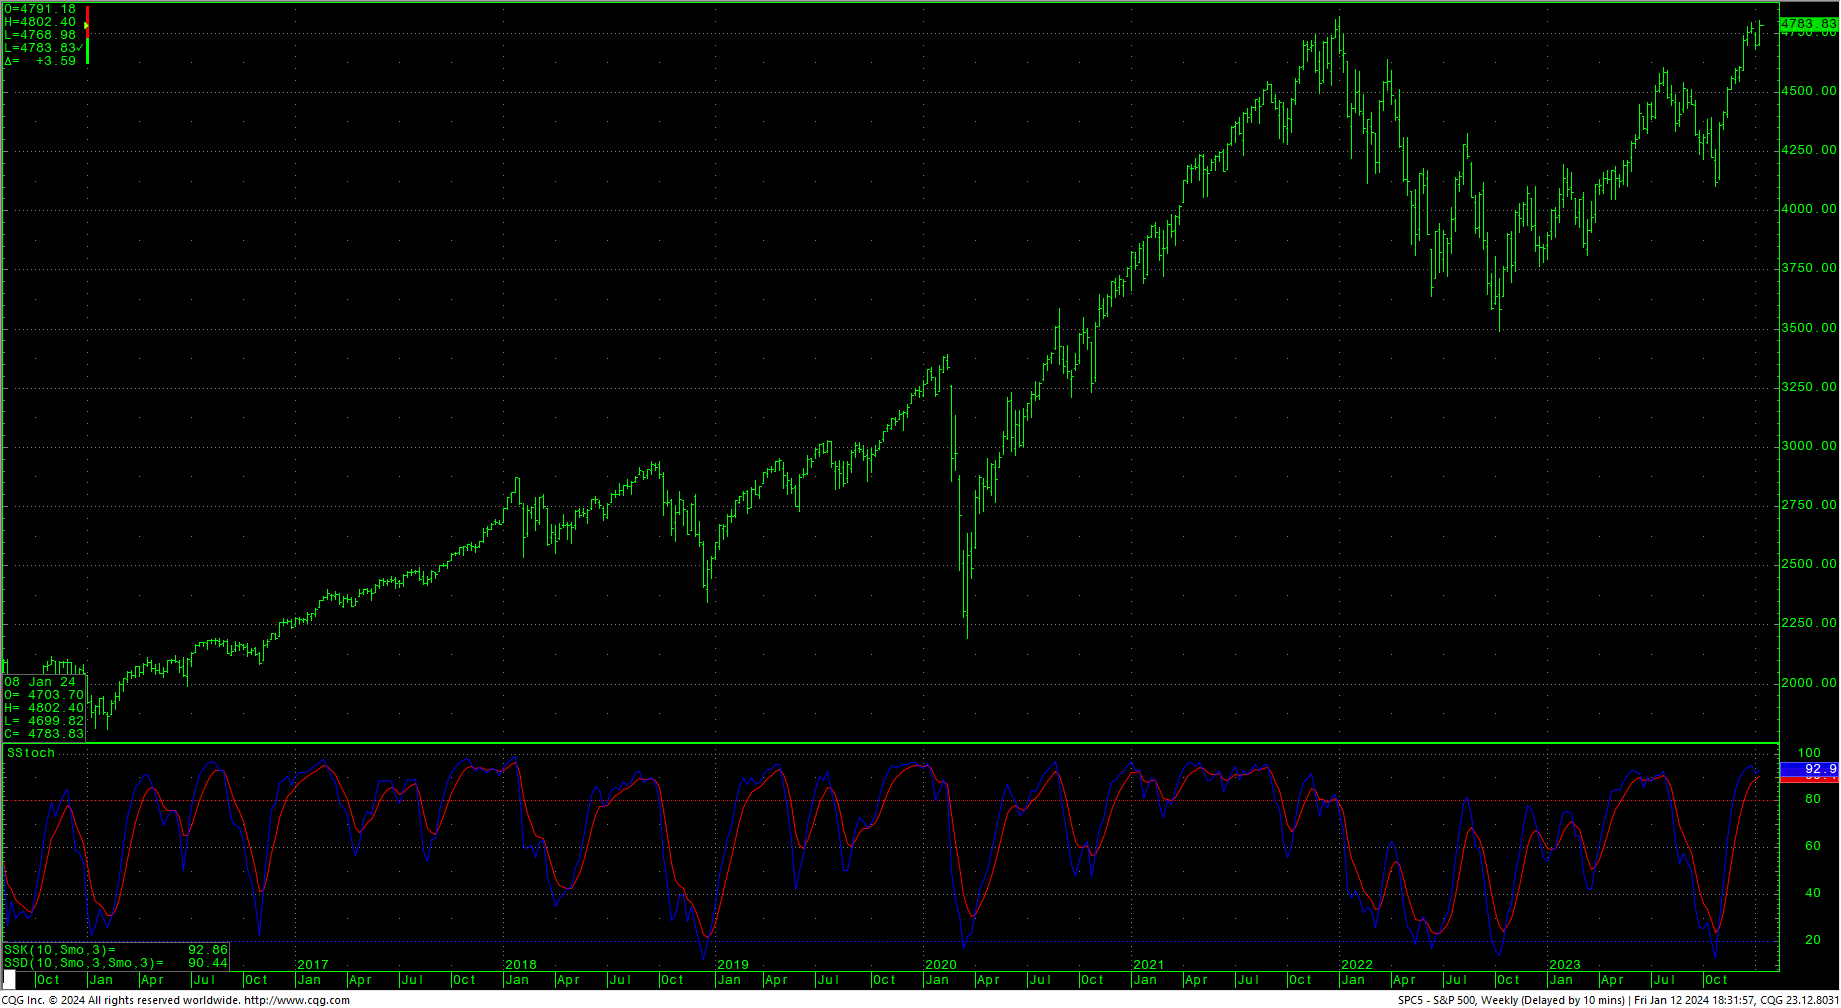
S&P 500 Cash Index
The S&P hourly is neutral on Friday’s close. The market set a new intraday trading high on Friday above the key psychological mark at 4800. Again, until proven otherwise, the running correction should be construed as bullish here. Resistance is 4789/4791. Rallies over 4791 should retest 4802 with a shot at the record intraday highs at 4818.62. Closes above 4818/4819 opens counts to 4952/5000 with potential to 5144. Closes over 5144 set up a drive to 5288 with counts to 5432. A breakout over 5432 will open potential to the 5720 area.
Support is at 4768 and 4739. A breakdown with closes under 4739 sets up a move to 4701/4700. Closes under 4700 suggest 4669 with potential to 4638/4635. A breakdown under 4635 should test 4535. Daily closes under 4535 counts to 4453 with potential to critical short-term support of 4370/4365. Daily closes under 4365 set up a move to 4301 with potential to support at 4146 through 4102. Daily closes under 4102 open counts to critical long-term support of 3992/3985.
S&P 500 Index Weekly HLC
Resistance
|
Support
|