
TECHNICAL ANALYSIS from Intraday Dynamics
Spot Soybeans Monthly Continuation
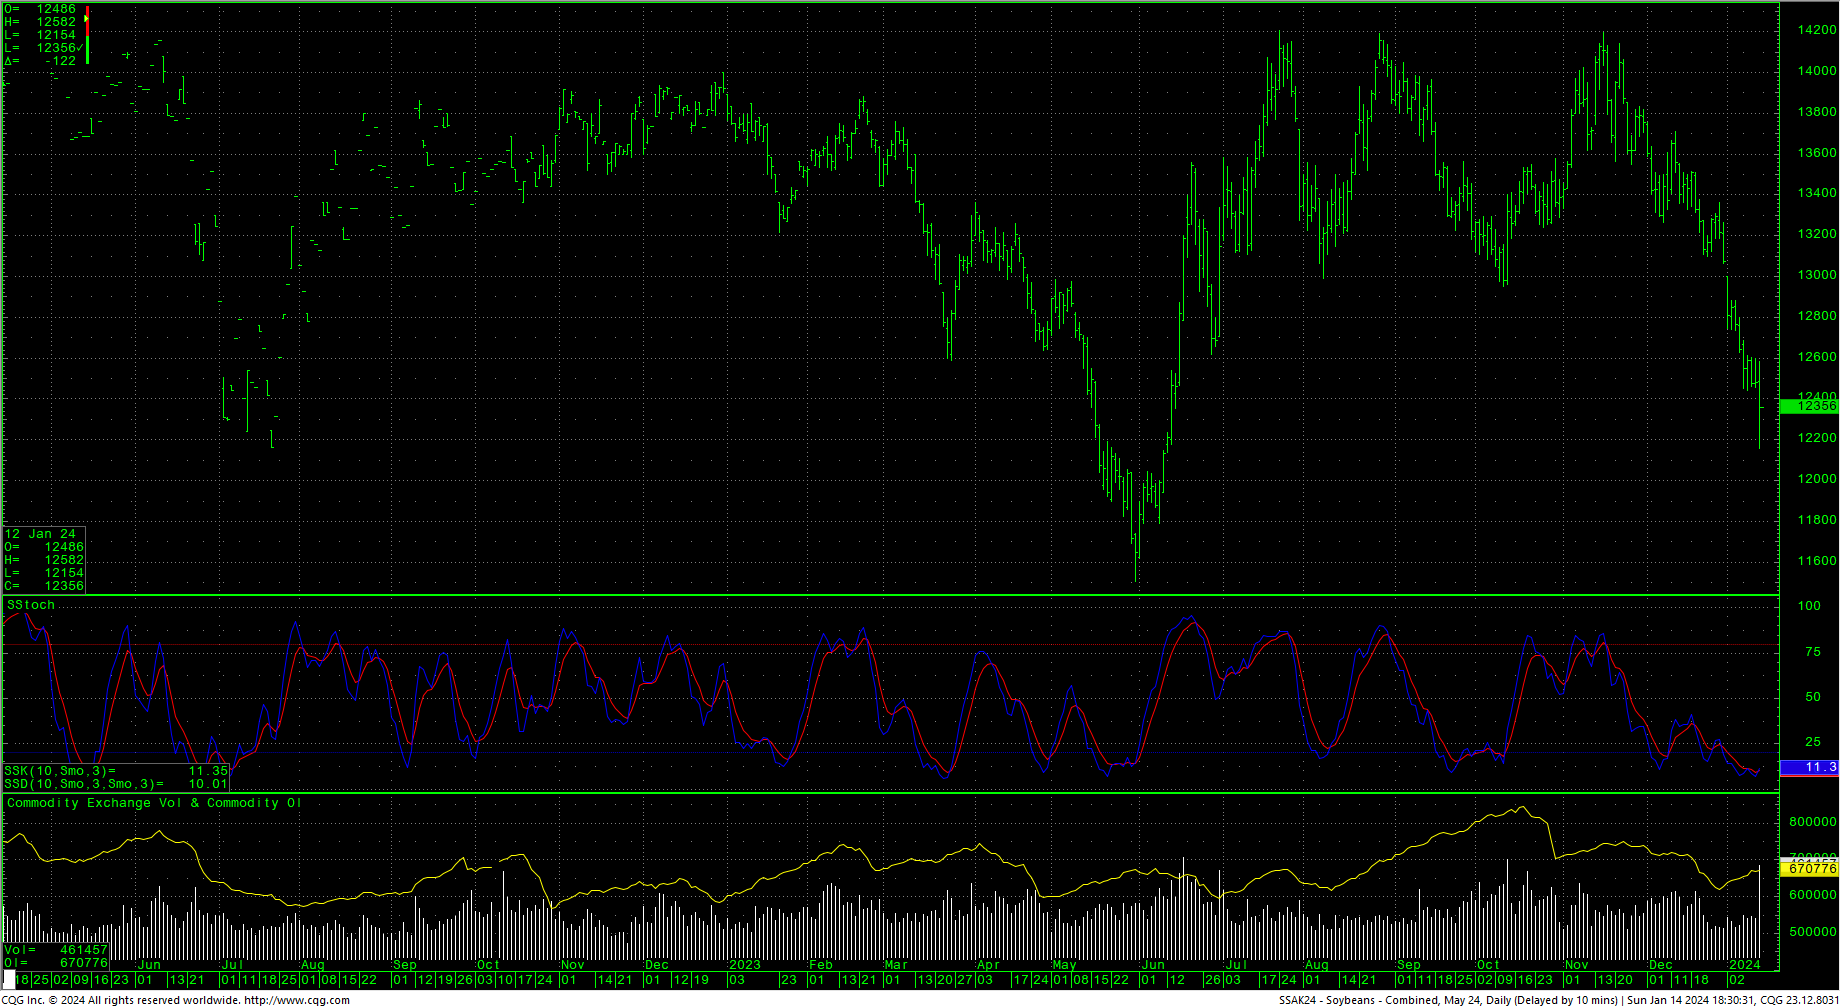
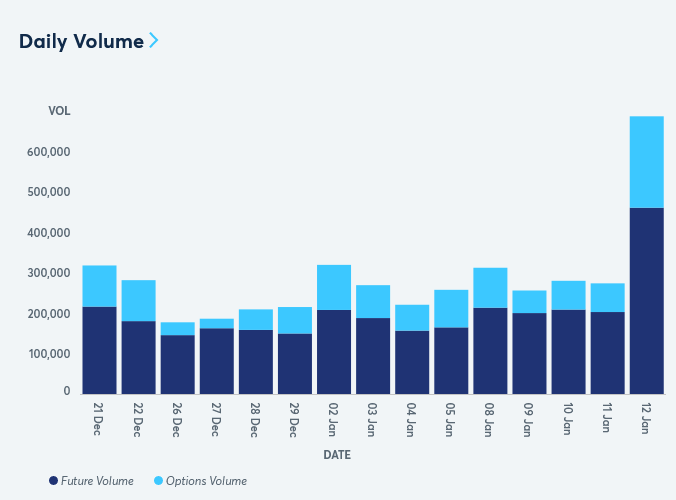
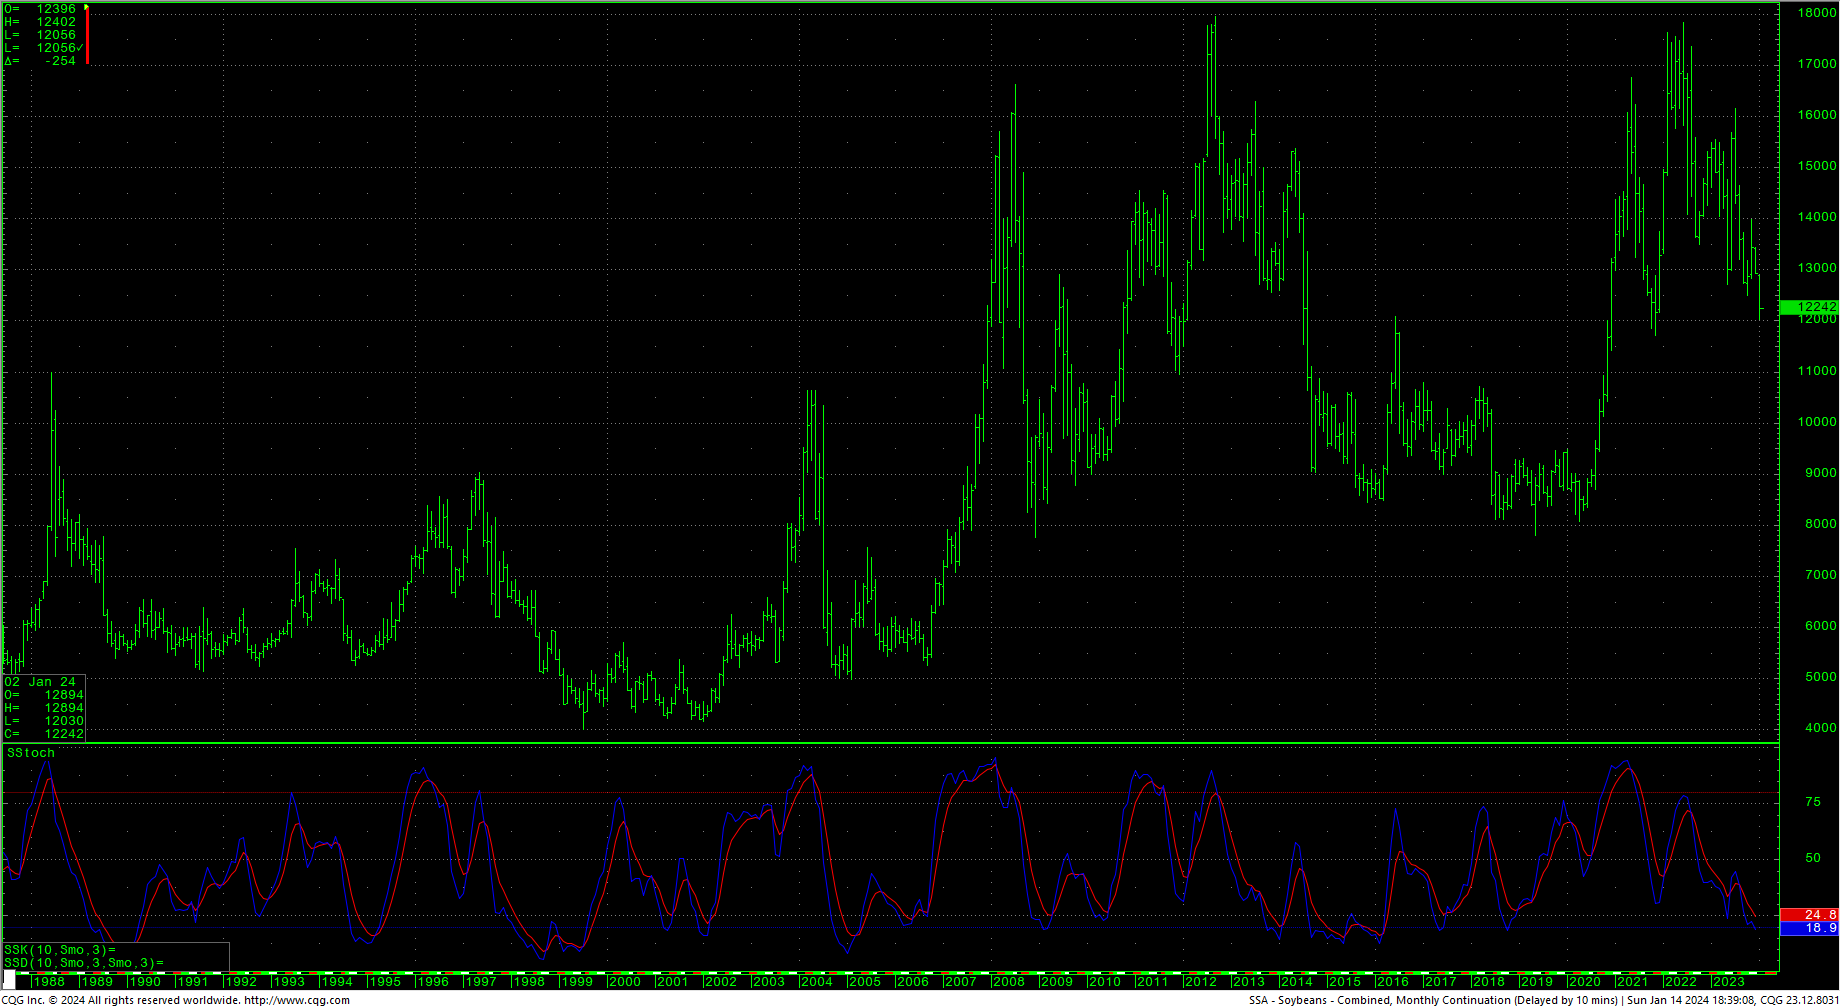 Soybeans have started the year with a sharp selloff that has carried spot prices to the lowest level since November of 2021. For this analysis, we will be primarily focused on the May24 soybeans, SK4. The monthly chart is drifting into oversold conditions. The same can be said for the weekly charts. The SK4 daily is showing oversold conditions and last Friday’s large trading range to new technical lows came with a big jump in volume.
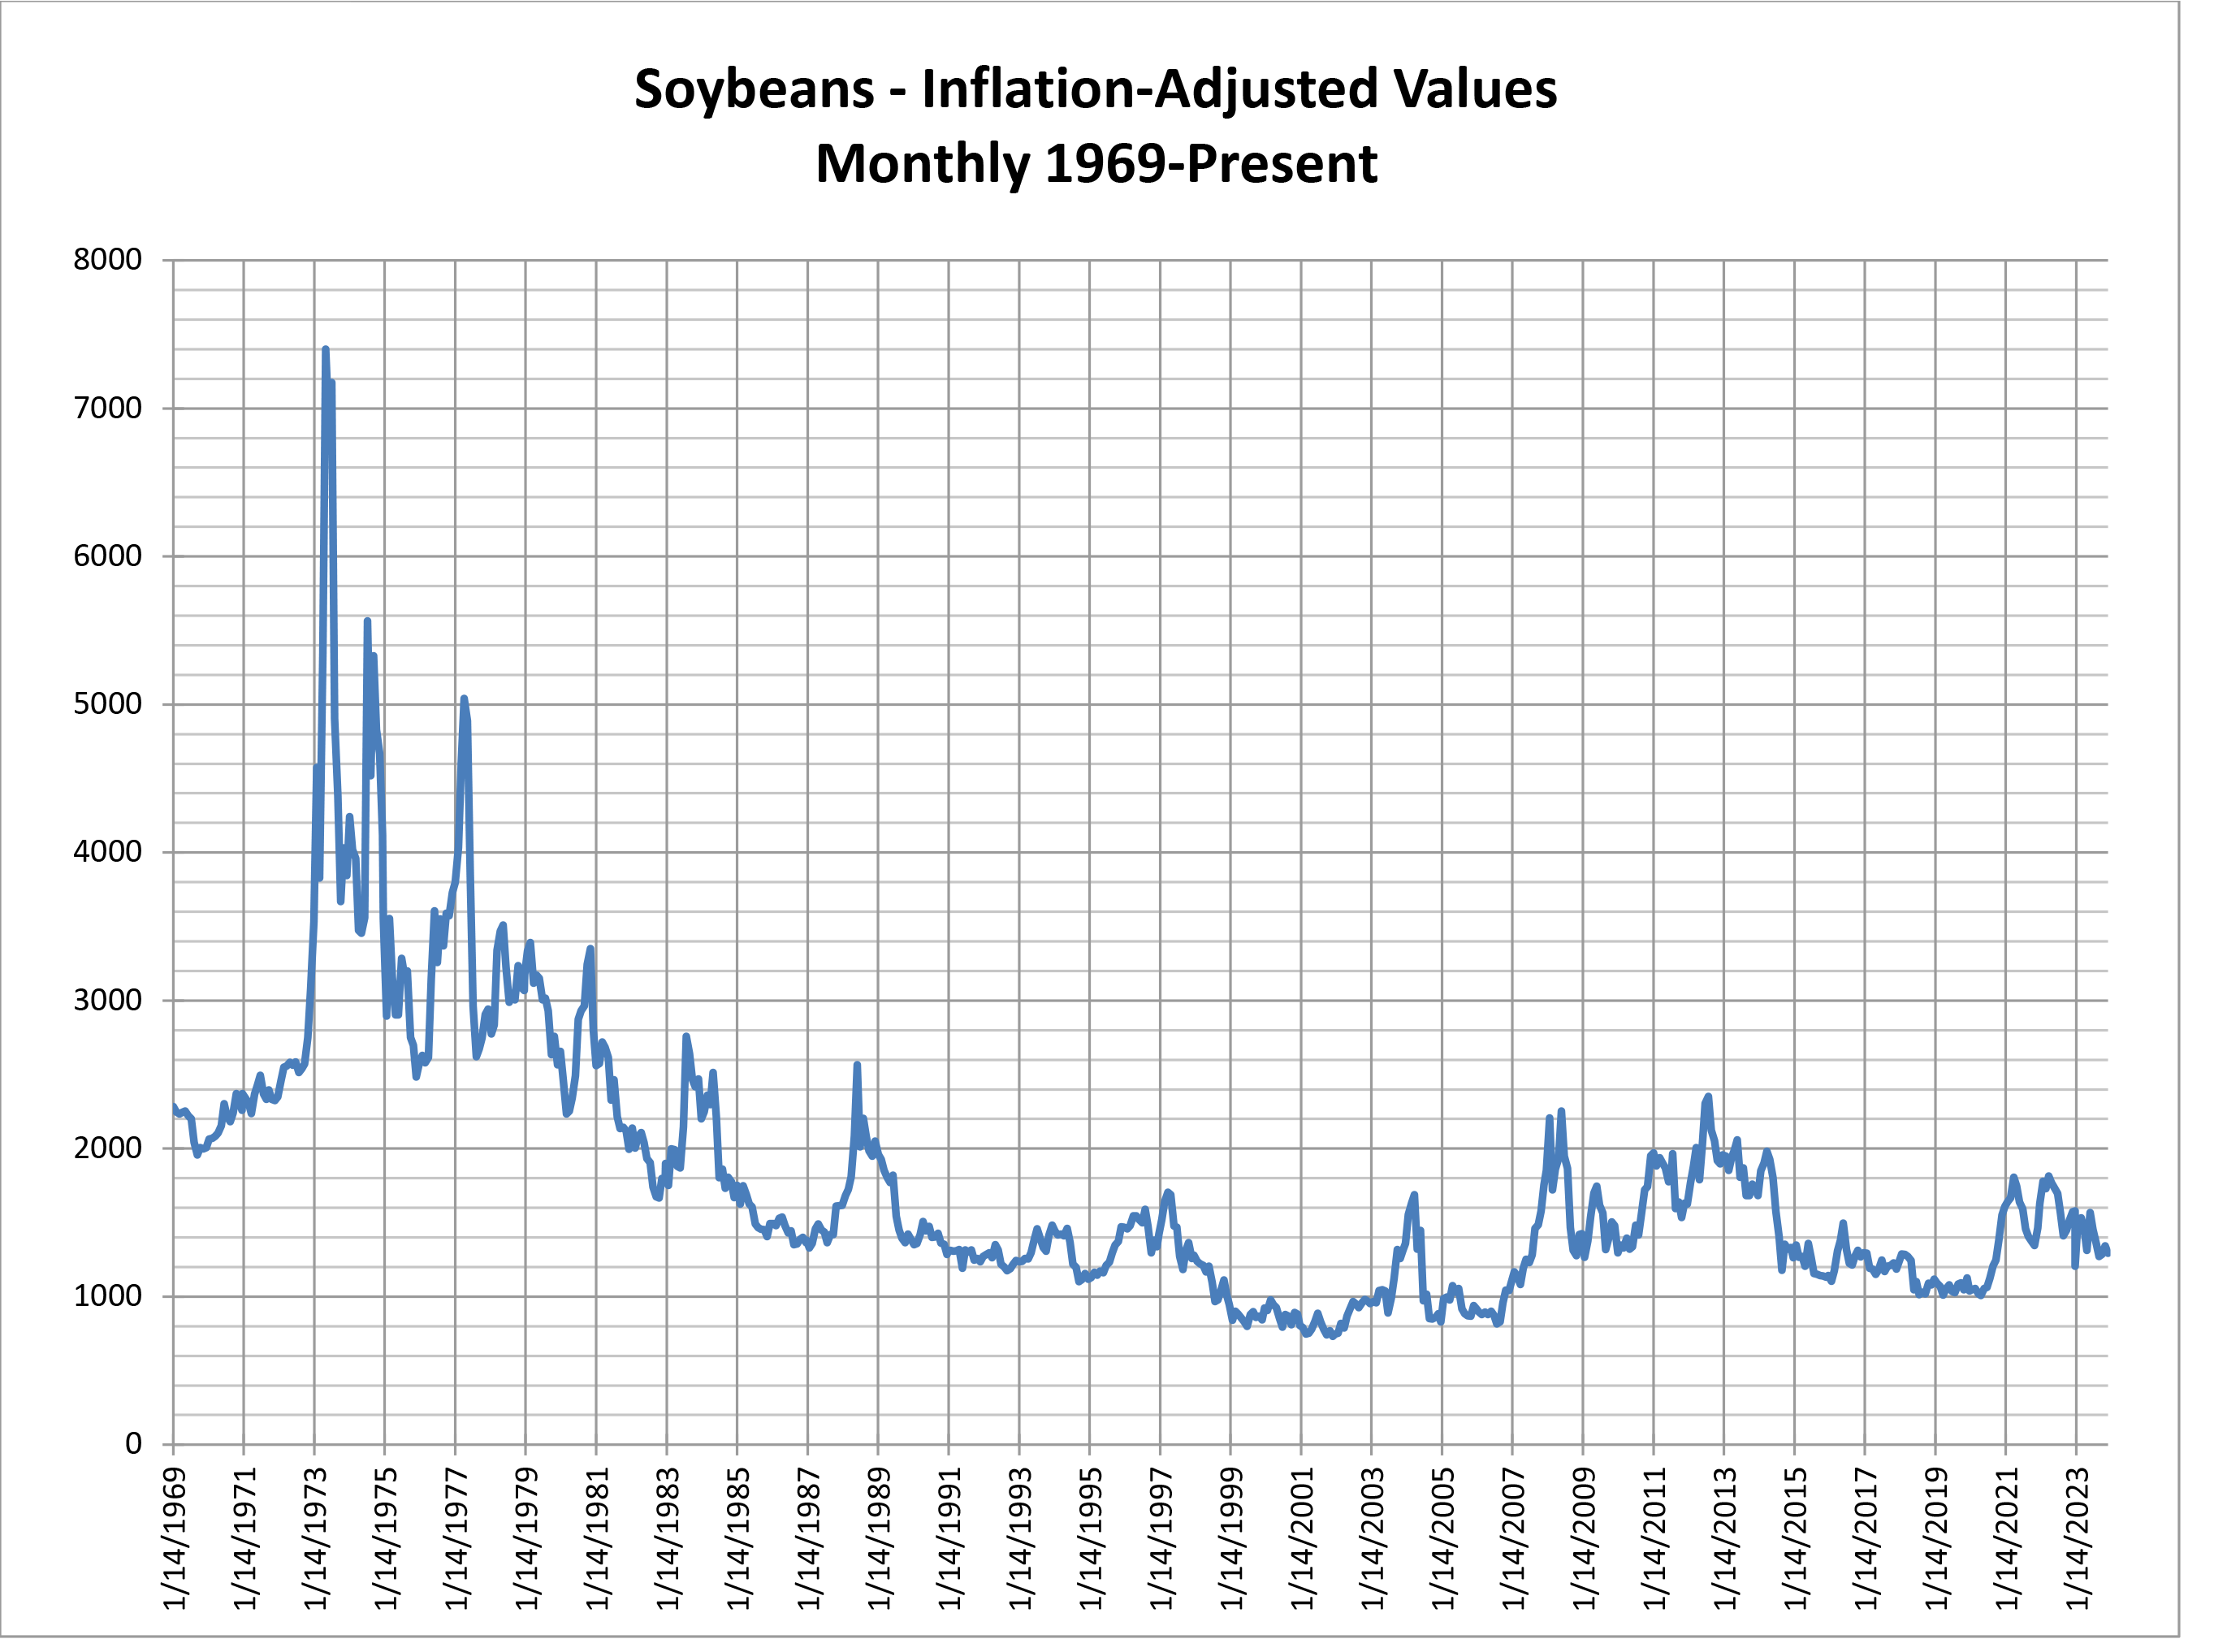
Spot Soybeans Monthly Inflation-Adjusted
 Coupled with the bearish chart action, there are two significant geopolitical events that are front and center and both involve shipping. The first is the crisis in the Panama Canal and the second the disruptions in the Red Sea. These are double-edged swords to be sure. Troubles with shipping may squeeze short-term delivery while leaving stocks in inventory. During the recent and significant price breakdown, the CoT shows commercials buying and speculators and funds selling.
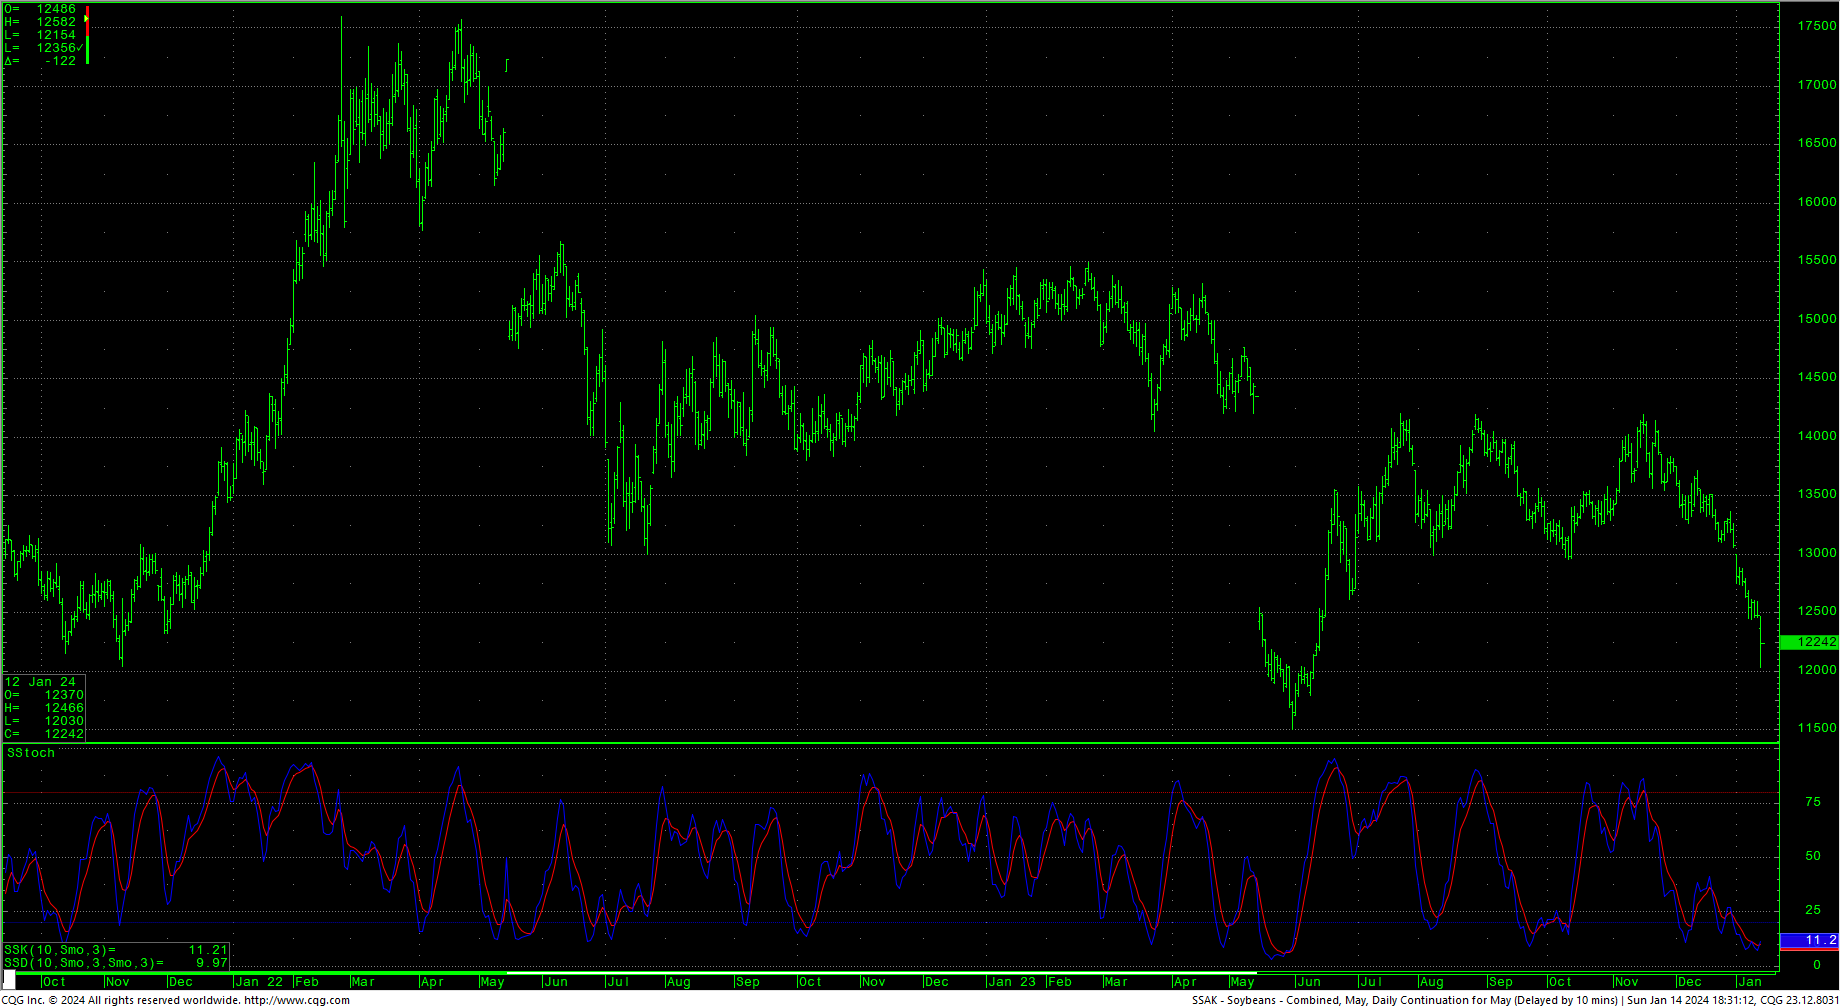
MAY-MAY Soybeans Weekly Continuation
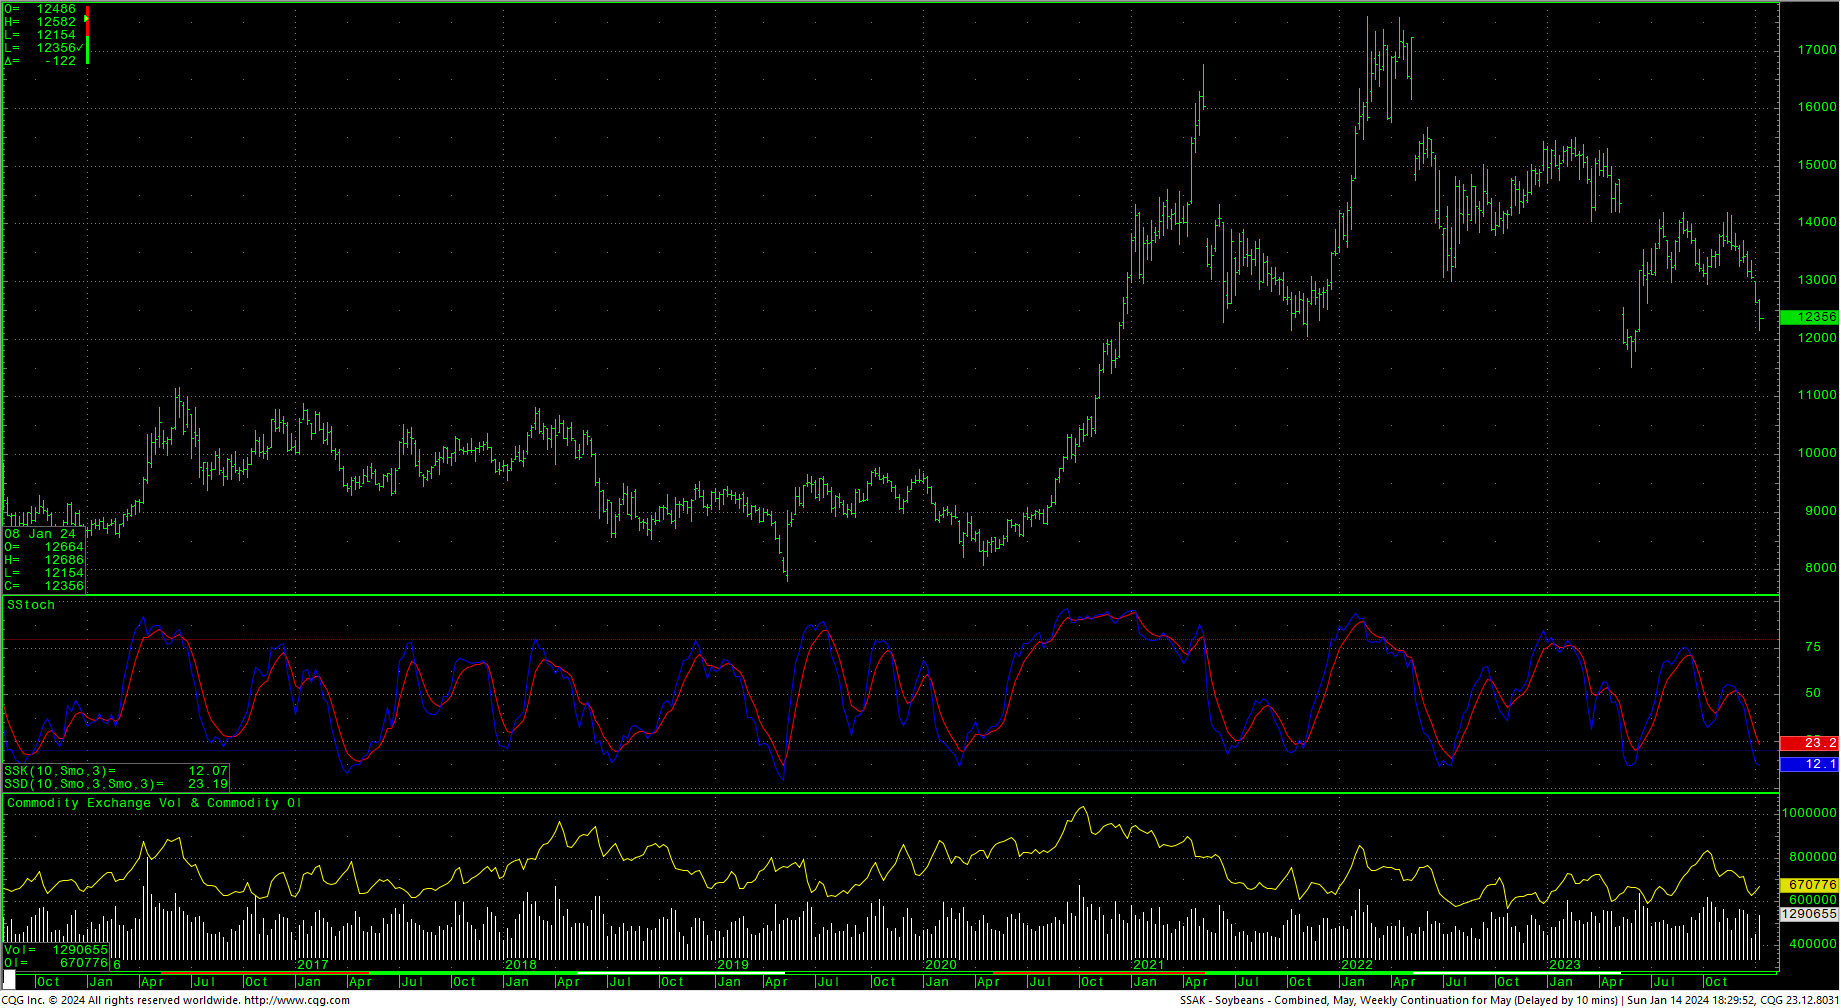 The SK4 has downside targets with this breakdown at 1169.75, basically a retest of the current contract low. With Friday’s trade, the SK4 tested last gasp support in the 1218/1214 level. A further breakdown with closes under 1281/1214 setup a move to 1202 with potential to the weekly target of 1169.75 and pivotal support of 1290/1189. Support is critical at 1170/1167, closes under that level will suggest a much steeper move into the 1025/1010 area for SK4.
MAY Soybeans SK4 Daily H-L-C
 MAY-MAY Soybeans SK4 Daily H-L-C
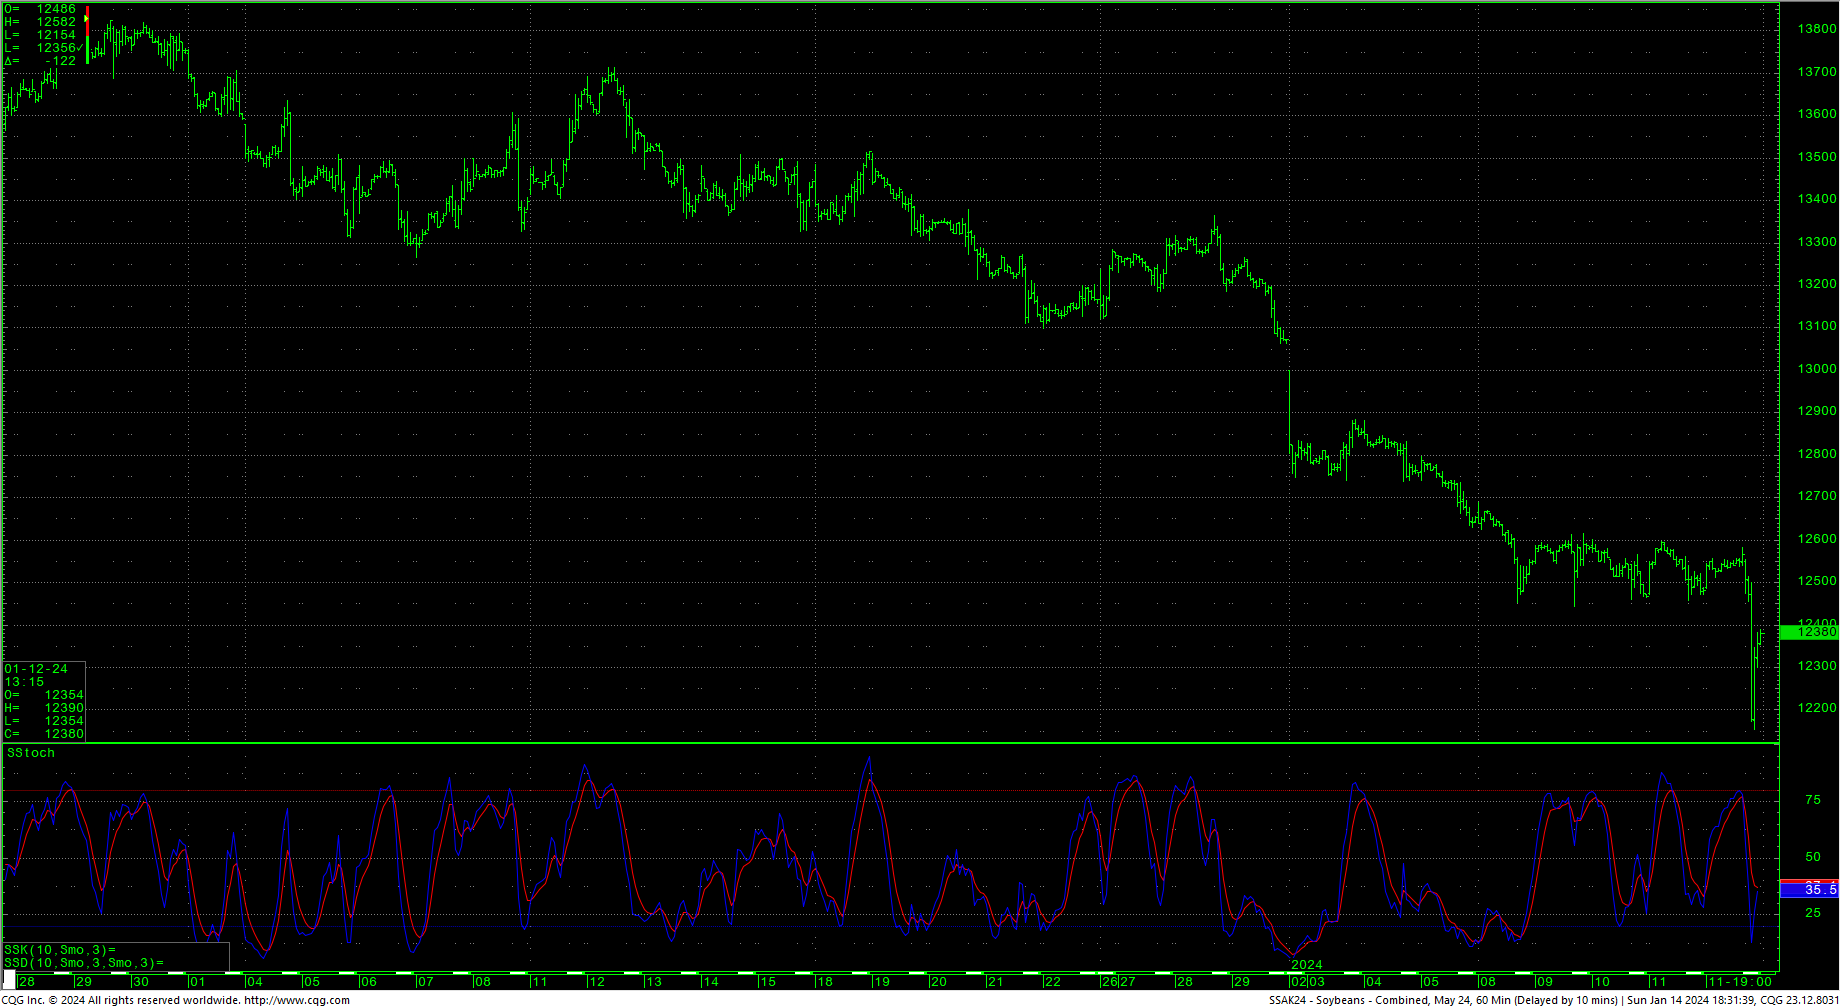
 MAY Soybeans SK4 Hourly H-L-C
 Soybeans Daily Volume (Source: CME Group)
 The hourly is manic in the oscillators with Friday’s wide range and high-volume trade. Short-term, resistance is pivotal at 1243.5/1245 and a drive back above that area may signify a short-term low is in place. Note that there is some strong timing falling on January 23-24. Rallies over 1245 should test 1251 with potential toward 1261.50/1263.75. Closes in SK4 above 1263.75 setup a drive to 1293/1294. Daily closes over 1294 open counts to 1318 with resistance of 1301.50.
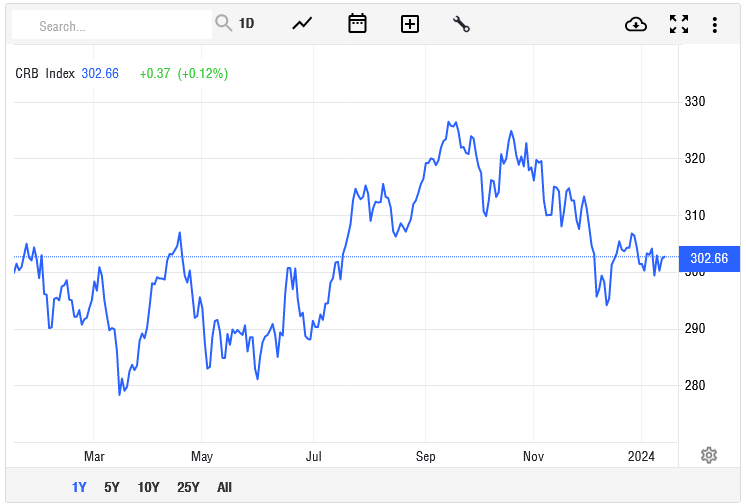
CRB Commodity Index
 Support
- 1229 **
- 1224 **
- 1218/1214 *** ↓
- 1202.5/1202 *** ↓
- 1190/1189 *** ↓
- 1176.5/1175 *** ↓
- 1170/1167 *** ↓
- 1158 **
- 1150 **
- 1141 *** ↓
Resistance
- 1243.5/1245 *** ↑
- 1251 *** ↑
- 1261.50/1263.75 *** ↑
- 1268.75 **
- 1279/1280 ***
- 1284.75 **
- 1288.5 ** ↑
- 1293/1294 *** ↑
- 1301.50 ** hourly gap at 1300
- 1306.25 ** fills hourly gap
- 1318 *** ↑
- 1326.5 **
- 1336.5 *** ↑
Charts courtesy of CQG, Inc.,