
TECHNICAL ANALYSIS (by Intraday Dynamics)
Major Indices Week of February 23, 2024
 Nasdaq NDQ Weekly
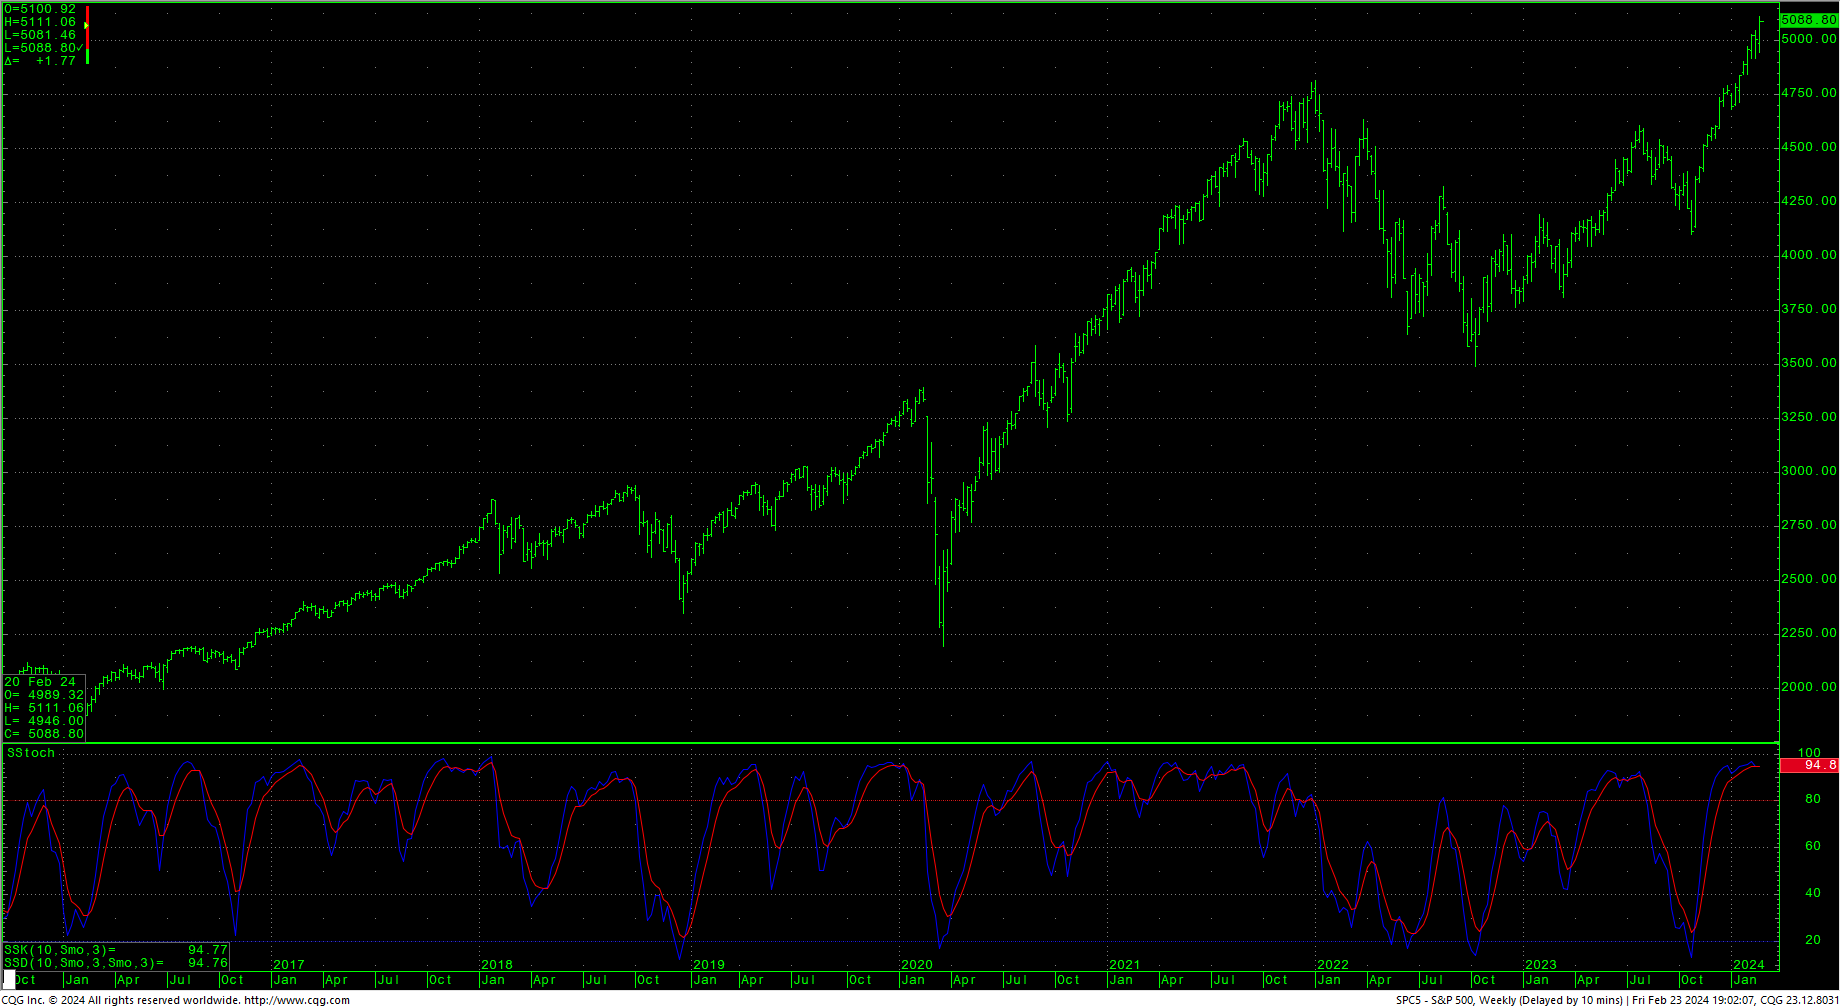
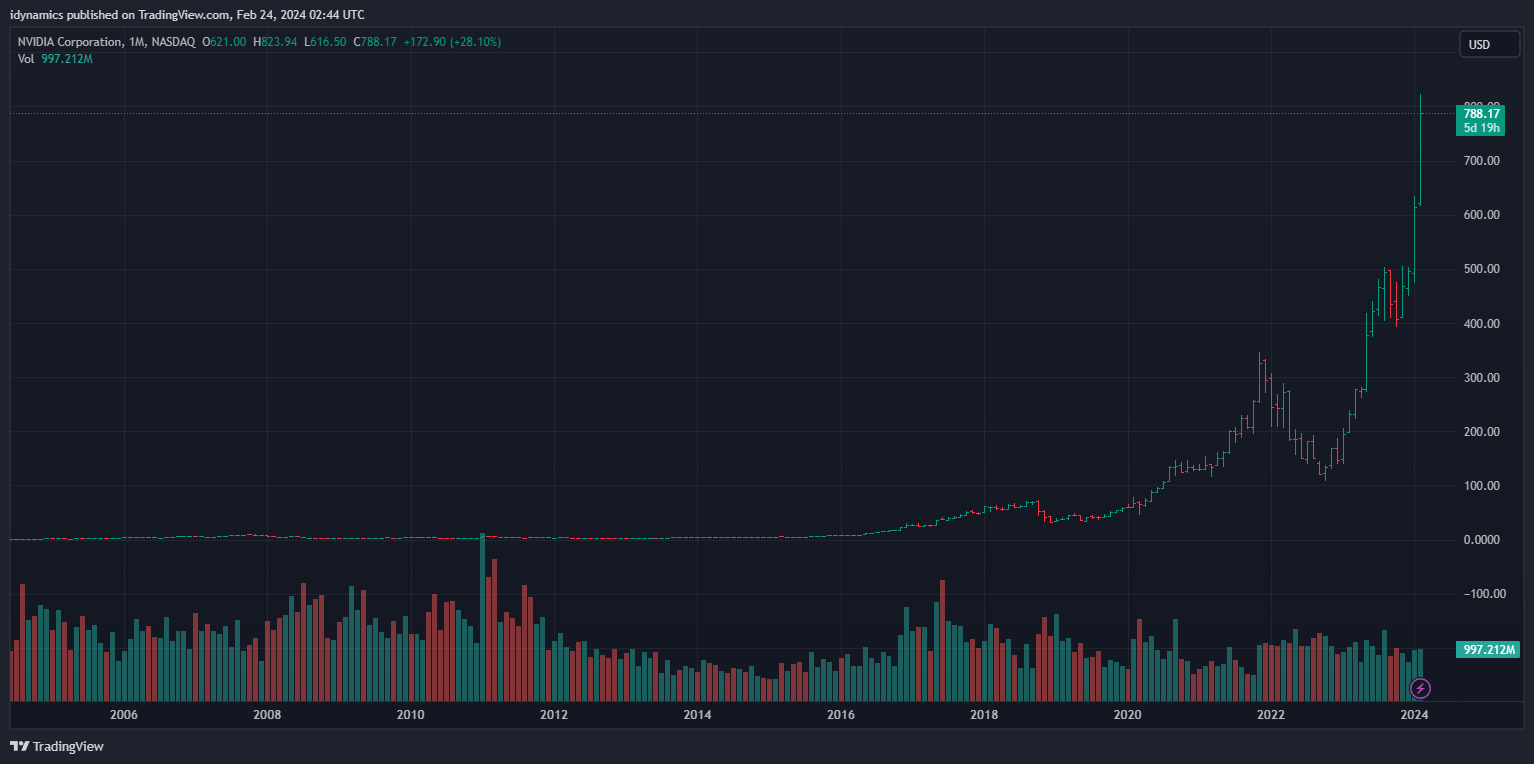
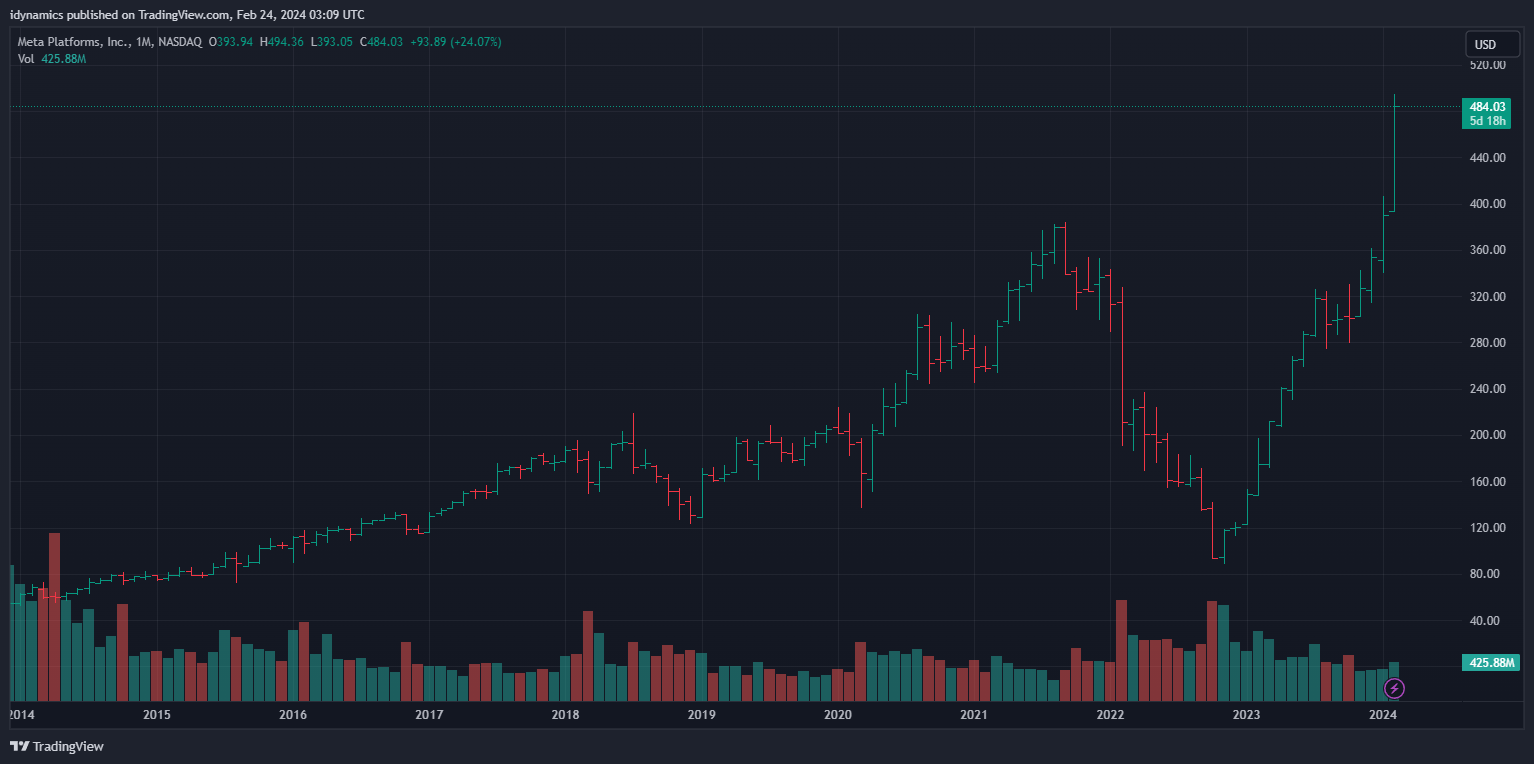
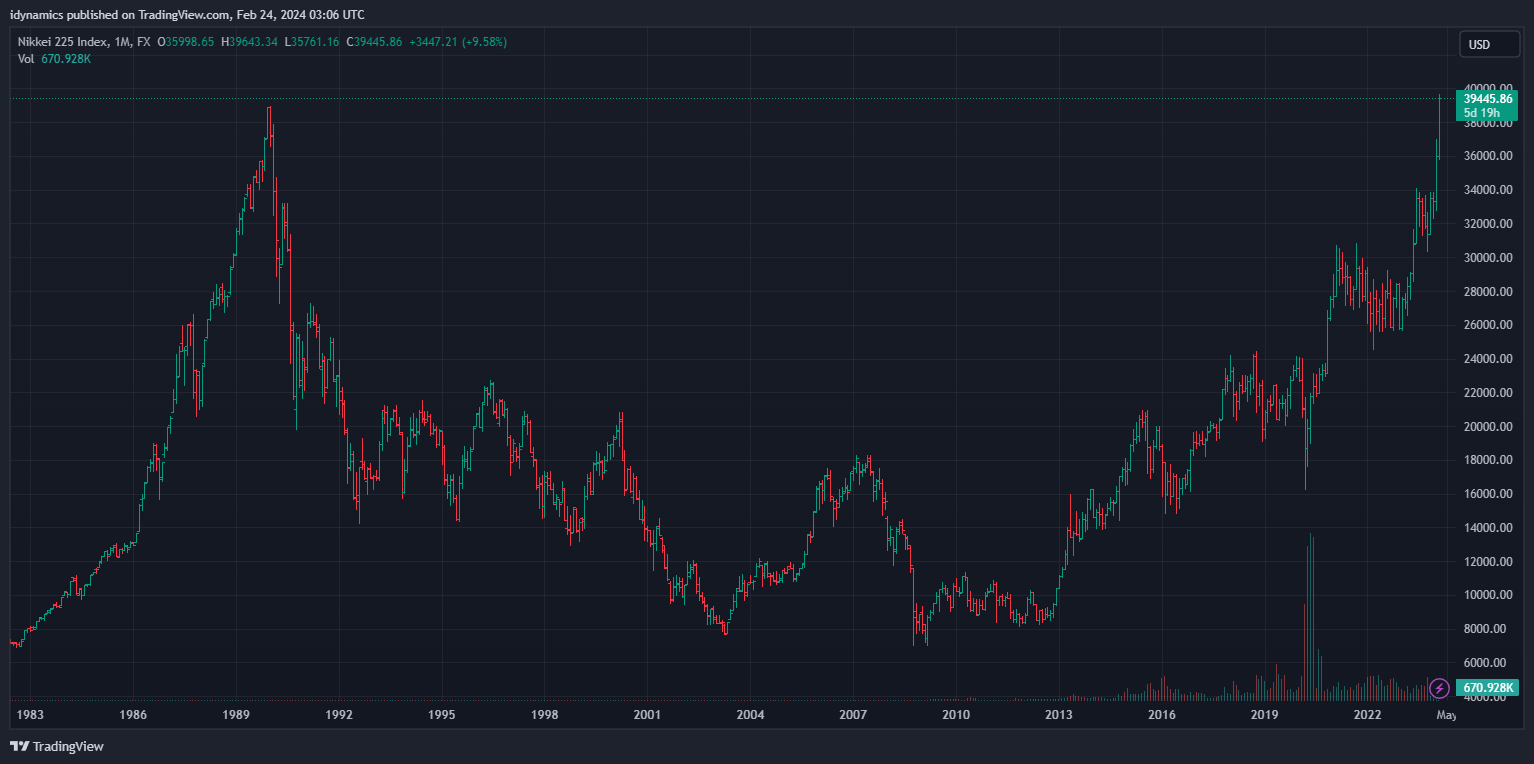
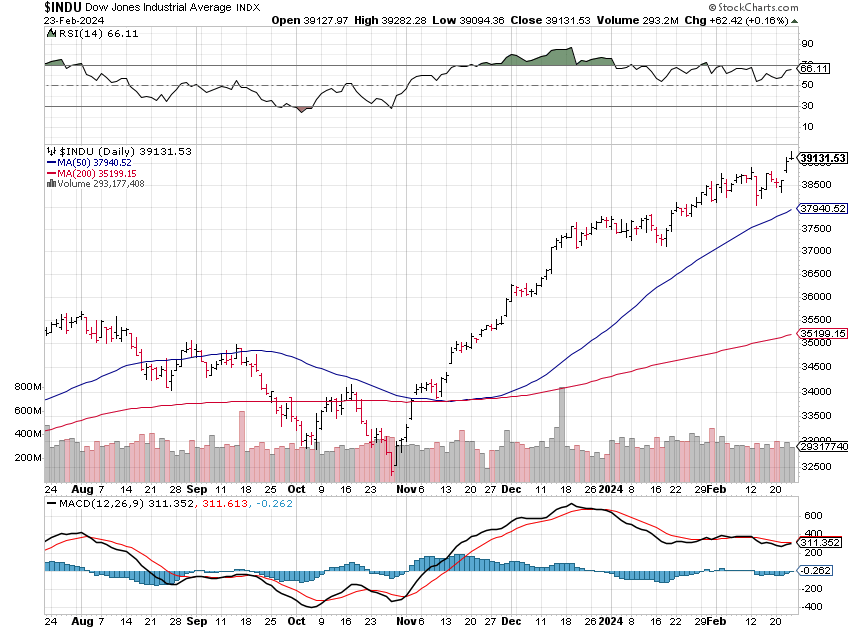
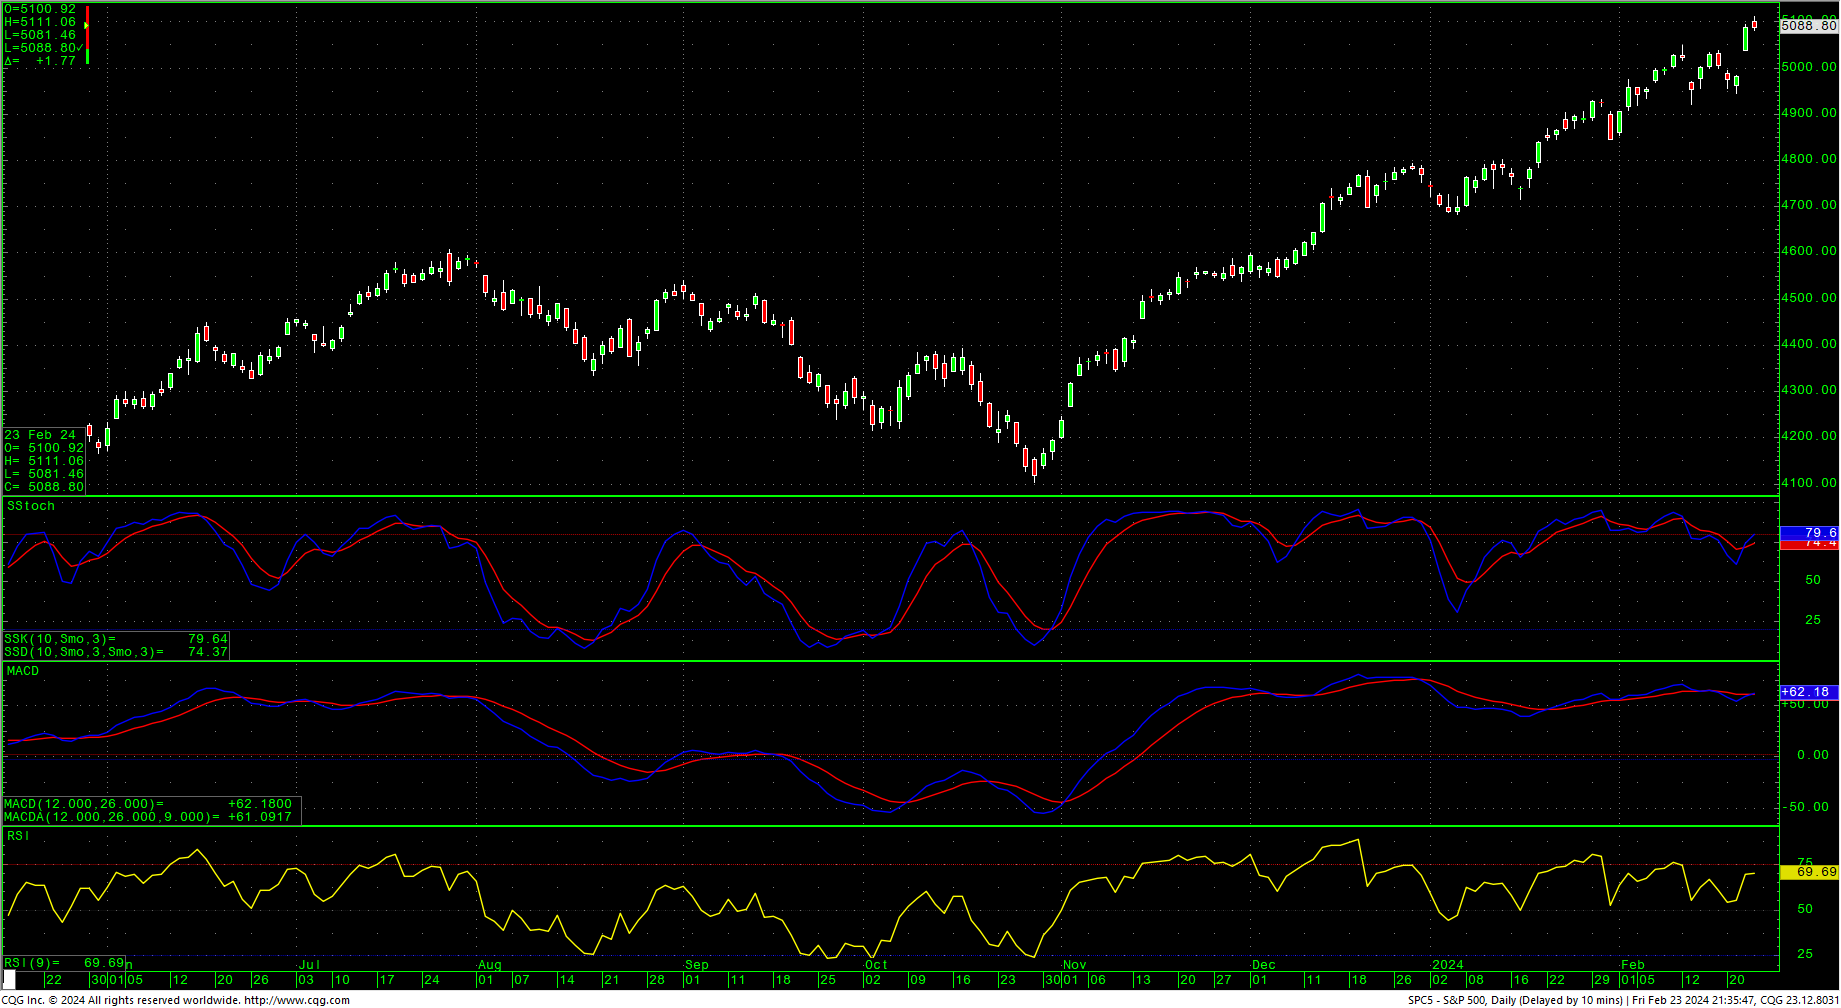
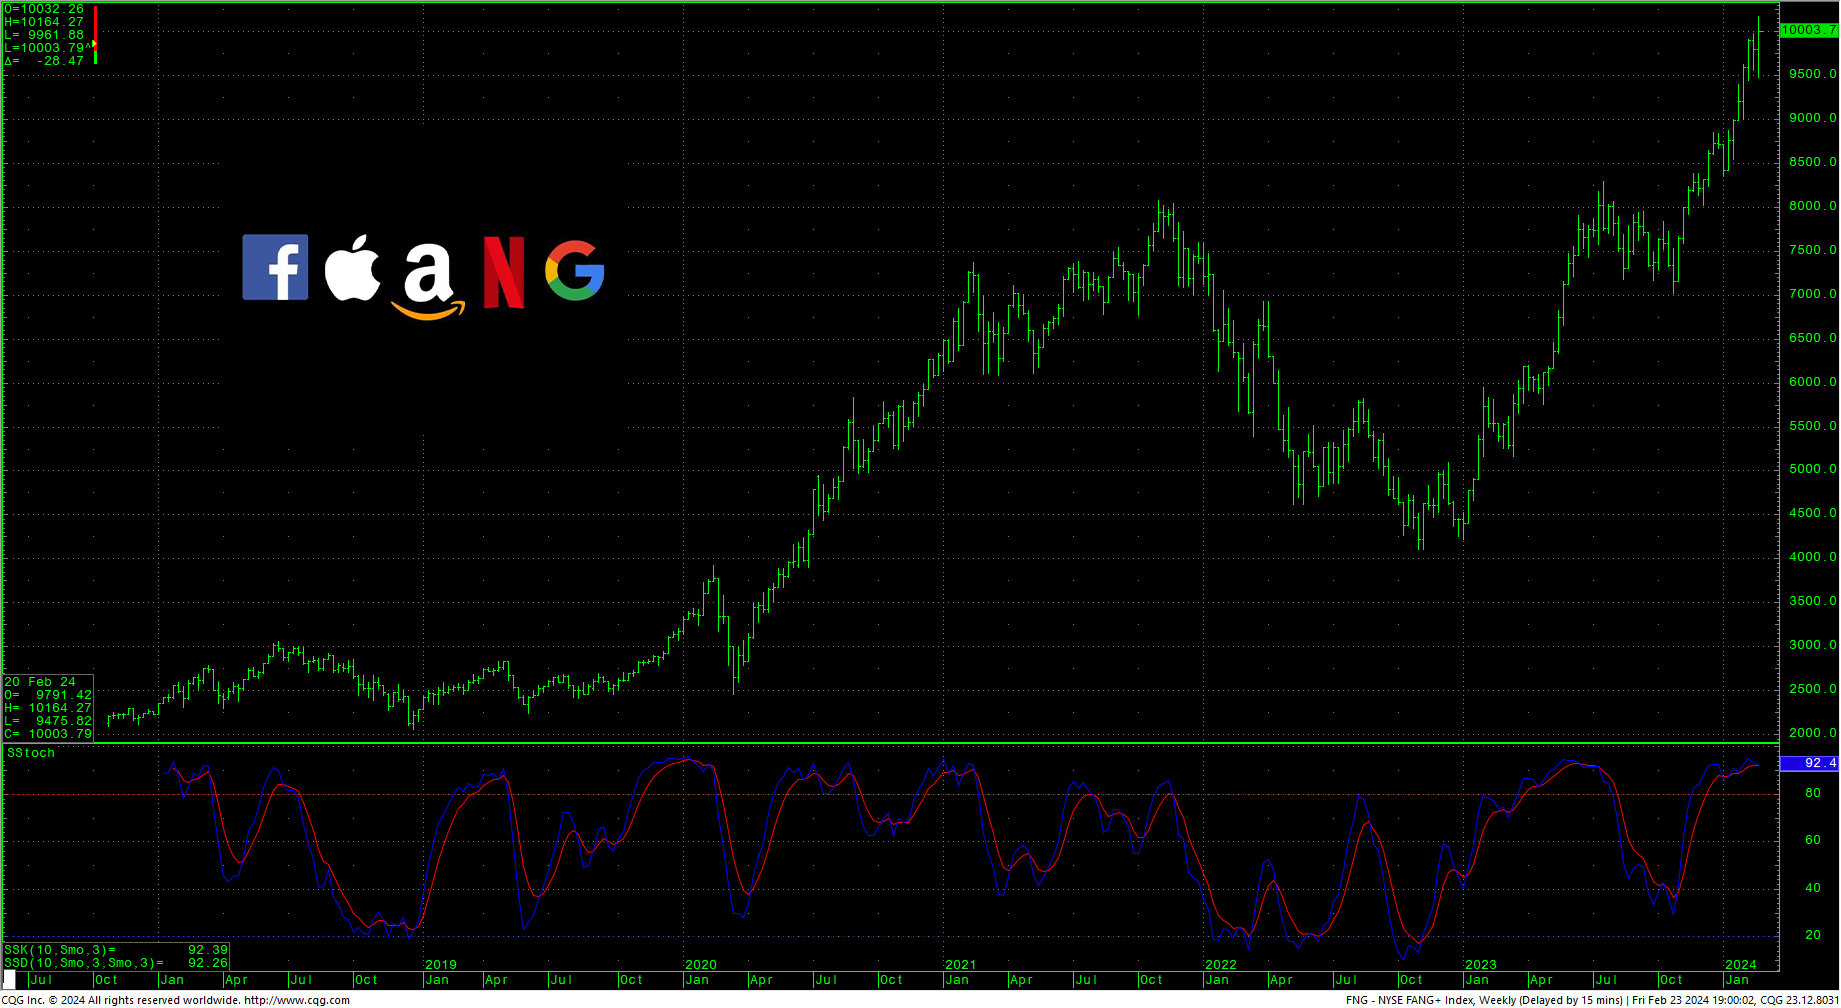
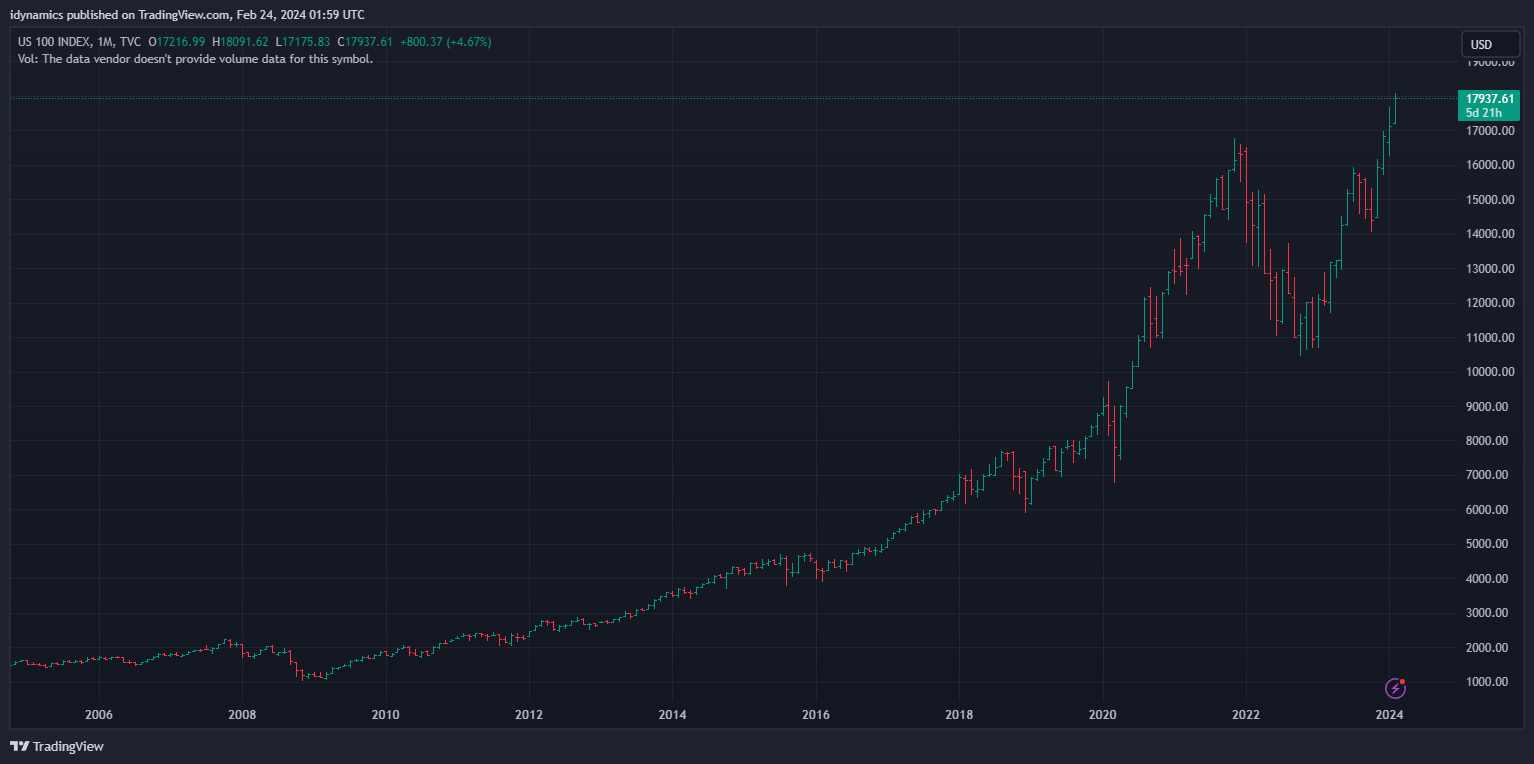 In a shortened trading week, stocks saw most of the major indices surge into record highs with last week’s critical cycle timing on Wednesday/Thursday coinciding with the release of NVDA earnings. The markets were perched on the edge of anticipation and the data sent NVDA soaring $277B to the largest one-day increase in valuation in history, eclipsing the previous record set just three weeks ago with META stock. The action on Thursday notched the best one-day performance for stocks in a year as prices responded to critical cycle timing…where we noted: “Thursday marks critical timing with potential for high volume and/or an extreme.“ Even with all the excitement in the tech sector, the S&P led the week, closing up 1.24% as it breached the 5100 level just 10 days after taking out the psychologically critical 5000 level. The Dow moved into record high territory, setting an intraday high of 39282 before selling off late Friday in reaction to short-term overbought conditions…taking out one long-standing target at 39075. Another milestone last week was the Japan Nikkei Index setting a new record high, eclipsing the previous high set back in 1989. Right now, sentiment indicators remain frothy, the weekly stochastics are overbought, the daily stochastics need continued highs to support the current hook higher. The record highs continue to bring a mixture of optimism along with some extreme pessimism. Thus far, technically, there is still no indication of mania. In fact, the RSI and the MACD on the Dow daily are just now trying to show buy signals. In contrast, the S&P daily looks a little frothier. The blistering FANG traded a huge outside week up and closed above the 10K level for the first time.
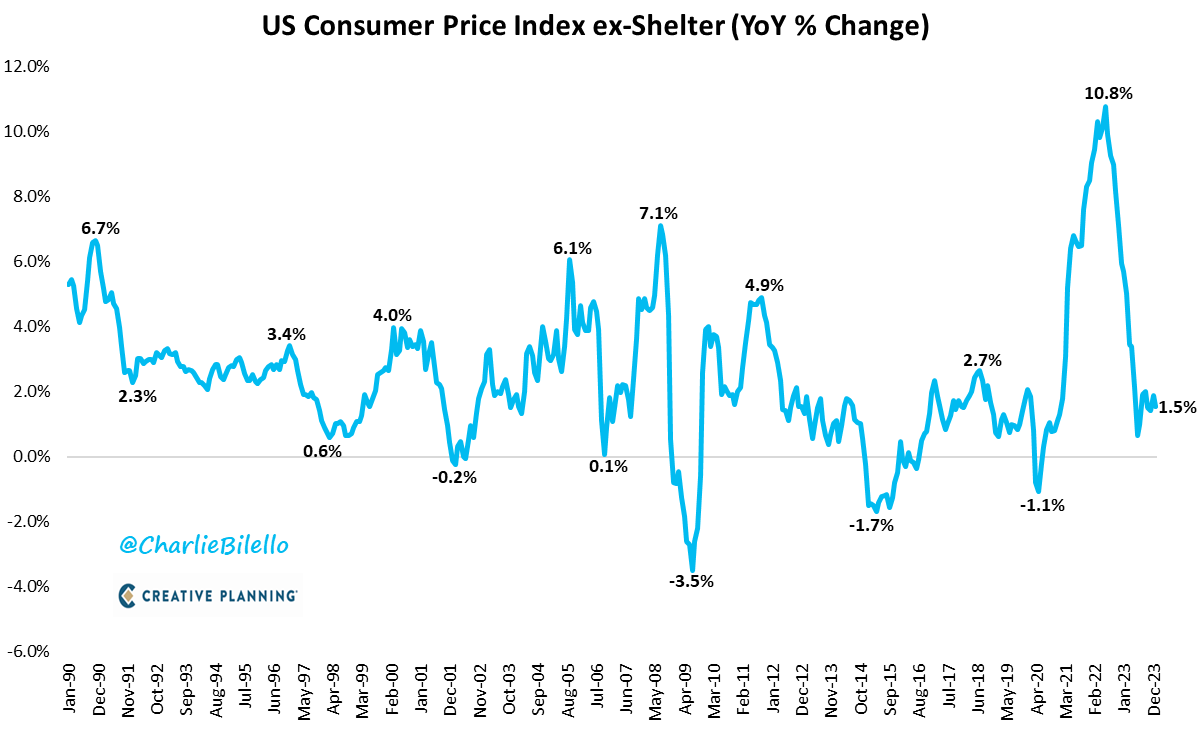
 The extreme fluctuations in market psychology could yet be favoring a sharp melt-up in prices as they move into a bona fide third-wave. As mentioned above, market breadth is not crazy and there is no sign of massive volume ‘blowoff’ type activity. That said, the diverging stochastics on the daily and the gaps last week throw some cautionary flags that require continued upside momentum, stat. BRKA traded to a record high above 632K but also trailed off late Friday with the broad market. Bonds reversed higher after setting new 2024 lows and the coming week is going to bring more edge-of-the-seat rate-centered activity as the market looks forward to consumer confidence on Tuesday, GDP on Wednesday (forecast is 3.3%), and then on Thursday is Core PCE (estimates 0.4%). Wednesday is a minor cycle date. Shelter remains the critical inflation issue, CPI minus shelter has come in under the Fed’s target of 2% for eight months in a row now. Expect Fed talk to be on the market’s lips this coming week.

 52-Week A/D Line

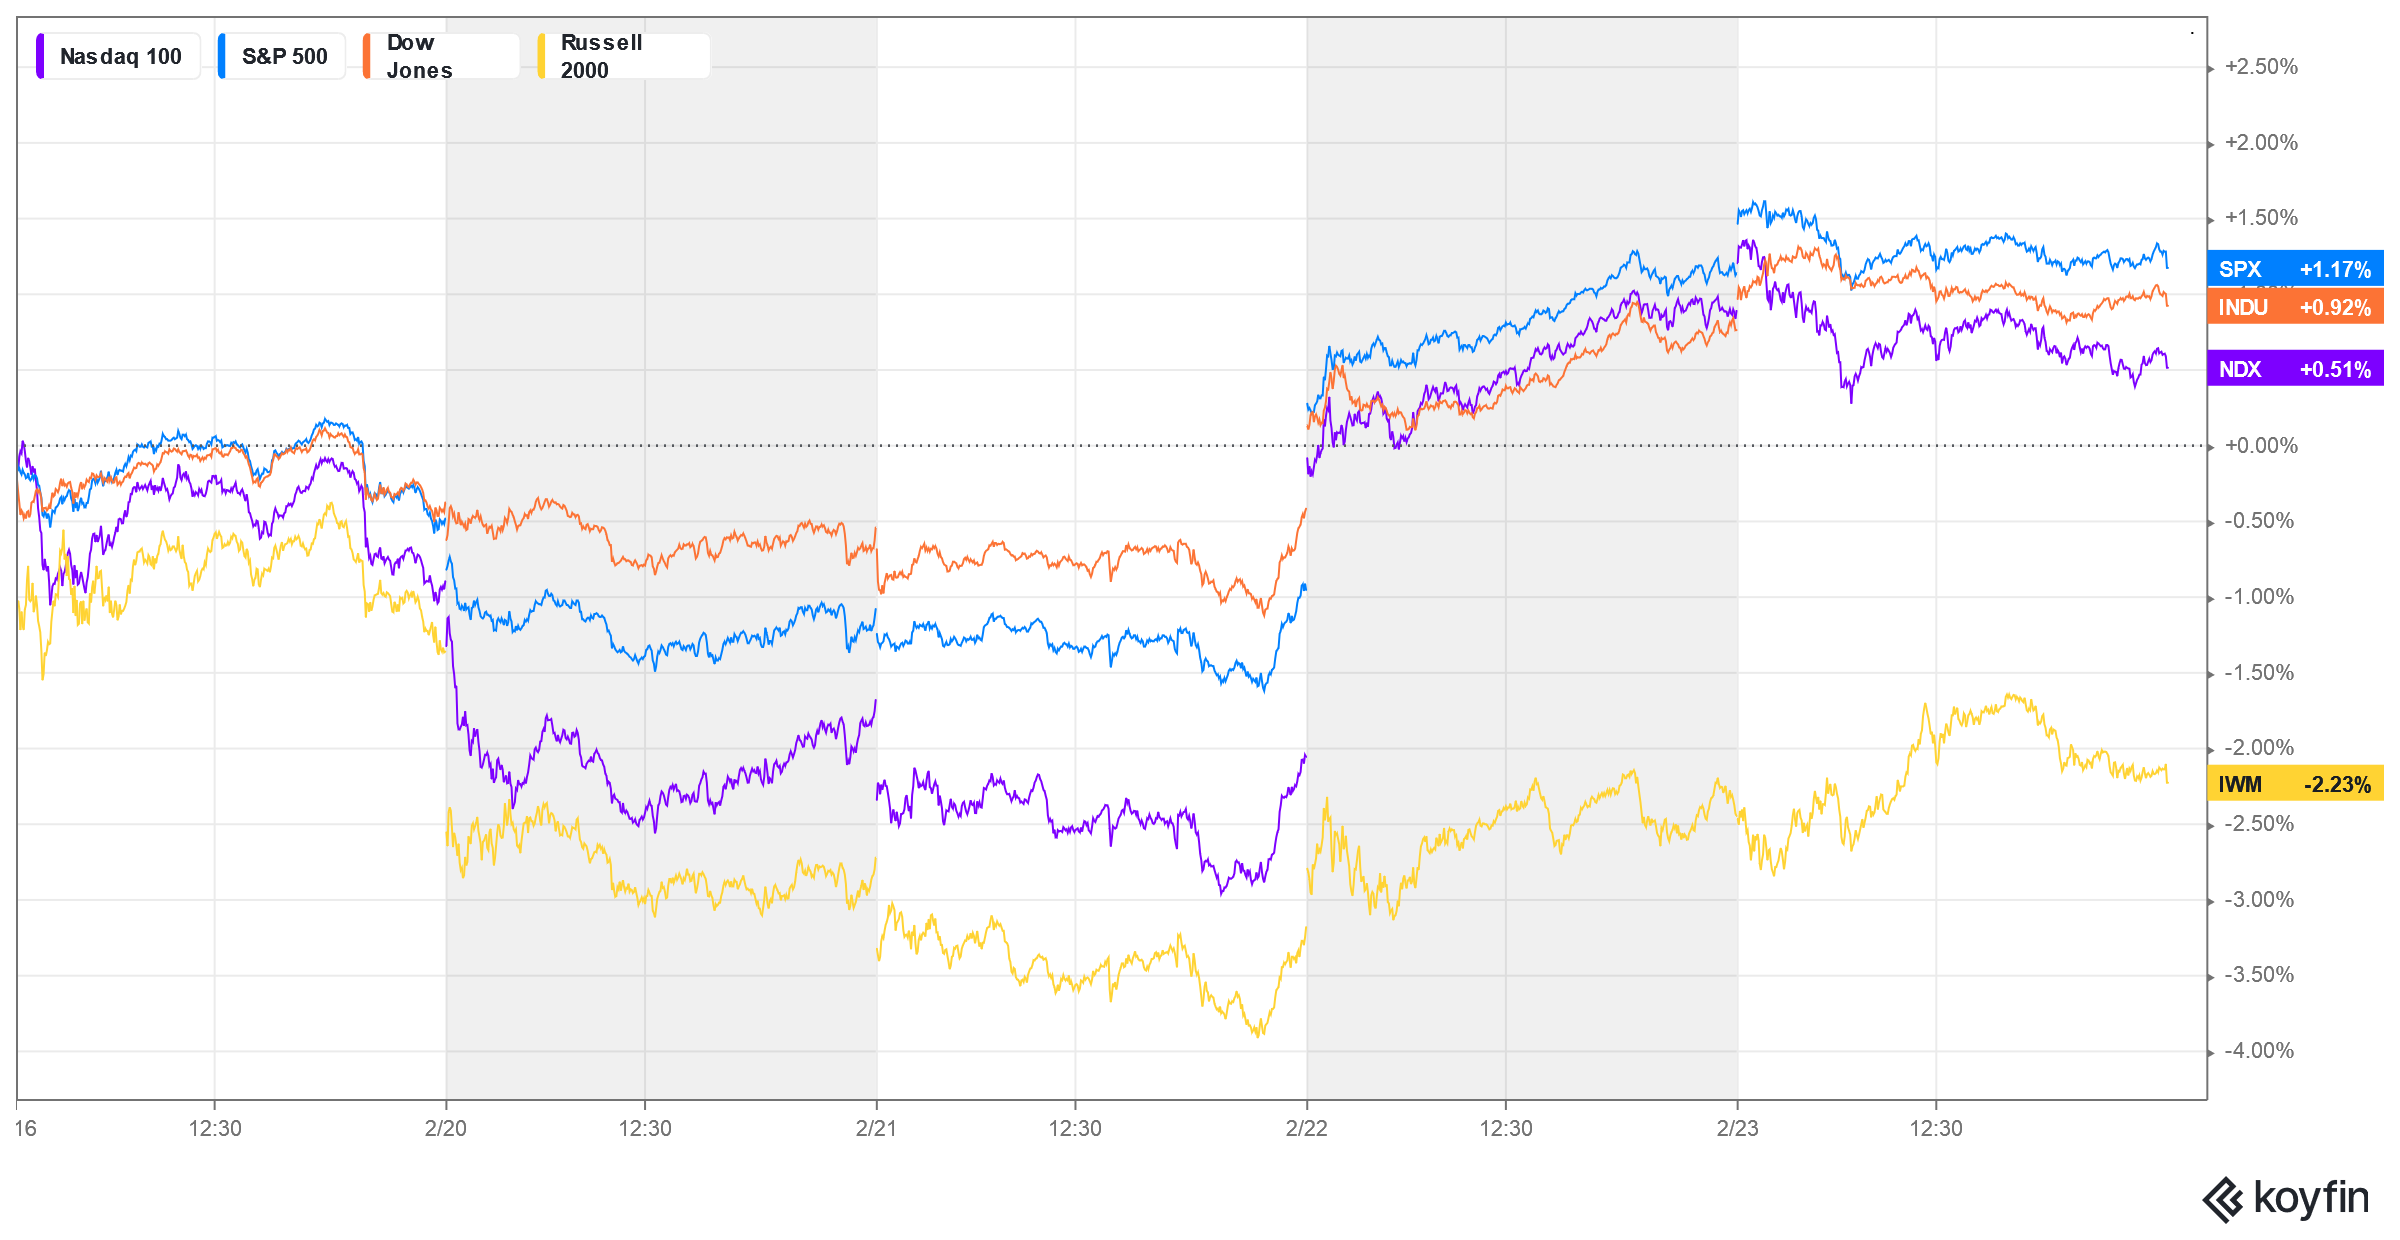
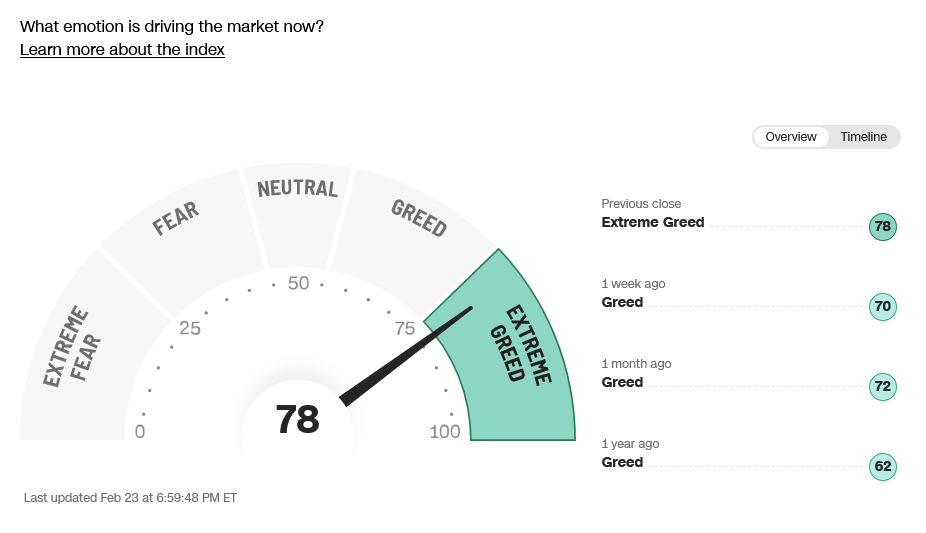
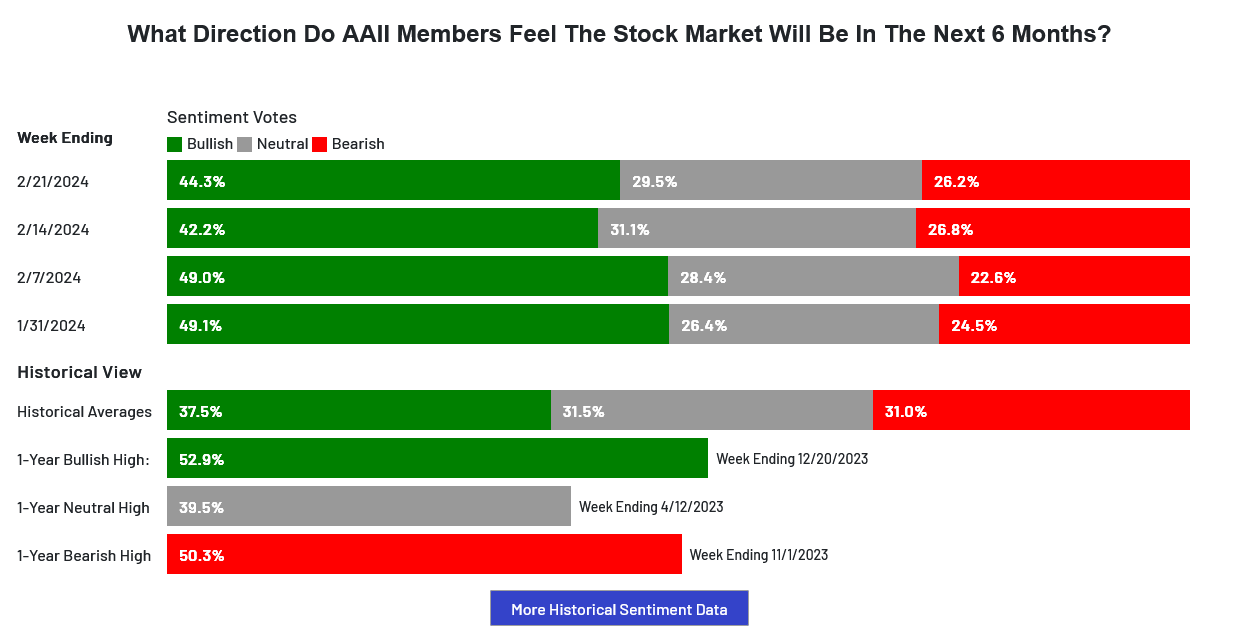
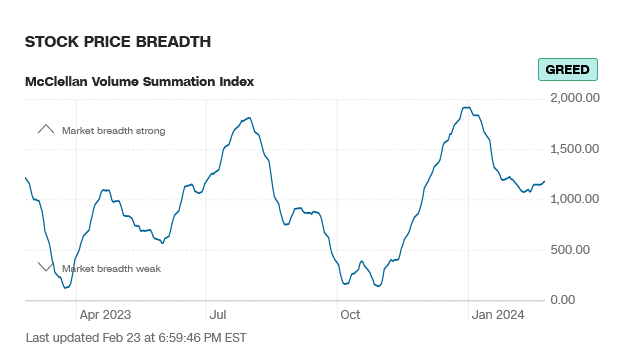
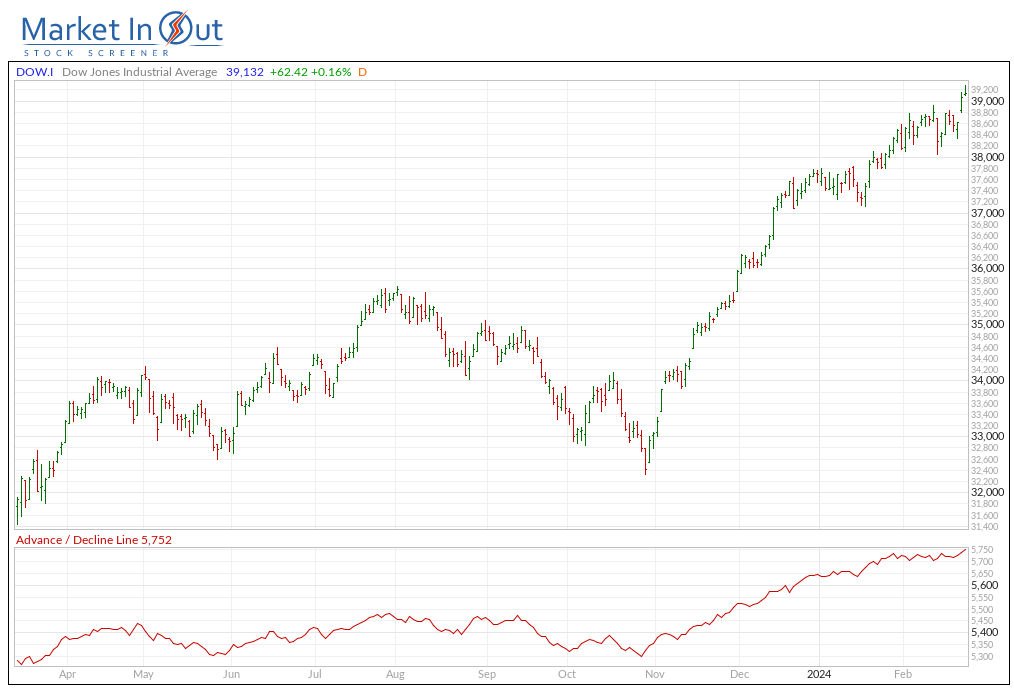
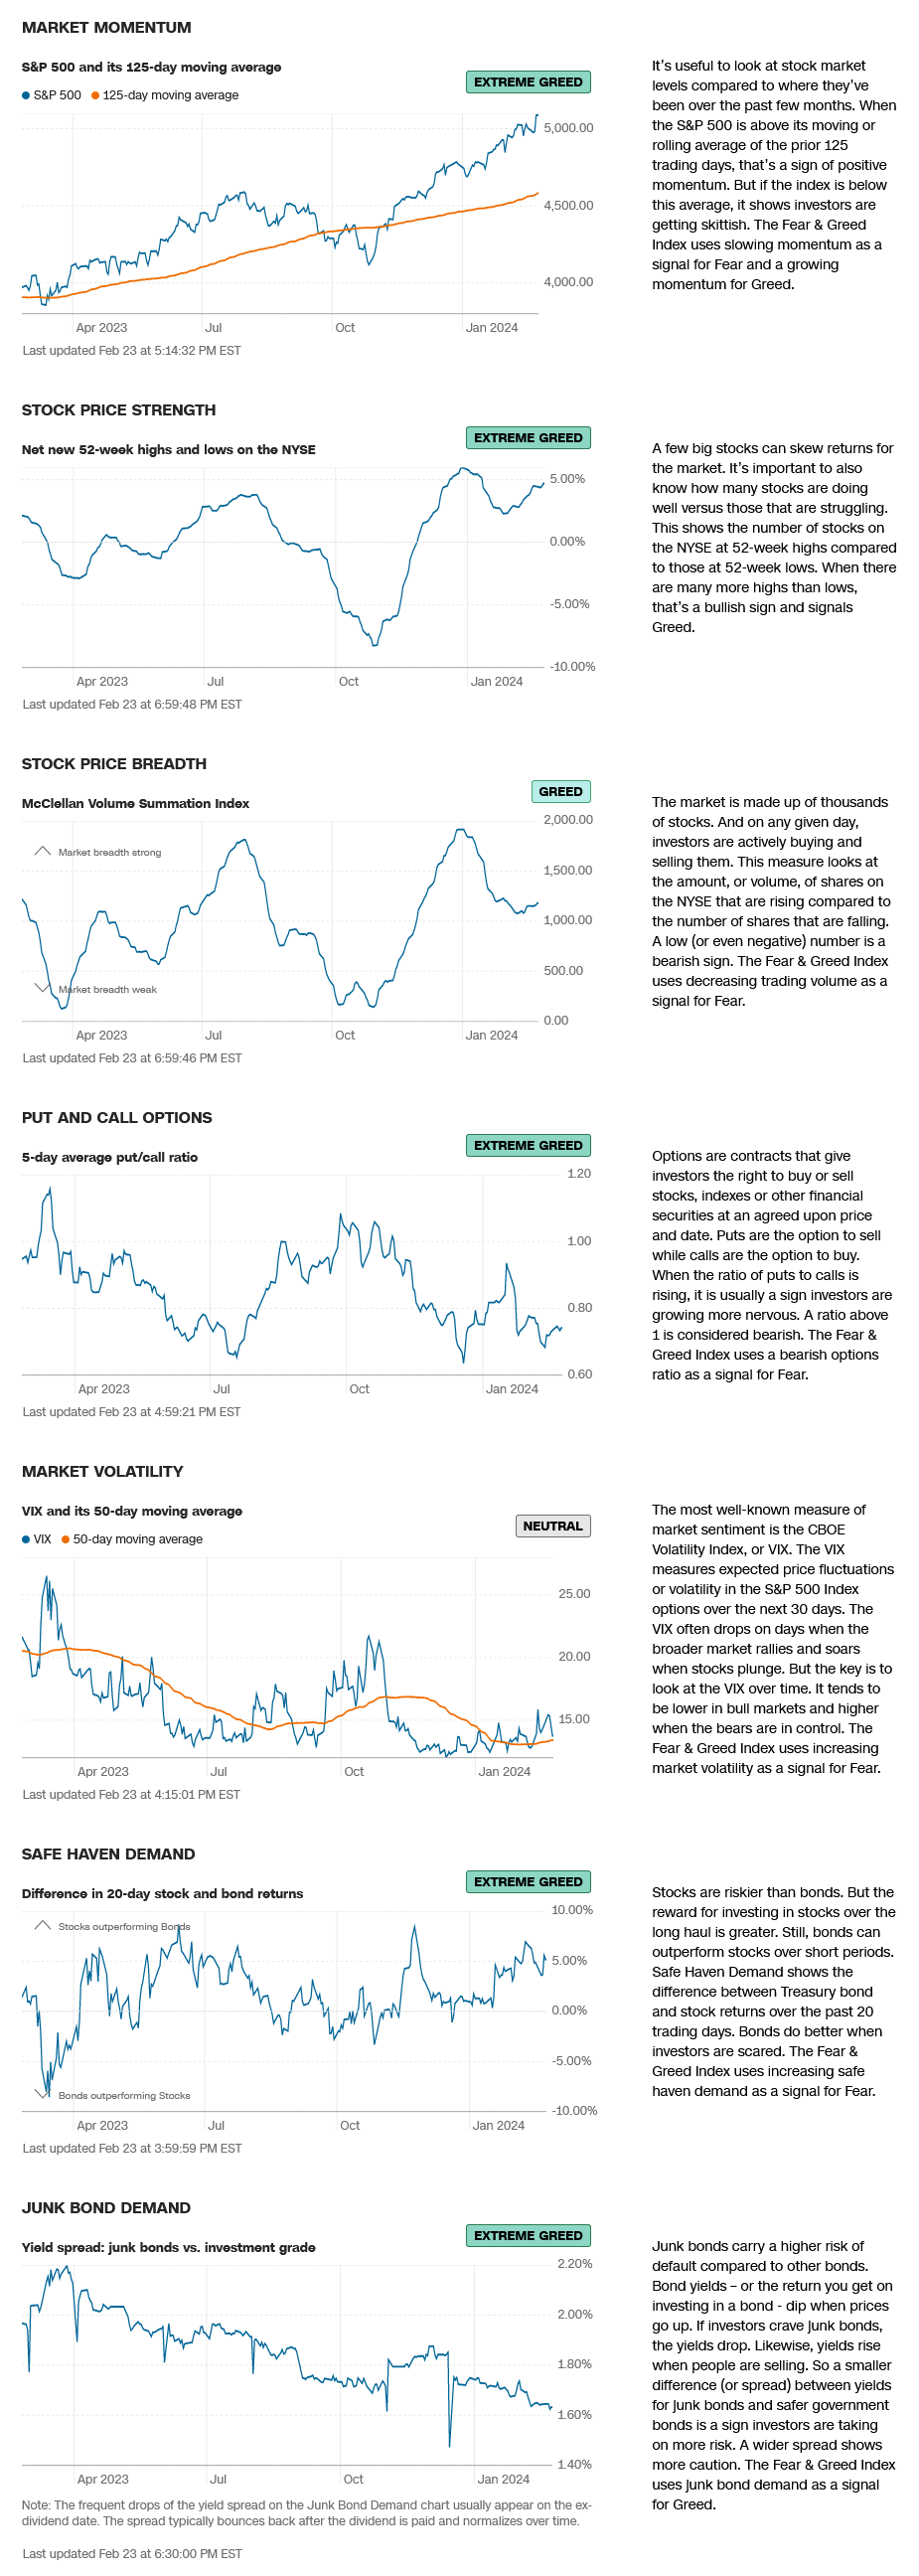
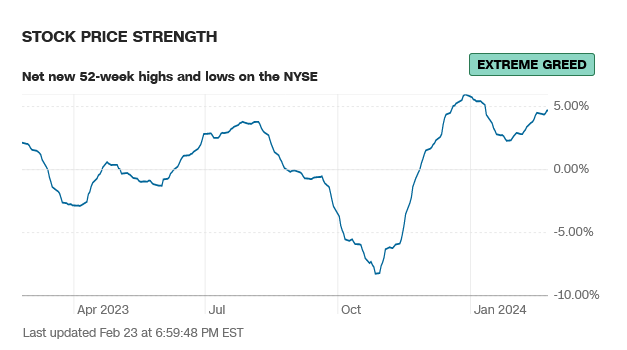
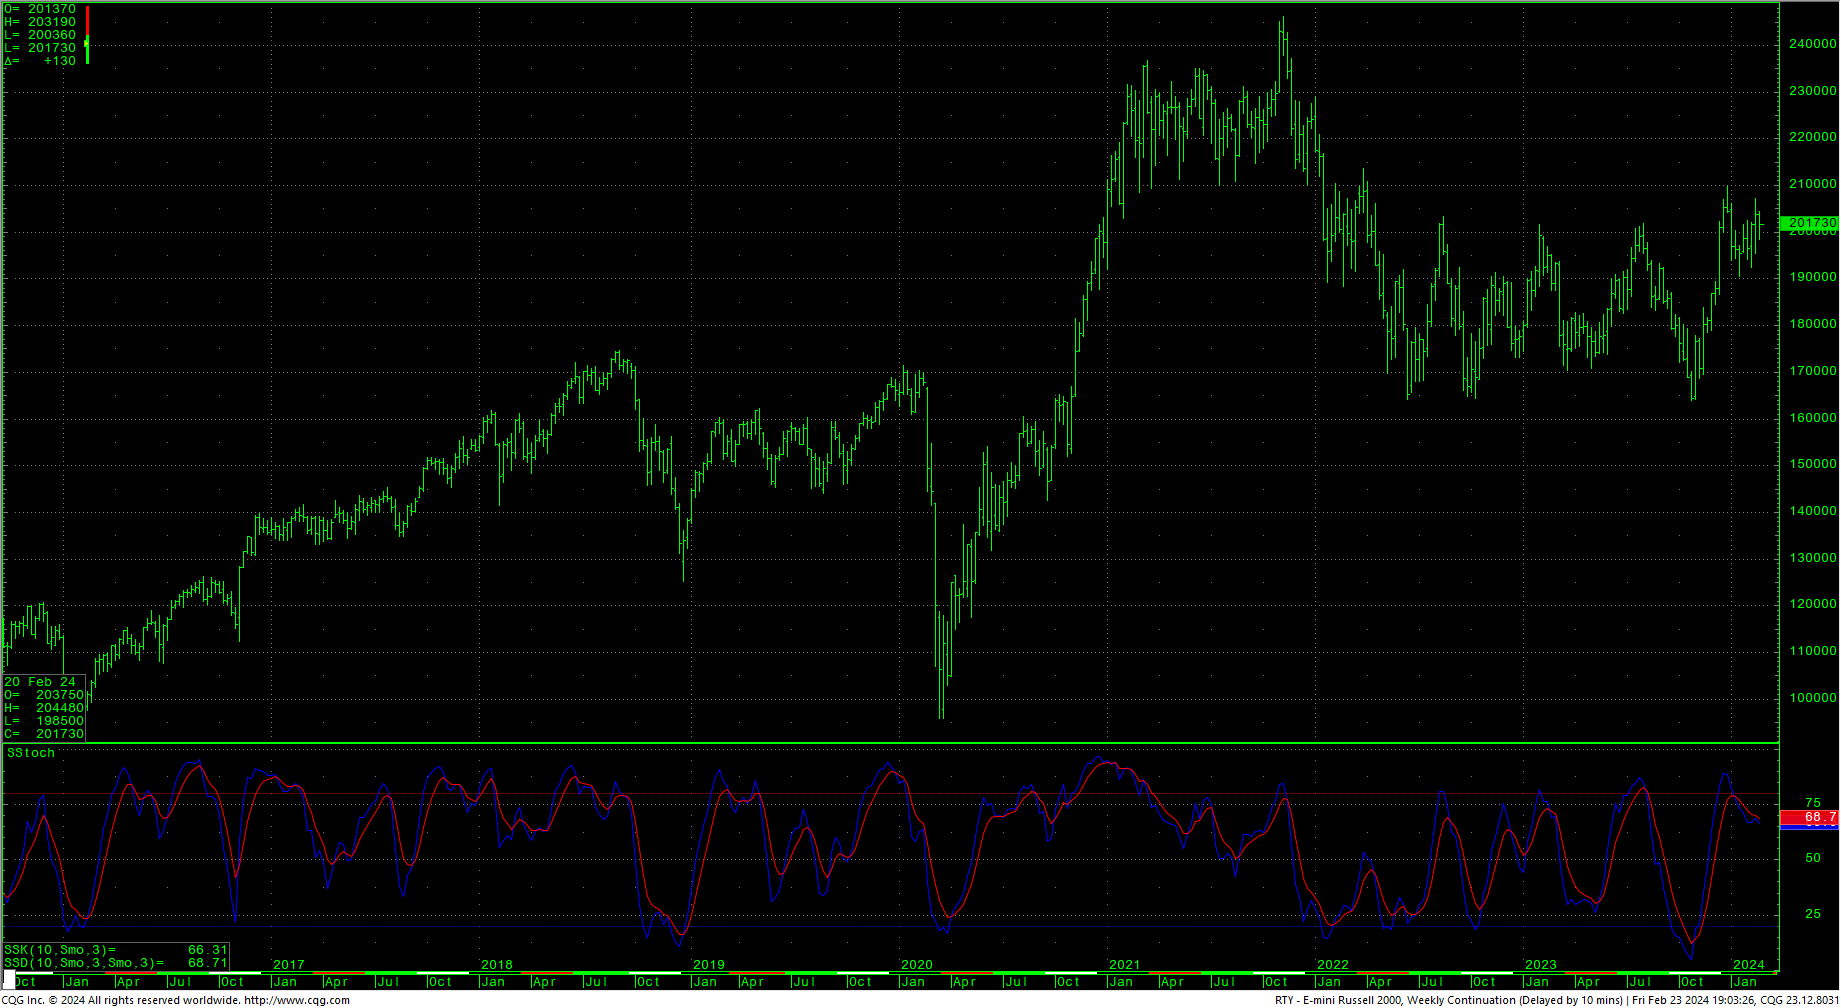
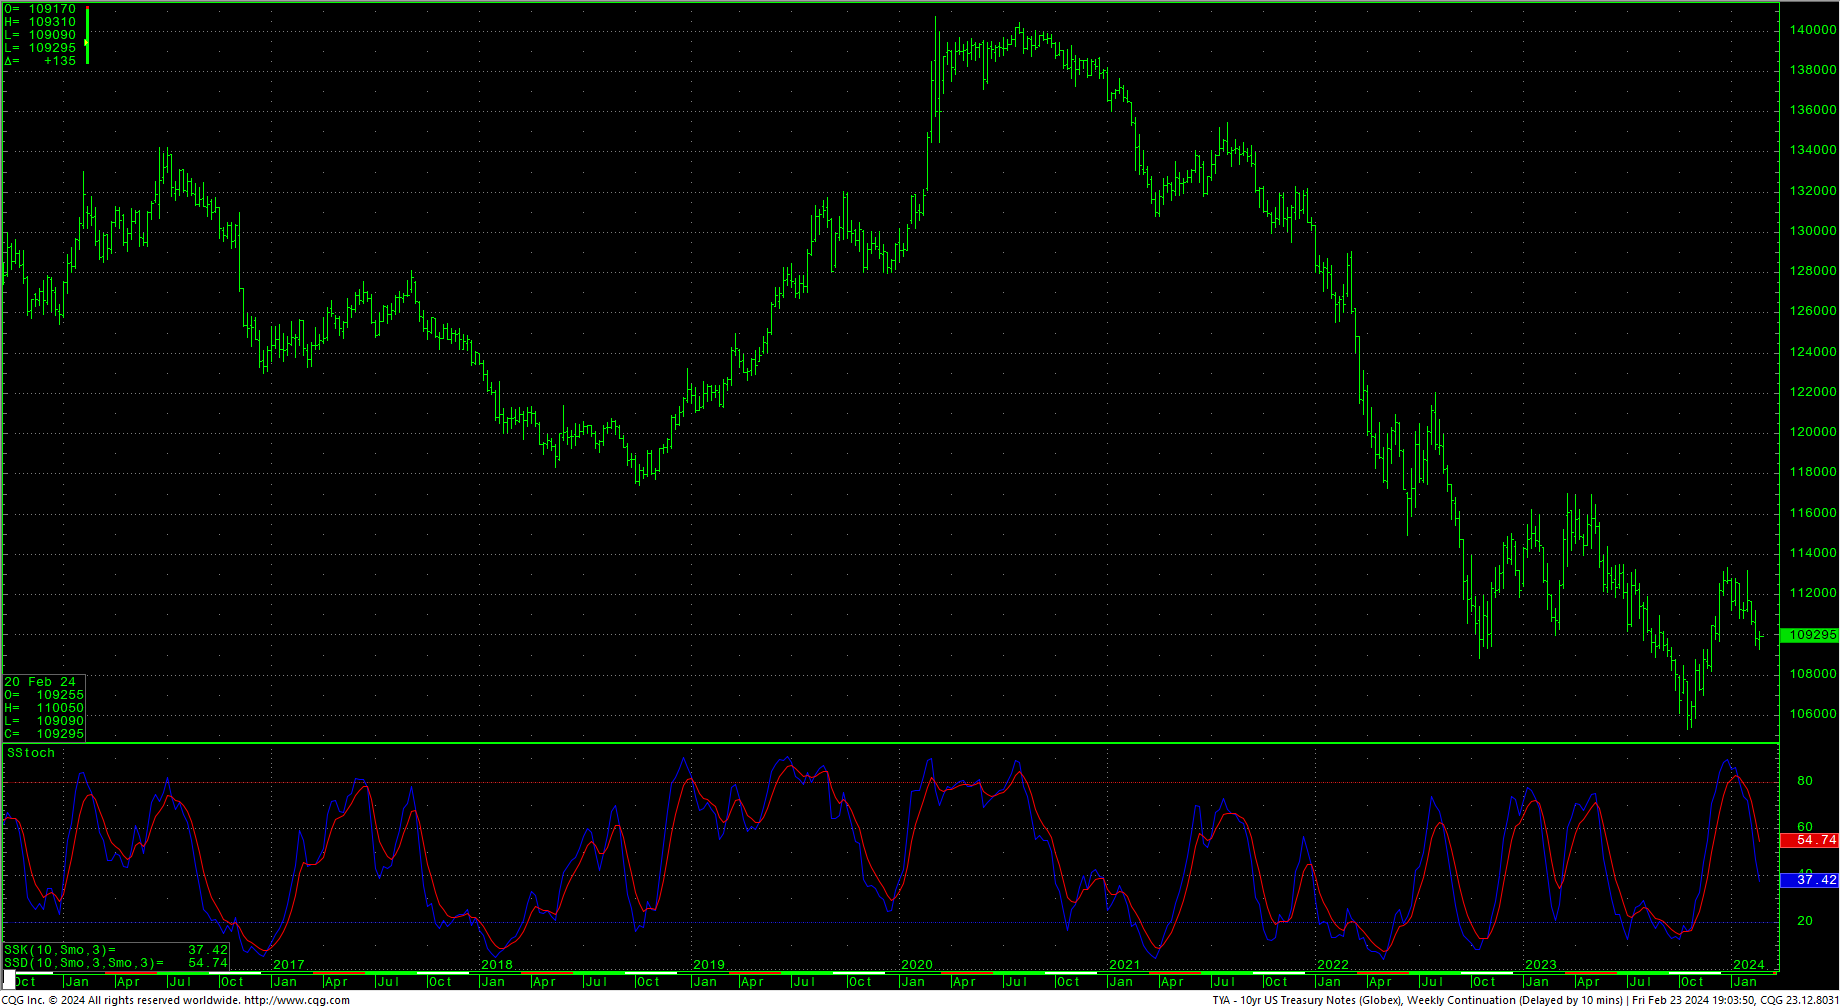
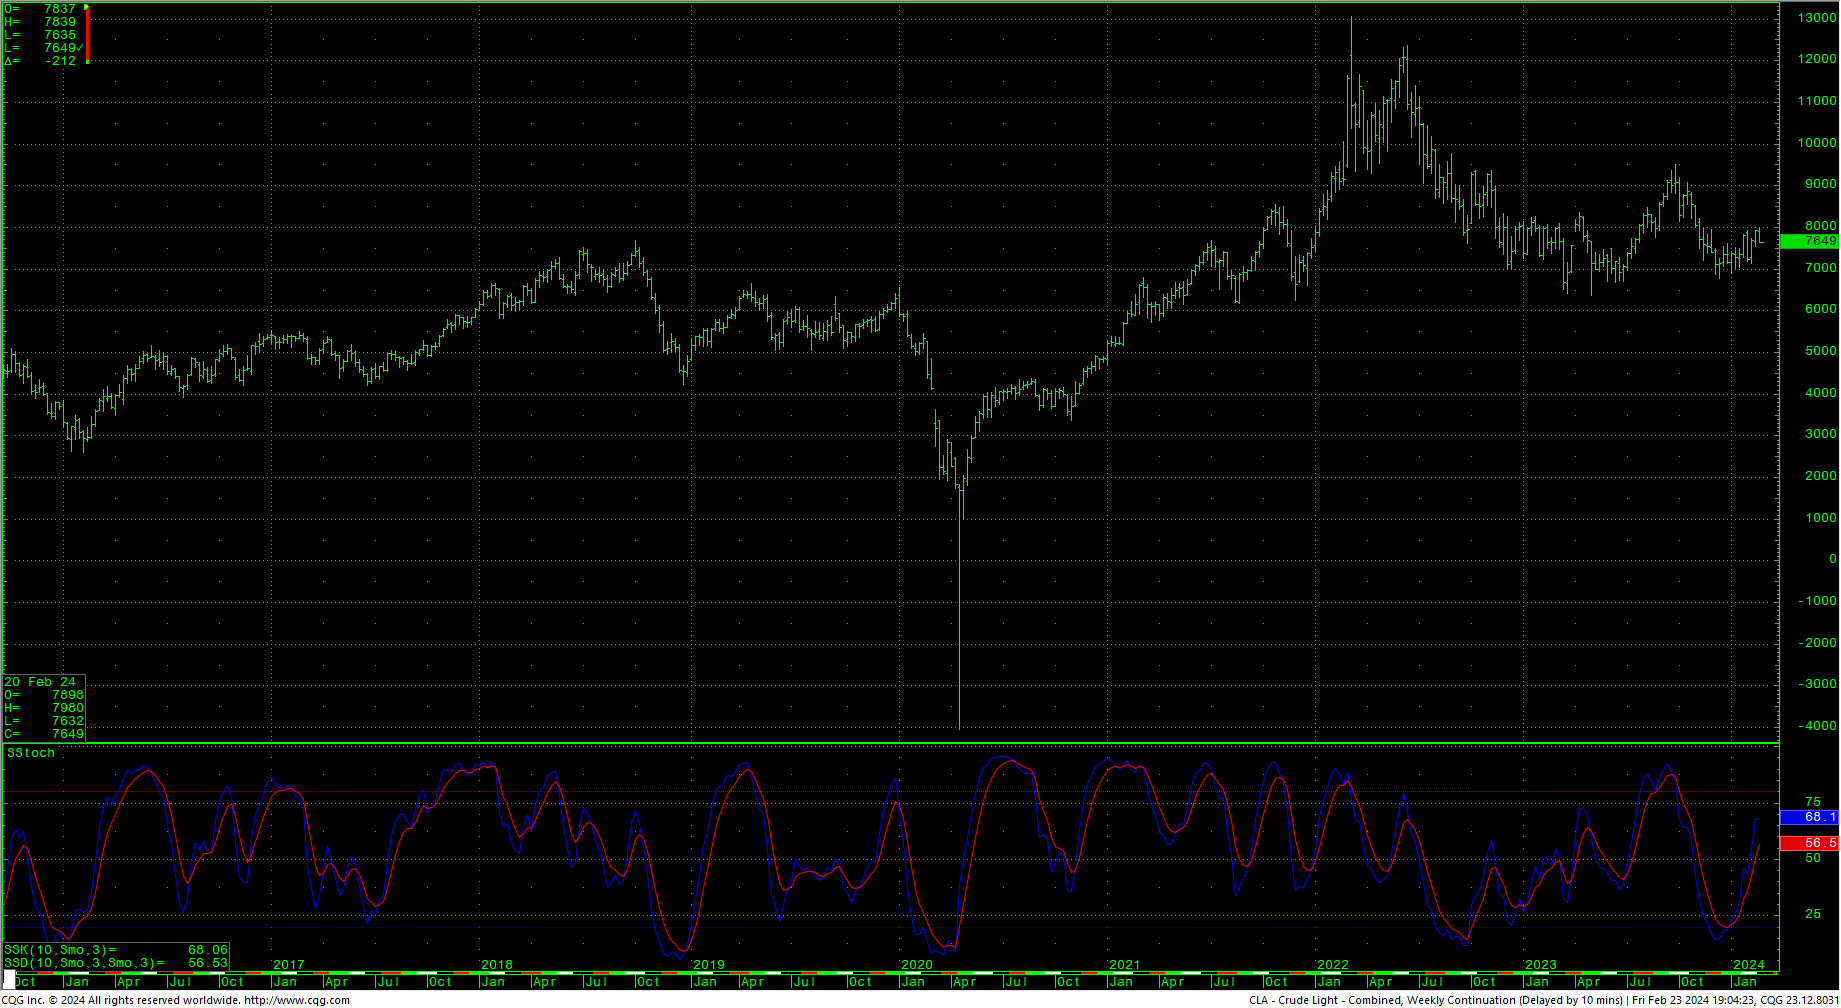
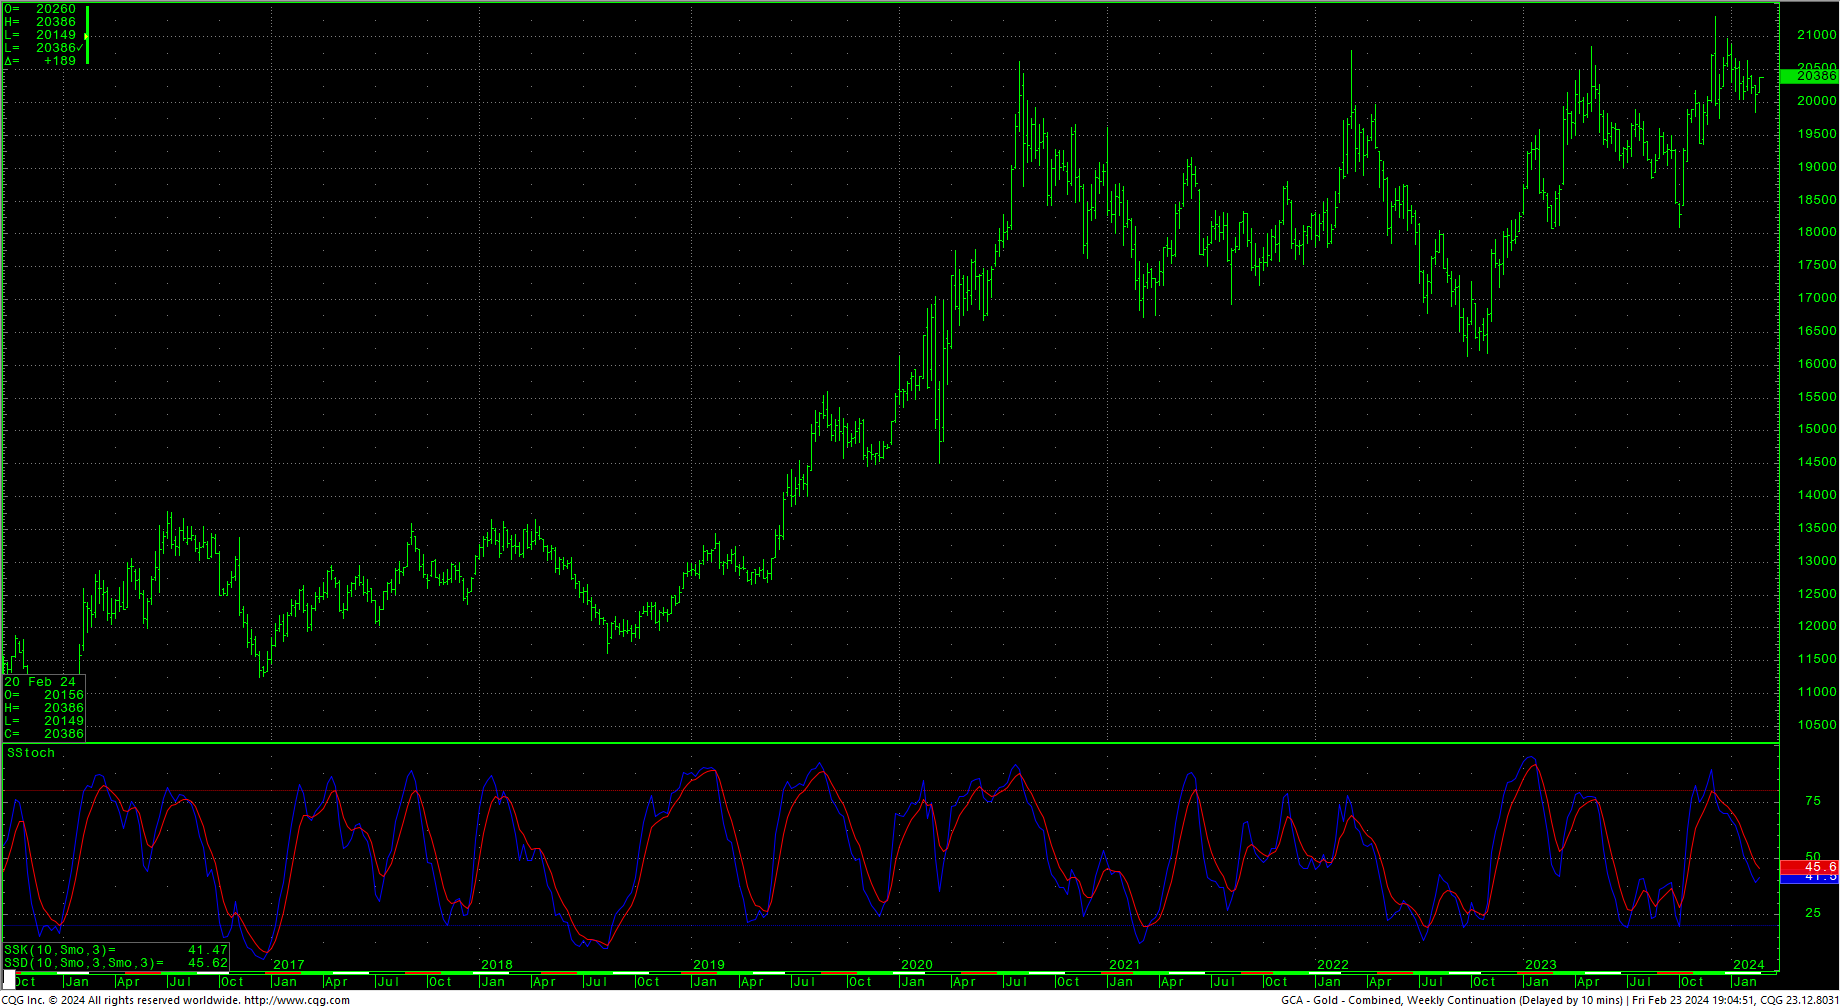
 Sentiment indicators remain in greed/extreme greed readings with breadth in a greedy but paltry trend. Last week in the AAII Sentiment Survey: Optimism Increases. The Dow A/D line hit 5752, at record highs. The VIX closed lower, on the bottom of an inside weeks range, after it hit a near three-month high just one week ago. The Put/Call ratio moved to 0.74, reflecting extreme greed. The 52-week, A/D moved up to +4.69% and indicates extreme greed. The Dow closed the week up +1.19%. The S&P was up +1.24%. The Nasdaq ended the week up +0.04%, the FANG moved into record highs, up +1.07% and the Russell finished the week higher, up +0.33%. The 10-year notes staged an upside reversal, closing fractionally higher in the upper end of the week’s range. For MAR24 S&R numbers, see the most recent Special Report. The CRB was down -1.08%…as crude oil staged a downside reversal week closing on the bottom of the week’s range. Gold rallied and closed on the top of the range (Note: the FEB24 contract leaves the board this week.) The CoT is still not making major moves as it shows very little directional clues.
Timing Points
Wednesday marks minor timing.
- 02/28 **
- 03/04 ** (bonds)
CNN Fear & Greed Index
 AAII Investor Sentiment Survey
 Dow Jones Industrial Average Hourly HLC
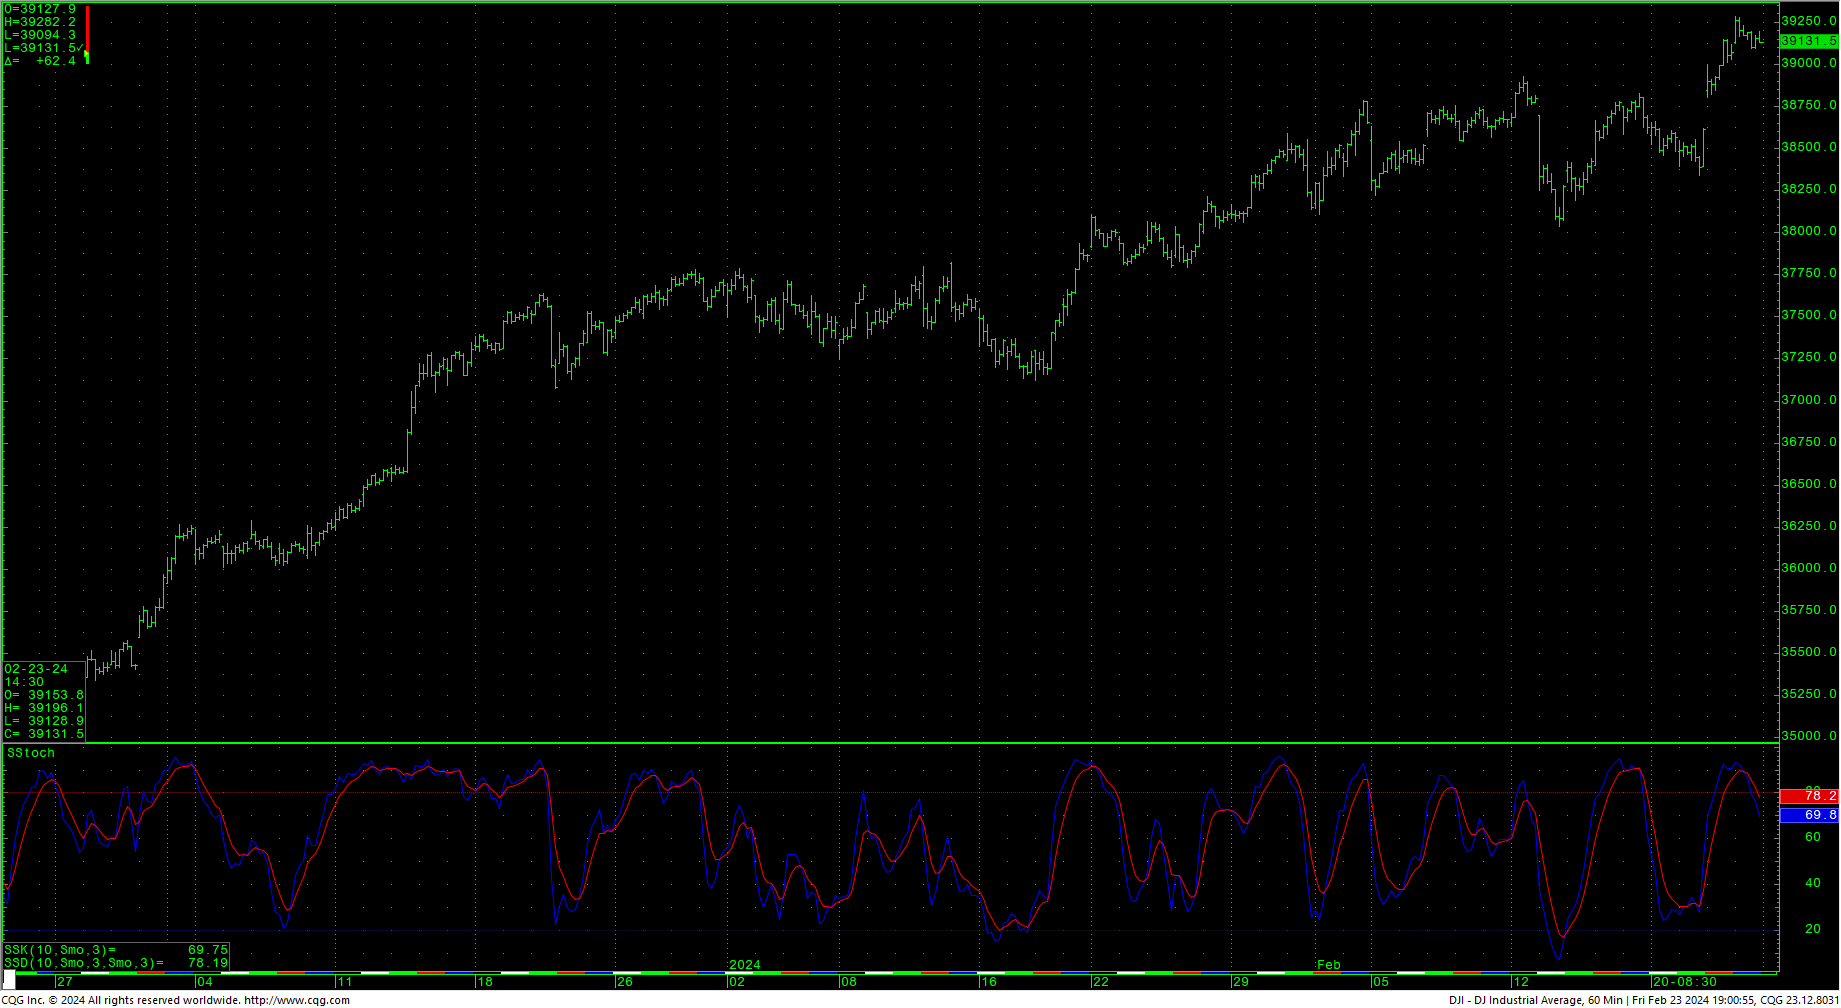 The Dow closed higher Friday but on the bottom of the day’s range as prices reacted to overbought conditions on the hourly. The action left a small bull flag on the hourly, but the stochastics are still high. The Dow hit a long-standing target at 39075 and closed slightly above that level. Resistance is 39196 and pivotal at 39210/39212. A drive back above 39212 should test 39235 with potential to the intraday highs at 39282/39283. Closes over 39283 can test 39651 and will renew momentum toward weekly objectives at 40245.4. Obviously, 40000 is a critical psychological area. Closes over 40245.4 will offer longer-term potential to targets in the 45244 area. Above 45244 gives monthly counts to 47400.
Support is at 39094 and pivotal at 38988. A breakdown under 38988 can carry to 38807, 38760 with full counts to pivotal short-term support of 38661/38658. Closes under 38658 setup a move toward 38547/38445. A breakdown under 38445 opens counts to 38202 and 38039 with potential to critical short-term support of 37947/37940. Closes under 37940 can carry to 37122 with counts toward critical short-term support of 36775. Closes below 36775 open counts to 35224.
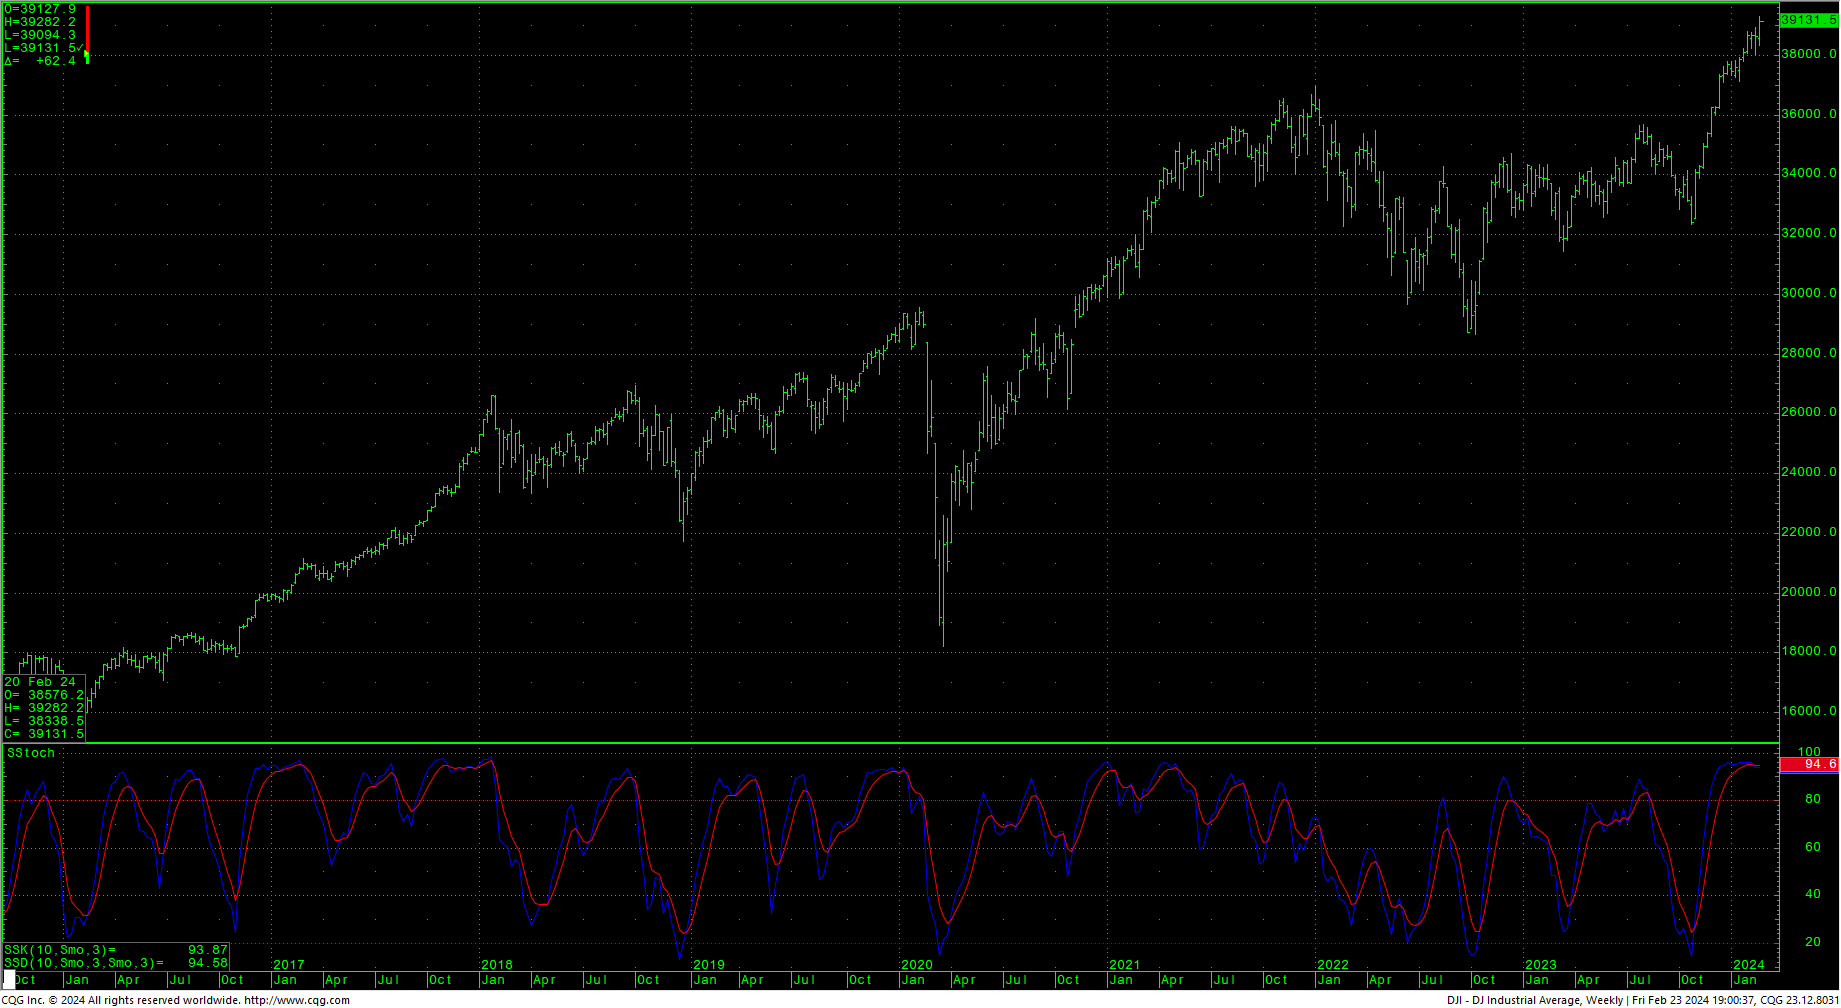
Dow Jones Industrial Average Weekly HLC
Resistance
|
Support
|
S&P 500 Cash Index
S&P 500 Index Hourly HLC
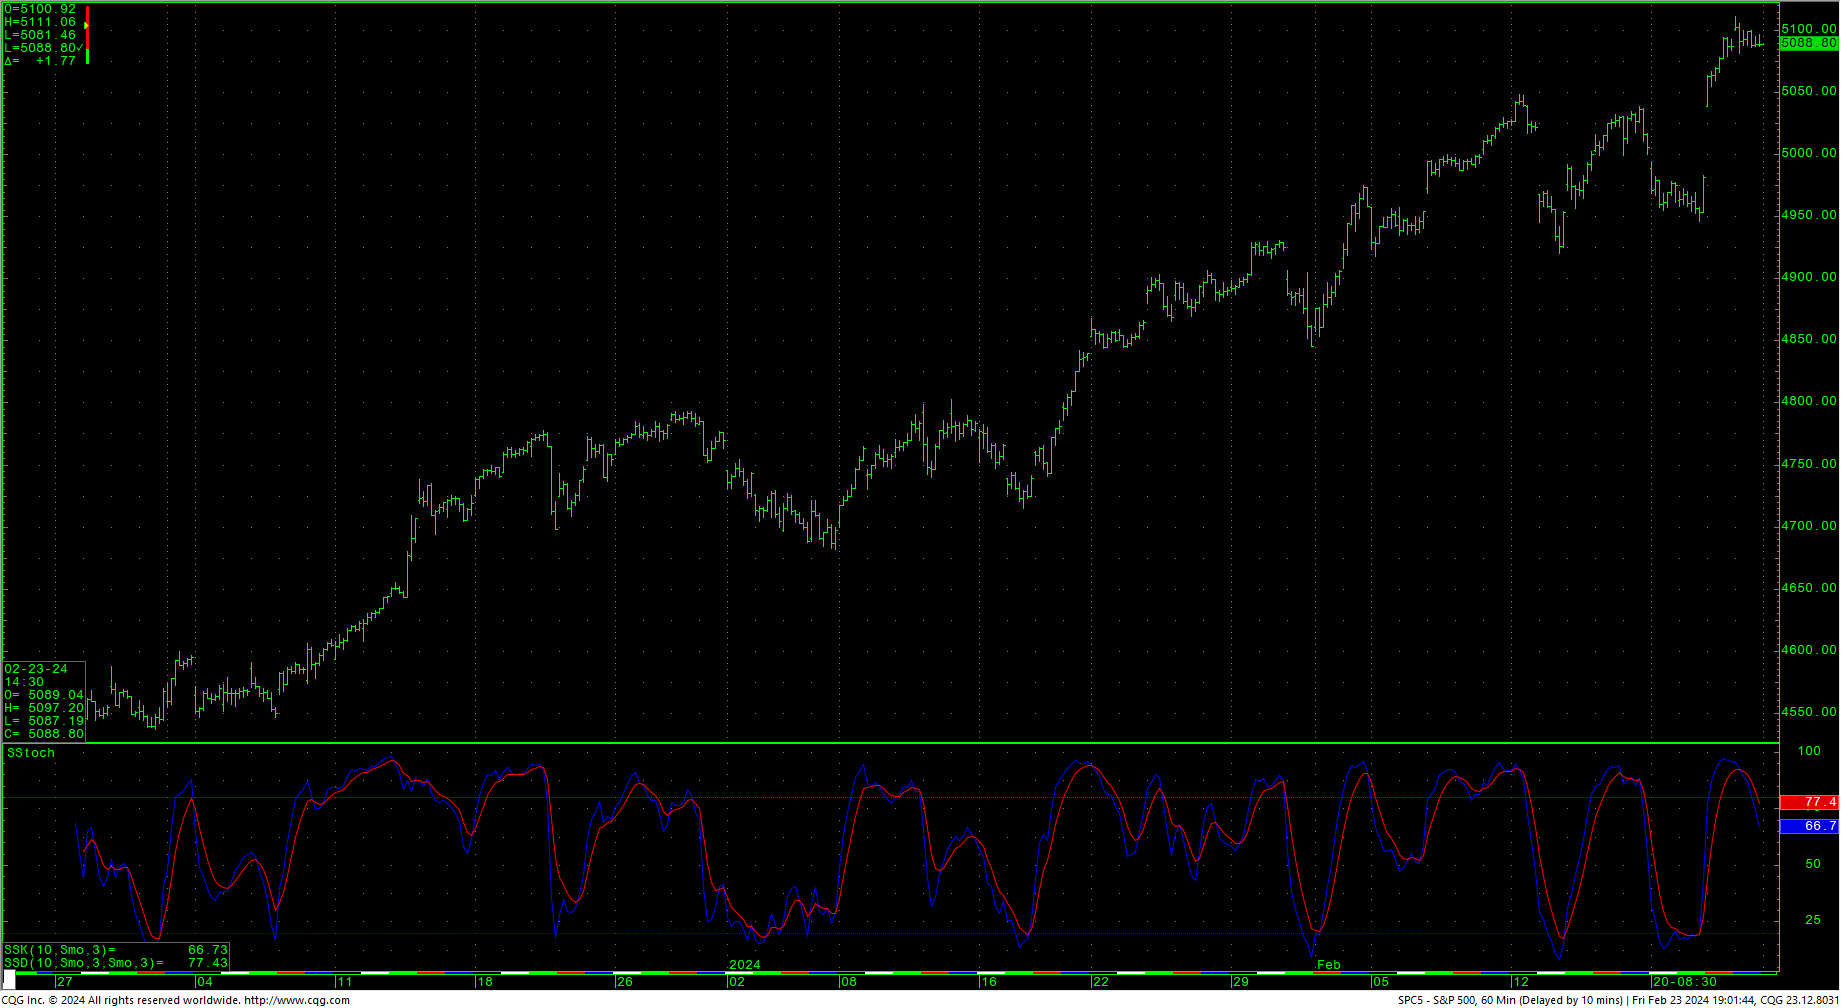 The S&P eked out a higher close Friday but ended at the bottom of the day’s range as prices followed Thursday’s massive surge with a reaction to overbought conditions short-term. Like the Dow, there might be a small bull-flag on the short-term charts. Big picture, as outlined earlier, upside action is needed immediately to work against the stochastics and the gaps. Prices hit the 5100 level and fell short of another upside target in the 5144 area. Resistance is 5099/5100 and a drive back above that area sets up a test of the intraday high at 5111 with counts to 5144. Closes over 5144 set up a drive to 5288 with counts toward 5432. A breakout over 5432 will open potential to the 5720 area. Closes over 5720 offer upside targets at 6000/6008.
S&P 500 Index Weekly HLC
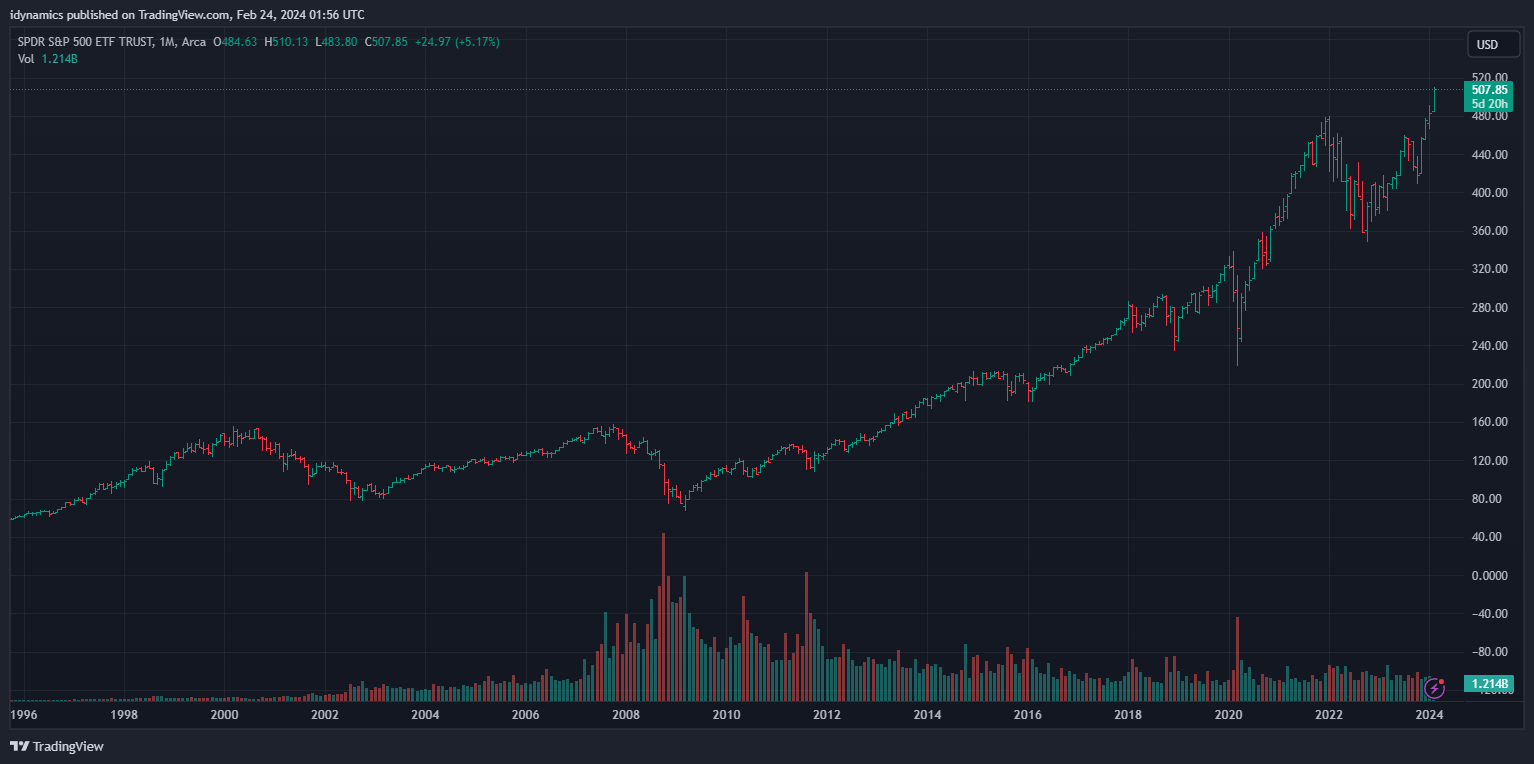
 SPY SPDR ETF
 Support is at 5081 and 5066. A breakdown under 5066 sets up a move to 5038 (gap), 5015 with counts to pivotal near-term support of 4993/4990. Closes under 4990 suggest 4959 and possibly 4912 while opening potential to critical support of 4866/4863. A breakdown under 4863 should test 4726/4714 with trading support at 4845 and 4808. Daily closes under 4714 count toward 4607 with trading support of 4682 and potential to critical short-term support of 4488/4485. Daily closes under 4485 set up a move to 4341 with counts to 4103.
Resistance
|
Support
|
Charts courtesy of CQG, Inc., CNN, Koyfin, Trading View, and AAII