
TECHNICAL ANALYSIS (by Intraday Dynamics)
Major Indices Week of March 7, 2025
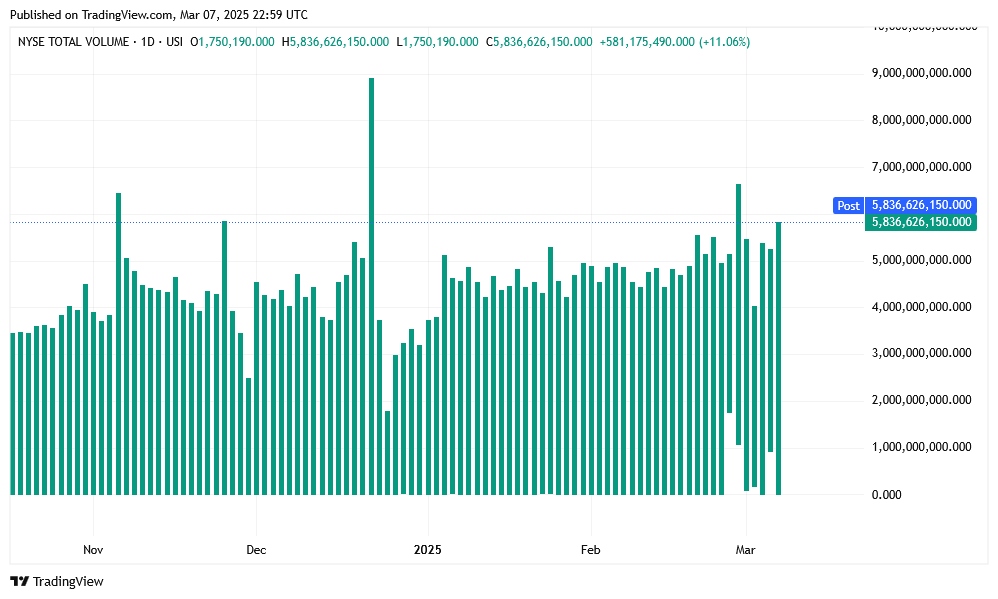
 NYSE Volume
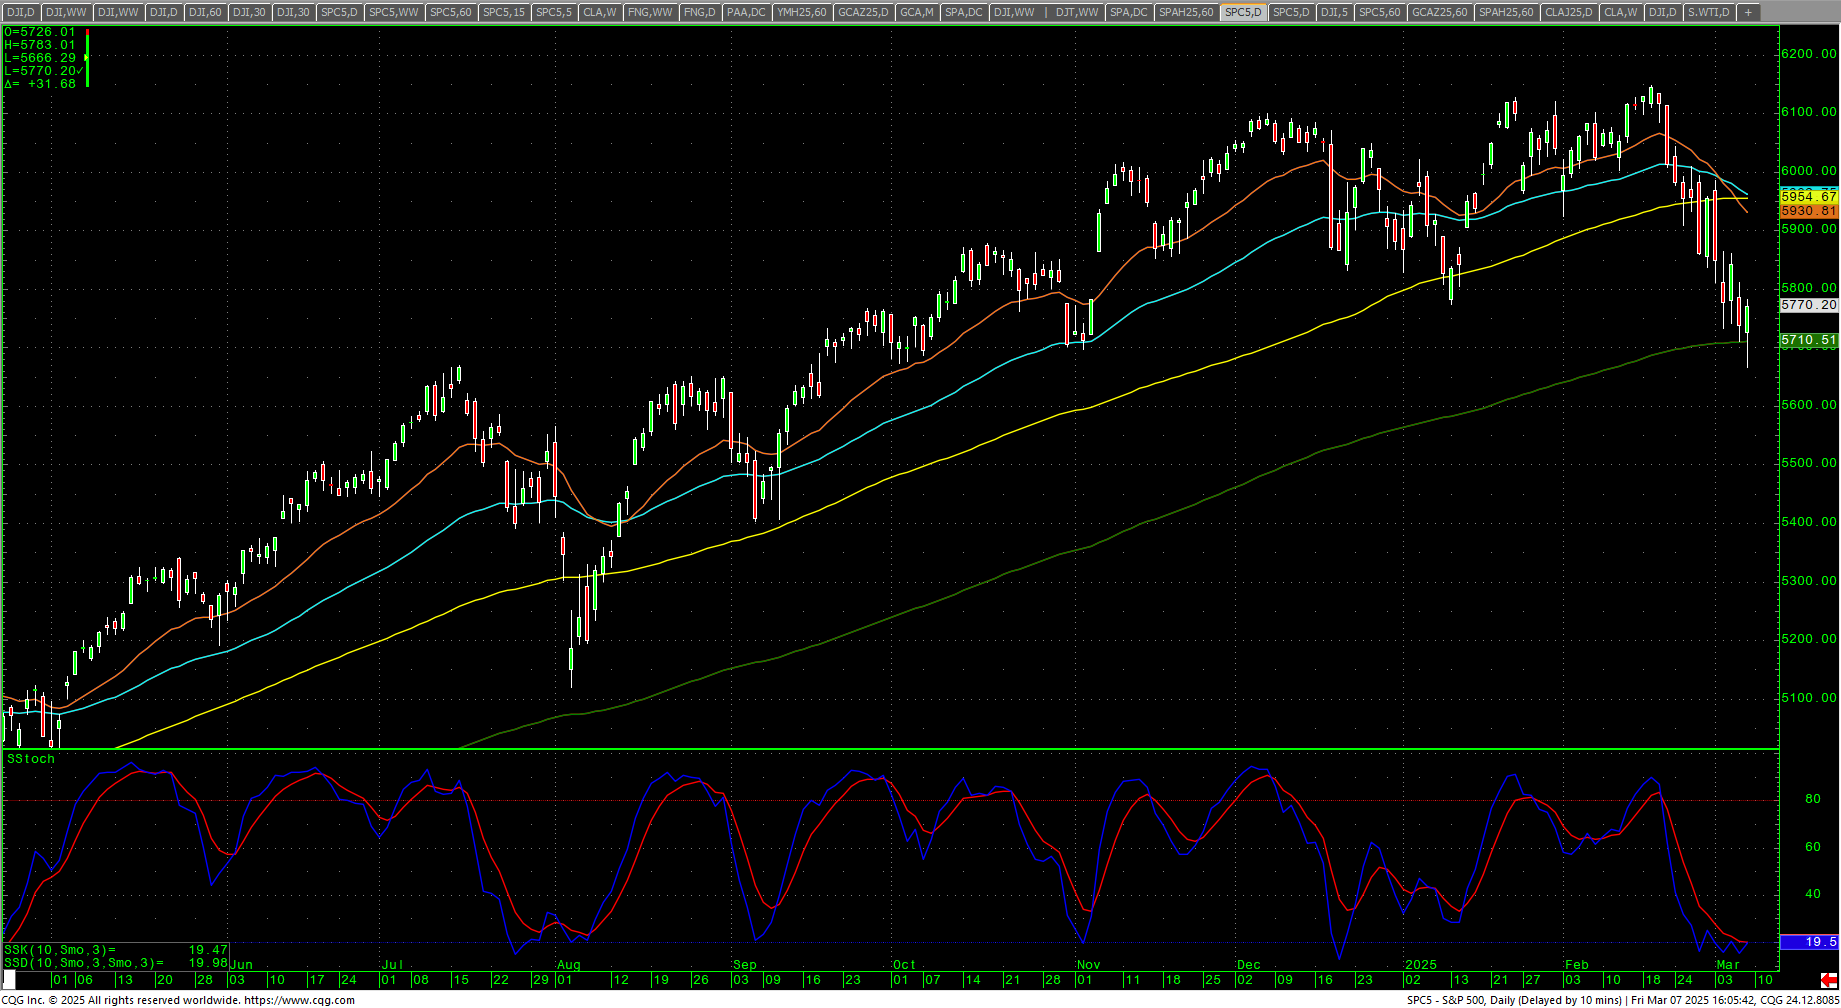
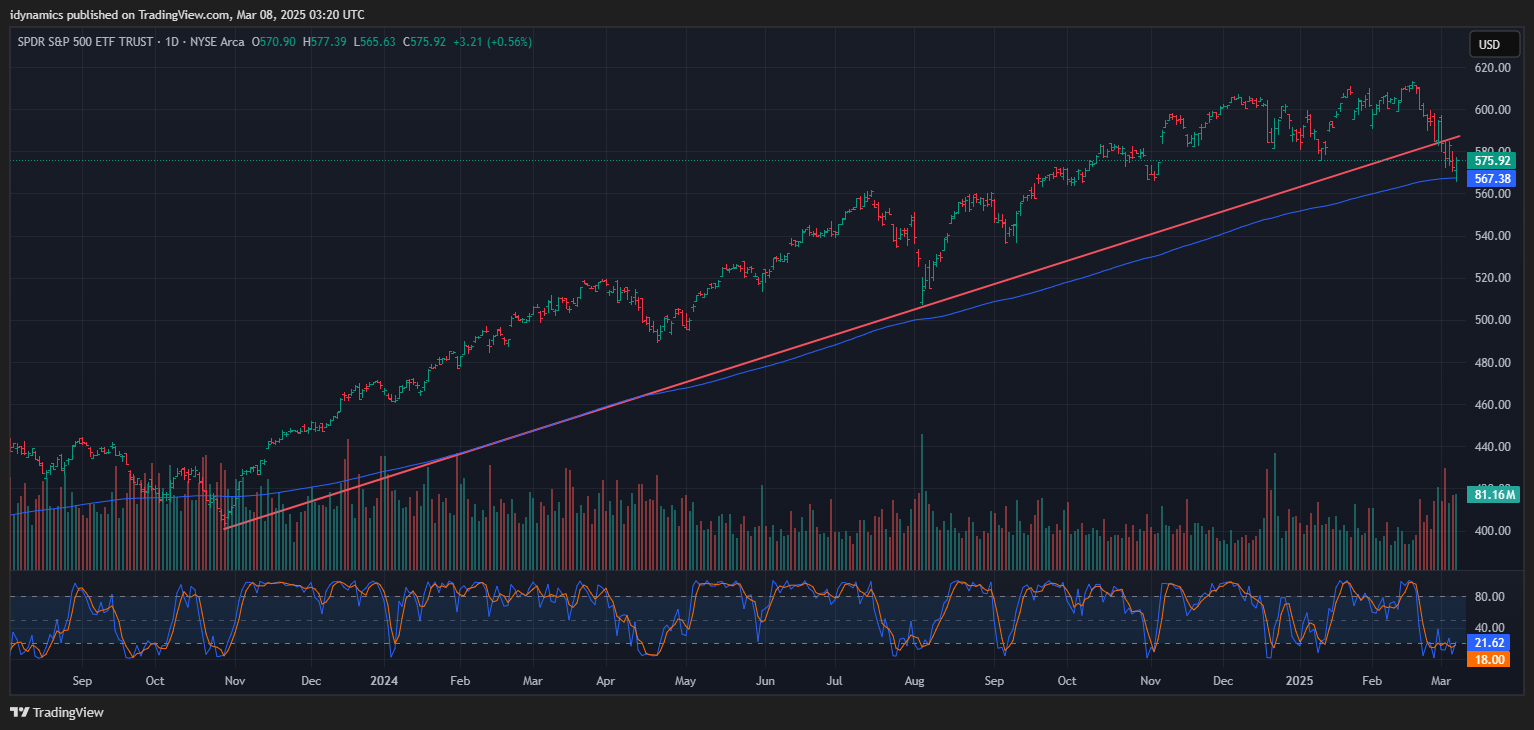
 SPX Daily Candles
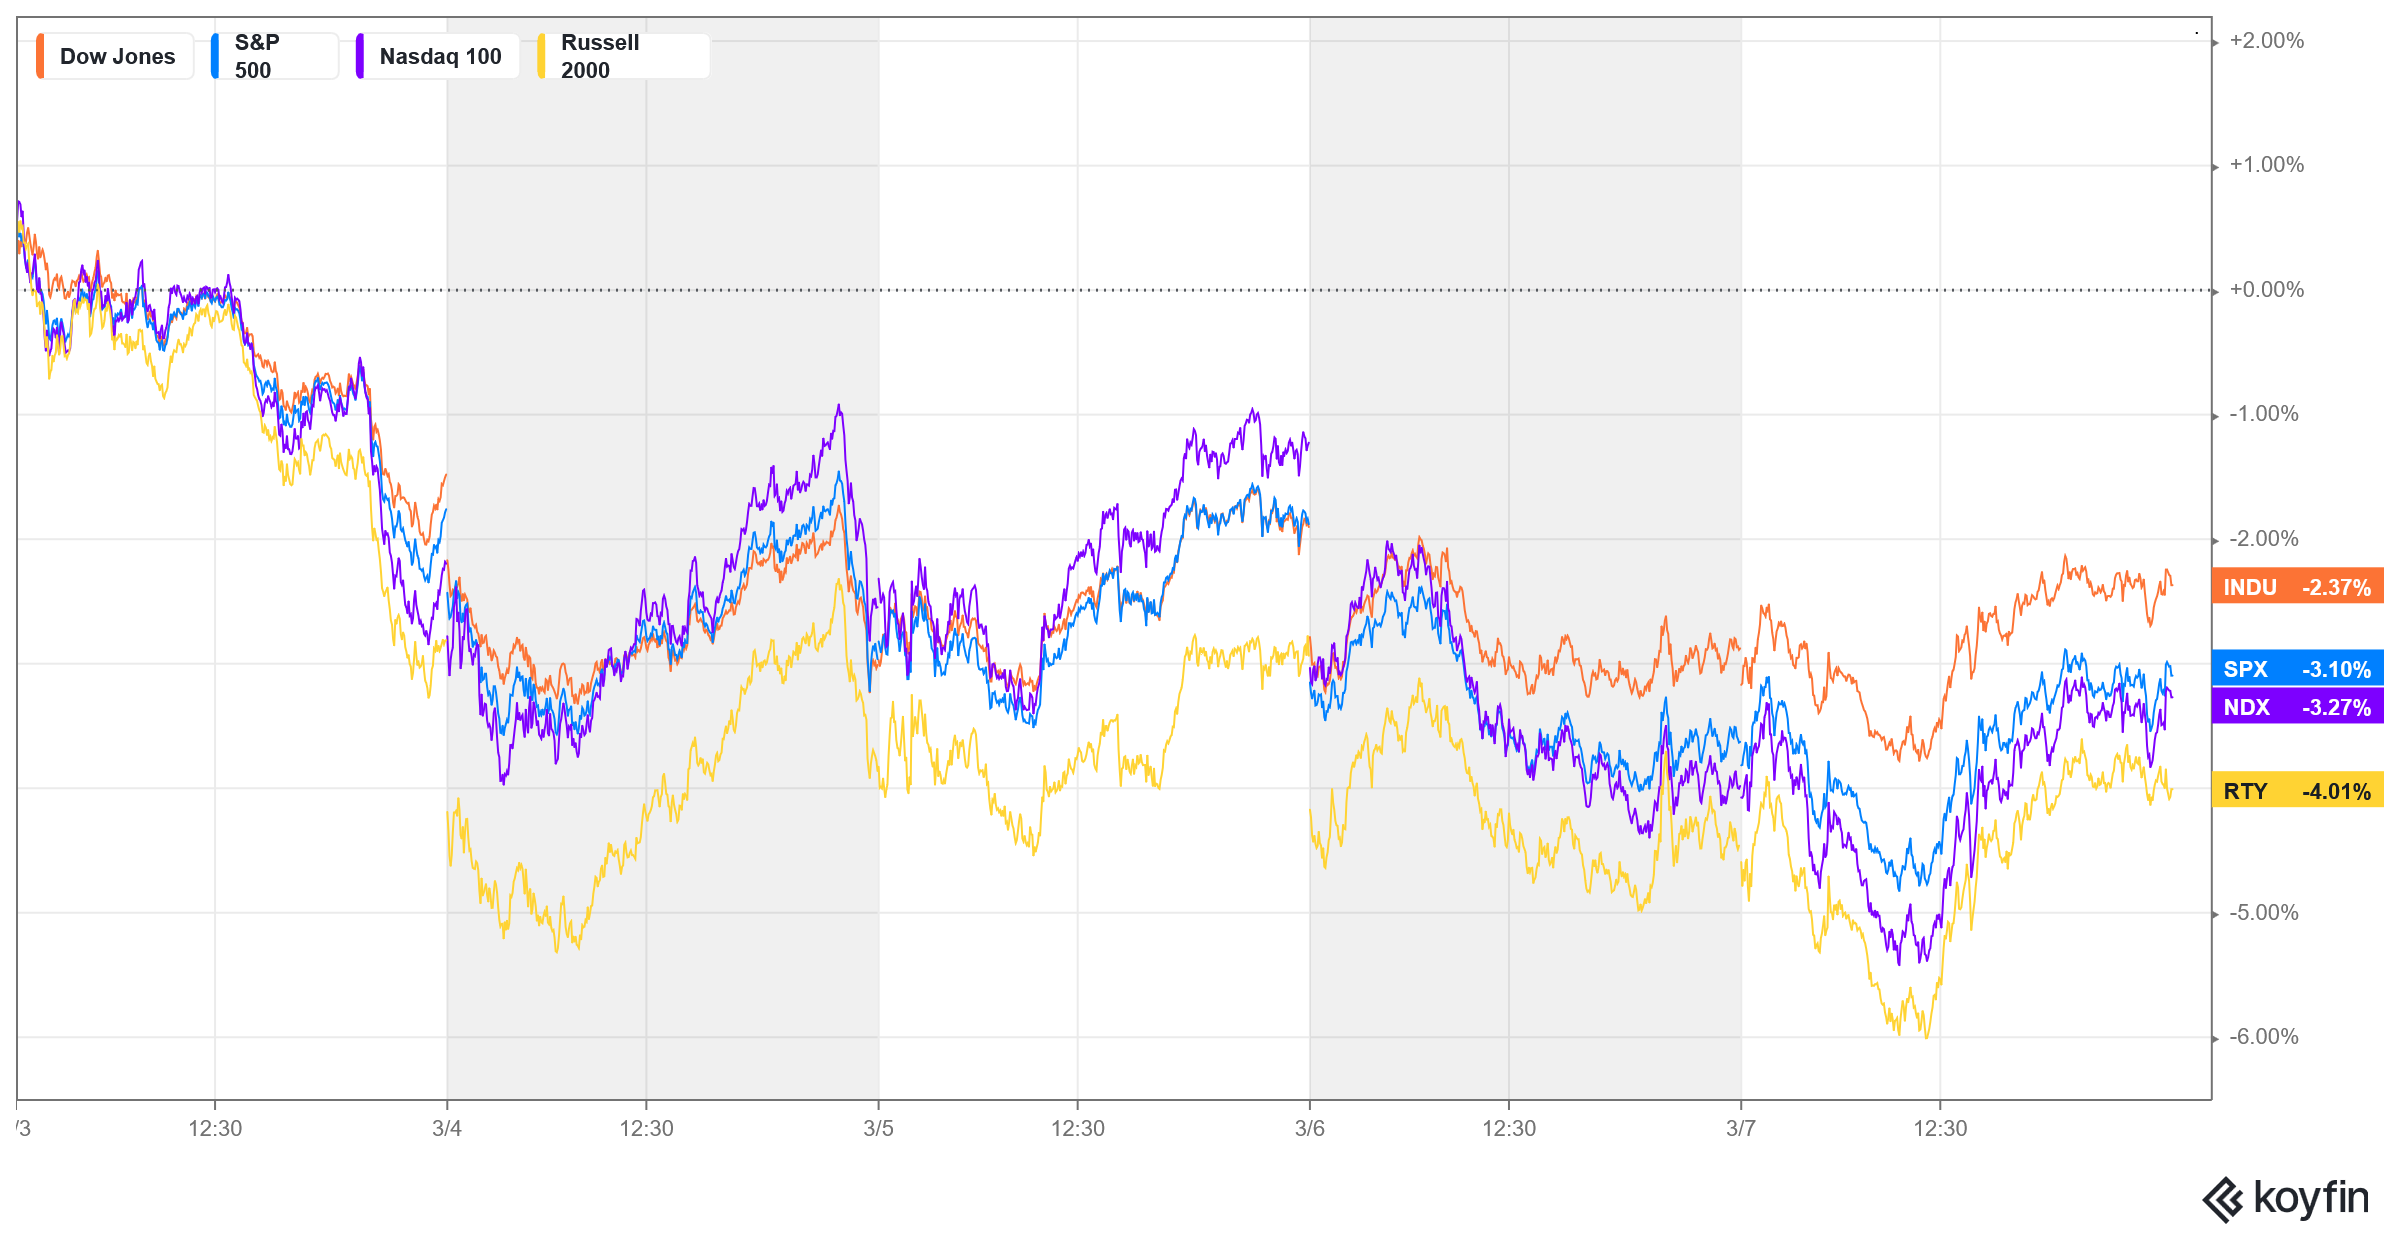
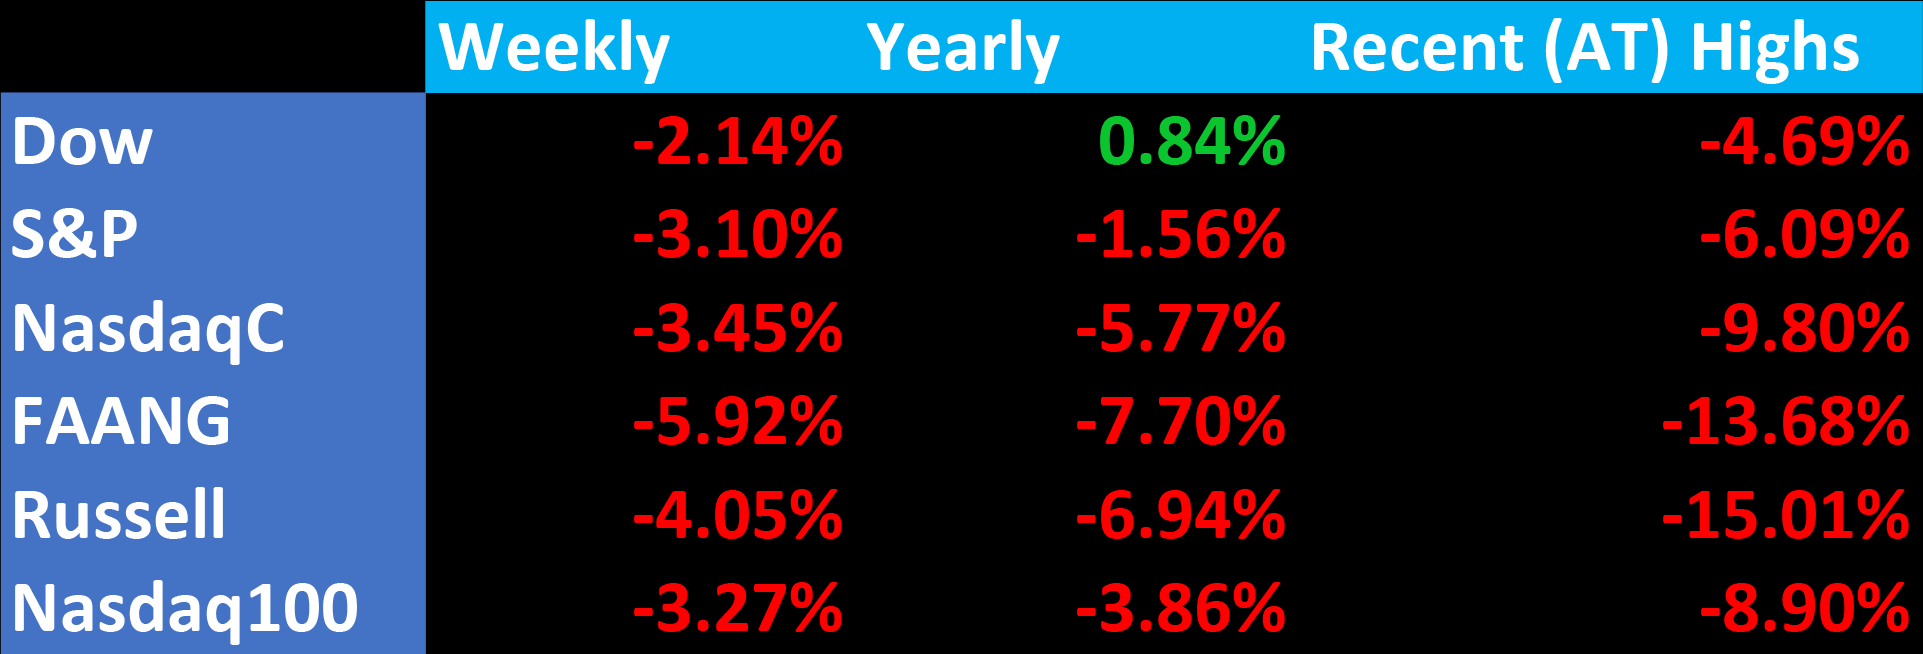
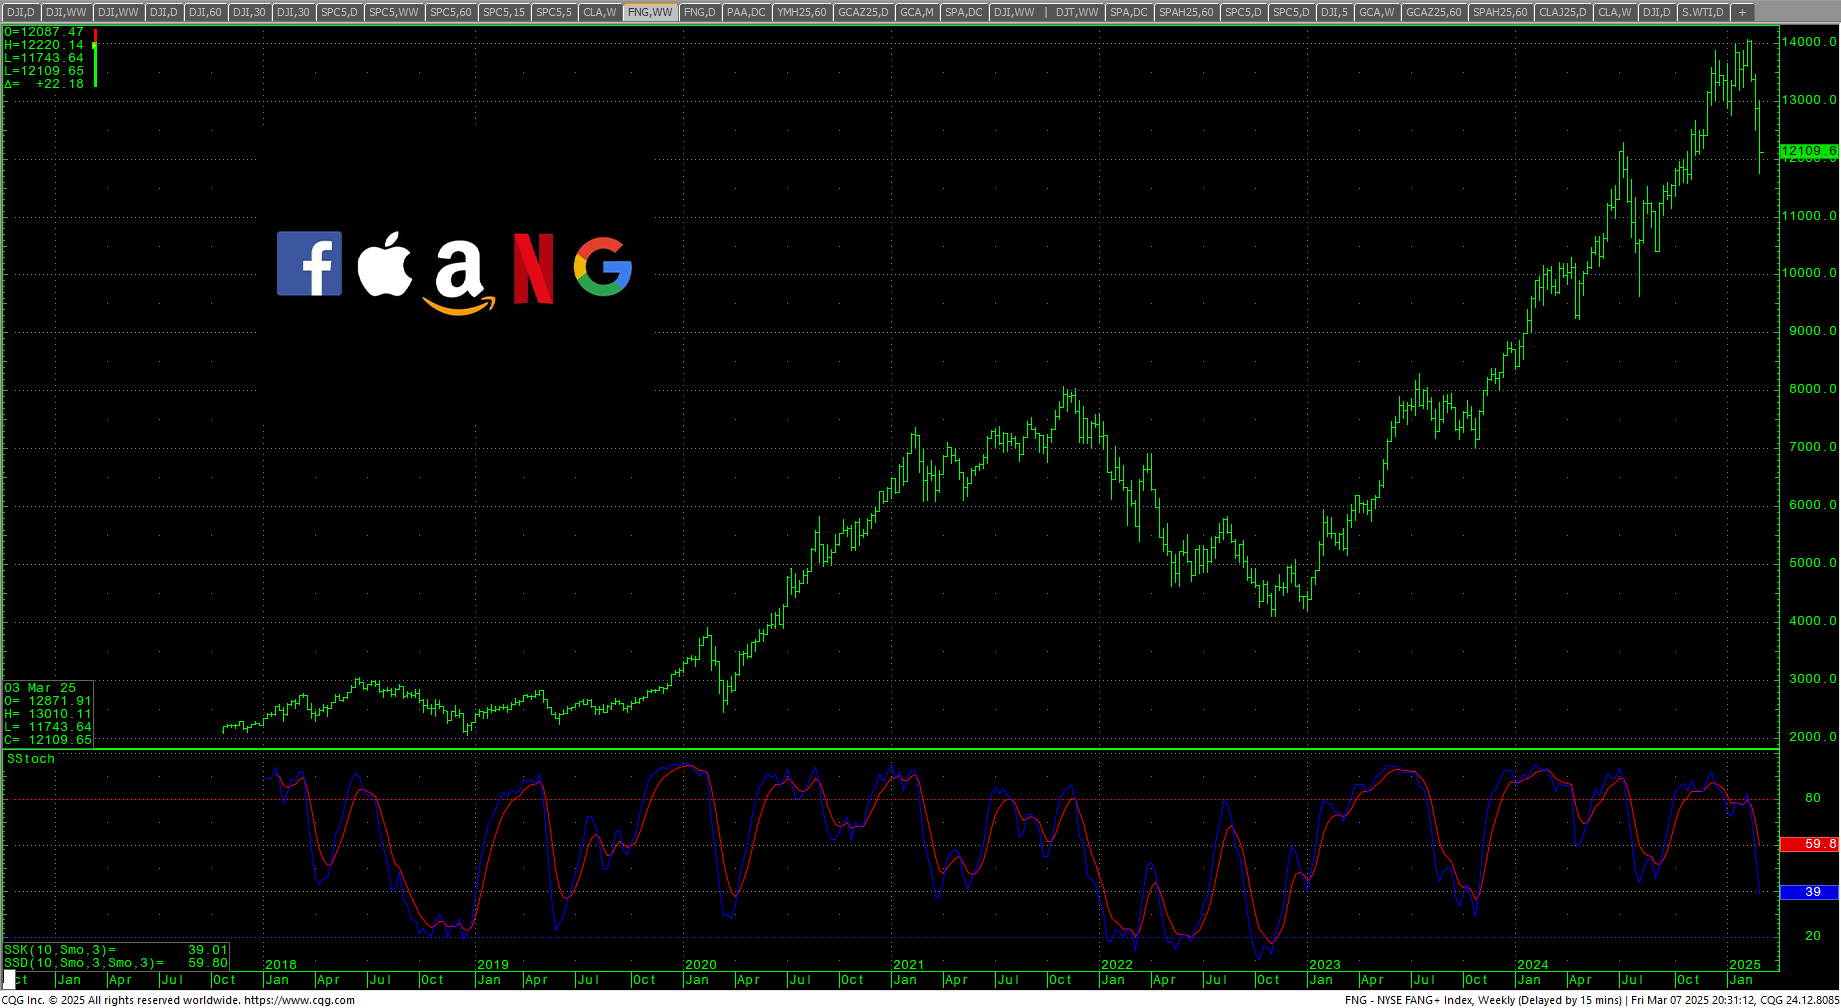
 Stocks traded another highly volatile week as prices are still going through Tariff Tantrums (‘the most beautiful word in the dictionary’) creating massive whiplash. Some big technical breakdowns as most major indexes erased 100% of all the gains since the last election, some trendlines were penetrated and numbers reaching near “correction” levels as the Russell is down -15% and the FANG off -13.68%. Only the Dow remains higher for 2025 and the crazy action has turned sentiment decidedly to fear and extreme fear.
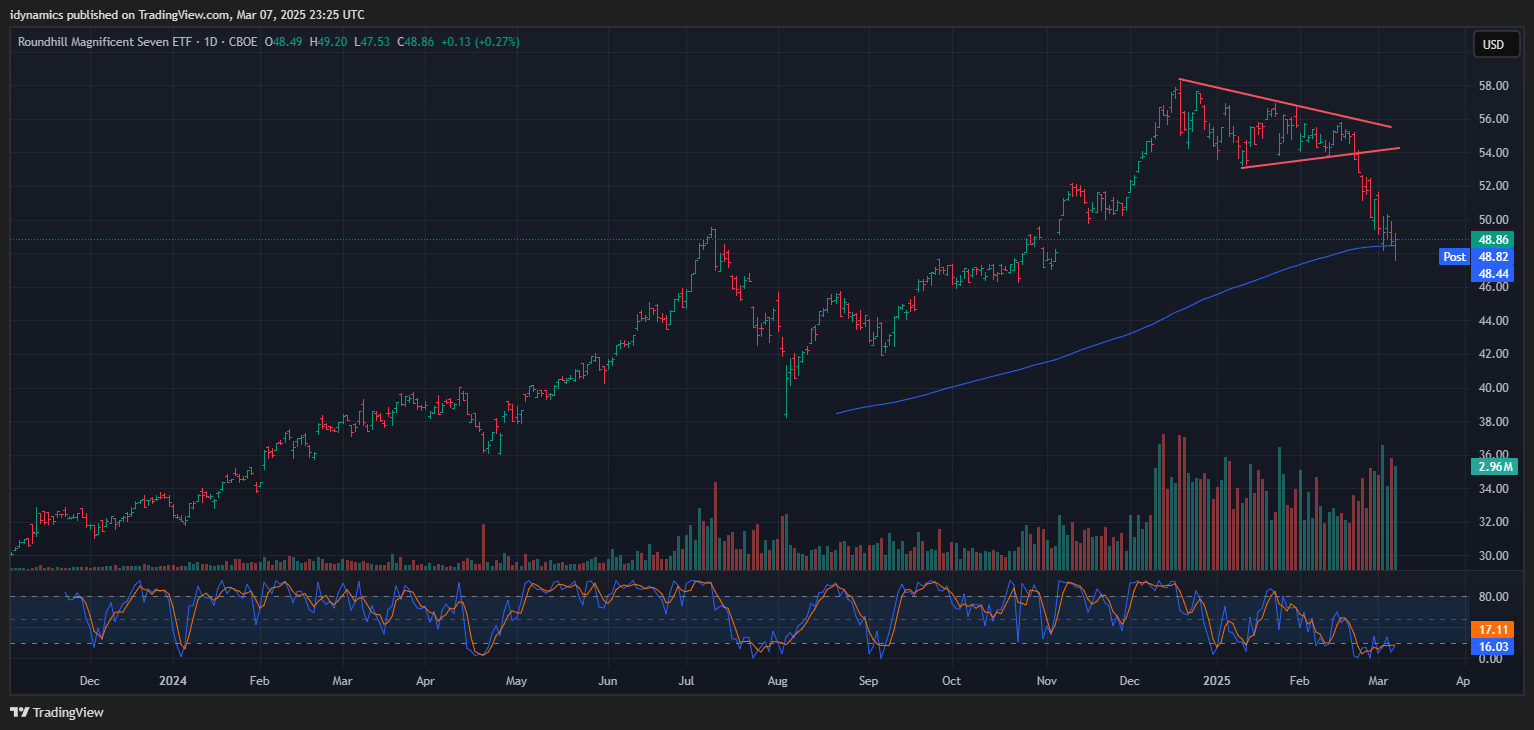
Prices recovered on Friday from deeply oversold short-term conditions on the hourly charts and did so on some fairly high volume. Tech stocks led the way down. Right now, the MAGS (Magnificent 7) chart holds the clues. It is testing the 200-day MA and traded under a critical level of 48 Friday but recovered to reverse higher. Closes in the MAGS under 48 should trigger a sharp move toward the 42-40 level and will likely take the rest of the tech stocks with it.
MAGS (Magnificent 7) Daily H-L-C
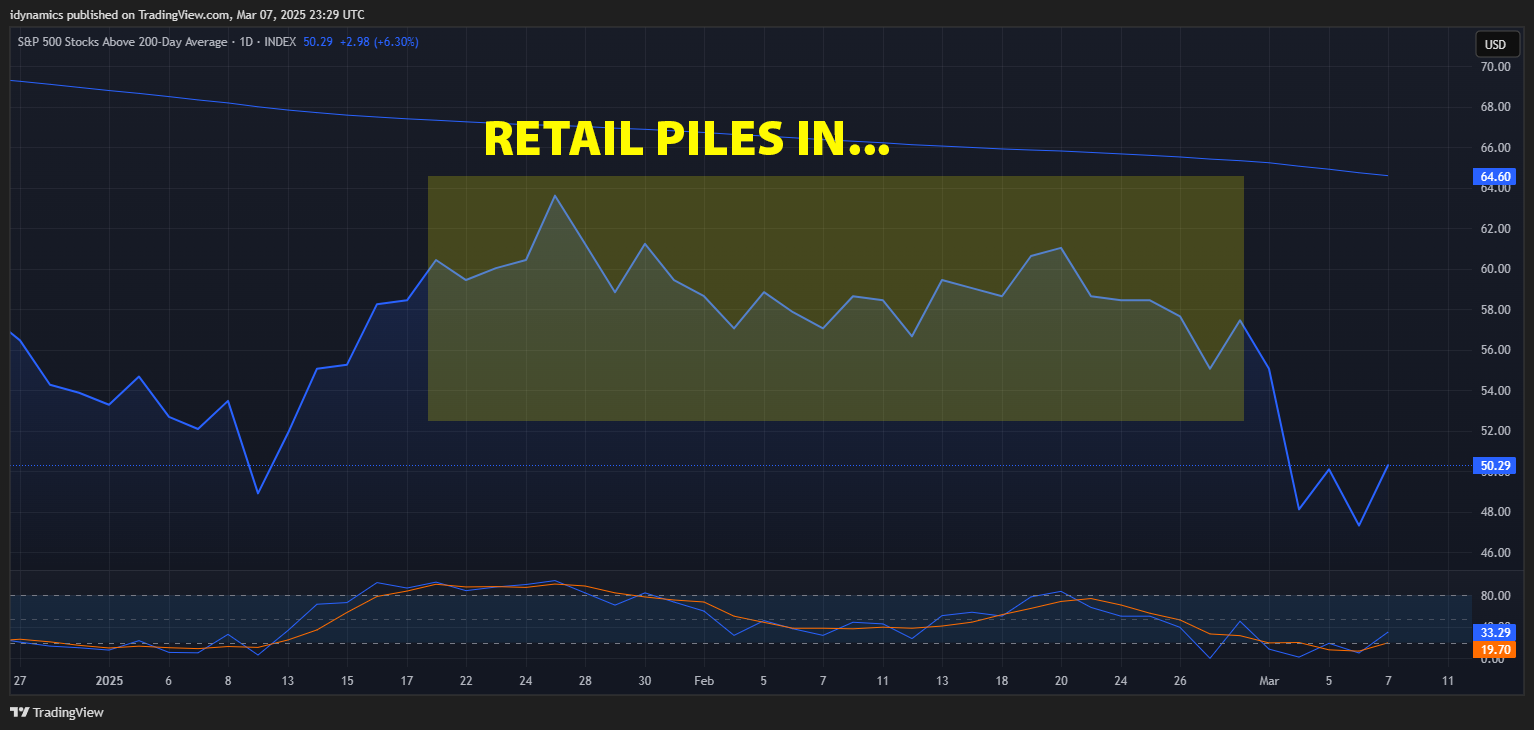
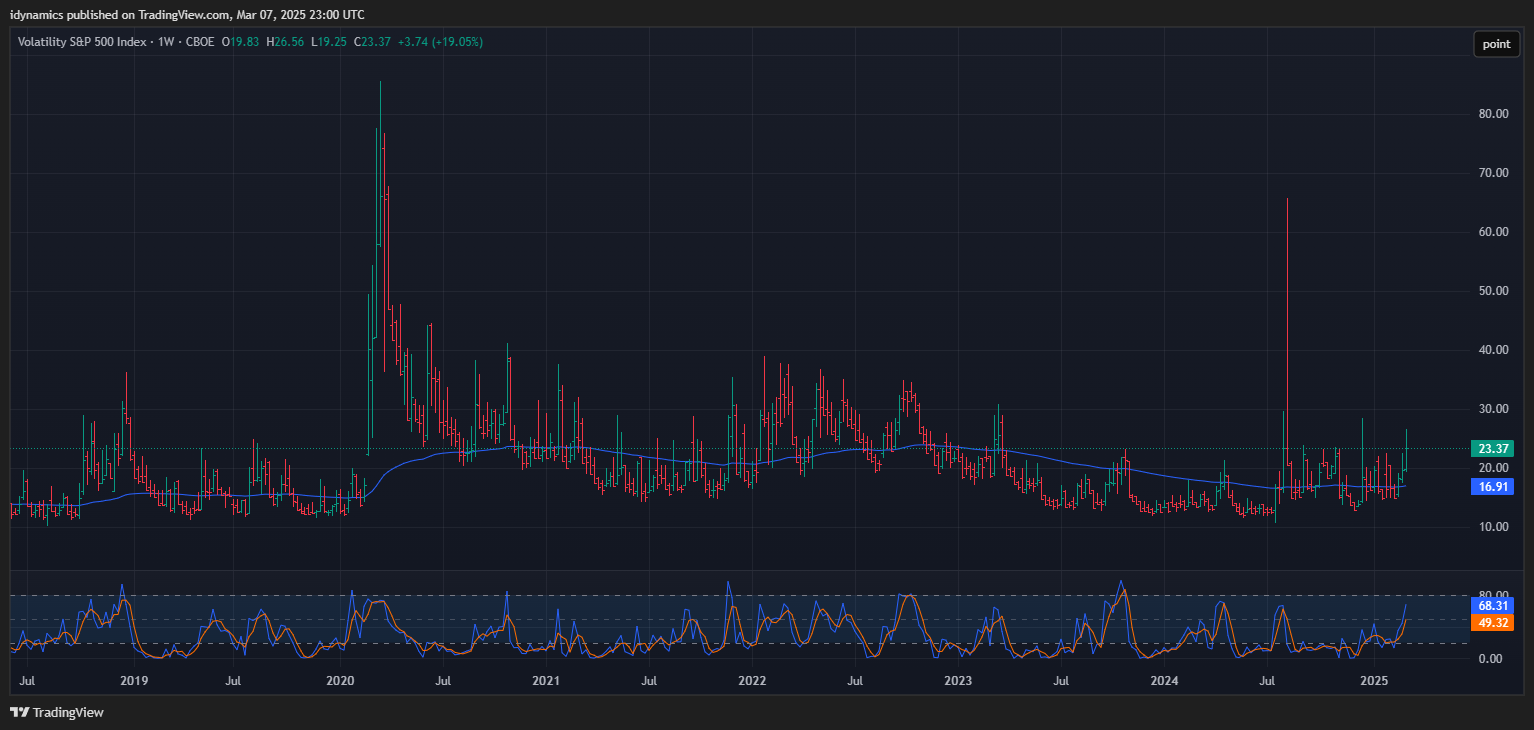
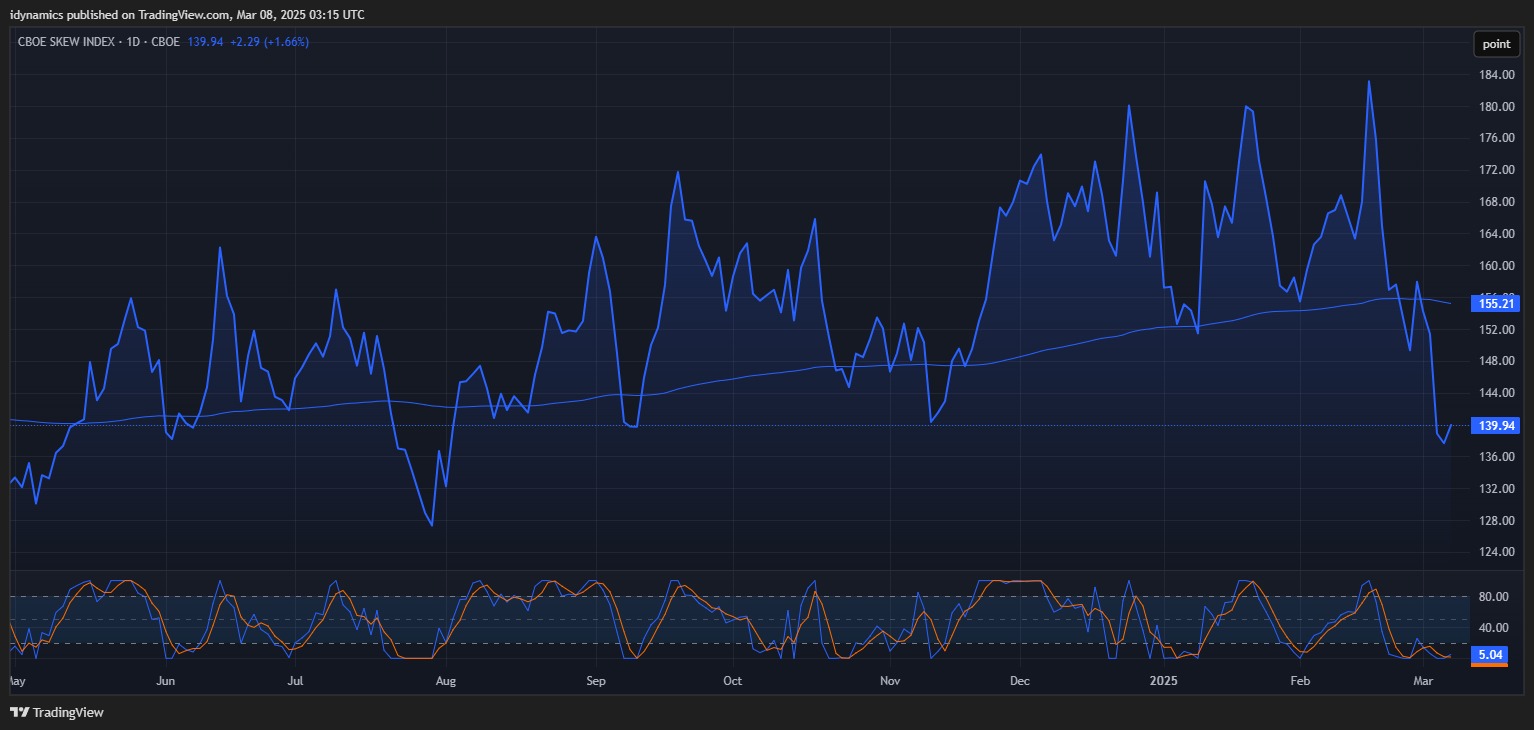
 As mentioned, the action has pushed most pedestrian sentiment into fear and extreme fear while the VIX finally heated up a bit last week. The SKEW has backed off of its record high of three weeks ago. As pointed out in the short-term timing update posted Friday, Week of March 14, 2025: Reality Check? Will We Hear Air Raid Sirens Next Week?…reports show that 25%/33% of all trade in the market since the election has been retail traders. Weak hands have piled into the market since November and the number of S&P 500 stocks under their 200-day MA suggests a potential bull trap.
S&P 500 Share of Stocks Under the 200-day MA
 This coming week marks extremely critical cycle timing. Read the latest short-term update for details. The news this coming week will focus on inflation with CPI and PPI on Wednesday and Thursday.
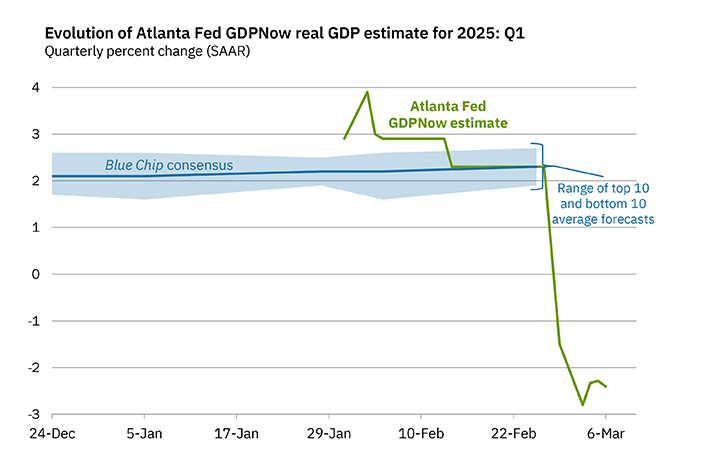
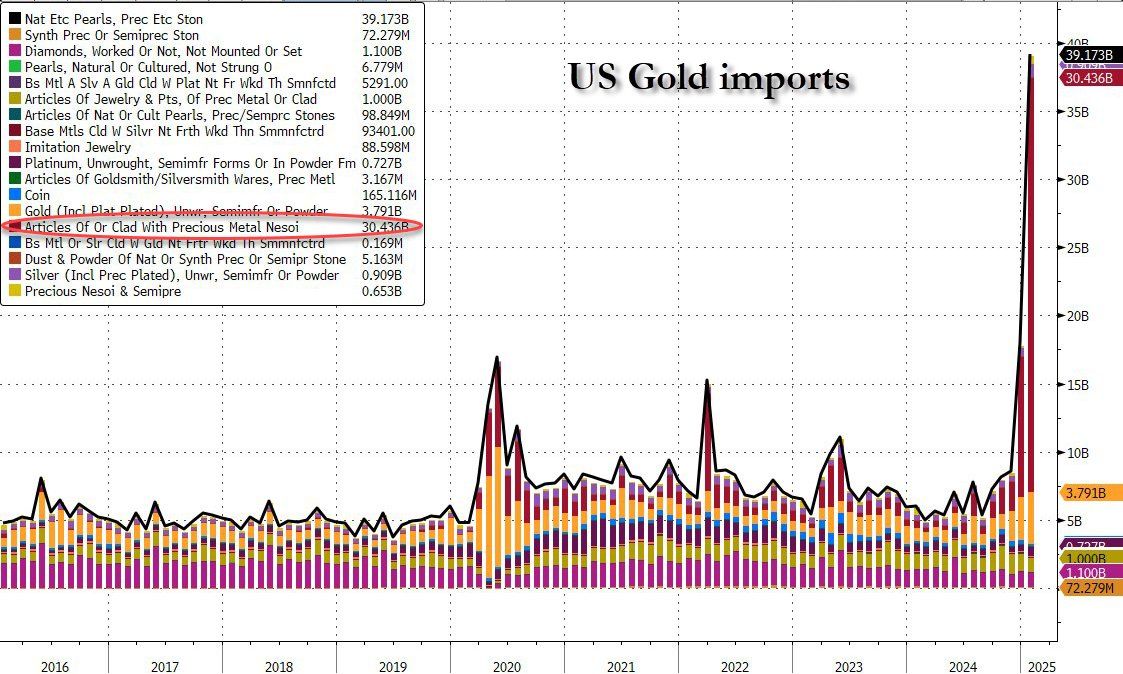
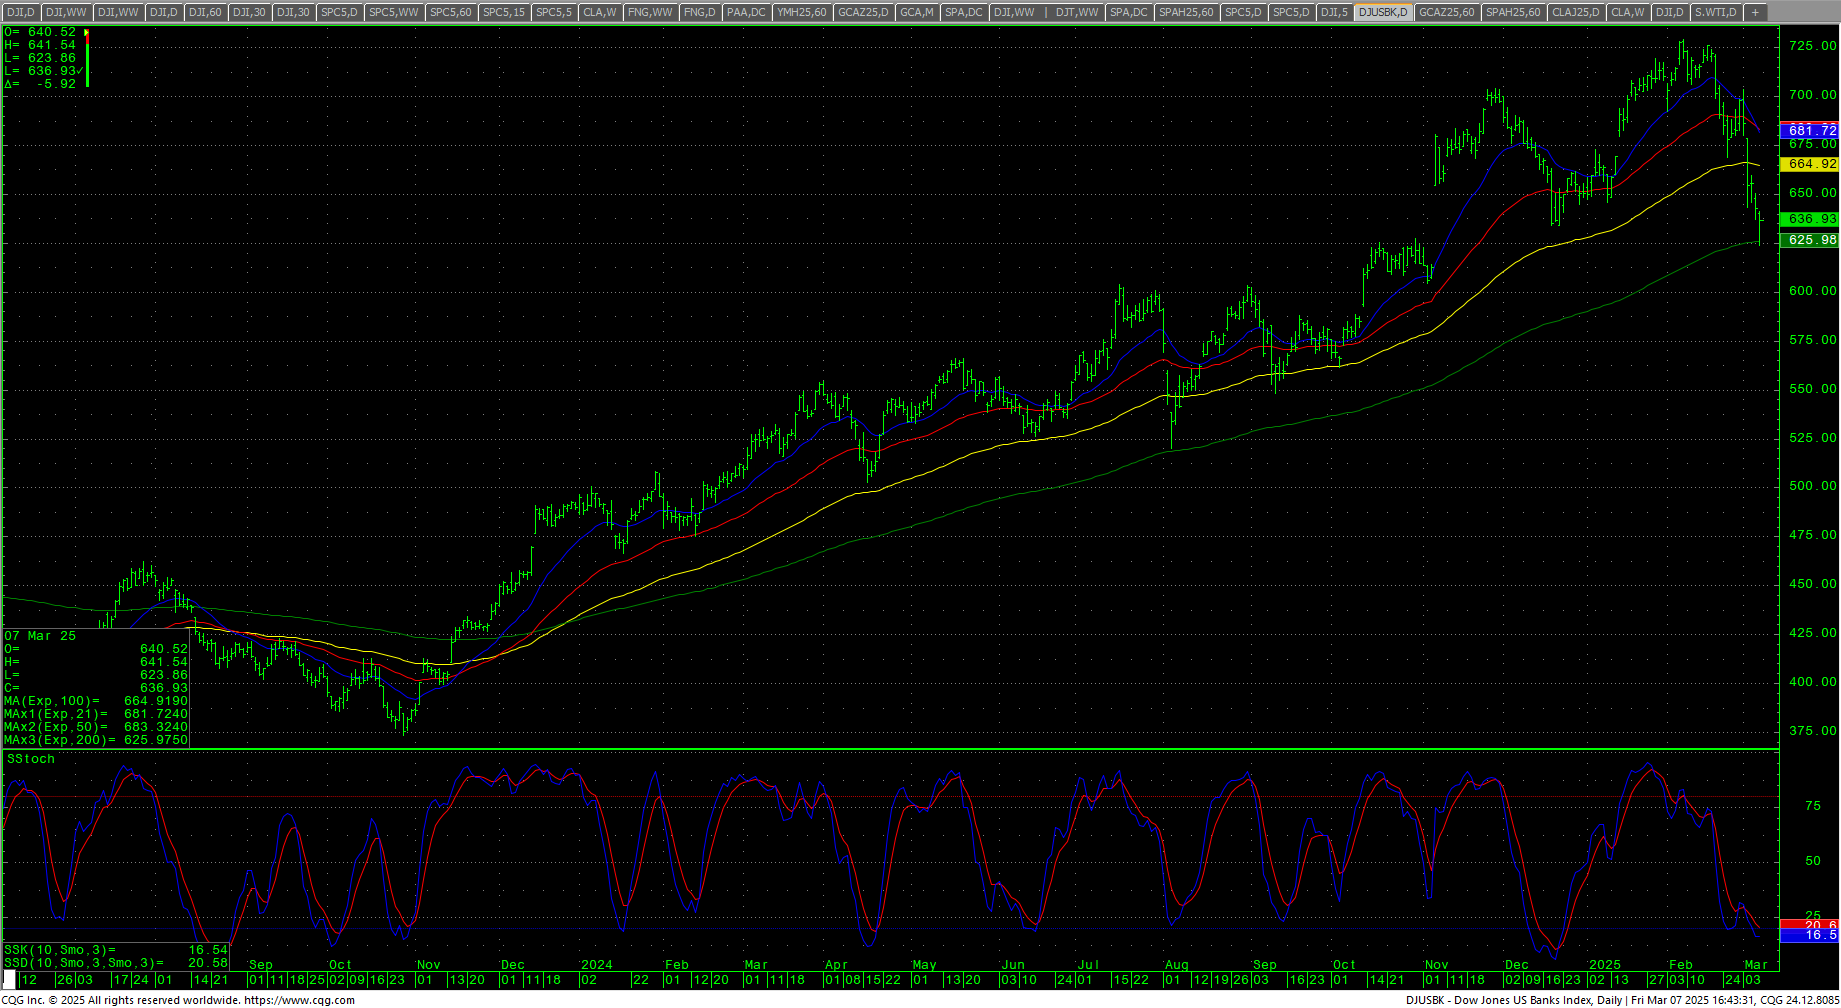
The chatter right now is the huge move in the Atlanta Fed GDPNow readings for Q1 which moved from a reading of +2%+ to -2.8%, a 5% swing from the start of the year. Some analysts are stating that the skewing of the data is due to the way gold imports are calculated as the U.S. has imported nearly $40 billion in gold this quarter and the Atlanta Fed did not remove those totals from its estimates. In 2024, central banks added over $1 trillion gold reserves. Do the banks know something we don’t? Banking stocks have come unglued in the past two weeks after setting record highs in early February. The Dow Jones U.S. Banks Index has dropped -13.34% since 6 February 2025 and the daily chart looks weak.
Atlanta Fed GDPNow Q1 Estimates
U.S. Gold Imports
 Dow Jones U.S. Banks Index Daily H-L-C
 SPX Daily H-L-C
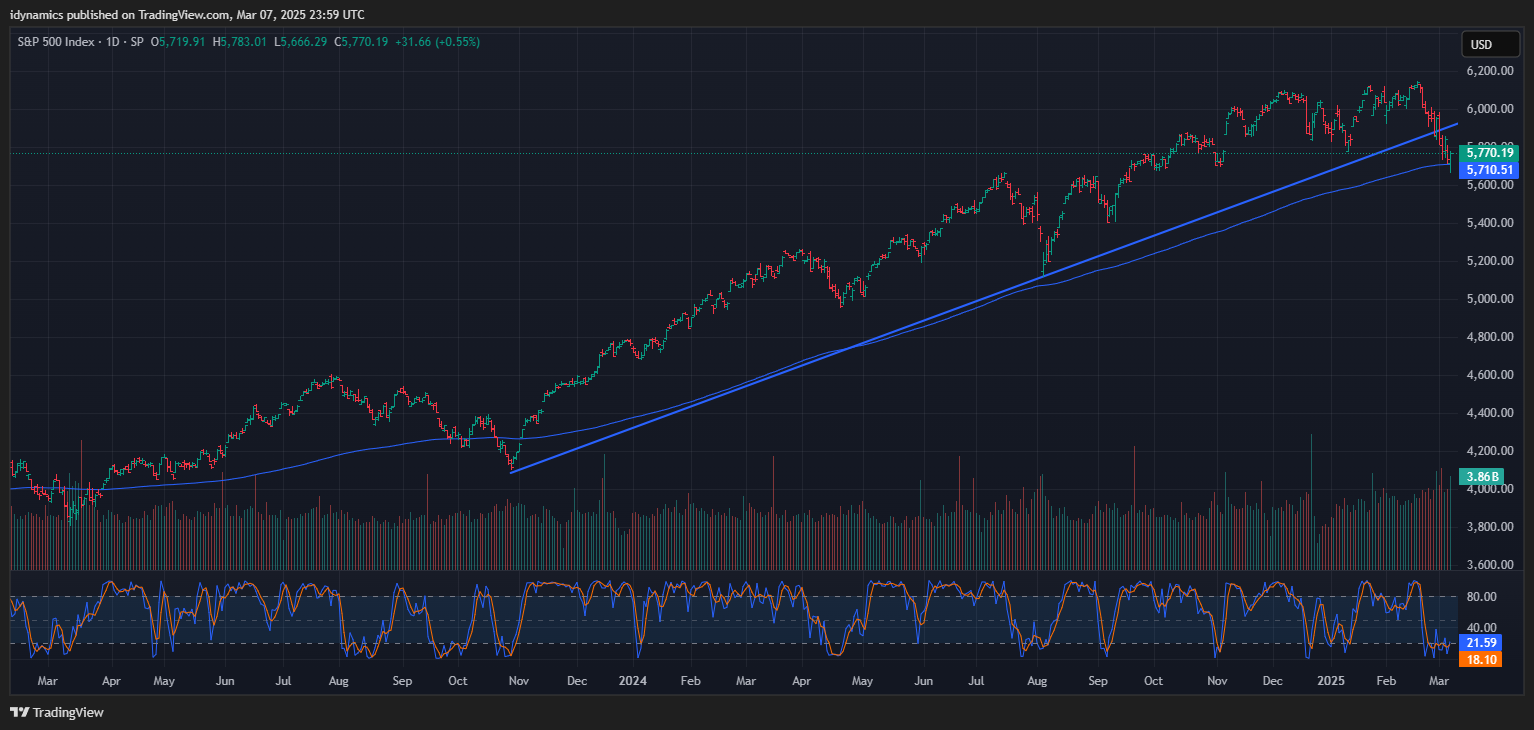 The S&P traded just under its 200-day MA on Friday and then staged a bullish reversal higher but still saw one of the worst weeks in months, closing down -3.10%.
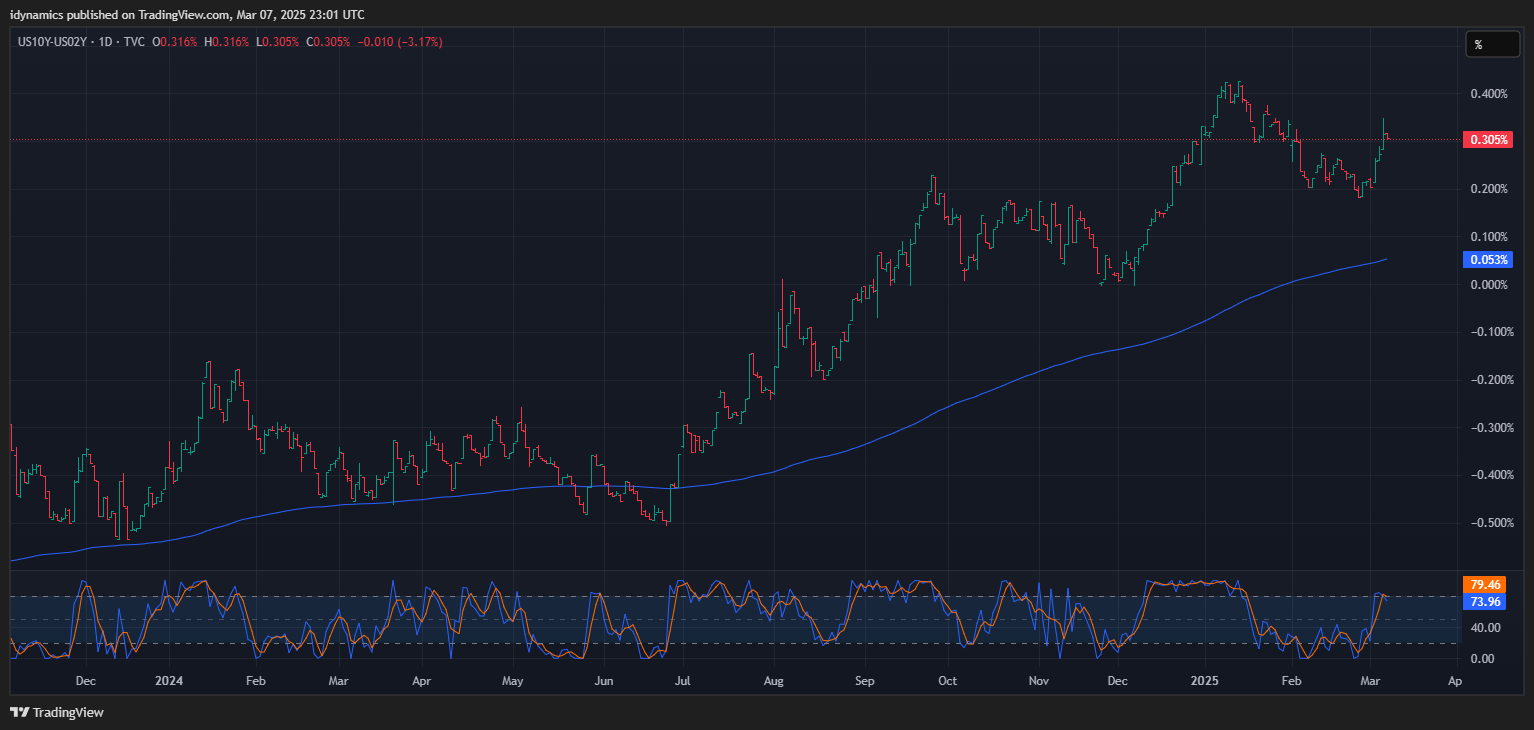
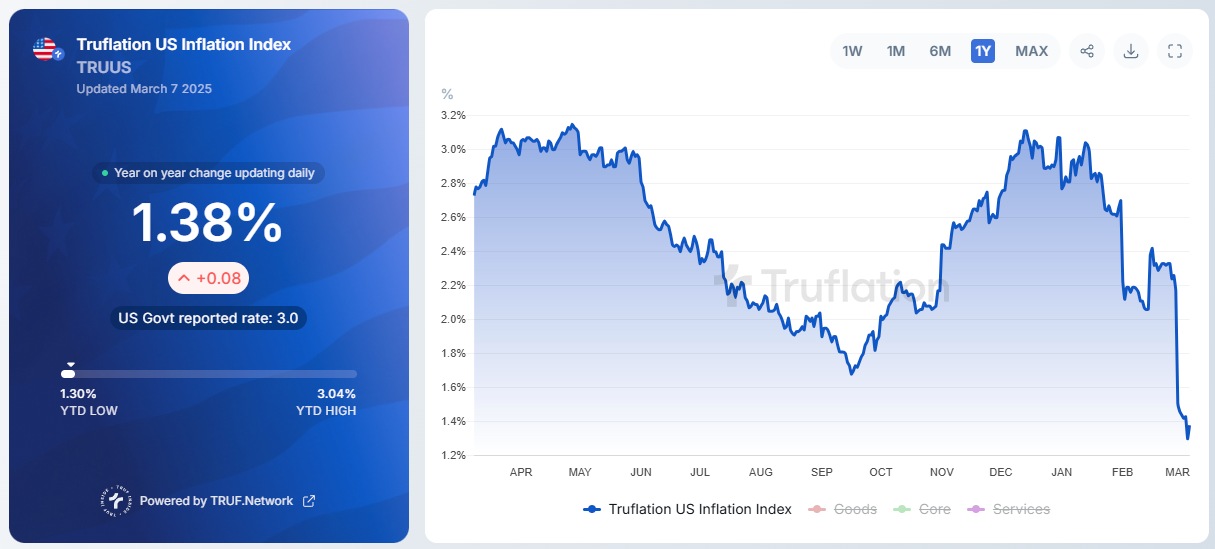
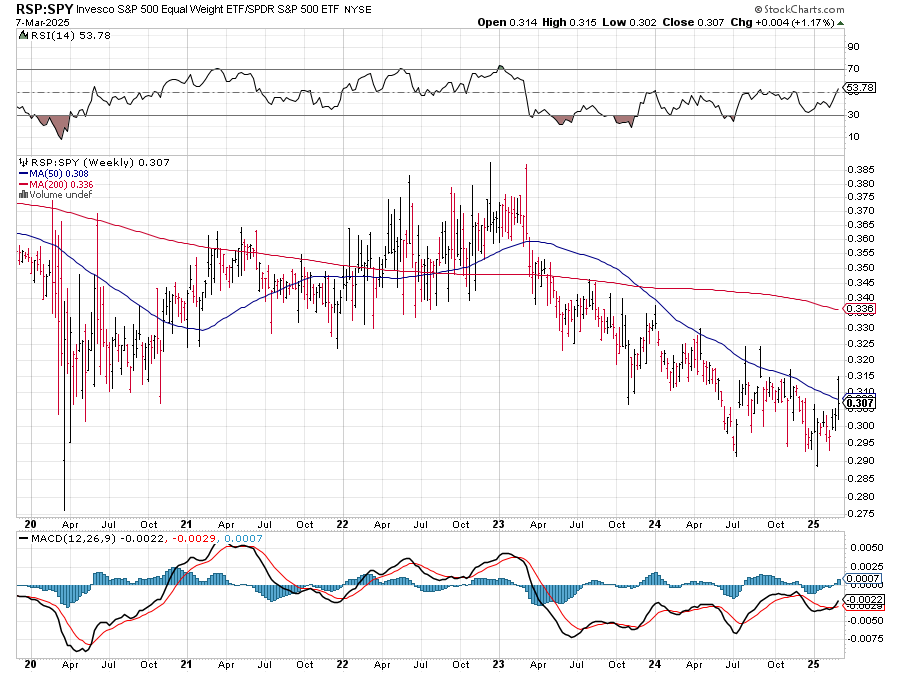
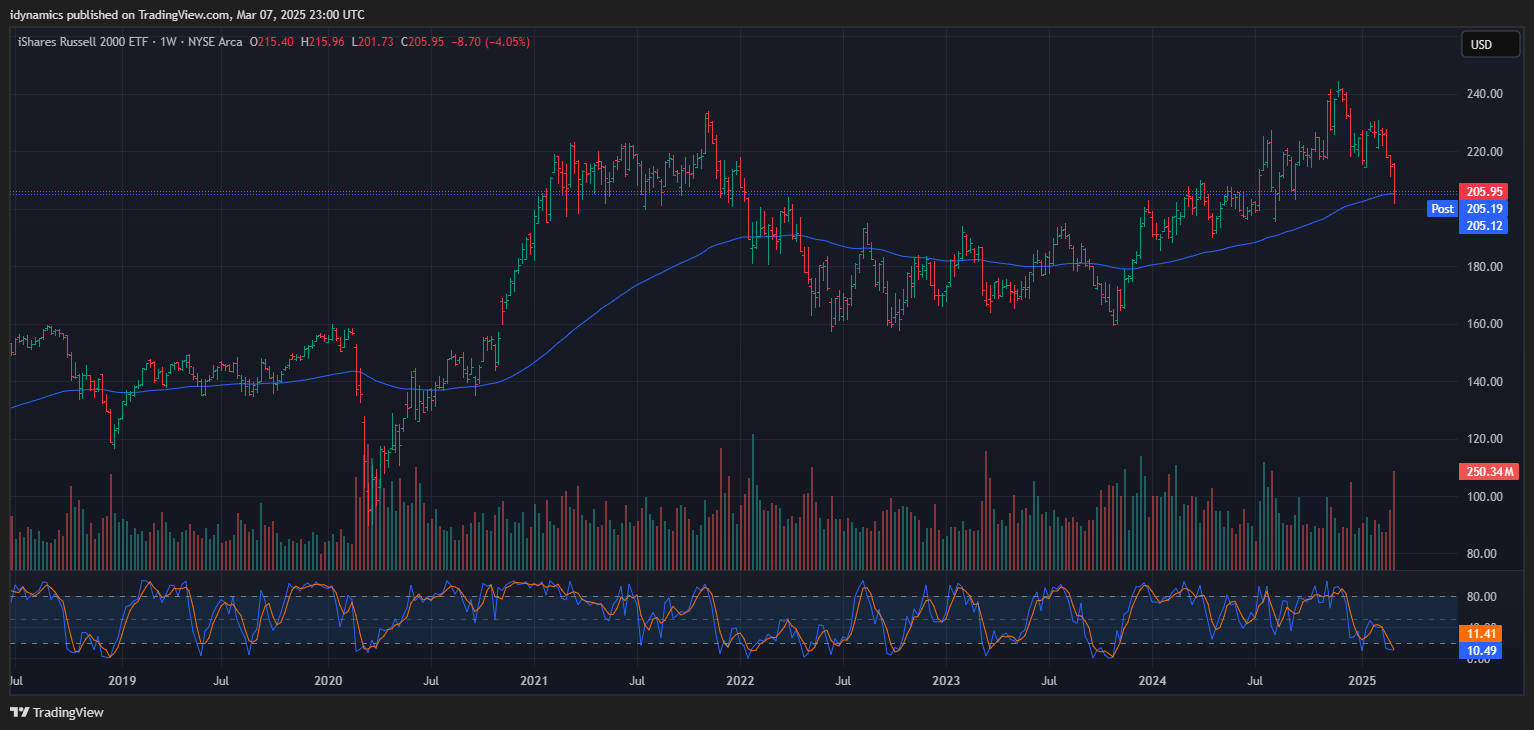
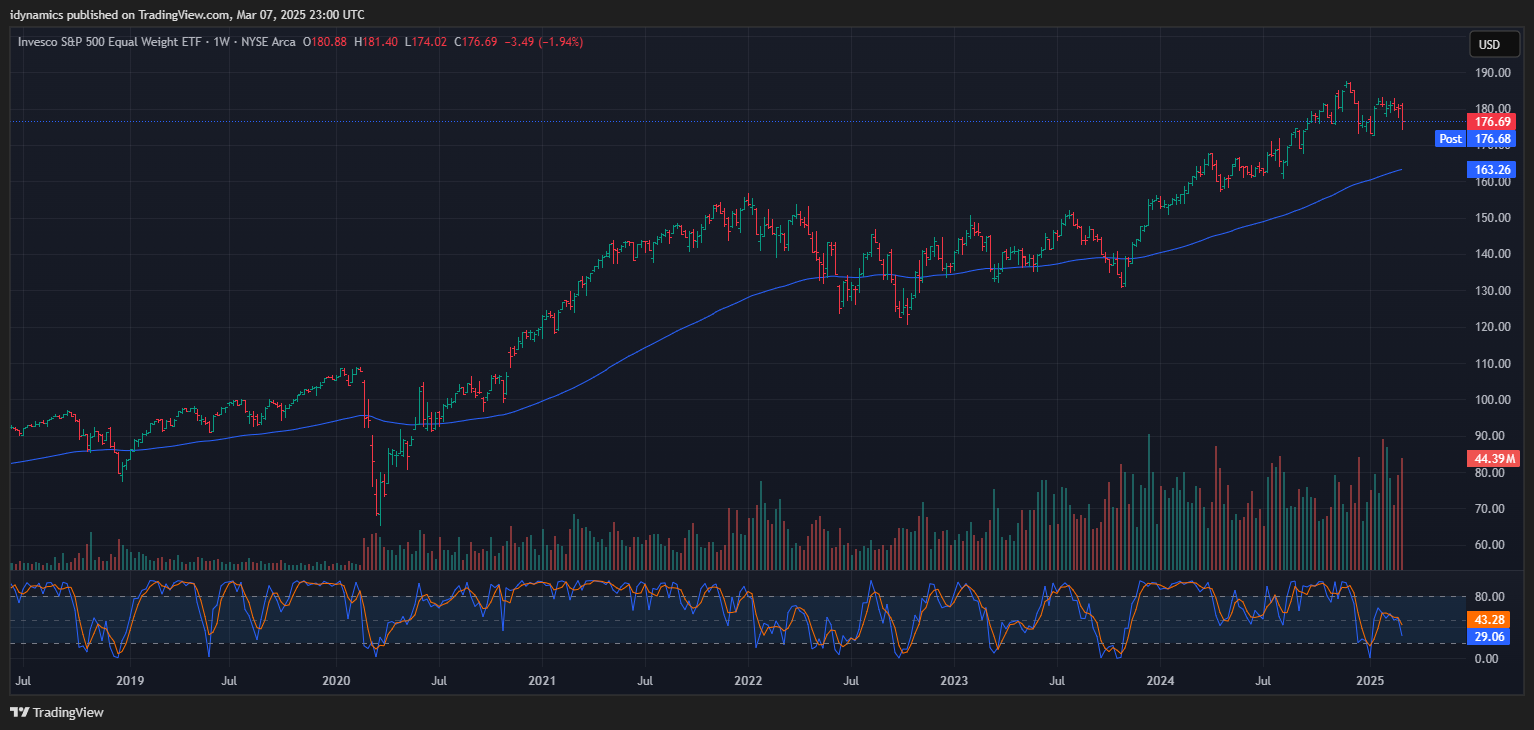
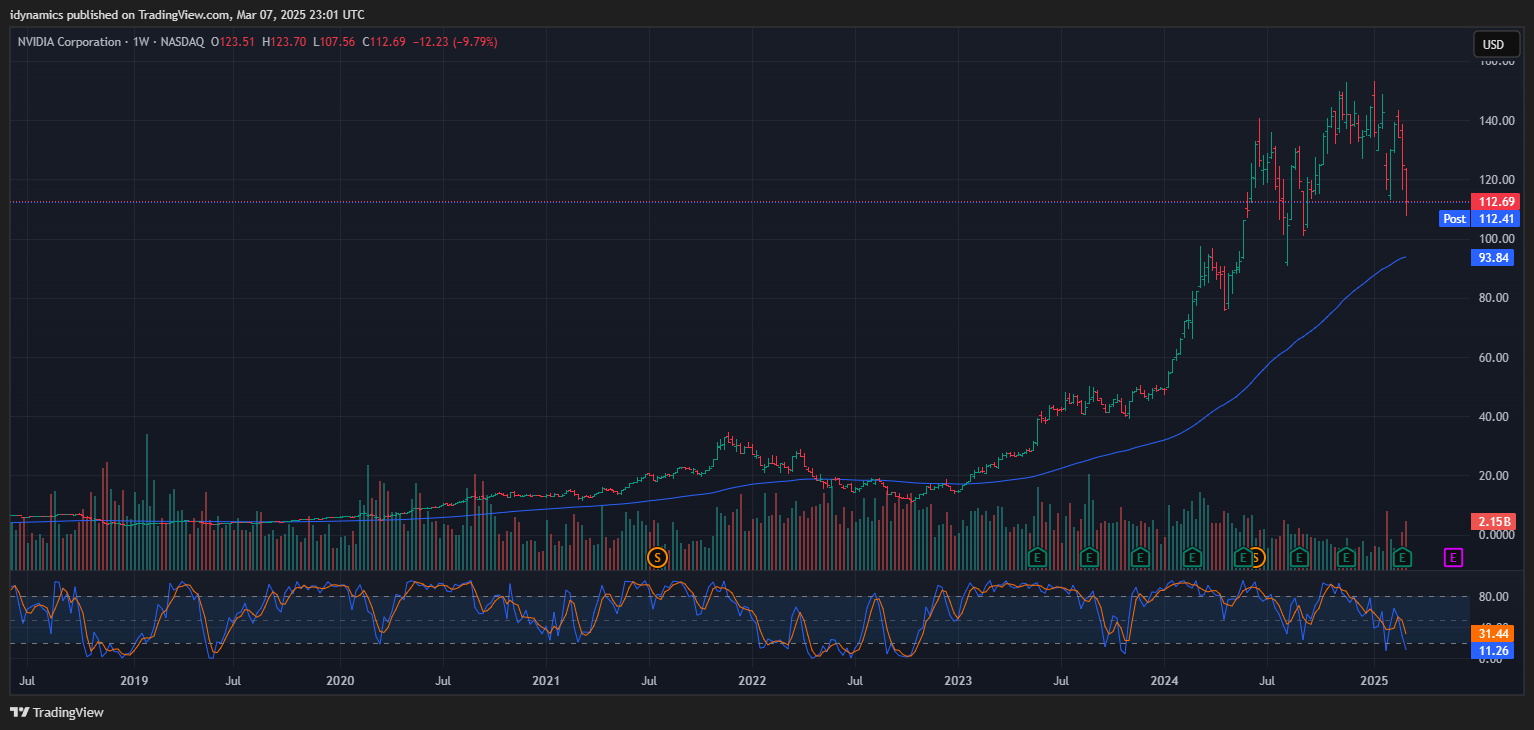
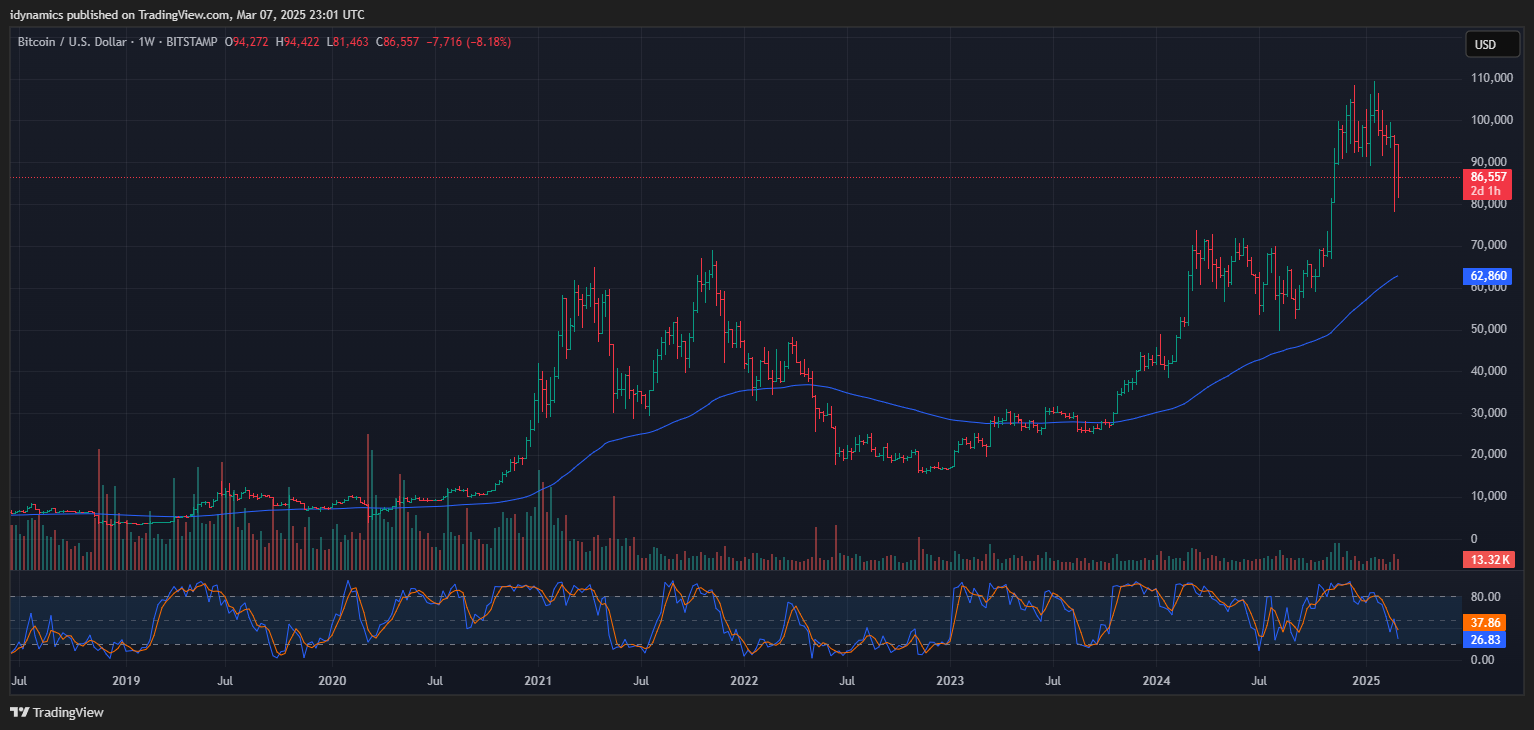
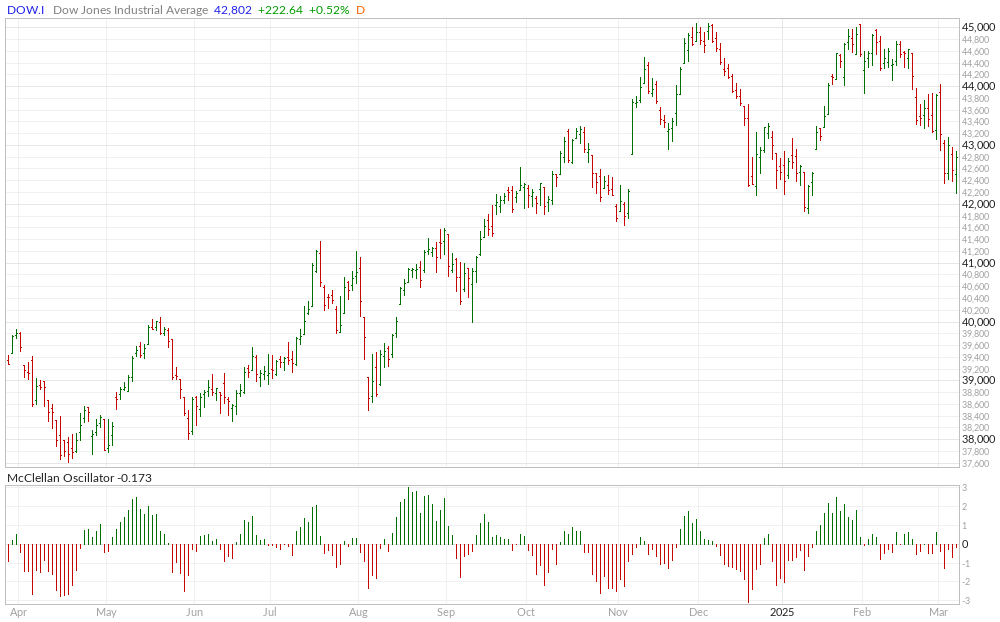
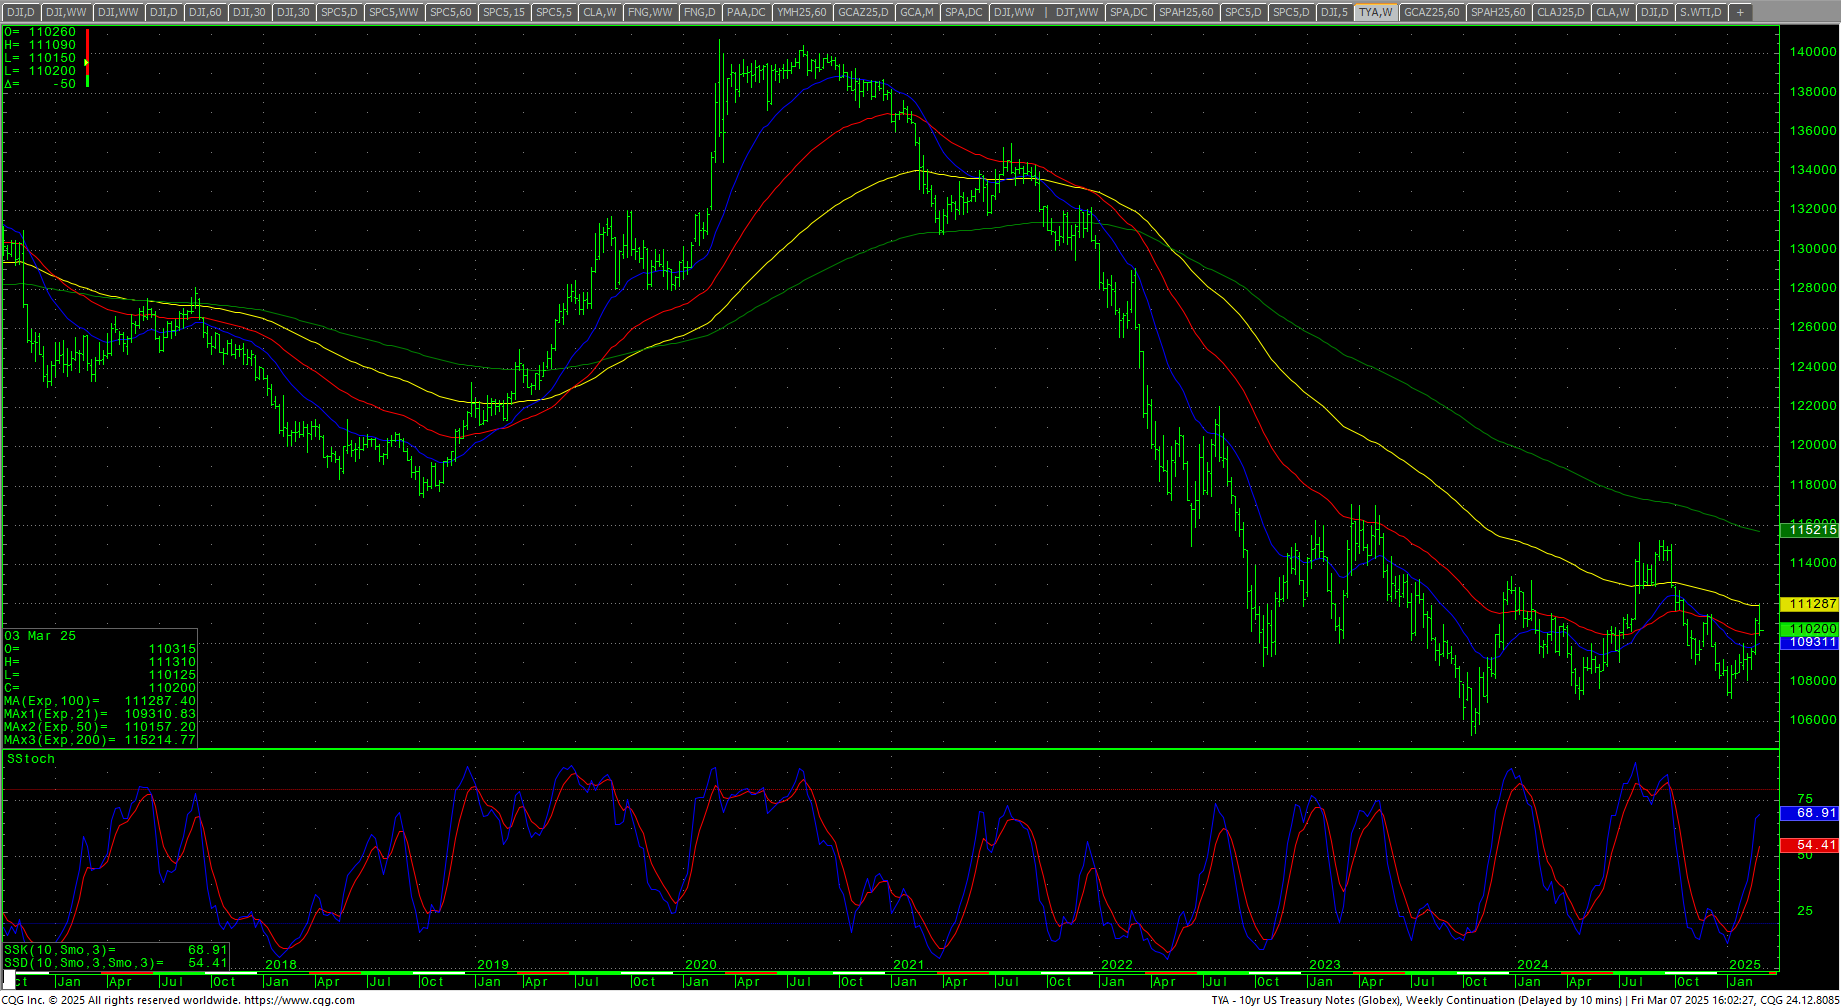
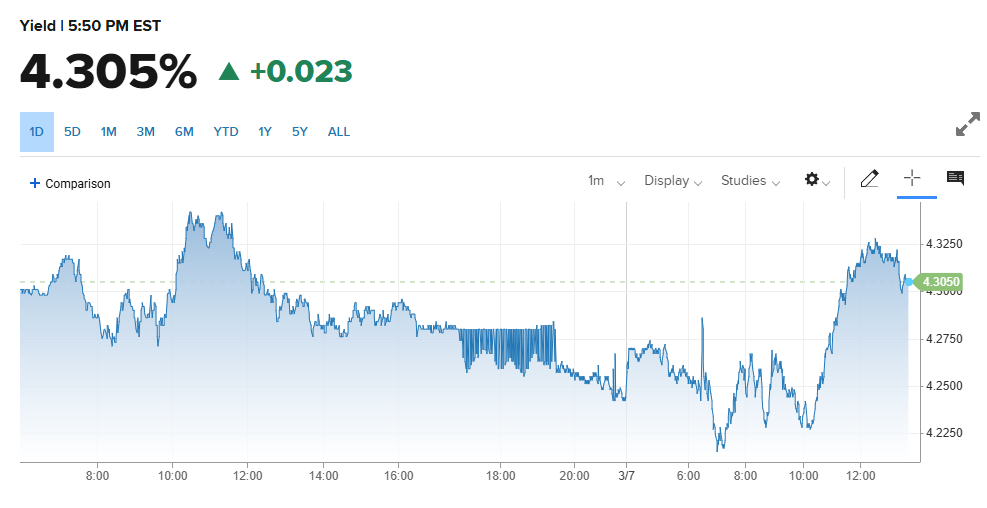
The RSP:SPY ended the week higher and the daily is overbought as the spread is trending upwards toward its 200-day MA. The IWM led the secondaries lower, trading to lowest levels since August 2024 while the RSP holds above its 2025 lows. The MAG7 took out critical support at 48…see comments above on the MAGS. NVDA traded to the lowest prices since September 2024 and closed in the low end of the range end of the range at the lowest weekly close since 3 September 2024. Bitcoin traded an inside week but a wide range after the meltdown the previous week and closed at the lowest weekly close since the last election. McClellan Oscillators are flat for the Dow but confirming the downtrend. The Yield Curve jumped on the week while yields rose. The 10YR yield moved higher to 4.305%. Truflation plunged to 1.38%.
10YR-2YR Yield Curve Daily
VIX Weekly H-L-C

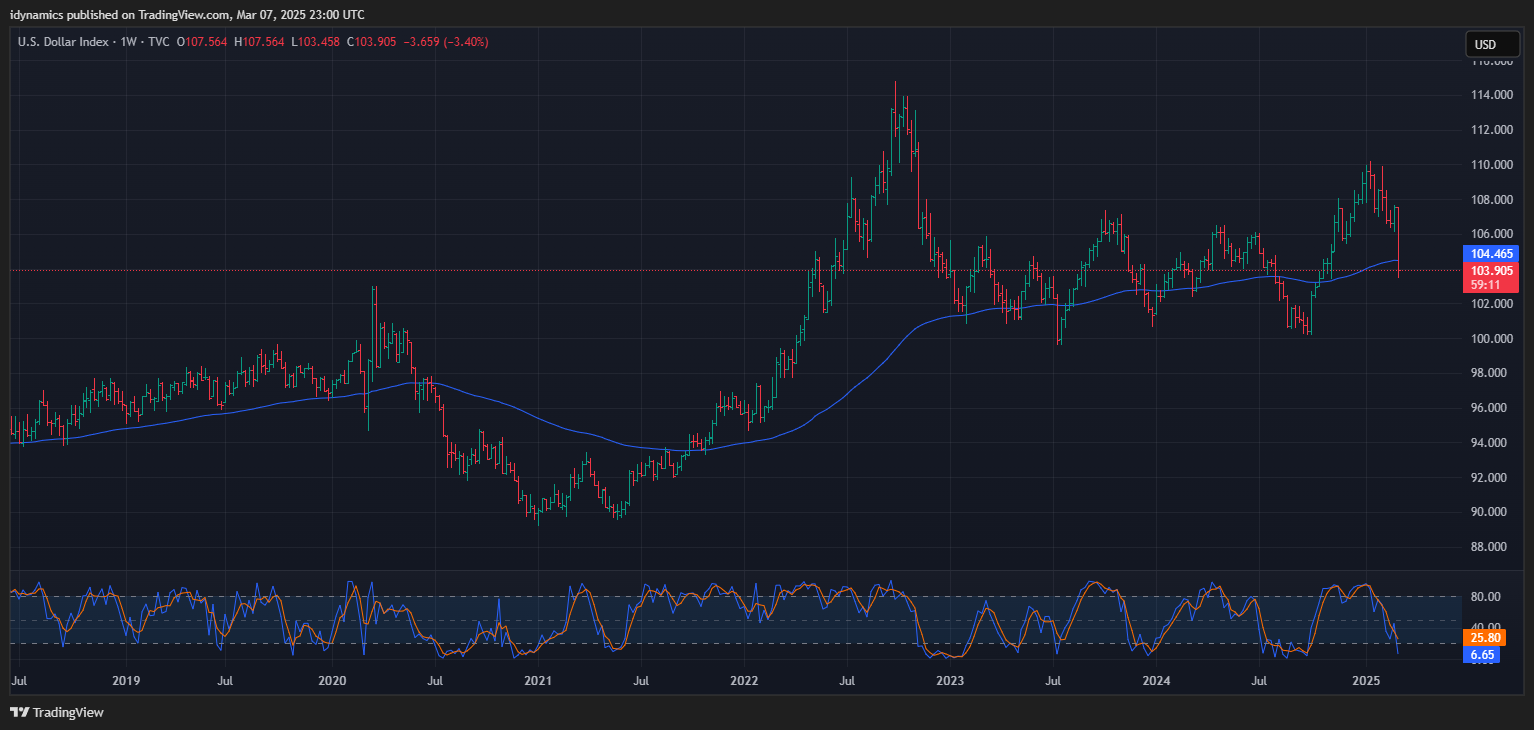
The VIX jumped to the highest weekly close since late July 2024, settling in the higher half of the range. The US Dollar plunged sharply and closed on the bottom of the weekly range at the lowest weekly close since middle of October 2024.
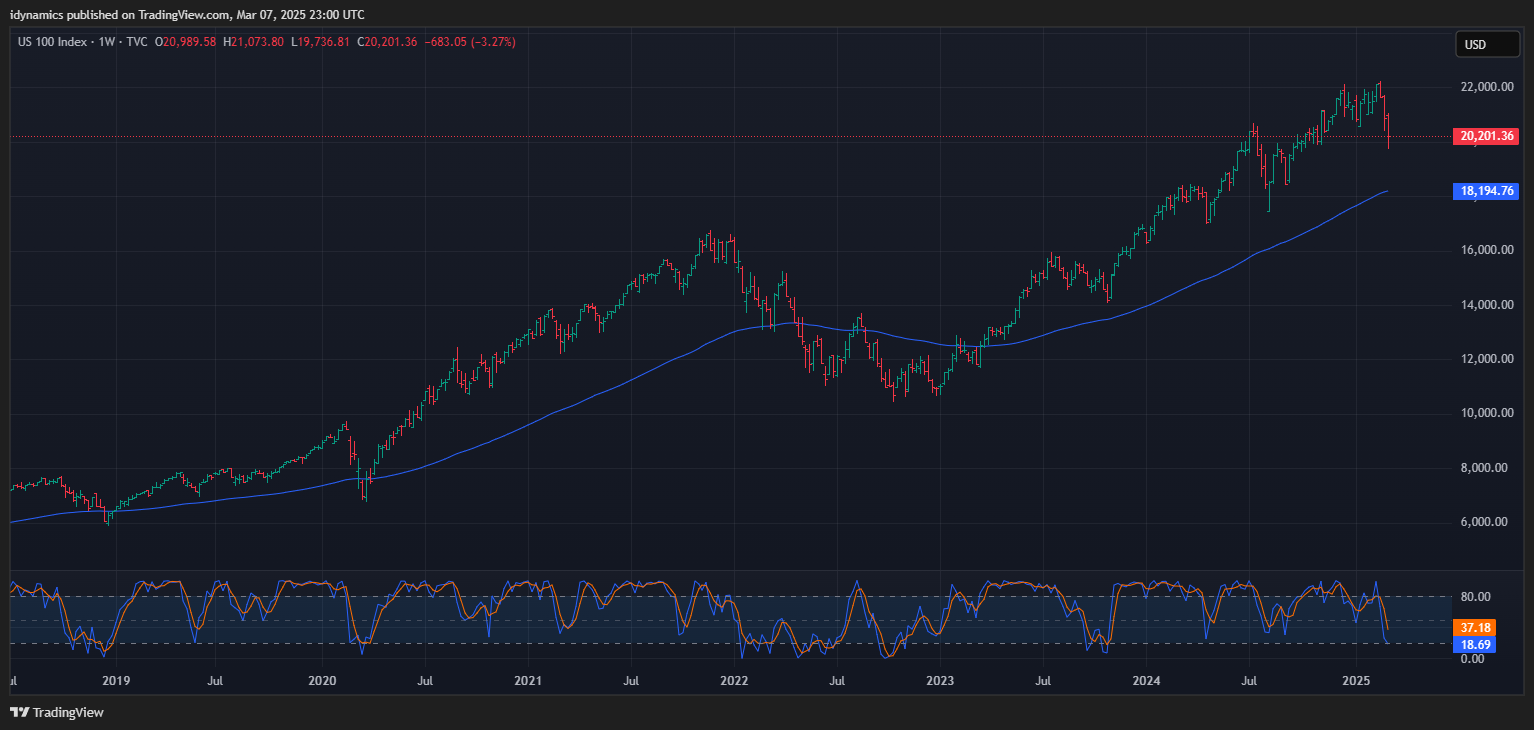
 Nasdaq 100 Weekly H-L-C
 52-Week A/D Line
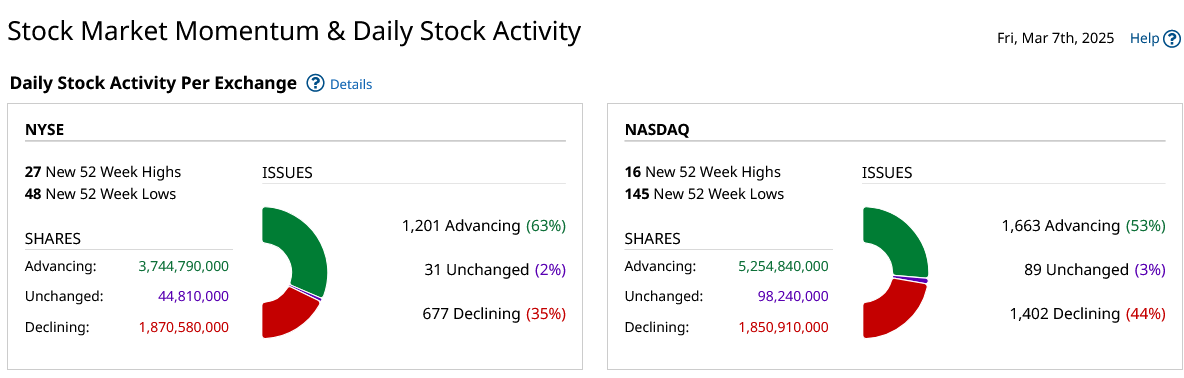
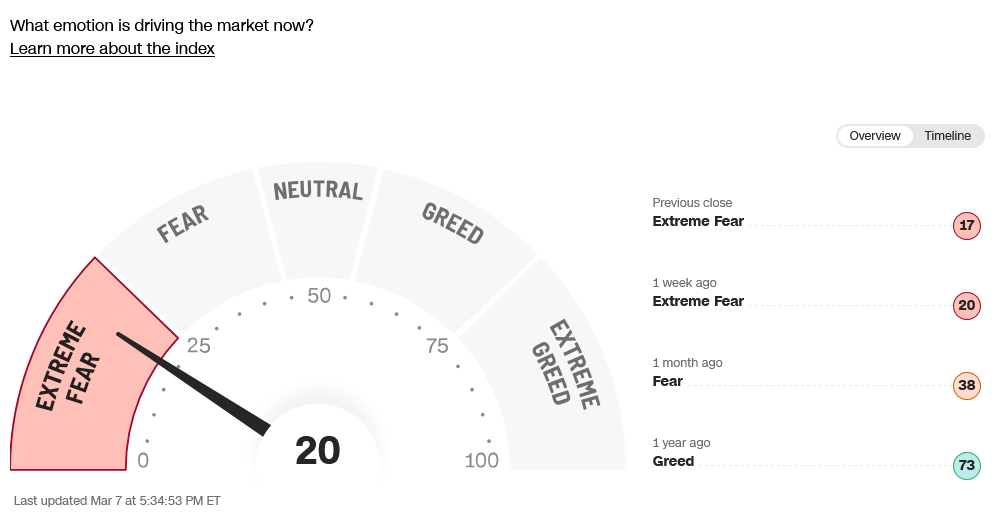
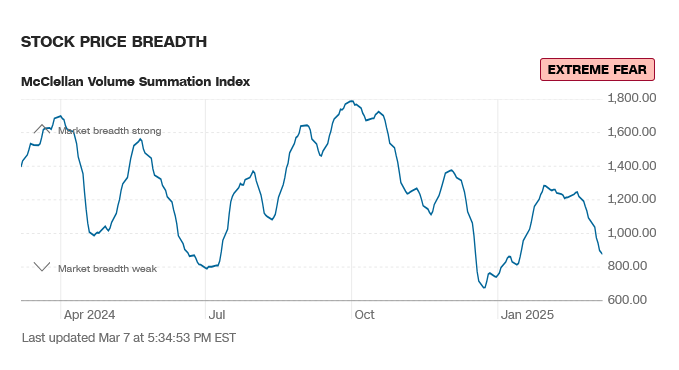
Breadth wasn’t bad, still taking a hit and sentiment moved to extreme fear.
CNN Fear & Greed Index
 AAII Investor Sentiment Survey
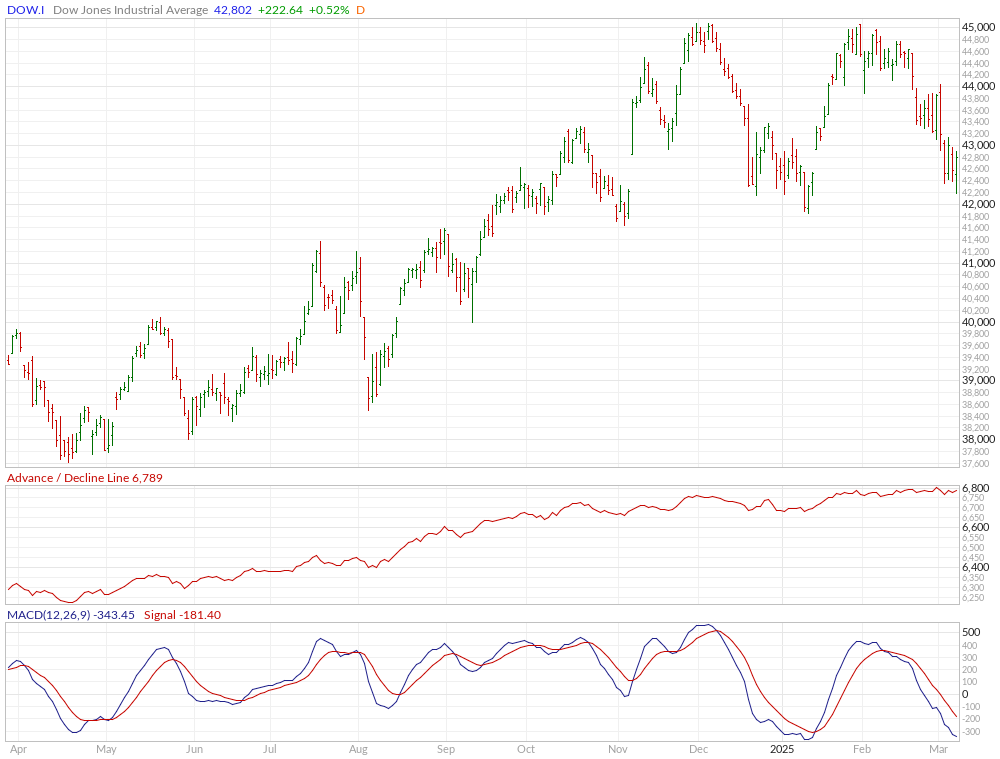
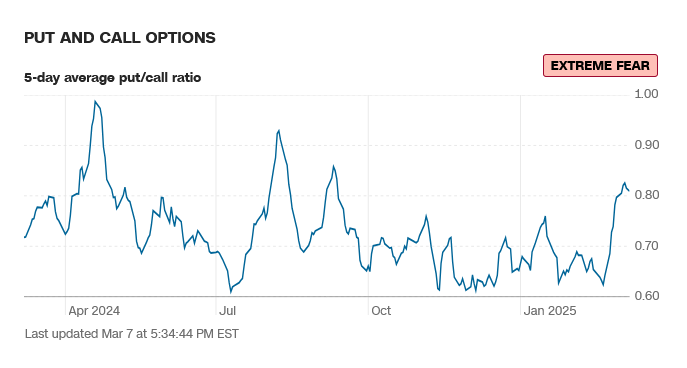
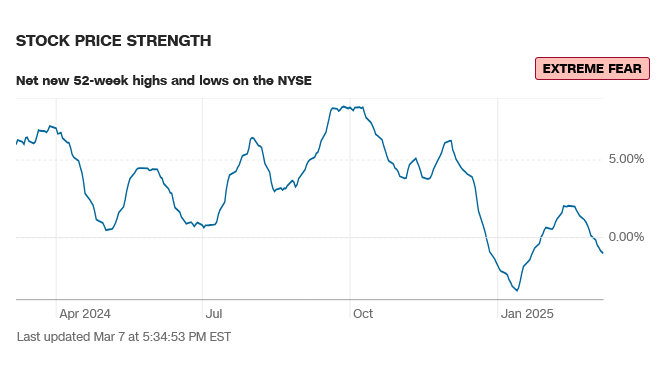
Sentiment has shifted into fear and extreme fear. The CNN Fear and Greed Index moved to 20 and reads extreme fear. Breadth is suffering and reads extreme fear. Latest AAII Sentiment Survey: Neutral Sentiment Increases. The Dow A/D ended at 6789 which sits at near record highs and the MACD remains down. The VIX rallied and closed in the top of the weekly range at the highest levels since July 2024. The Put/Call ended at 0.81 and reads extreme fear. The 52-week, A/D declined to -1.03% and reads extreme fear. The Dow closed the week down -2.14%, closing in the lower half of a wide outside week down. The S&P was down -3.10% in the lower end of the range at the lowest weekly close since 28 October 2024. The Nasdaq Composite declined -3.45% and the Nasdaq 100 was down -3.27%. The FANG crashed, closing down -5.92% in the lower half of the weekly range at the lowest weekly close since 28 October 2024. The Russell was down -4.05% in the lower half of the range, the lowest close since August 2024. The 10-year notes reversed lower and closed on the bottom of the weekly range. The yield on the 10YR jumped to 4.305%.
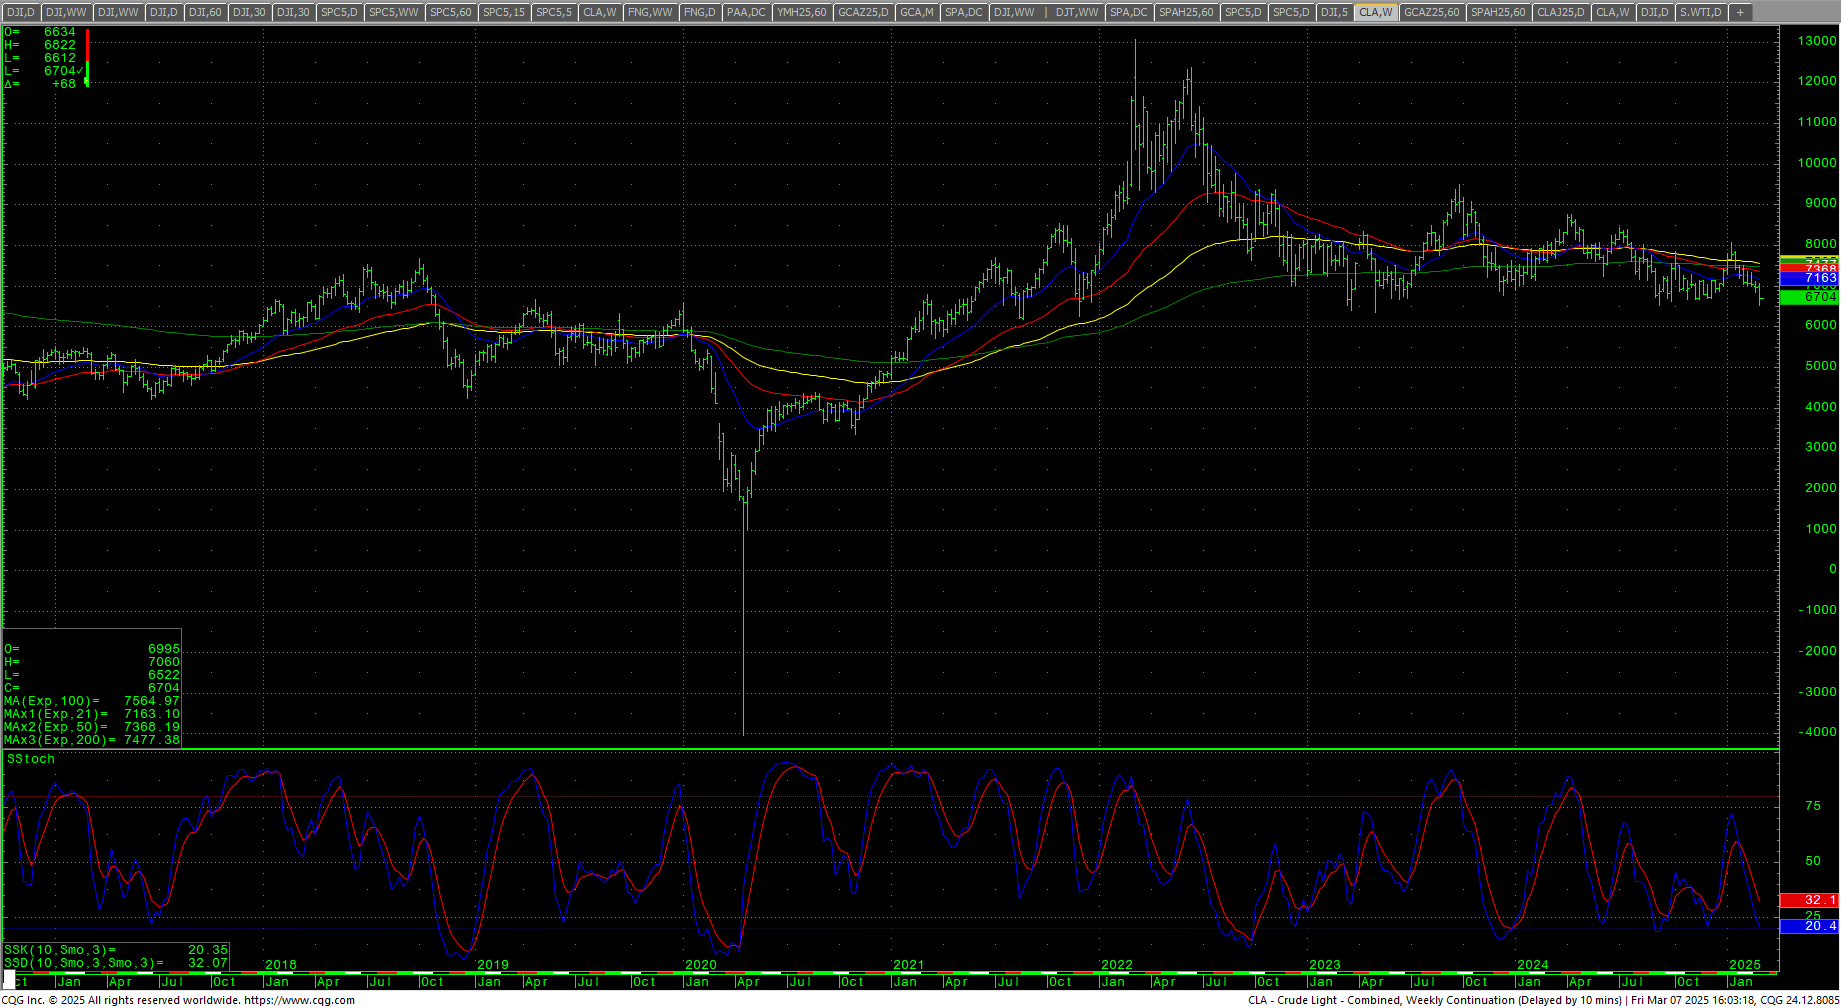
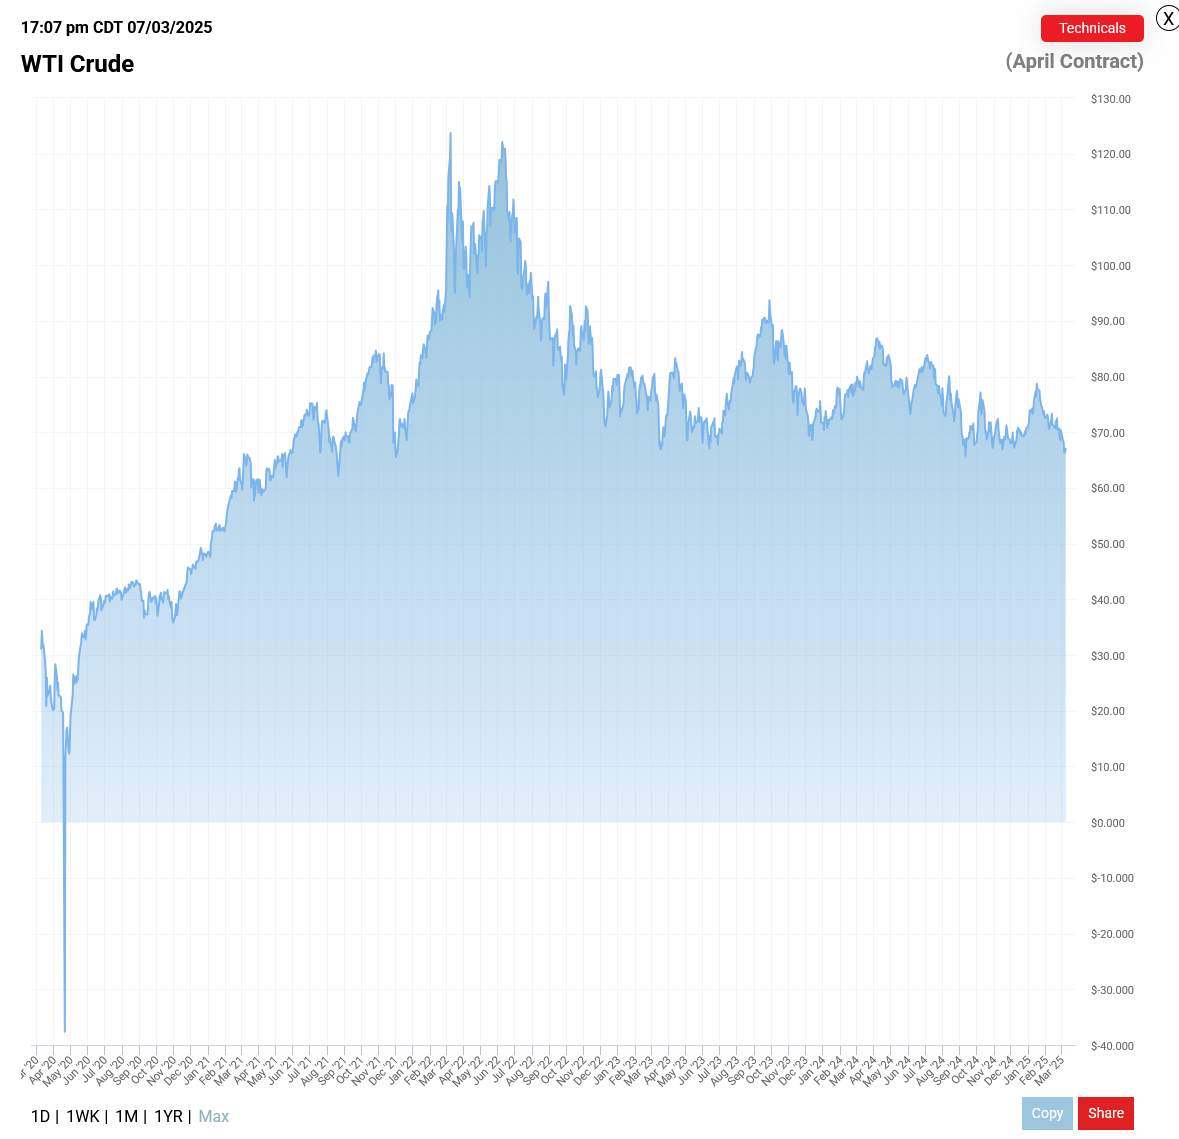
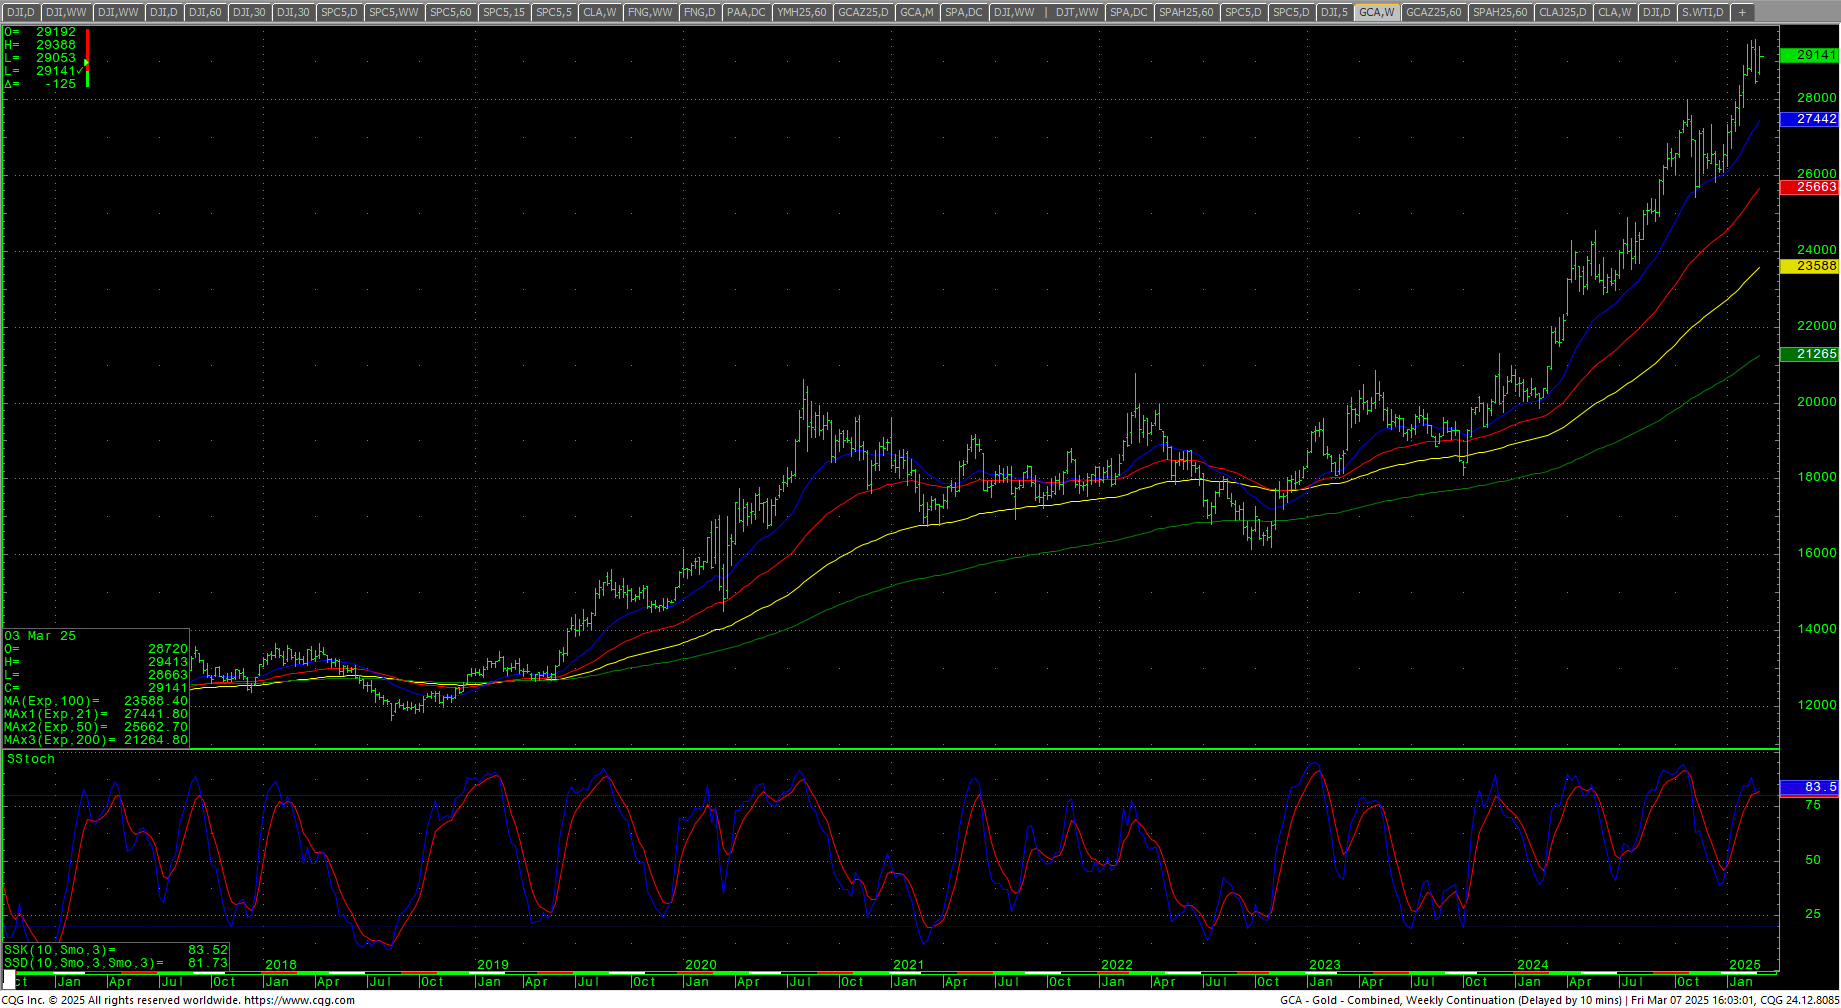
The CRB Index declined as crude oil sold off settling down -1.51%. Crude oil closed under the $70 level toward the bottom of the range at the lowest weekly close since 11 November 2024. WTI Crude traded to the lowest levels since September of 2021. Gold traded an inside week and closed in the upper end of the range as it sits just under record highs near the psychologically critical level of $3000. The CoT for the S&P 500 saw dealers and commercials with spec positions moving up slightly. The CFTC S&P 500 Non-Commercial Net Positions ended at +32.1K and most likely represents some bigger short-covering during the week. Sellers still have a 6-day window.
Timing Points
This week is a CRITICAL week for stocks. Tuesday and Wednesday are highlighted and there is strong potential for extremely wide ranges and volatility/volume. Note that Wednesday is CPI data and Thursday is PPI data. For a deeper look, see: Week of March 14, 2025: Reality Check? Will We Hear Air Raid Sirens Next Week?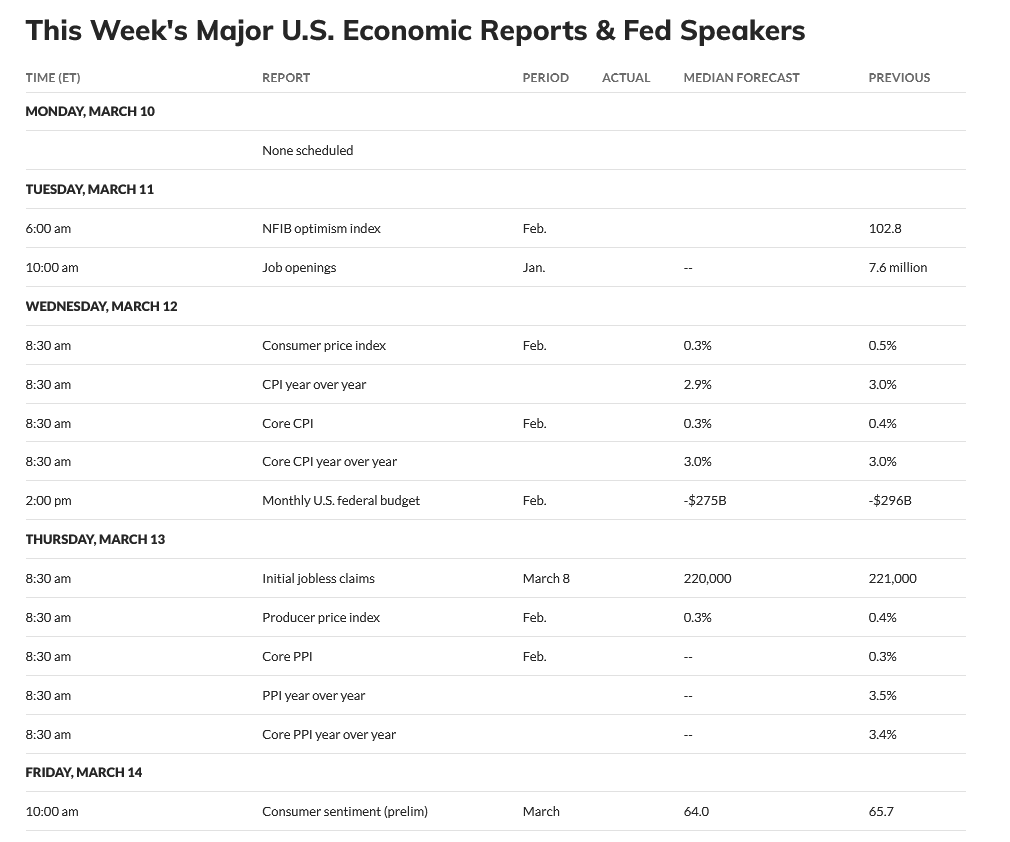
- 03/11-12 *** X critical. Potential for extreme volatility and/or wide ranges.
- 03/21 *** X
- 03/27-28 *** X critical
- 04/07 **
- 04/12 **
Dow Jones Industrial Average
Dow Jones Industrial Average Weekly Candles
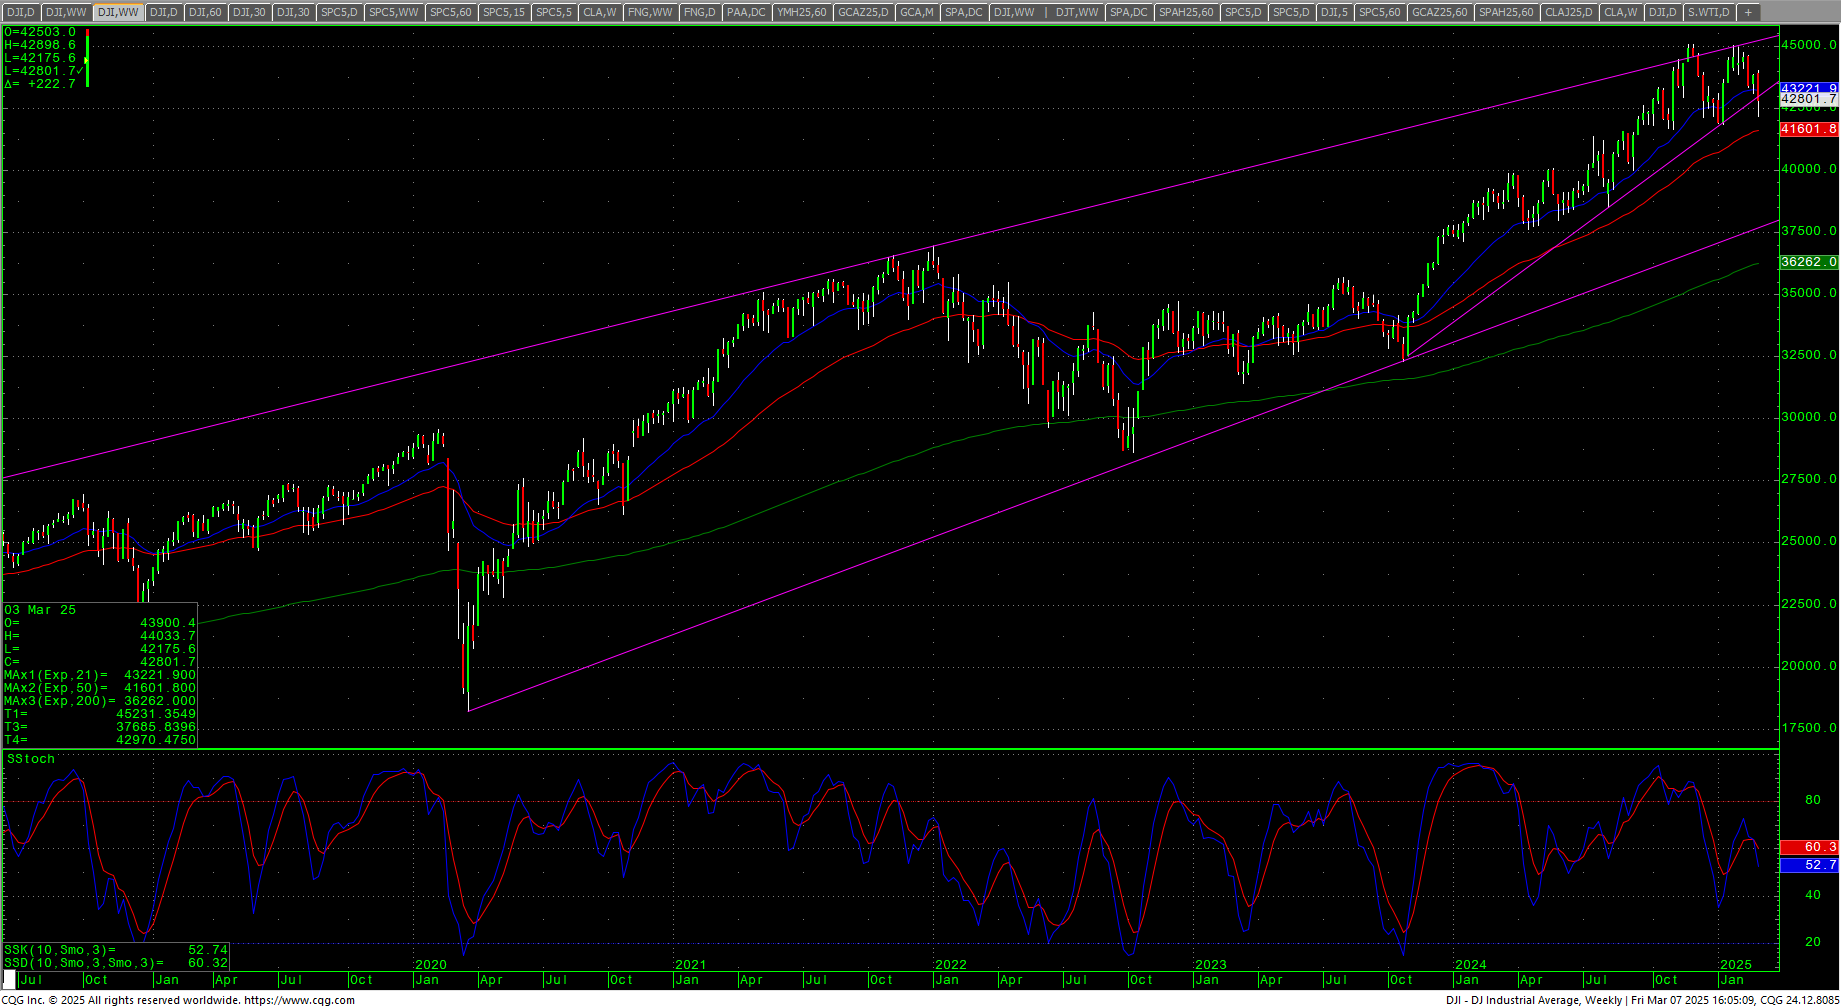 The Dow traded close to the 200-day MA as the daily is negotiating a double-top pattern and is oversold. The oscillators are bearish even with the stochastics oversold. The weekly close is the lowest since the start of 2025 but the Dow remains slightly higher on the year. The 21-day MA has crossed under both the 50-day MA and the 100-day MA. The MACD and the RSI are weak. The weekly has hooked lower. The hourly ended the week neutral as it relieves oversold conditions. The 200-day MA starts the week at 42028.
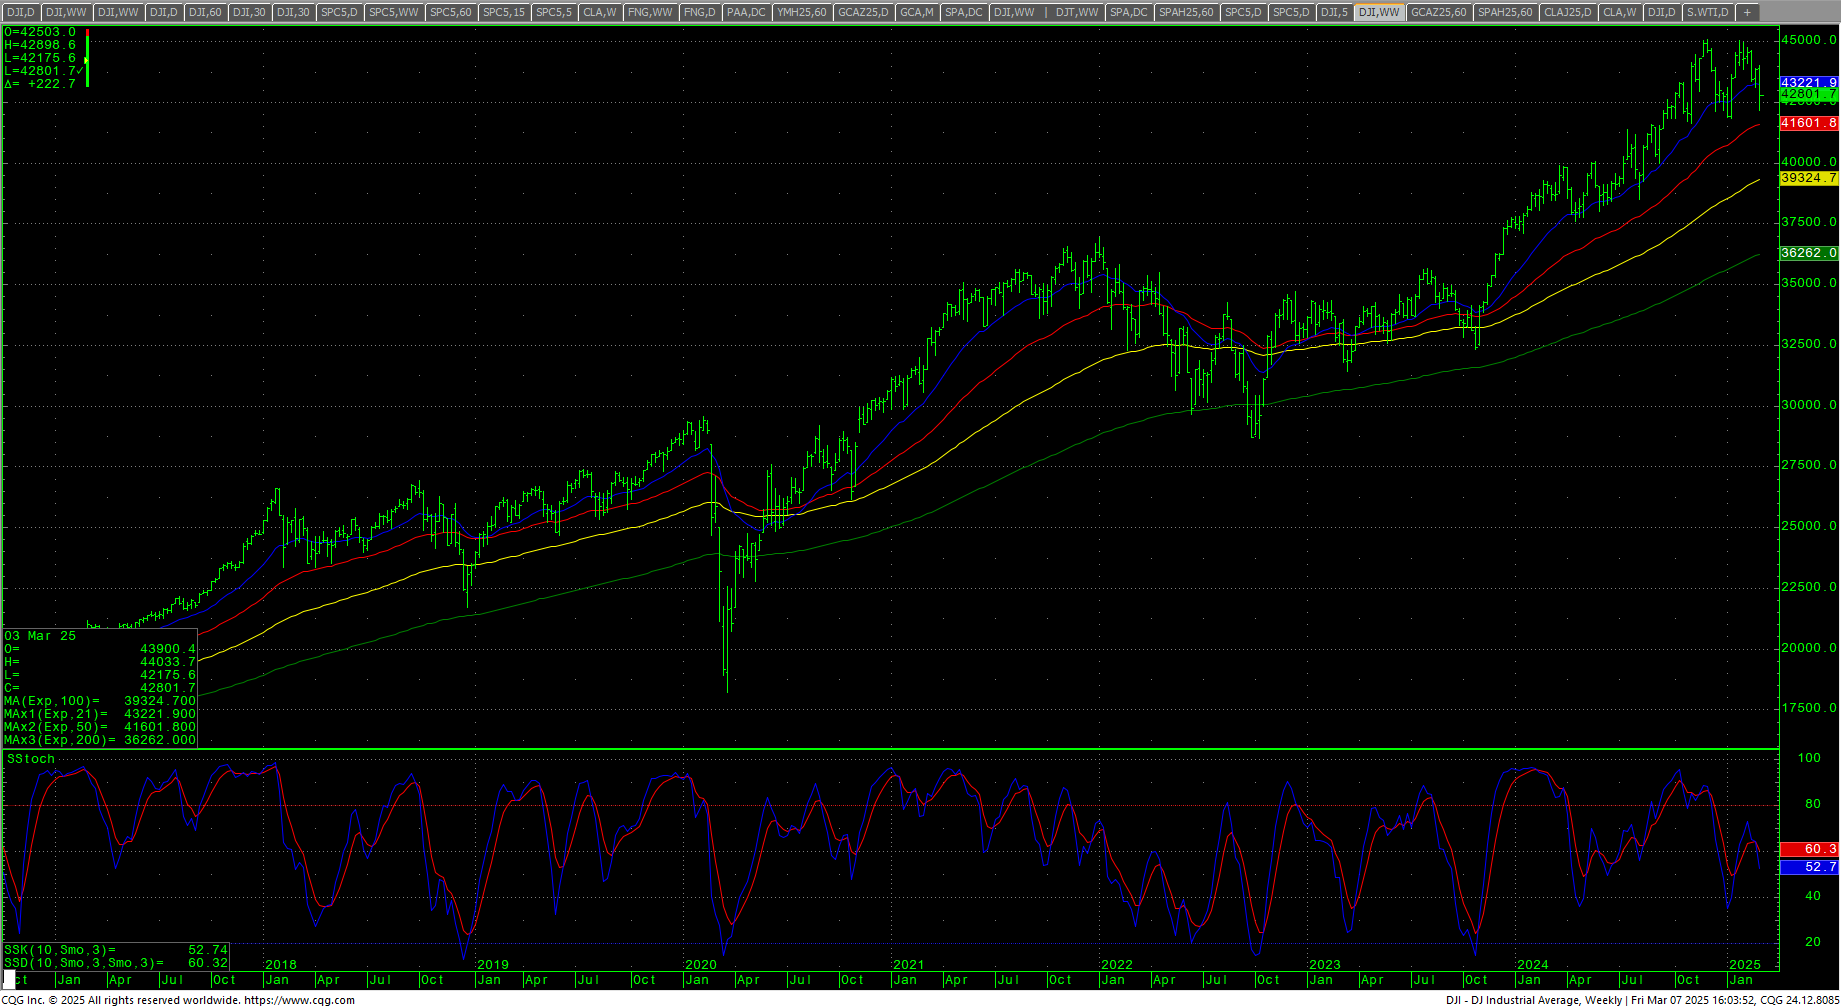
Dow Jones Industrial Average Weekly H-L-C
 Support is 42727 and 42622. A breakdown under 42622 should test 42537 with counts to 45451/42448. Under 42448 sets up 42356/42346 with counts back to 42175. Closes under 42175 should fuel downside movement to 41850/41844 level with critical closing support in the 41933/41925 level. A breakdown with closes under 41925 should test 41844 and 41647 (November low) with potential to 41263 through 41192. Taking out the November low of 41647 would be a bearish signal. Closes under 41192 opens counts toward 41128/41107 and the 40008/39993 area with key support at 40665, 40338 and 40204/40200. A breakdown under 39993 sets up a decline to 38734.
Dow Jones Industrial Average Hourly H-L-C
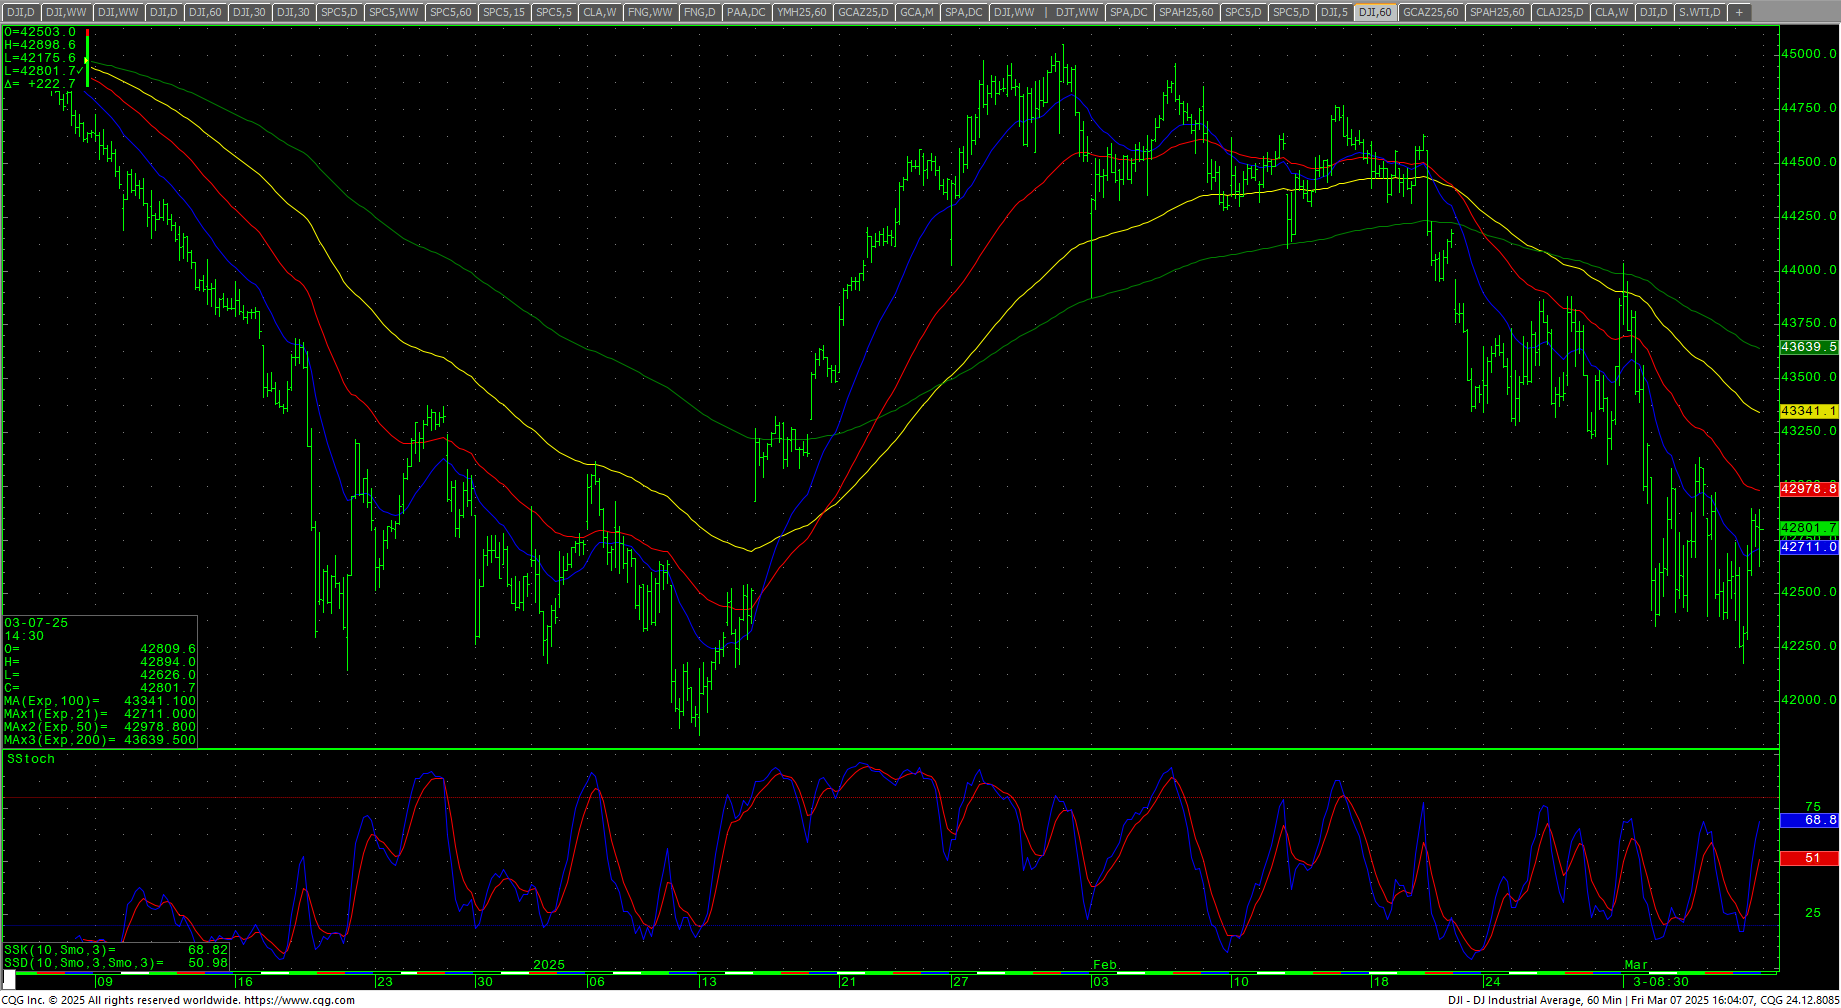 Resistance is key in a band right here at 42855/42885. A drive above 42885 sets up 43104 and 43275 through 43323/43325. A move through 43325 counts to 43614 with counts to critical short-term resistance at 43954/43960. Closes over 43960 sets up 44434 through 44374 with a shot at the intraday trading highs against the 45054/45074 level. Closes over 45074 opens counts toward 45244 and 45426 (Fibonacci target). Rallies with closes over 45426 will reopen longer-term monthly targets in the 47400 level with targets of 46568 and 46954.
| Resistance | Support |
|
|
S&P 500 Cash Index: SPX
S&P 500 Index Weekly H-L-C
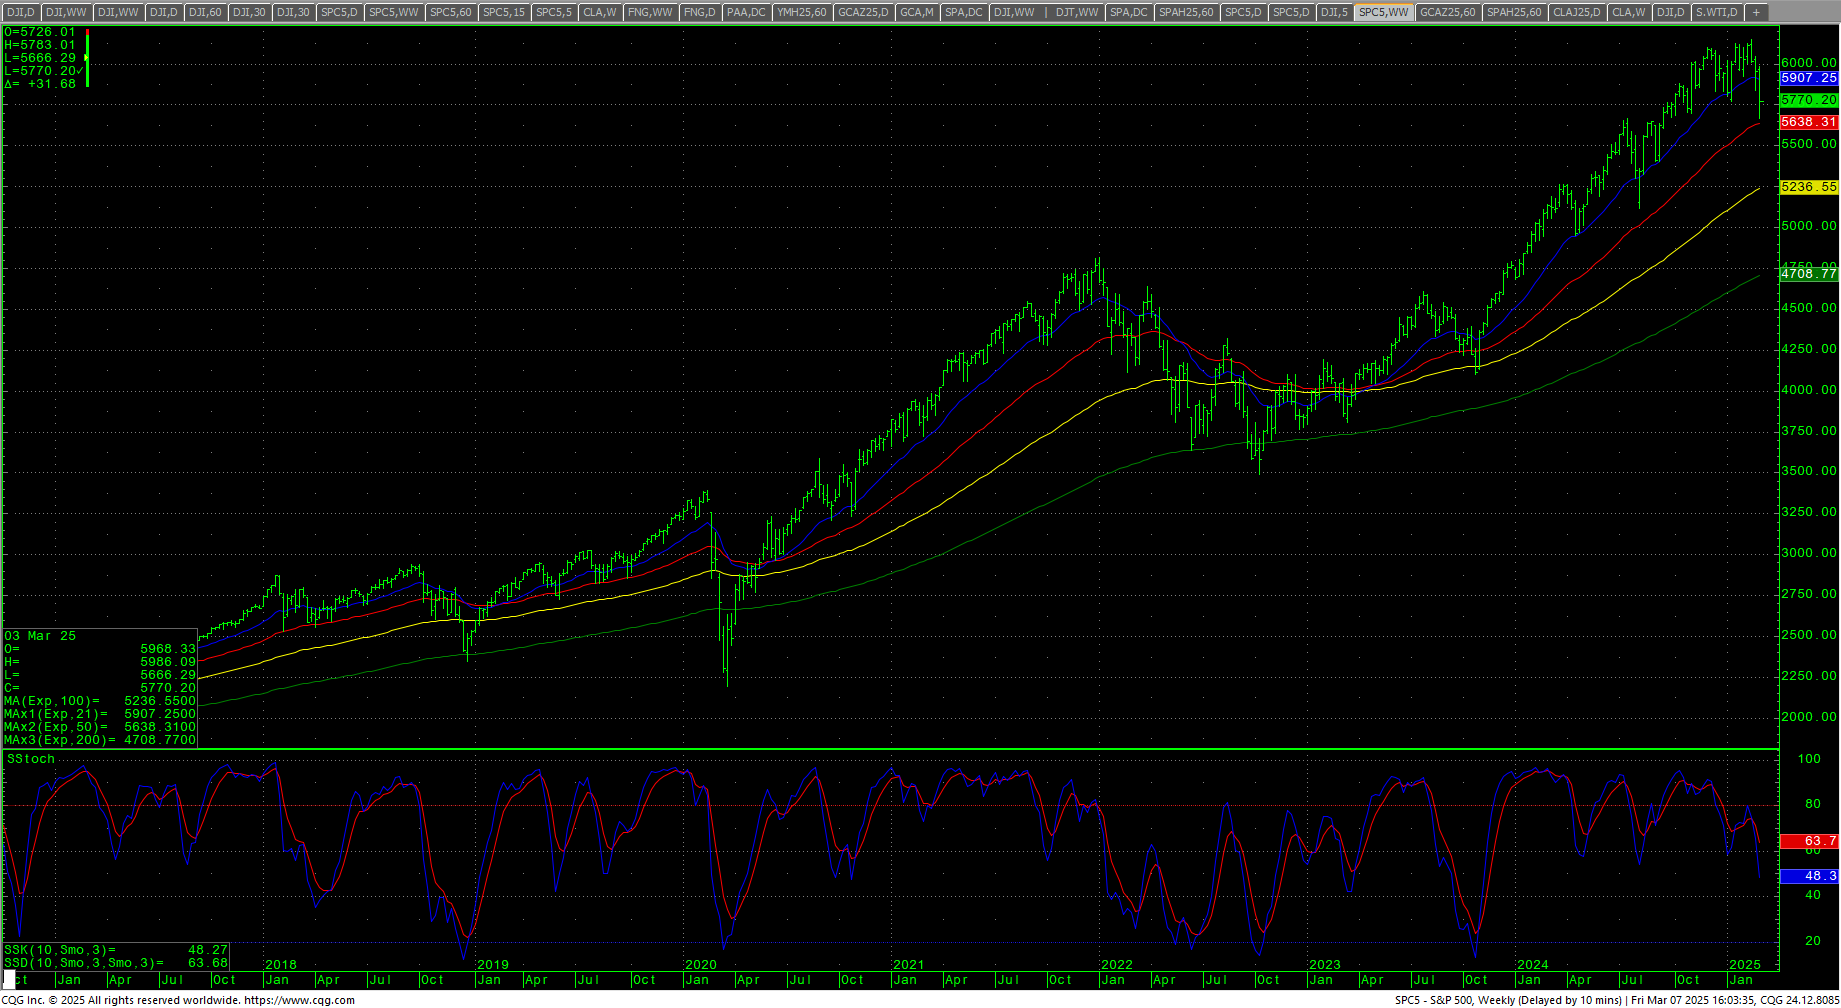 The S&P traded to the lowest intraday level since 18 September 2024 and under the 200-day MA before staging a bullish reversal to the upside Friday to relieve oversold short-term conditions. The daily is oversold but the oscillators are still negative with a weak RSI and the MACD bearish. The weekly stochastics have turned back down. Prices traded to weekly support at 5665/5650 and this is a pivotal level now. The 200-day MA is 5711.
SPY Weekly
 Prices traded to a key area of support against the 5665/5650 area before reversing. Support is now 5739/5738, 5724 and 5710/5708. Under 5708 can test 5695/5693 with potential to retest 5666/5665 and 5650. Closes under 5650 setup critical short-term support of 5367/5350 with support at 5611/5609 and 5493/5490. Daily closes under 5350 sets up 5289 and 5244/5240 with full counts to 5125/5119. Closes under 5199 will open counts into the 4884/4880 area. Closes under 4880 are bearish and open counts to 4614 through 4586.
S&P 500 Index Hourly H-L-C
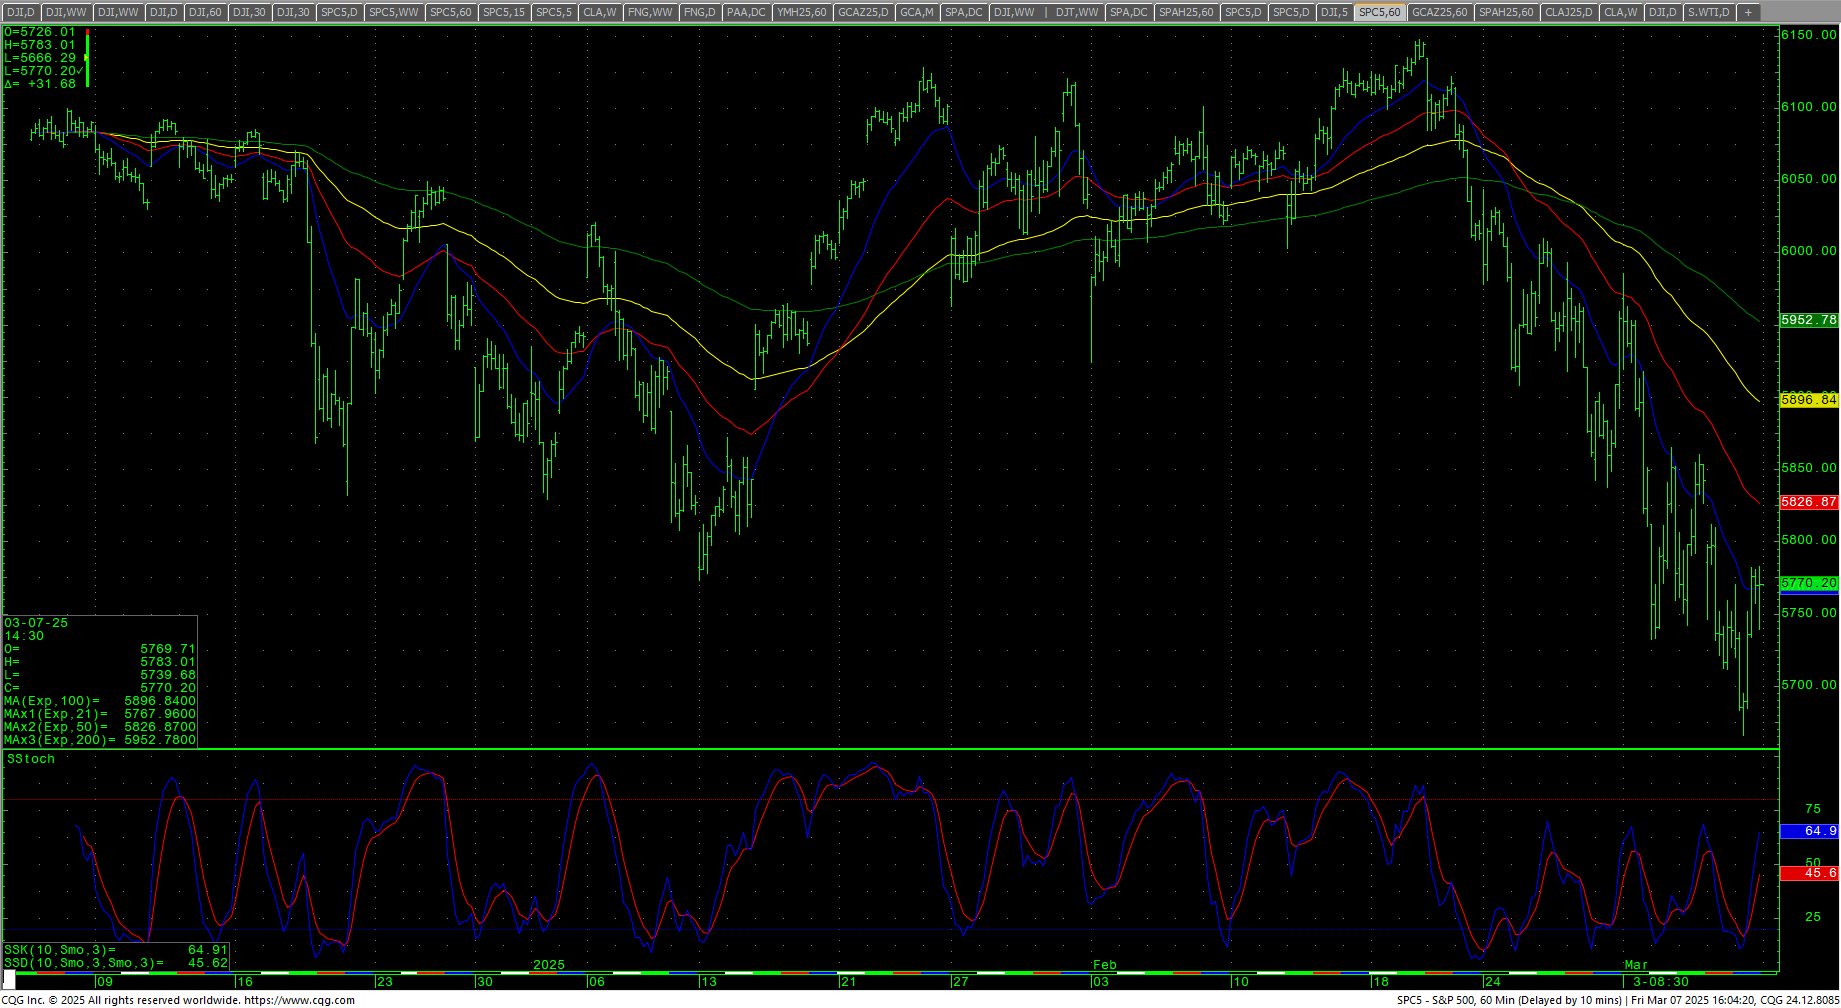 The hourly ended the week slightly overbought as prices test the first area of resistance of 5788 through 5800. A drive above 5800 can test 5826 with counts to 5850 and 5863/5865. Closes over 5865 count to 5906 with full counts to 5963/5966. Daily closes over 5966 suggest 6027/6033 and opens counts to 6112/6114 and full counts into critical resistance at the intraday high of 6147.43. Rallies through 6148 should test 6160 with a shot at a target of 6180.35. A drive with closes over 6181 can test 6206 with pivotal resistance at 6224. A drive over 6224 will open potential to the 6278.80 objectives with a shot at 6296. Above 6296 can carry to 6368 with counts into the 6440 area. Closes over 6440 will open counts to 6584. A breakout over 6584 sets up 6638 and 6692.
| Resistance | Support |
|
|
Charts courtesy of CQG, Inc., CNN, Koyfin, Trading View and AAII