
TECHNICAL ANALYSIS (by Intraday Dynamics)
Trouble in Paradise? Two Critical Indicators Now
S&P 500 Index Hourly HLC
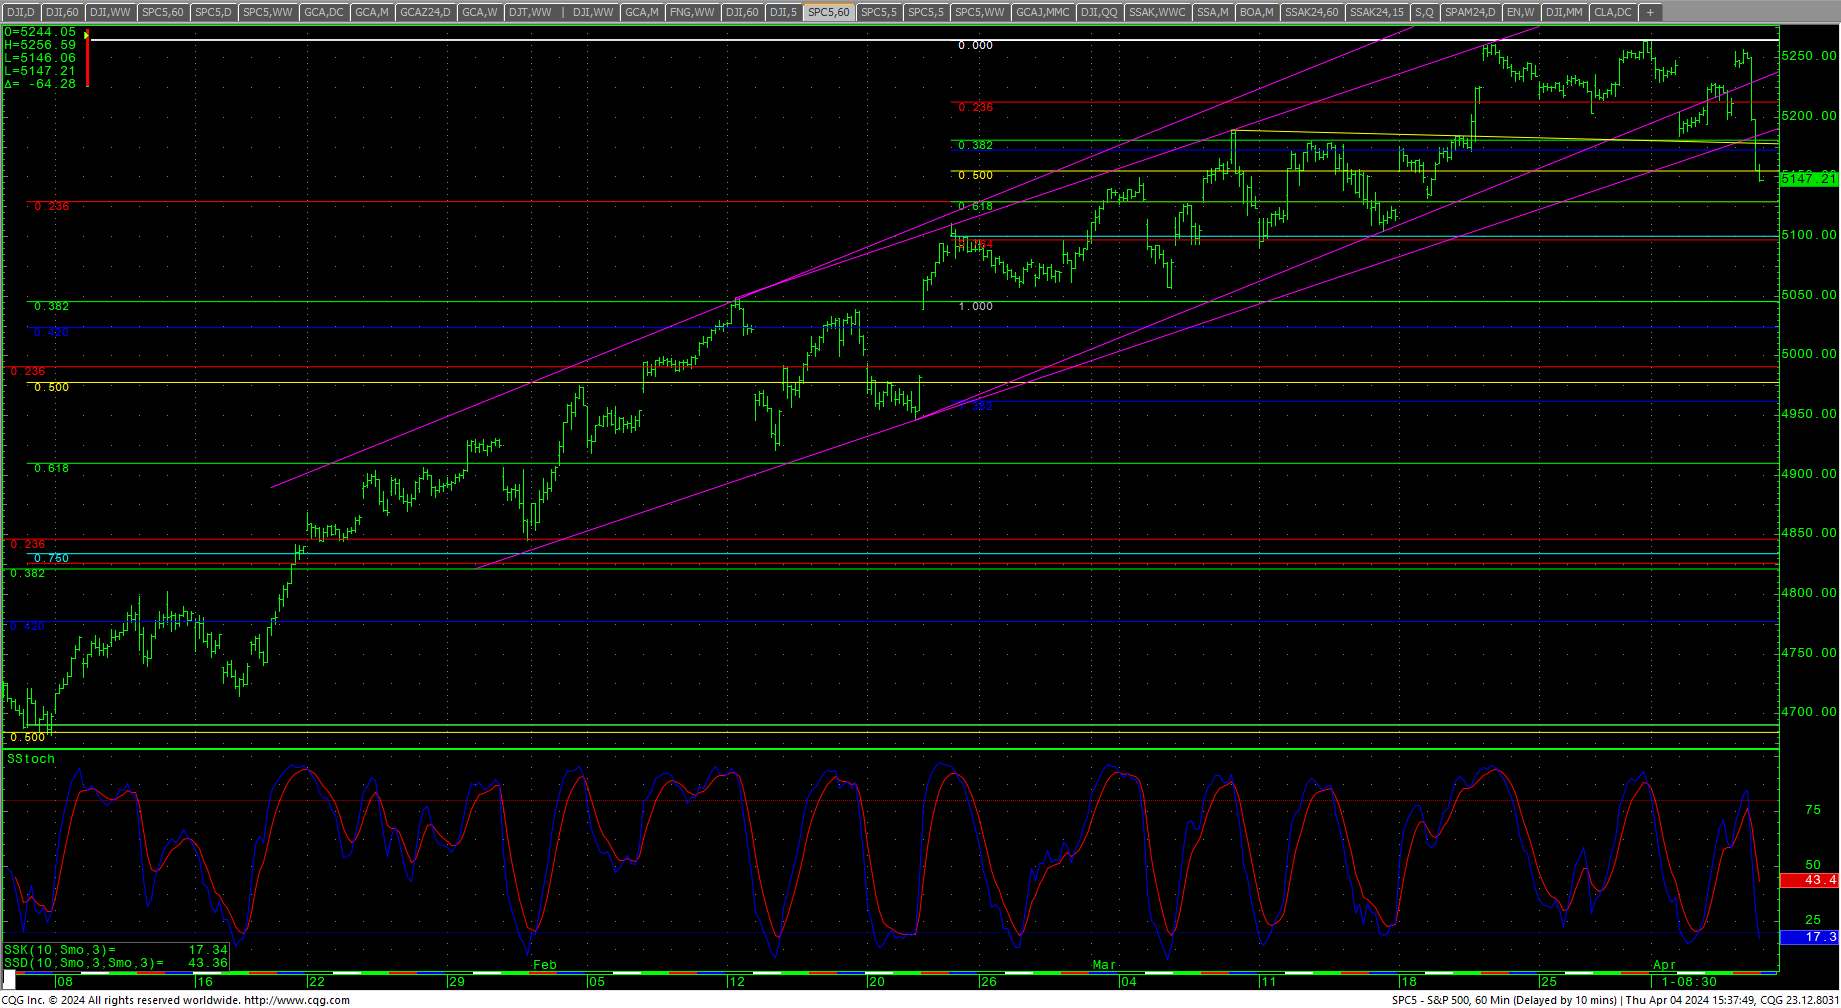 Thursday’s cycle timing saw a massive 109.38 range in the S&P 500 as prices initially gapped higher and closed the island gap on the charts, only to swoon over 2%, (following some bearishly construed comments from Minneapolis Federal Reserve Bank President Neel Kashkari) ending the day down -1.23% for the worst one-day performance in quite some time. The action this week throws out two very distinct indicators that, coupled with the volatility, need serious attention for the trend. The first is the initial island top on the hourly chart which appeared in Tuesday’s trade. The second, and perhaps most critical right here, is the fact that Thursday’s trade went back and filled in the gaps, eliminating the island and then plunging. Remember that we have pointed out in the past two weeks, the CRITICAL cycle timing window we are in now, saying: “A reminder that we are now in a critical cycle window that runs between now and the end of April. Trade can become much more active with potential for wider swings and short-term moves.” The next critical date is April 19th.
10-Year Notes Spot Futures Daily H-L-C
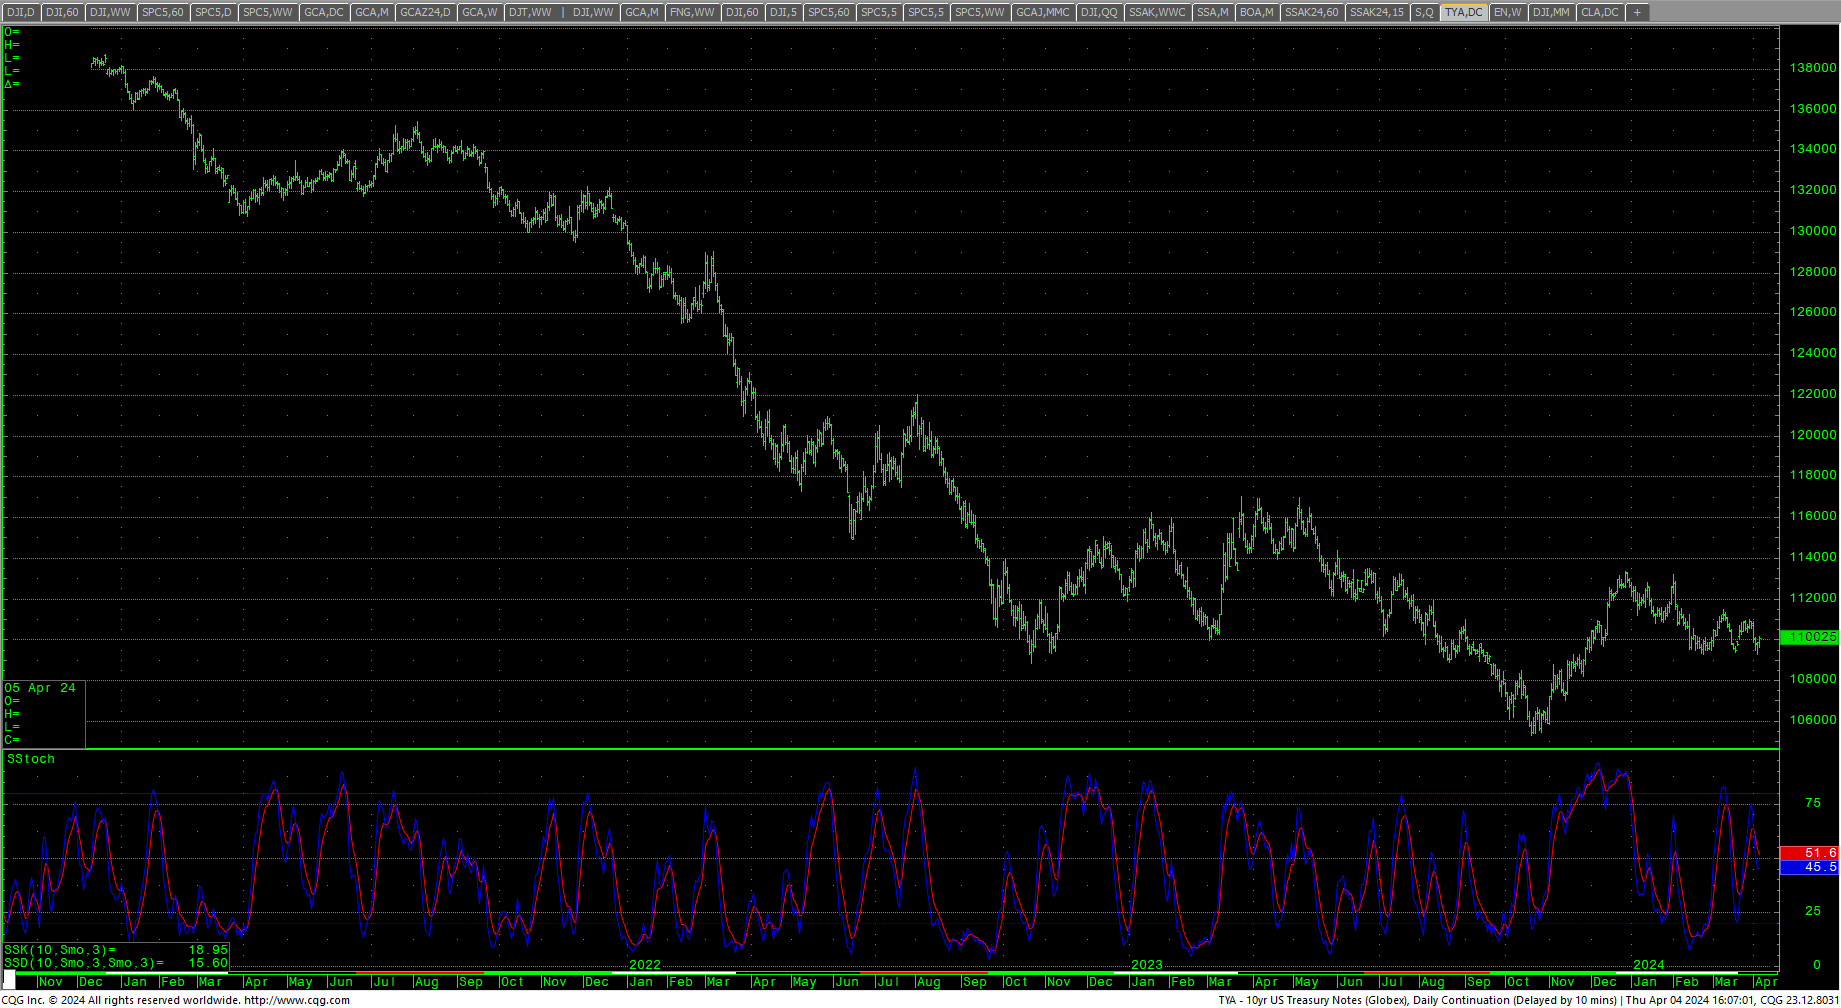 Friday we get Unemployment Data with the current market consensus for the numbers are +200K versus +275K and the rate at 3.8% versus 3.9%. Anything can happen with this volatile cycle timing window but, suffice to say. Good is bad and bad is good right now. Bonds rallied Thursday as the daily 10-year chart is showing a preliminary bullish divergence on this week’s new lows. (Note that on the spot chart, nearby futures found support at the February low of 109090 while the TYM24 traded new lows for the move.) Support and resistance for TYM24 can be found here.
The market collapsed under support of 5155, and support is now pivotal short-term 5129/5125. Daily closes under 5125 can carry to 5045/5038 with counts to 4977 and critical short-term support of 4909/4905. A breakdown under 4905 sets up a move to 4845 with counts toward the 4587 level. Closes under 4587 give counts to 4378 with potential to daily support at 4168/4160.
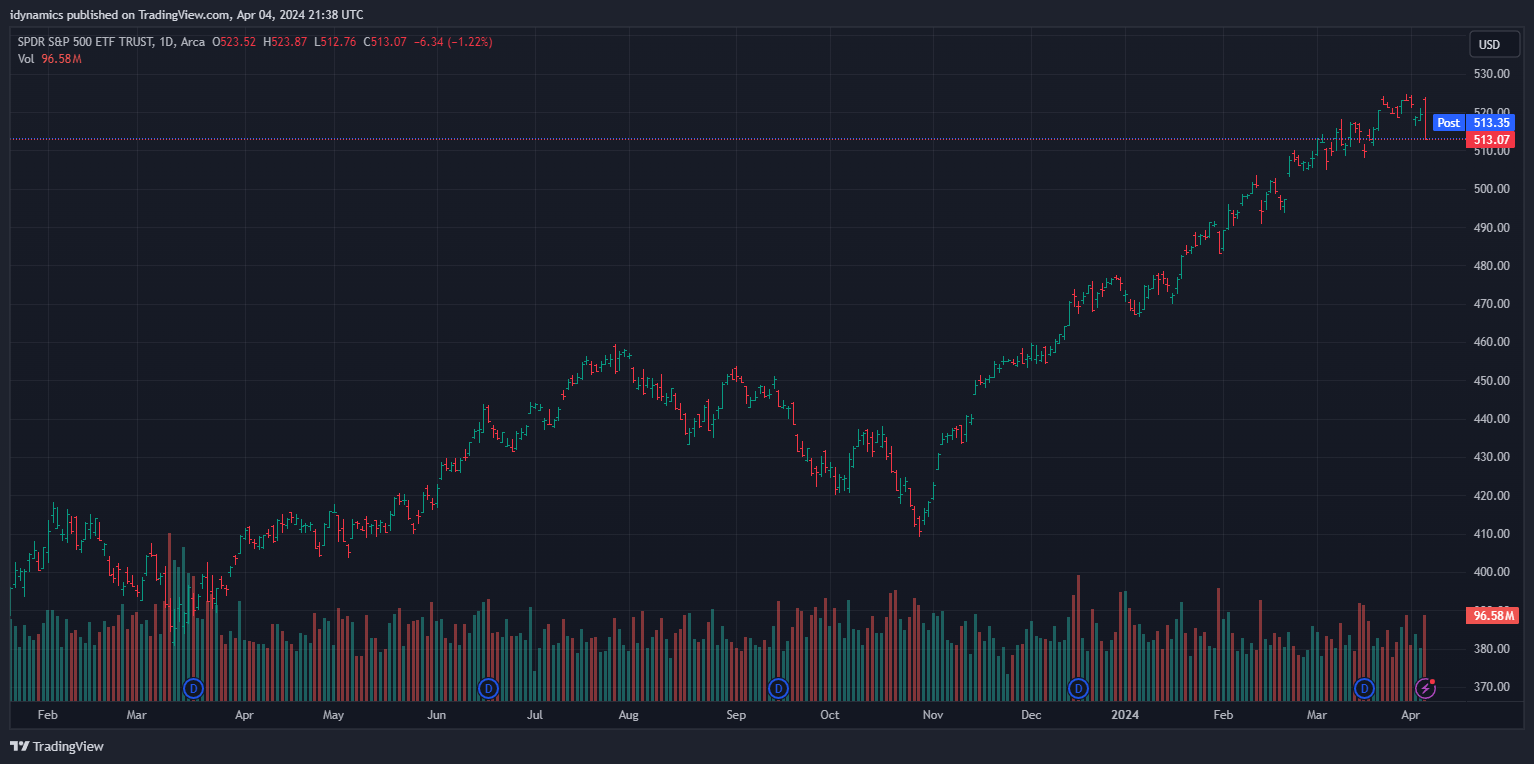
SPY Daily H-L-C
 Resistance is 5174 and 5191/5192. A drive back over 5192 can test 5205 with potential to 5219/5221. Rallies over 5221 should test 5256/5265. Closes over 5265 count to 5288. Closes over 5288 will open counts into the 5432 level. A breakout over 5432 will open potential to the 5576 with counts into the 5720 area. Closes over 5720 offer upside targets at 6000/6008.
Resistance
|
Support
|
Charts courtesy of CQG, Inc., and Trading View