
TECHNICAL ANALYSIS (by Intraday Dynamics)
Major Indices Week of April 4, 2025
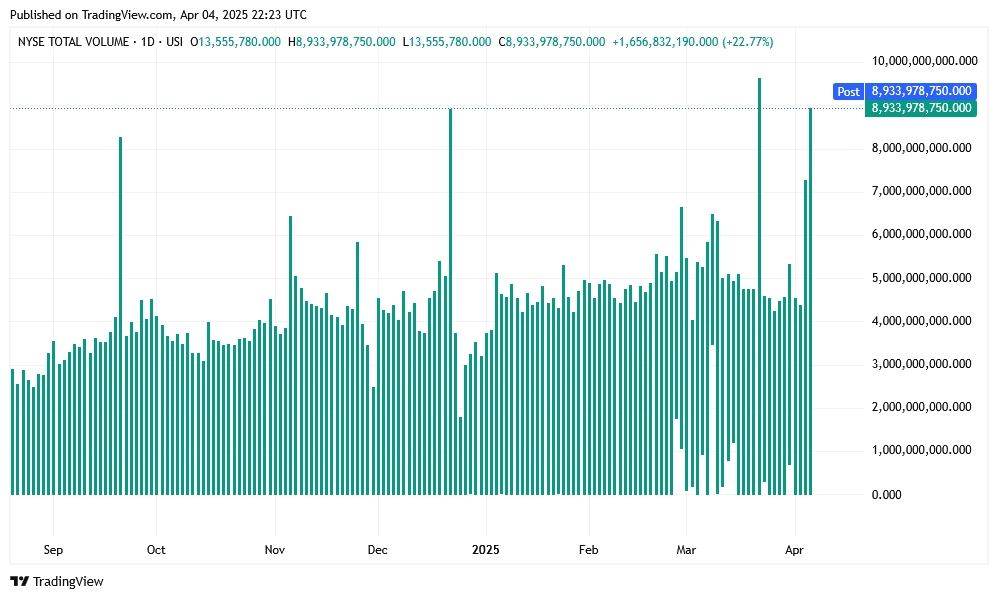
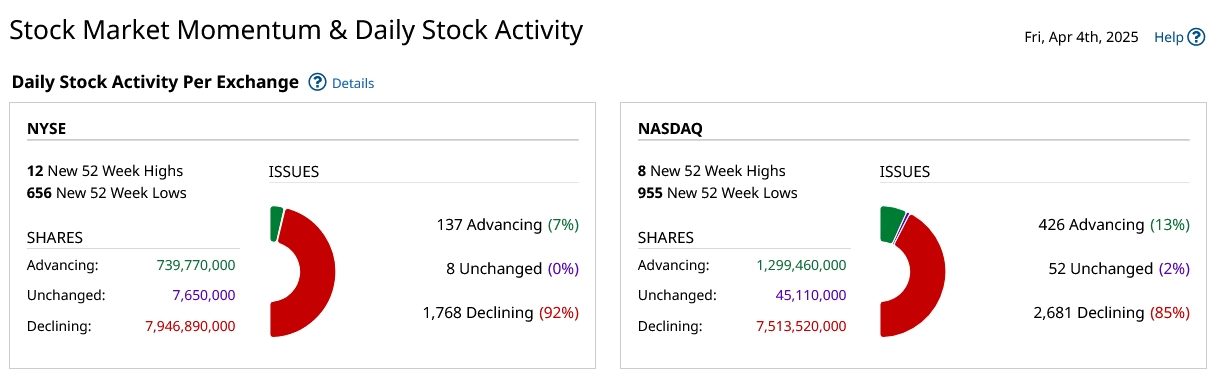
 NYSE Volume
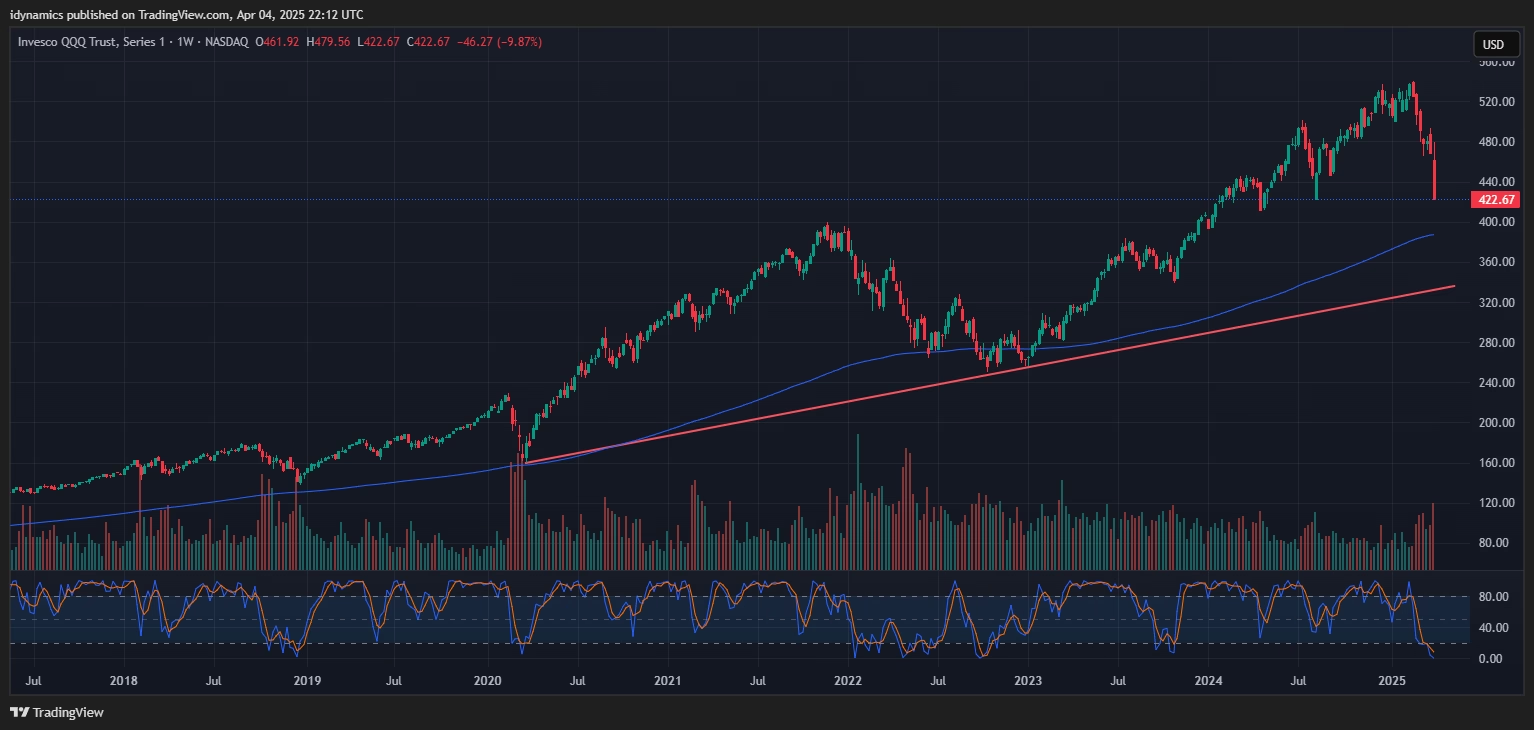
QQQ Weekly Candles
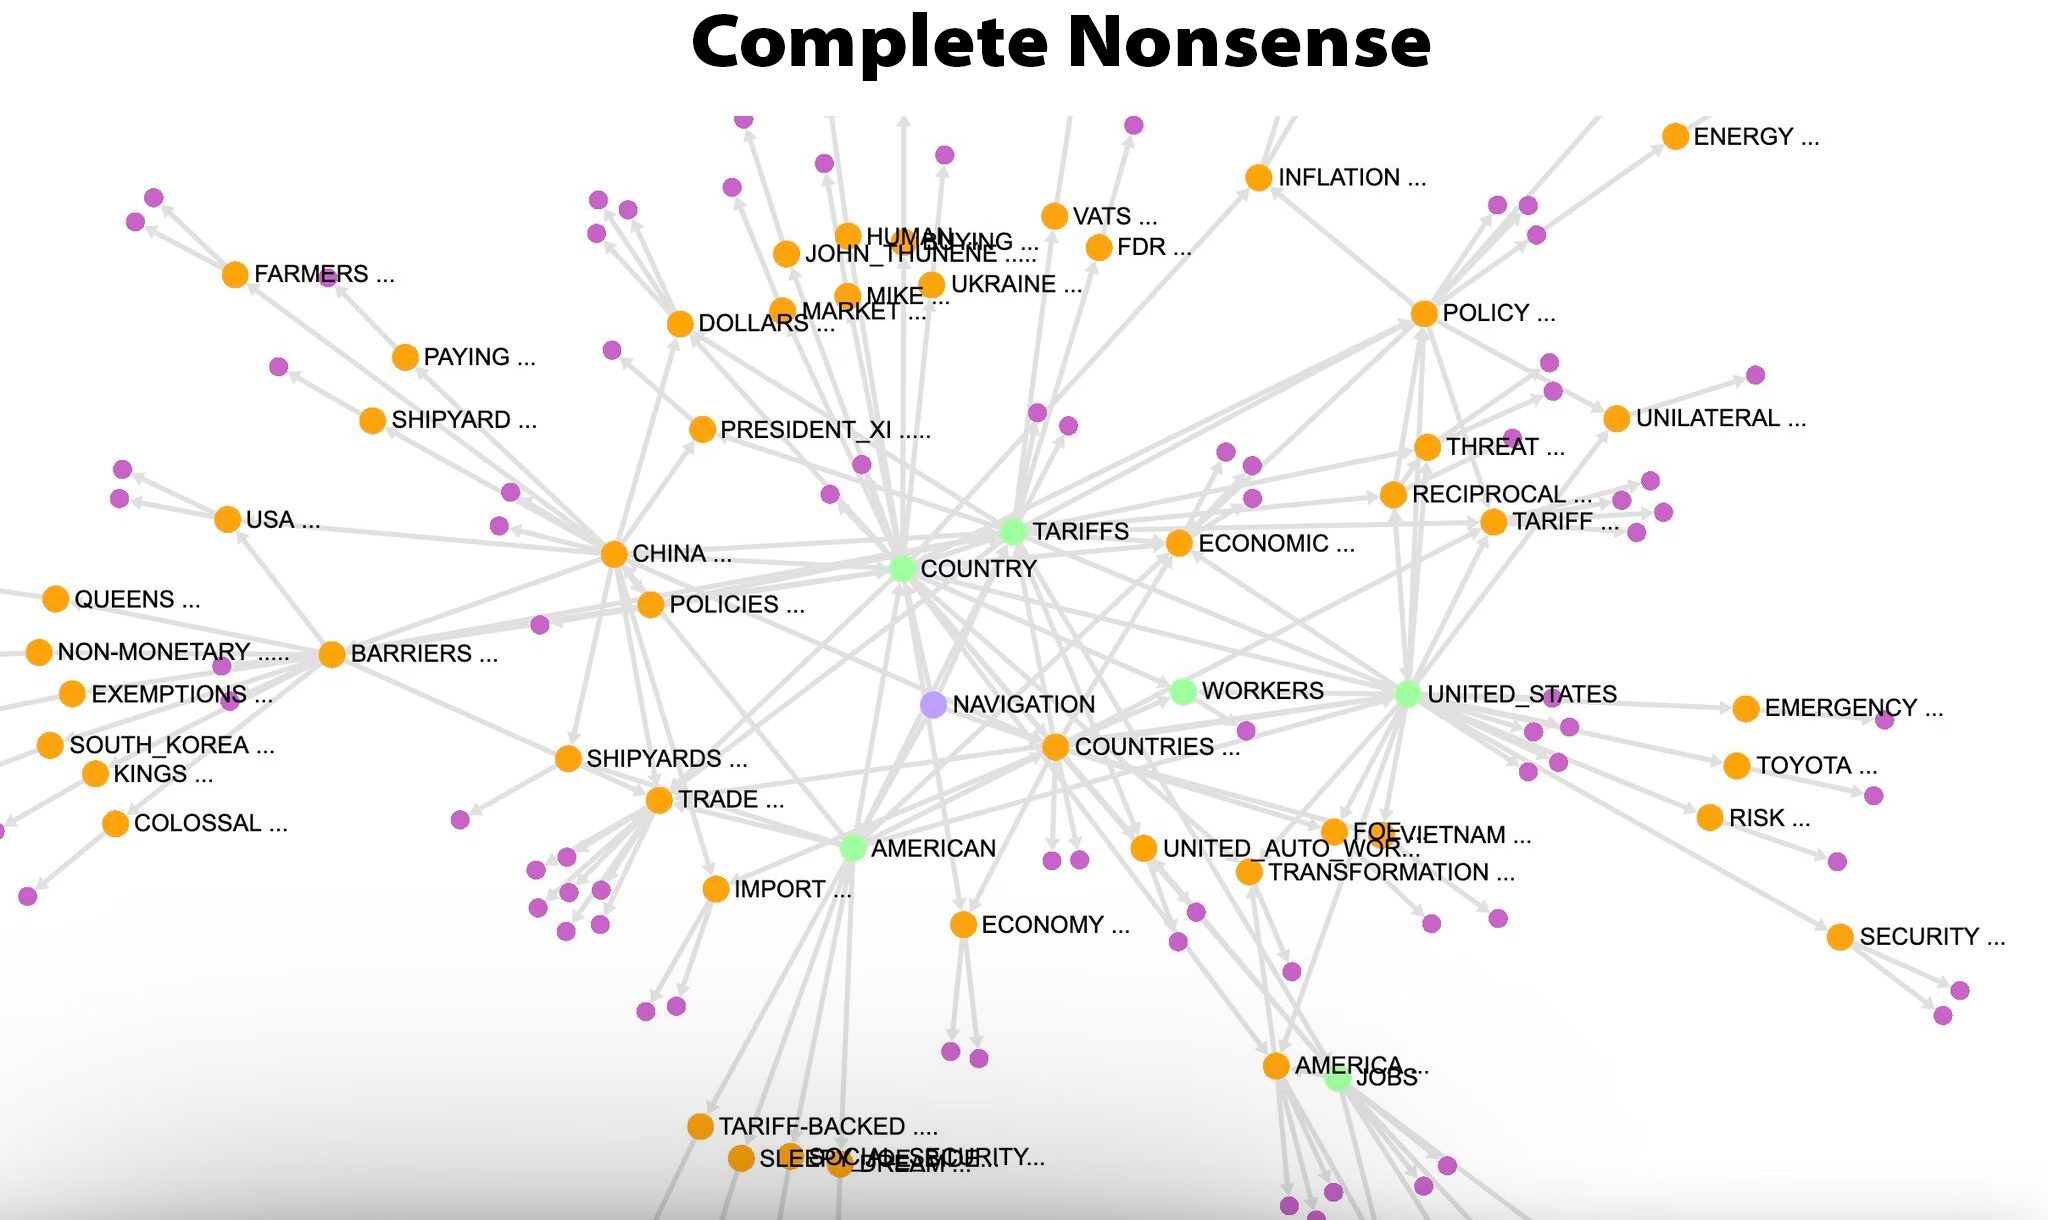
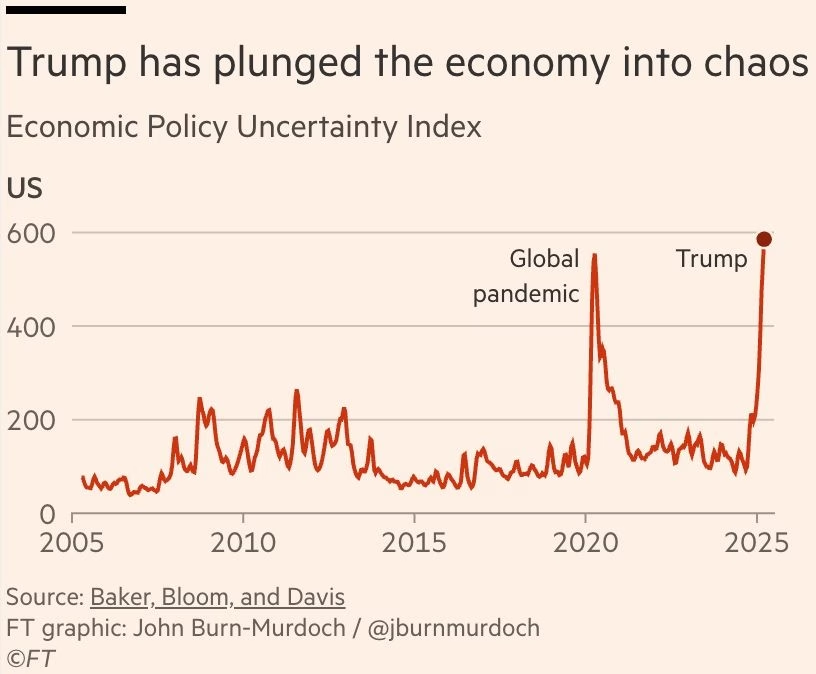
 Stocks entered April on a high note and then a harsh reality set in on “Liberation Day” which turned out to be “Liquidation Day.” Not only were the anticipated tariffs larger than people expected, but they were completely bogus, made-up and nonsensical. From last week’s letter: “Are we potentially heading toward the “Gradually and then suddenly” stages?”

 Tarrifying Stupidity
 How stupid are tariffs? There are 33 million companies in the USA. Only 21K employ 500 or more people. And, combined they only make up 23% of workers. Tariffs ignore the more than 32 million entrepreneurs that can’t afford to build a new factory or pay tariffs or absorb cancelled contracts.
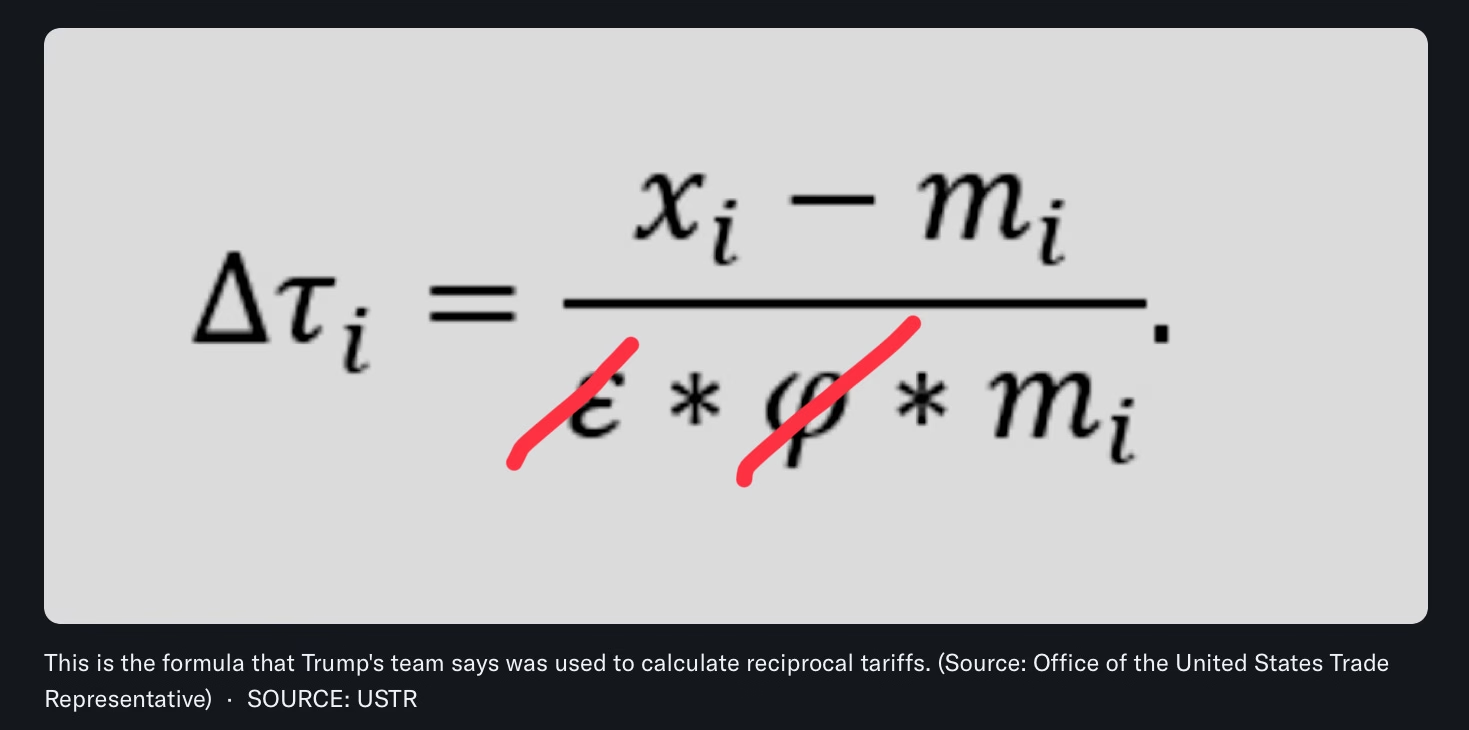
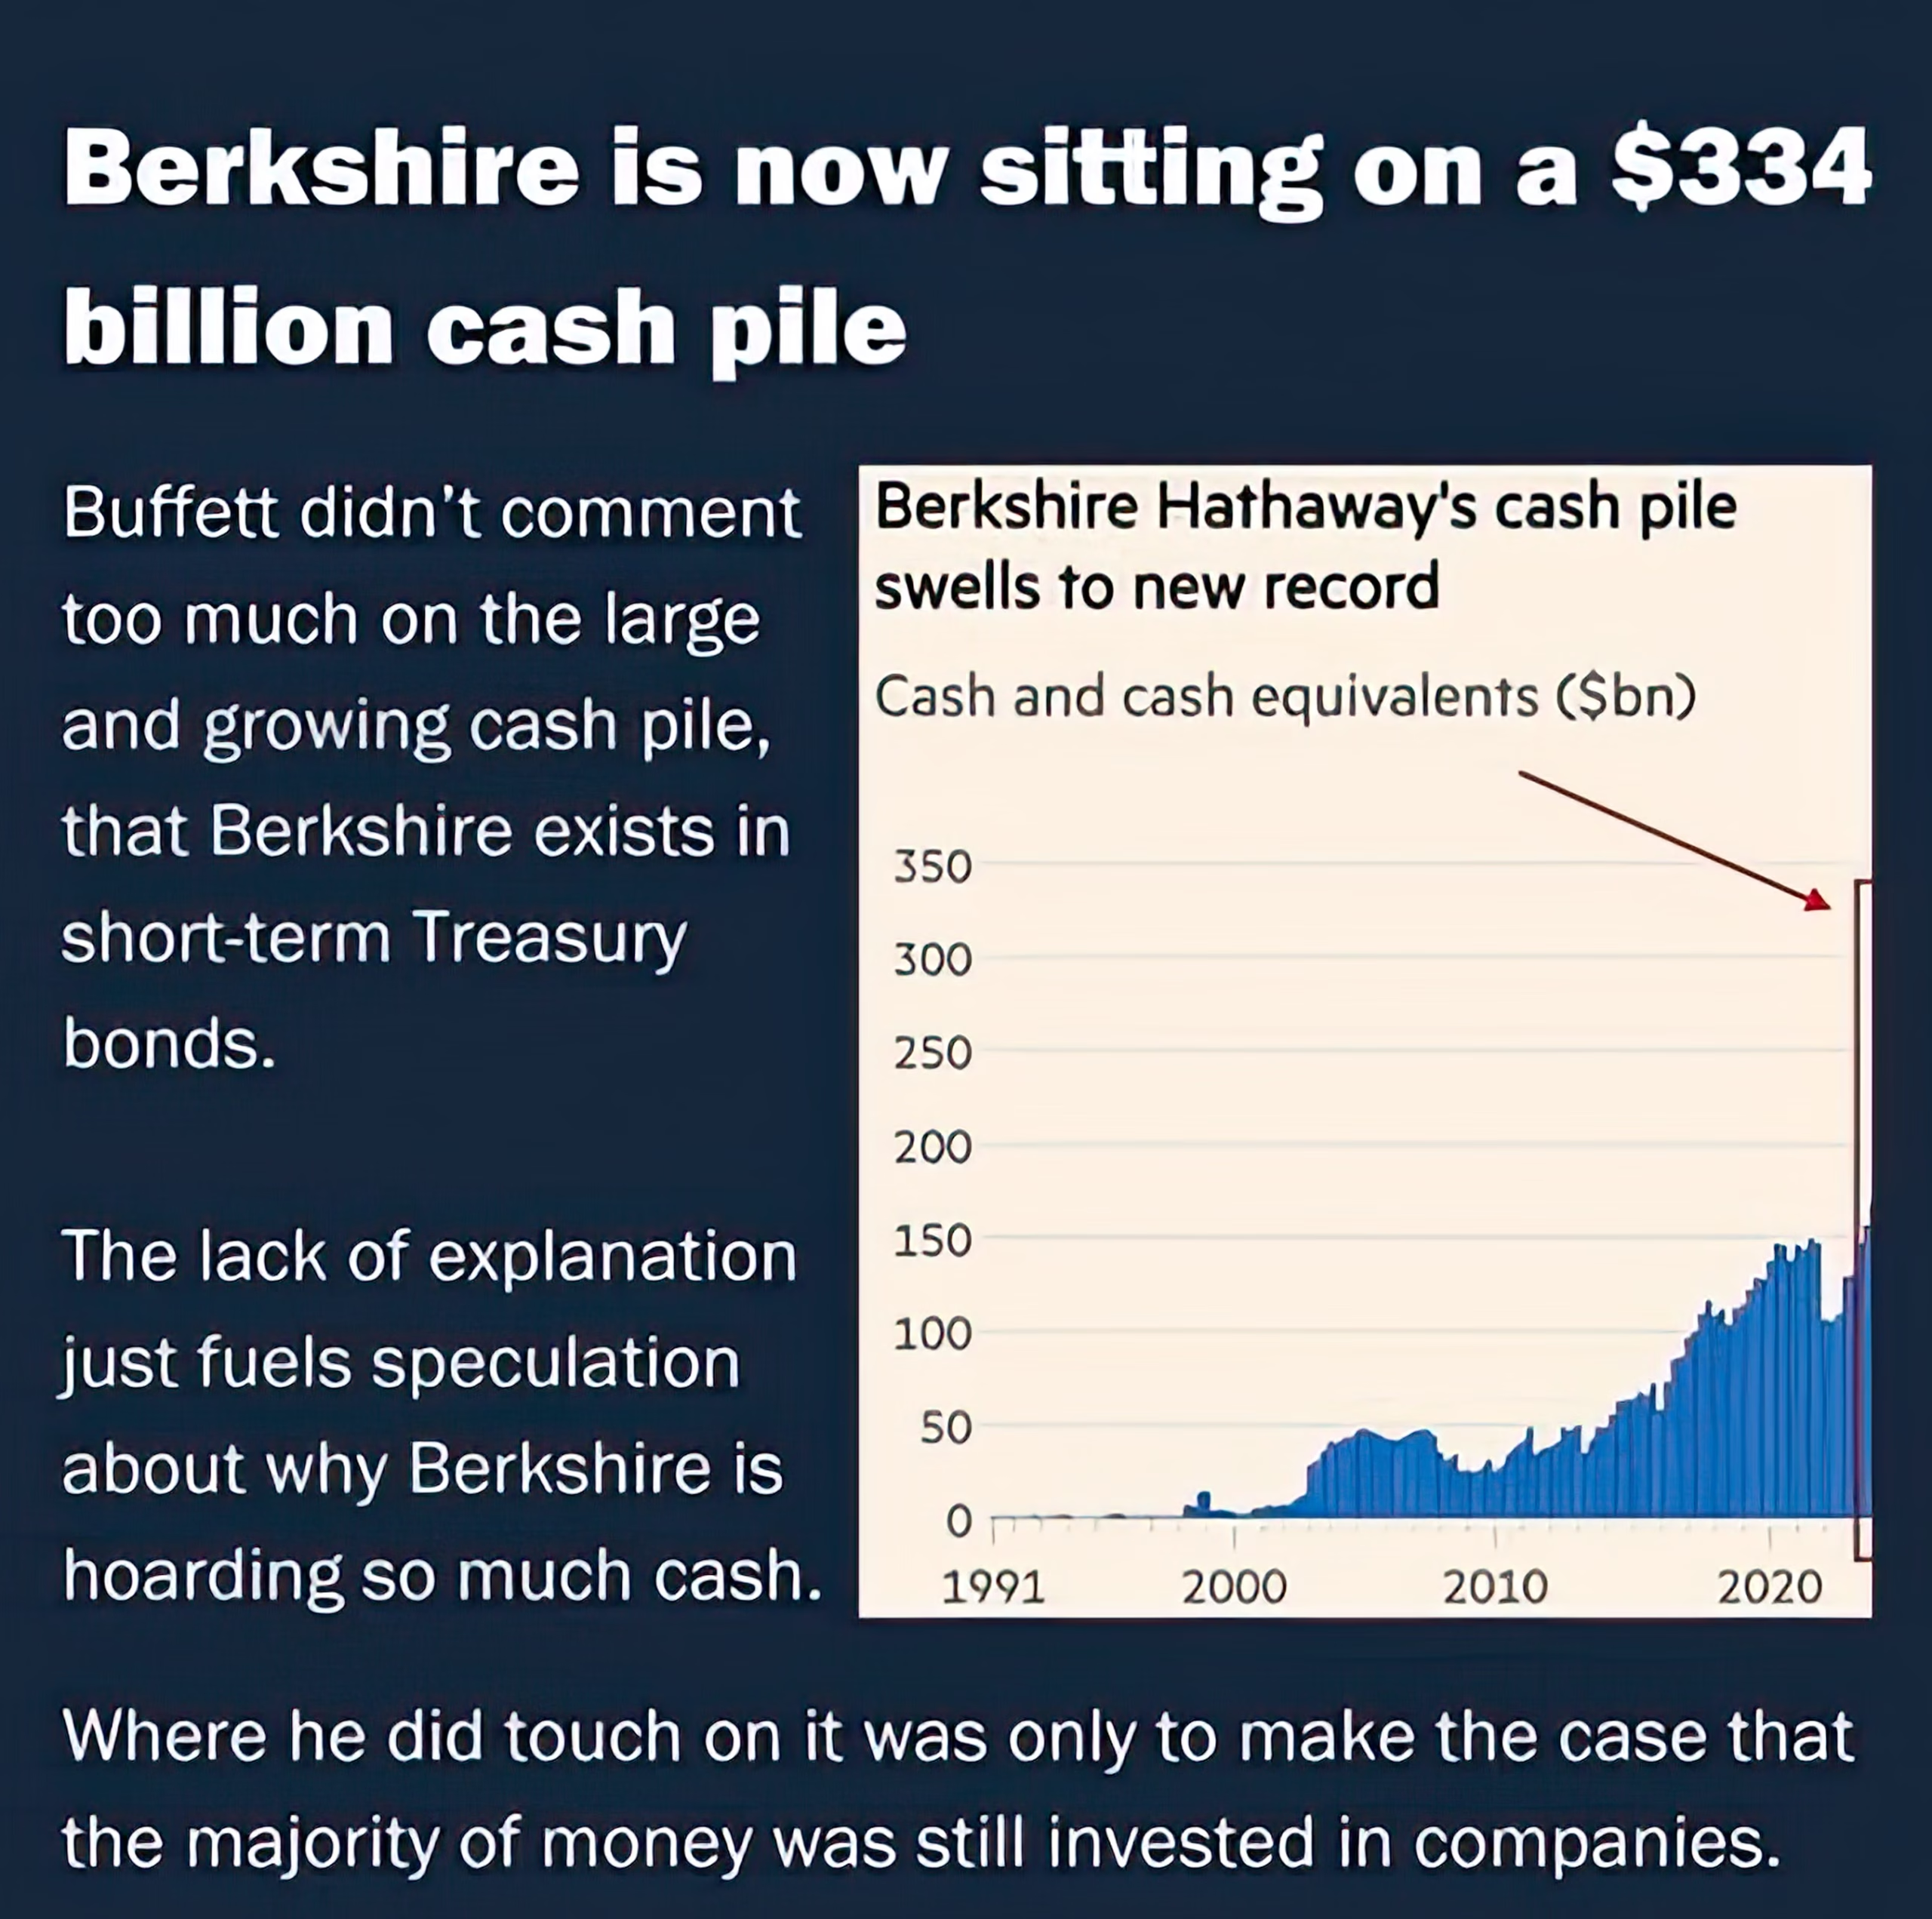
 The first thing that made people skeptical was the ridiculous “formula” that they linked to the so-called “tariffs” that other countries supposedly were charging the U.S. That, and the fact that tariffs were applied to countries that have no human beings living there such as The Heard and McDonald Islands, where the only inhabitants are penguins. To add insult to intellectual injury, they tried to spin tariffs as something that “Warren Buffet endorsed.” To be clear, this is what Warren Buffet had to say about tariffs.
“Over time, they are a tax on goods. I mean, the tooth fairy doesn’t pay ’em!” Buffett said with a laugh. “And then what? You always have to ask that question in economics. You always say, ‘And then what?’” –Warren Buffet

This is the same Warren Buffet who went primarily to cash in late 2024 and is sitting on the largest cash position in the history of Berkshire Hathaway.
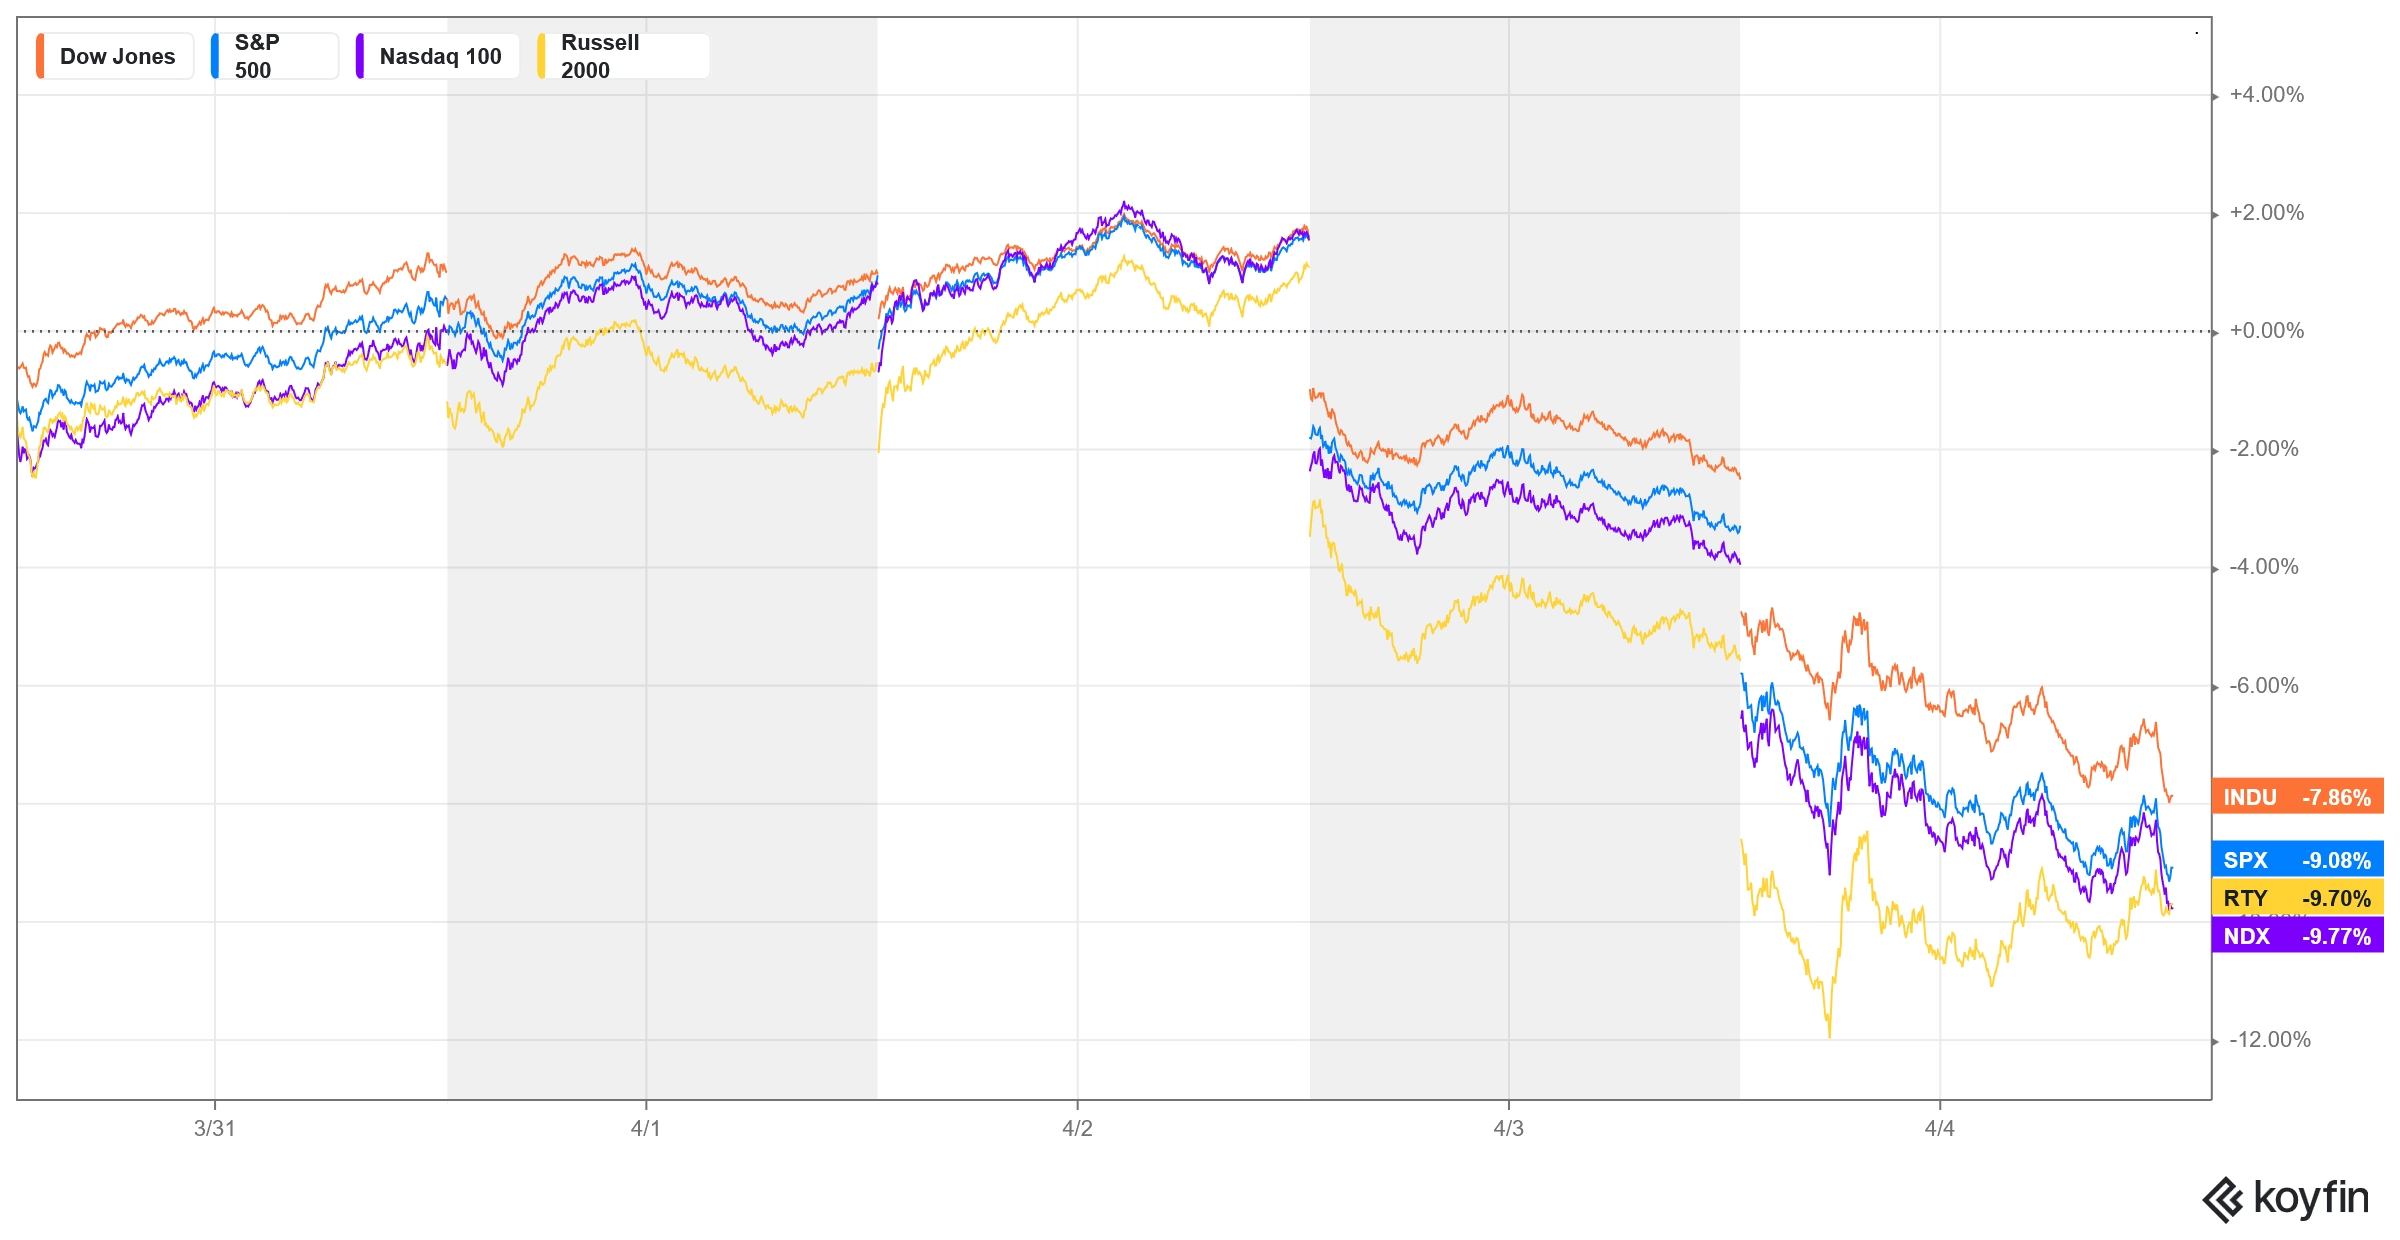
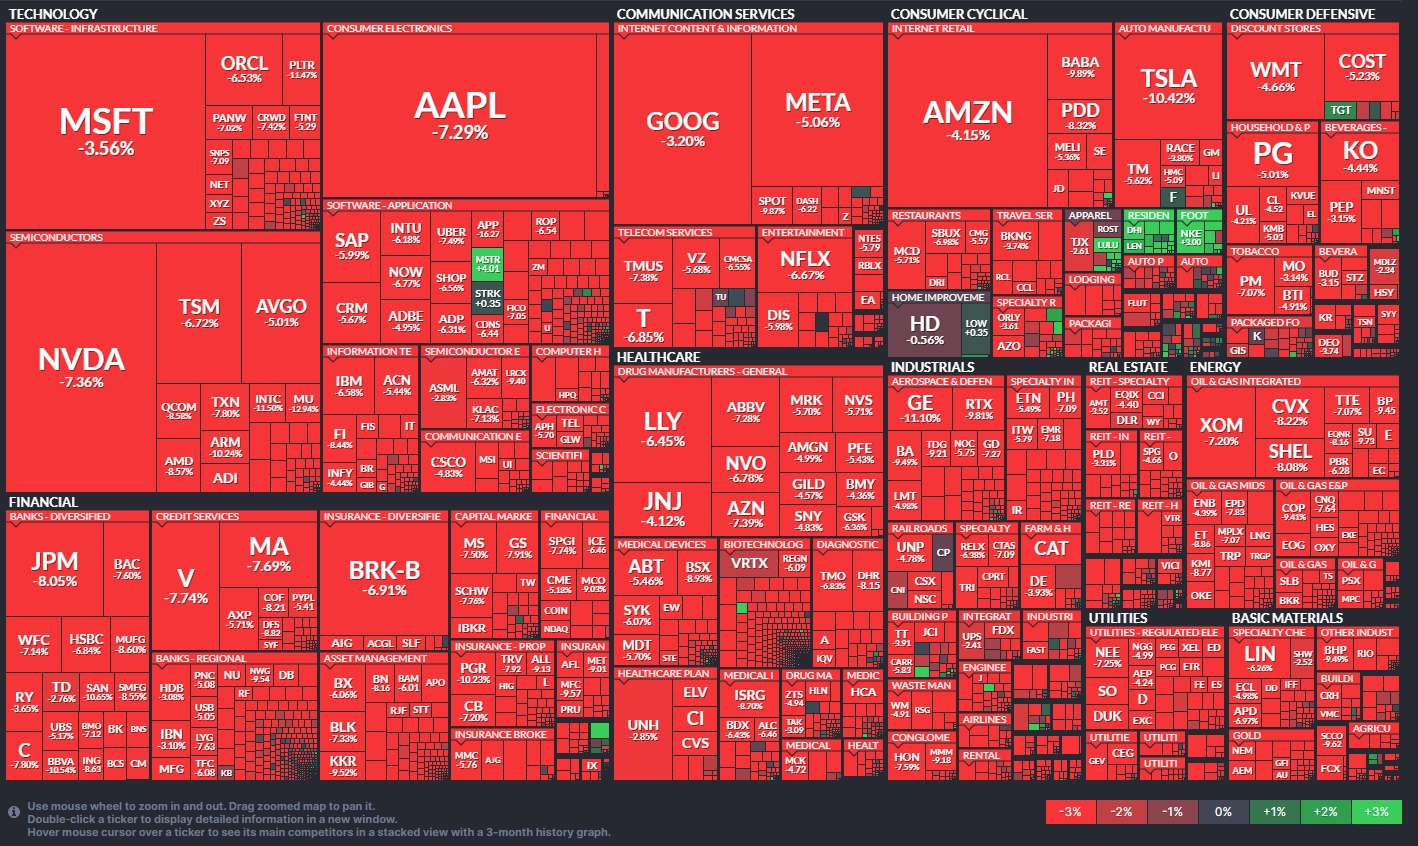
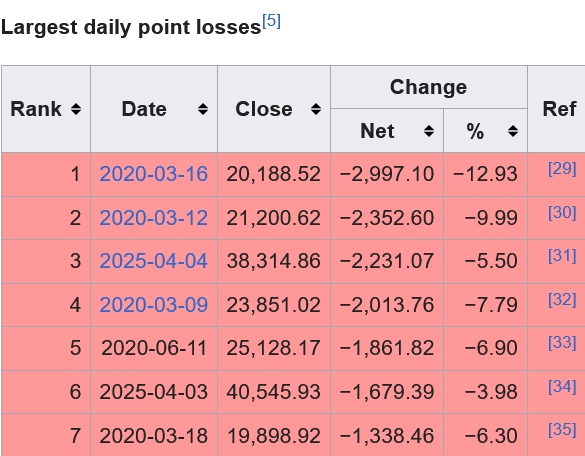
 The declines on Thursday and Friday now rank in the top seven total point declines for the Dow Jones with Friday ranking as the third worst single-day point decline. The combined losses Thursday/Friday amount to $6.4 trillion shaved off the value of U.S. markets and total market losses are now at almost $10 trillion. In fact, the two-day “Liberation” adds up to a “normal” correction as all the major indexes were down -10%+ over those two days. Note that all seven dates on the list occurred under the same ‘leadership.’
 Last week’s declines are the worst one week performance since the 1970s. As I pointed out last week: ”A reminder that the month of April continues a larger window where things should remain volatile.” And then this re-print from the March Timing Update:
“Again, this current window does not end until early May and could run into mid-Summer, late July to early August. While the energy shifts a bit coming out of March, April has the potential to be much more aggressive. Conflict is a keyword, how it plays out needs to be seen. I would not rule out a Black Swan in April, something that confirms the long-term trends and takes participants by storm. The weekend of April 19-20 is key with the 21st as the next ultra critical timing point.”
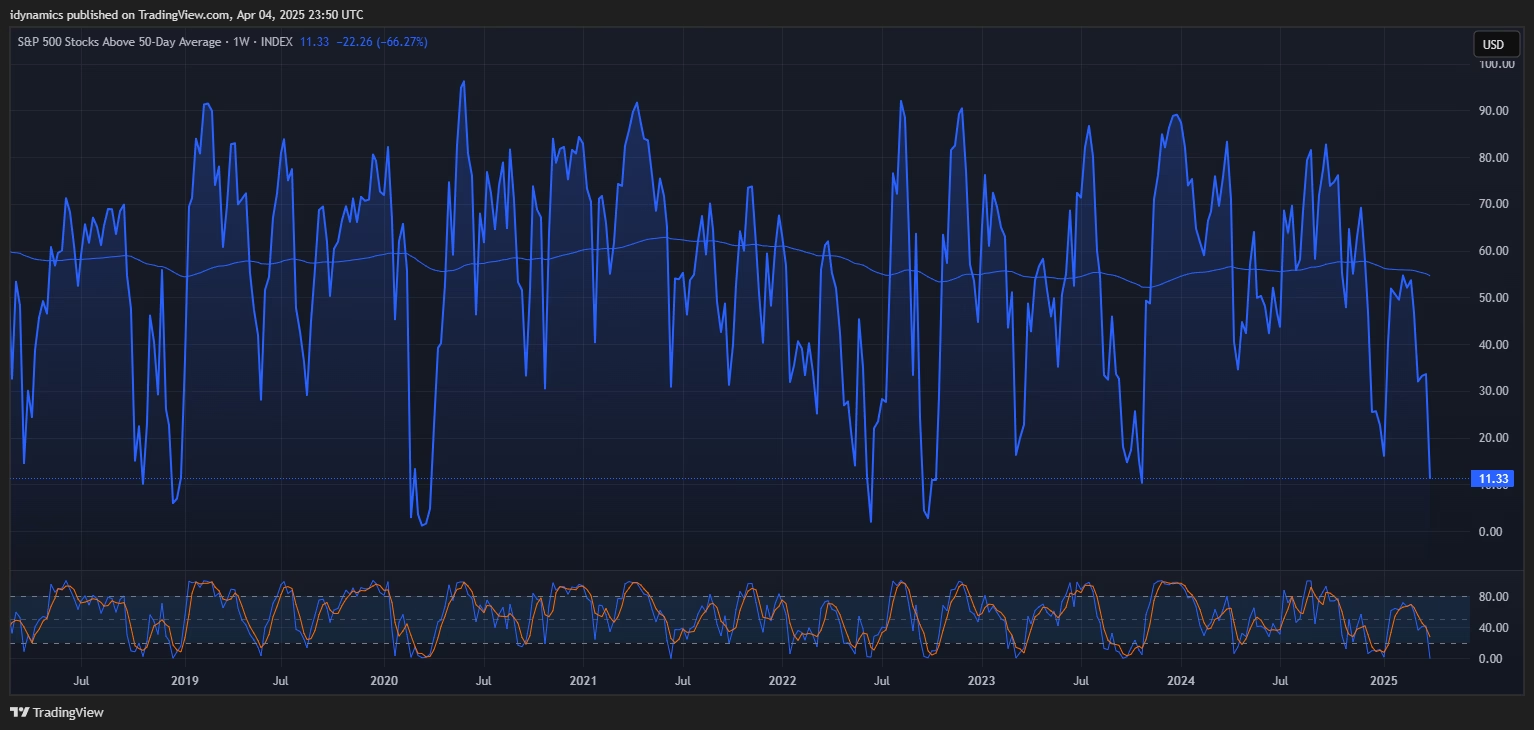
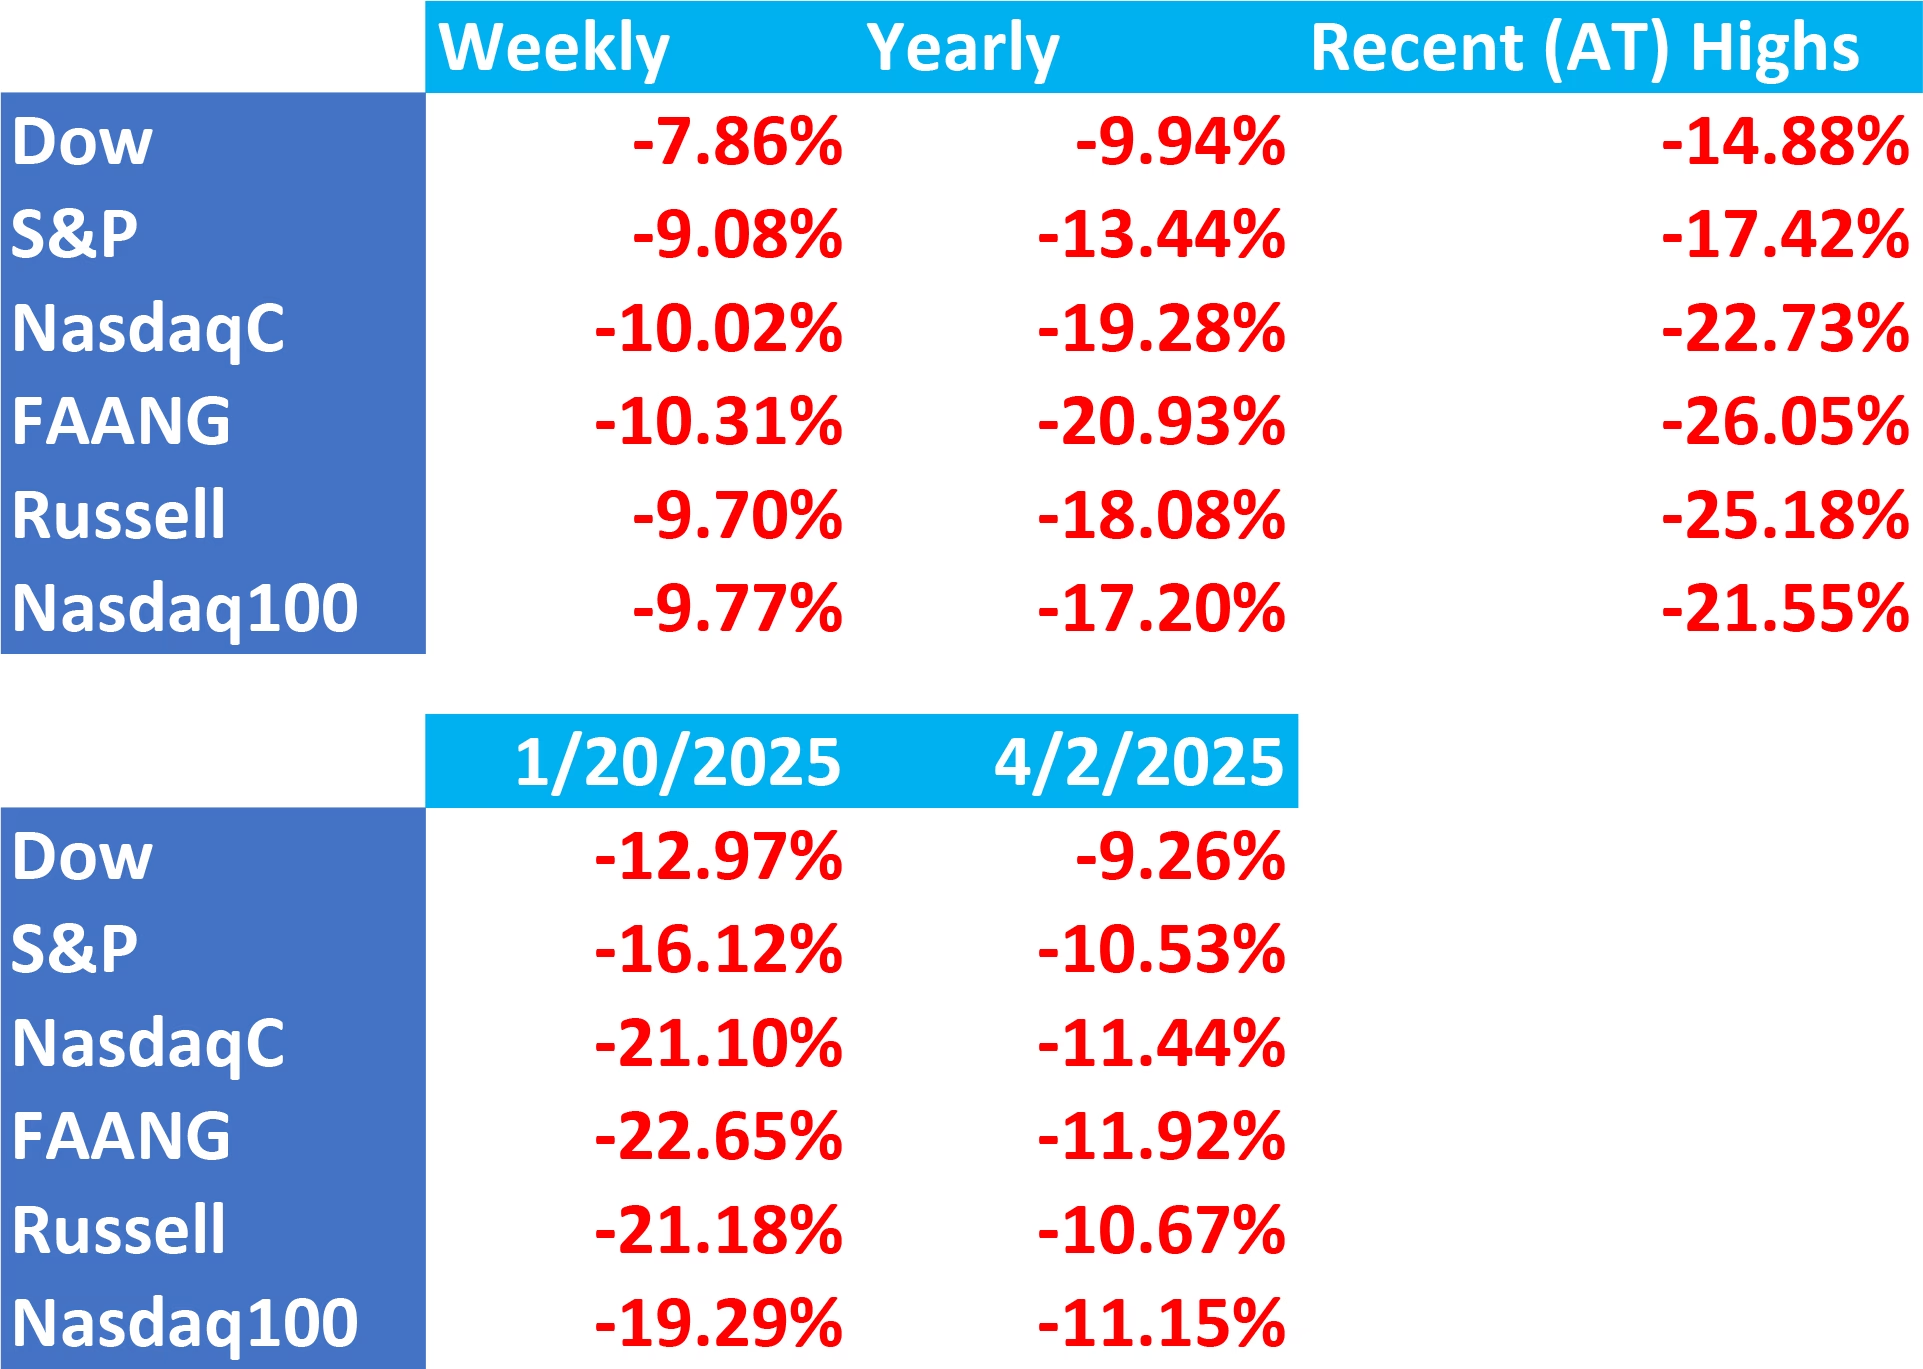
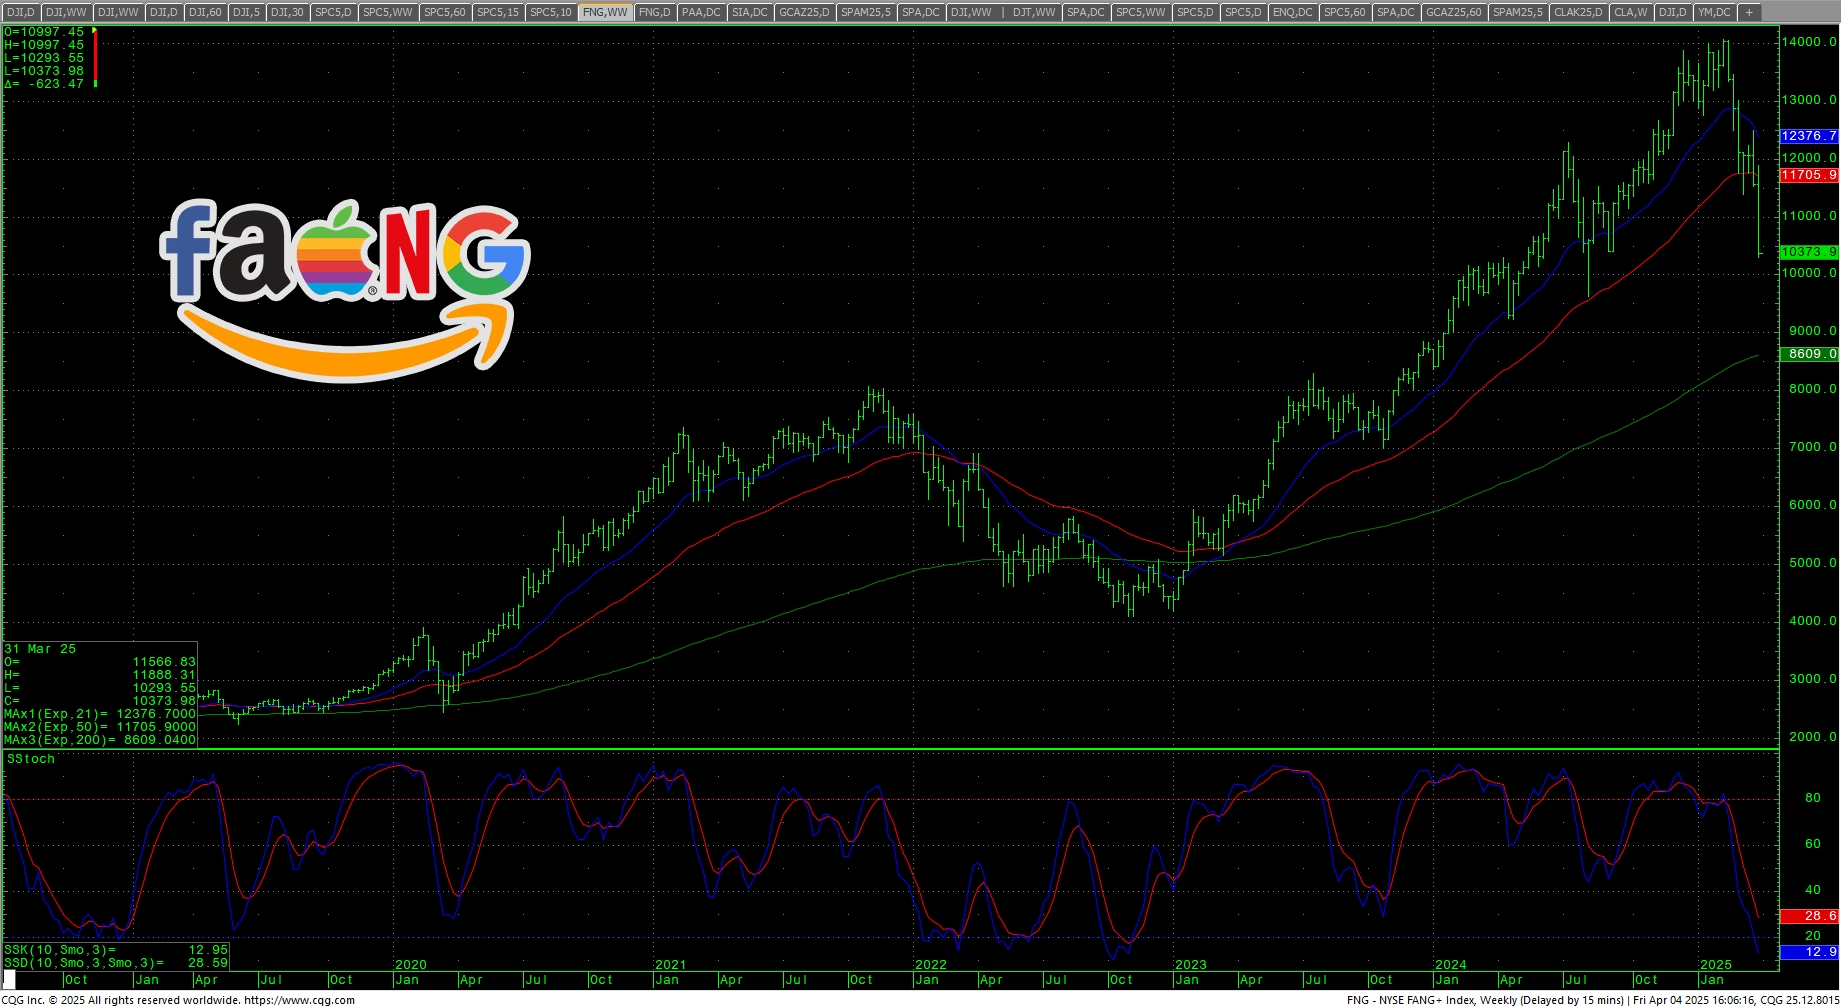
We are now officially in bear market territory for a number of the major indexes. The FANG leads the way, down -26.05% from its highs. The Russell is next at -25.18% from the tops. The Nasdaq Composite down -22.73% from the highs and the Nasdaq 100 down 21.55%. The S&P is down -17.42% and the Dow down -14.88% from the ATH. Another note, the Dow has now met the target off the large double-top pattern which was 38,634. The number of stocks under the 50-day in the S&P 500 has reached sickly levels.
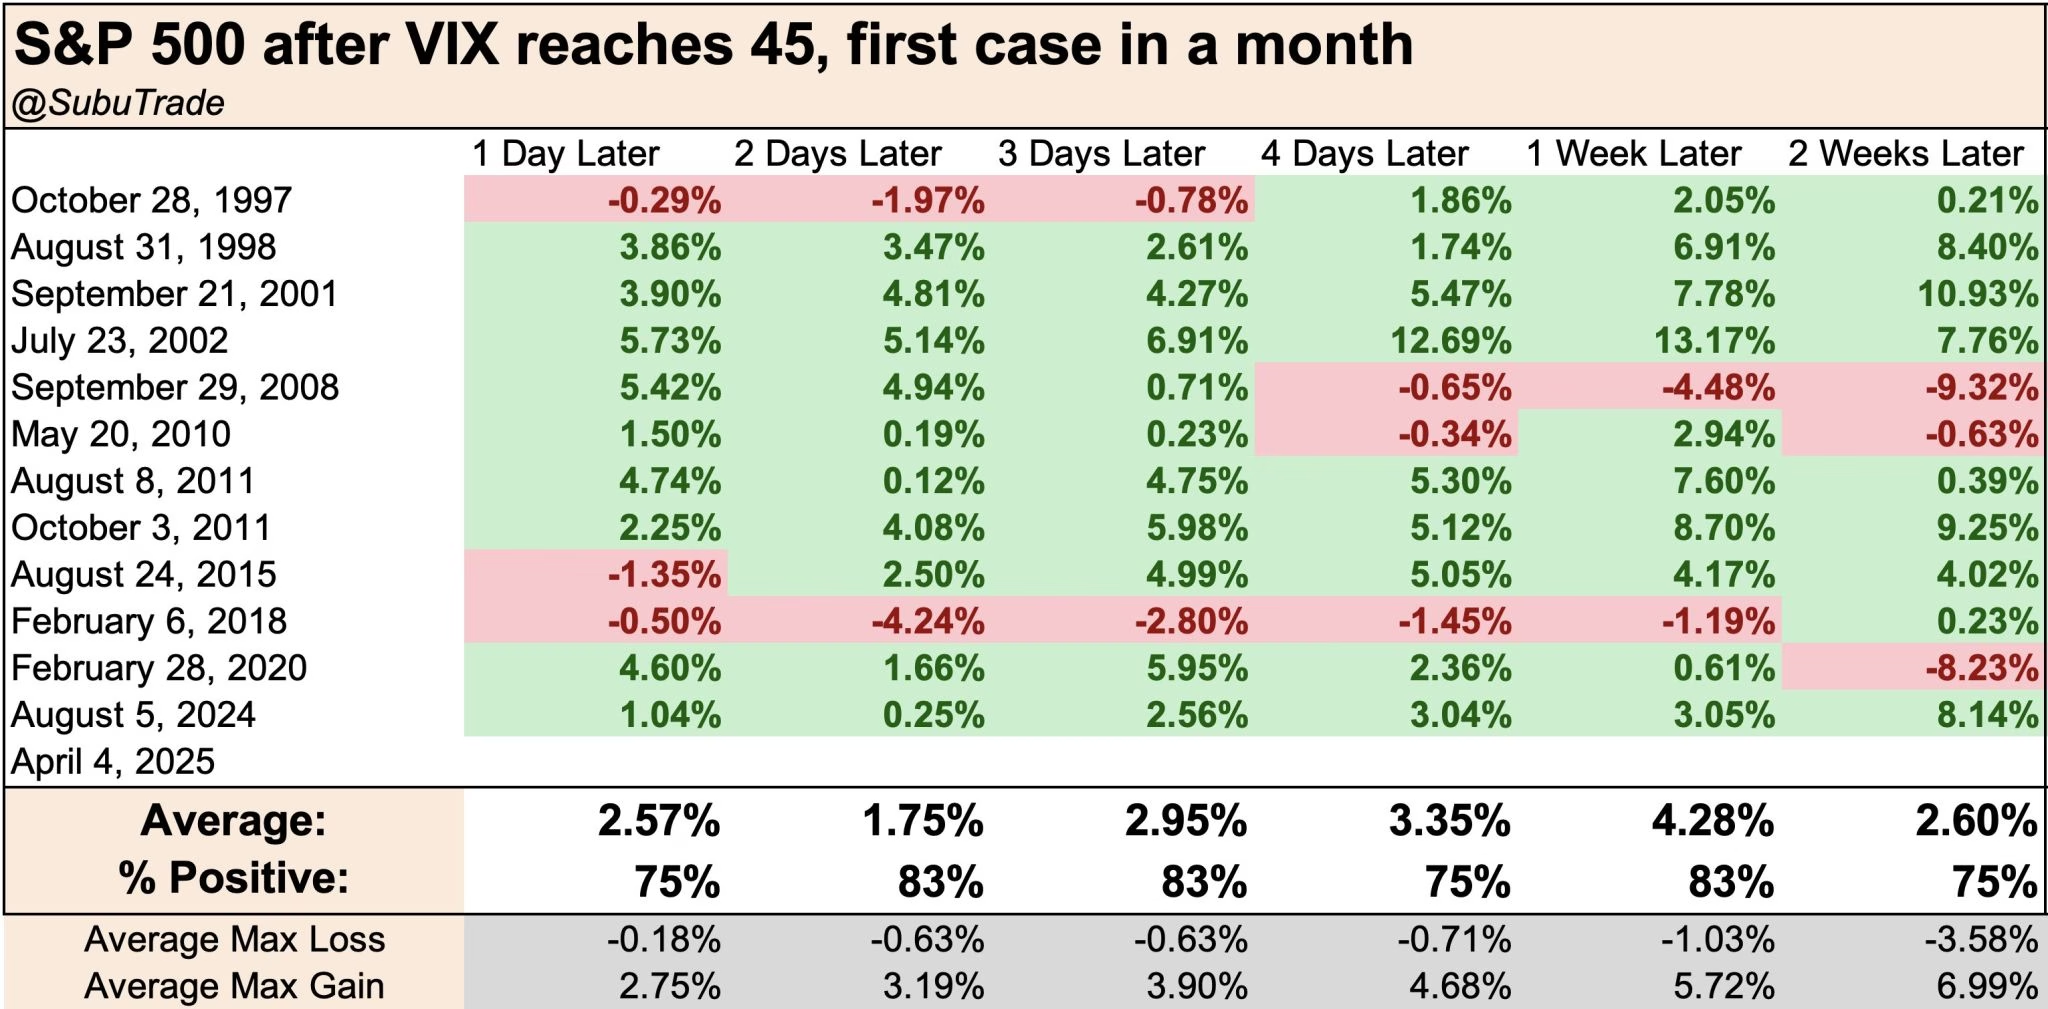
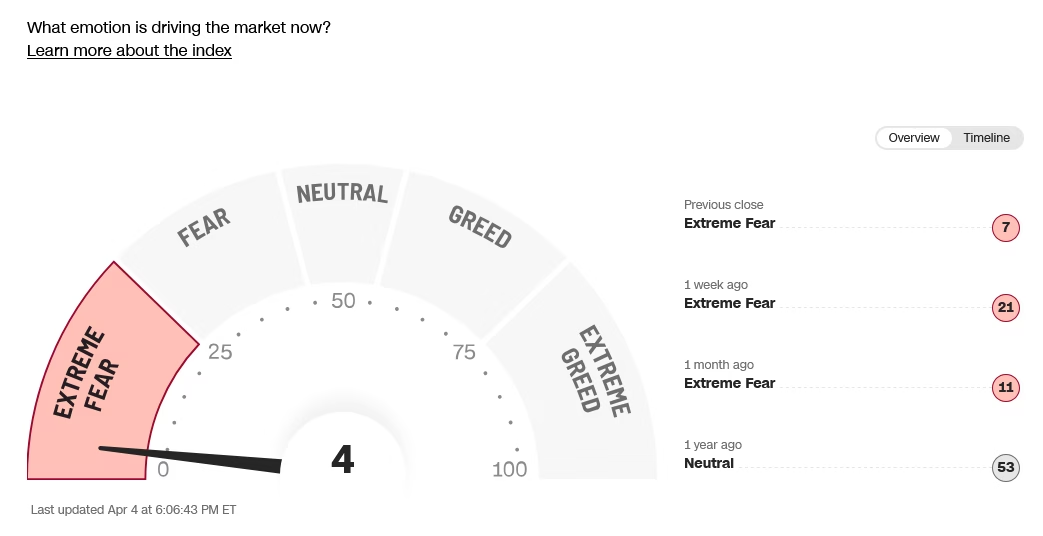
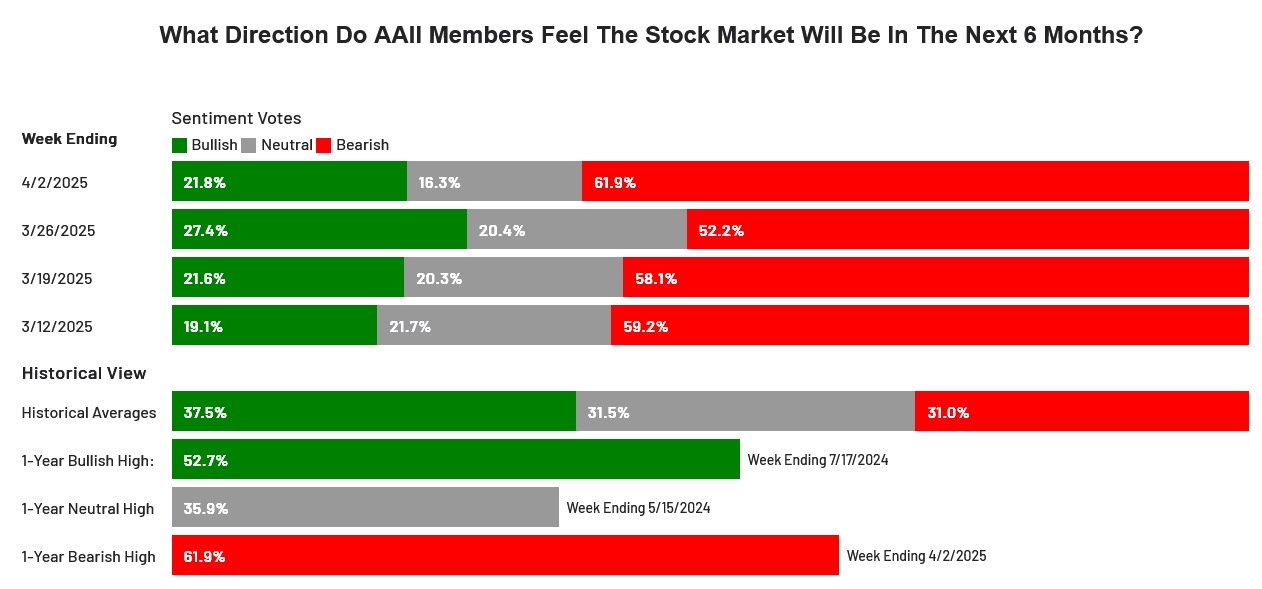
 Needlesstosay, sentiment is at mega-extremes with the CNN Fear Index at 4 and the AAII back to a 62% to 22% imbalance of bears to bulls. The VIX closed at the highest weekly close since 30 March 2020. Oversold is putting it mildly. So, the questions come down to: Will the tariffs last? (Tariffs versus head of lettuce?) Are we in a panic? Will we see a “V” bottom? Will there be a K recovery? Or, is this the beginning of a much larger correction that is just now unfolding? The following table shows the direction of the S&P 500 after the VIX hits 45. Short-term, is there hope?
 Again, back to the March Timing Update: “…we indicated that this starts a time window that runs through the early part of May 2025 and closely resembles a pattern in late 2018 where the Dow lost -19.44%. If we follow this pattern the month of March could be seriously rough sailing for the stock market.”
Dow Jones Late 2018 Window
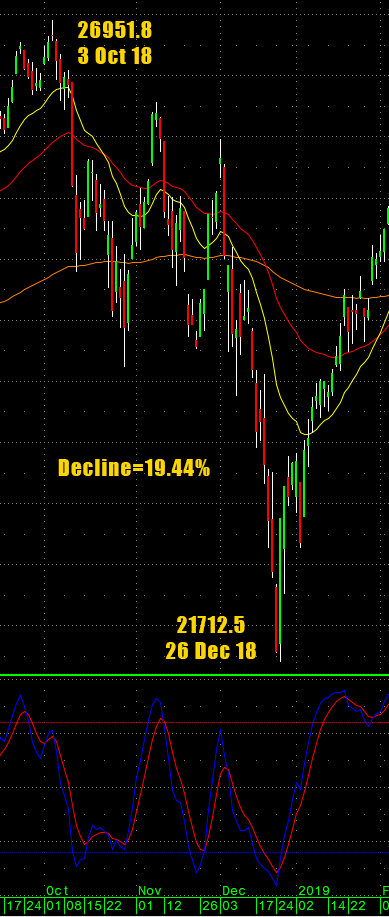 While this window runs through the first week of May, it is looking more and more, from a cycles standpoint, that this will run well into Q4 2025/Q1 2026. Thus, a much more protracted and drawn-out bear and not the “flash crash” that everyone has gotten used to over the past two decades. That doesn’t mean we won’t have significant rallies, but chasing rallies is likely to be a losing strategy until this thing is spent…which very likely will not be until Q1 2026 at this point.
There are many very critical economic realities that challenge this market long-term. One of these is housing prices. There is a potential housing crisis coming. Hedge funds own over 5% of the market. The Covid crisis saw massive investment in homes, at super low borrowing rates, that were then used as rental properties (AirBNB: $ABNB). Those rentals are now losing 40-50% of their occupancy rates and many have ARMs that need to be refinanced. For an in depth look at housing, see Charlie Bilello’s post here.
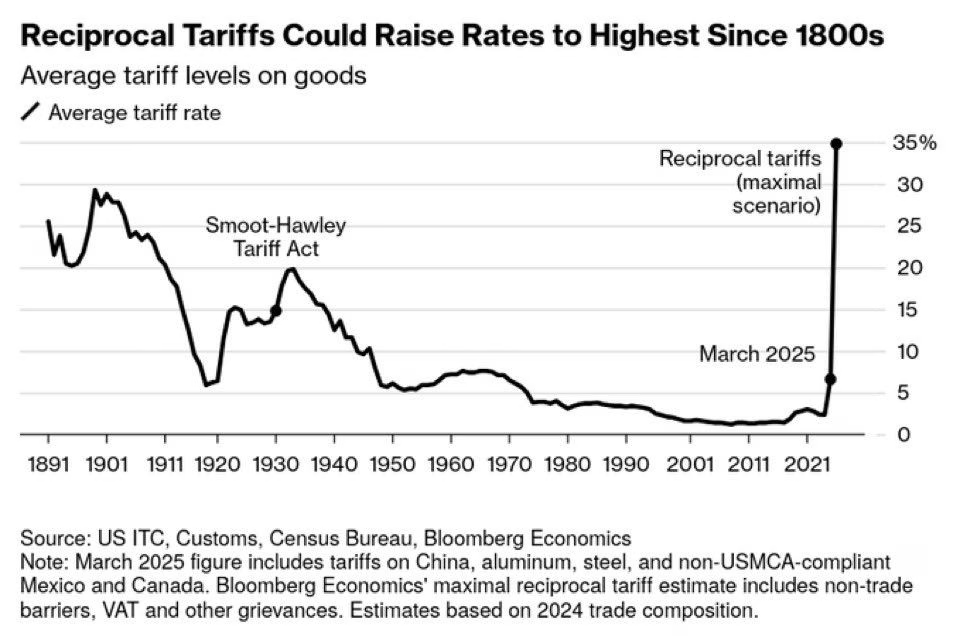
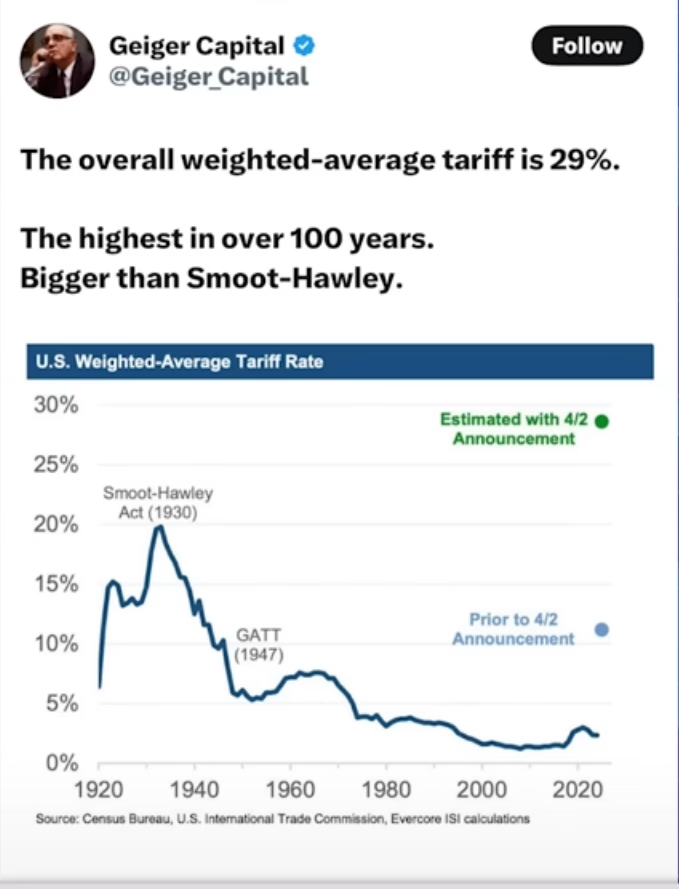 The biggest one of course is the tariffs. Again, they are NOT reciprocal. They are contrived and made up completely from thin air. The current tariffs put the overall rates to the highest levels since the late 1800s. Not only are the tariffs made up on flim-flam logic, the United States does not have the factory base to repatriate “jobs” in industries like shoes, clothing, TVs, computers, cell phones etc. etc. Corporations will not want to commit billions in investments in a 3-5 year plan to build factories if their costs are unknown due to tariffs. This entire “Advanced Manufacturing” pipedream is just not logical. Lastly, the average American reads at a fifth-grade level. Unlike China, the USA has made zero investment in education in science and math. Training workers for all the magical phantom jobs is nothing short of insane.
This is why Friday; China announced an immediate counter-tariff of 34% against the United States (conflict: see above). Now, will there be “negotiations,” or will we see a dick measuring contest? China has leverage. Here are some of the things they have and can do.
- Reducing U.S. Treasury holdings or halting purchases
- Weaponize rare earth exports
- De-dollarizing regional trade
- Accelerating ties with BRICS, ASEAN, and Global South
- Devalue the Yuan by 20-40%
- They have a much higher educated population in STEM
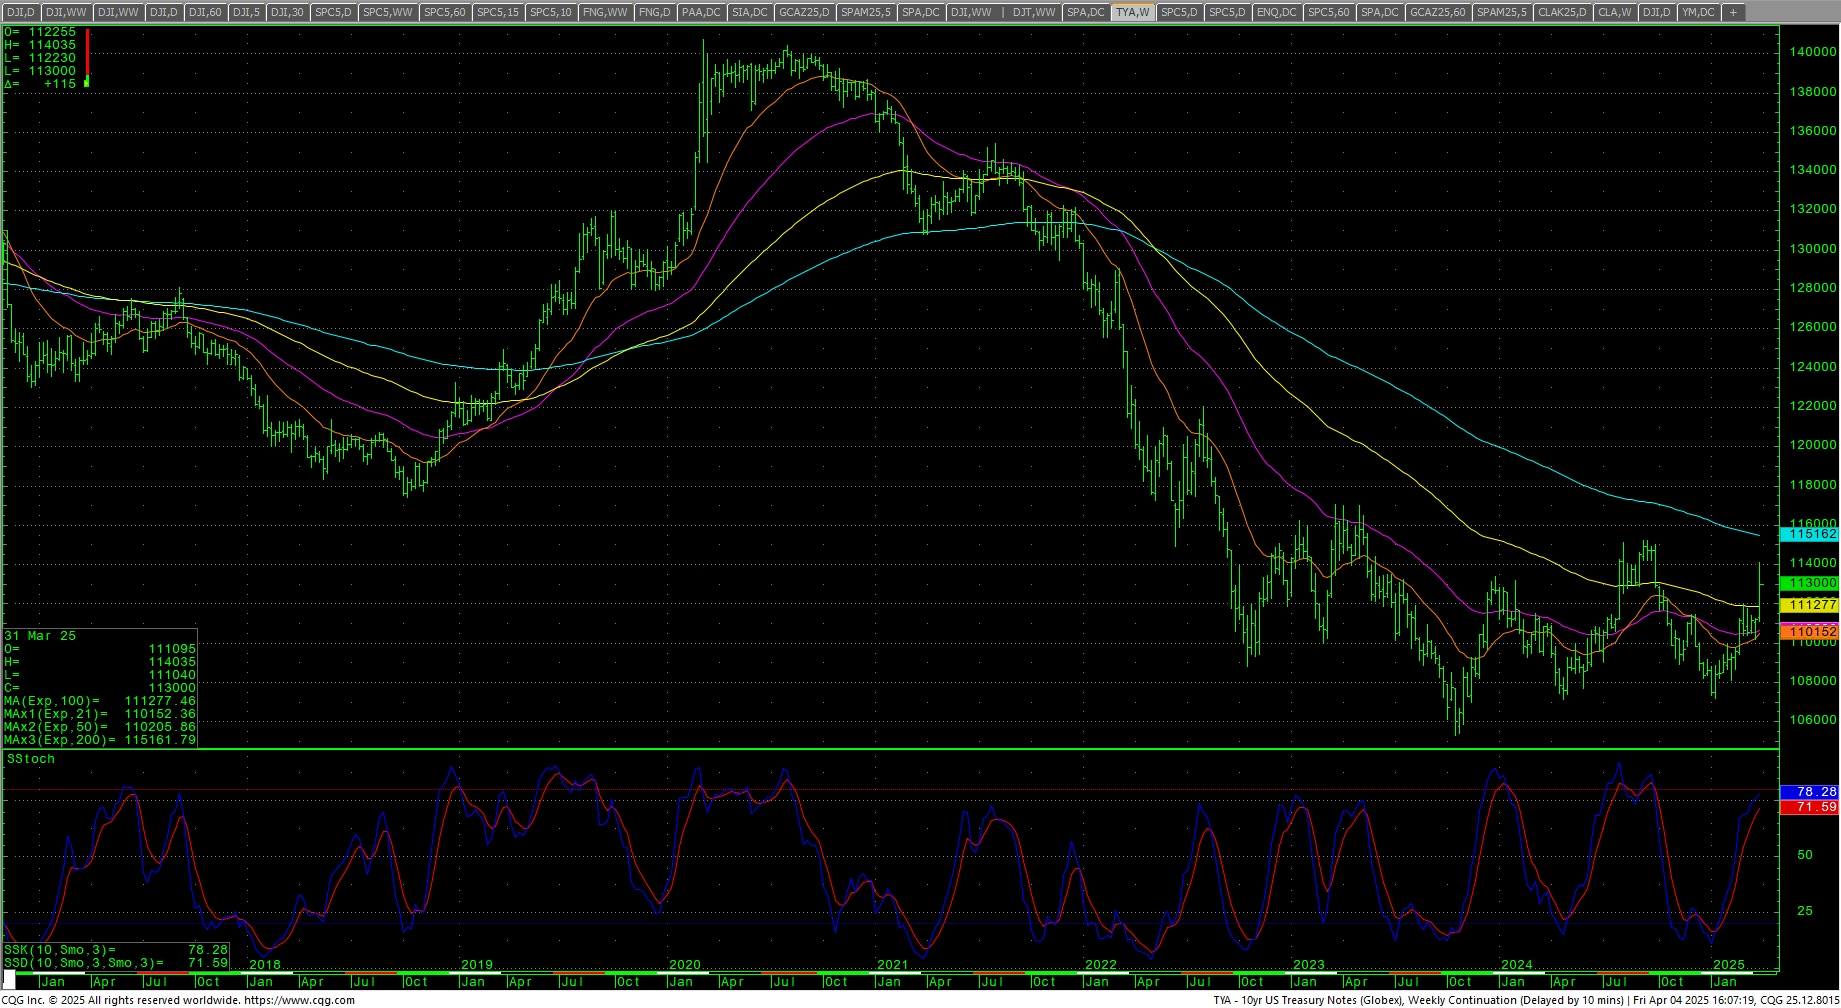
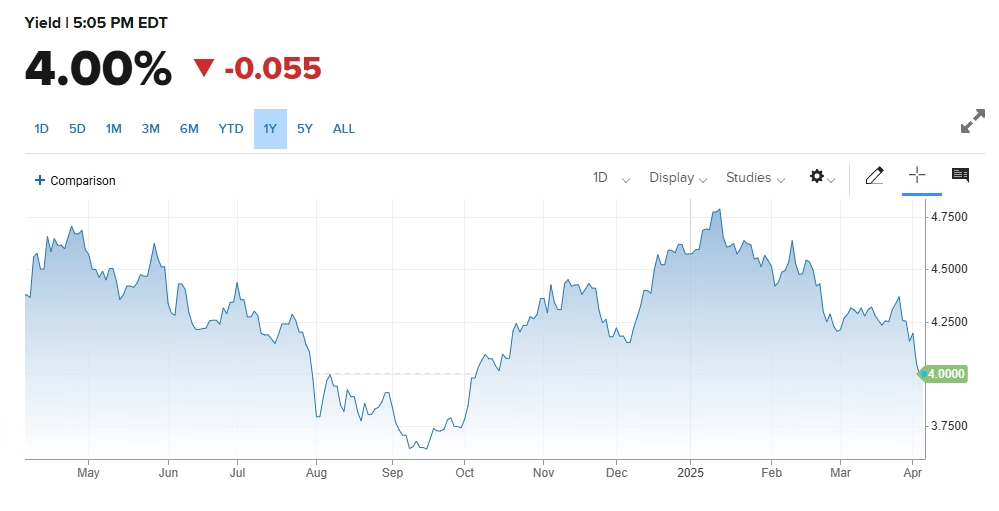
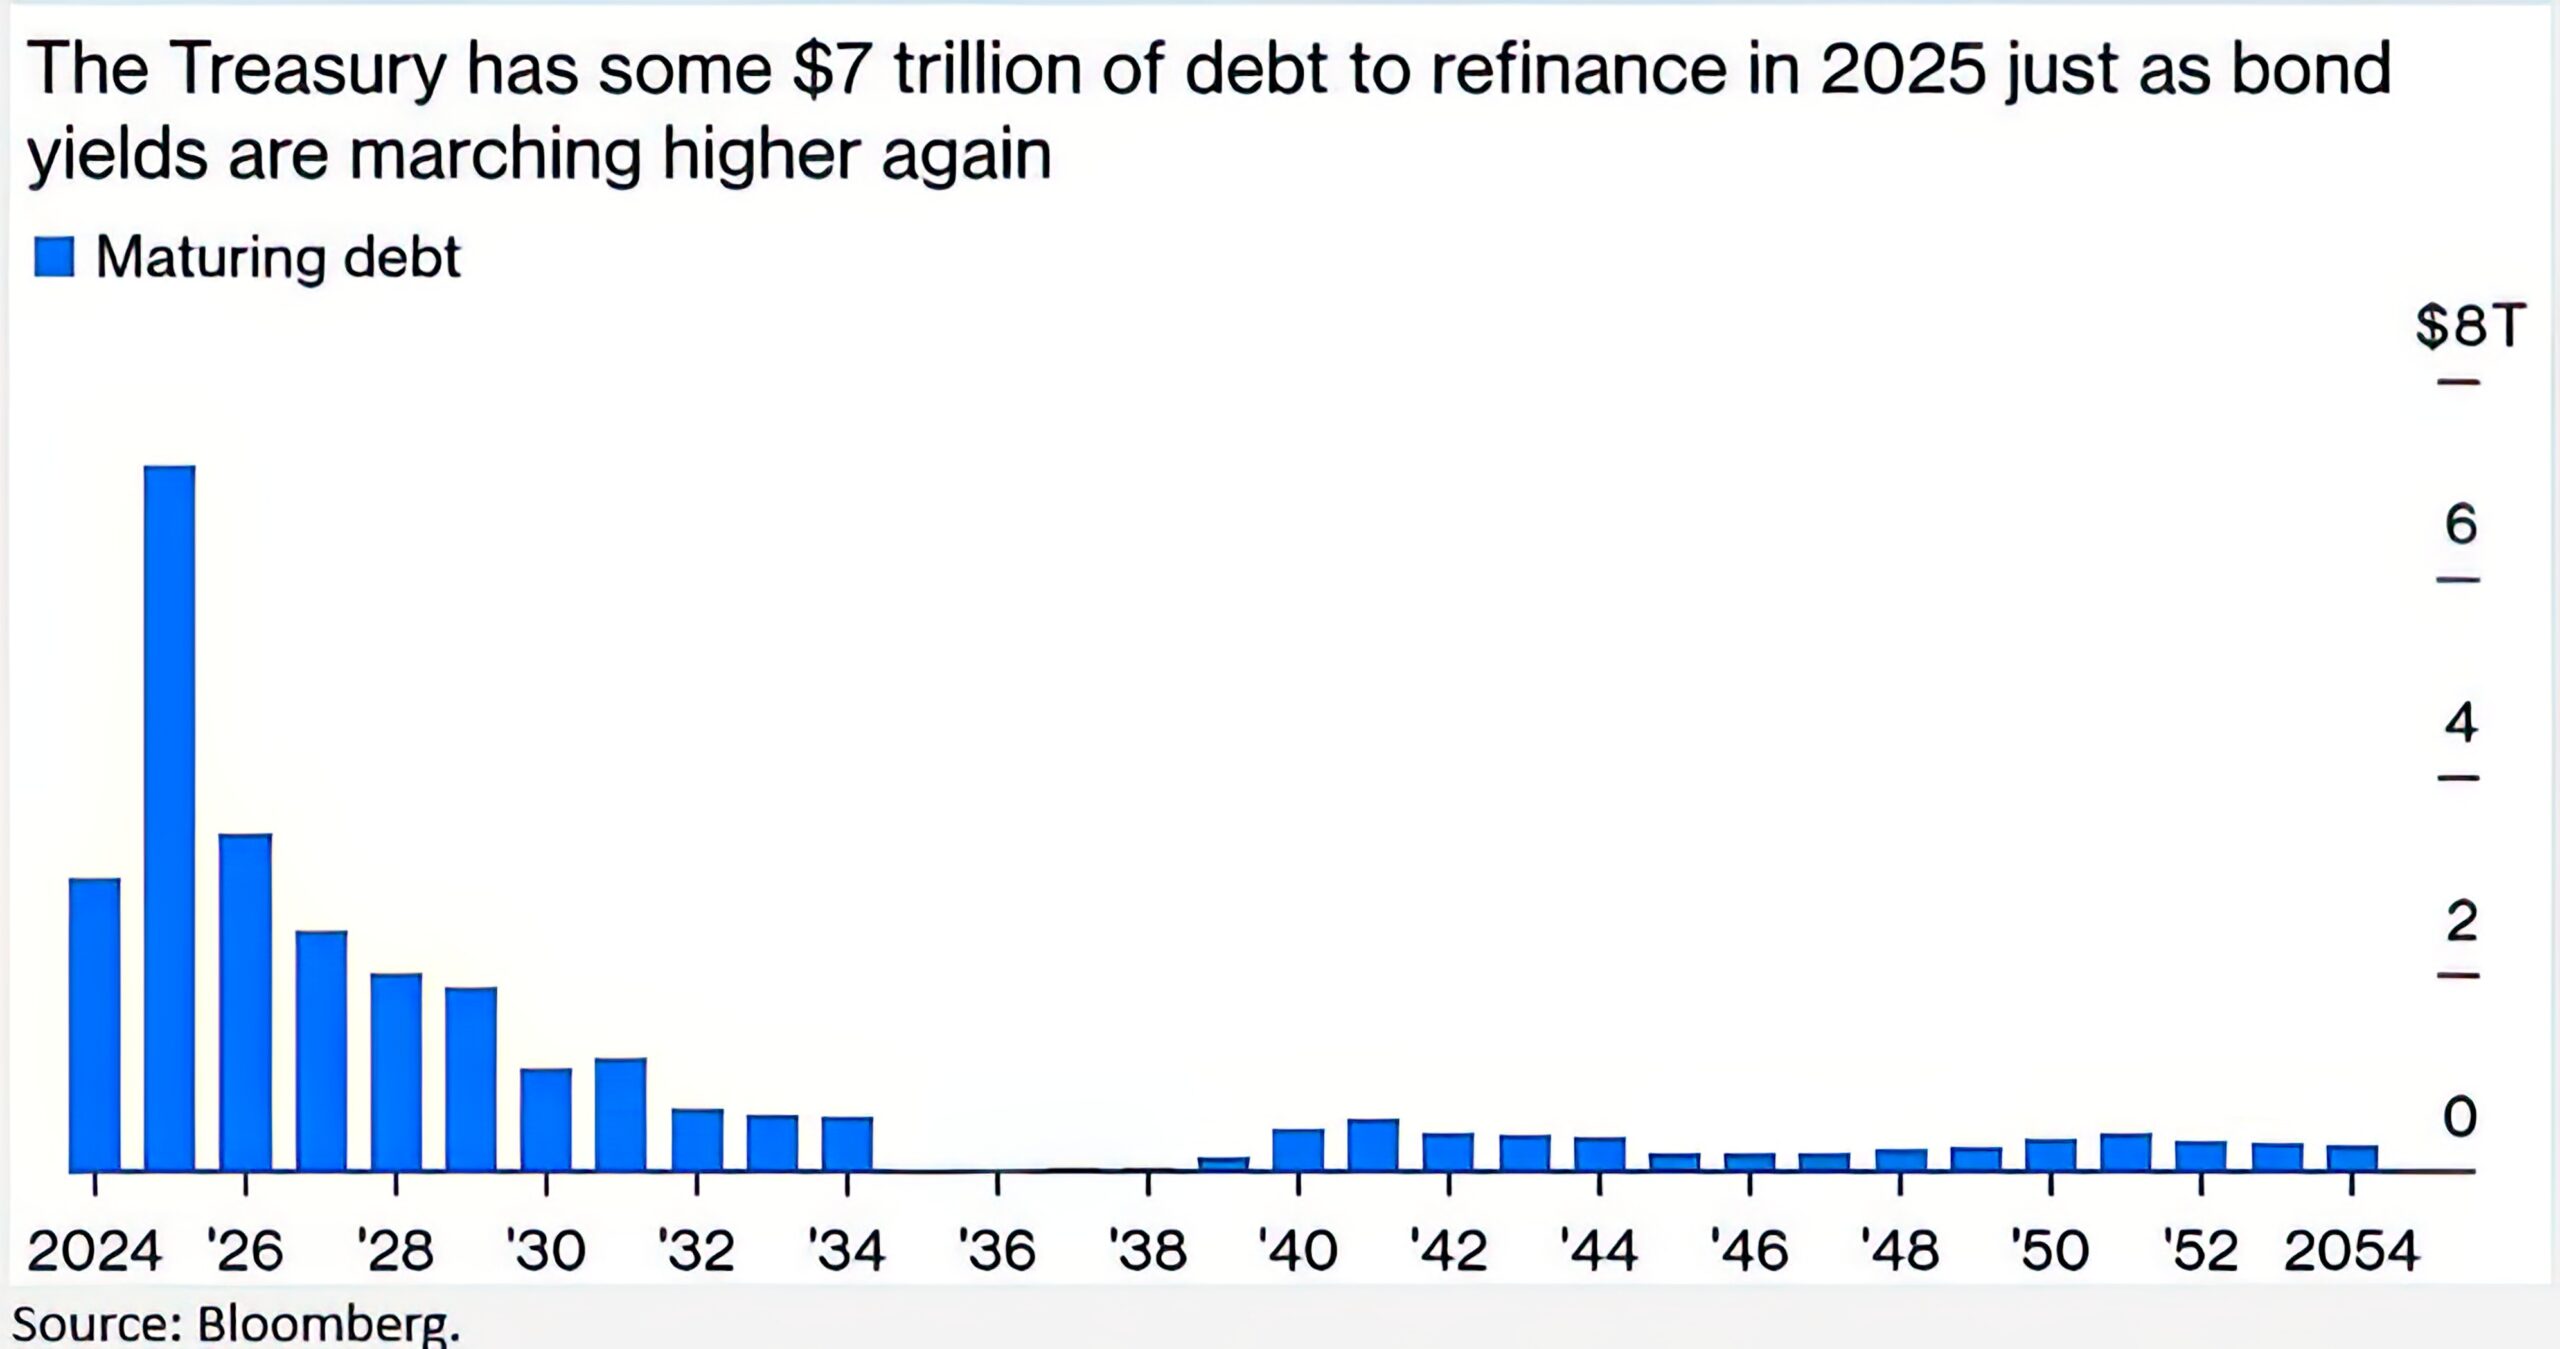 With $7 trillion in debt that needs refinancing in 2025, the need for rates to come down has been the key strategy. The crash in stocks has taken the 10-Year to 4%. The rest of the planet is already in a “race to bottom” on rates, so this makes sense. The Atlanta Fed is now predicting a decline in Q1 GDP to -2.8%.
“The GDPNow model estimate for real GDP growth (seasonally adjusted annual rate) in the first quarter of 2025 is -2.8 percent on April 3, up from -3.7 percent on April 1. The alternative model forecast, which adjusts for imports and exports of gold as described here, is -0.8 percent. After today’s and yesterday’s releases from US Census Bureau, the US Bureau of Economic Analysis, and the Institute for Supply Management, both the standard model’s and the alternative model’s forecasts of first-quarter real final sales to private domestic purchasers growth increased from 0.4 percent to 1.4 percent.”—Atlanta Fed
Whatever we see for Q1, remember that it most likely reflects front-running in front of the tariffs.
Dow Theory
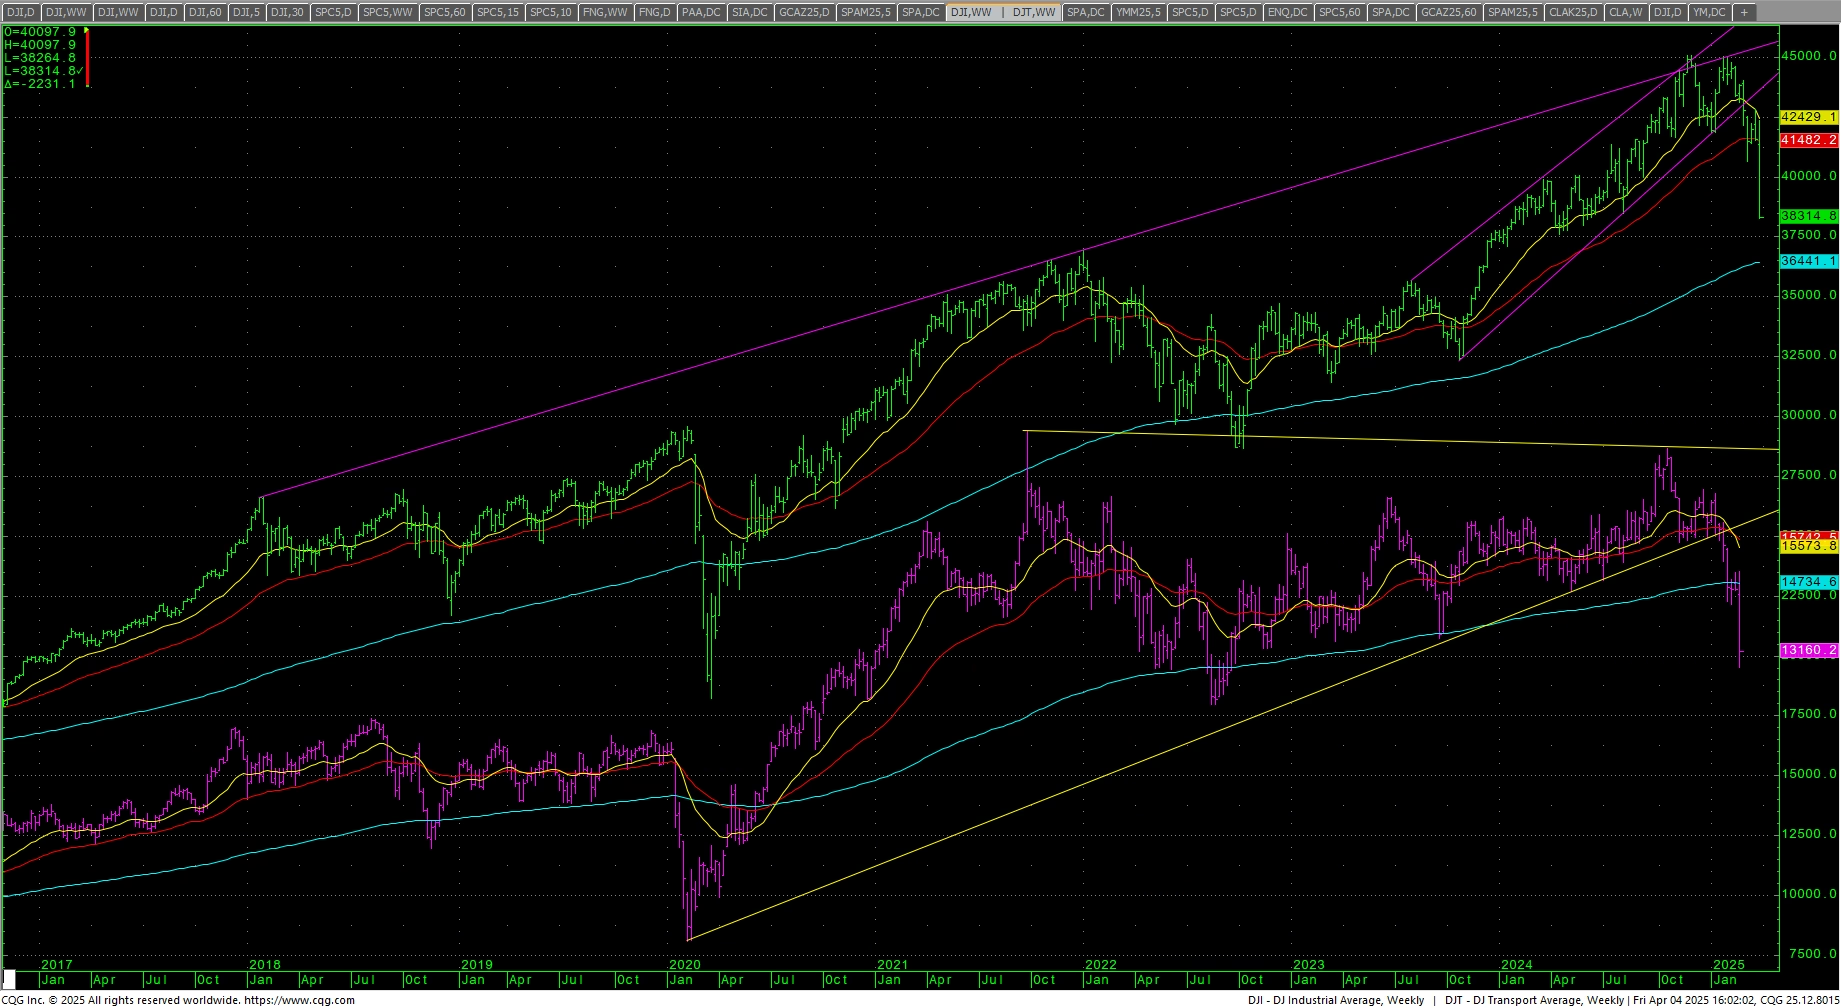 Dow Theory still has a bearish pattern.
MAGS (Magnificent 7) Daily H-L-C
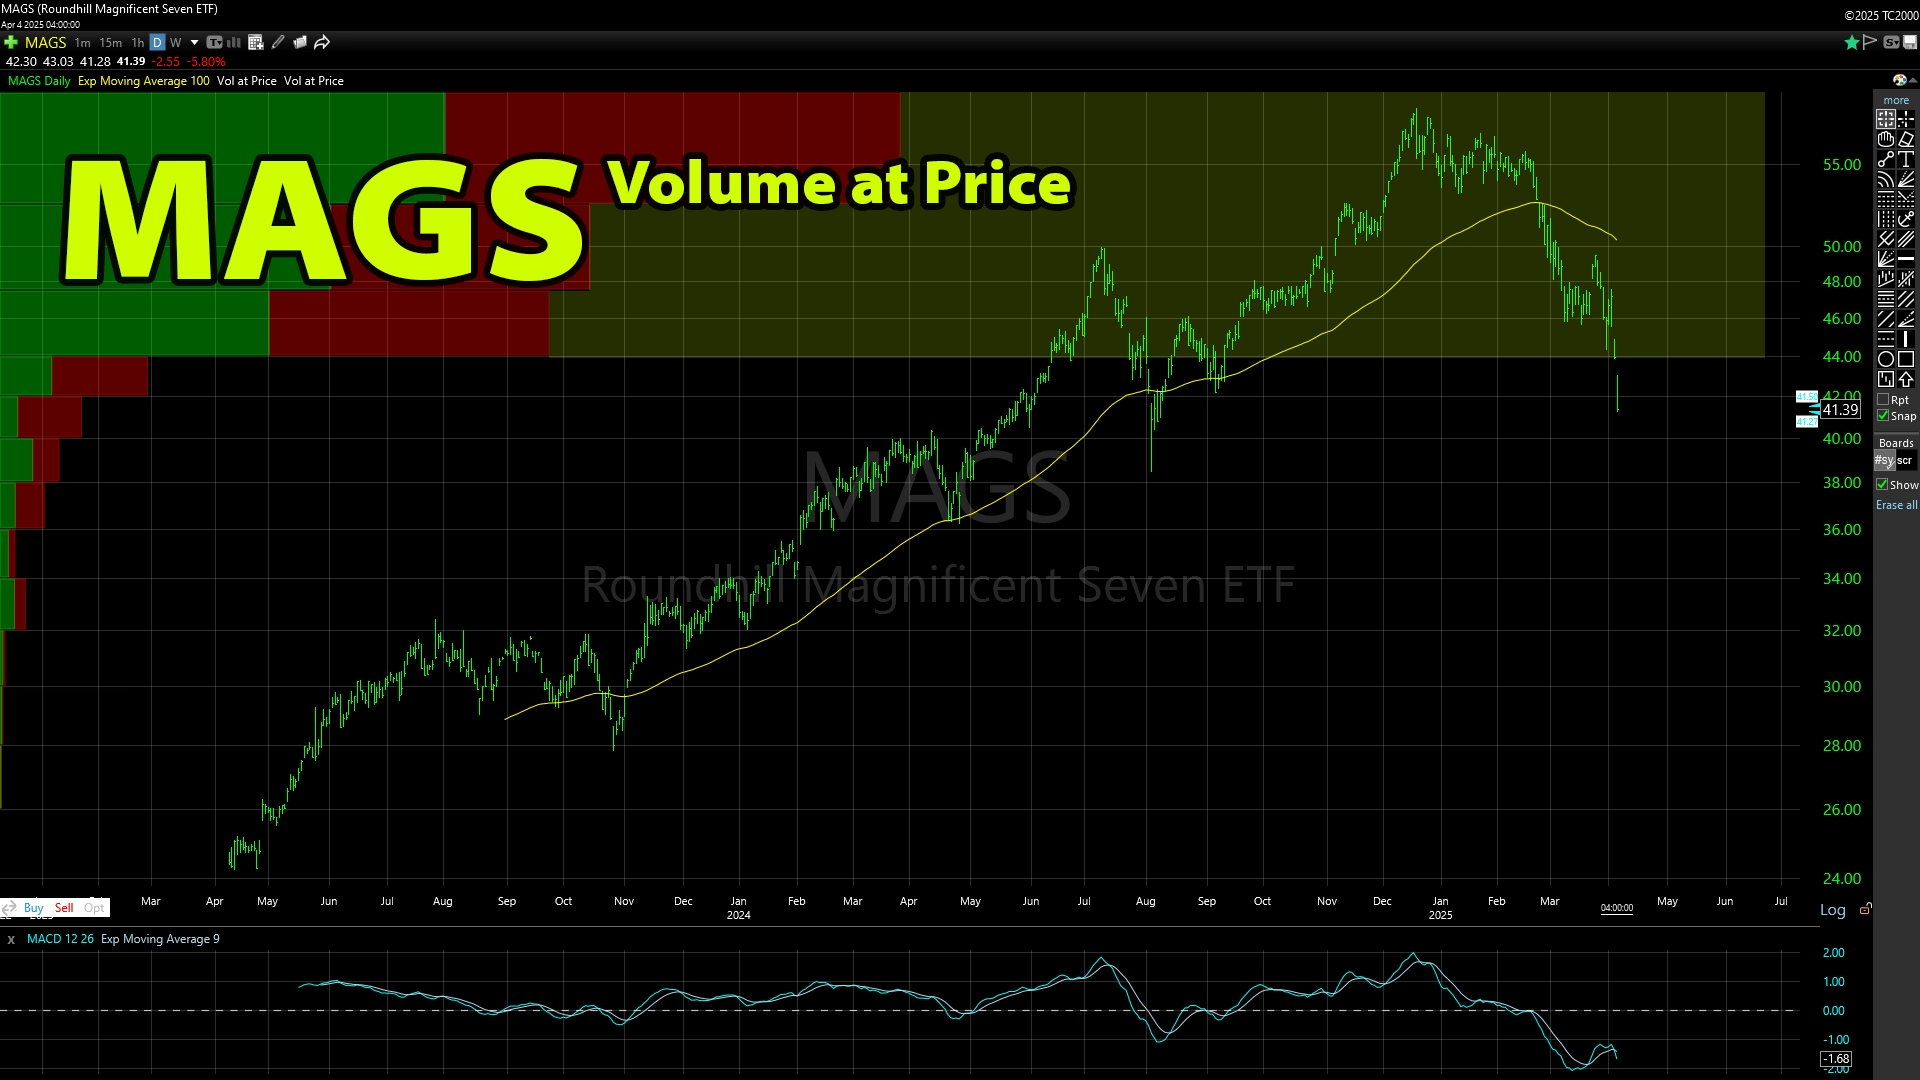 The MAGS (Magnificent 7) plunged directly into the first target area outlined in the past number of weekly letters in the 42-40 level. As the chart shows, this is one of the most top-heavy charts in history where Volume at Price is basically ALL at THE TOP. Retail has been the biggest buyers, the CashApps, the Robinhoods, etc. etc. Have we hit a major vein yet for retail? It is hard to say. Basically, the floor is the limit. If this is year 2000 all over again, the MAGS could go all the way back to where it started. Selling rallies should be the short-term strategy until proven otherwise.
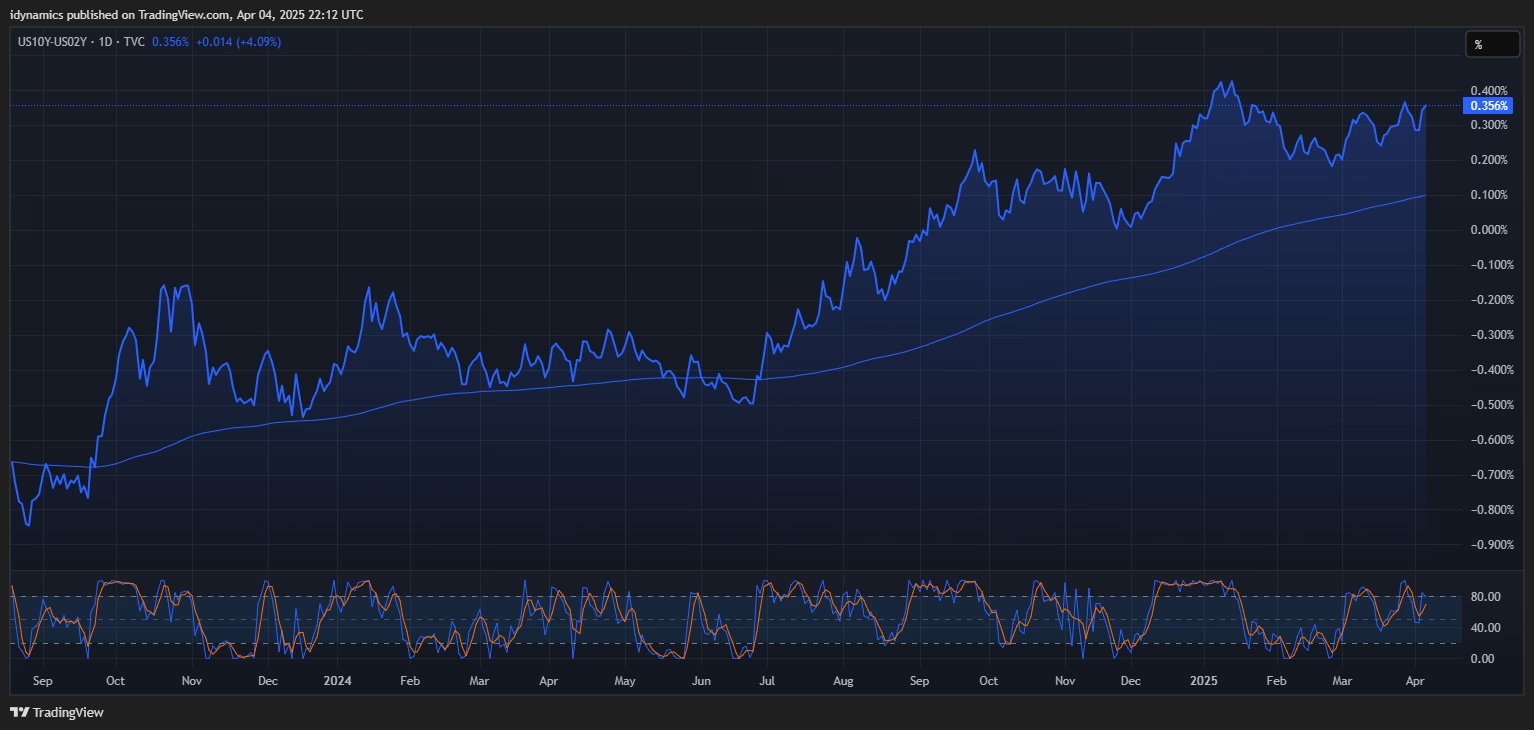
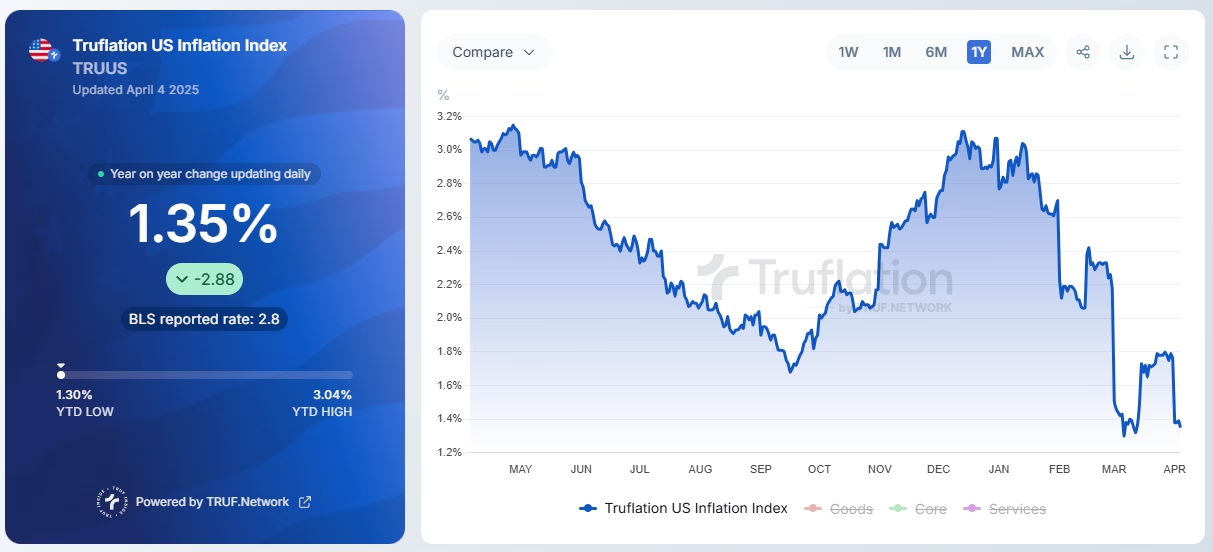
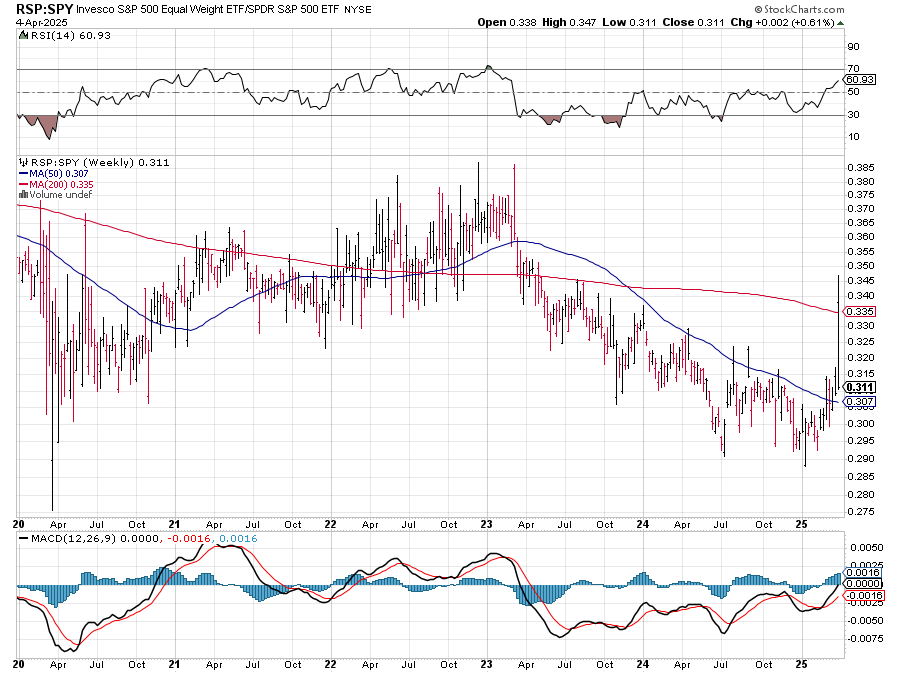
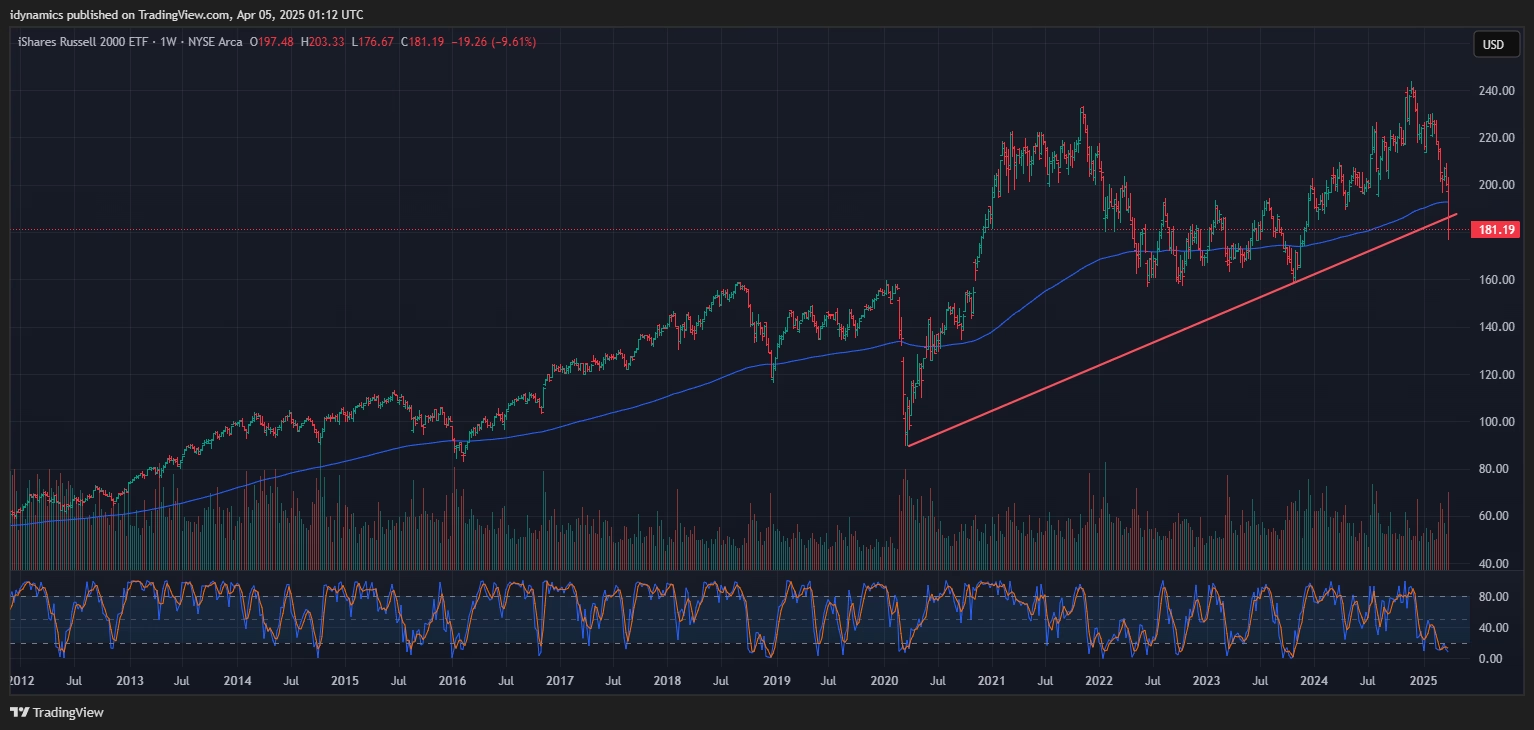
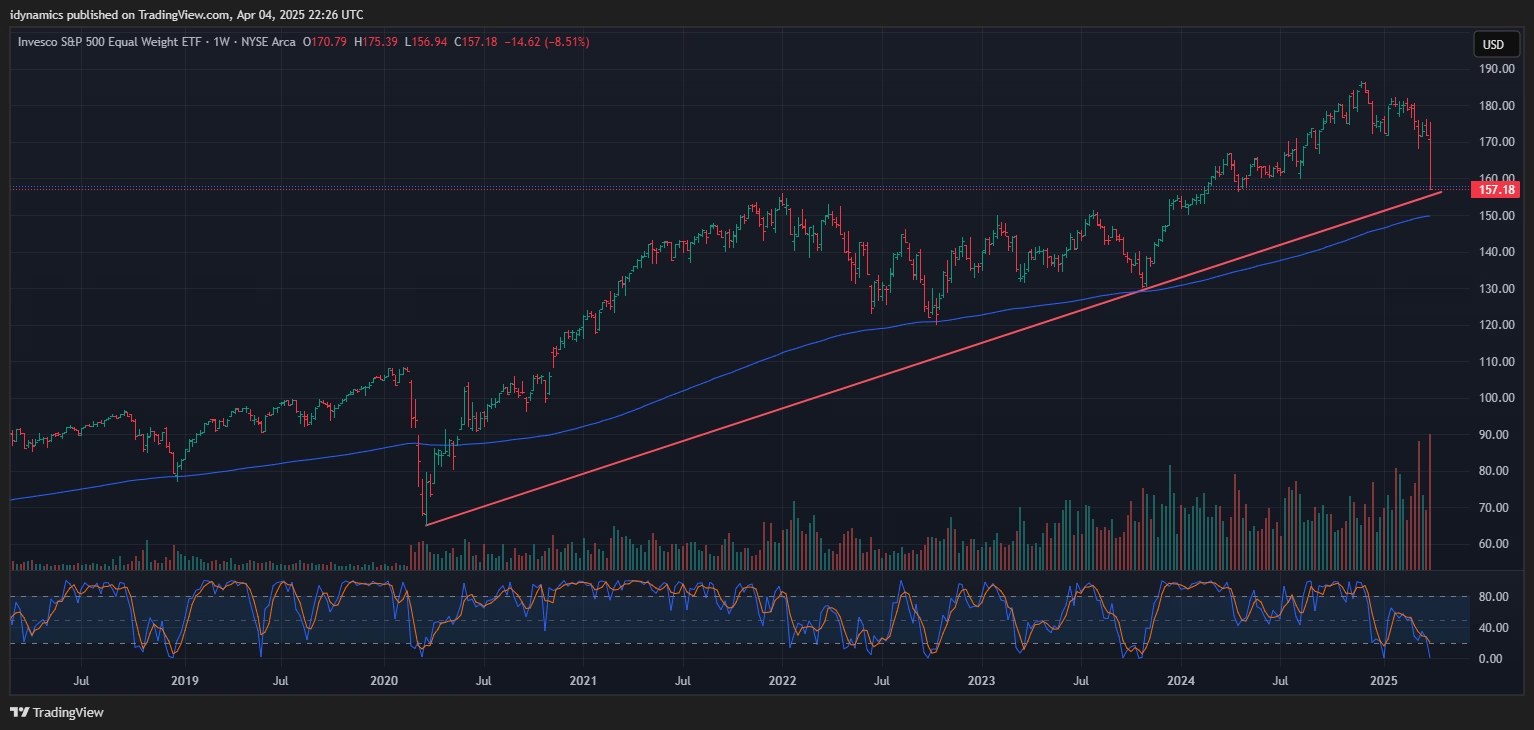
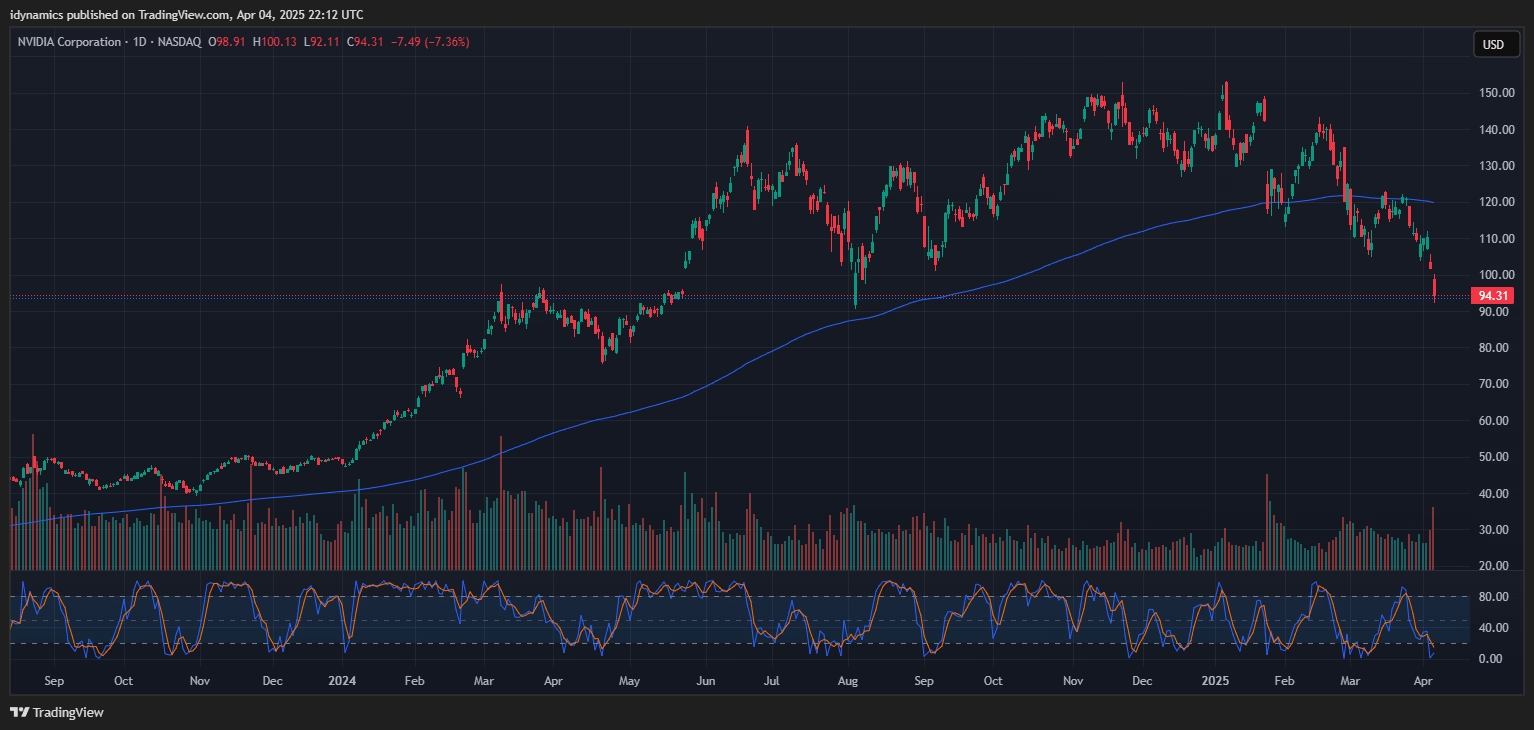
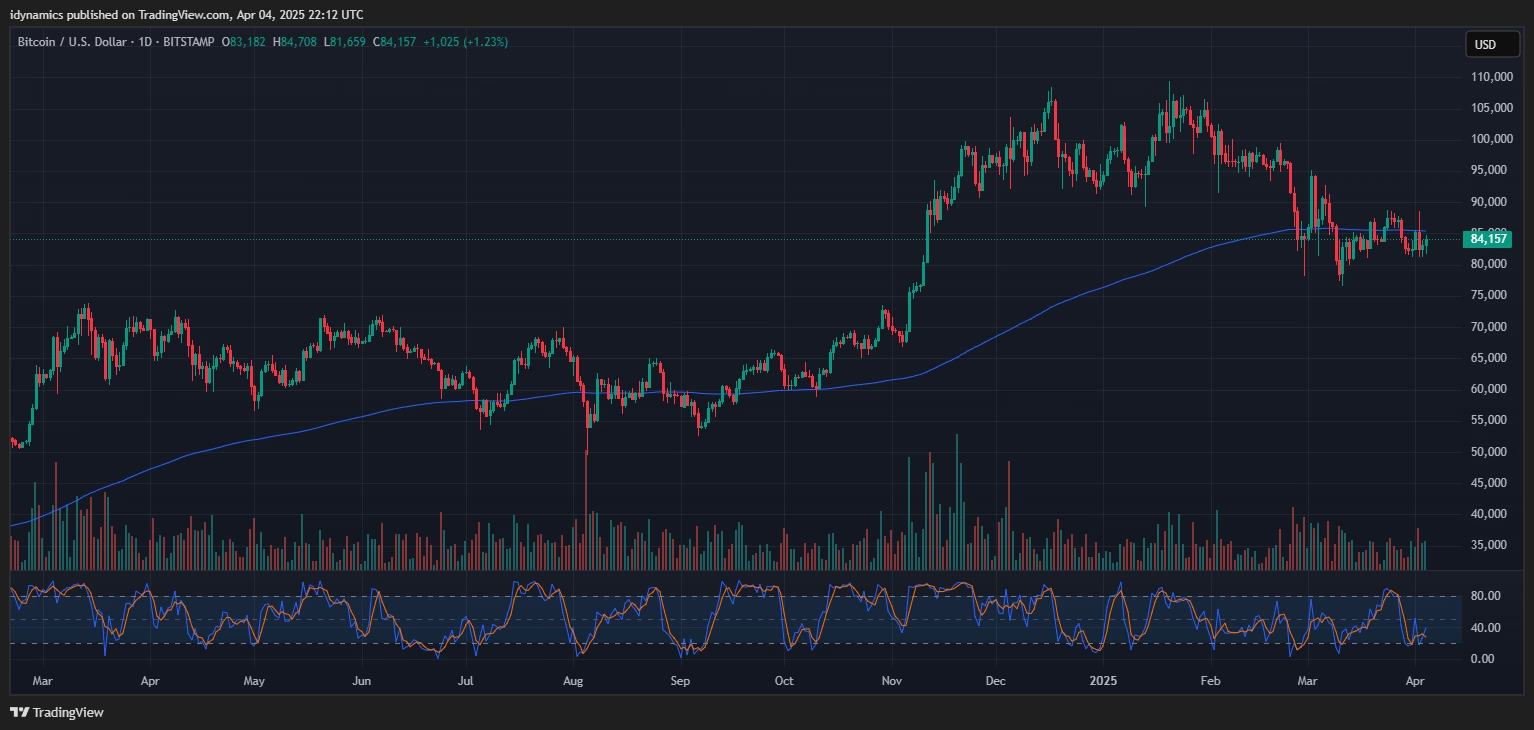
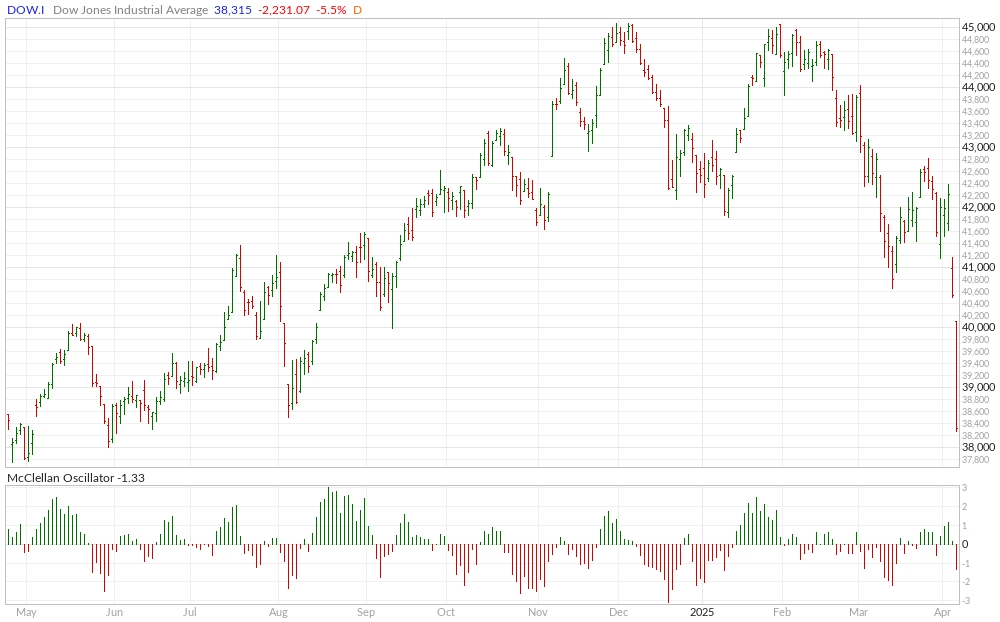
The RSP:SPY rocketed higher during the week but dropped to the bottom of the weekly range. The chart looks like it wants to make a turn with the oscillators indicating a possible bottom. The IWM took out a critical trendline and closed on the week’s lows, ending -9.61% on the week. The RSP closed out the week down -8.51% as it nears a critical trendline from the 2020 bottoms. NVDA crashed, ending down -14.01% on the bottom of the range as it nears some big support in the 92/91 area (also a target). Bitcoin closed flat, ignoring most of the risk-off of the week. McClellan Oscillators confirm the down move in the Dow. The Yield Curve inched back toward the recent highs. The 10YR yield plunged to end at the lowest level since late summer 2024 at 4.00%. Truflation decreased to 1.35%.
10YR-2YR Yield Curve Daily

 VIX Weekly H-L-C
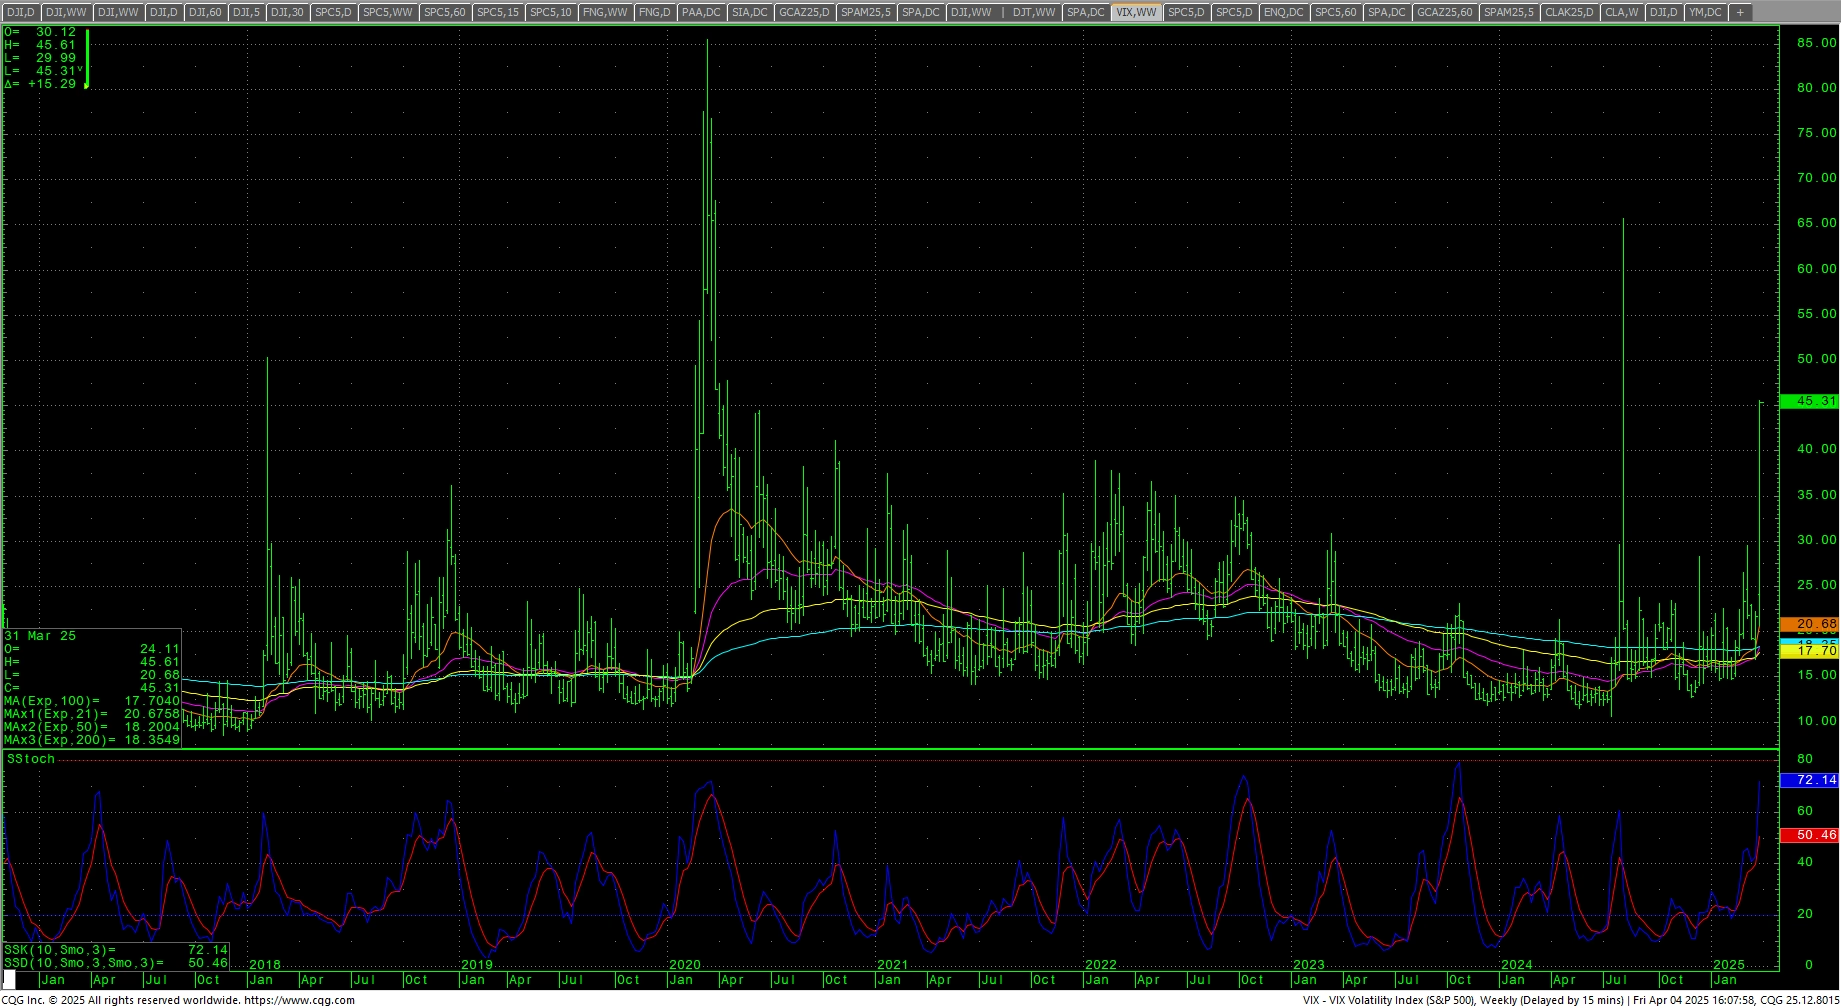
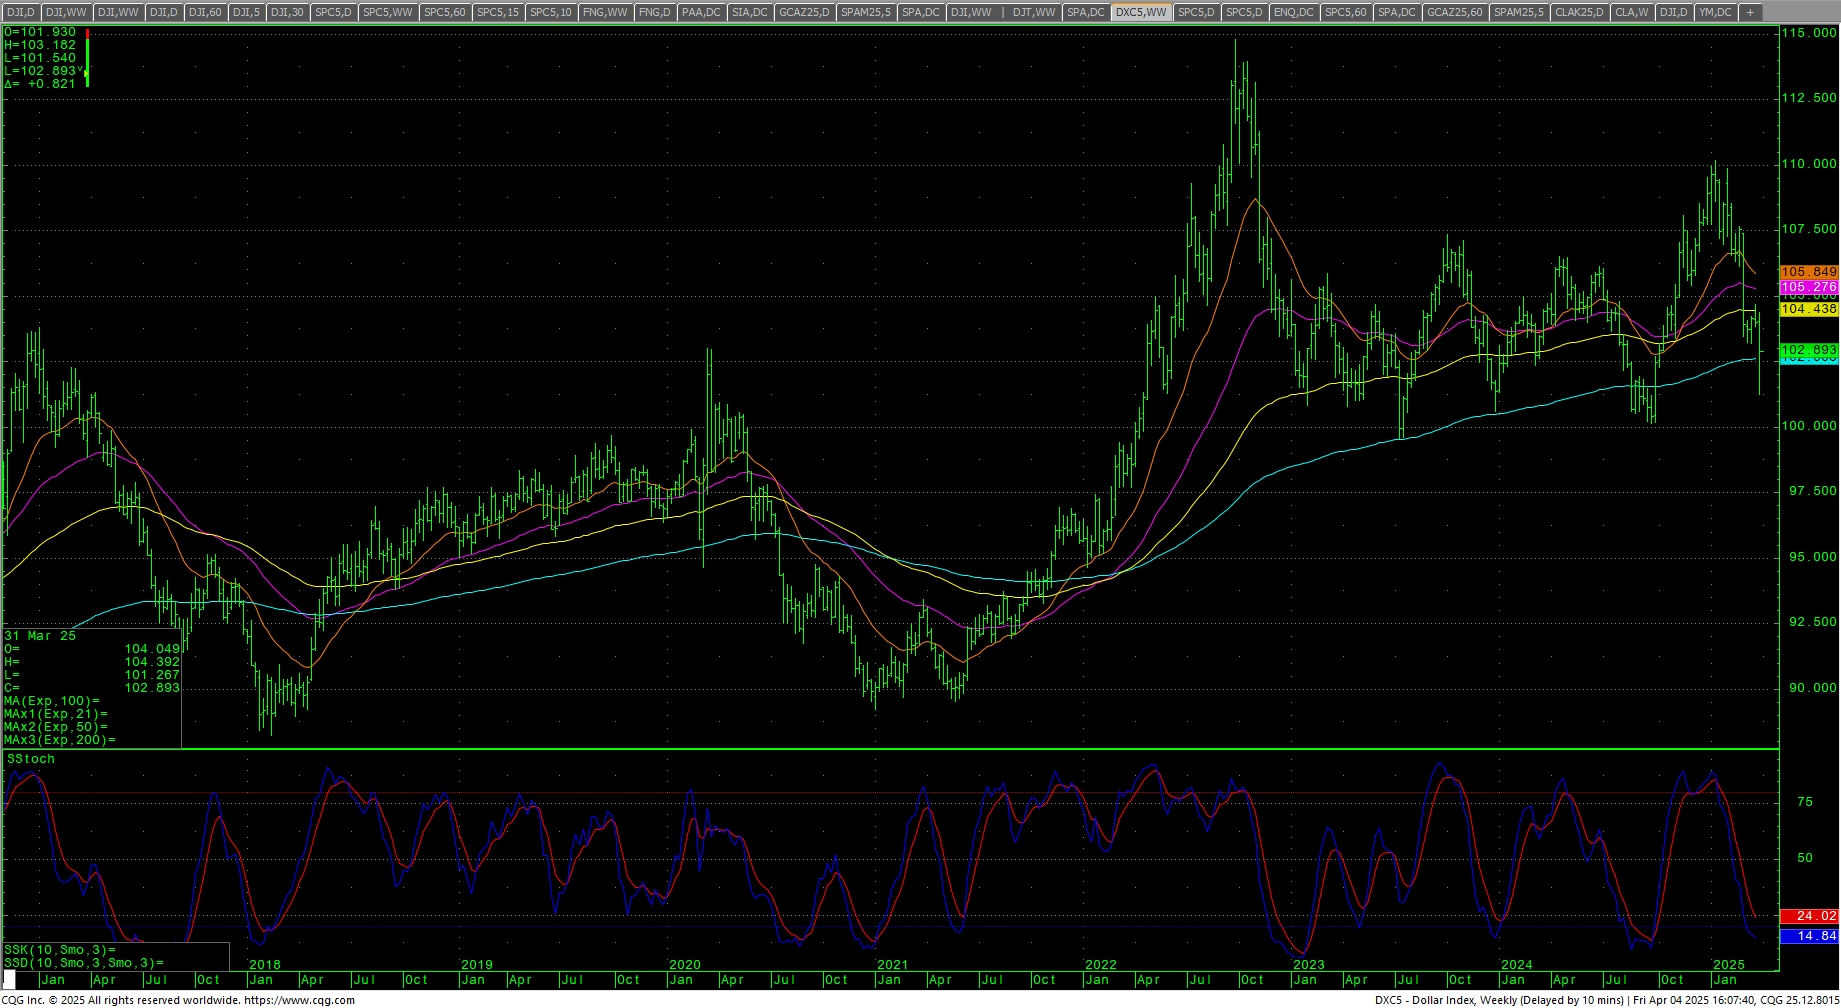
The VIX exploded on Friday to the highest levels since the Yen-carry panic of last August and closed at the highest weekly close since March of 2020. The US Dollar plunged to the lowest level since September 2024 before recovering Fridy to close in the middle of the week’s range.
 Nasdaq 100 Weekly H-L-C
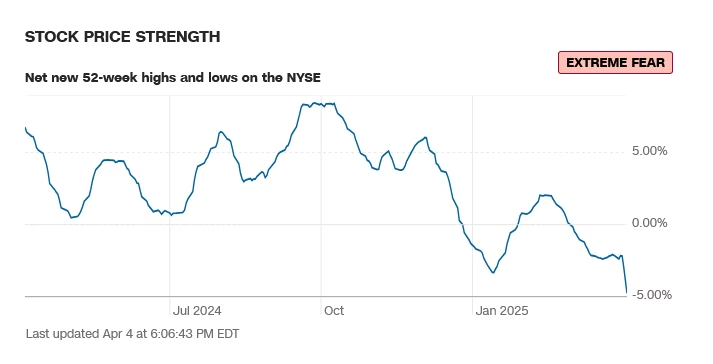
52-Week A/D Line 
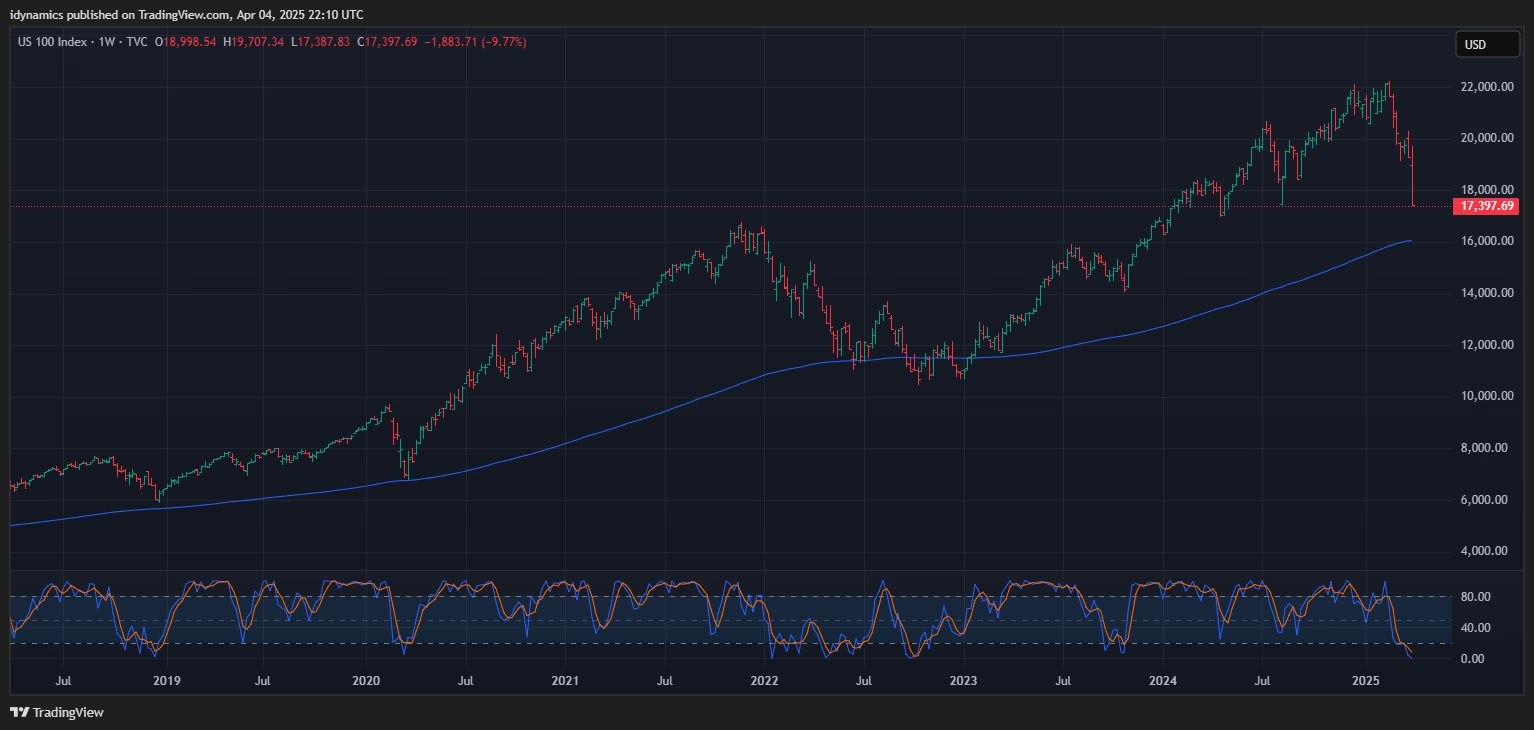
Breadth weakened and sentiment remains in extreme fear.
CNN Fear & Greed Index
 AAII Investor Sentiment Survey
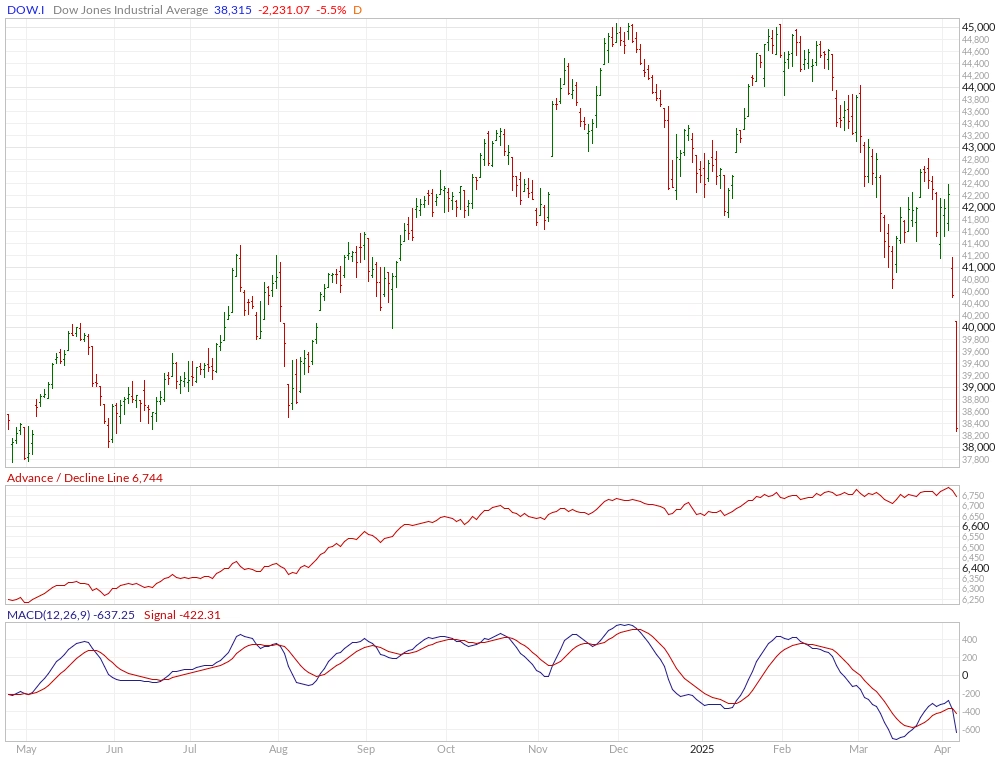
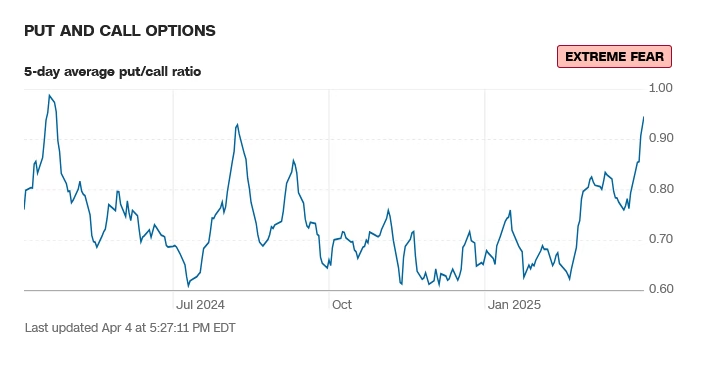
 Sentiment remains in fear and extreme fear. The CNN Fear and Greed Index read 4 on Friday, down from 7 and reads extreme fear. Breadth was weak and reads extreme fear. Latest AAII Sentiment Survey: Pessimism Surges. The Dow A/D ended at 6744, the MACD turned down again. The VIX exploded to the highest levels since March 2020, up +109.28% on the week. The Put/Call jumped to 0.95 and reads extreme fear. The 52-week, A/D plunged to -4.77% and reads extreme fear. The Dow closed the week down -7.86%, closing on the bottom of the range, shedding 3269.04 points to the lowest close since 15 April 2024. The S&P was down -9.08% on the bottom of the range, losing 506.86 points to the lowest weekly close since 15 April 2024. The Nasdaq Composite closed down -10.02% at the lowest weekly close since 15 April 2024. The Nasdaq 100 was down -9.77%. The FANG led the way lower, settling down -10.31% at the lowest weekly close since 6 May 2024. The Russell was down -9.70% to the lowest weekly close since 12 February 2024. The 10-year notes soared higher and closed at the top of the week’s range. The yield on the 10YR plunged to 4.000%.
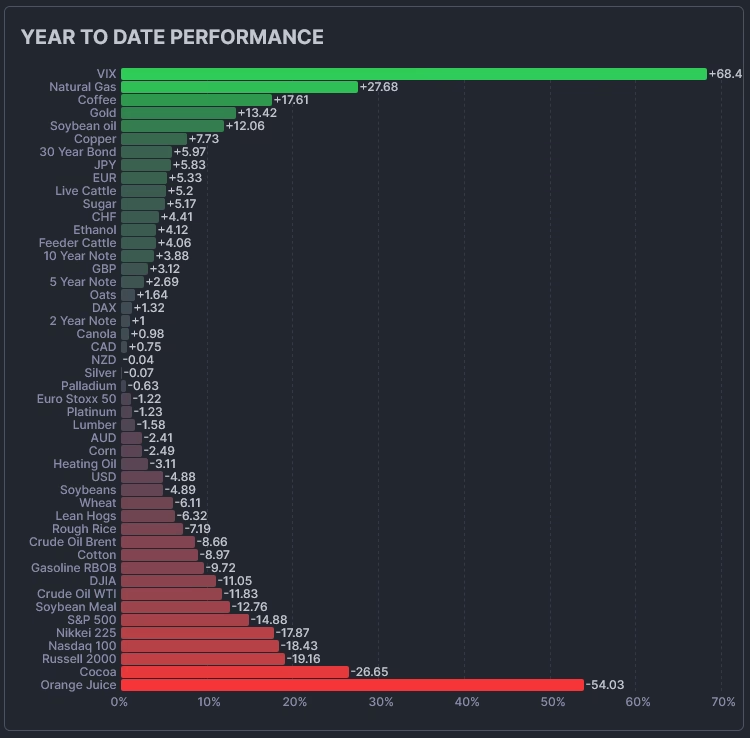
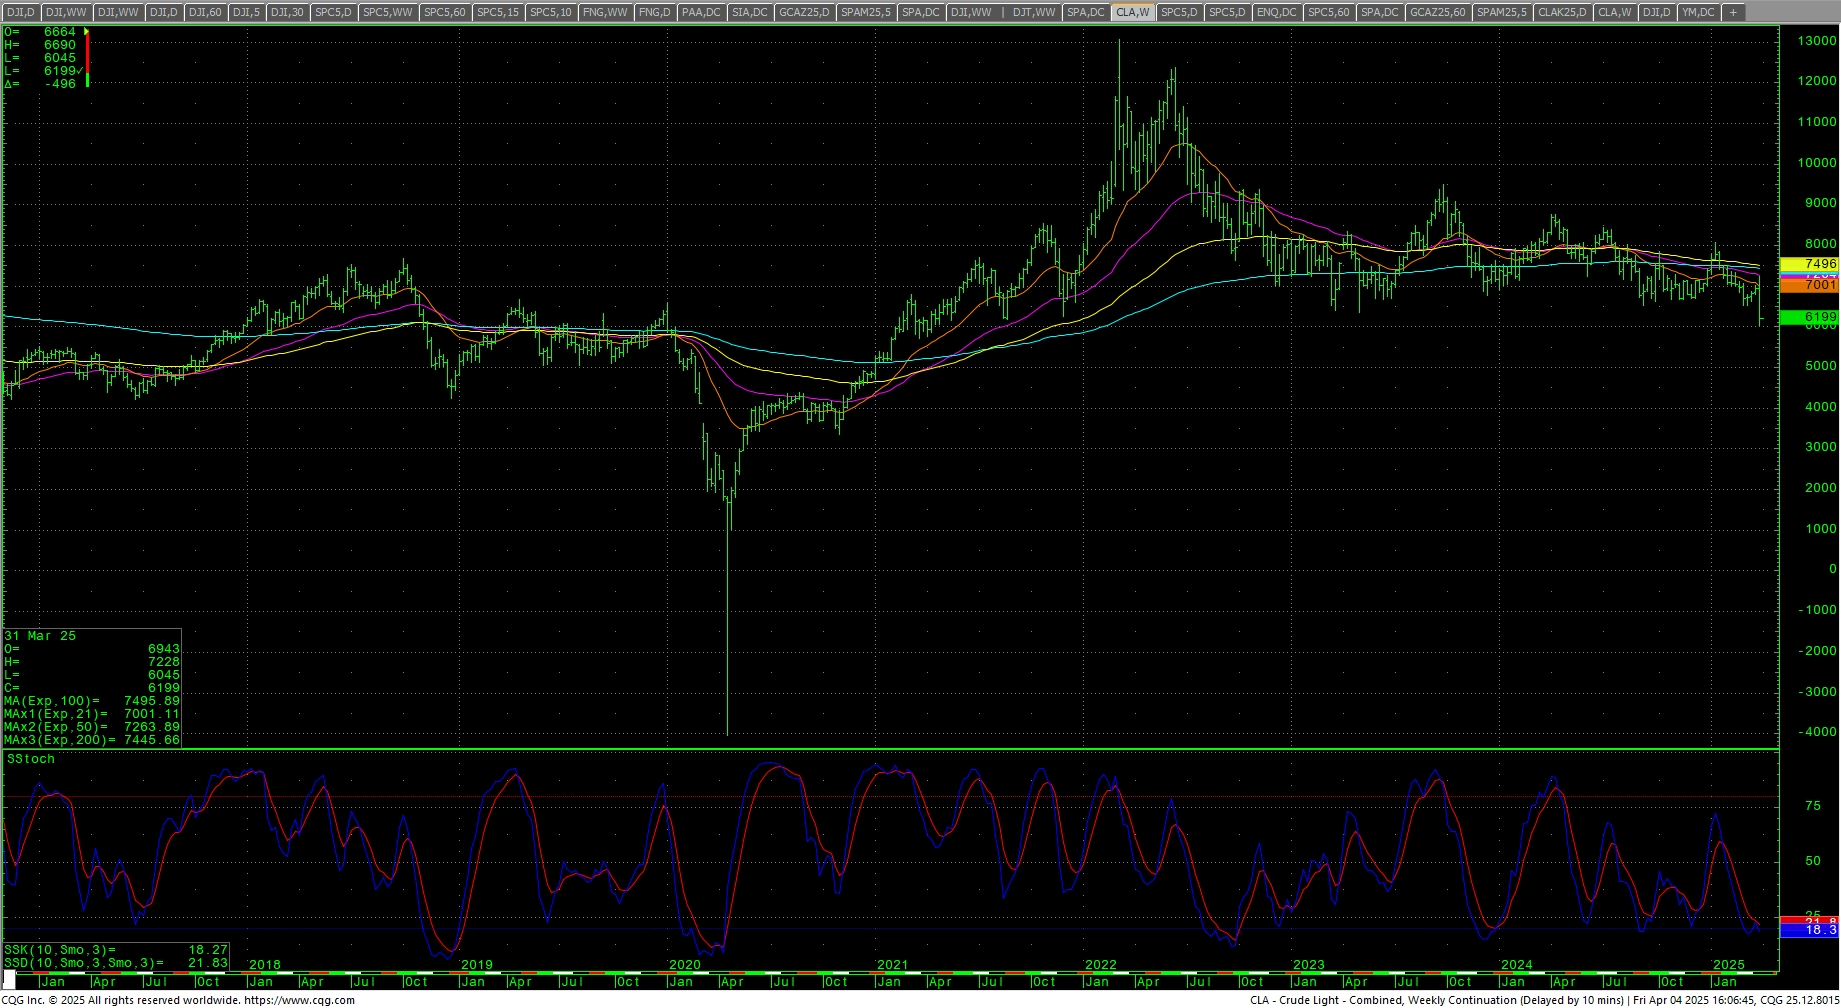
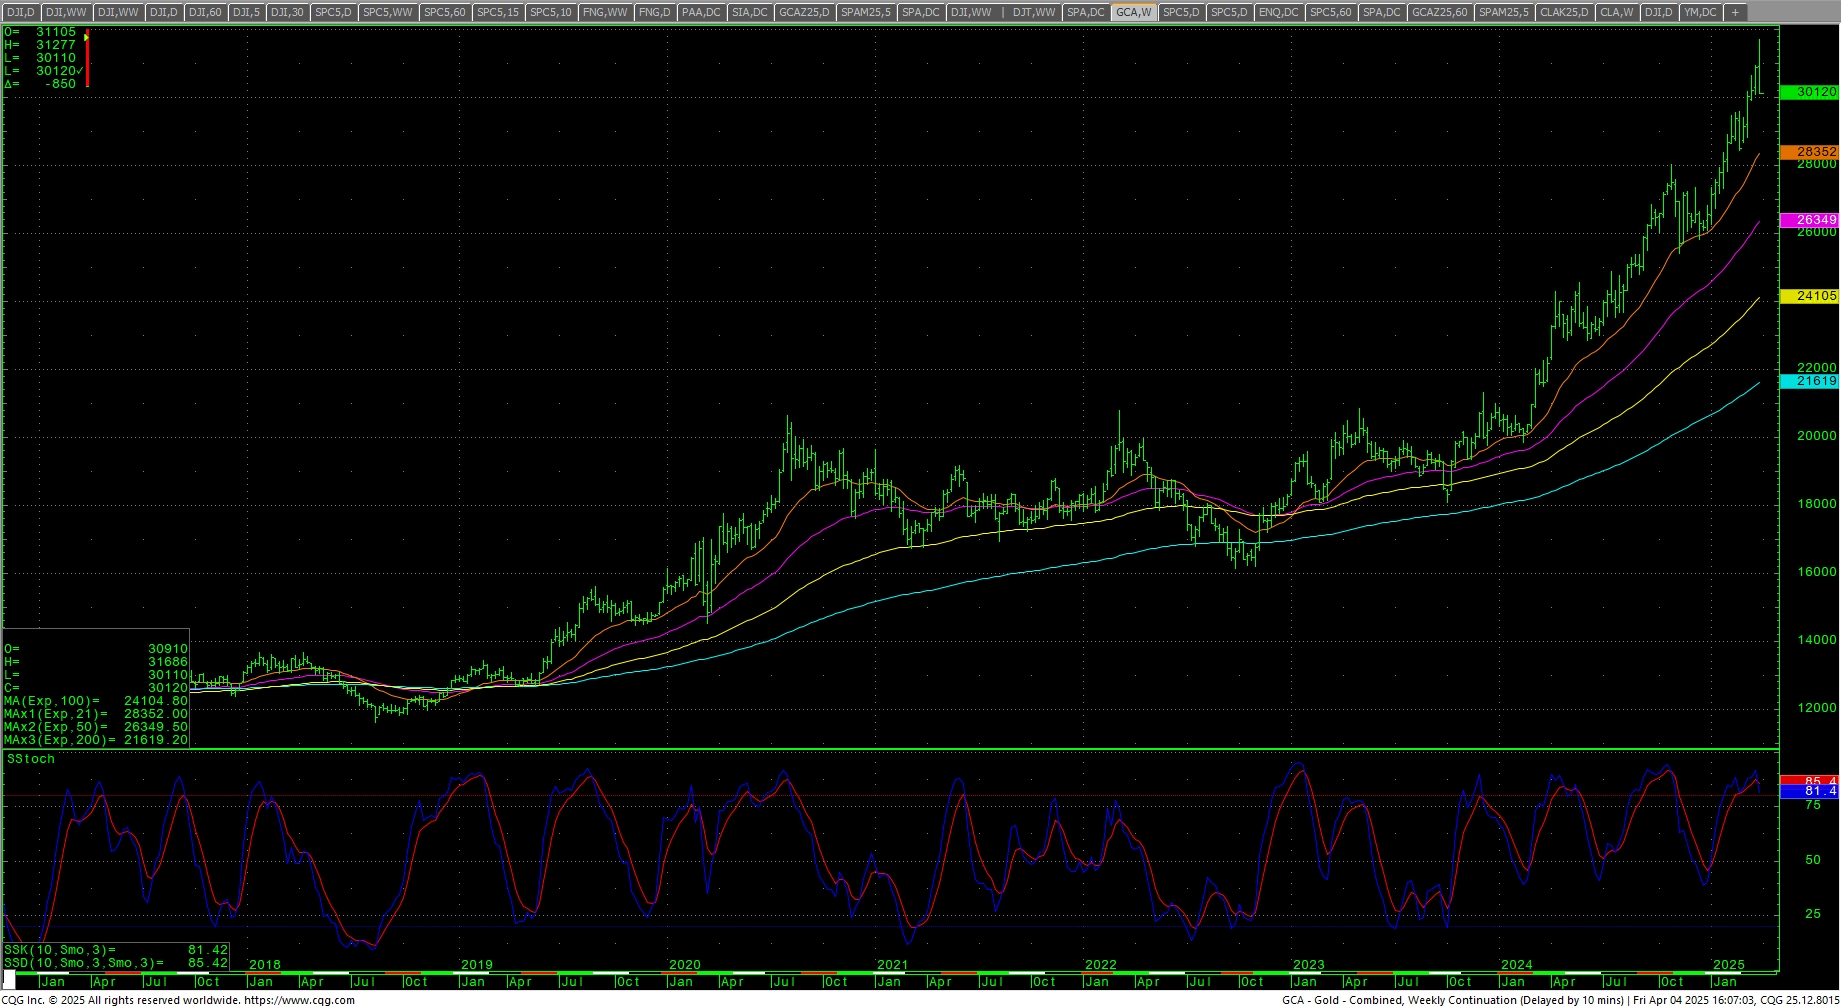
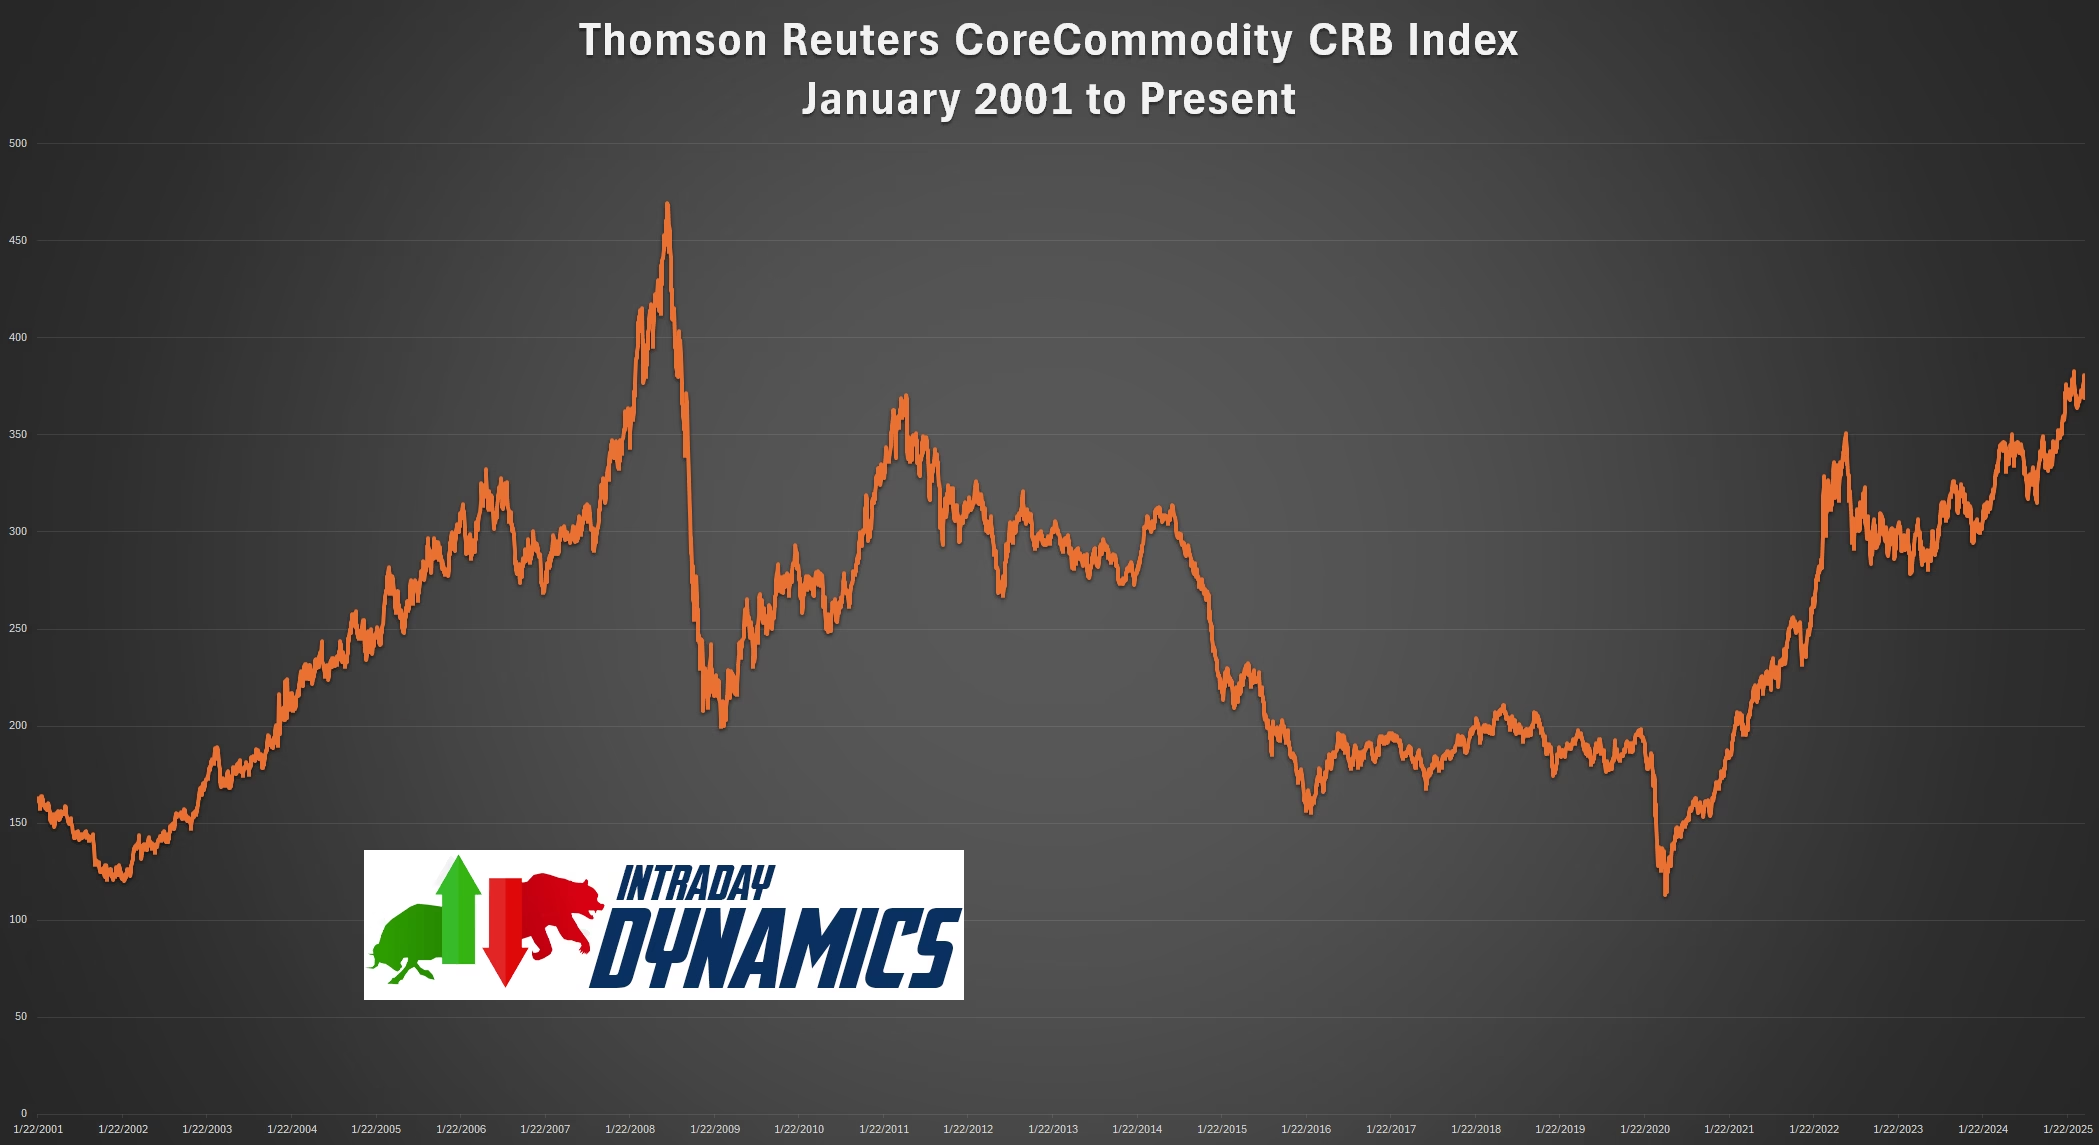 The CRB Index closed down -1.06%. Crude oil plunged sharply toward the $60 level and closed at the lowest weekly close since 5 April 2021. Gold reversed lower as Friday it succumbed to the risk-off mentality, closing on the bottom of a reversal range some $150 off the record highs. The CoT for the S&P 500 saw a huge shift for commercials making a big jump while non-commercials liquidated. The CFTC S&P 500 Non-Commercial Net Positions ended at -19.0K and looks like there was some short covering. Sellers still have a 6-day window.
Timing Points
This month continues CRITICAL timing. Monday the 7th is minor timing. The next critical timing point is April 21st. Thursday we get CPI (est: 0.1%) and core CPI (est: 3.0%). Friday is PPI (est: 0.2%). Will do a timing update over the weekend as the last half of the month is also critical.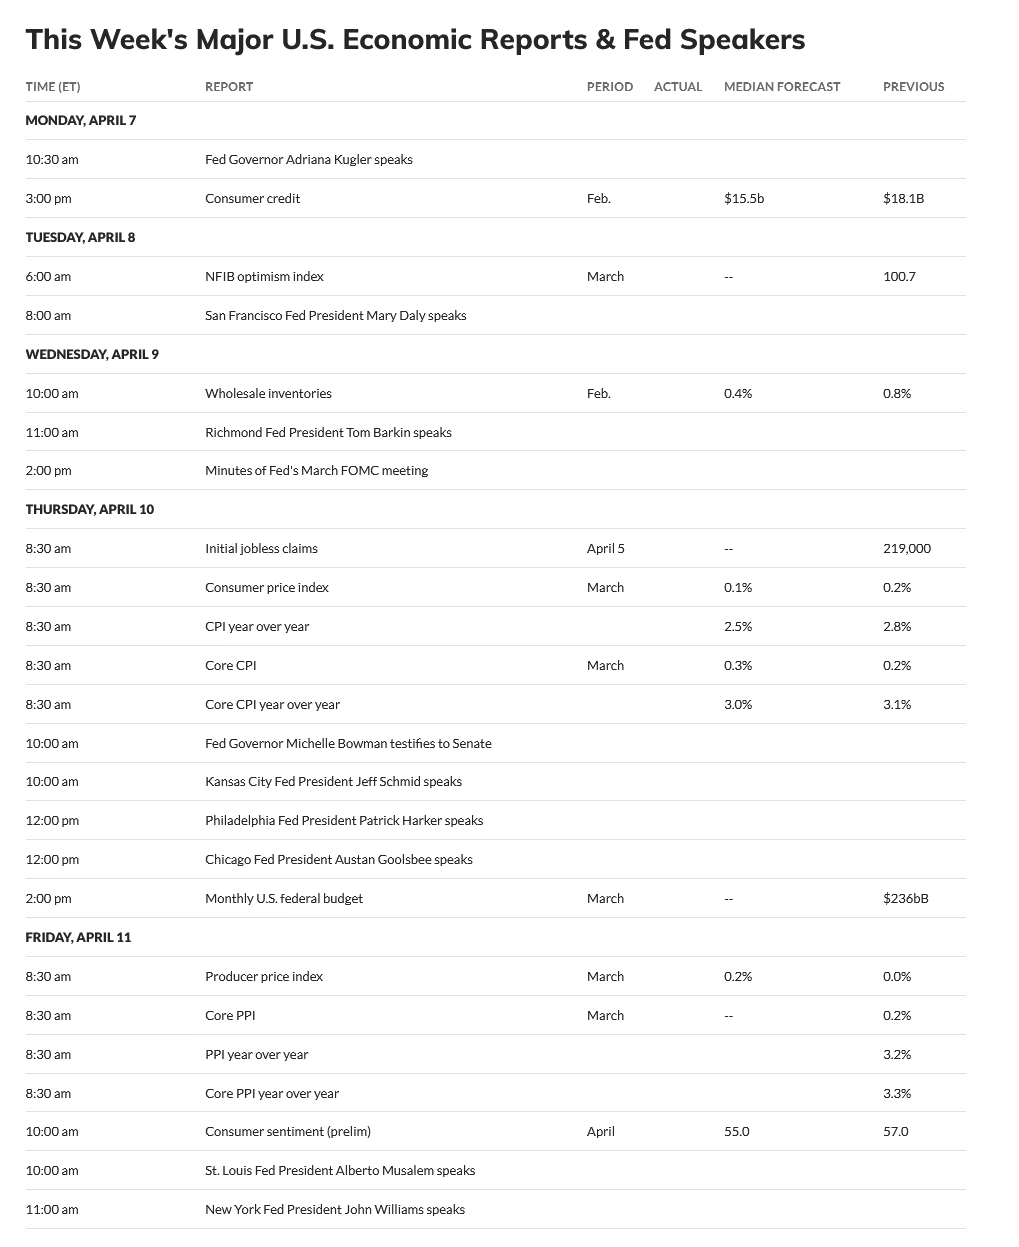
- 04/07 **
- 04/12 **
- 04/21 *** Critical with potential for wide ranges/volatility
Dow Jones Industrial Average
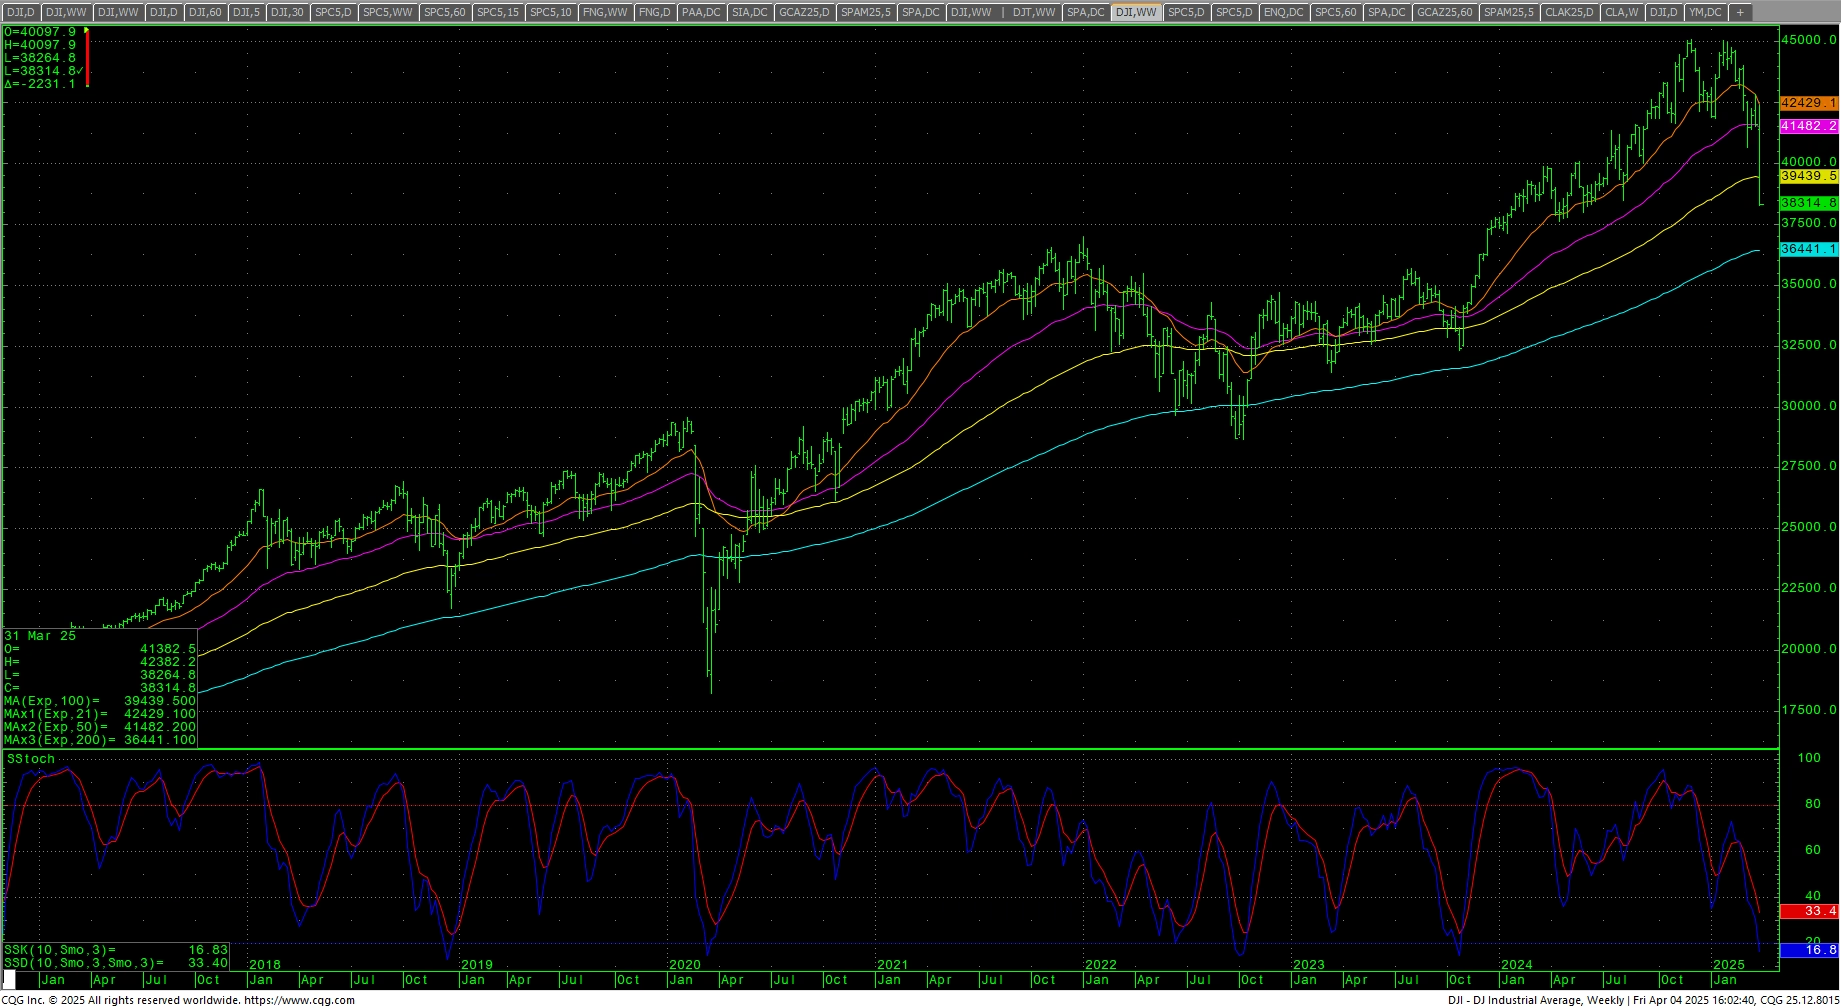
Dow Jones Industrial Average Weekly Candles
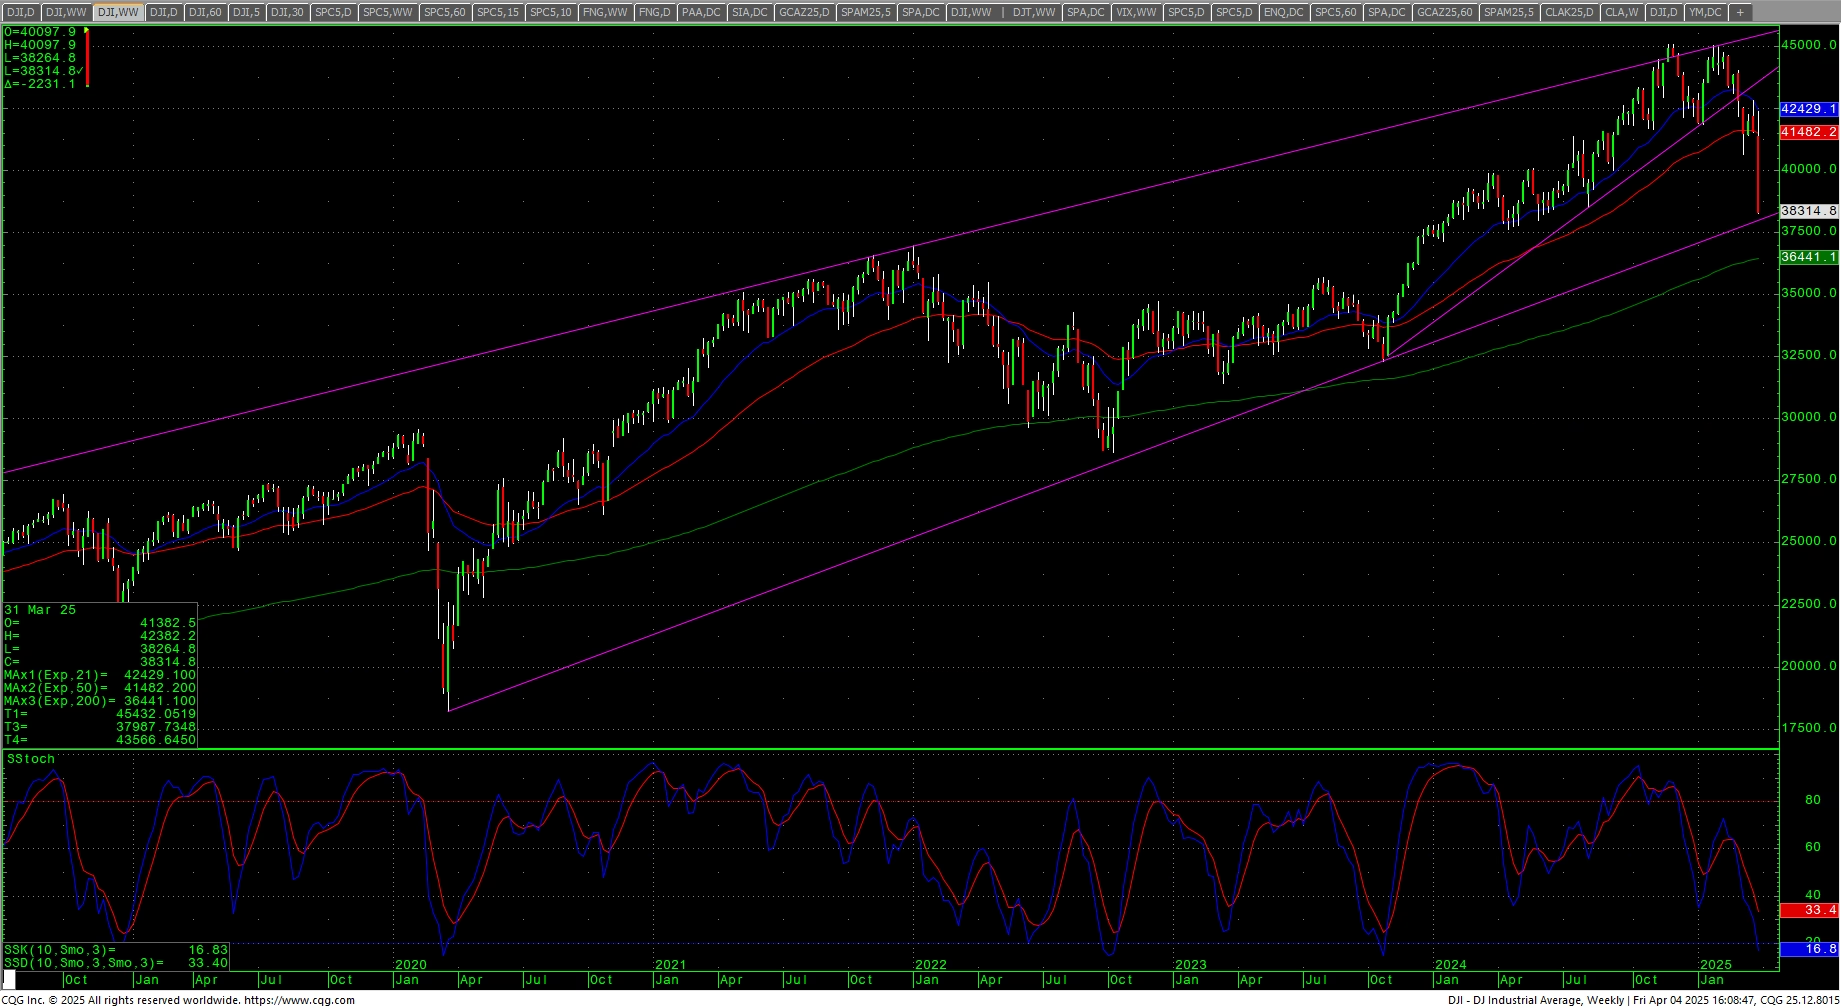 The Dow rallied early in the week and then went into a full-fledged meltdown. Prices closed at the lowest daily settlement since 30 May 2024. The market met, and closed under, targets in the 38634 level. There is now a breakaway and runaway gap on the daily but, as mentioned above, sentiment is overblown with the crash. The MACD turned back down and the RSI is oversold at 18.24. The stochastics are in a sell signal. All the moving averages are in downtrends. The weekly is in a sell signal. The hourly ended the week deeply oversold with Friday’s collapse. The 200-day MA starts the week at 41957.
Dow Jones Industrial Average Weekly H-L-C
 Prices took out weekly support at 38700 and 38634. A further breakdown counts to 37196/37190 with support of 38000 and 37611. 37611 is the April 2024 swing low and support is critical long-term at 37196/37190. Closes under 37190 opens counts to 37122 with full potential toward 35515/35335 and trading support at 36523 and 36024.
Dow Jones Industrial Average Hourly H-L-C
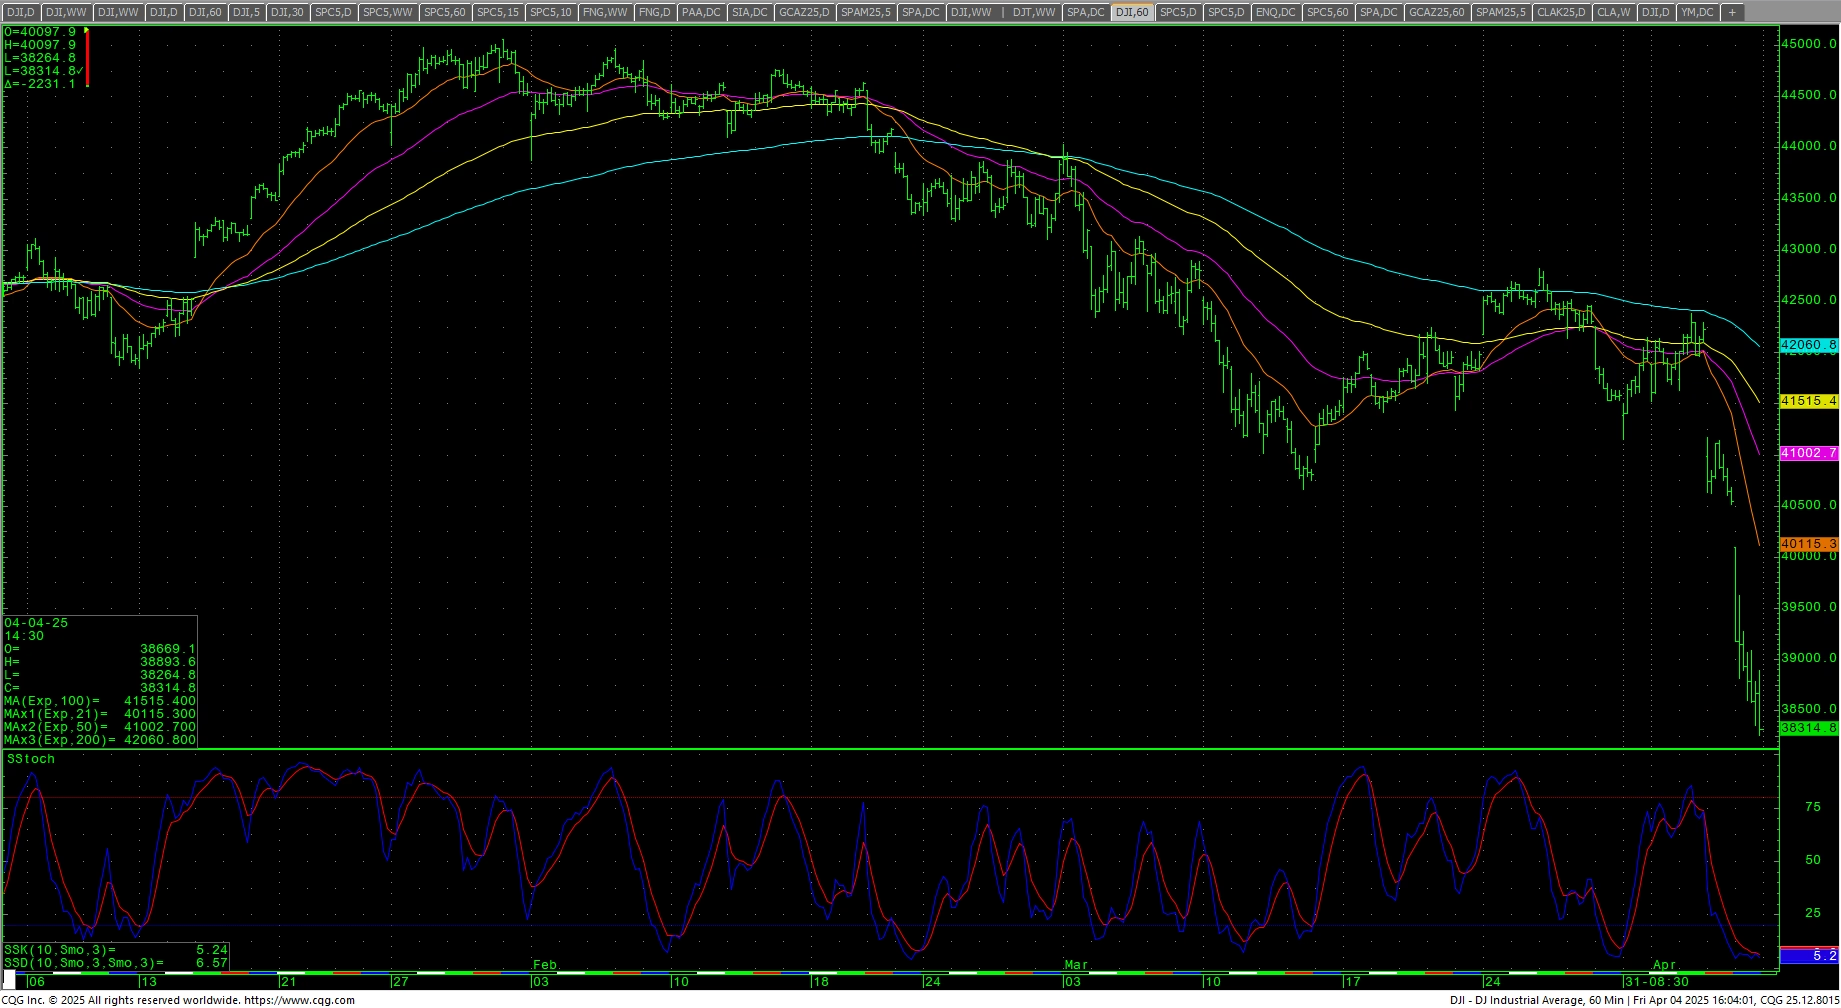 Resistance is 38879/38893 and 39236/39259. A breakout over 39259 counts to 39543/39566 with counts to pivotal near-term resistance at 39844/39850 and 39871/39877. Closes over 39877 will open counts to 39994 and 40423. A drive above 40323 counts to critical short-term resistance at 40809/40815 through 40865. Closes over 40865 opens counts to 41669 with resistance at 41124.
| Resistance | Support |
|
|
S&P 500 Cash Index: SPX
S&P 500 Index Weekly H-L-C
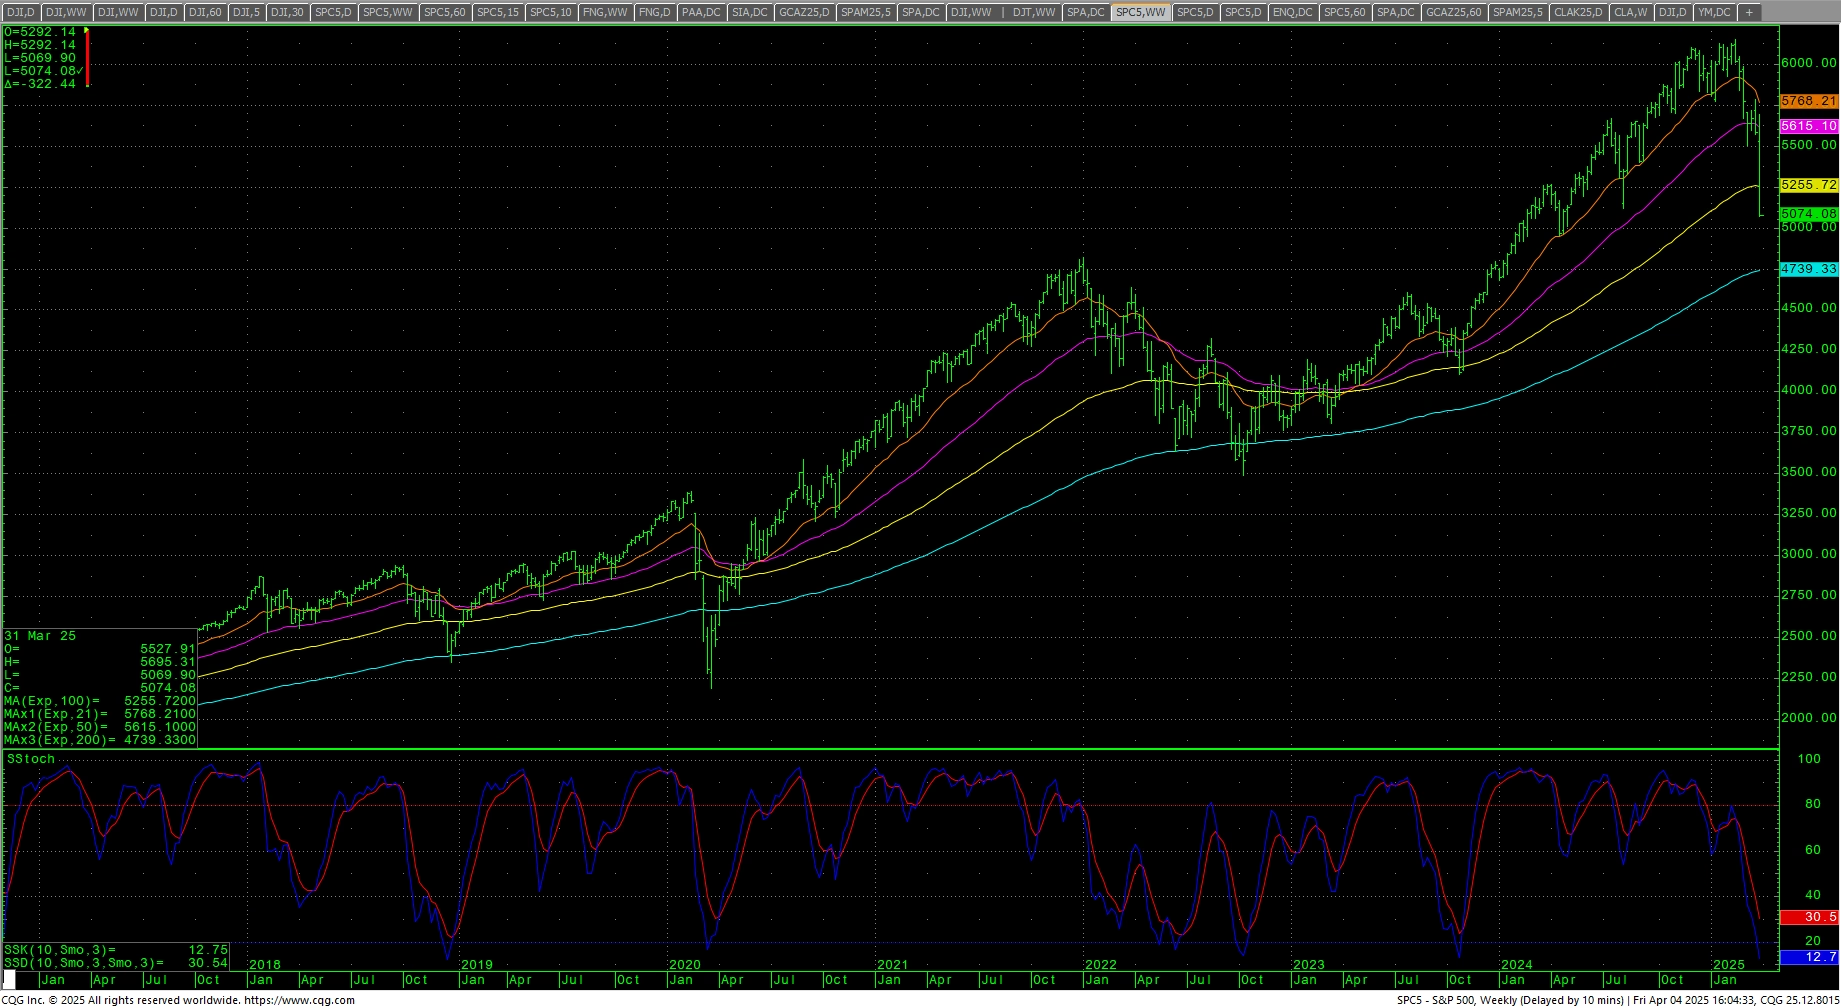 The S&P started the week lower and reversed into Wednesday’s trade before crashing in one of the worst weekly declines in 50 years. The daily close is the lowest since 2 May 2024. The daily is in a sell signal on the stochastics, the MACD is has hooked lower and the RSI is oversold at 18.15. The weekly stochastics remain in a sell signal with the lowest weekly close since 15 April 2024. The hourly ended deeply oversold with Friday’s plunge. The 200-day MA is 5691.40.
SPY Weekly
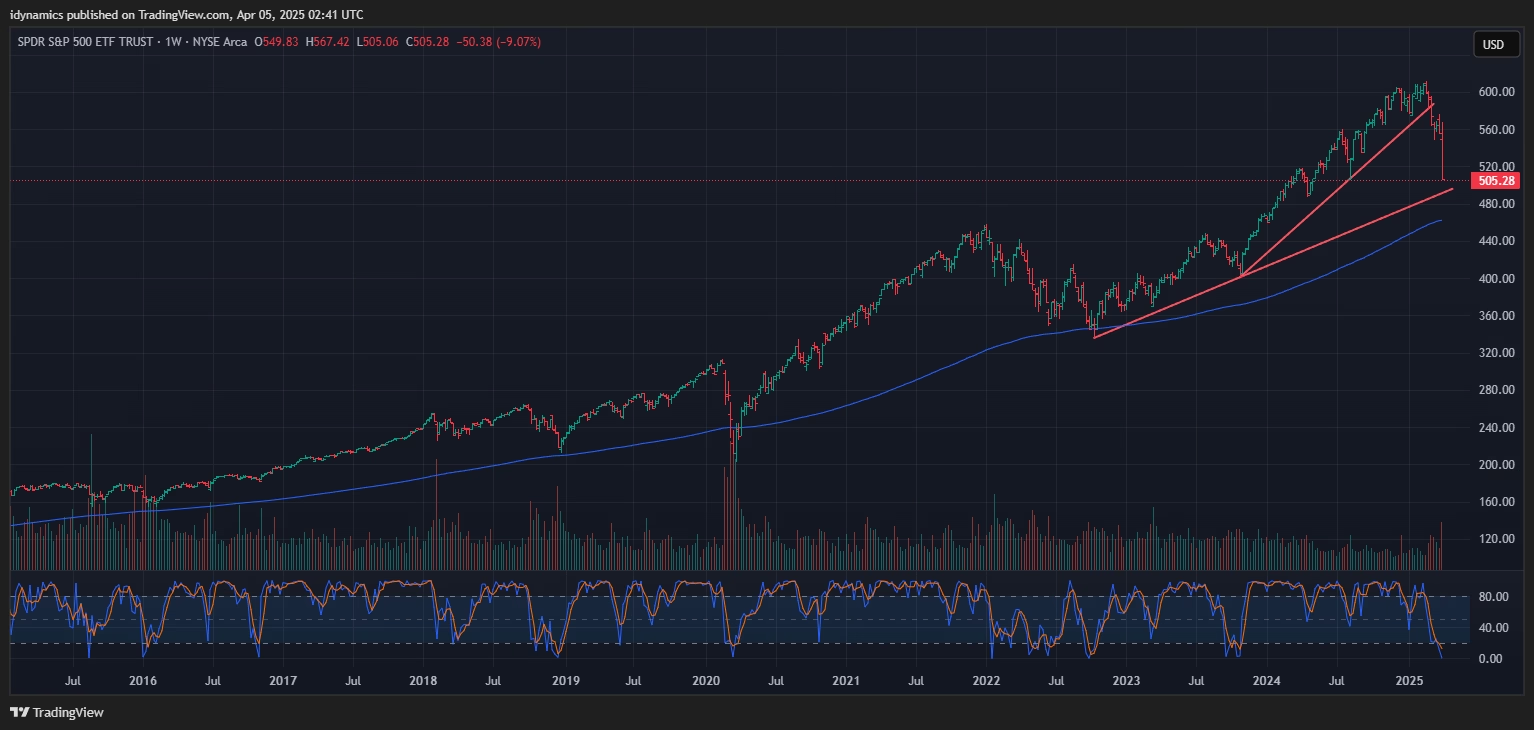 The market has retraced over 50% of the move from late 2023 to the February highs. Prices took out critical support 5125/5119 (there was a target at 5144 also). A further breakdown with closes under 5119 offers counts into the 4884/4880 area with support at 4953. Closes under 4880 are bearish and open counts to 4614 through 4586. Under 4586 can carry to 4486 with counts to 4421/4418 (gap) and support at 4459. Closes under 4418 set up 4319 with full counts into the 4104/4100 area.
S&P 500 Index Hourly H-L-C
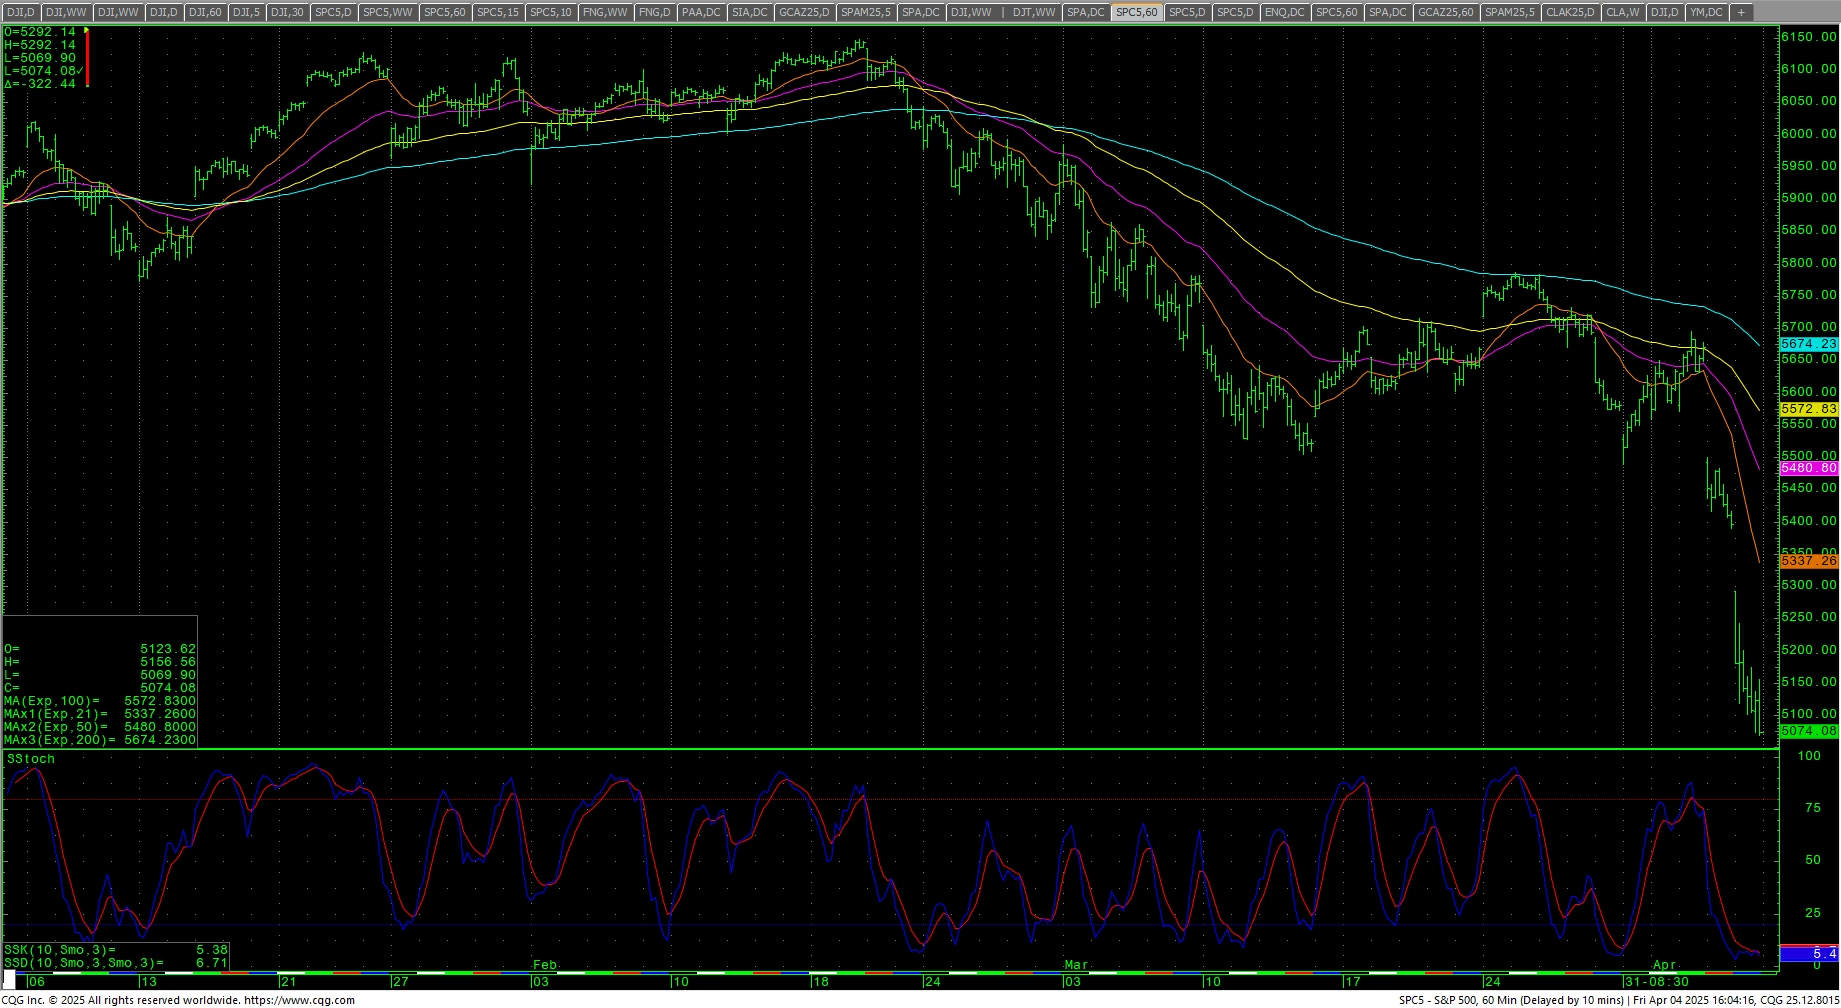 Resistance is 5167 and 5227. A drive back over 5227 sets up 5276 with counts to near-term resistance at 5325/5330. Closes over 5330 should test 5385 and 5480/5482. Closes over 5482 are friendly and count to 5608 with potential to 5735/5740. Daily closes above 5740 should minimally test 5787 with potential to 5878/5893. A breakout over 5893 will open counts to 5986 with full potential to 6043 and opens counts to 6112/6114 and full counts into critical resistance at the intraday high of 6147.43. Rallies through 6148 should test 6160 with a shot at a target of 6180.35/6181.
| Resistance | Support |
|
|
Charts courtesy of CQG, Inc., CNN, Koyfin, Trading View and AAII