
TECHNICAL ANALYSIS (by Intraday Dynamics)
HAPPY EASTER WEEK!
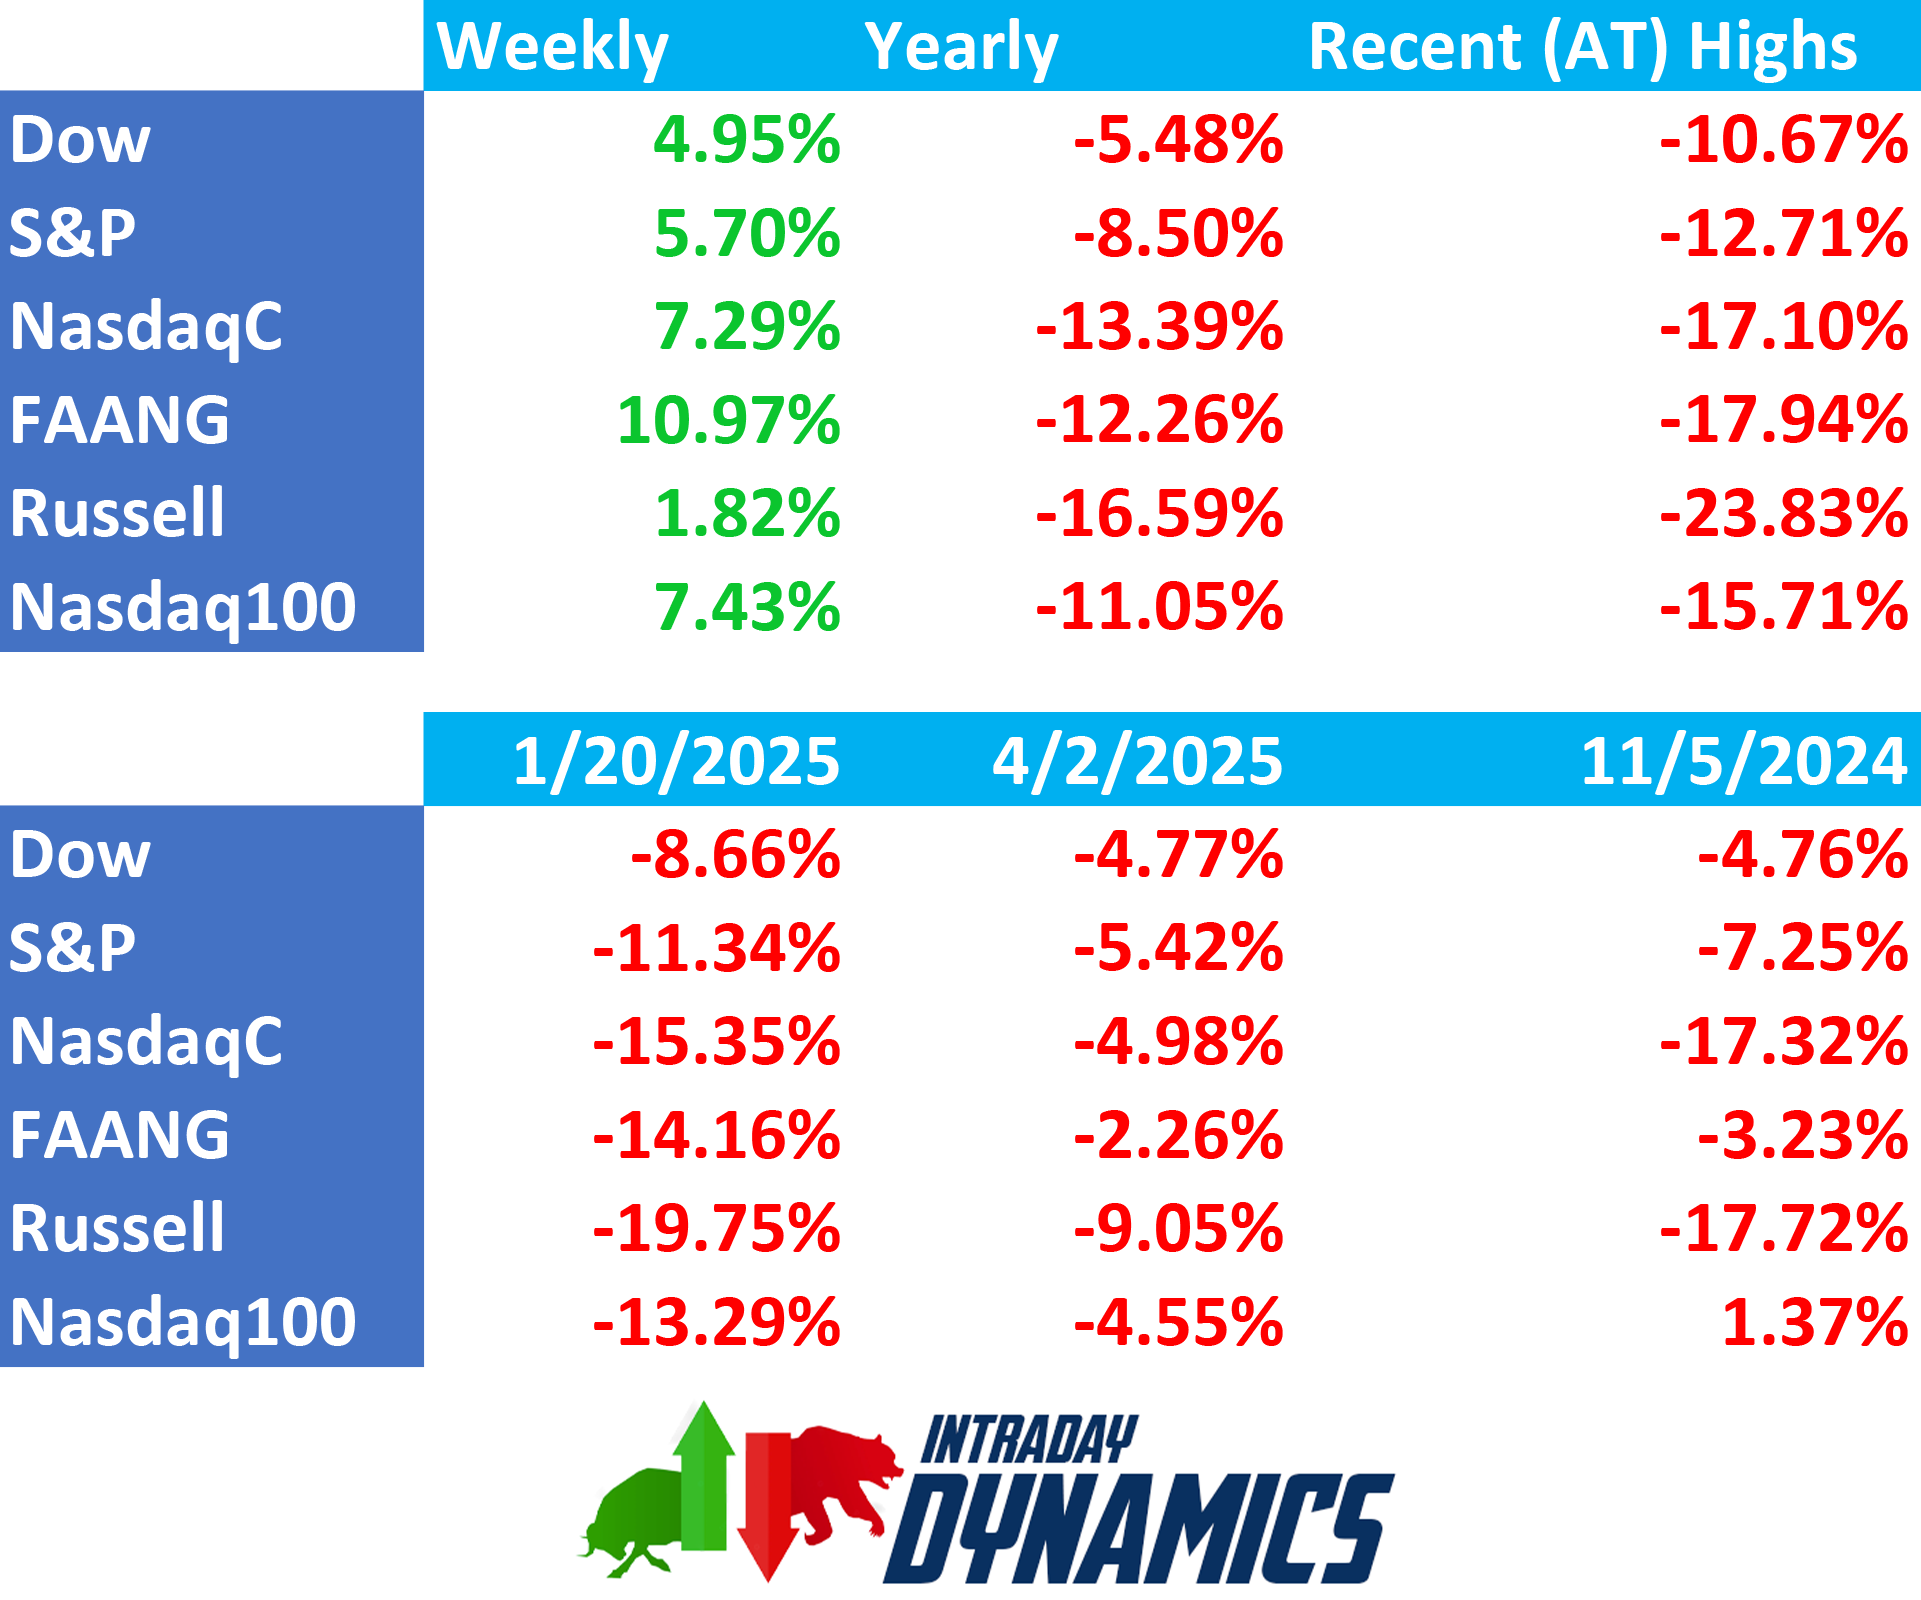
 Major Indices Week of April 11, 2025

 NYSE Volume
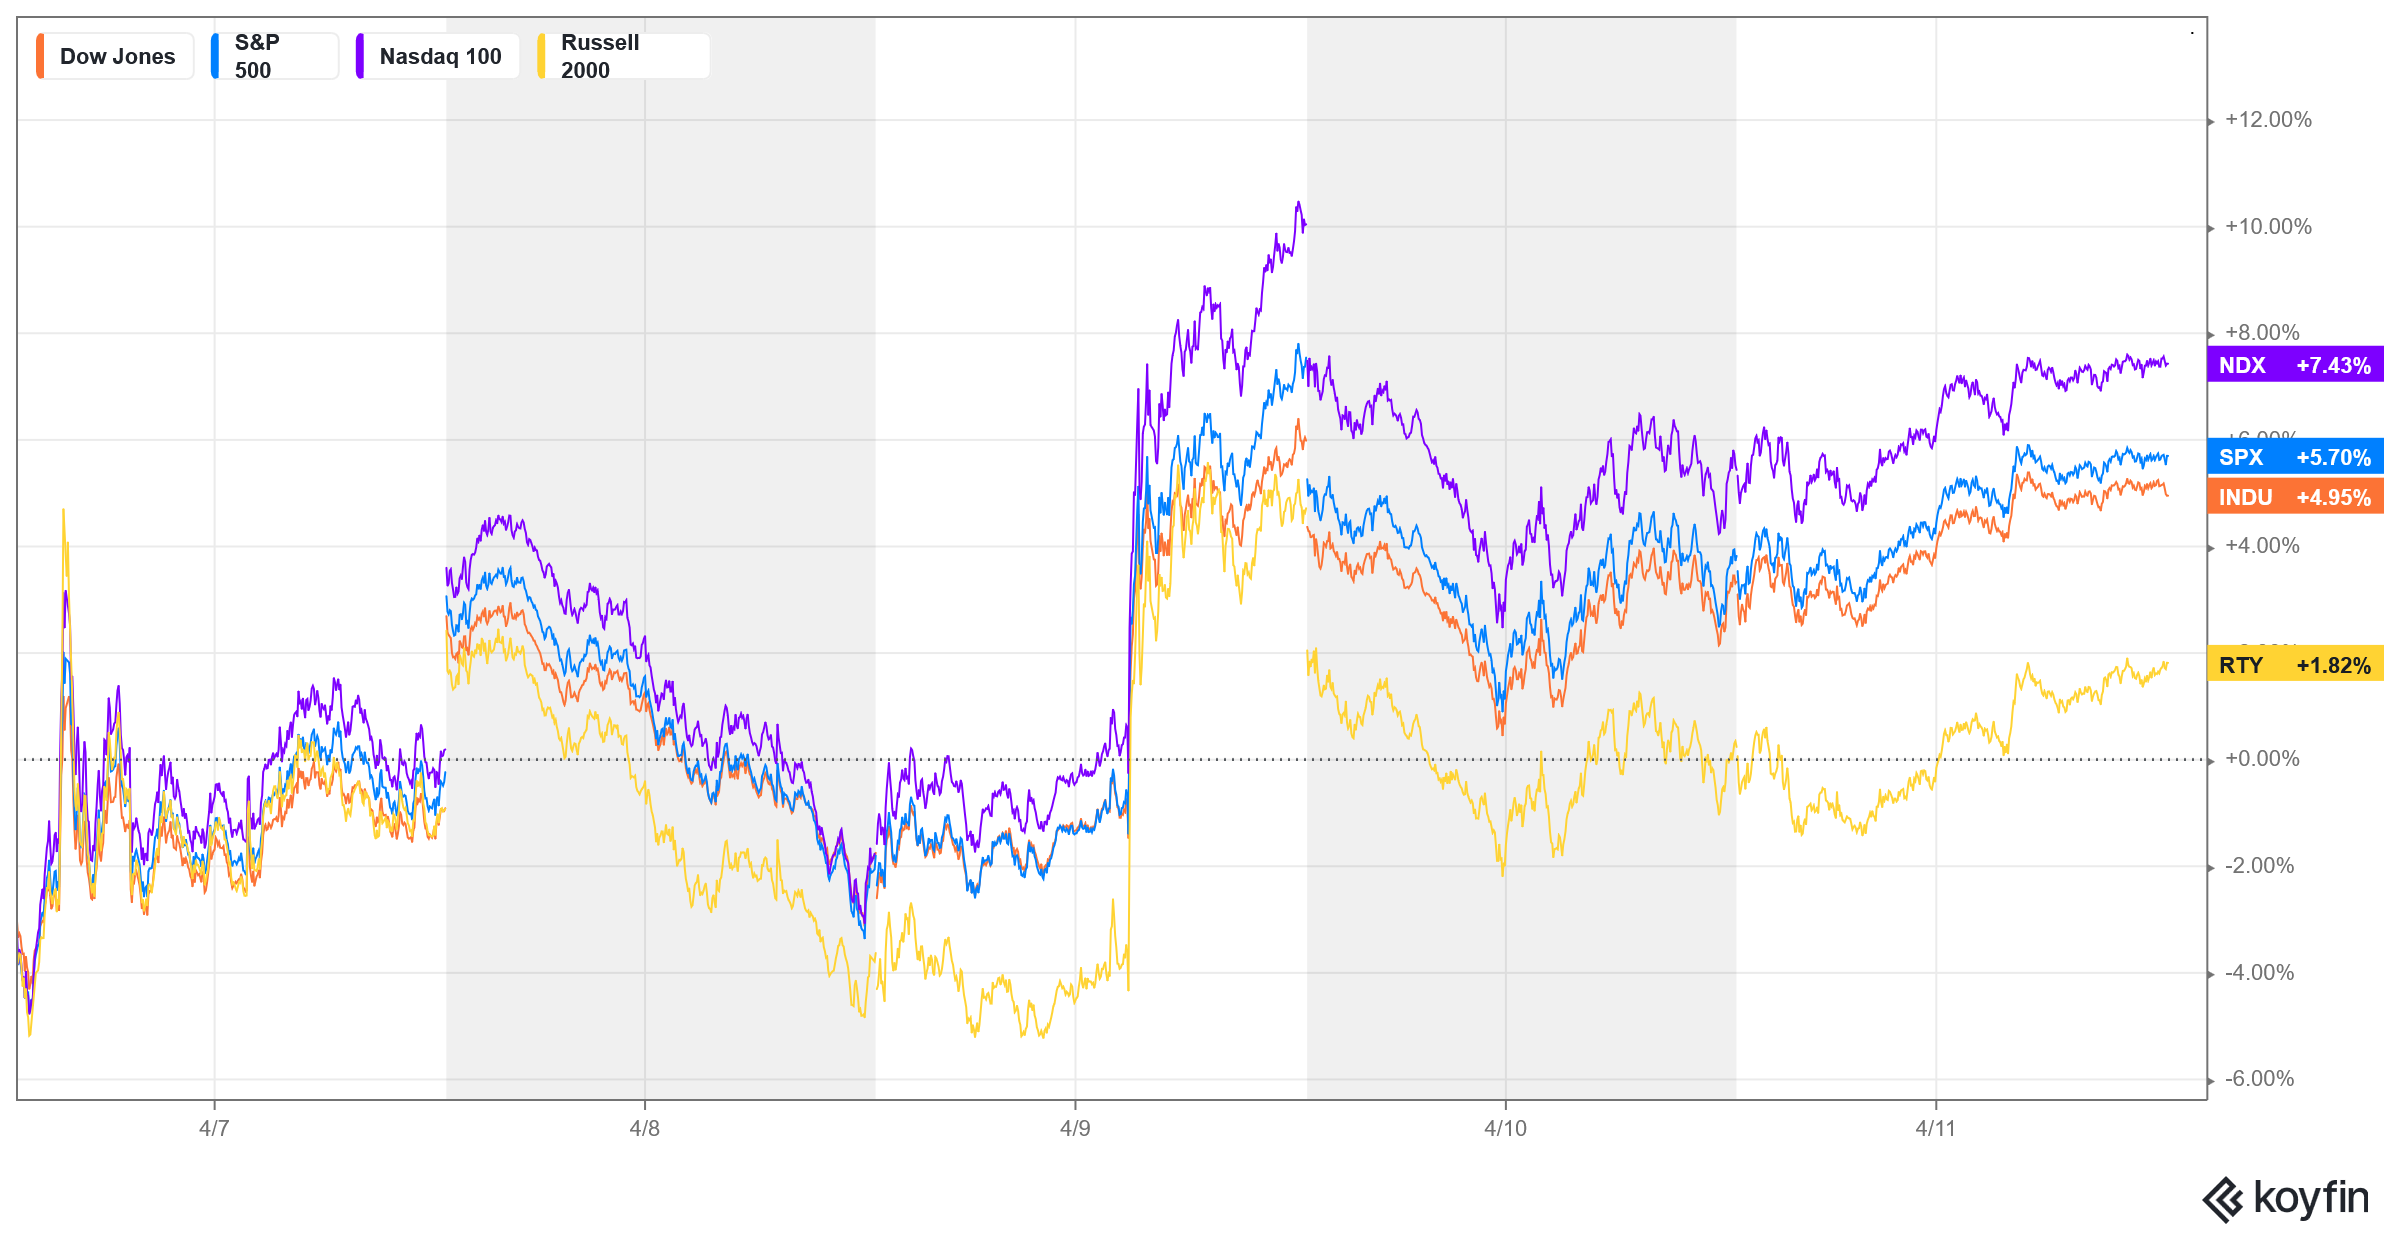
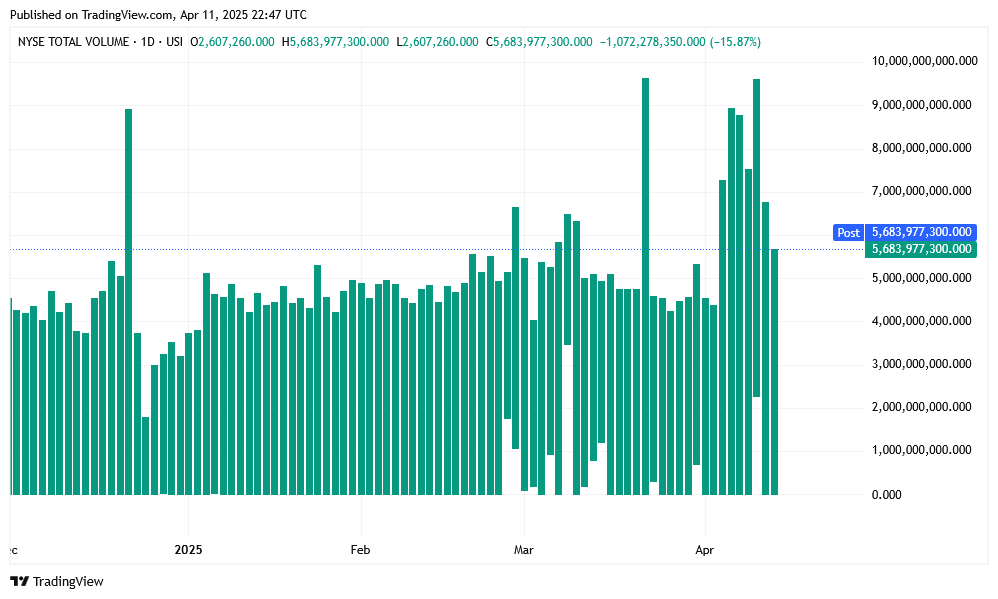 Stocks traded a massive and volatile week, reversing, with all indexes except the secondaries posting sharp gains…the best week since 2023. Monday’s trade started off with a huge decline on follow through from last week’s meltdown and then staged a near 7% intraday move in the Dow on rumors of a “pause” on tariffs. A late day selloff ensued as the talking heads all came out and said there were “no plans for a pause.” That line was touted throughout Tuesday’s trade as prices again went on the defensive. On Wednesday, Tariff Man turned into The Khaotic Kid as “policy by tweet” announced a pause in most tariffs for 90 days. To add to the insanity, we now know that the architect of the tariff plans, Peter Navarro has been taking counsel from a fictional anti-China “expert” by the name of “Ron Vara,” which is an anagram of Navarro’s last name. Can this fracas get any dumber?
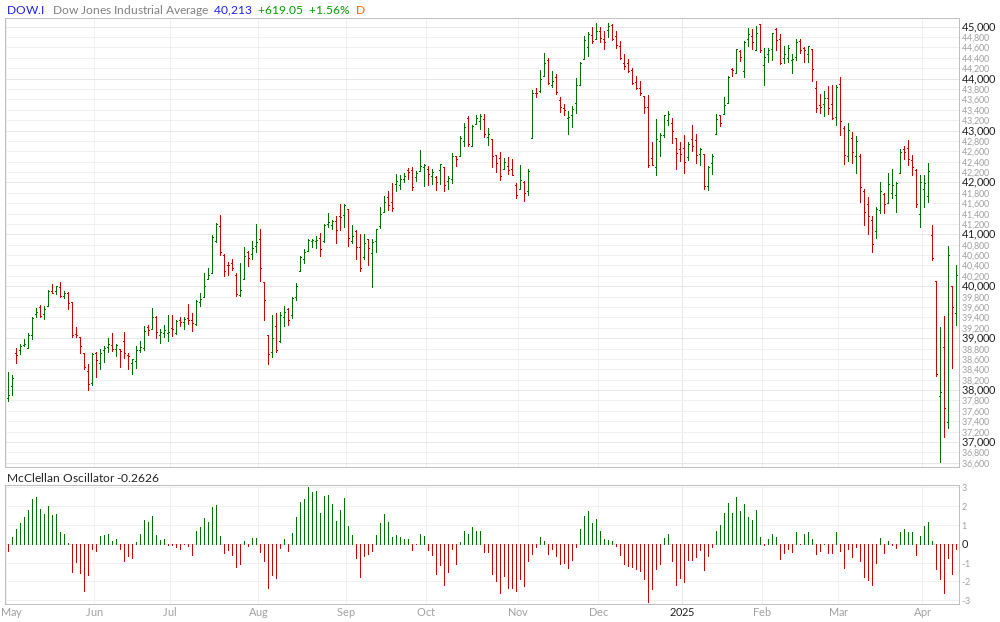
 Dow Jones Weekly Candles

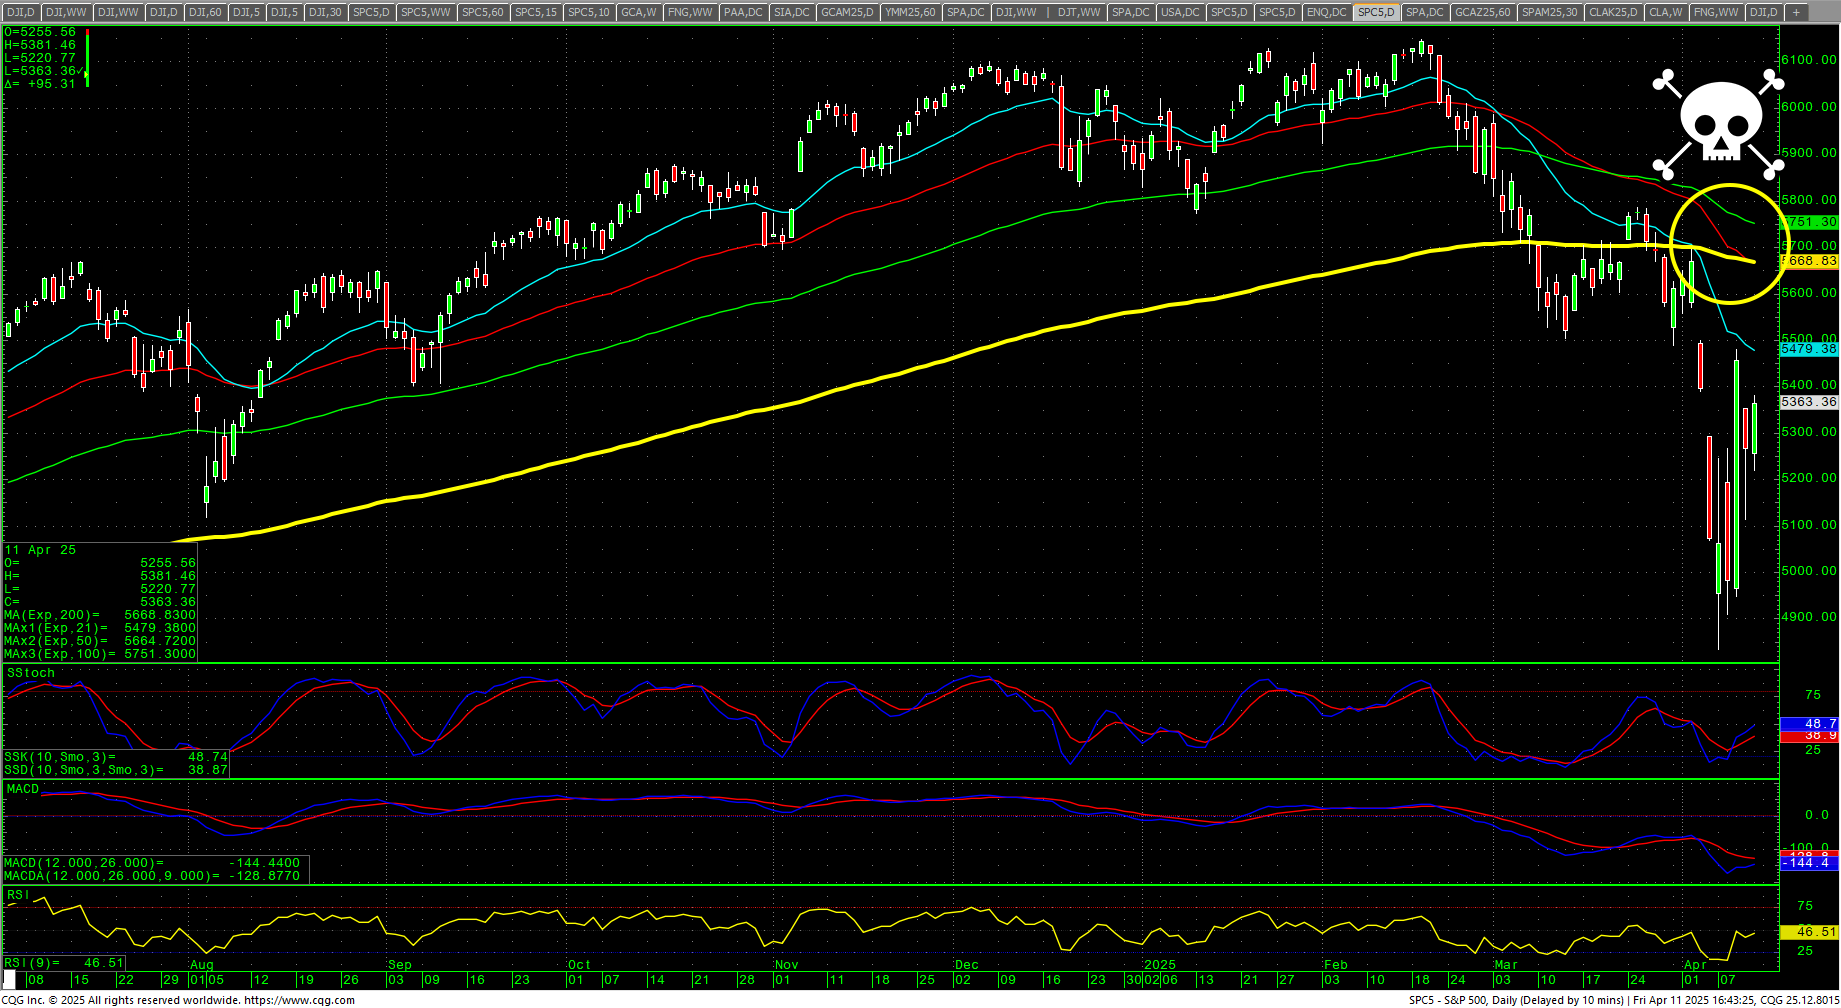
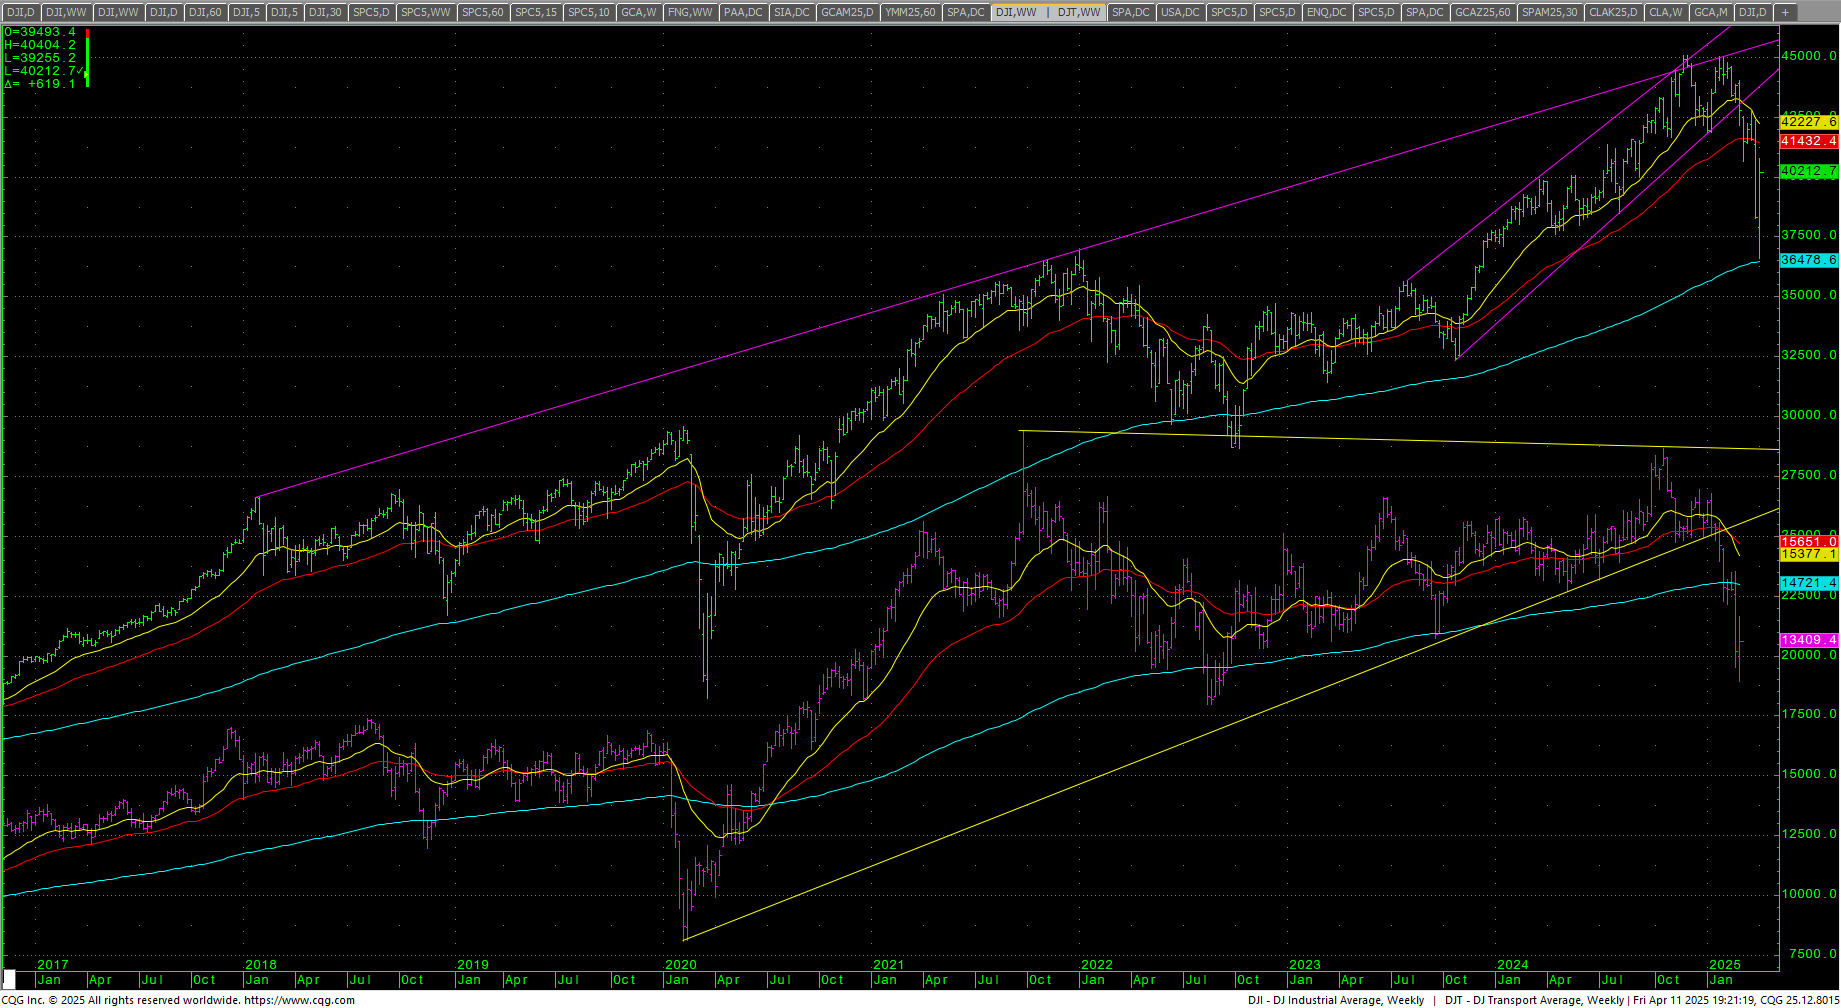
 The Dow also came very close to kissing the 200-week MA on Monday. At the same time the SPY hit a critical trendline on the weekly chart from the 2022 and 2023 lows. That said, the Nasdaq and the SPX daily charts have both staged Death Crosses with the 50-day MA going under the 200-day MA last week.
SPX Daily Candles
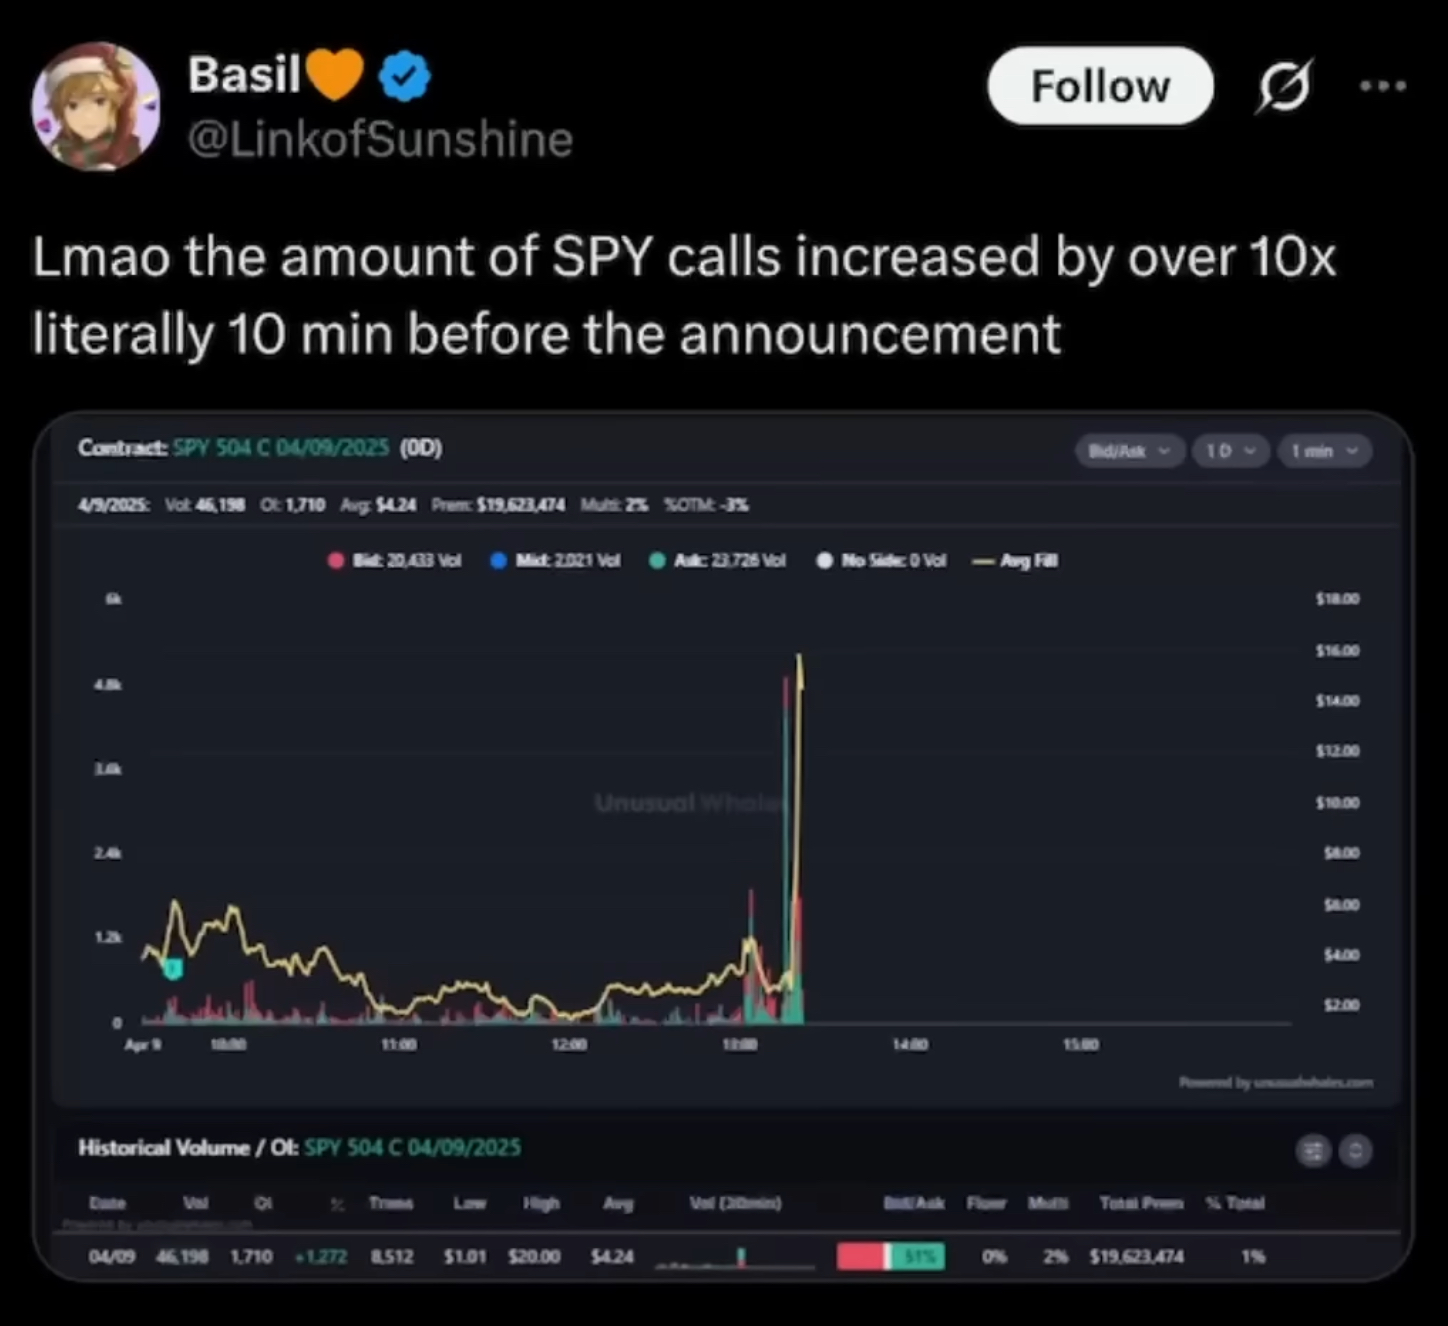 How contrived was this? 10 minutes prior to the social media post, volume in SPY and QQQ options exploded by 10X+…so someone “knew” what was coming and was able to front run the announcement. The volume in the 504 calls on the SPY went into a hockey stick to the upside. Clearly insider trading. In fact, it was so “inside,” the U.S. Trade Representative Greer had no clue as to what was happening and only discovered the social media post while testifying before a House committee! Before that, he seemed completely clueless.
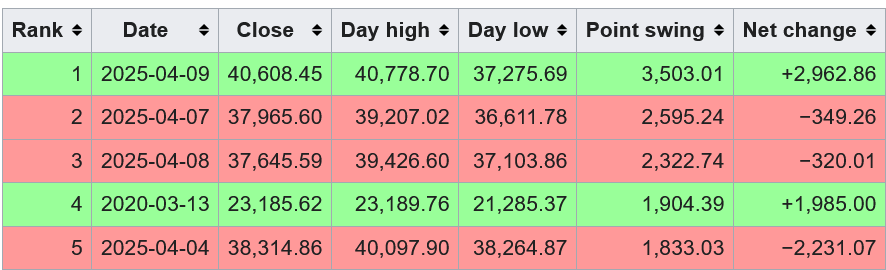
We went from “Liberation Day” to “Runaway Day.” This resulted in the largest single-day point increase in the history of the Dow as it closed just shy of up 3000 points. At this point, four of the five largest one day intraday moves in all history have occurred between Thursday the 3rd and Wednesday the 8th of April 2025.
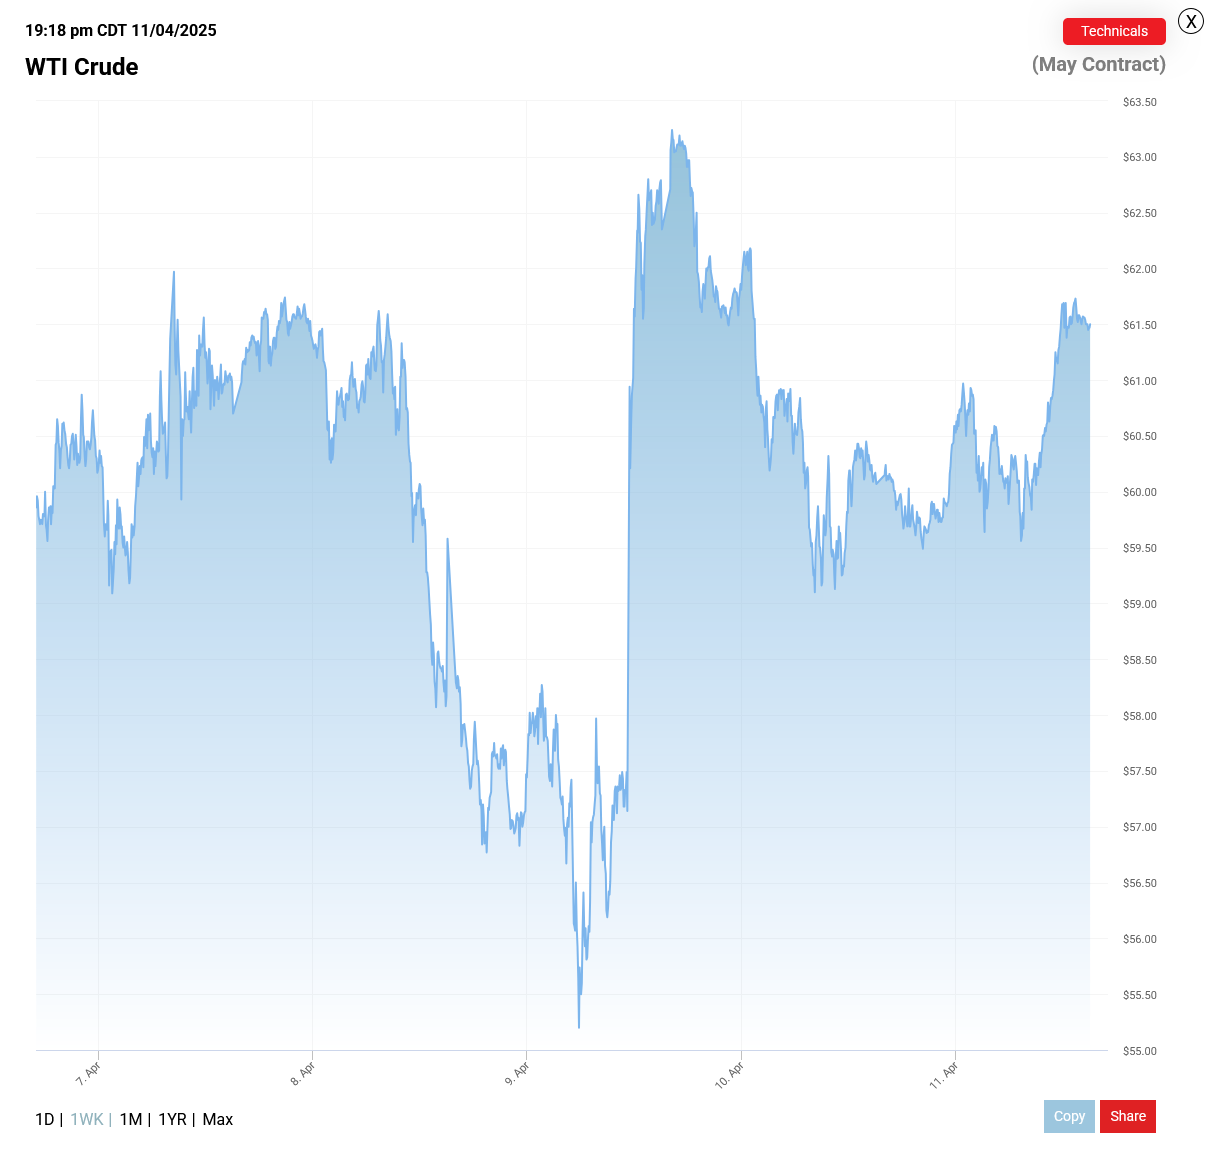
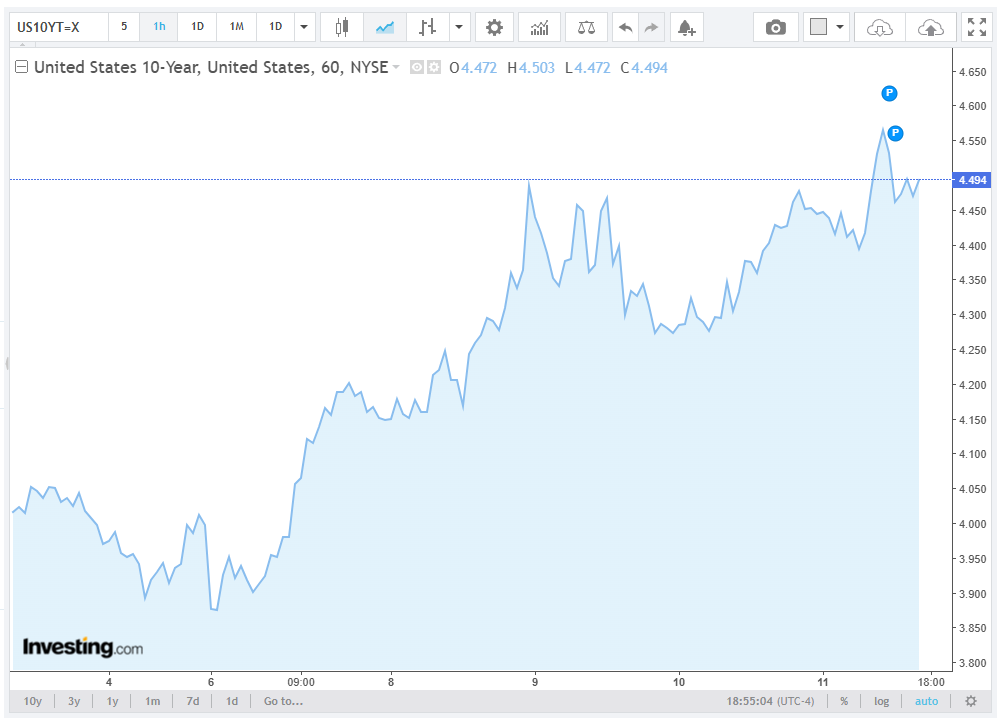
 Speculation over what led to “Runaway Day” is mixed, but it is safe to say, as Professor Scott Galloway pointed out: “The 10YR note was the only adult in the room.” The 10YR yield soared on the rally as Japan and China unloaded U.S. Treasuries in a tepid auction. It was the 10YR, coupled with a meltdown in credit spreads, a plunging Dollar and, most likely, angry Texas billionaire oil barons angrily calling up the White House as the price for WTI crashed to a low of $55.20 intraday on Wednesday. At that price, capping wells and laying off workers is the only play left for the oil producers.
 The structural problems are now growing to be substantial. Last week prompted people to revive the famous Milton Friedman I, Pencil video where he explains the beauty of free trade and supply chains. The rest of the globe is moving quickly to re-order their supply chains amongst themselves and to now exclude the United States. Repairing relationships over this fiasco could take decades. This whipsaw insanity prompted the following quote from Larry Fink:
“The United States, post WWII was a global stabilizer. We are [now] a global destabilizer; This is not a pandemic, this is not a financial crisis, this is something that we’ve created.” –Larry Fink: Blackrock
The outside week up trade has taken prices back to the initial breakdown levels since “Liberation Day,” and it has relieved some of the severely overblown sentiment…but it has only increased, deeply, uncertainty in the country and around the world.
 Lies, deception, policy by “Tweet,” Tariff Tantrums and insider trading does NOT make for a stable business environment. No sane person could support the mishigas. Fund managers were hit hard in the past seven sessions, which has led to fear of a liquidity crisis and even prompted this headline from The Independent: Fund managers quietly fear Trump doesn’t have a tariff plan and that he ‘might be insane’
 Consumer Freakout
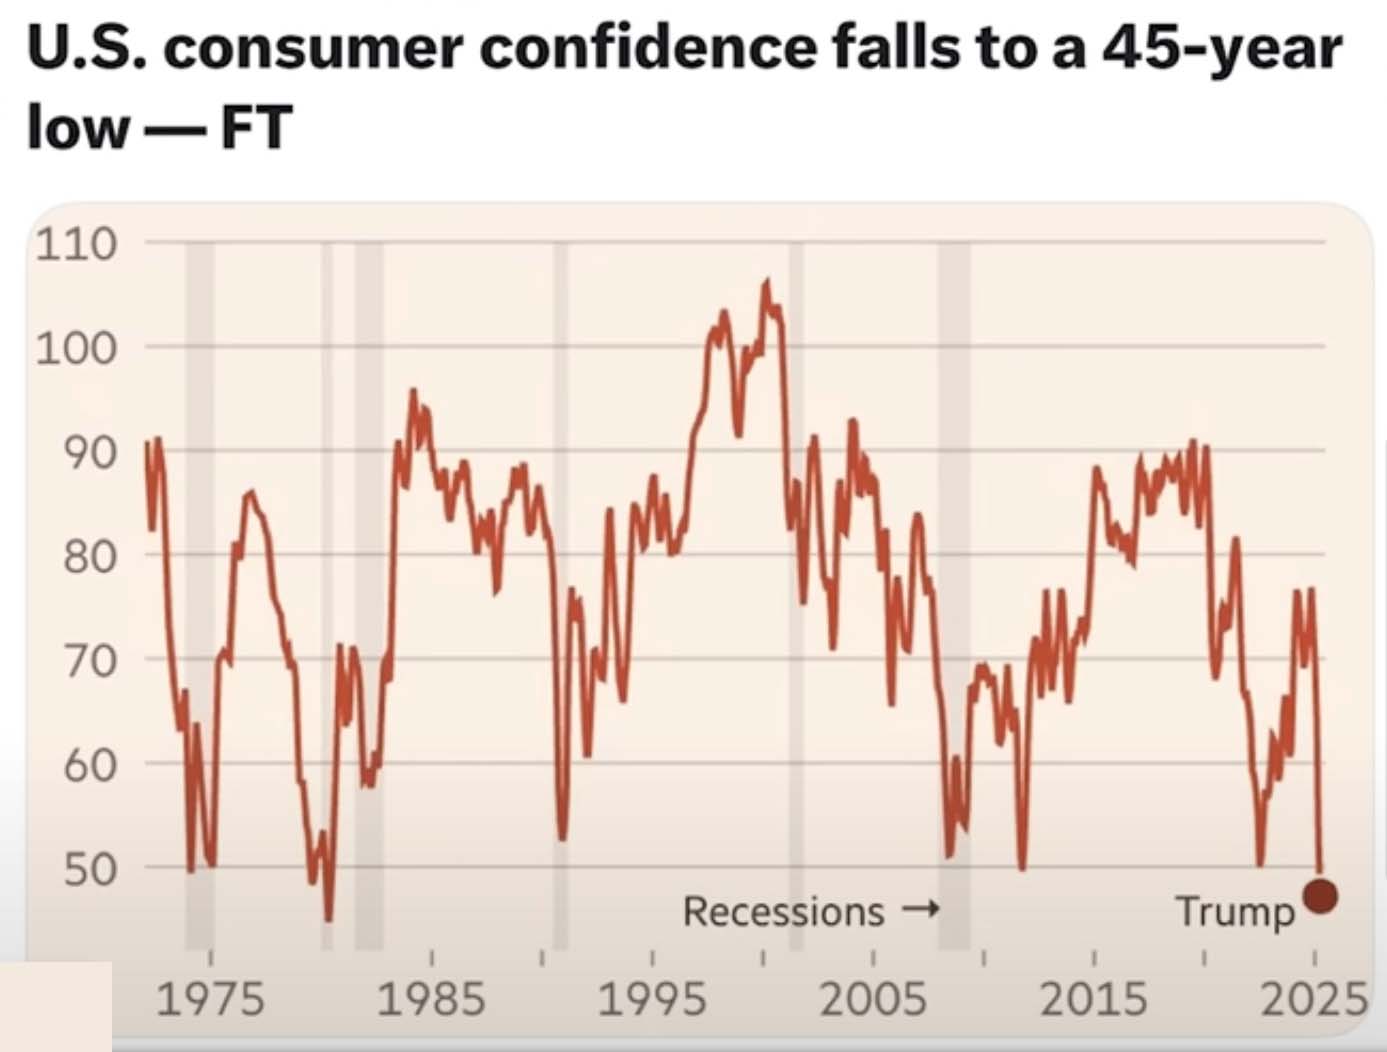
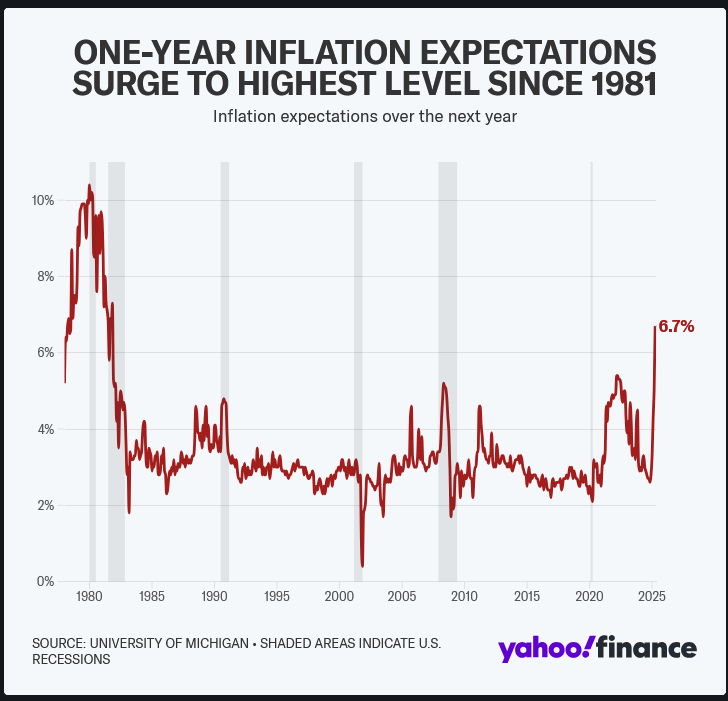
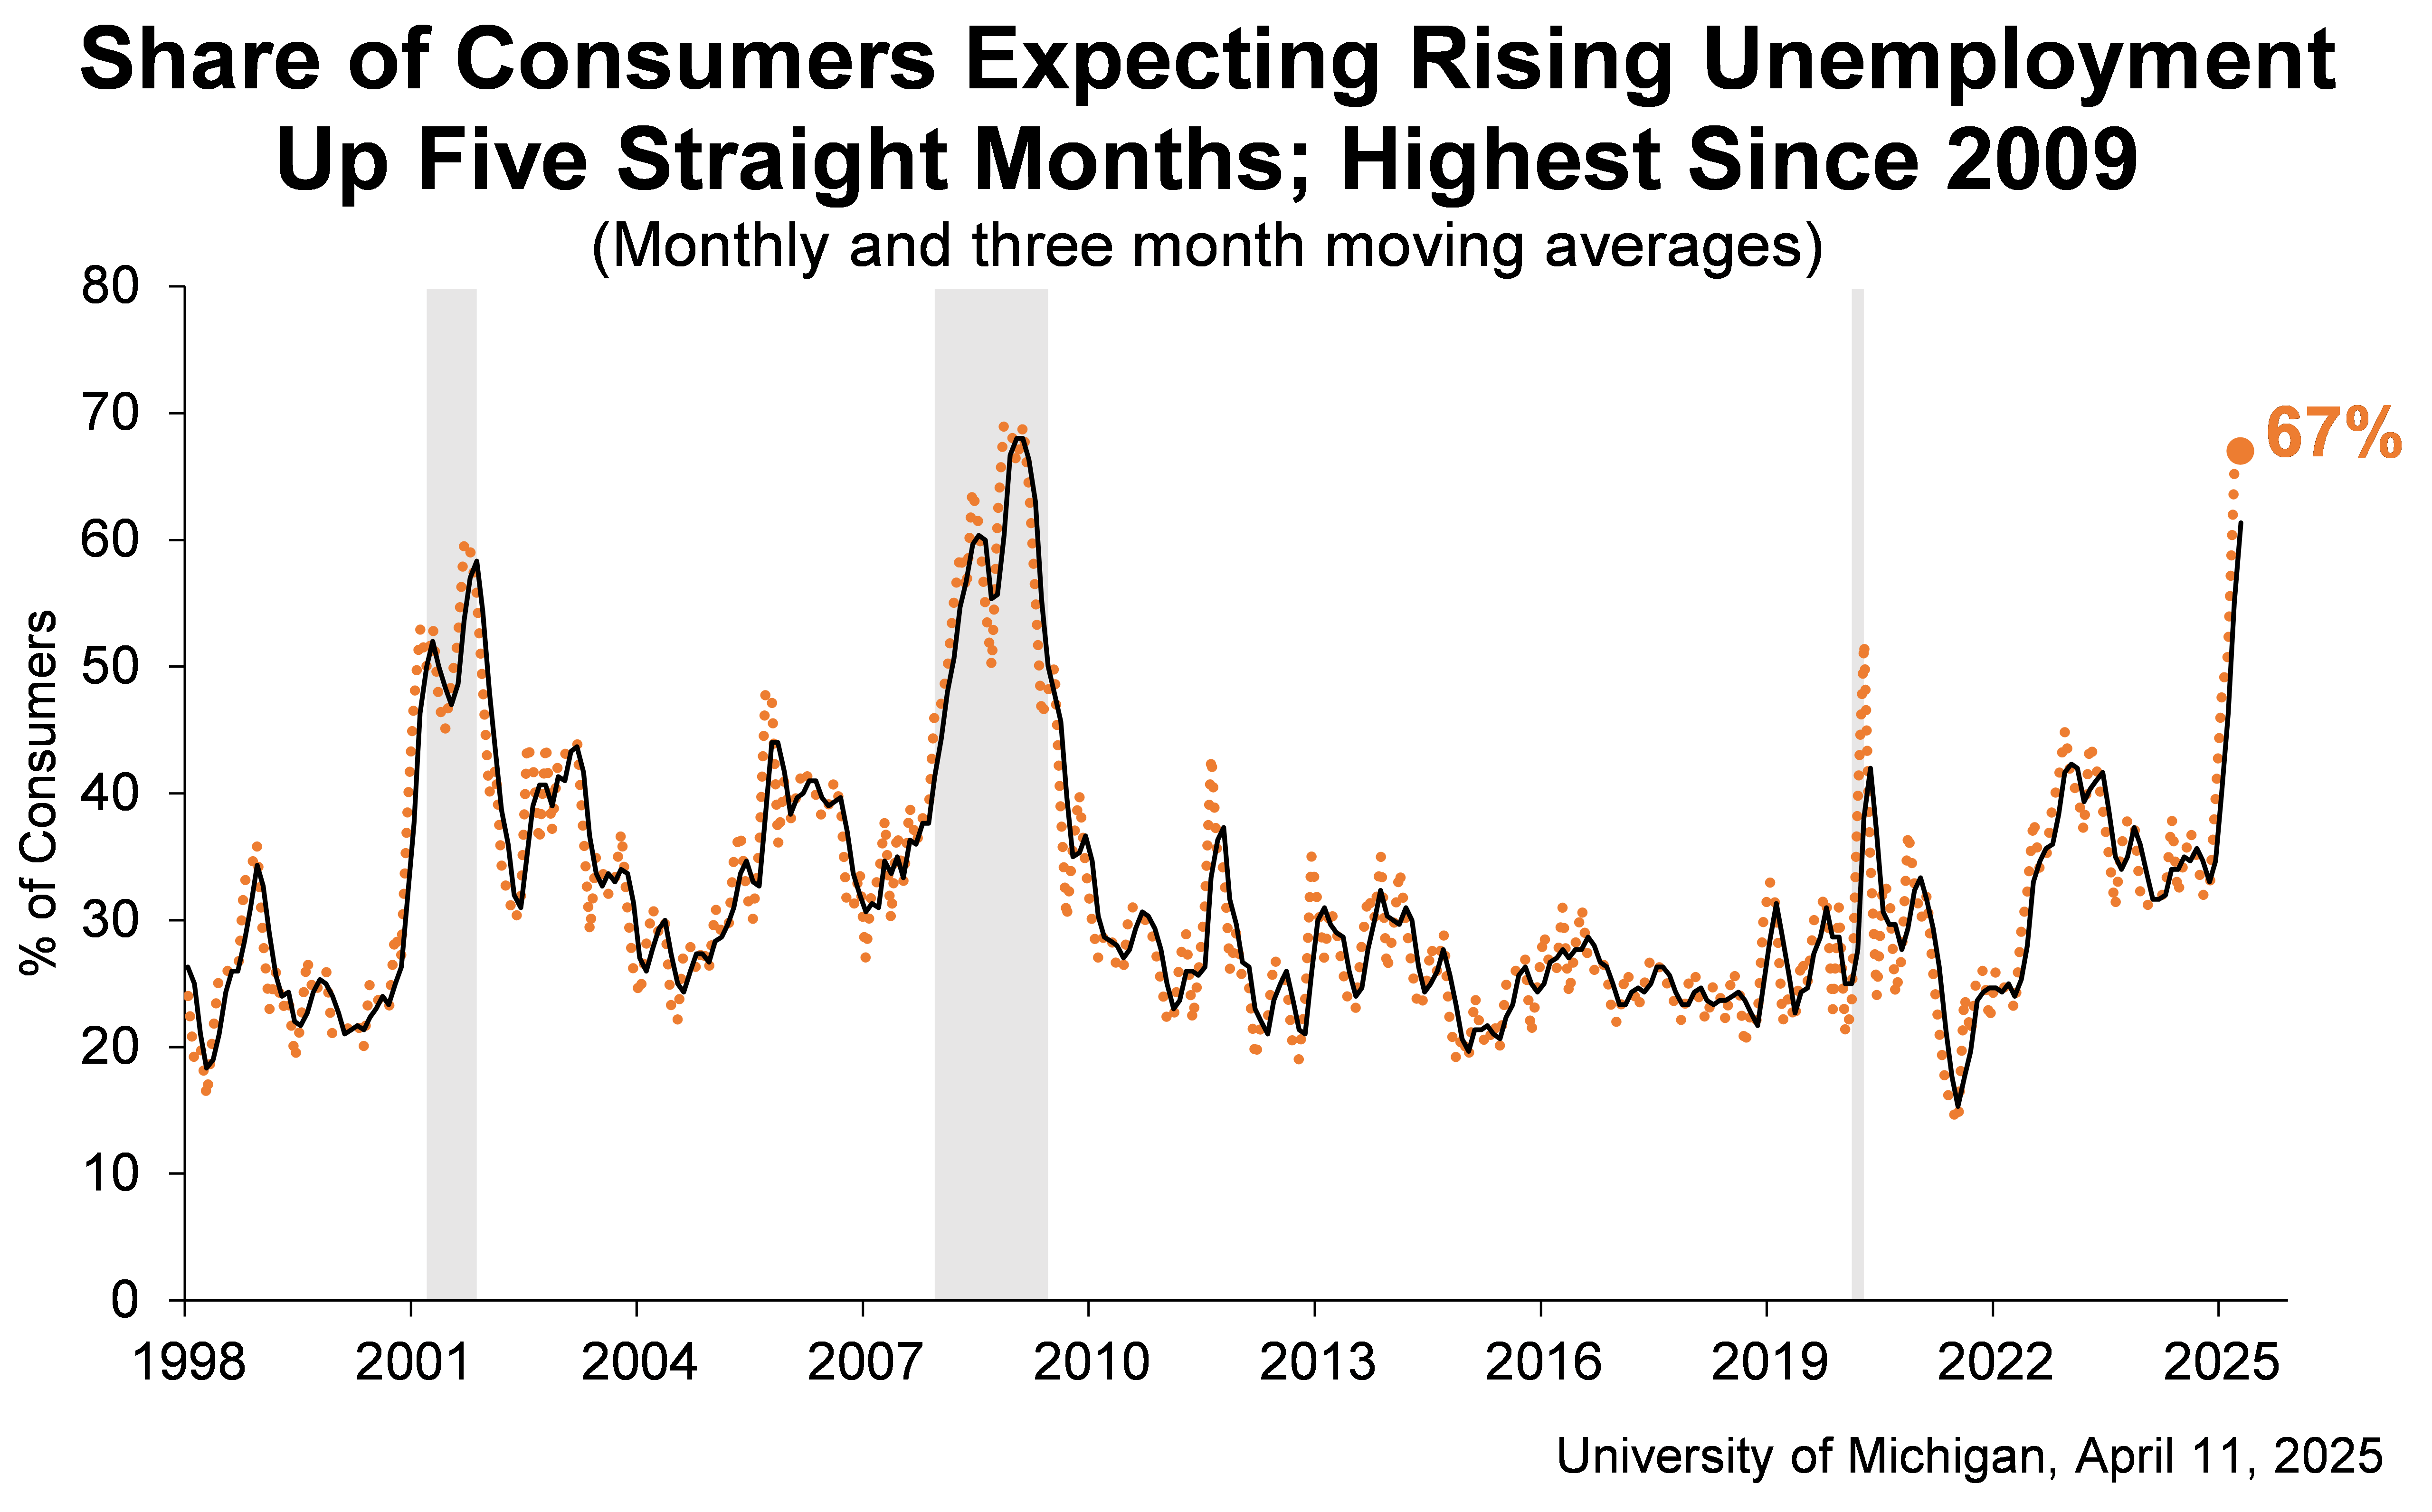
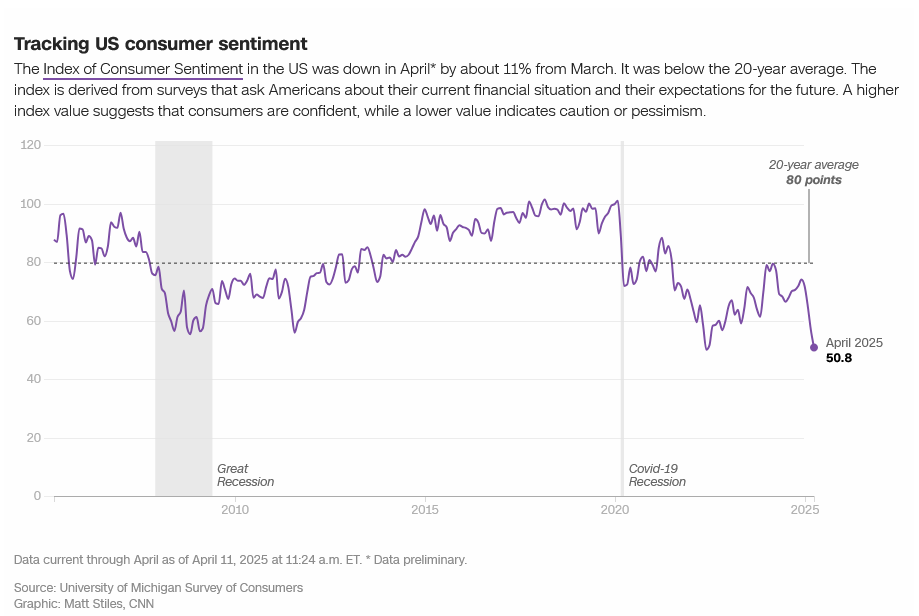 The lifeblood of the economy, American consumers, are not liking the mania. Consumer sentiment plunged 11% from March and is below the 20-year average, hitting a 45 year low. In addition, consumer inflation expectations jumped to the highest level since 1981, hitting 6.7% (even with Friday’s cold PPI at -0.4%). The share of consumers expecting rising unemployment jumped to 67%, the highest since 2009.
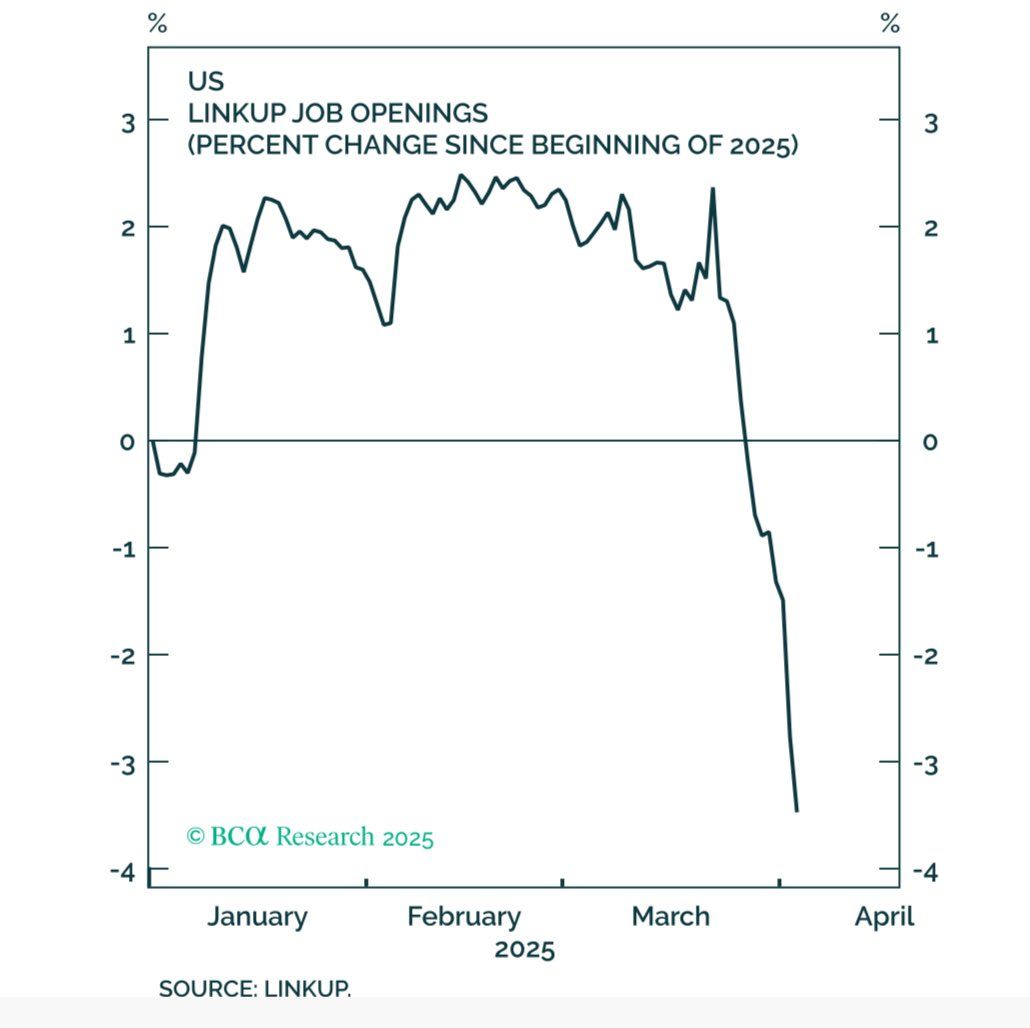
 This may not be the responses of “Panicans.” LinkUp Job Openings have plunged by over 5 percentage points since March. Dropping from a high of 2,764,179 on 25 March 2025 to a low of 2,608,624 by 5 April 2025…a near -6% decline in two weeks.
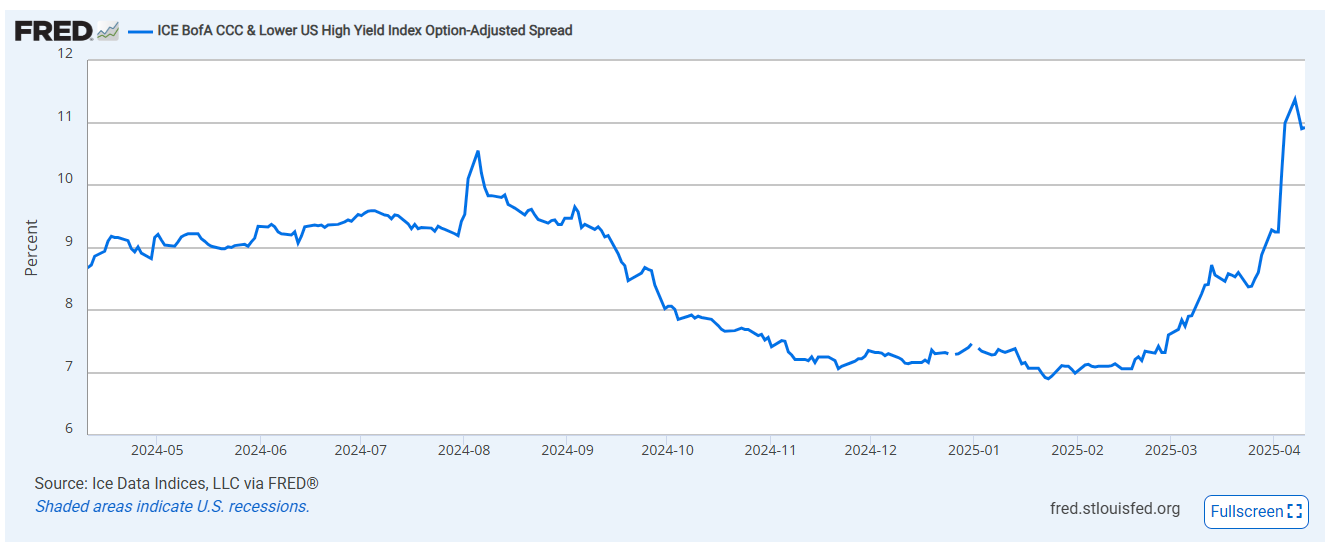
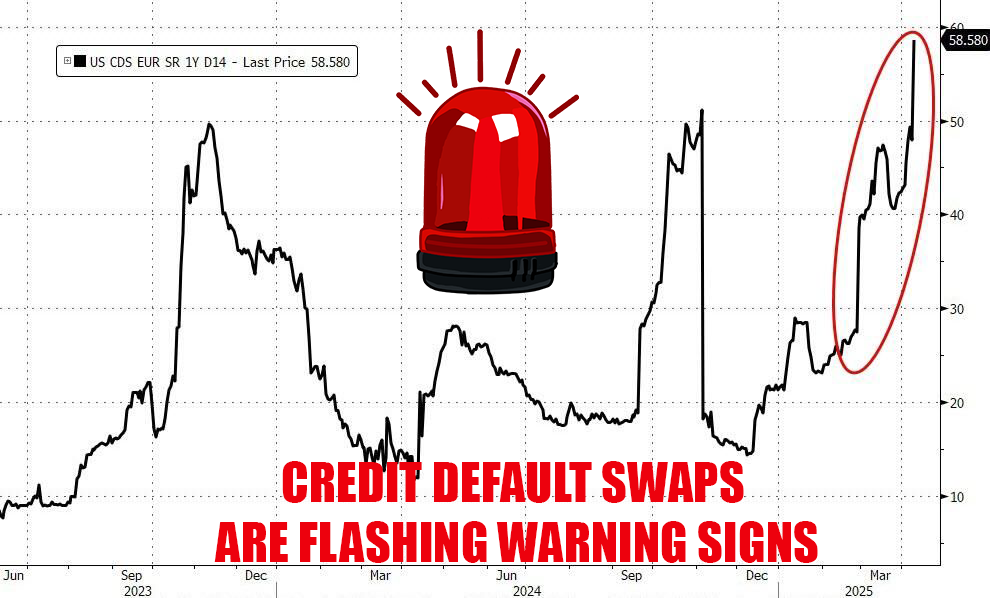
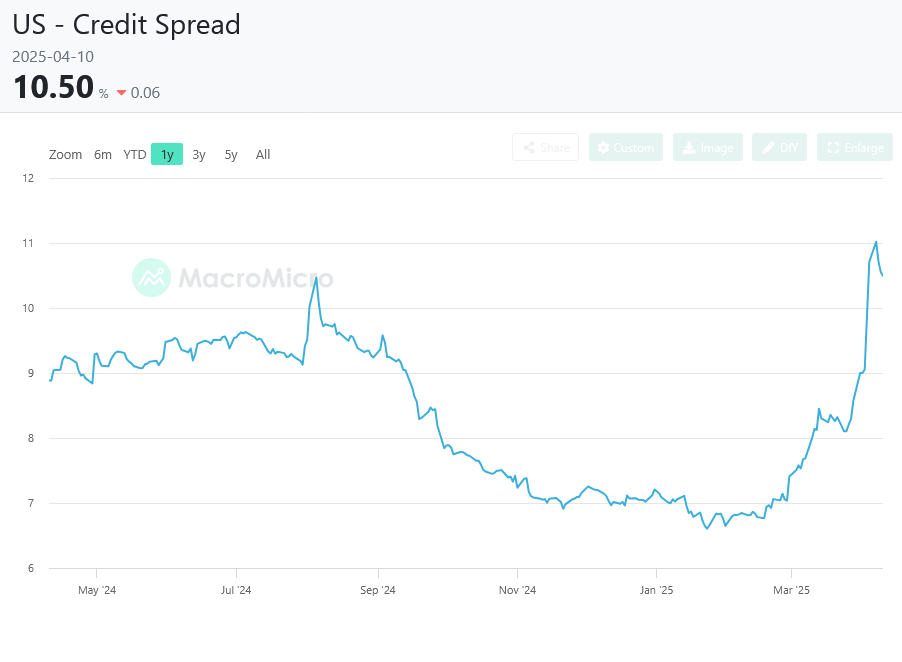
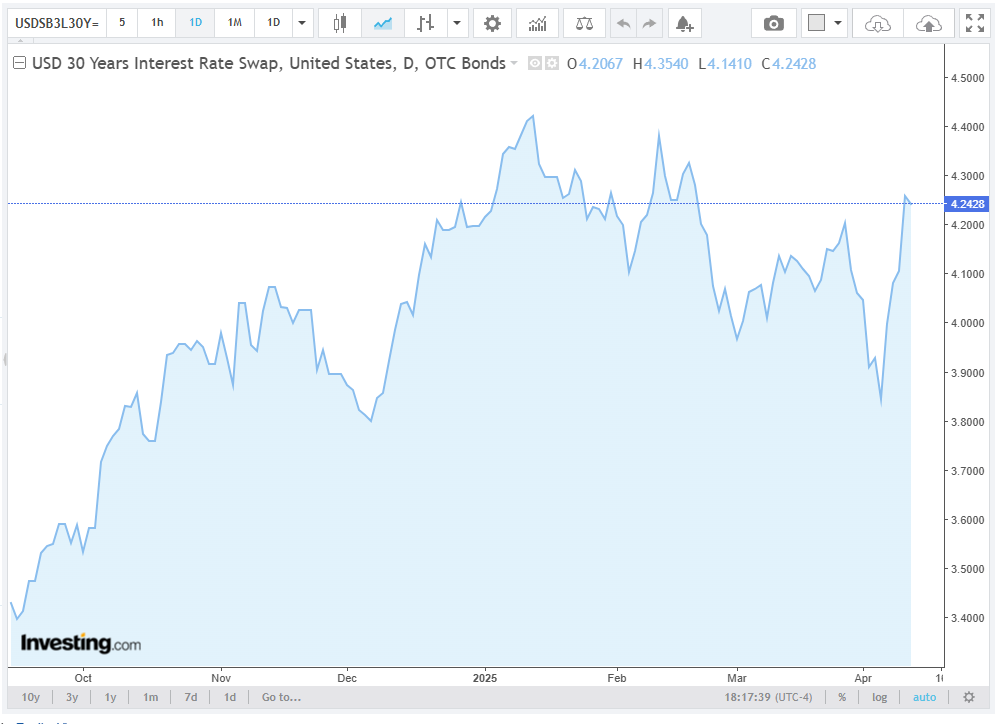
 Along with the crazy comes the reality of the bond markets. The 10-year yield surged to its highest level since February to trade as high as 4.59%, a massive 72 basis point swing from Monday’s low of 3.87%, notching its biggest week since 2001 with the long bond setting the largest one week swing since 1982. At the same time, credit spreads are coming unglued. The 30YR Swap staged a 40+ basis point move during the week. The BofA CCC High Yield Spread has jumped from a low on 24 March 2025 of 8.37% to a high last Monday at 11.37%. Something is “not right” in the credit markets, and it is starting to smell an awful lot like 2007/2008 in the swaps. CDS, Credit Default Swaps are flashing major warning signs.
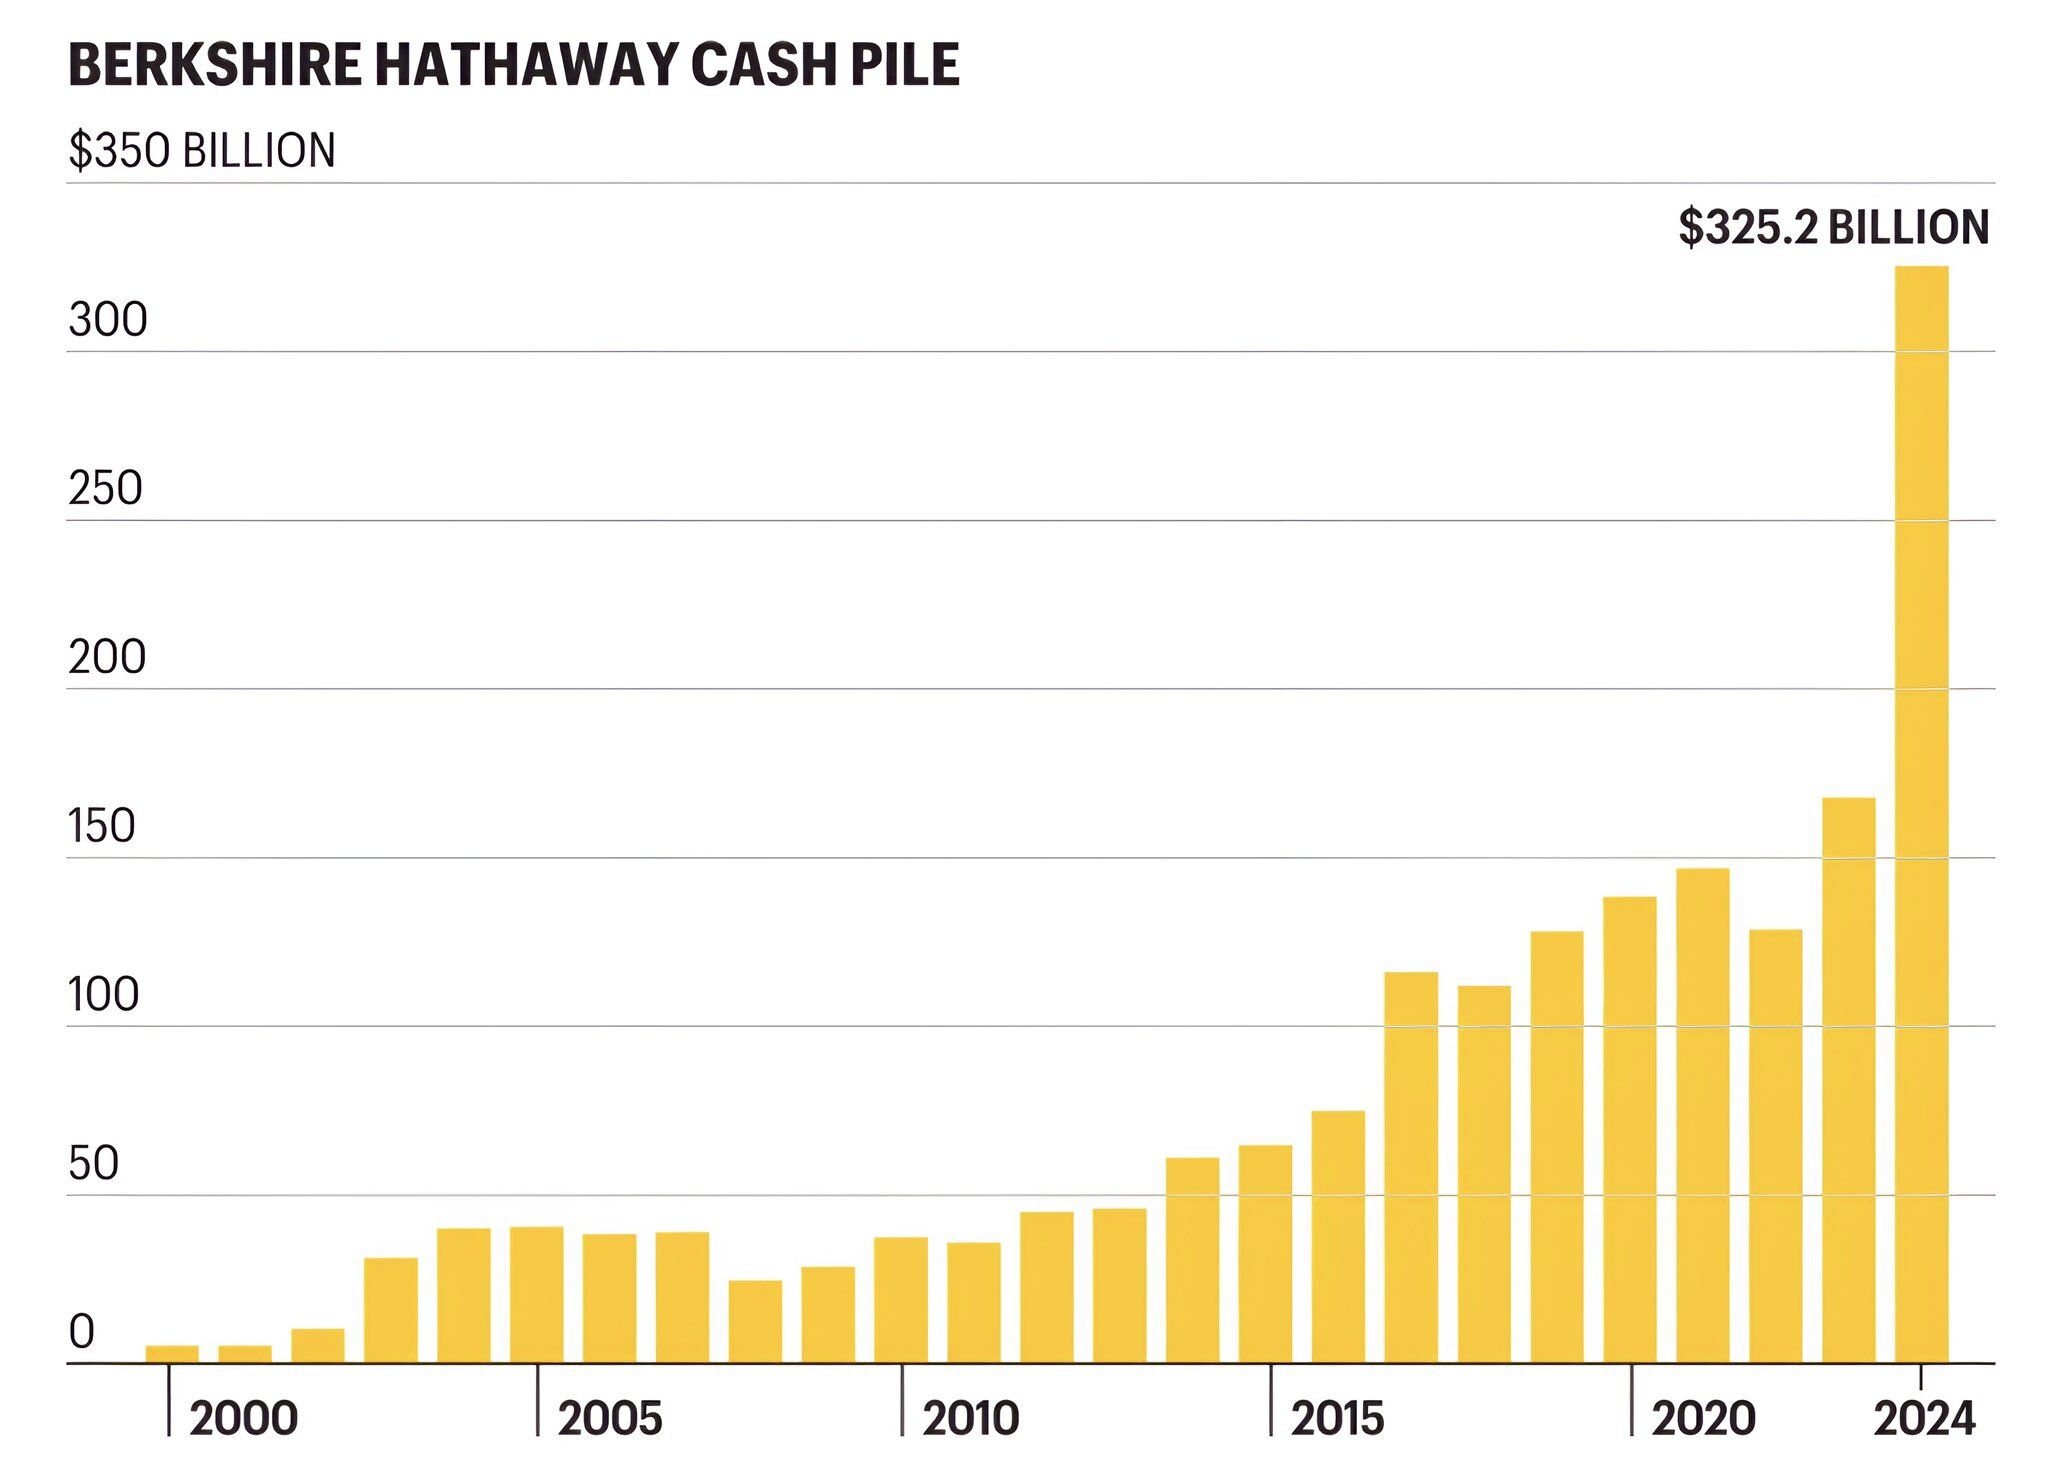
 And remember this guy, Warren Buffet? The guy sitting on $325 billion in T-Bills. He seems to be someone who sniffed out a structural problem well before the rest of the market. We also now know that Buffet has been selling the banks. Why would The Oracle of Omaha be dumping banks, unless he also thought that there might be more structural issues underlying the market?
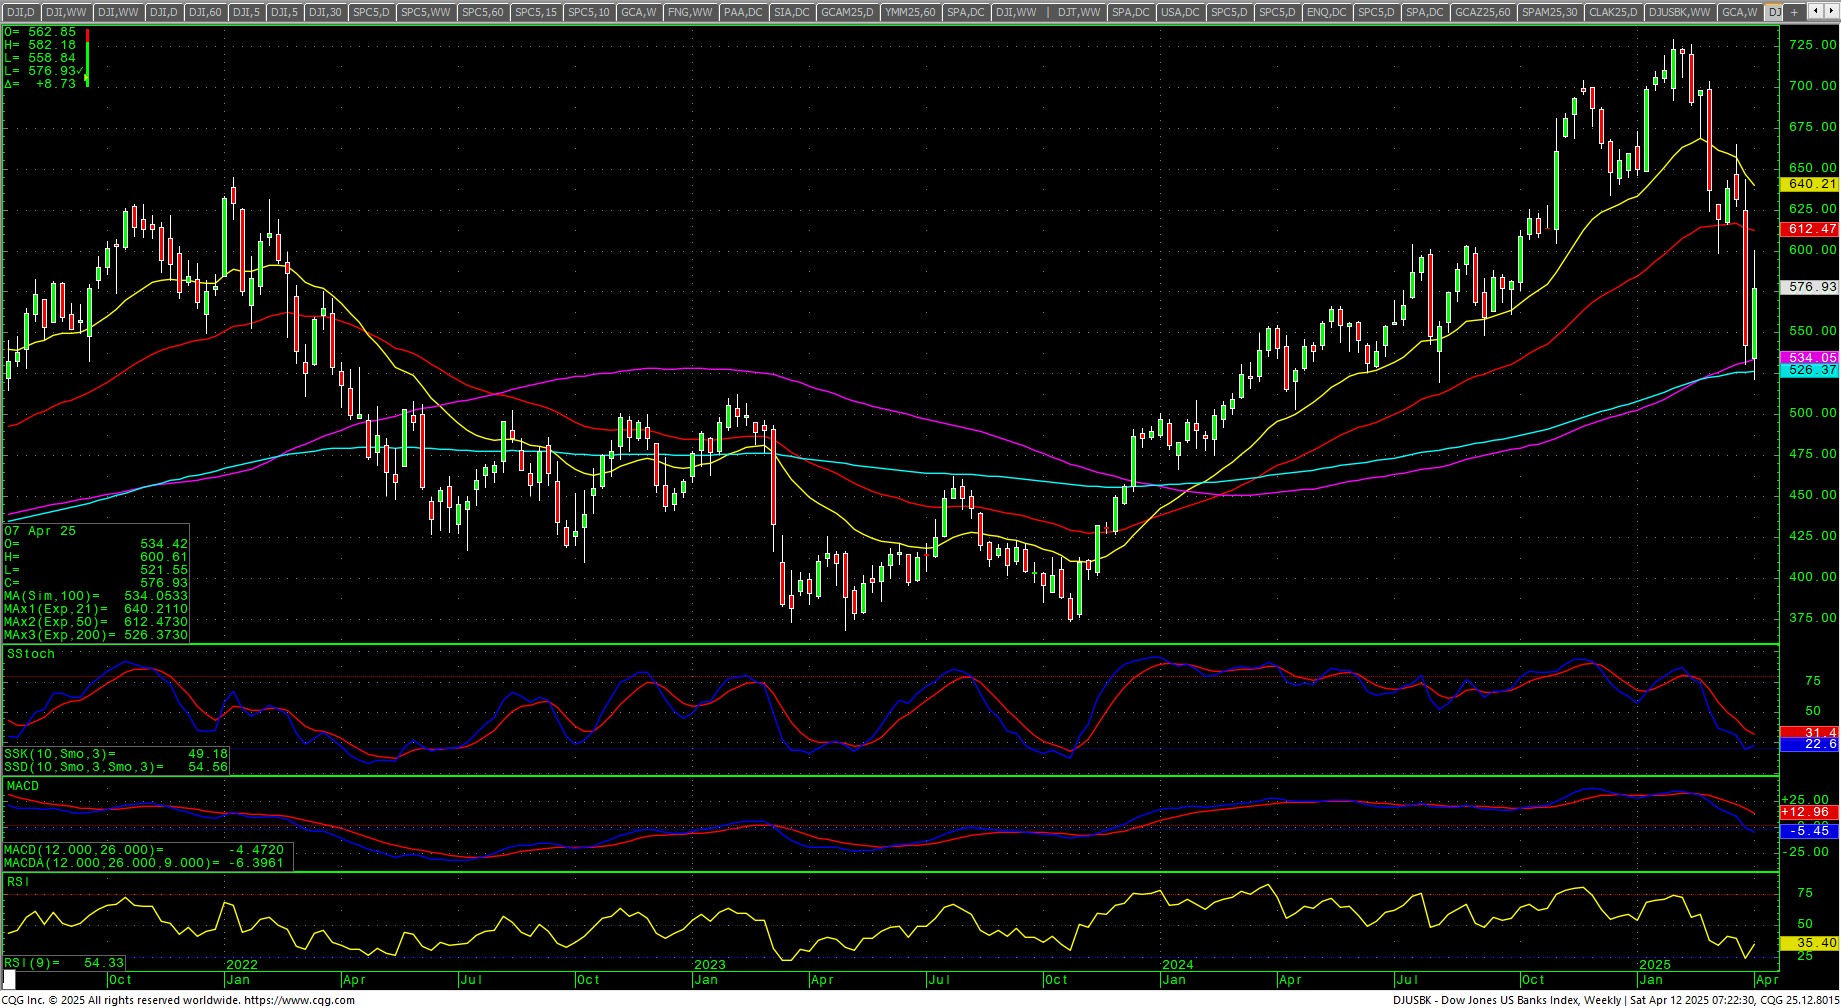
 Dow Jones US Banks Index Weekly Candles
 Where does this leave us? As I pointed out last week: ”A reminder that the month of April continues a larger window where things should remain volatile.” And then this re-print from the March Timing Update:
“Again, this current window does not end until early May and could run into mid-Summer, late July to early August. While the energy shifts a bit coming out of March, April has the potential to be much more aggressive. Conflict is a keyword, how it plays out needs to be seen. I would not rule out a Black Swan in April, something that confirms the long-term trends and takes participants by storm. The weekend of April 19-20 is key with the 21st as the next ultra critical timing point.”
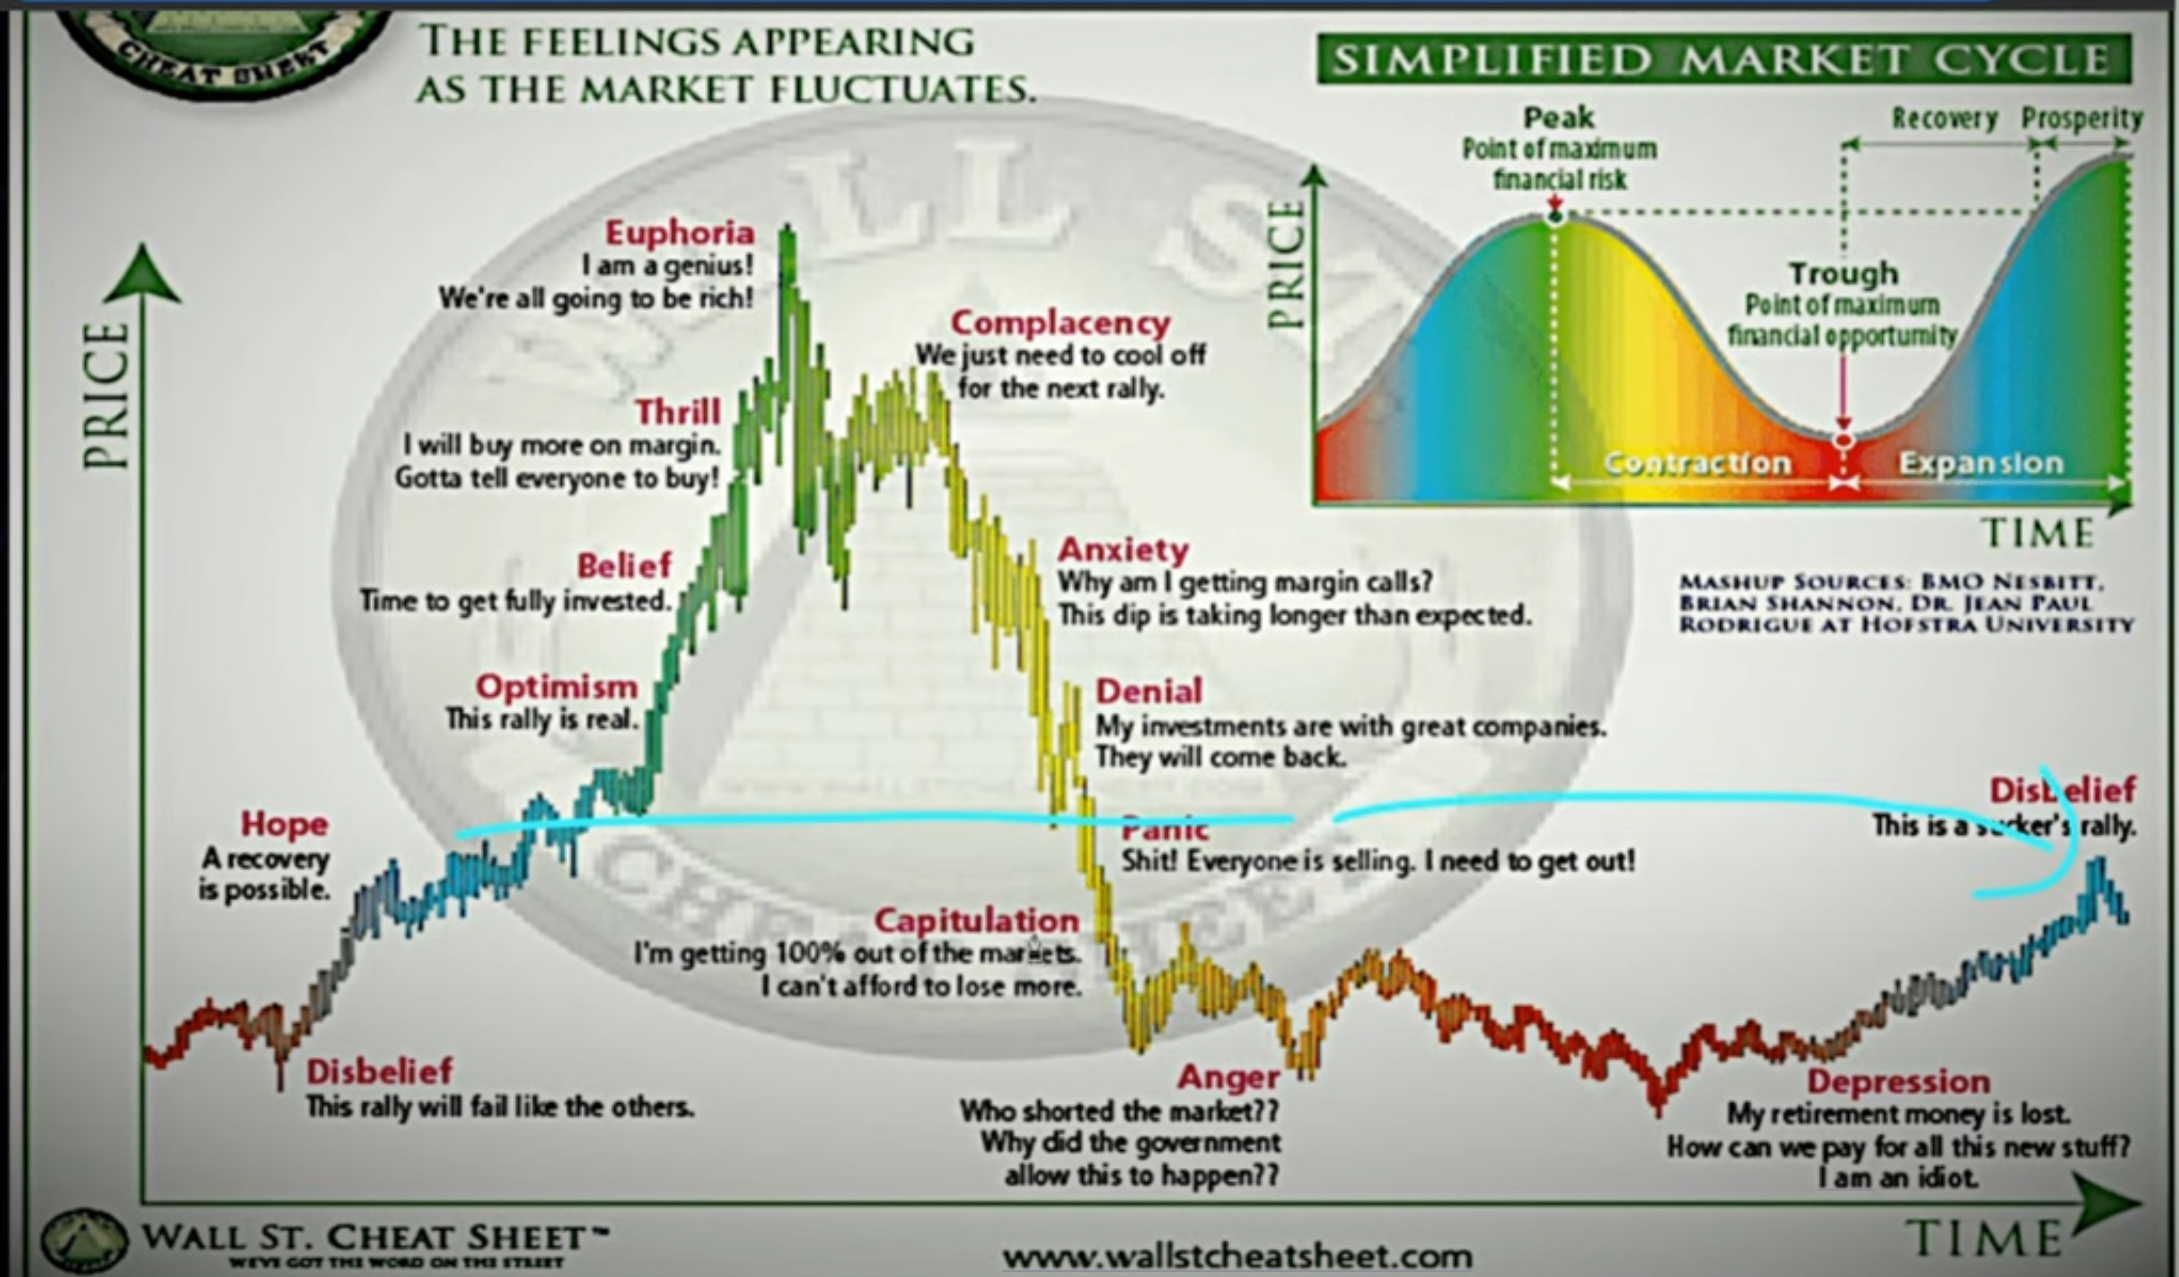
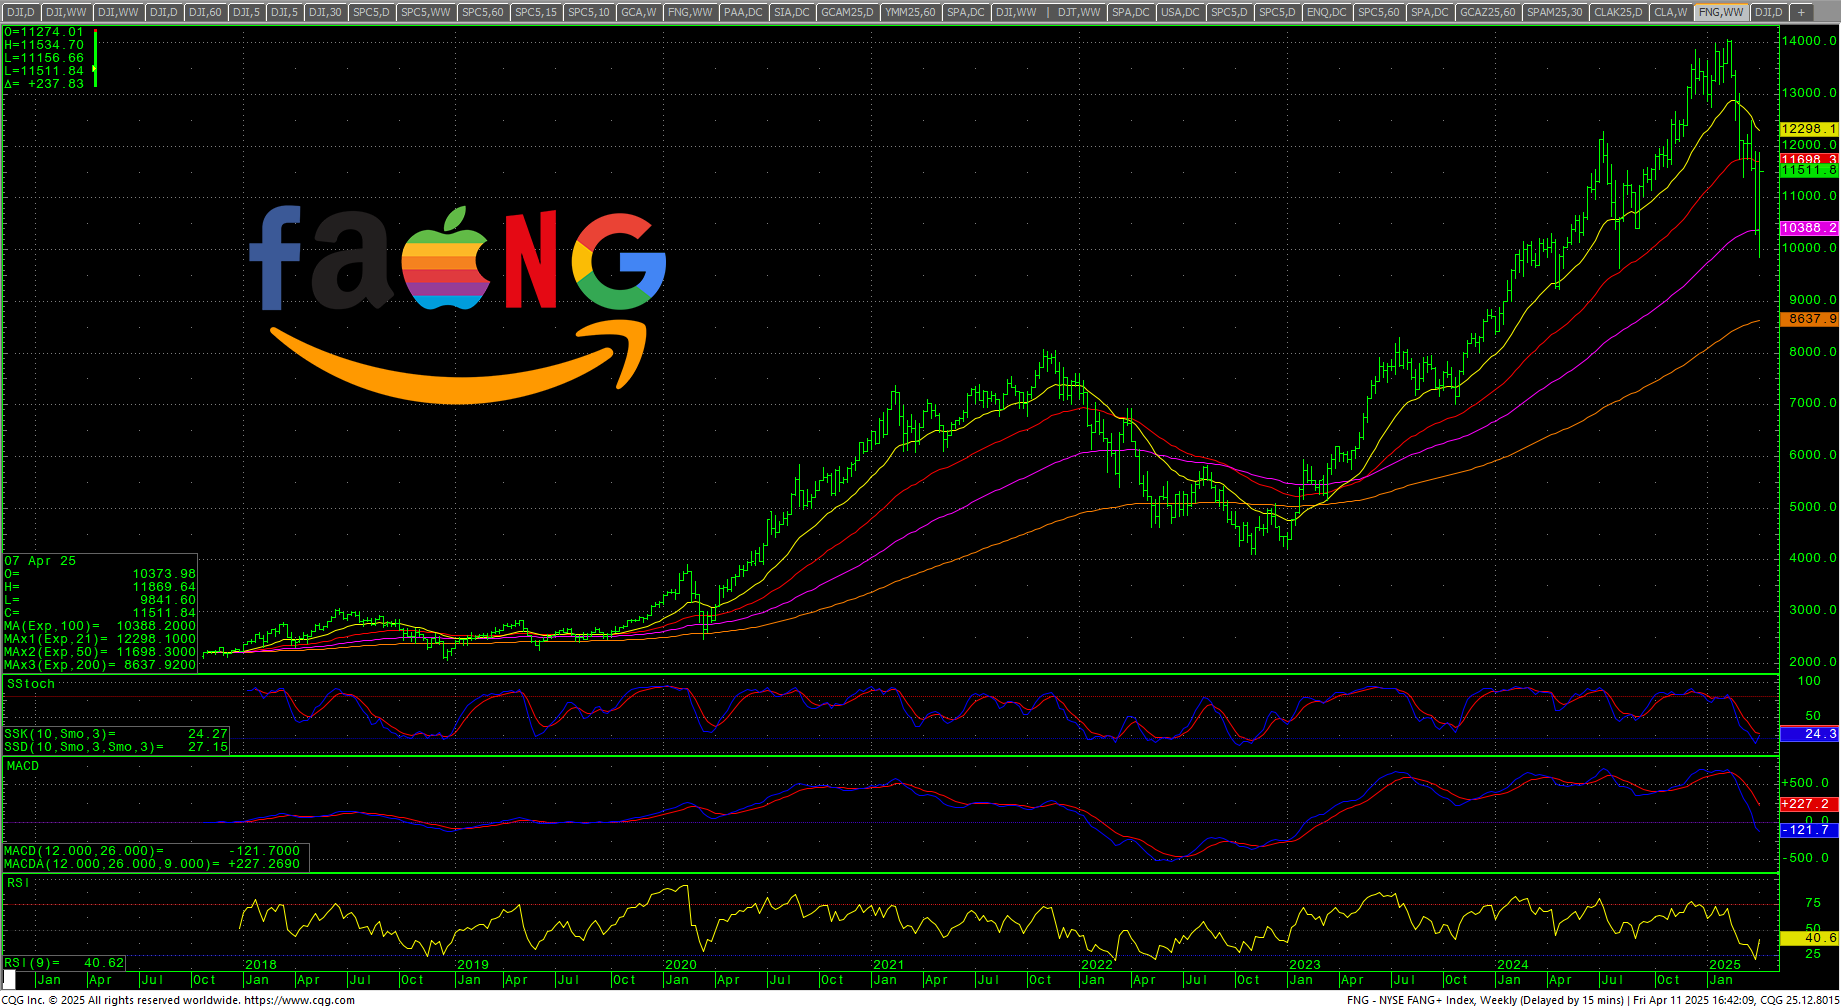
Last week’s rally lifted the FANG and the Nasdaq back above the -20% “bear market territory.” Thursday and Friday saw two days of higher lows and higher highs. From a very short-term viewpoint, that is a good technical signal. That said, with prices now congesting just under the breakdown area, intermediate-term strategy would be “Sell the RIP.” We are in the “Complacency Phase.”
 Again, back to the March Timing Update: “…we indicated that this starts a time window that runs through the early part of May 2025 and closely resembles a pattern in late 2018 where the Dow lost -19.44%. If we follow this pattern the month of March could be seriously rough sailing for the stock market.”
Dow Jones Late 2018 Window
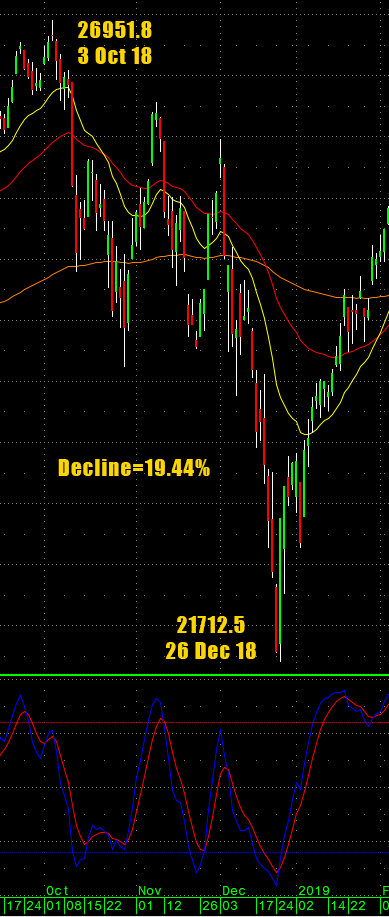 Based on this chart, we are in the November portion of this move. And, again, I do not see this ending in early May as previously thought. “While this window runs through the first week of May, it is looking more and more, from a cycles standpoint, that this will run well into Q4 2025/Q1 2026. Thus, a much more protracted and drawn-out bear and not the “flash crash” that everyone has gotten used to over the past two decades. That doesn’t mean we won’t have significant rallies, but chasing rallies is likely to be a losing strategy until this thing is spent…which very likely will not be until Q1 2026 at this point.” I would add right here that the last 10-12 days of April could be really wild…that is saying something given just the past seven sessions.
Without any clarity on tariffs, it will be difficult for anyone to make plans. As one analyst pointed out: “Capitalism runs on confidence. On predictability. On decisions made today that pay off years from now. Trump’s reckless tariff policies have shattered that foundation. CEOs can’t build new factories, because they don’t know what the tariff rate will be next month. Global companies are starting to back away from the U.S. because the rules change on a whim.”
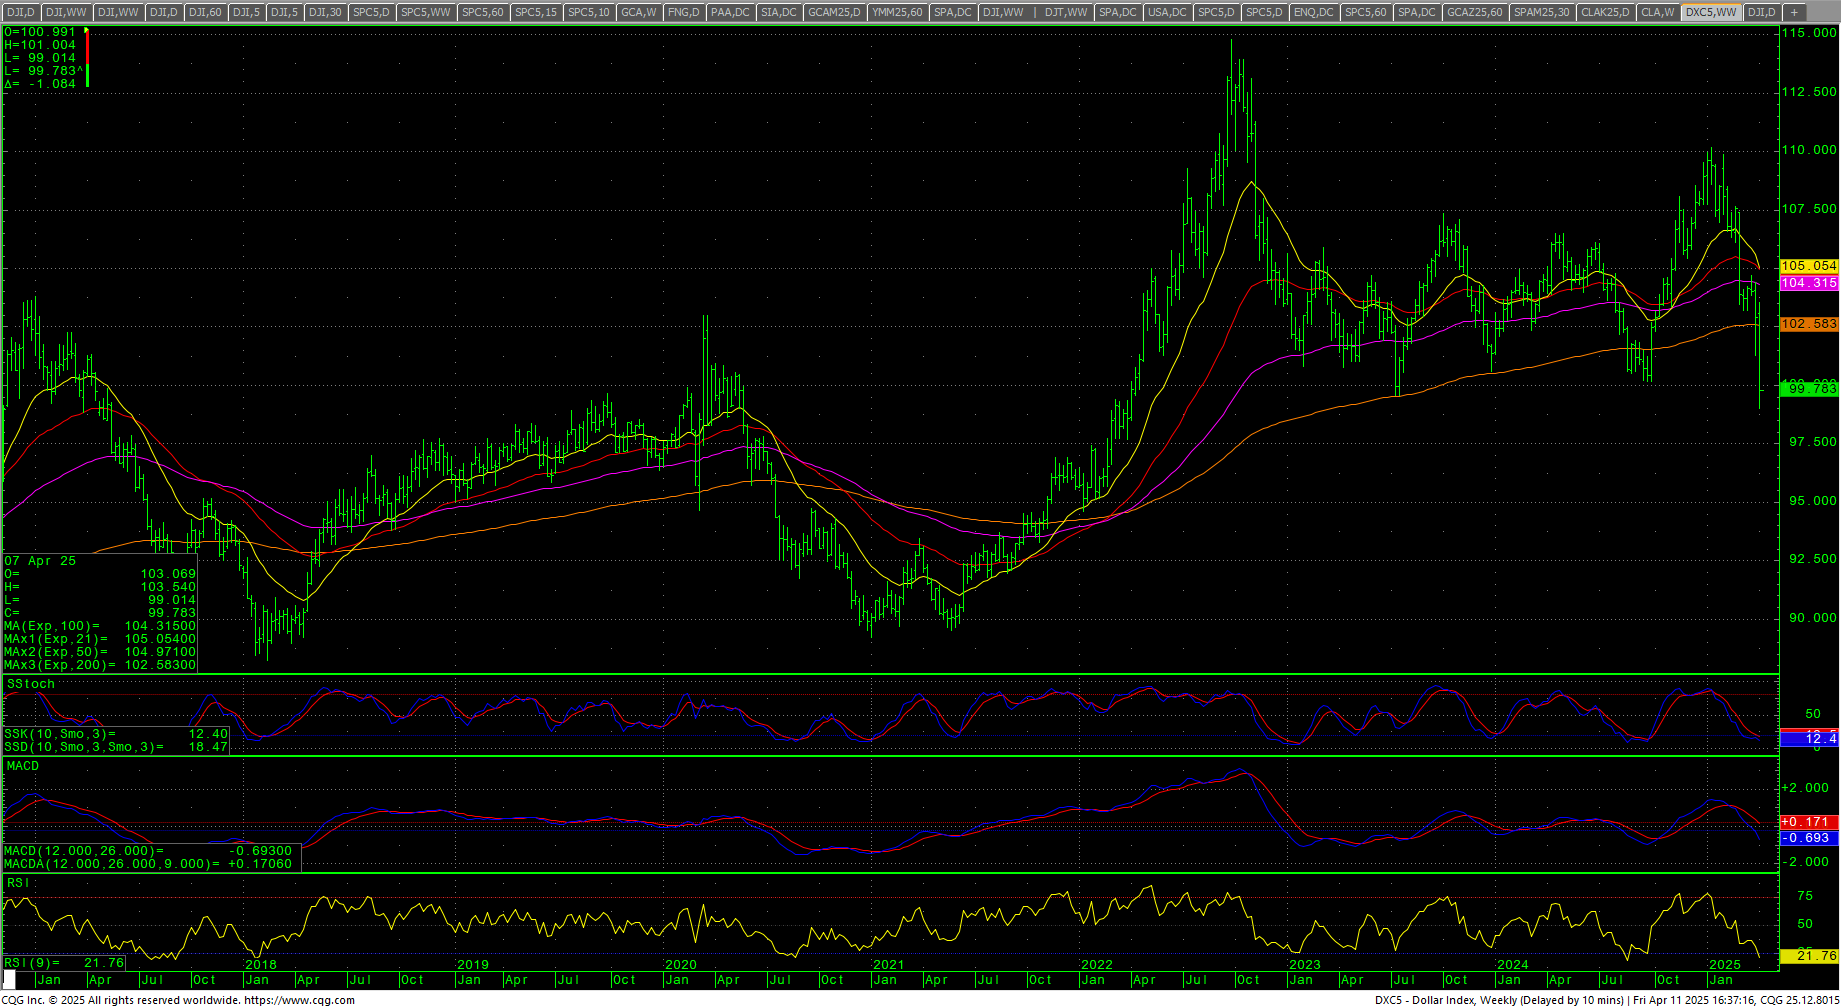
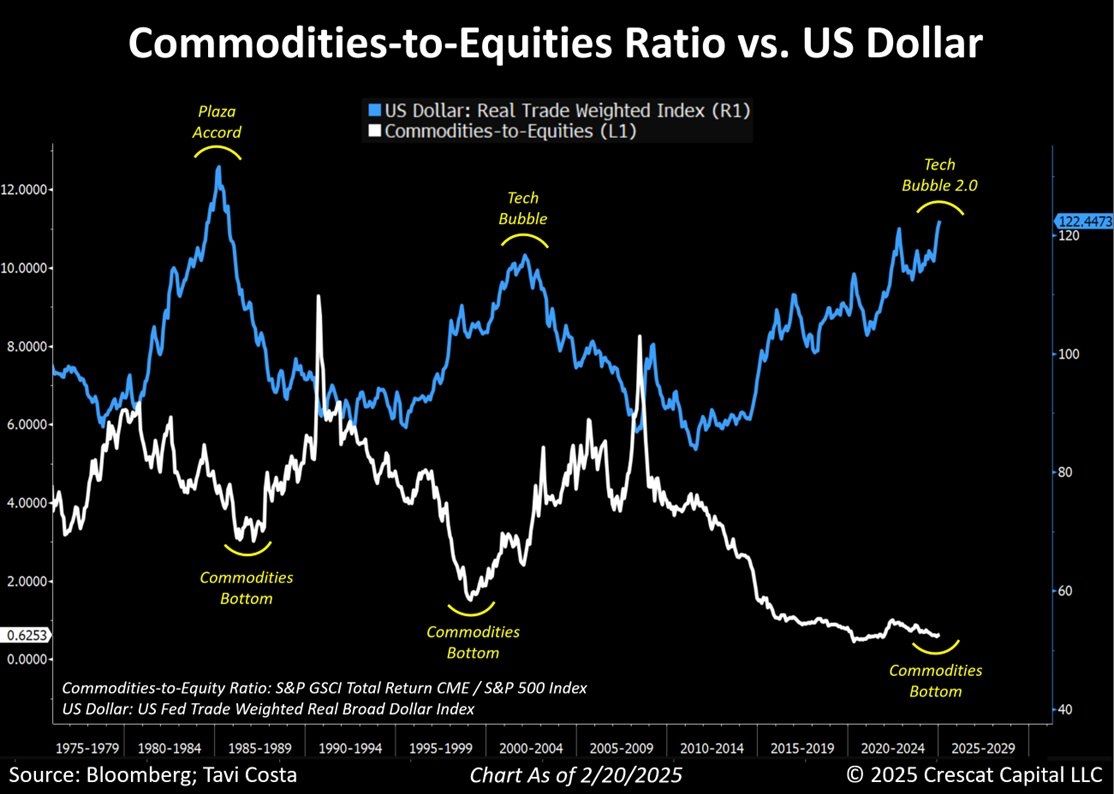 The plunging dollar is another canary in the coalmine for the overall market environment as the globe appears to be de-dollarizing as trust in the U.S. erodes. It has gotten to the point where China, Japan and South Korea have joined forces to have their own response to tariffs.
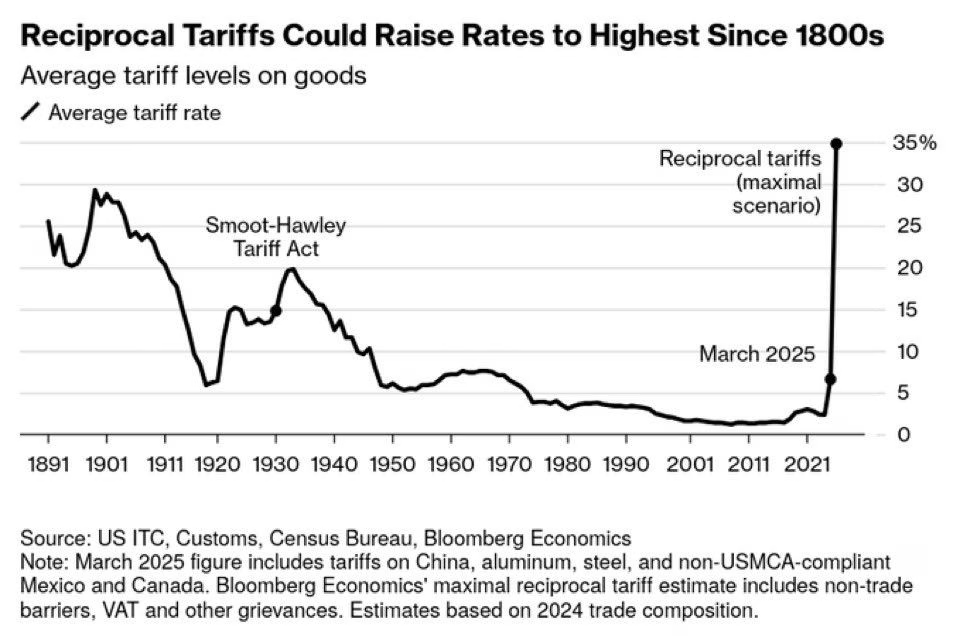 If we suddenly go back on tariffs, they put the overall rates to the highest levels since the late 1800s…since before “cars,” e.g., horse and buggy era.
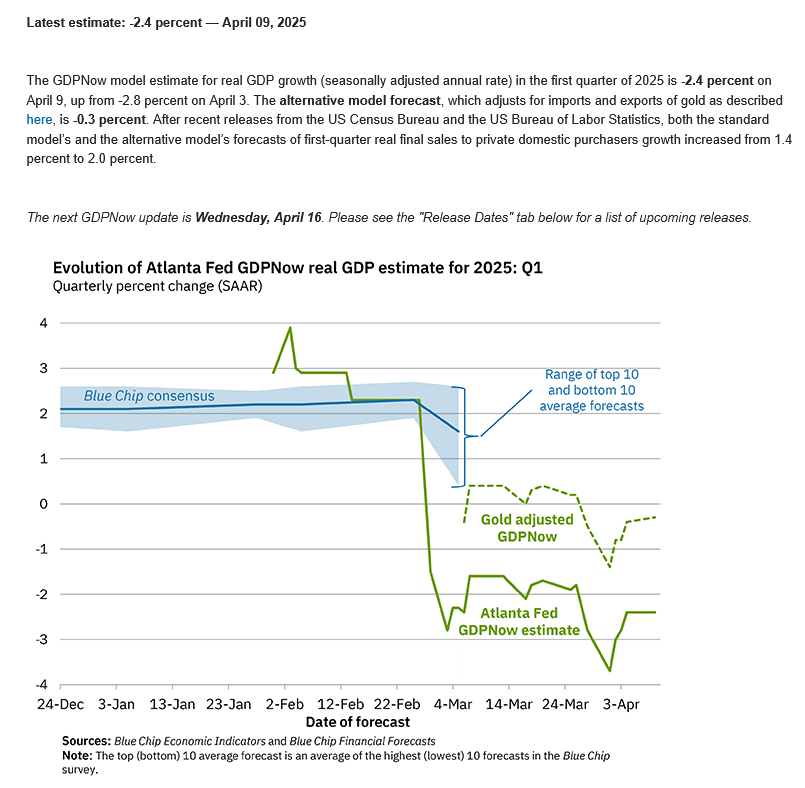 GDP isn’t released until month’s end and the data will be polluted by companies front-running the tariffs. Atlanta Fed is now predicting the Q1 to be -2.4% and -0.3% when accounting for gold imports.
“The GDPNow model estimate for real GDP growth (seasonally adjusted annual rate) in the first quarter of 2025 is -2.4 percent on April 9, up from -2.8 percent on April 3. The alternative model forecast, which adjusts for imports and exports of gold as described here, is -0.3 percent. After recent releases from the US Census Bureau and the US Bureau of Labor Statistics, both the standard model’s and the alternative model’s forecasts of first-quarter real final sales to private domestic purchasers growth increased from 1.4 percent to 2.0 percent.”—Atlanta Fed
Dow Theory
 Dow Theory still has a bearish pattern.
MAGS (Magnificent 7) Daily H-L-C
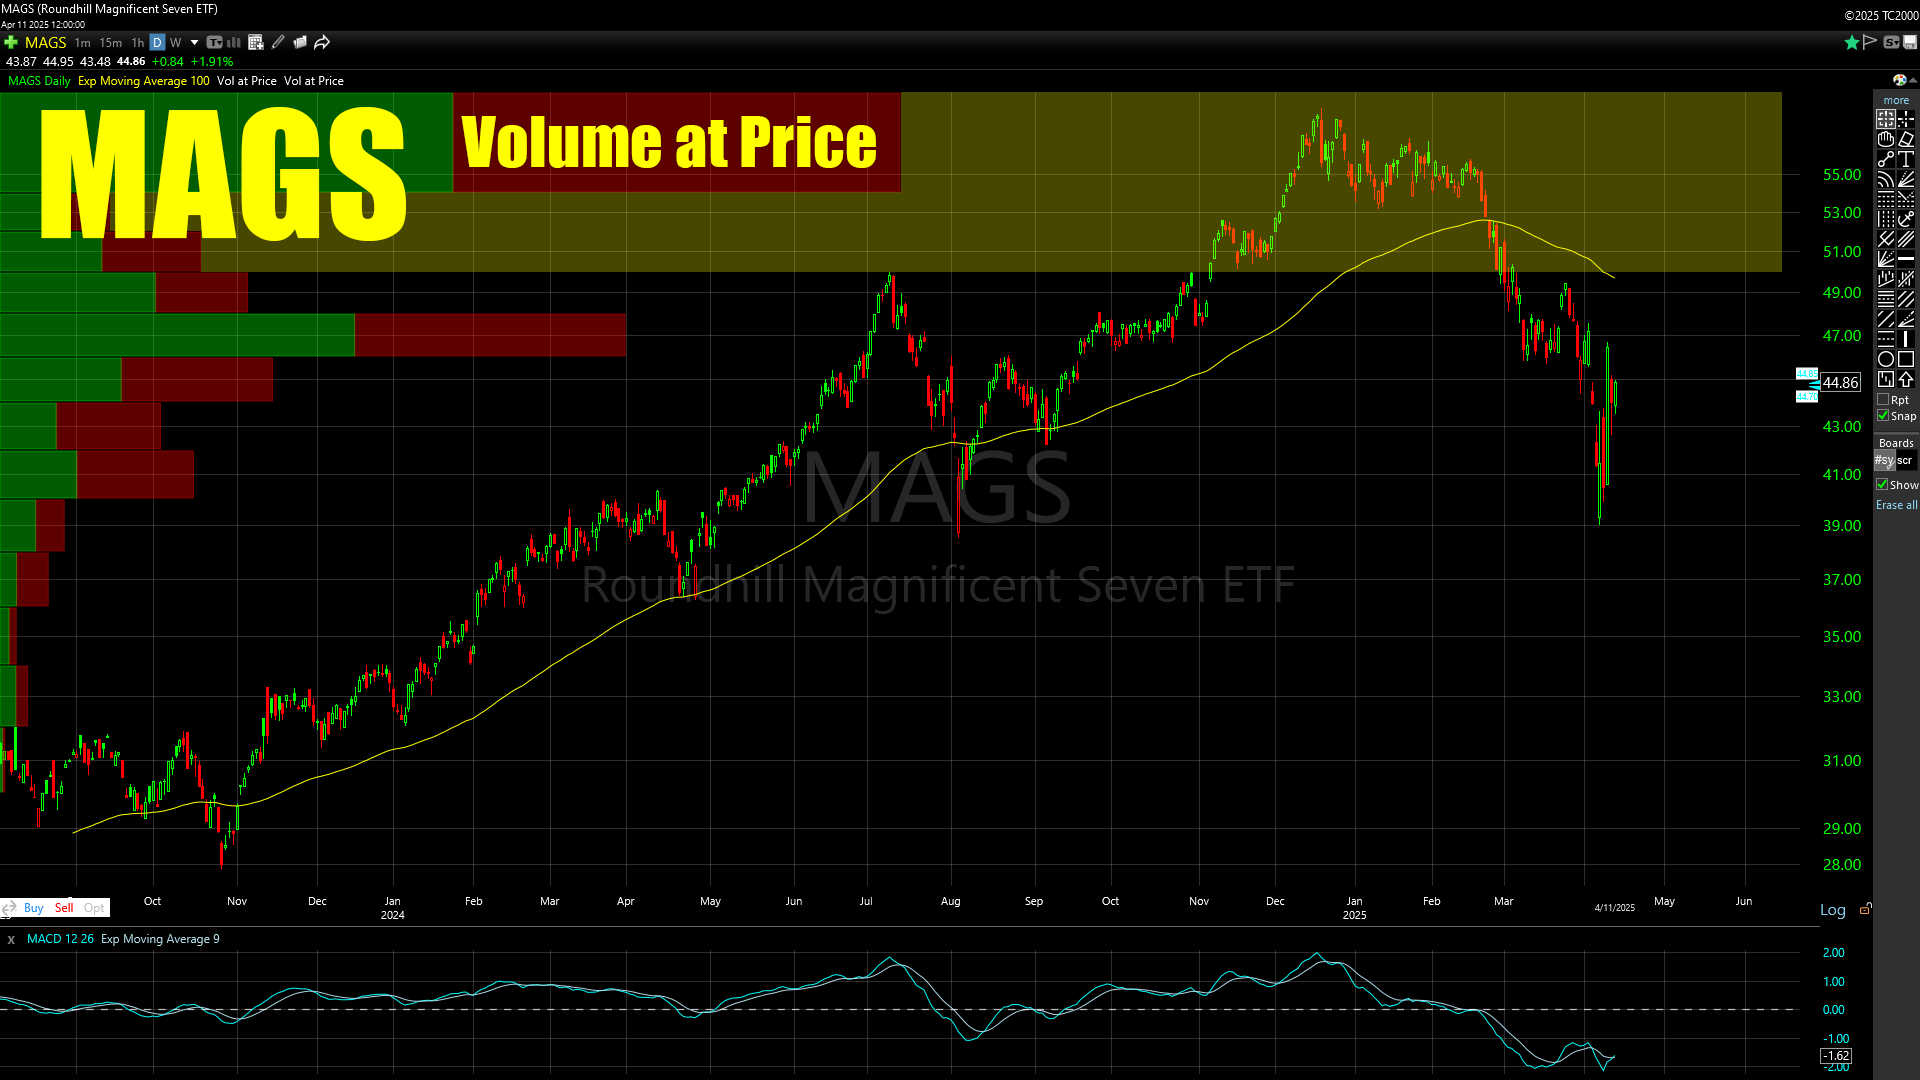 The MAGS (Magnificent 7) staged a strong reversal week and closed on the highs after testing the August 2024 “Yen Carry” mini panic low just under 39. This remains the first target area outlined in the past number of weekly letters in the 42-40 level. As the chart shows, this is one of the most top-heavy charts in history where Volume at Price is basically ALL at THE TOP. Retail has been the biggest buyers, the CashApps, the Robinhoods, etc. etc. Have we hit a major artery yet for retail? It is hard to say…but highly doubtful. Basically, the floor is the limit. If this is year 2000 all over again, the MAGS could go all the way back to where it started. Selling rallies should remain the short-term strategy until proven otherwise. Closes over 50 in the MAGS would change things.
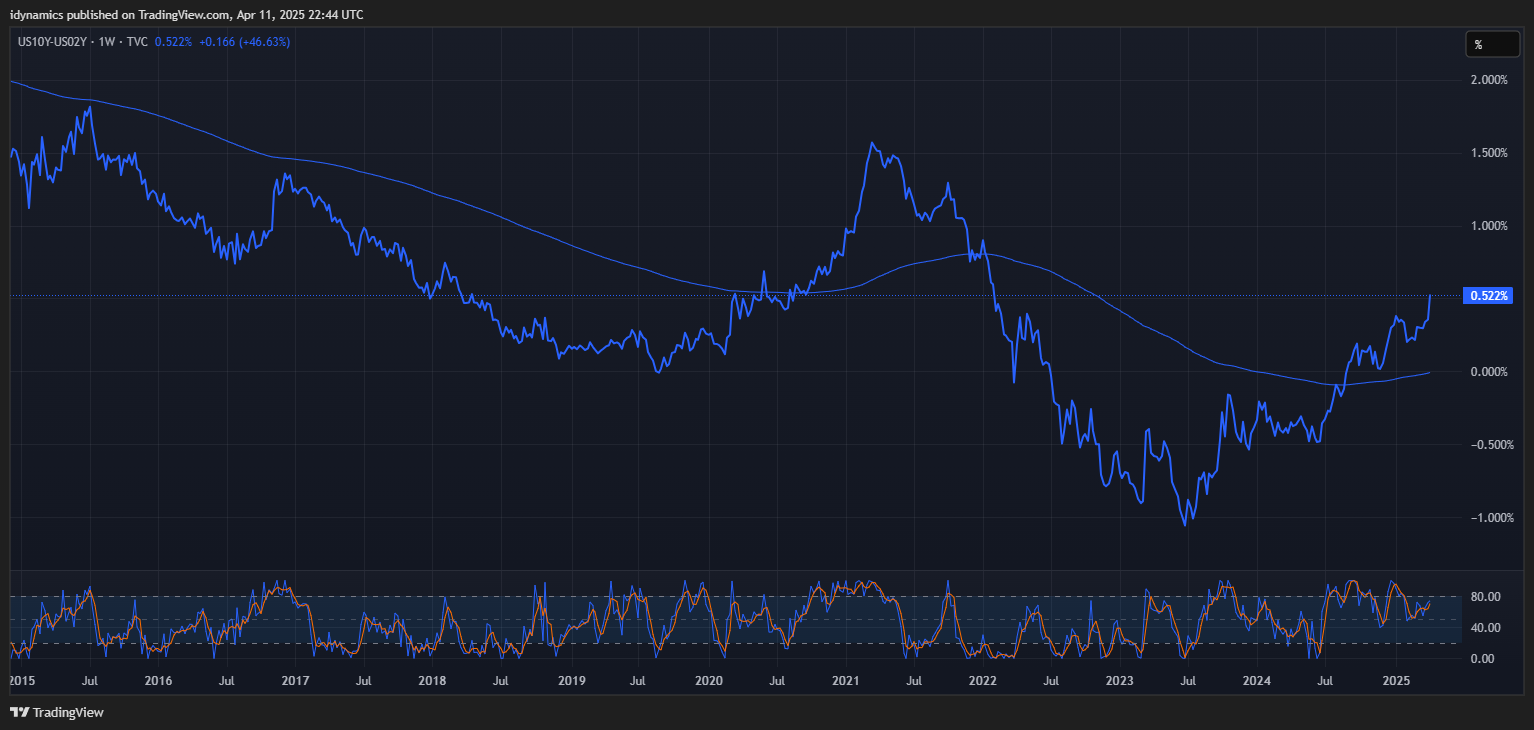
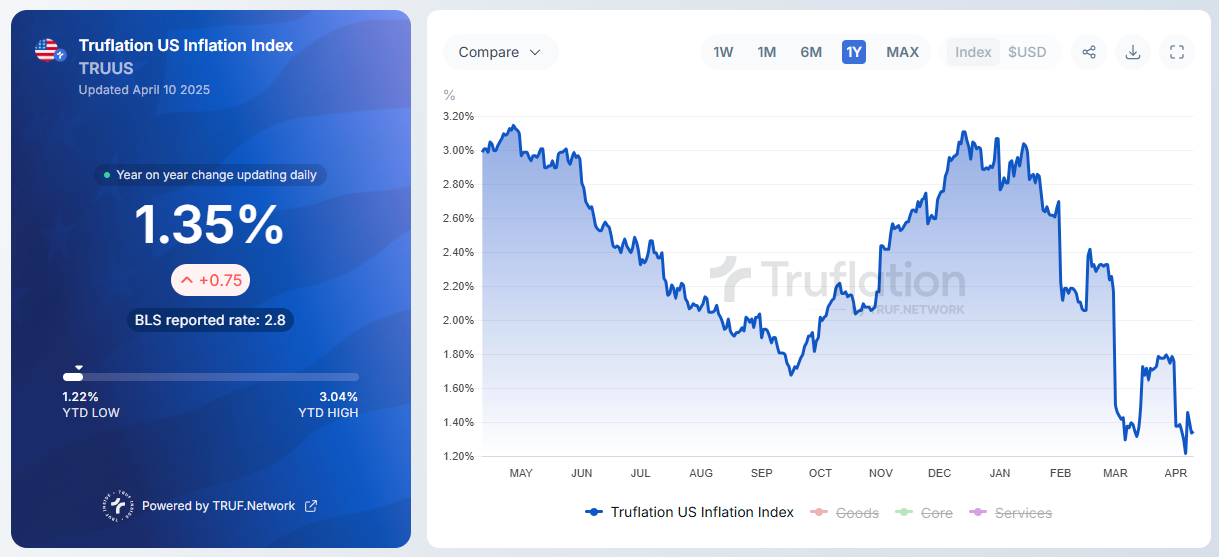
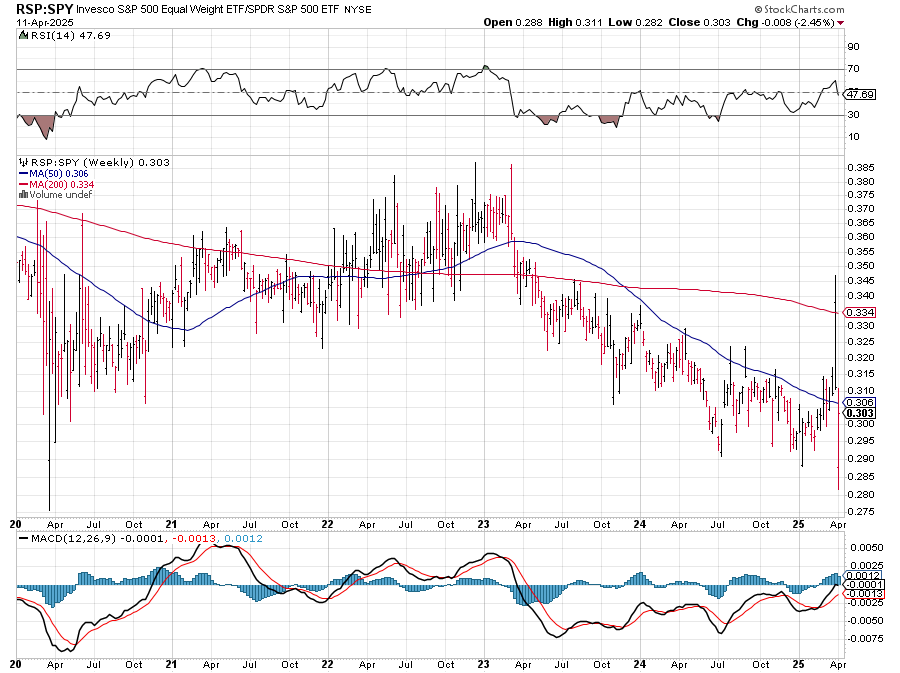
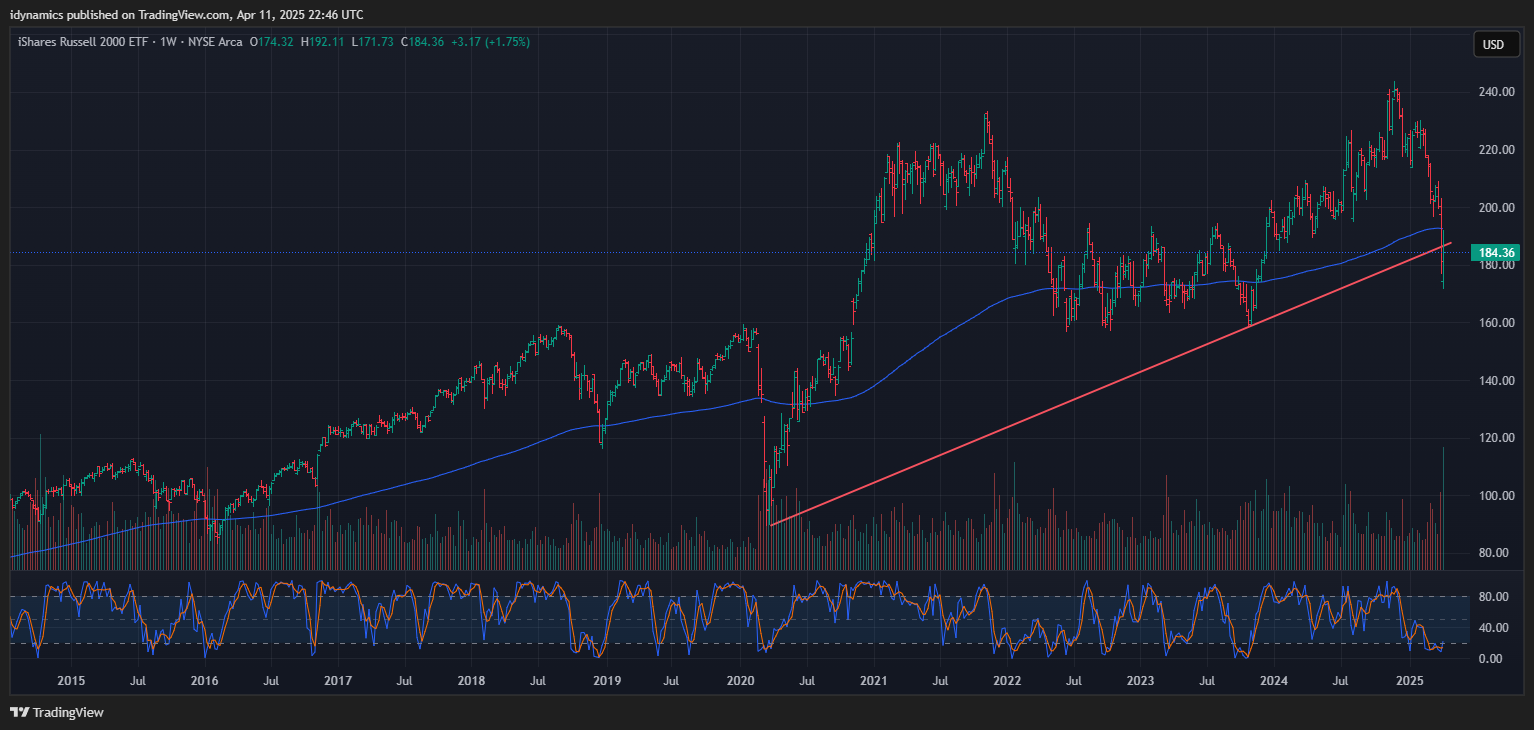
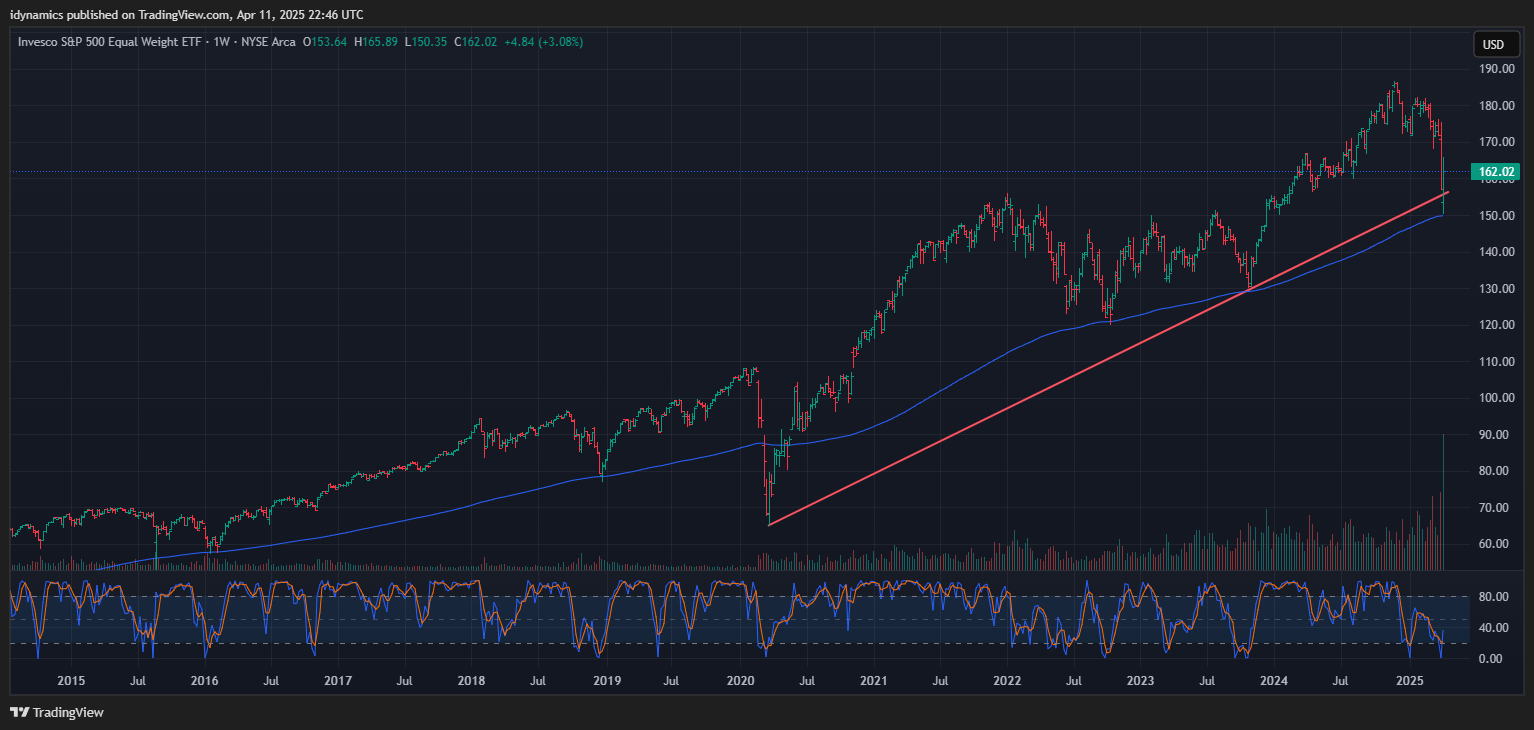
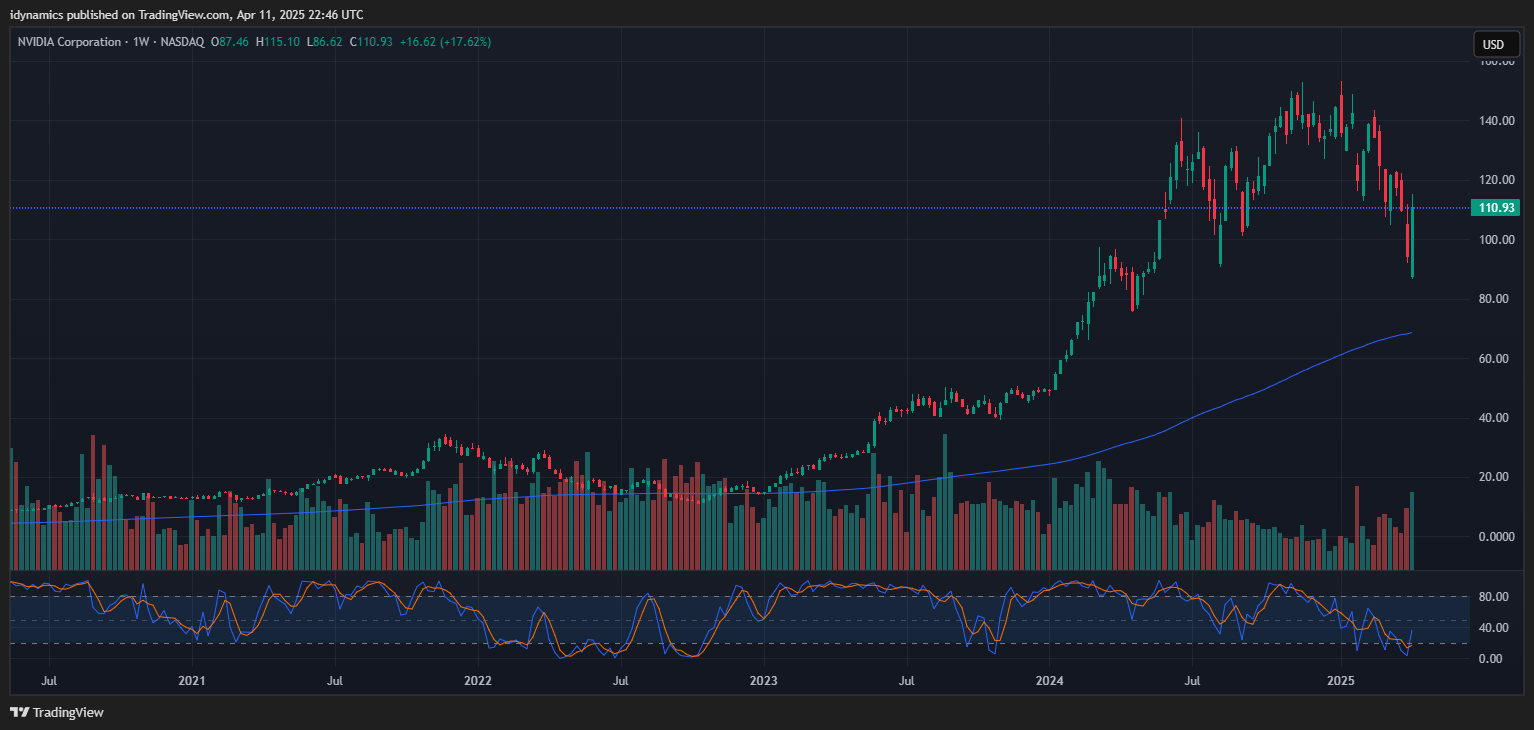
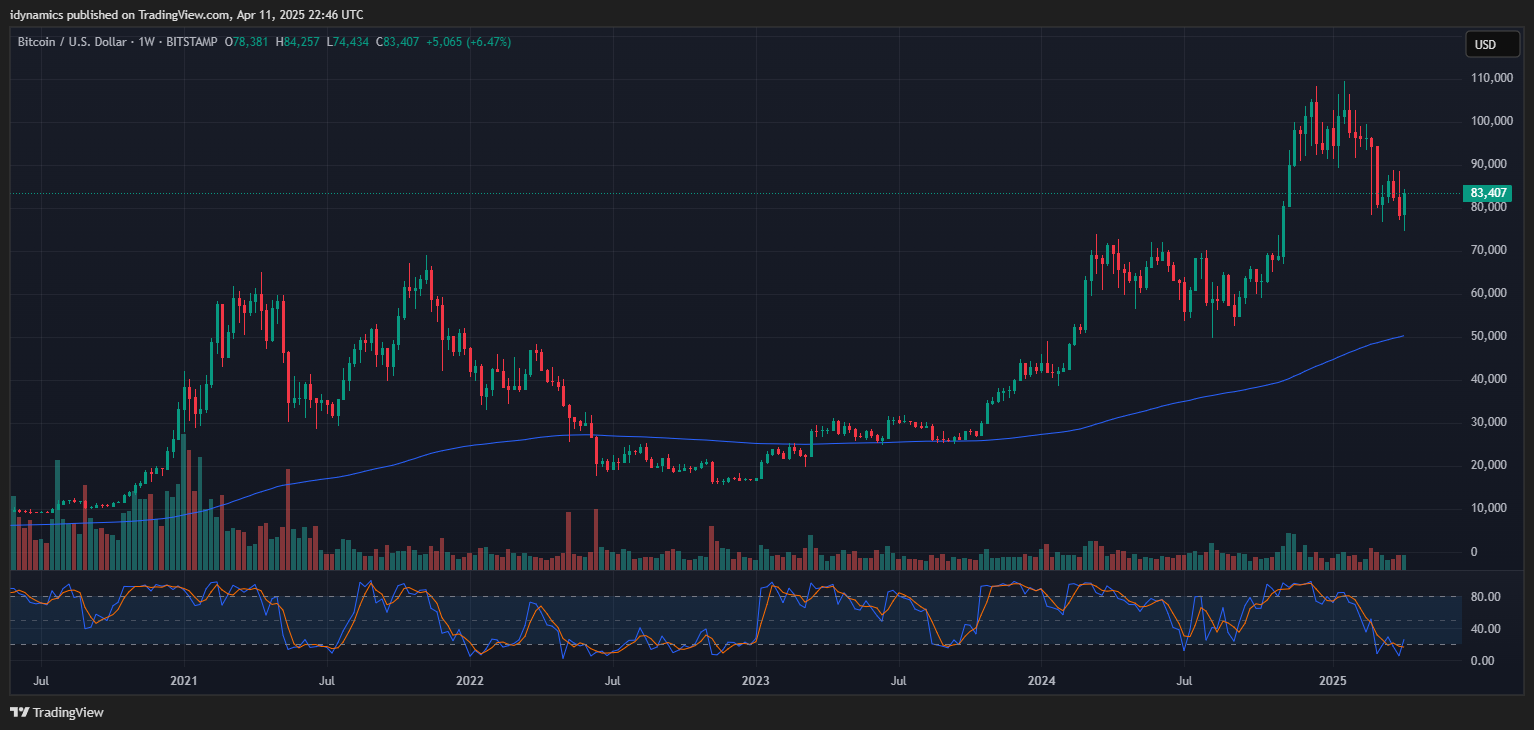
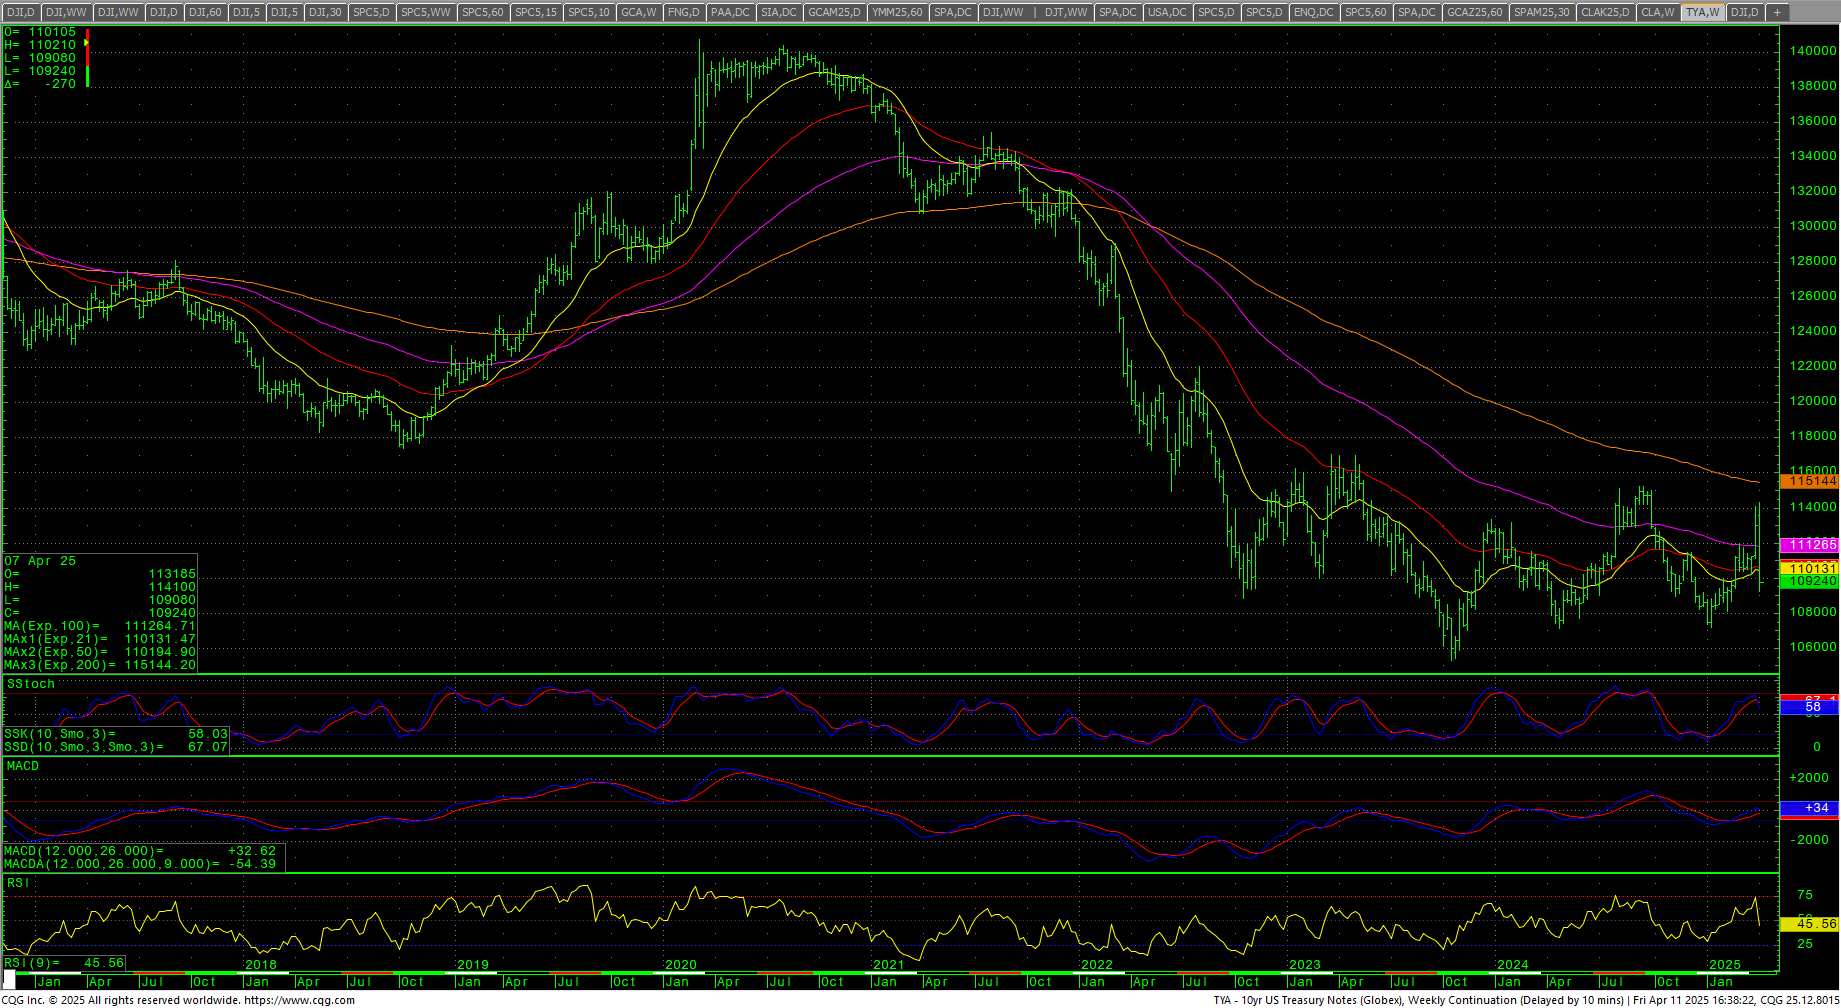
The RSP:SPY plunged to a four year low on Monday but recovered to close lower and in the top end of the weekly range. The IWM traded to the lowest levels since late 2023 before reversing and closing the week up +1.75%. The RSP took out a critical trendline from the 2020 lows through the 2023 lows and closed in the upper end of the range, +3.08% on the week. NVDA has a bullish outside week up and closed on the highs, rocketing +16.62% on the week. Bitcoin set a new swing low for the decline mid week but recovered to the weekly high for a reversal of +6.16%. McClellan Oscillators are all over the place with the manic trade in the Dow. The Yield Curve expanded sharply and set new highs for the move at 0.522%. The 10YR yield yo-yoed from 3.89% to near 4.6% and closed out the week at 4.497%. Truflation was neutral at 1.35%.
10YR-2YR Yield Curve Daily

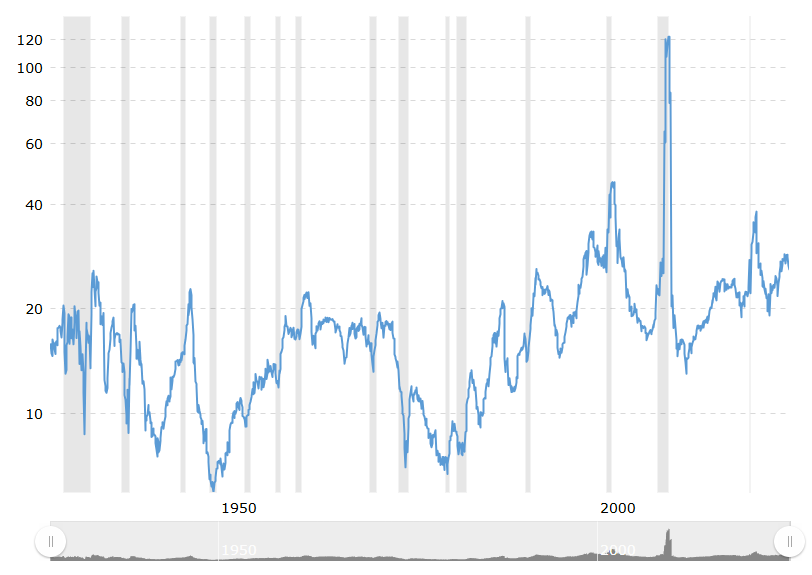
 VIX Weekly H-L-C
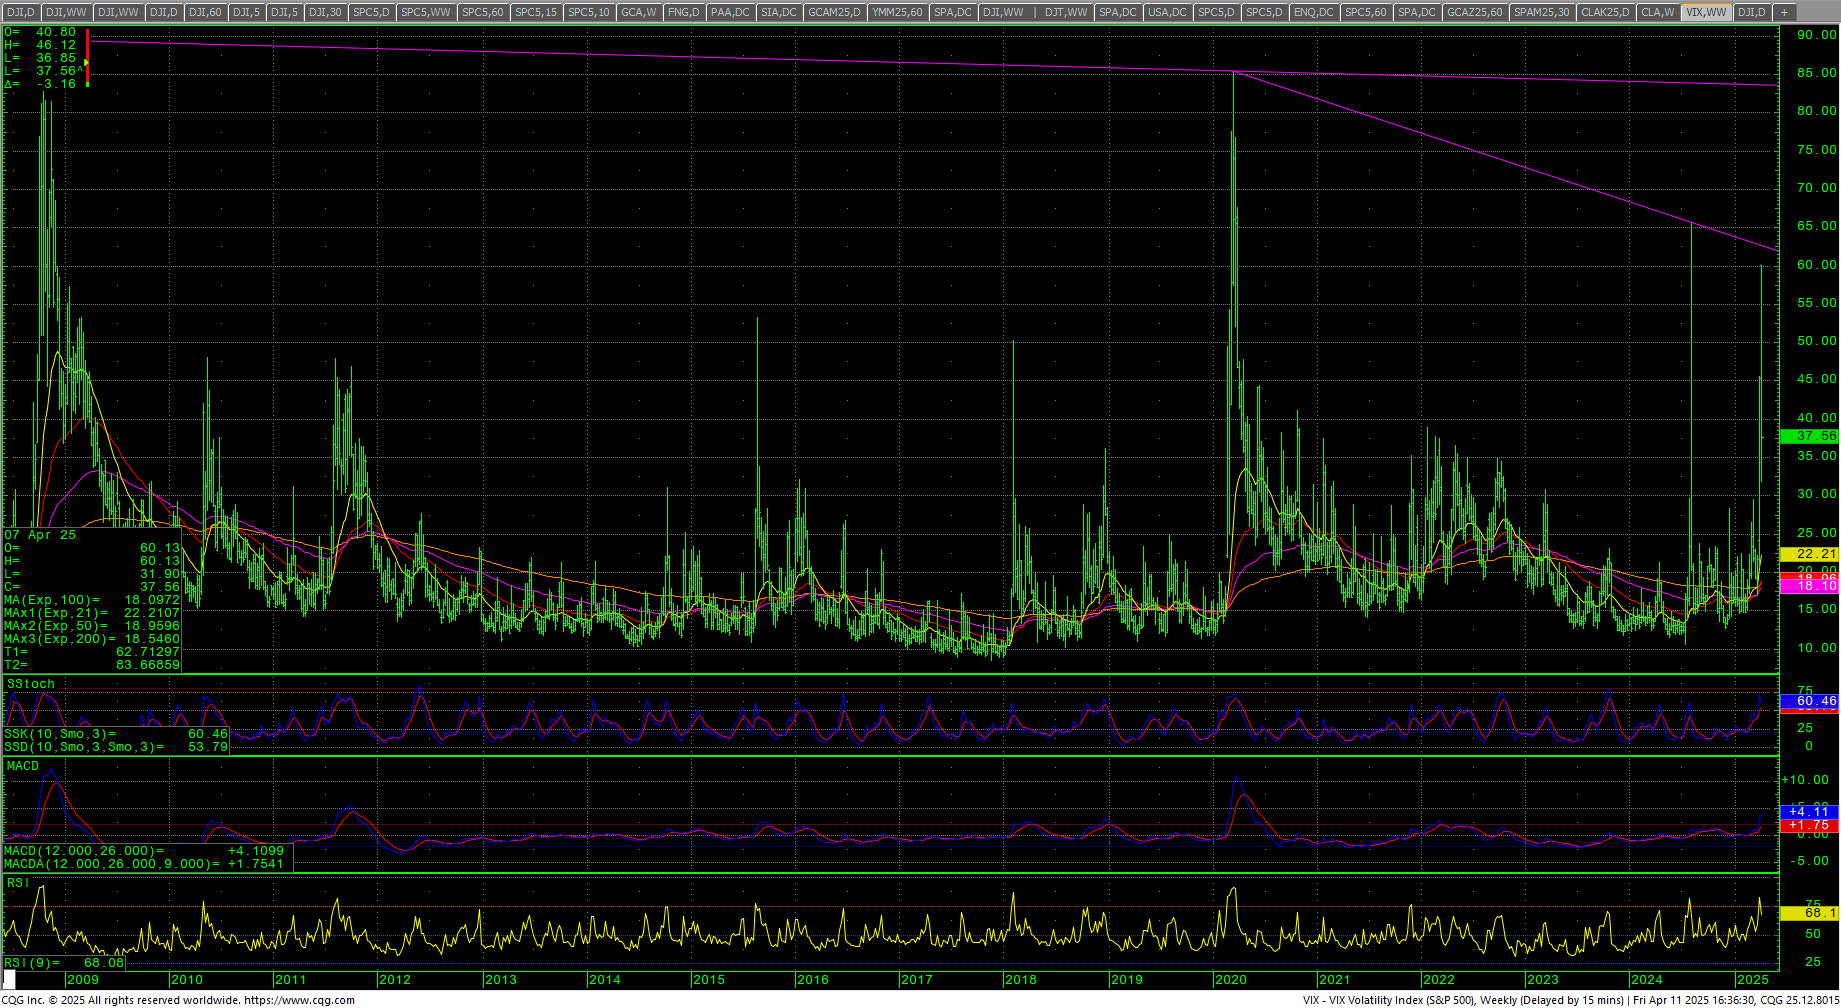
The VIX exploded to over 60 on Monday and then spent the week in whipsaw mode before ending back under the 40 level. The US Dollar plunged to the lowest level since 14 April 2022 and closed in the lower half of the weekly range, under the 100 level and the lowest daily close since 13 July 2023 and is now seriously threatening the trading range of the past few years.
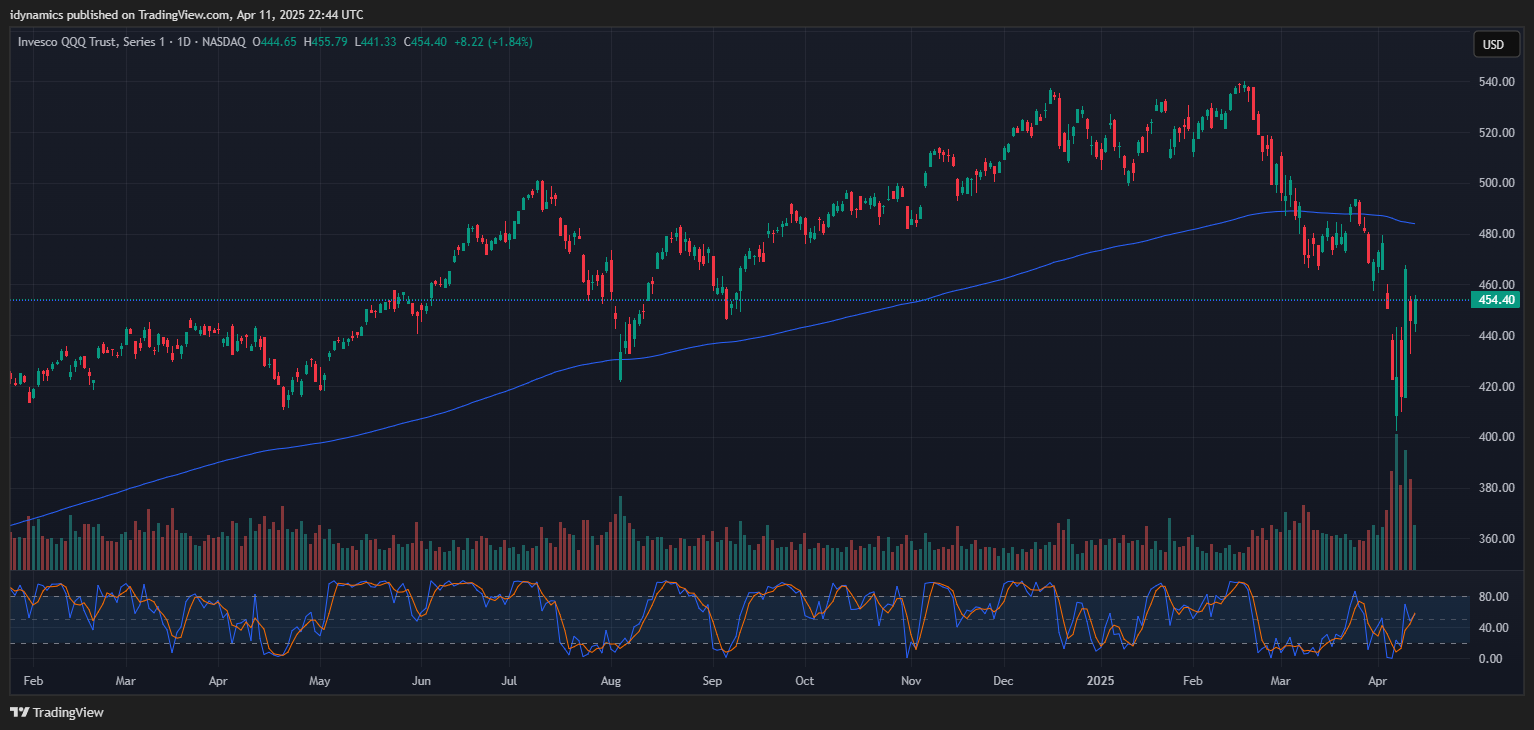
 QQQ Daily Candles
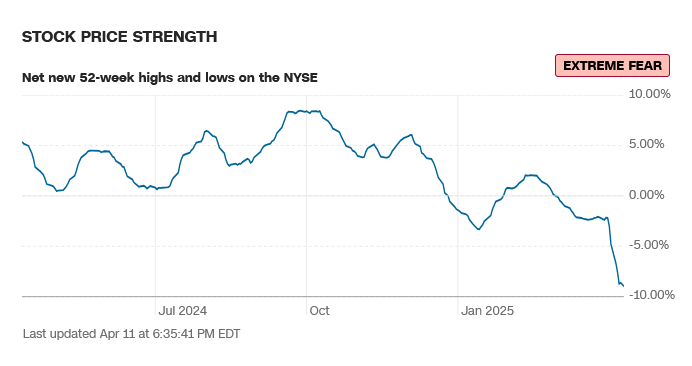
52-Week A/D Line
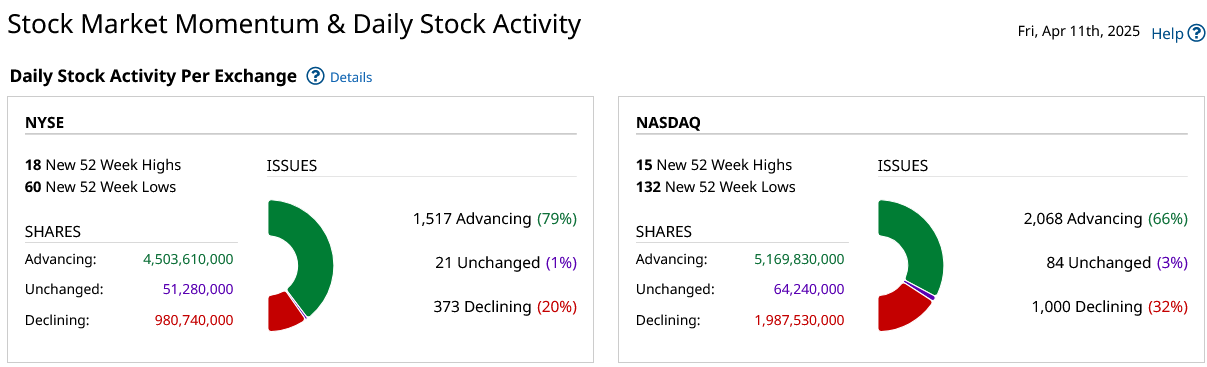
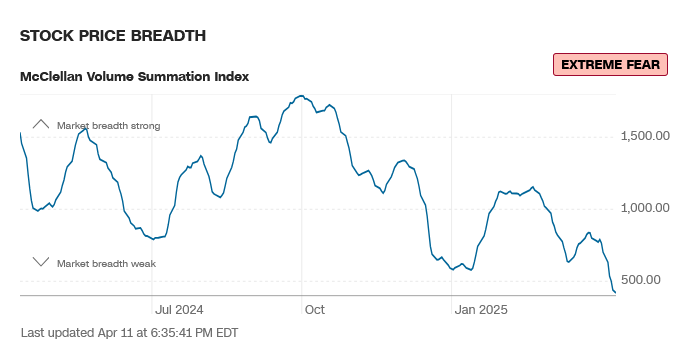
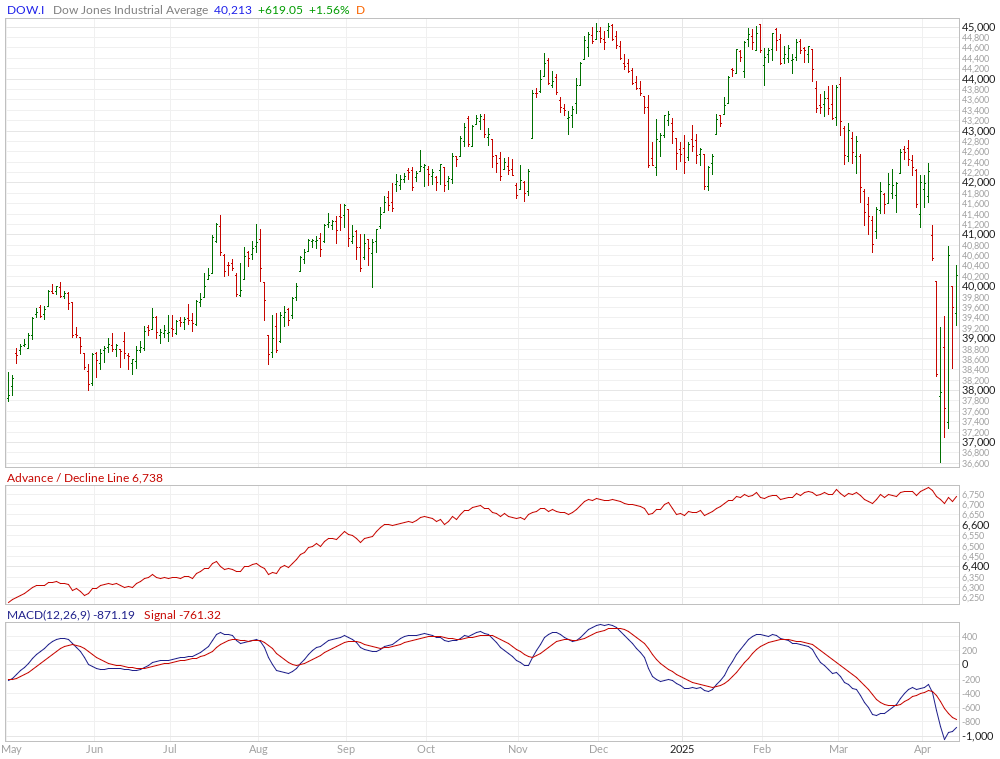
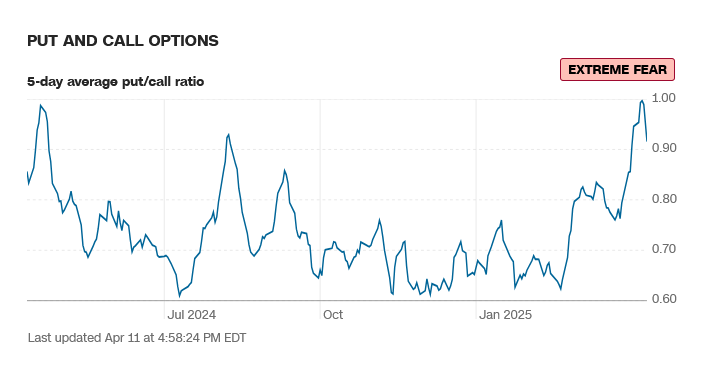
Breadth was strong on Friday but weak overall and sentiment remains in extreme fear.
CNN Fear & Greed Index
 AAII Investor Sentiment Survey
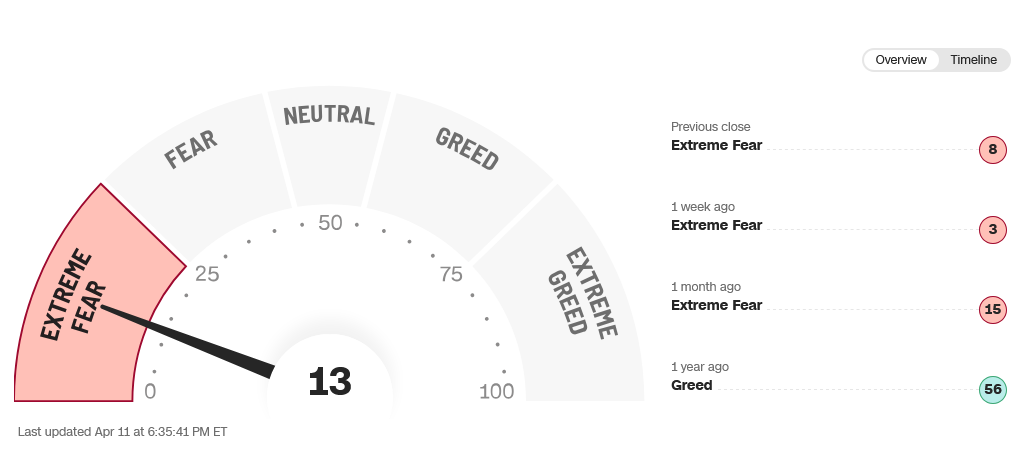
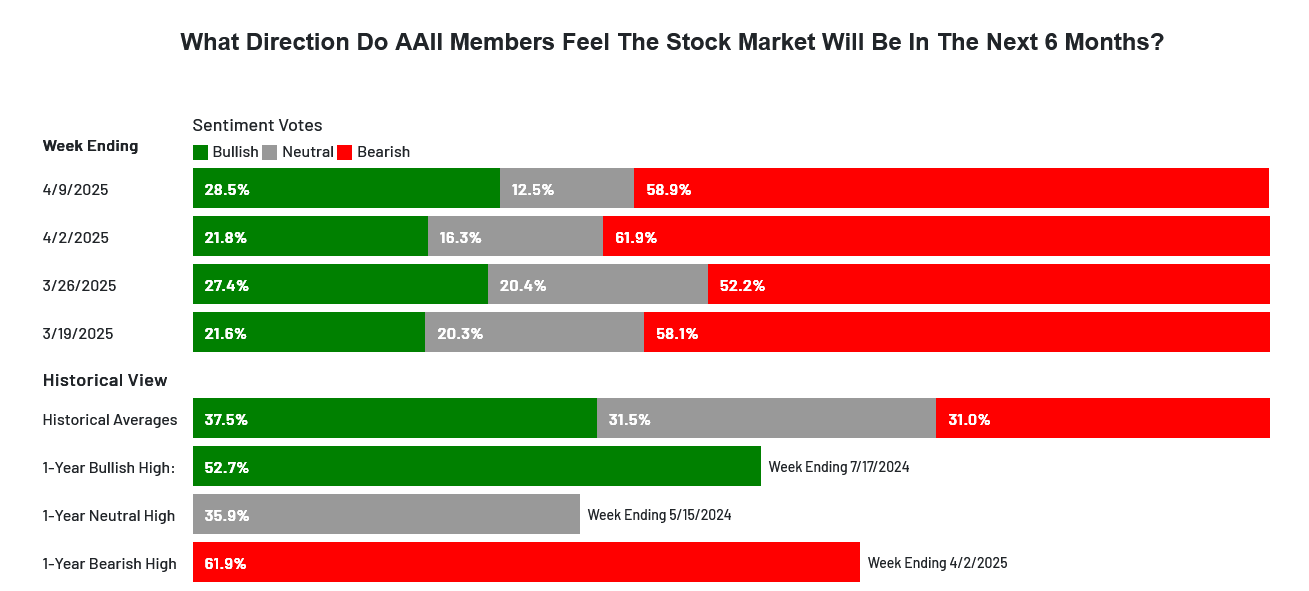 Sentiment remains in fear and extreme fear. The CNN Fear and Greed Index moved up to 13 on Friday and reads extreme fear. Breadth was weak overall and reads extreme fear. Latest AAII Sentiment Survey: Optimism Bumps Up. The Dow A/D ended at 6738, the MACD is oversold. The VIX exploded but tailed off late to end under 40, down -17.10% on the week. The Put/Call ended at 0.93 and reads extreme fear. The 52-week, A/D plunged to -8.62% and reads extreme fear. The Dow closed the week up +4.95%, closing on the top of a massive reversal range. The S&P was up +5.70% on the top of the reversal range. The Nasdaq Composite soared +7.29% and the Nasdaq 100 was up +7.43%. The FANG exploded, leading the way higher, settling up +10.97%, gaining back all of the previous weeks losses. The Russell was up +1.82% in an upside reversal. The 10-year notes staged a wide outside week down and closed on the low of the week’s range. The yield on the 10YR soared to 4.497%.
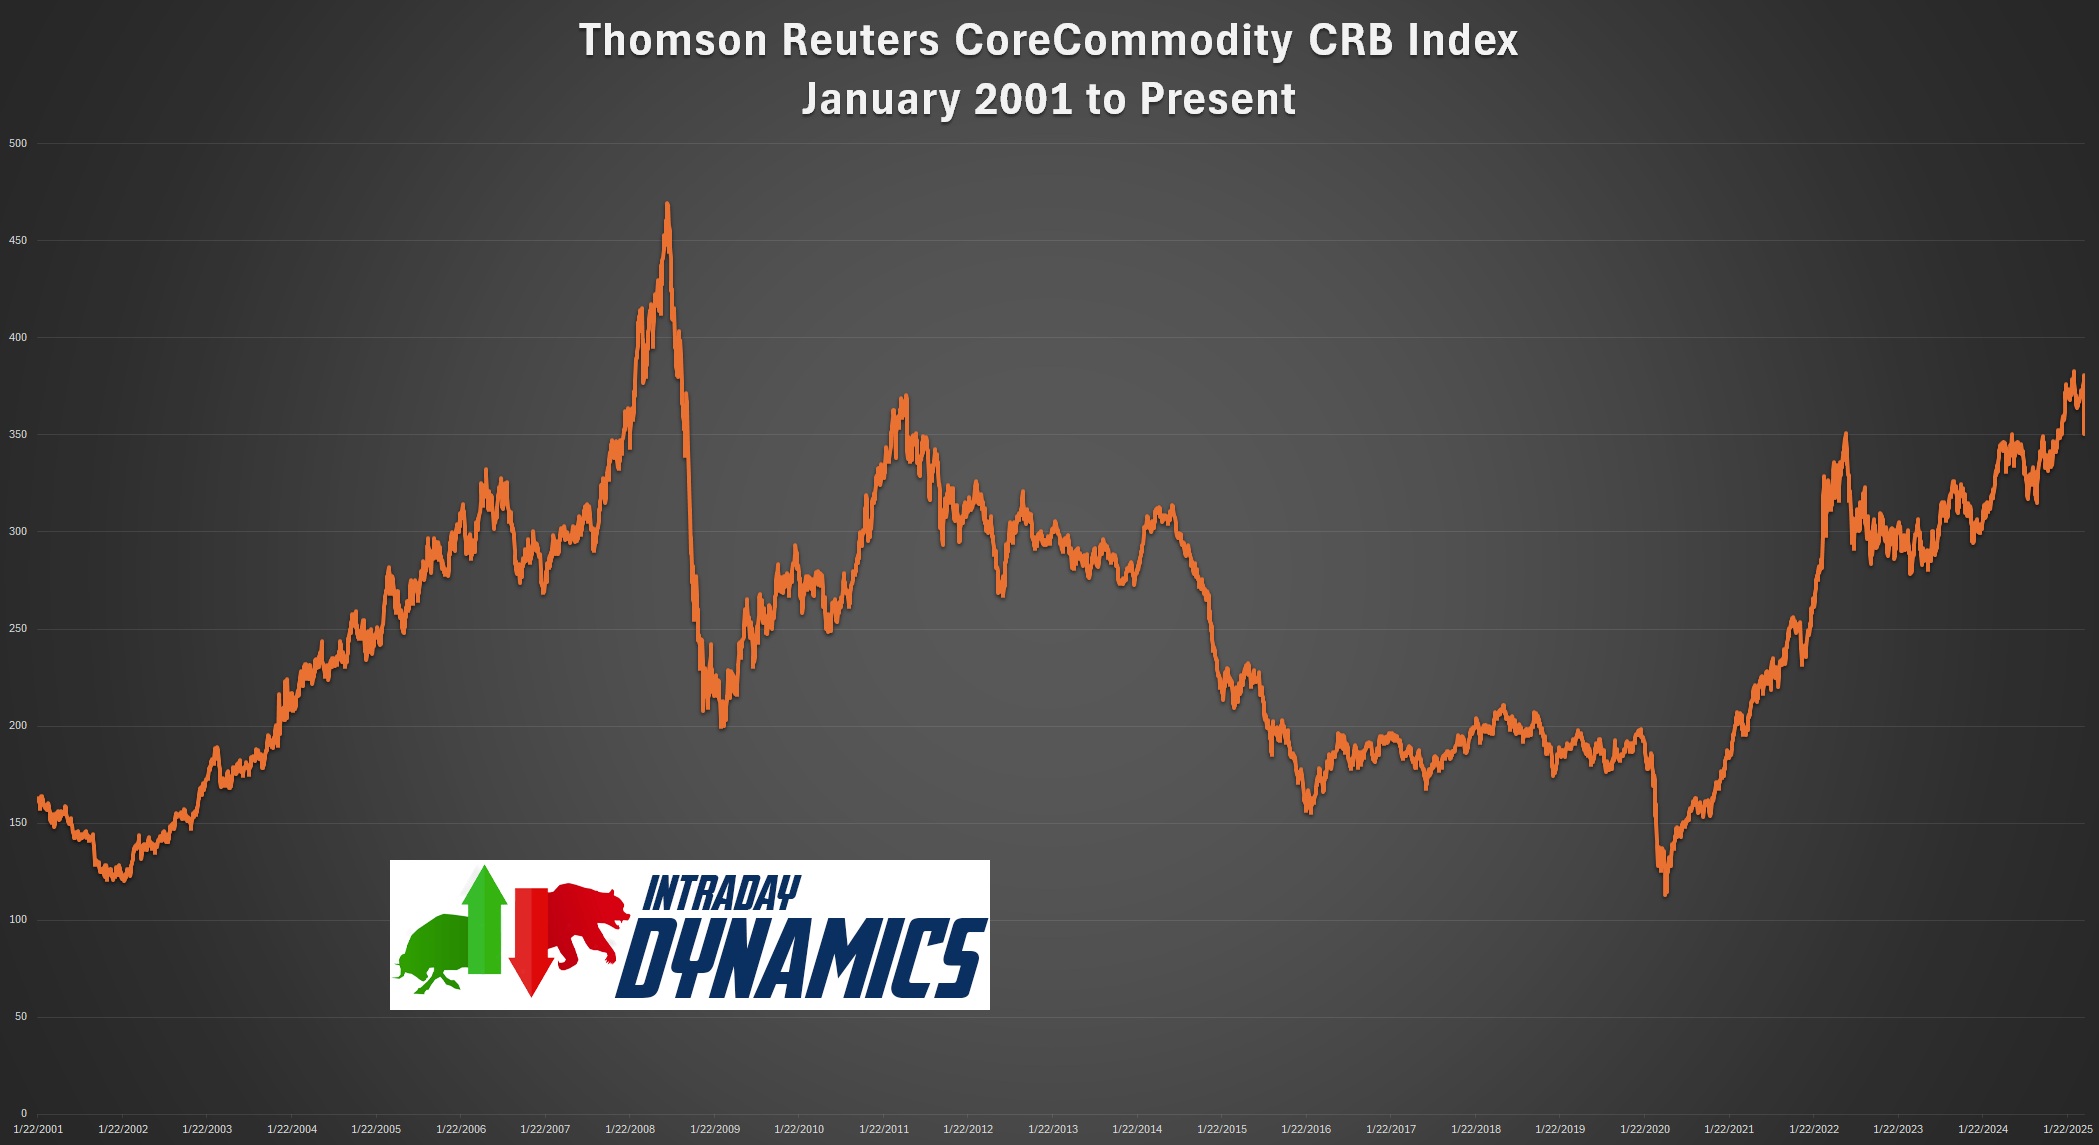
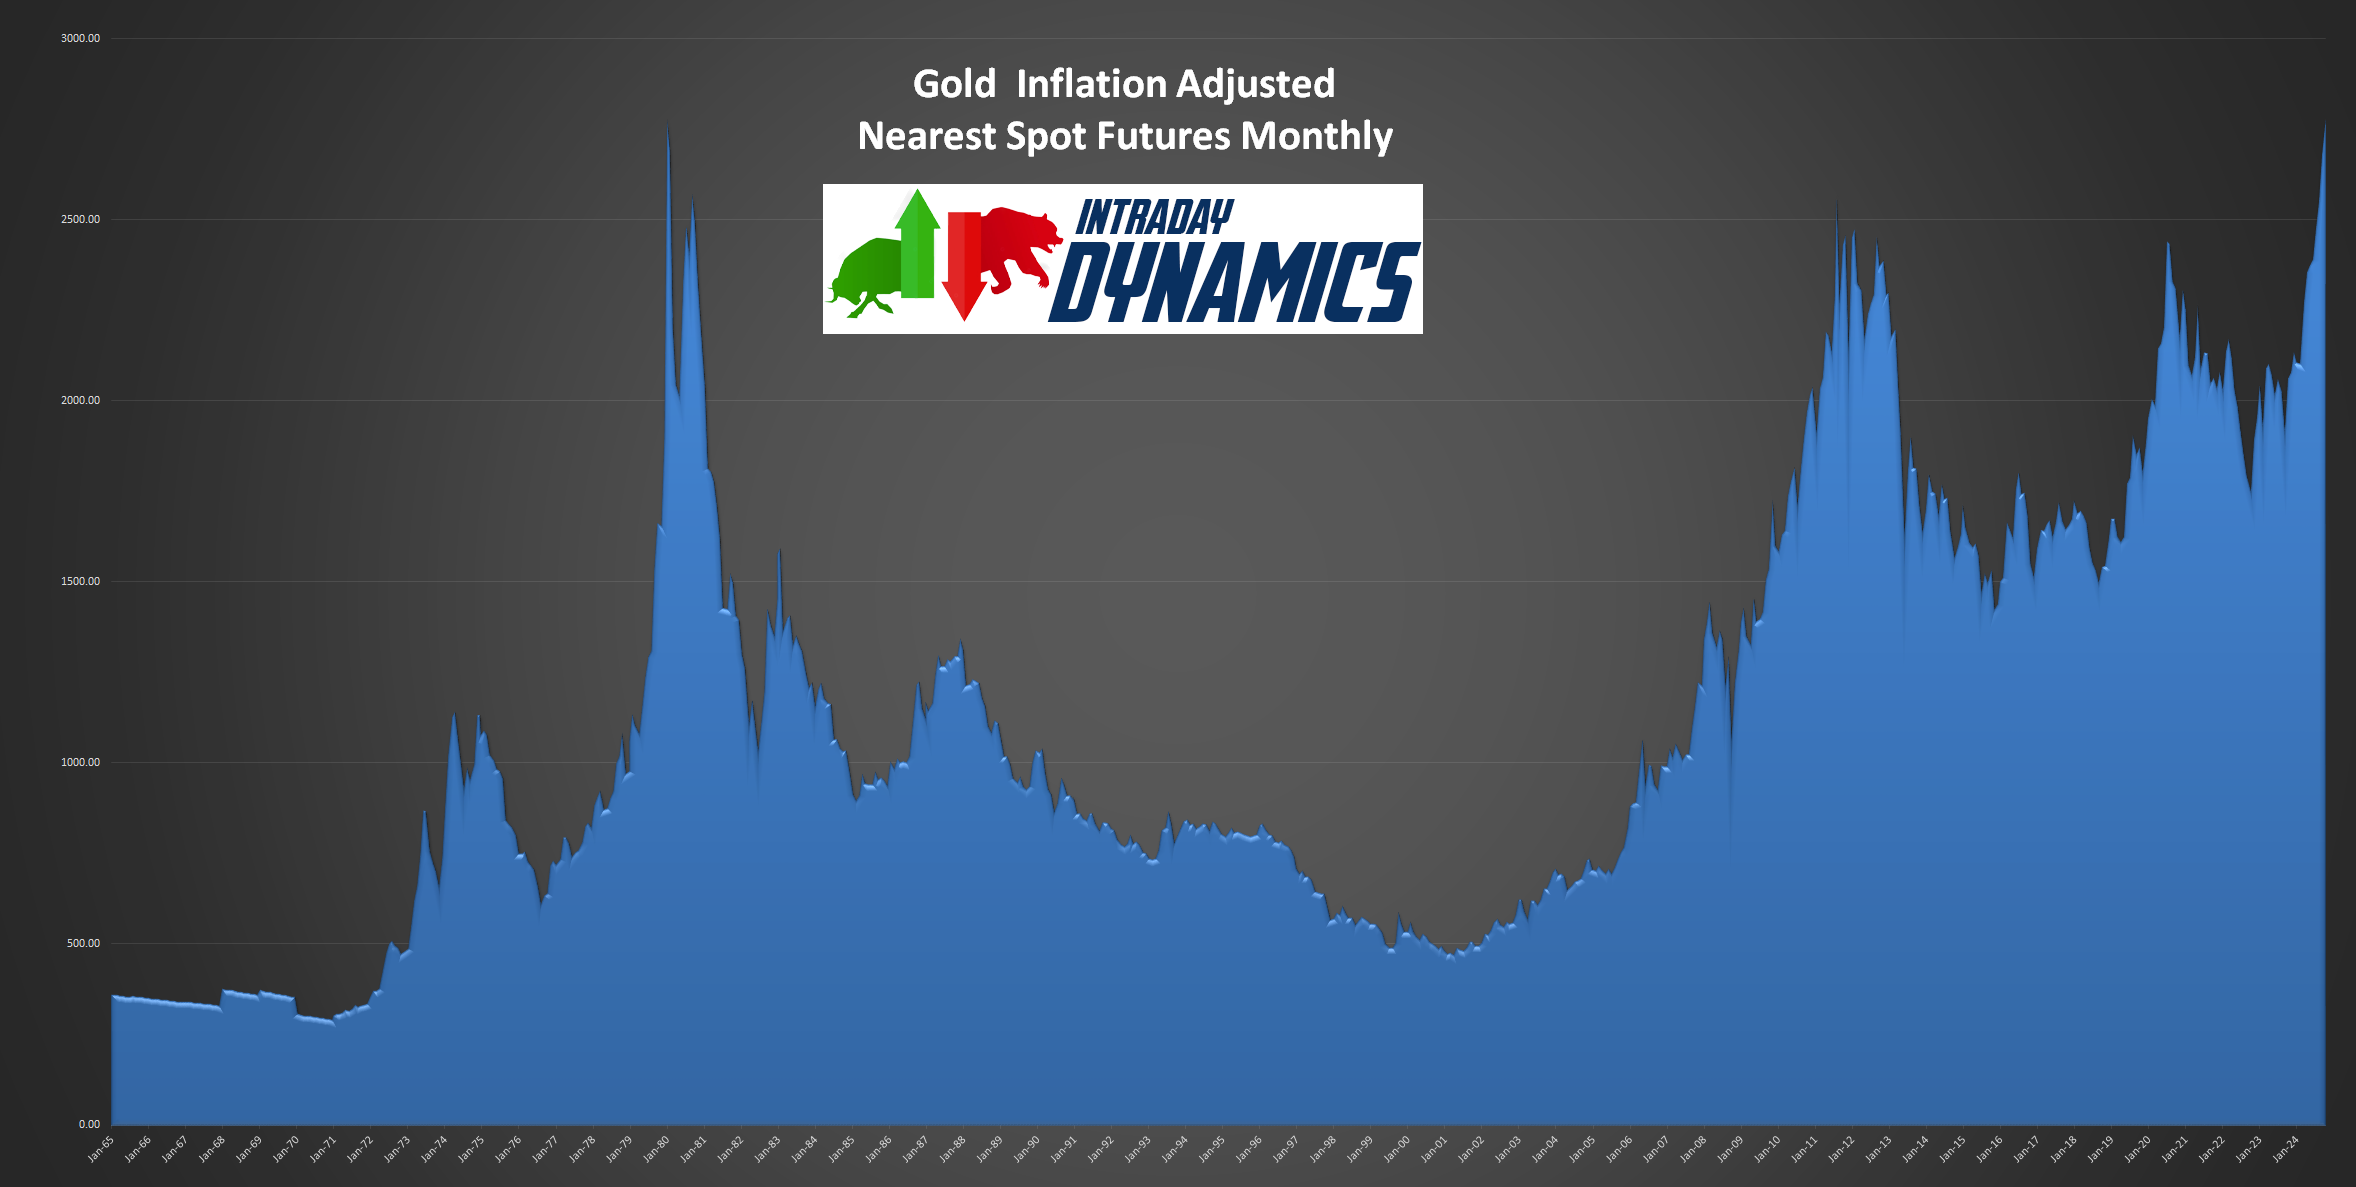
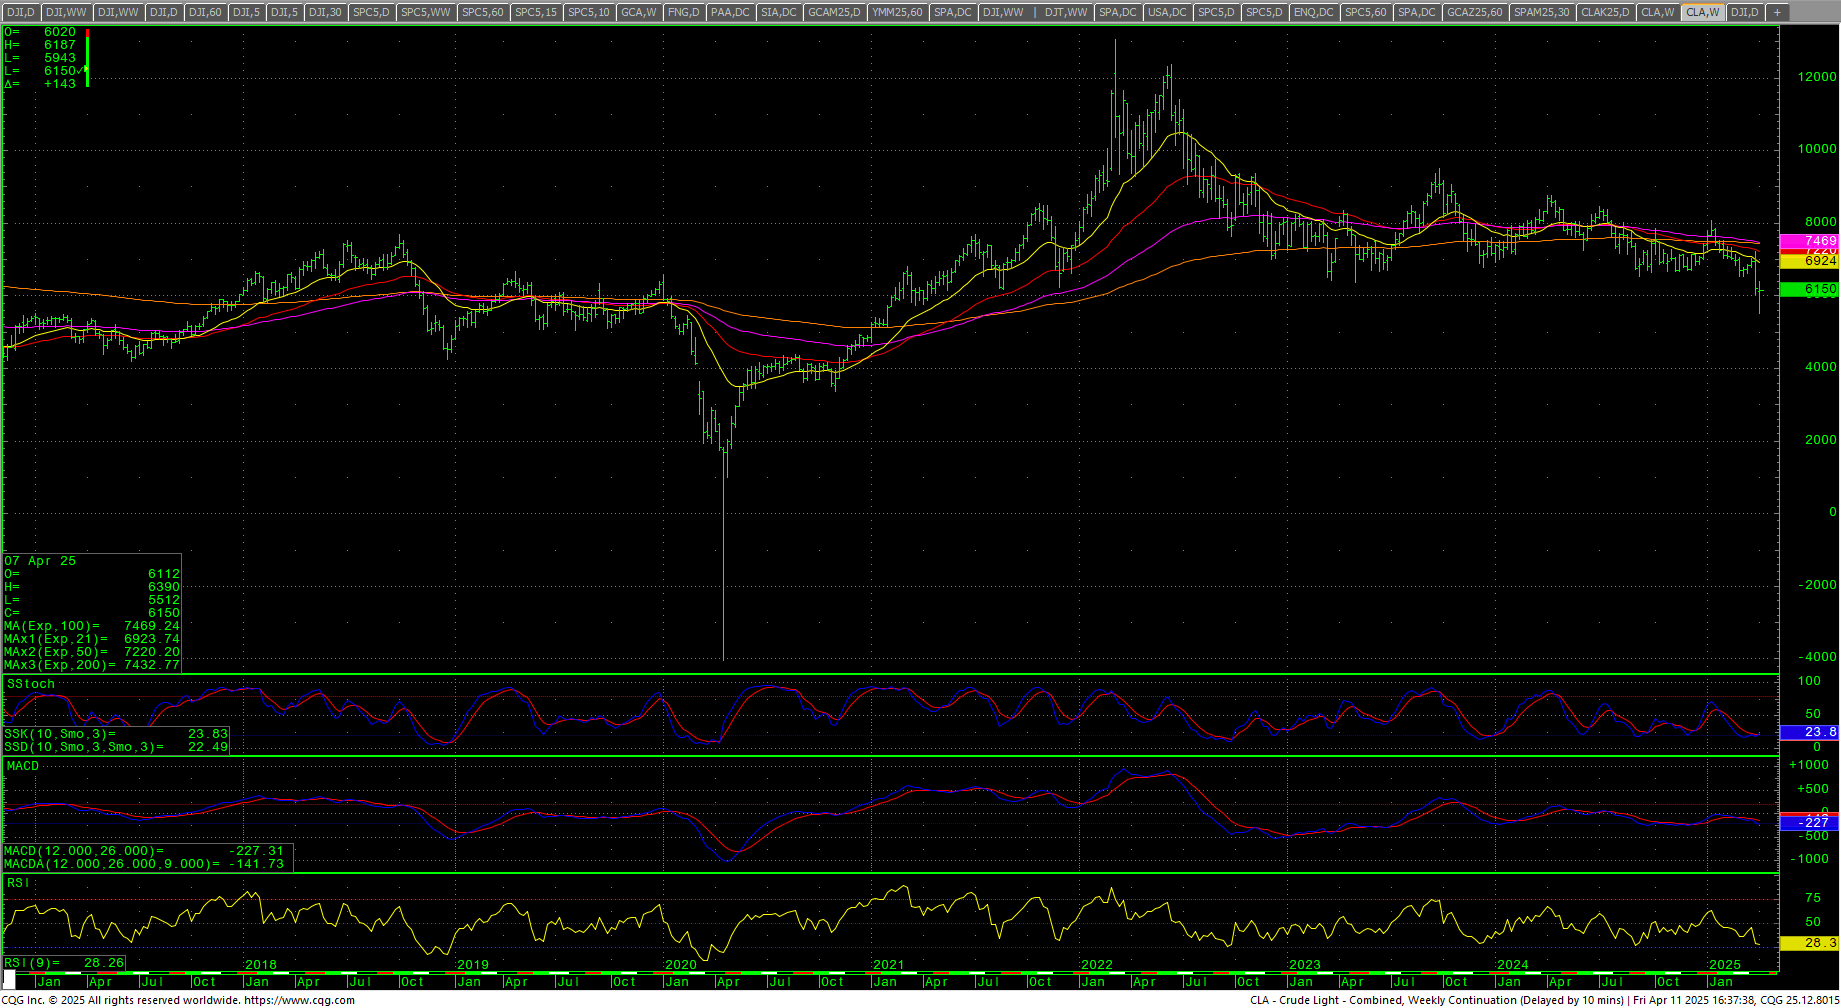
 The CRB Index took a big hit, plunging down -5.99%. Crude oil plunged under the $60 level but recovered late to settle in the upper end of the range after testing the February 2021 lows. Gold staged a massive outside week up and roared into all-time highs with spot gold clearing the $3200 level. The CoT for the S&P 500 saw dealers buying and asset managers selling with small specs exiting (likely shorts). The CFTC S&P 500 Non-Commercial Net Positions ended at -28.7K and appears there was more short covering. Sellers have a 6 day window.
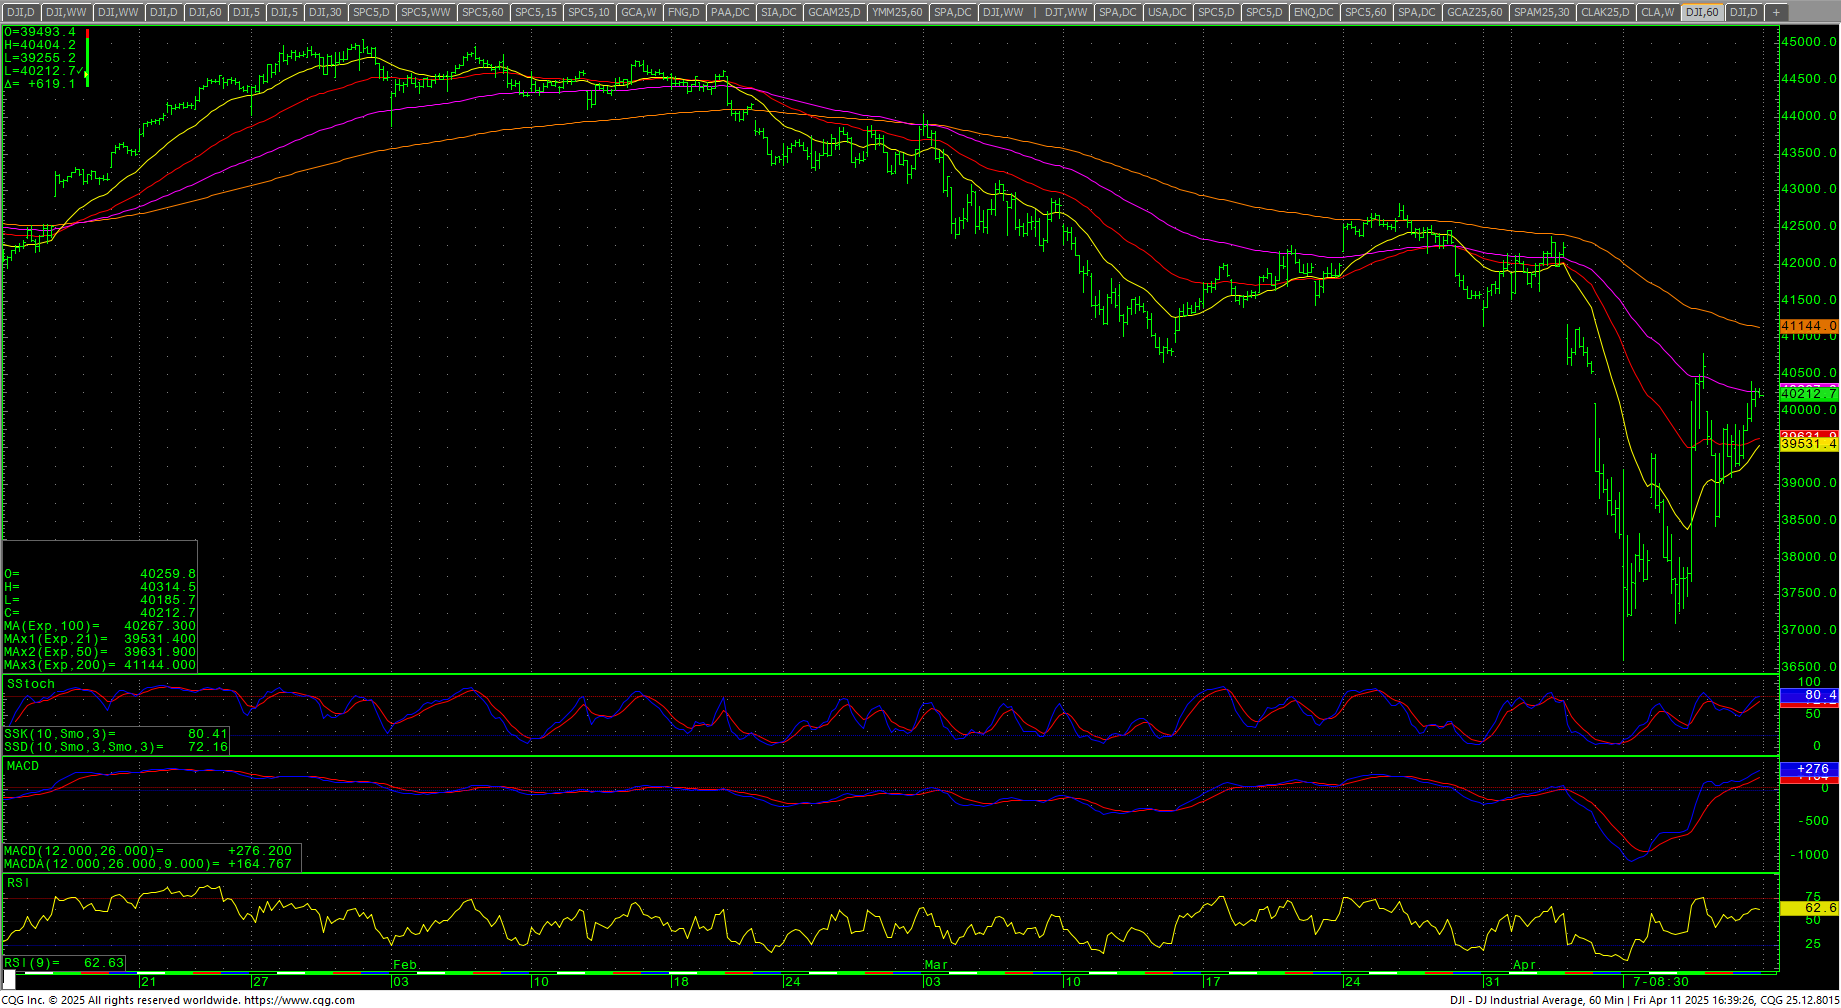
 Timing Points
This month continues CRITICAL timing. Monday the 14th is minor timing. The next critical timing point is Monday April 21st. Tuesday we get the Empire State Manufacturing Survey (est: -10.0%). Wednesday is March Retail Sales (est: +1.2%) and Capacity Utilixation (est: 77.9%). Thursday is Housing Starts (est: 1.41M). 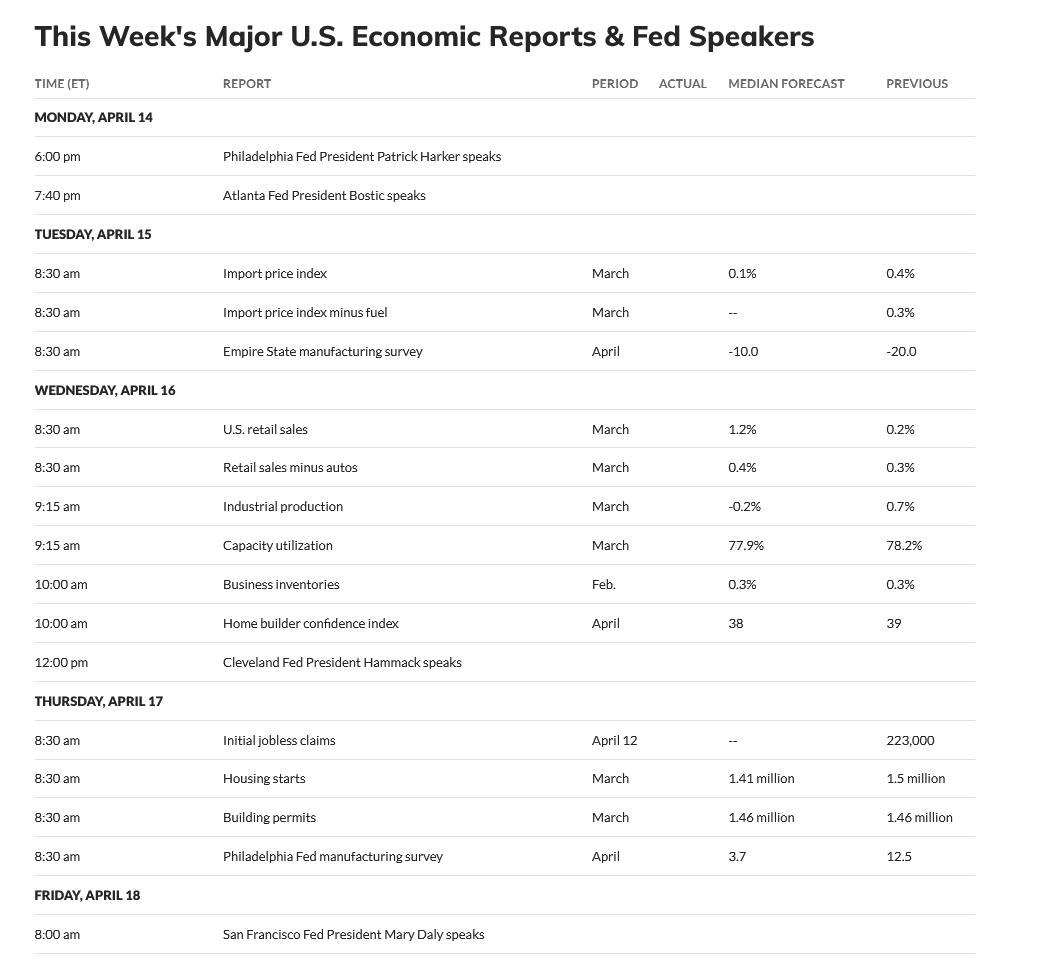
- 04/14 **
- 04/21 *** X critical (from the 18th/19th) Geopolitical
- 04/25 **
- 04/30 *** X
- 05/08 **
- 05/13 *** X critical, fast moves
- 05/20 **
- 05/29 *** X critical
Dow Jones Industrial Average
Dow Jones Industrial Average Weekly Candles
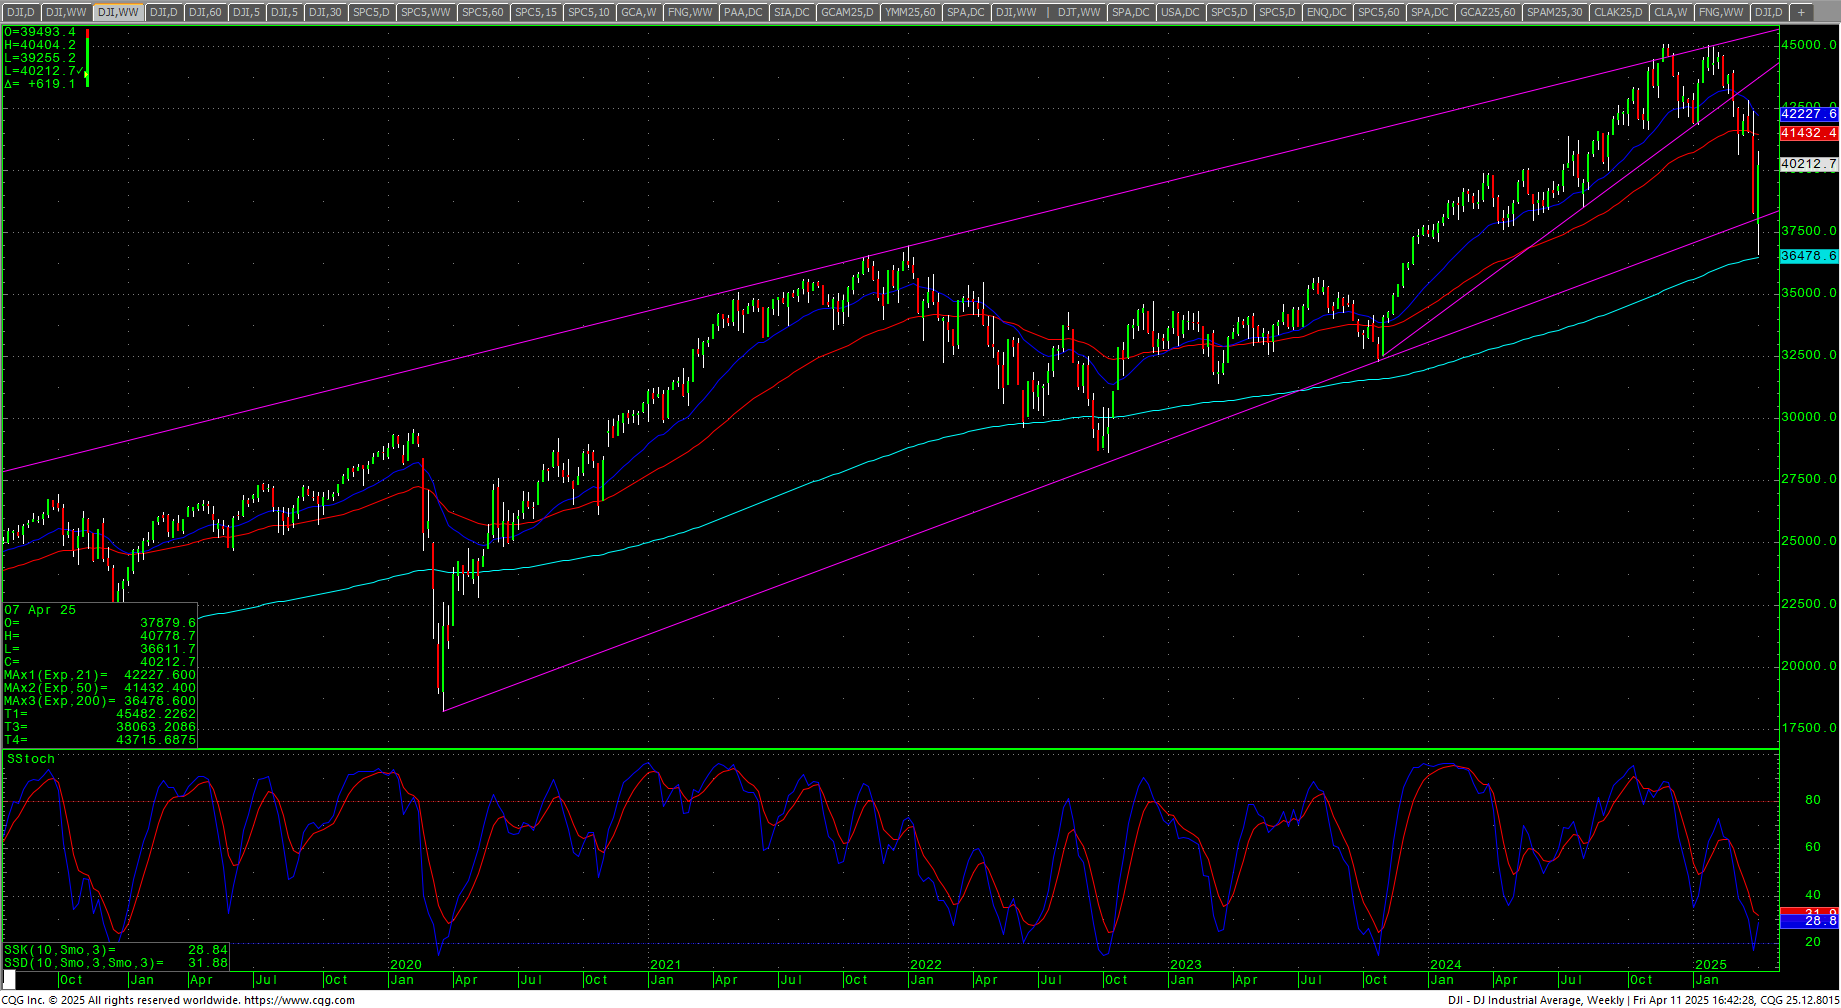 The Dow had an absolutely manic week and closed at the top of a large reversal range on the weekly chart as prices congest under the neckline of the H&S/Double Top pattern on the daily. The action filled in the runaway gap on the daily. Both the daily stochastics and the MACD want to hook higher, RSI is back above 40 at 47.11. The daily is very close to establishing a Death Cross on the moving averages. The weekly is in a sell signal. As mentioned above, the weekly almost hit the 200-week moving average, which came in at 36478 with an intraday low of 36611. The hourly ended the week slightly overbought with Friday’s rally. The 200-day MA starts the week at 41823.
Dow Jones Industrial Average Weekly H-L-C
 Prices hit a 50% retracement of the move from the 2022 low to the ATH at 36867 before reversing to close on the weekly highs. Resistance is 40449/40455 and near-term pivotal at 40778/40833. Closes over 40833 will open counts into 41140/41148 level with counts to the 41269 through 41356 area. Daily closes above 41356 should minimally test critical resistance at 41829/41835 through 40865. Closes over 41835 opens counts to 42943 through 43061.
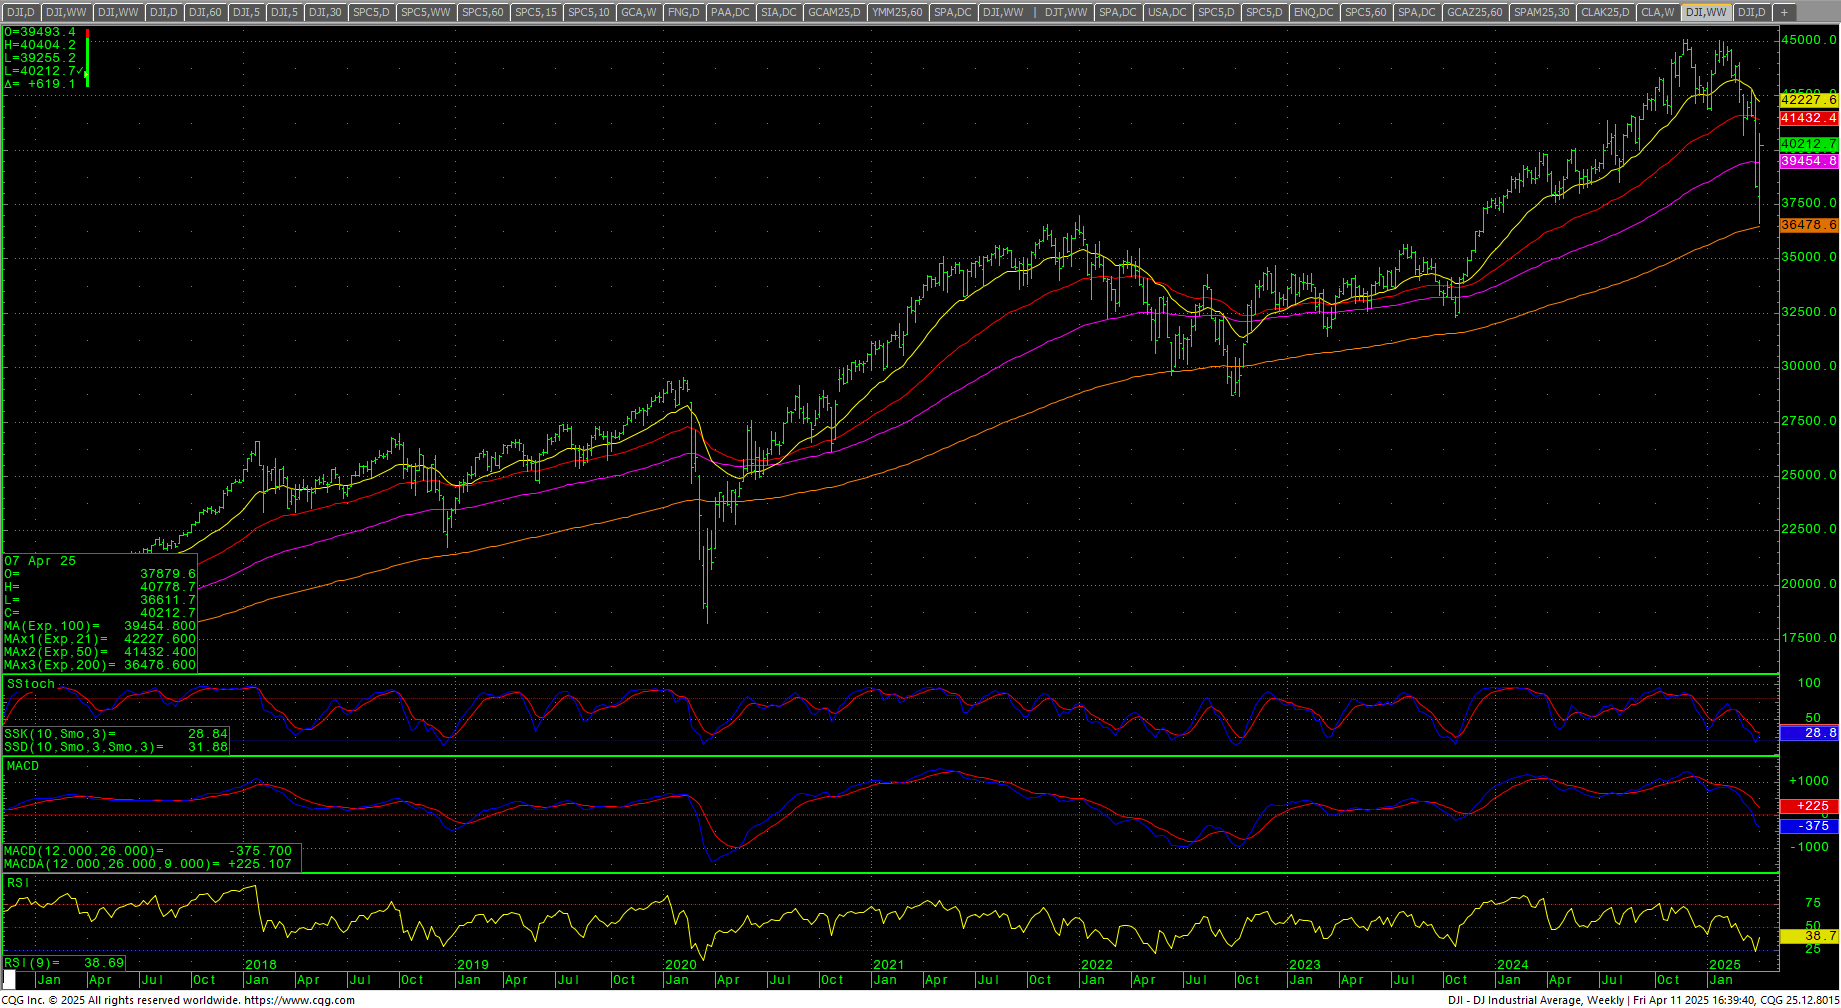
Dow Jones Industrial Average Hourly H-L-C
Dow Jones Industrial Average 5-Minute H-L-C
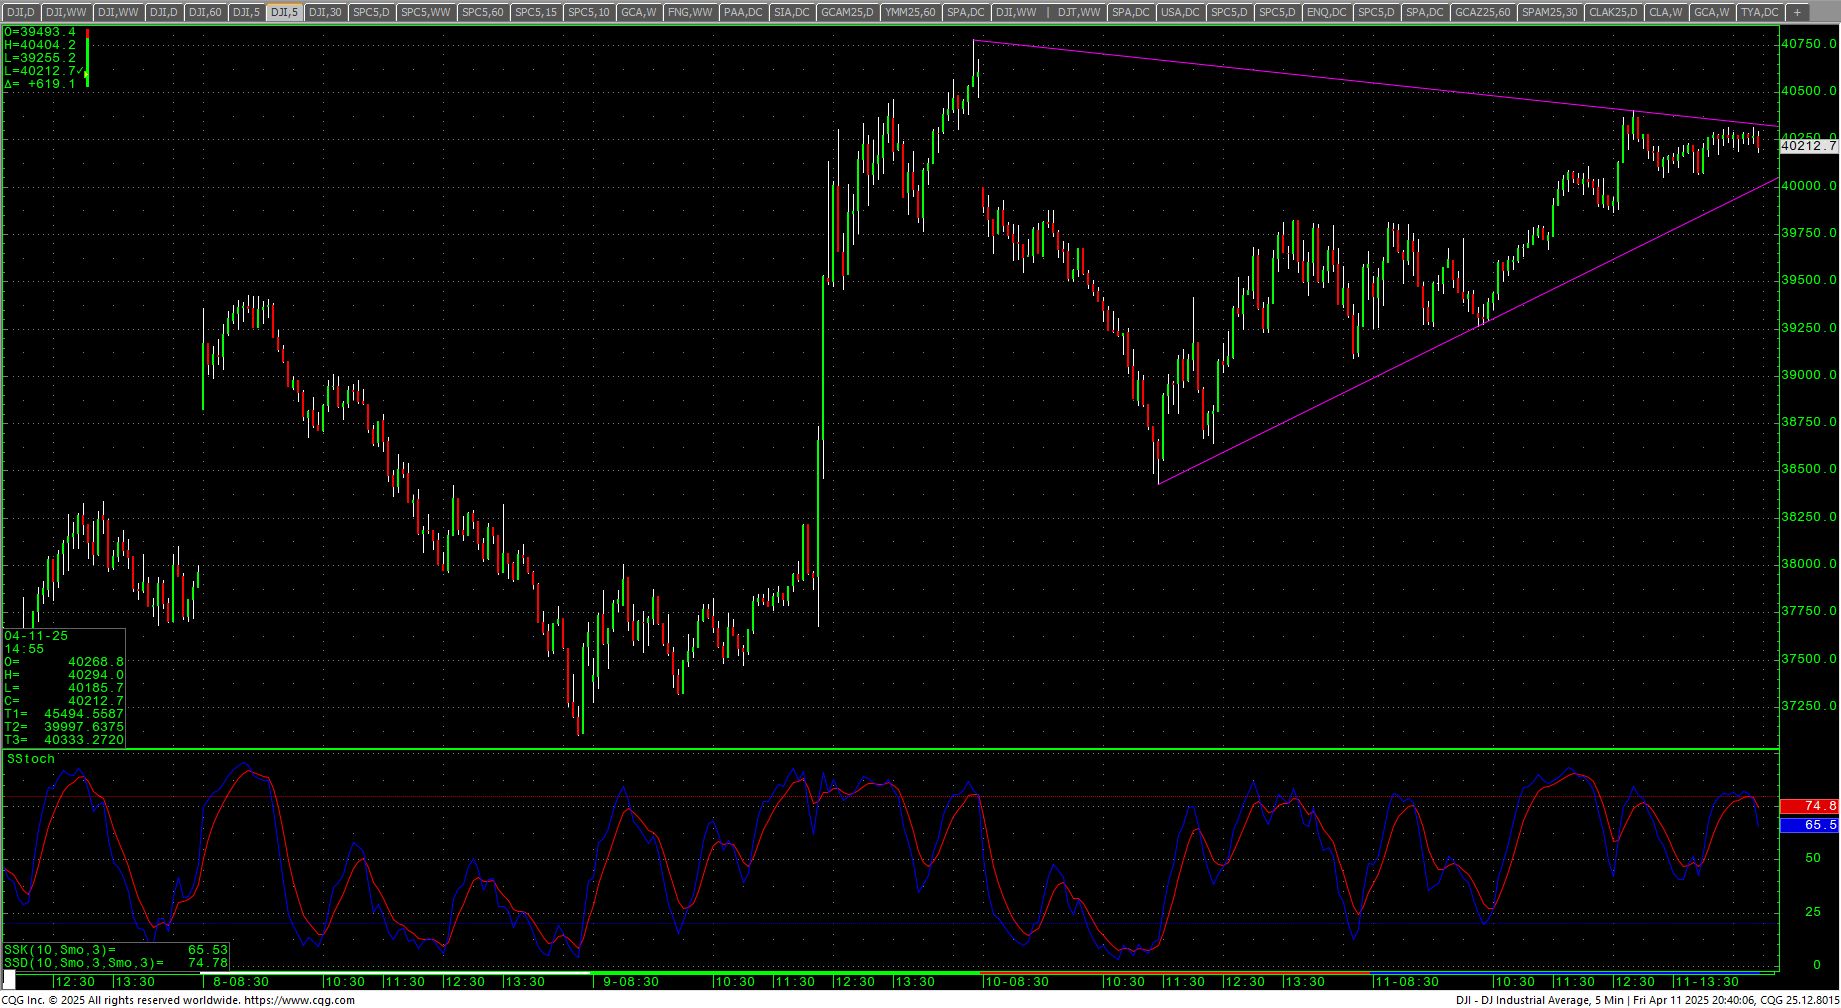
Support is at 40046, 39795 and 39594. A breakdown under 39594 sets up 39228/39186 with counts into the 38862/38858 area. Closes below 38858 should test 38695 and 38427 with potential to 38203/38200. Closes under the 38200 level sets up 37653 through 37595 with full potential to retest the 36611 low with support at 37103. Closes under 37611 should test 36478 with full potential toward 35515/35335 and trading support at 36024.
| Resistance | Support |
|
|
S&P 500 Cash Index: SPX
S&P 500 Index Weekly H-L-C
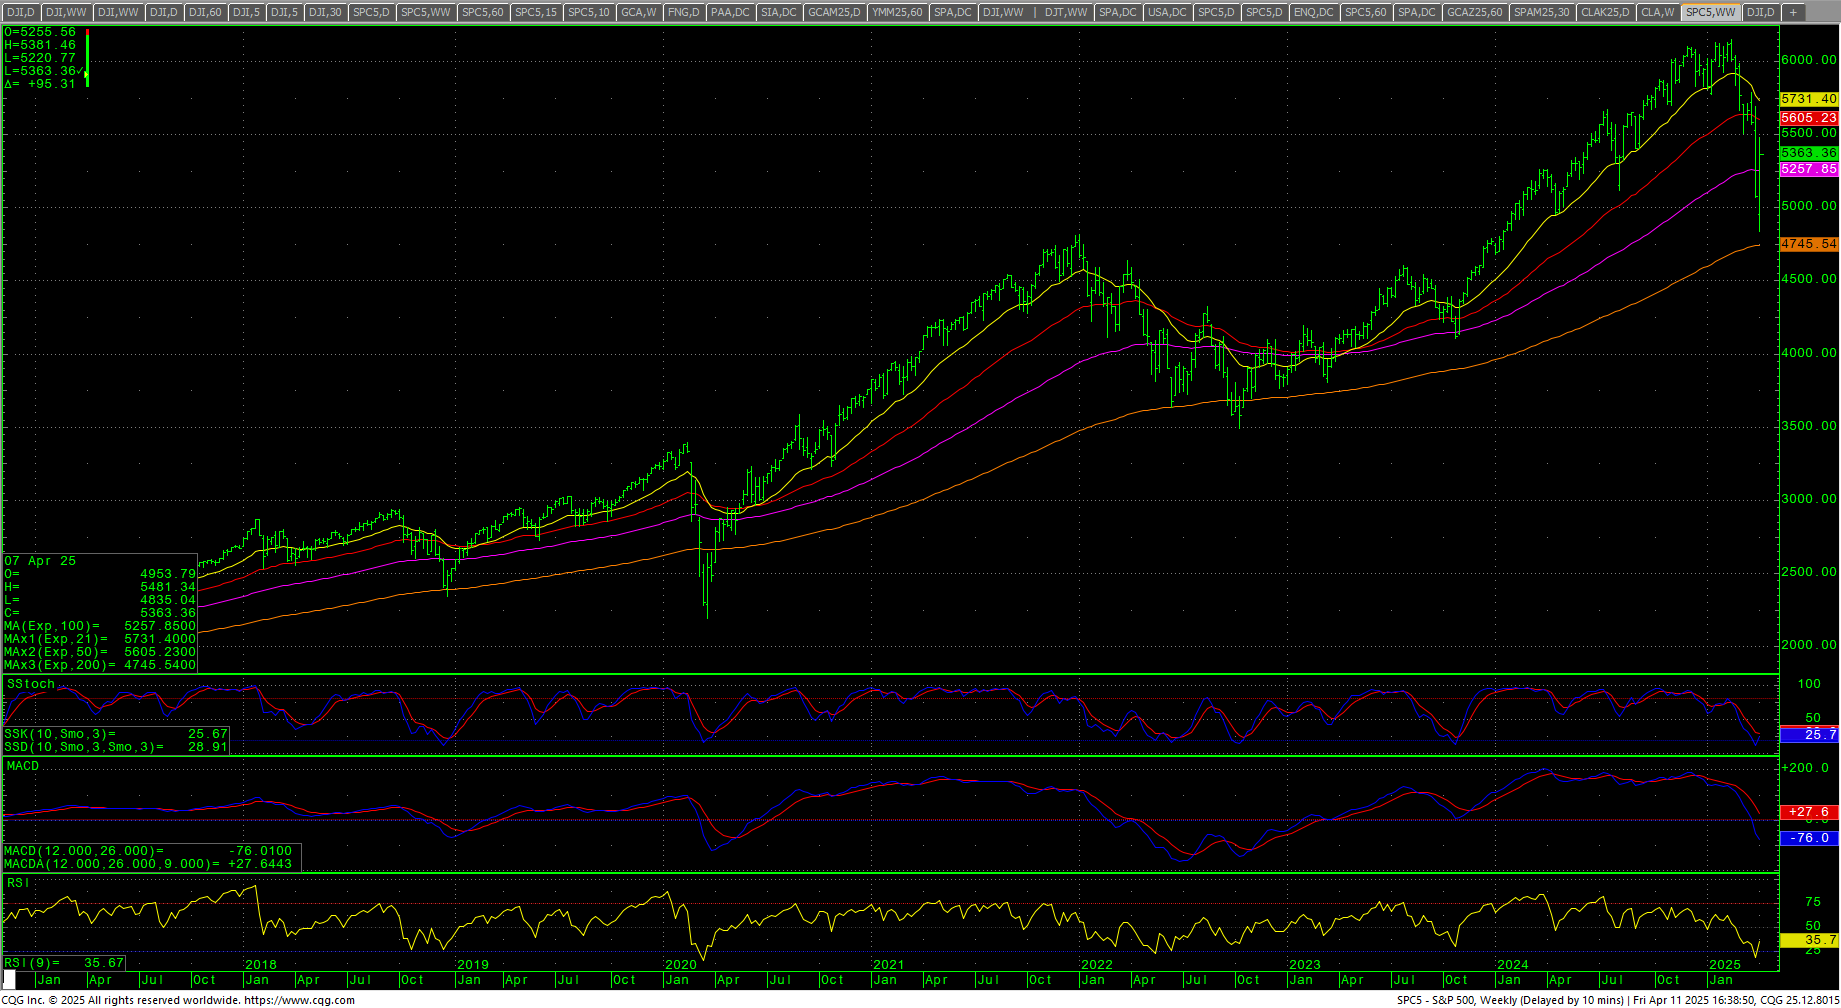 The S&P did the intraweek loop-the-loop and managed two days of higher lows and higher highs as prices traded the equivalent of an entire year’s worth of trade in four intraday sessions. The key now, since this is all artificially created via “Tweet,” is going to be how weekly charts look by the time we get to the end of the month. The daily is looking to hook higher on the stochastics and the MACD shows the same. RSI is back over 40 at 46.51. The weekly is leaning toward oversold readings. The hourly ended slightly overbought with Friday’s rally. The 200-day MA is 5668.83.
S&P 500 (SPX) PE Ratio
 Valuations are still between 26-27. The mean is roughly 15-17.
SPY Weekly
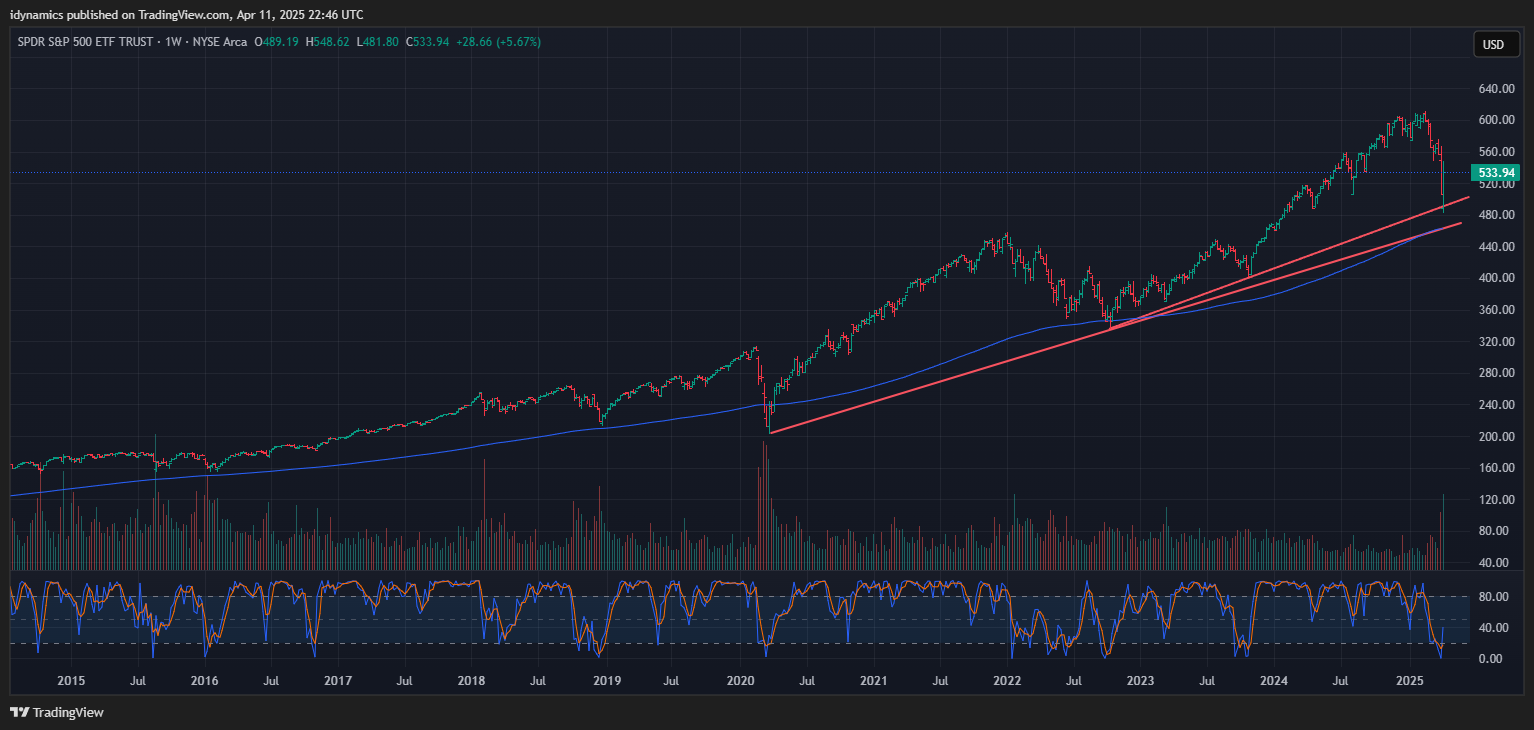 Resistance is 5379/5385. Closes over 5385 set up 5480/5482. Closes over 5482 are friendly and count to 5608 with potential to 5735/5740. Daily closes above 5740 should minimally test 5787 with potential to 5878/5893. A breakout over 5893 will open counts to 5986 with full potential to 6043 and opens counts to 6112/6114 and full counts into critical resistance at the intraday high of 6147.43. Rallies through 6148 should test 6160 with a shot at a target of 6180.35/6181.
S&P 500 Index Hourly H-L-C
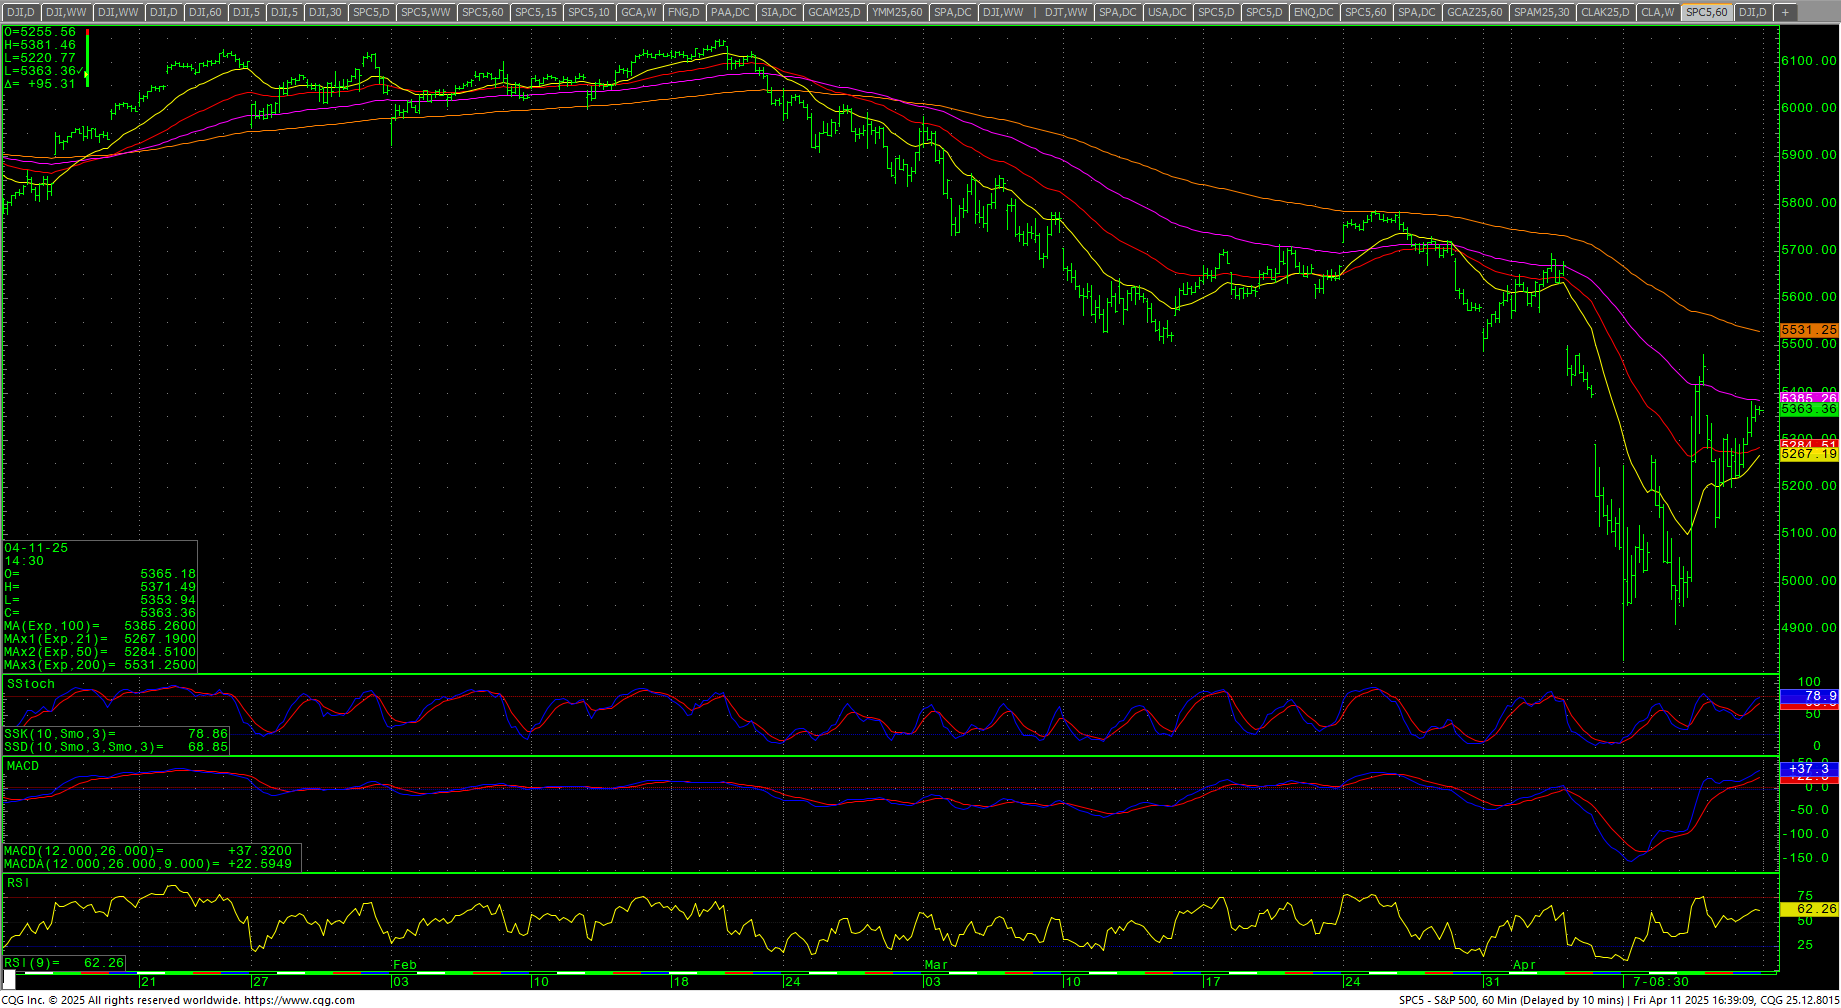 Support is 5328, 5297 and 5241/5234. A breakdown under 5234 sets up 5184/5180 and 5154. Closes under 5154 should test critical support at 5181/5178. Closes below 5178 should minimally test 4996/4987 while setting up a retest of the 4835 swing lows with support still at 4884/4880. Closes under 4880 are bearish and open counts to 4614 through 4586. Under 4586 can carry to 4486 with counts to 4421/4418 (gap) and support at 4459. Closes under 4418 set up 4319 with full counts into the 4104/4100 area.
| Resistance | Support |
|
|
Charts courtesy of CQG, Inc., CNN, Koyfin, Trading View and AAII