TECHNICAL ANALYSIS (by Intraday Dynamics)
VIX Volatility Index Daily Close
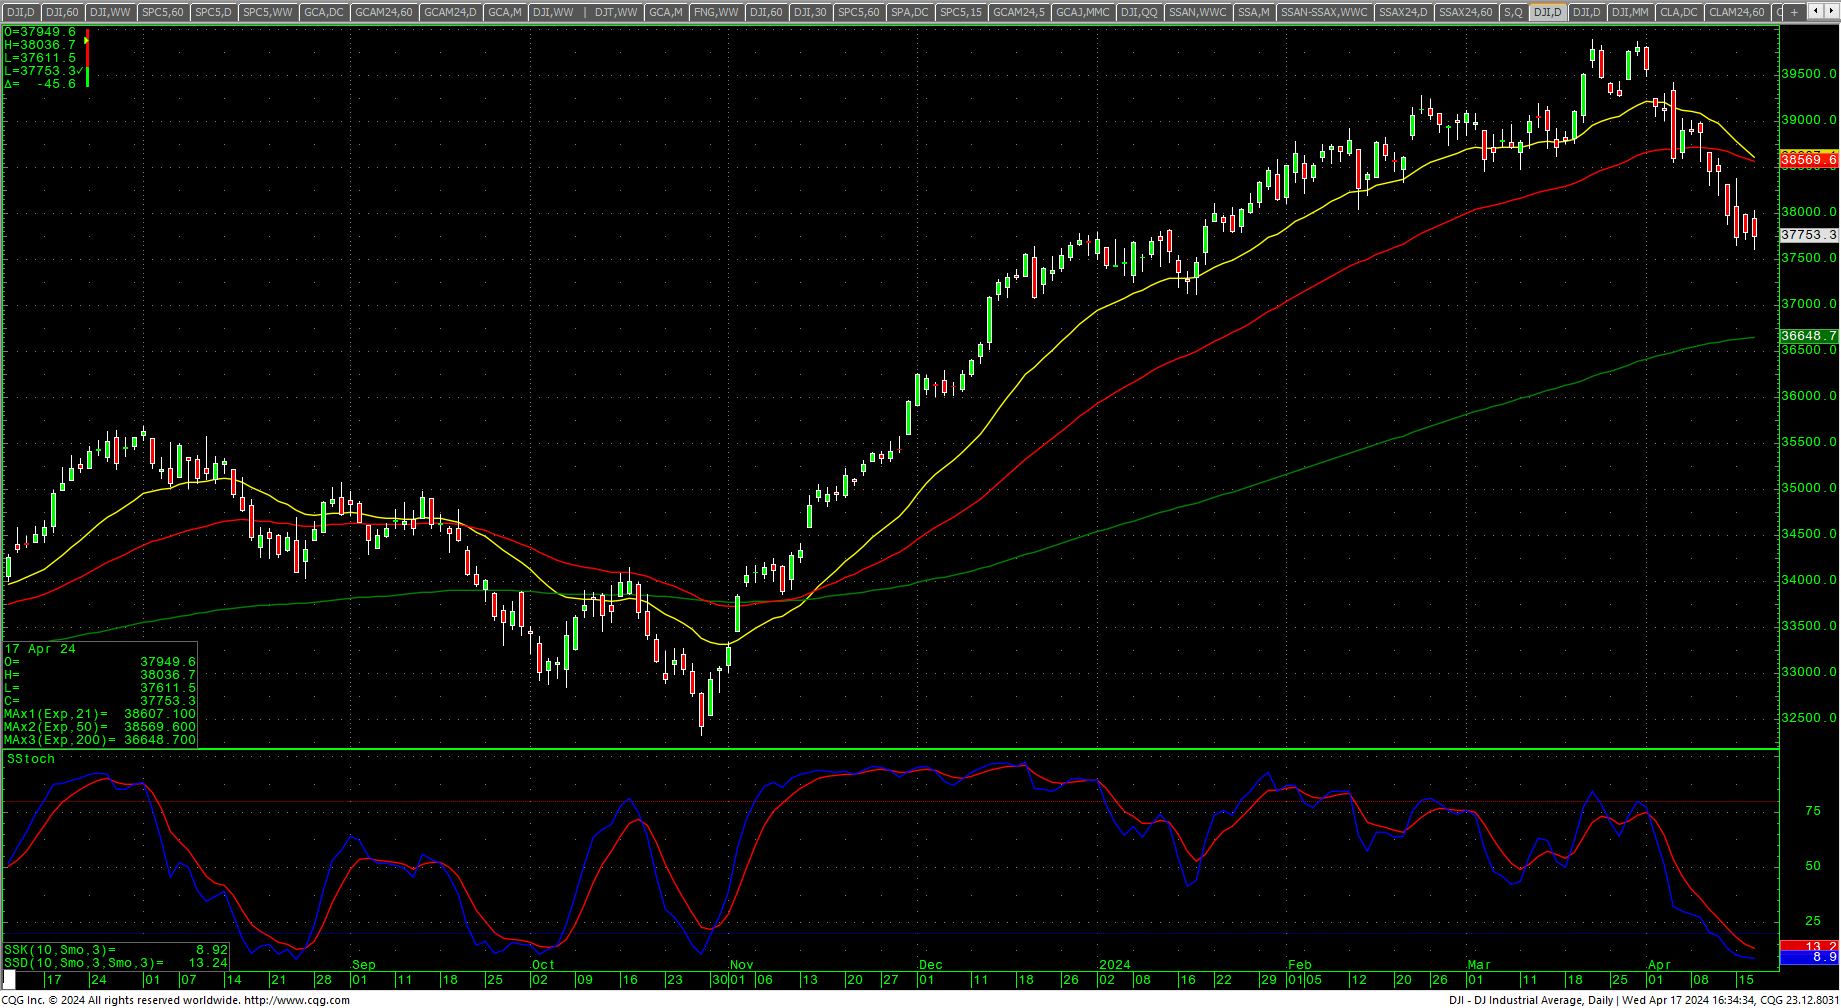
 DJIA Daily Candles
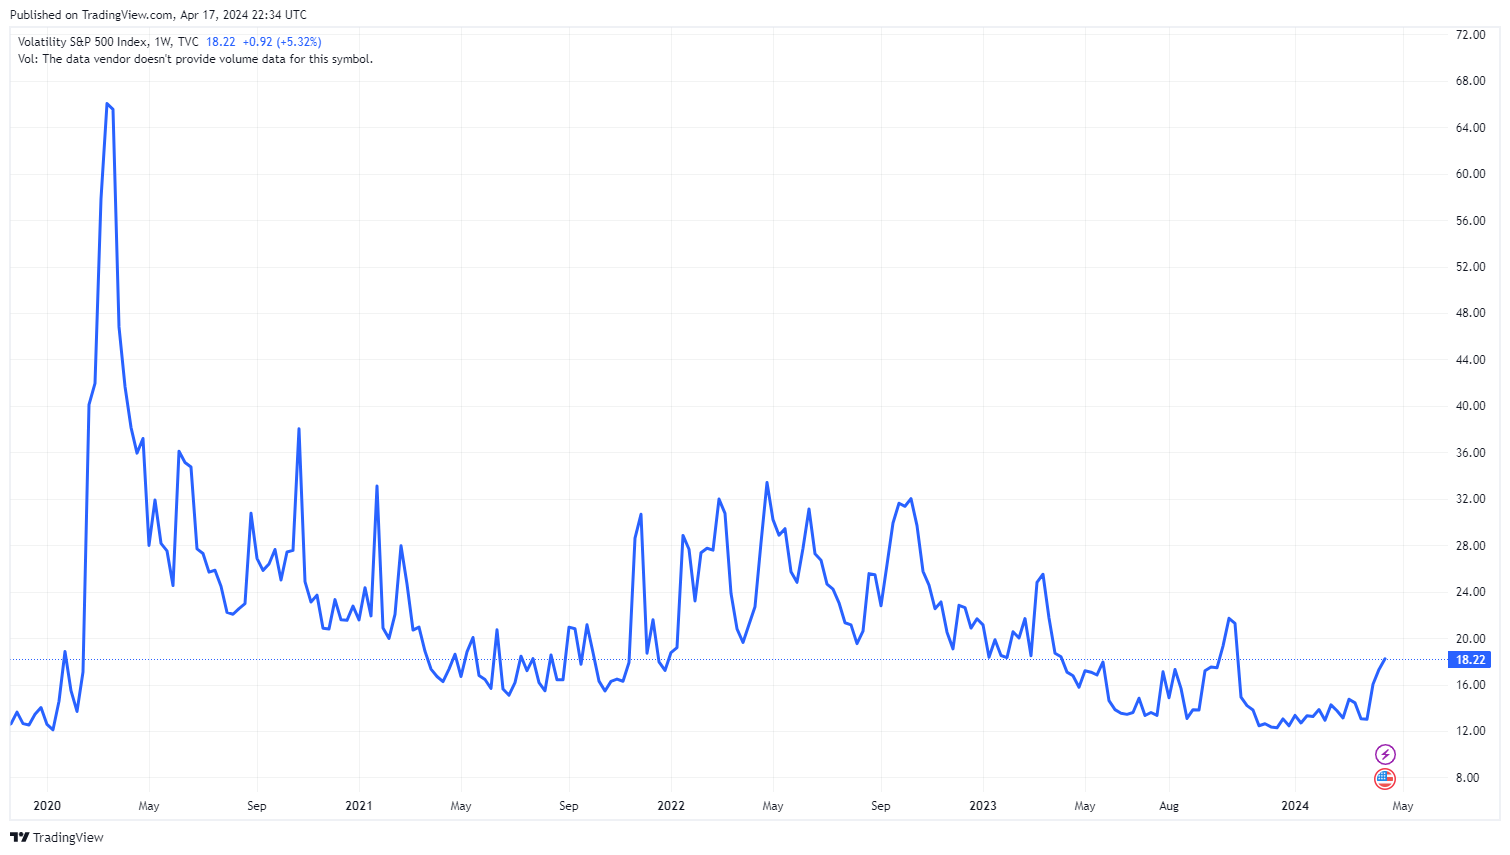
 With Wednesday’s close, the Dow is now down -5.16% from its record high close of 28 March 2024…a decline of 2054 points in just 13 trading sessions. The steep decline has triggered some panic as the VIX is now sitting at levels last seen when the market bottomed out in the Fall of 2023. A ‘typical’ mid-cycle correction is in the 5% range. Now that we are here, what is next for the Dow? Is the market ‘over’ and sellers are once again to be in charge…or is this action normal in the course of bull market cycle, and prices are going to recover and begin a new leg? Meaning, will the Dow eventually take out the critical $40K level after trading 111 points short of that area in March? Note there are still unfilled monthly targets at 40106/40107 and 40245/40250.
Remember that, as we have been pointing out since the end of last month, “…we are now in a critical cycle window that runs between now and the end of April. Trade can become much more active with potential for wider swings and short-term moves.
Speculators have been short sellers at the highs, and they have been handsomely rewarded in the past three weeks. A direct 180 from where they were back in October of last year when specs were heavily short, and commercials were long. Now the VIX is reaching levels last seen at the lows last October, but the specs have been covering their shorts with the latest selloff.
Dow Jones Industrial Average Hourly HLC
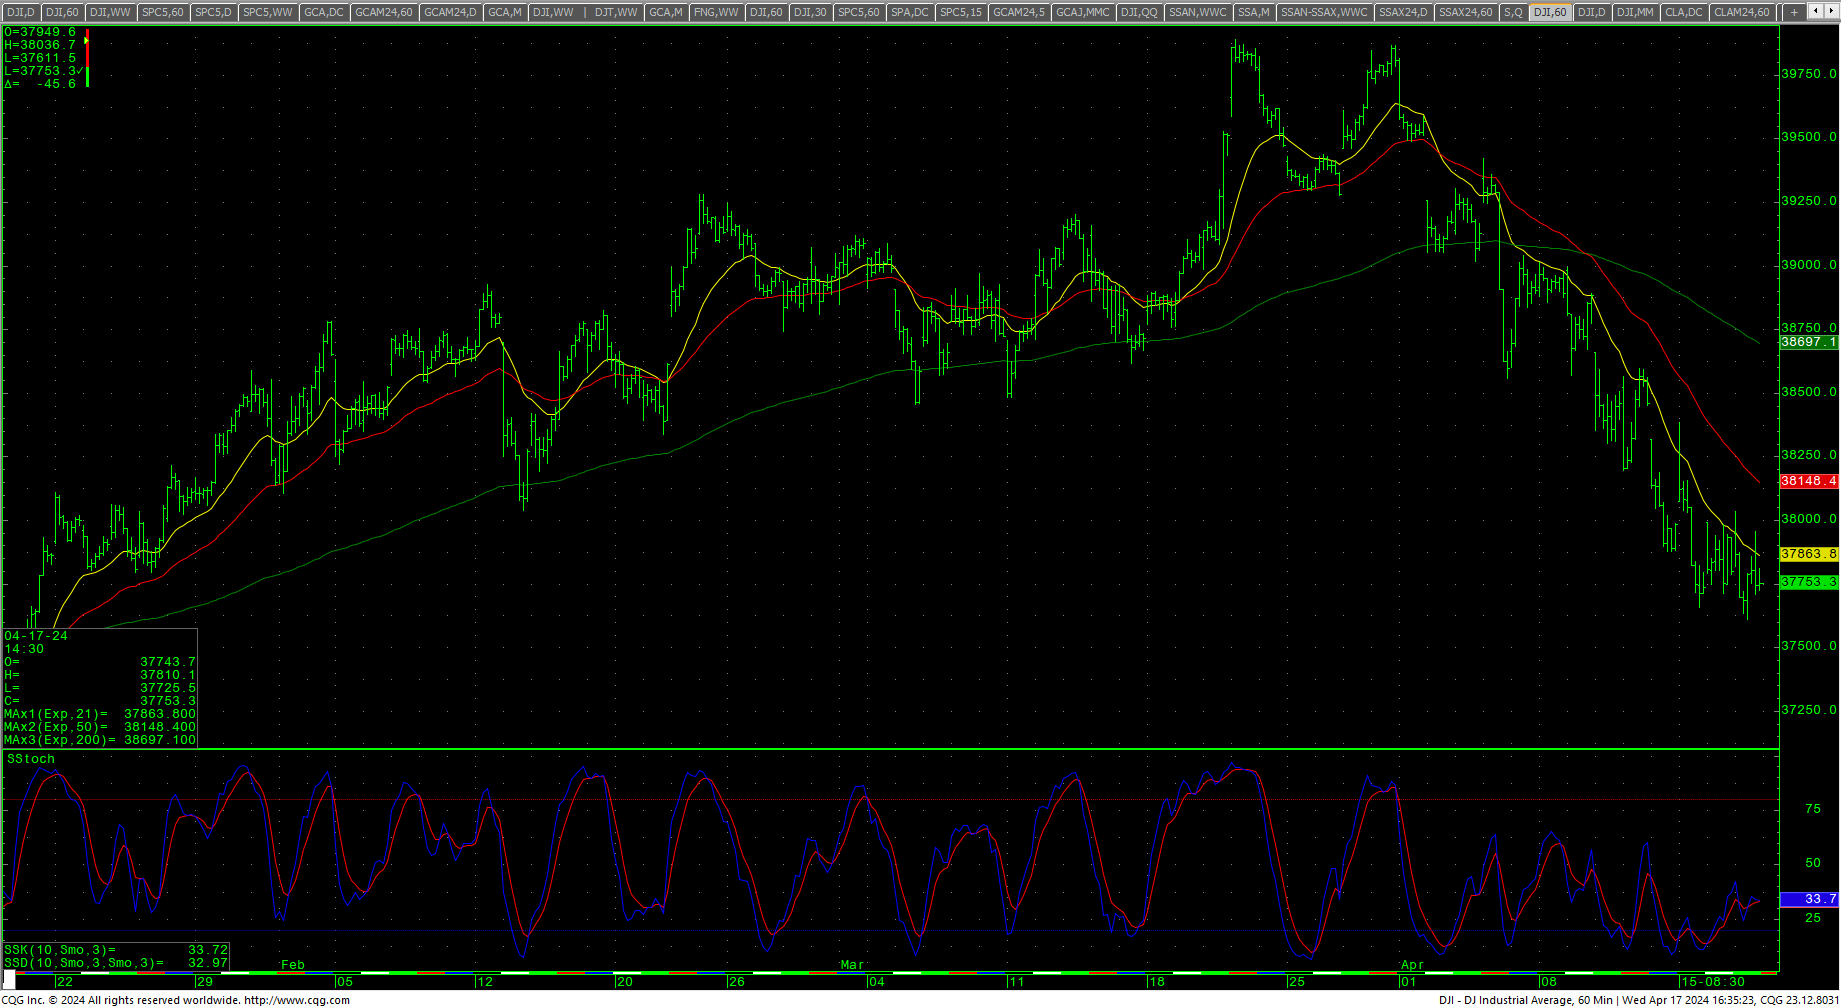 The Dow hourly is oversold and flashing a significant bullish divergence with the lows this week as prices navigate a key area of support in the 37775 level. Continued selloffs with closes under 37775 will open counts to critical support of 37239/37122. Closes under 37122 open counts to 36713 and 36108. A breakdown under 36108 will open counts to the 35599/35592 level with full potential toward 35215/35200.
Dow Jones Industrial Average Weekly H-L-C
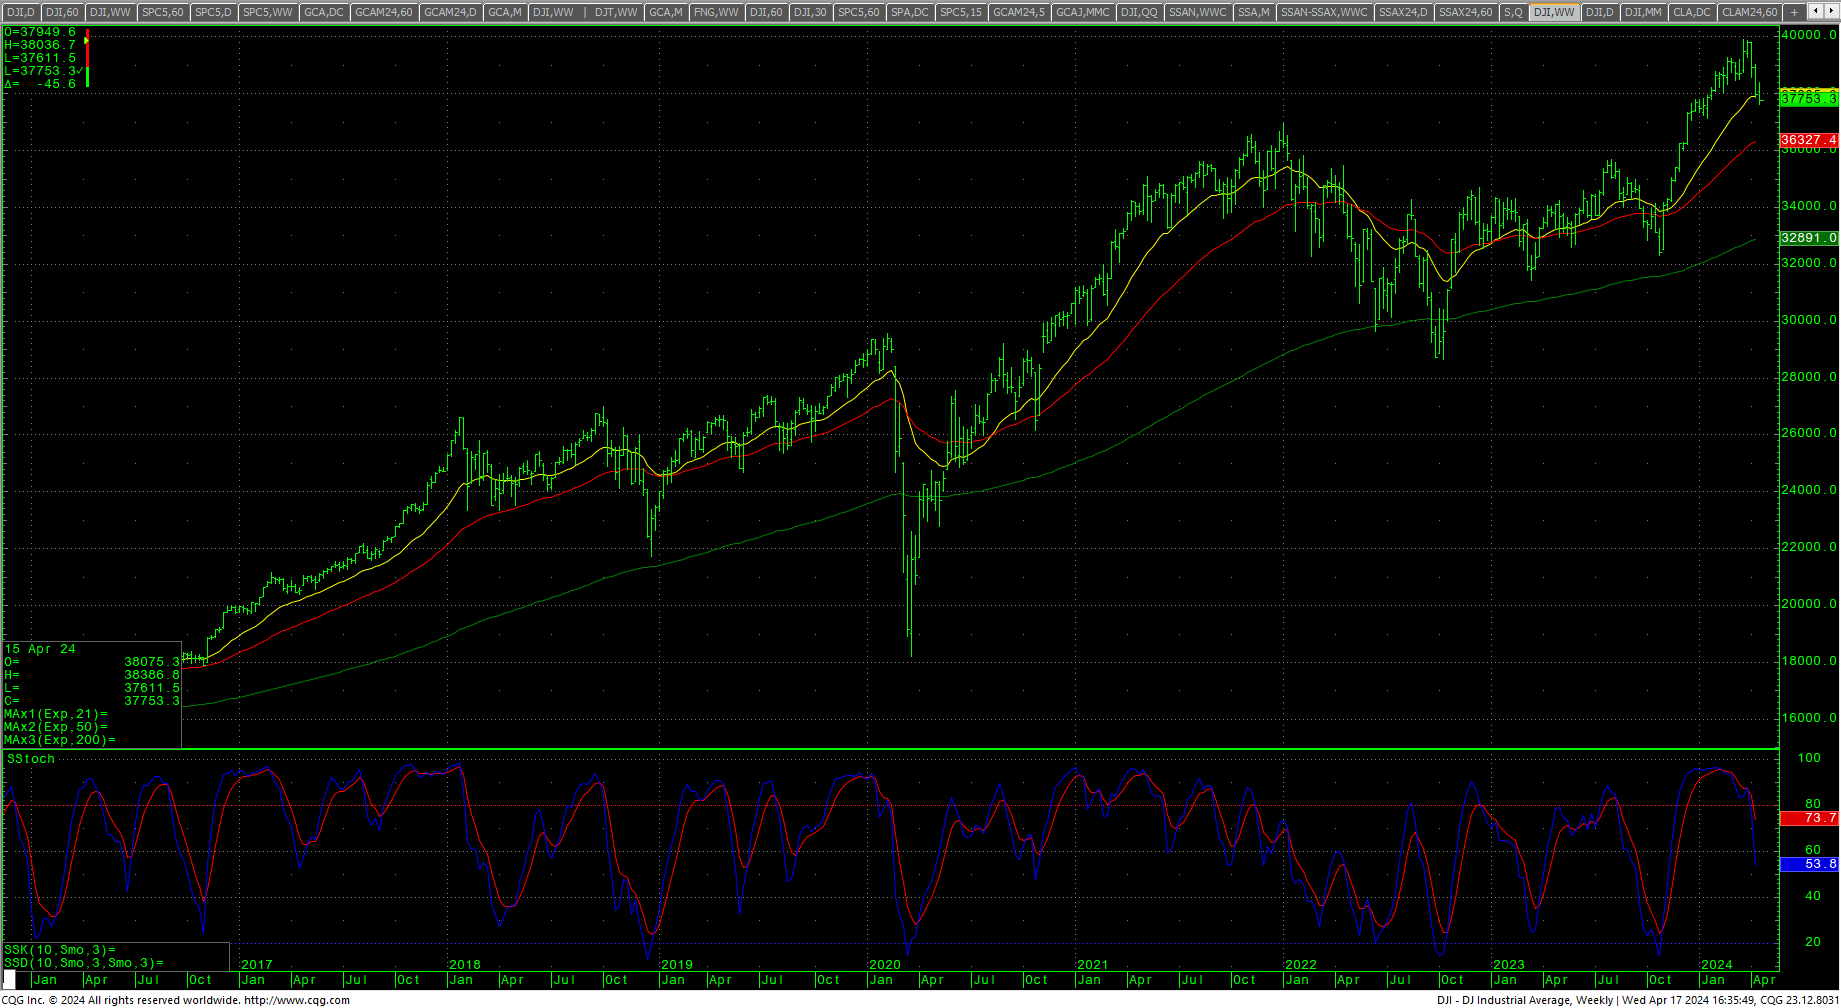 Resistance is 37948 and near-term pivotal at 38148/38157. A drive over 38157 should test 38325 with counts to 38494/38500. A breakout with closes over 38500 will open counts to 58750 with potential to critical short-term resistance of 39018/39030. A drive over 39030 counts to last-gasp resistance of 39319/39351. A close over 39351 sets up a test of 39585 with full potential to the record highs at 39889/39890. Closes over 39890 will renew momentum toward a daily target at 40106.6 and weekly objectives at 40245.4/40250…with 40000 as a critical/pivotal psychological area. The 2021 inflation-adjusted highs are 40010 and 40250, and 40300.
Resistance
|
Support
|
Charts courtesy of CQG, Inc., CNN, Koyfin, Trading View and AAII