
TECHNICAL ANALYSIS (by Intraday Dynamics)
Enjoy the Memorial Day Weekend

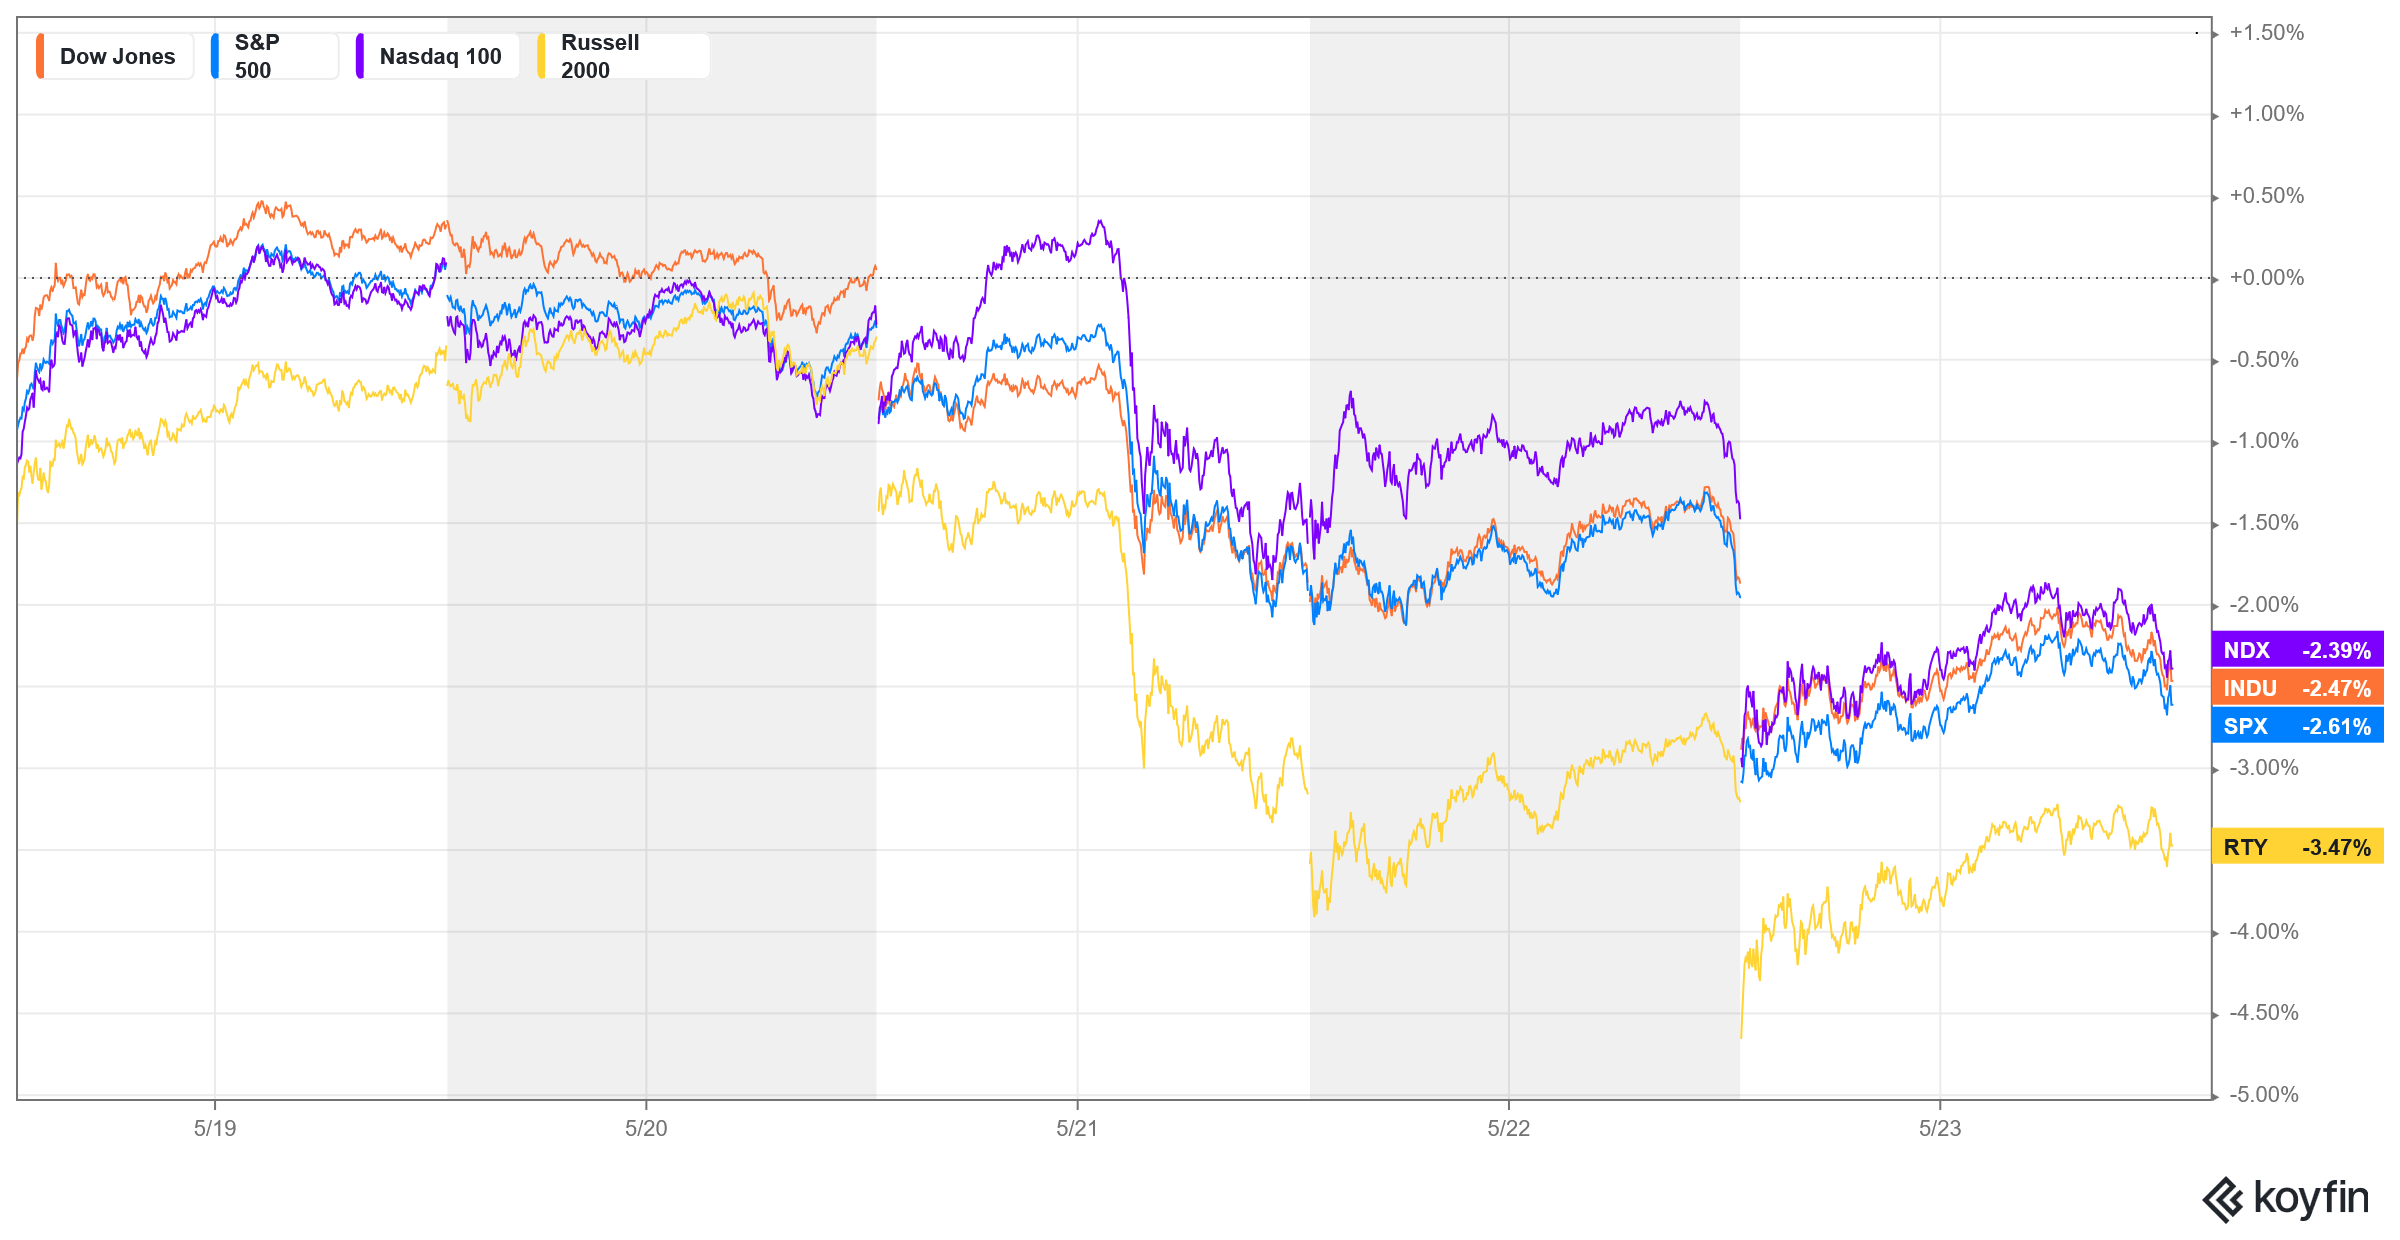
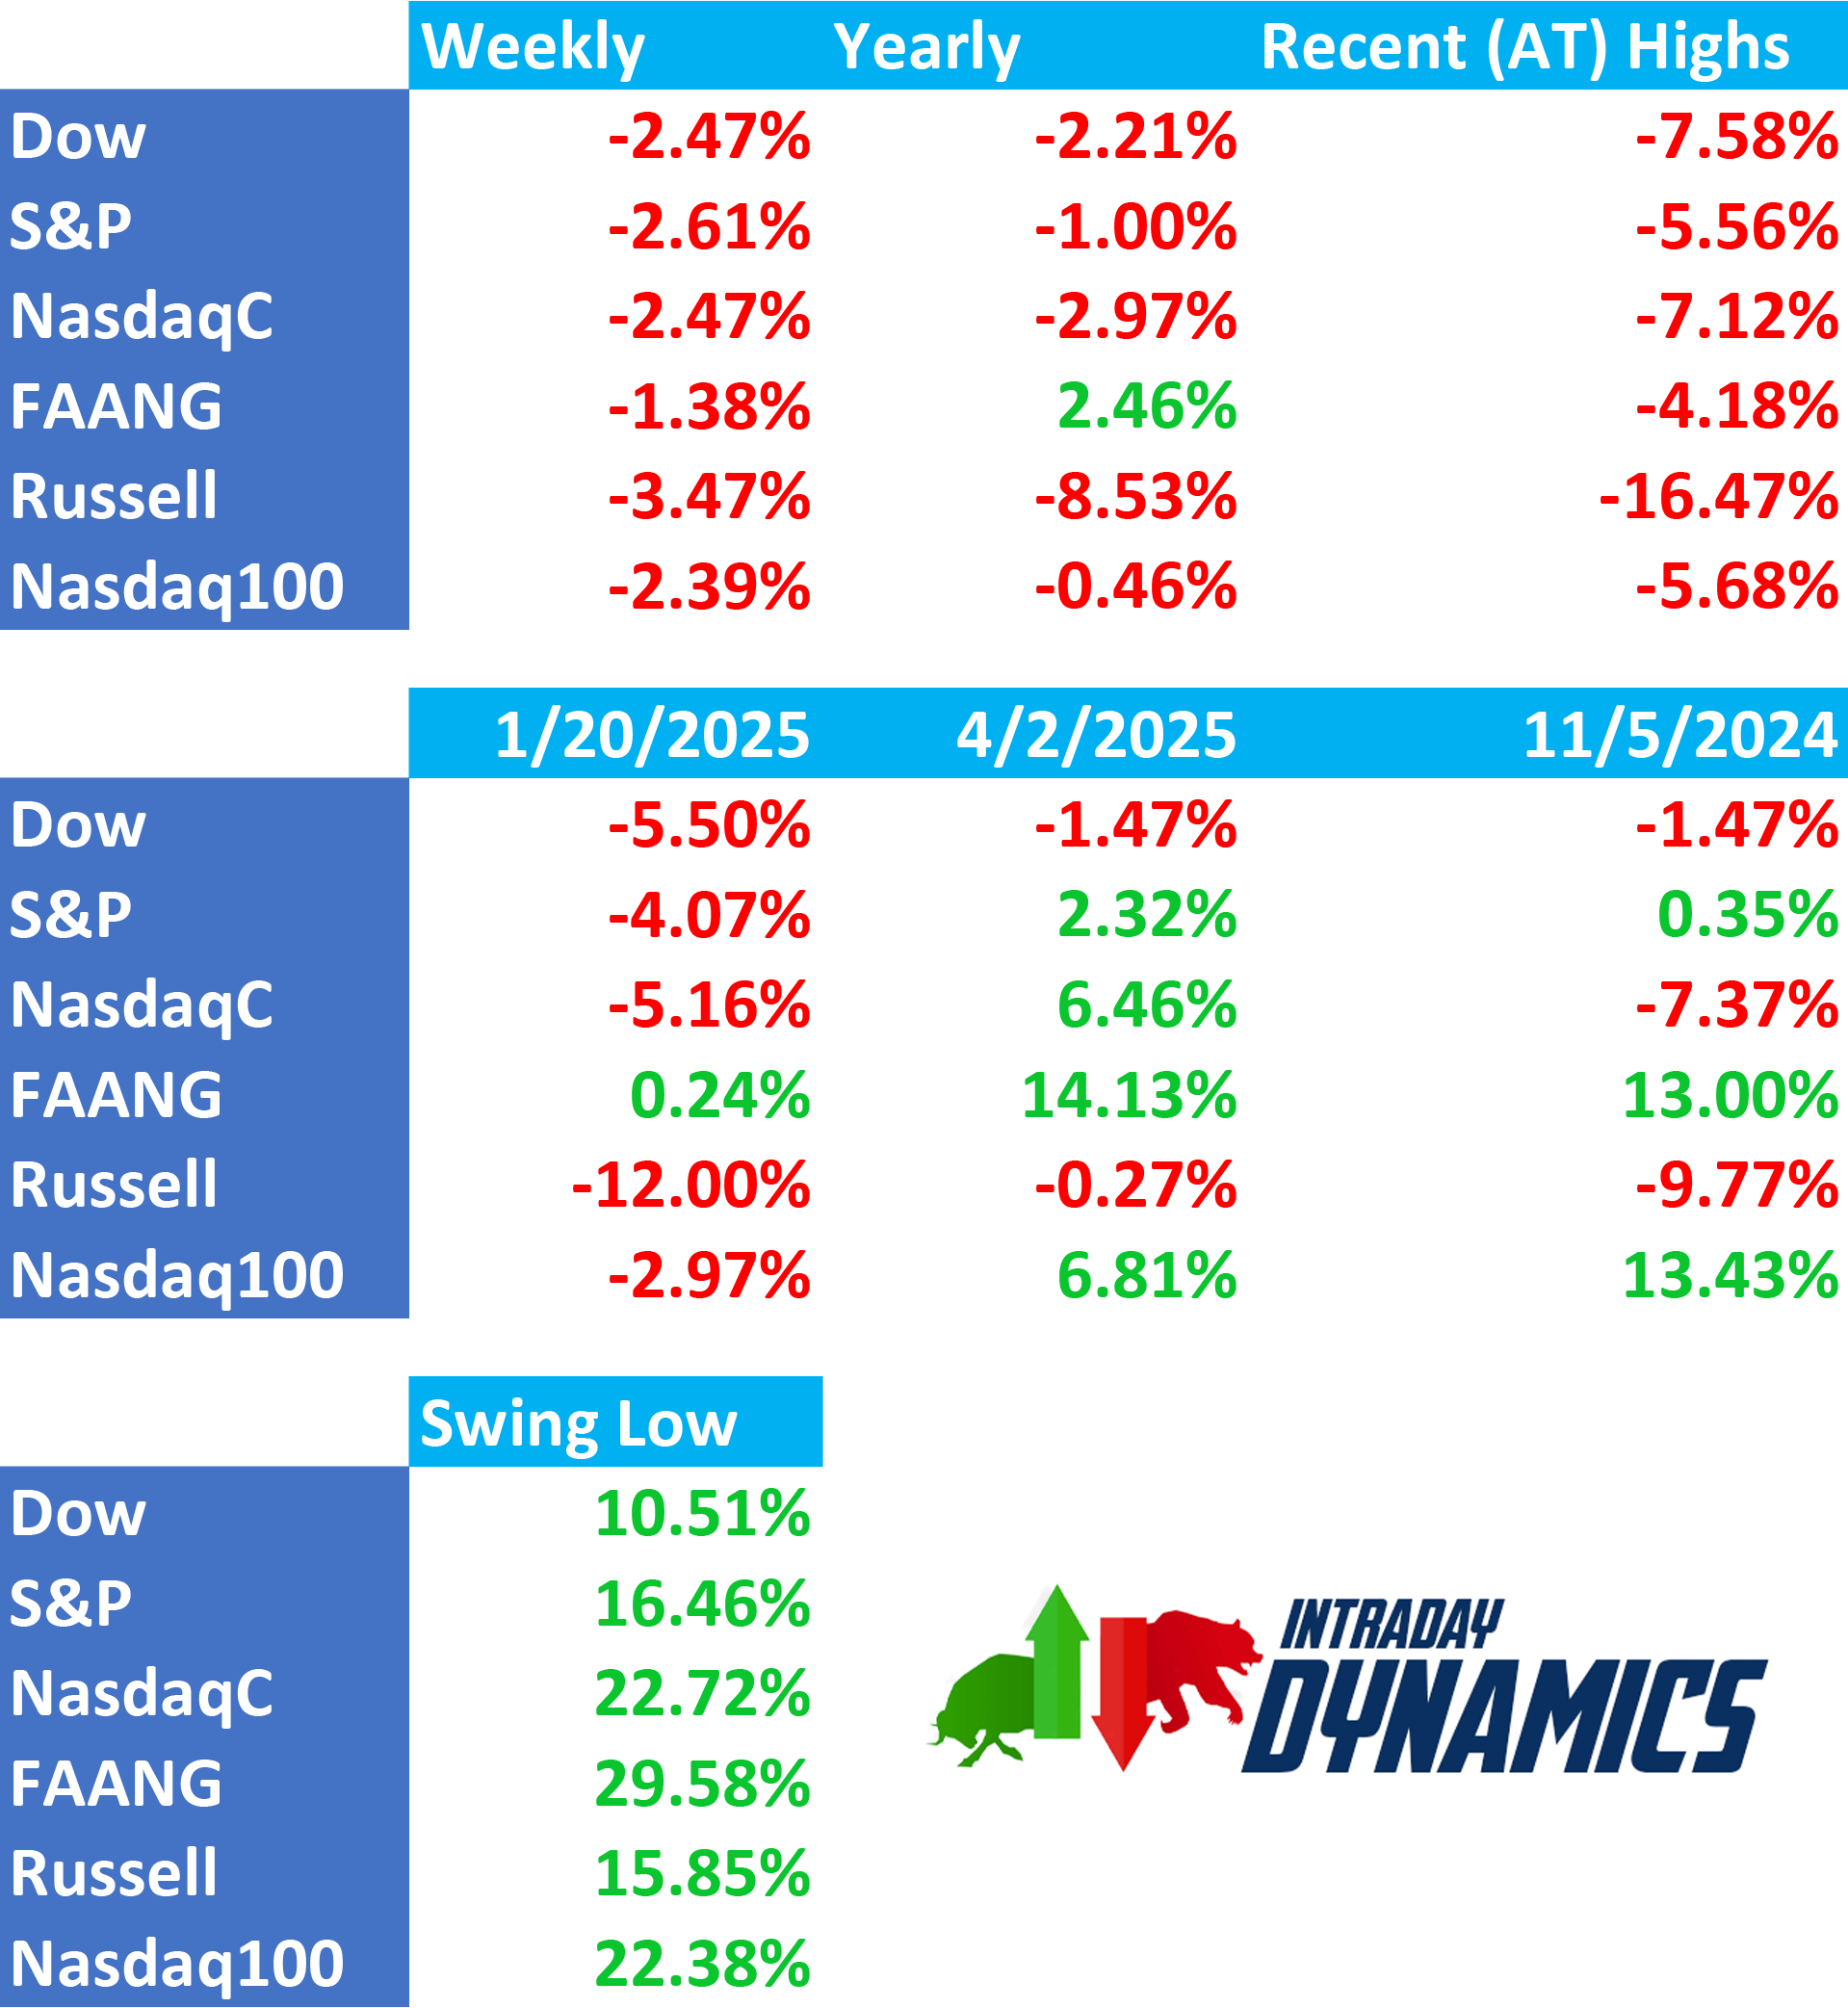
Major Indices Week of May 23, 2025
 NYSE Volume

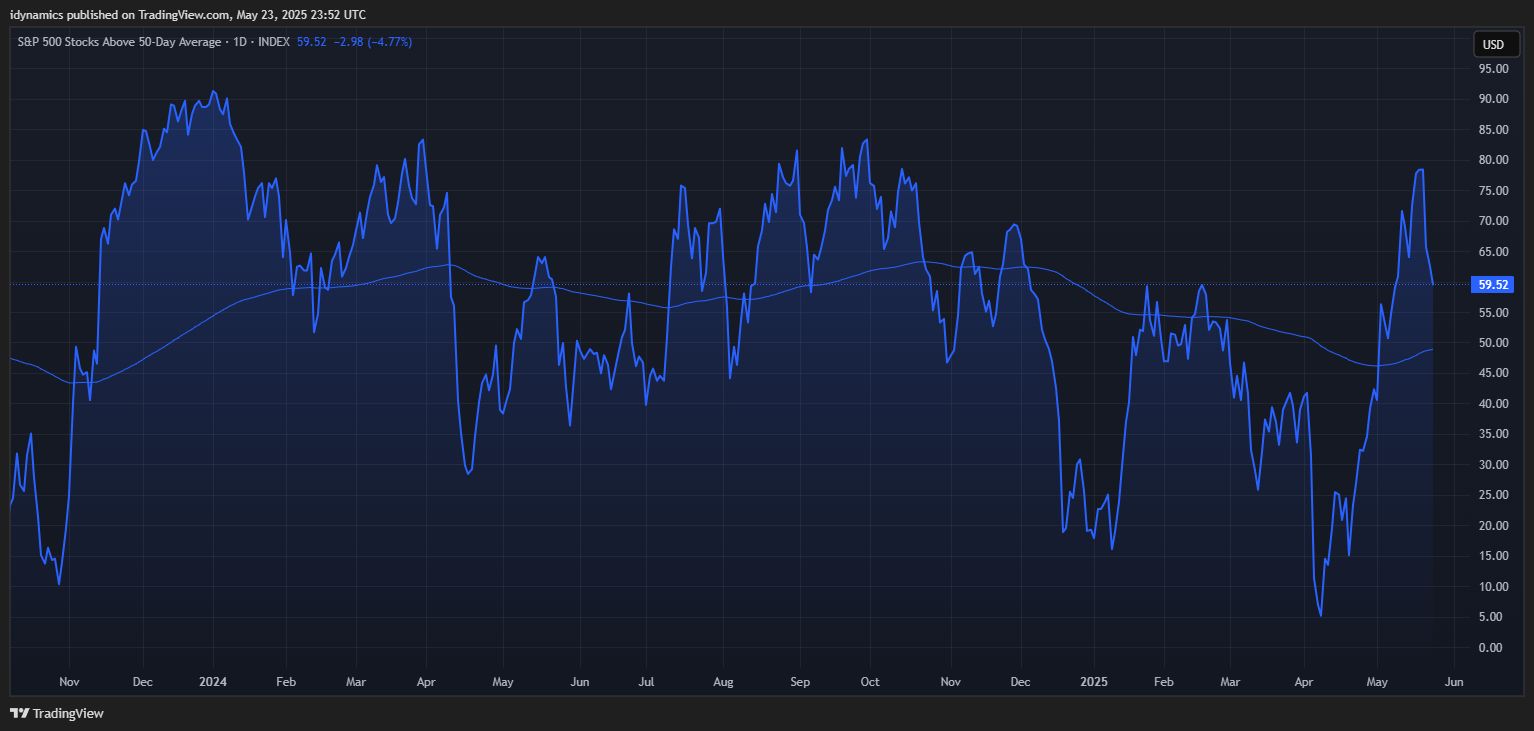
 S&P 500 Stocks Above 50-Day Moving Average
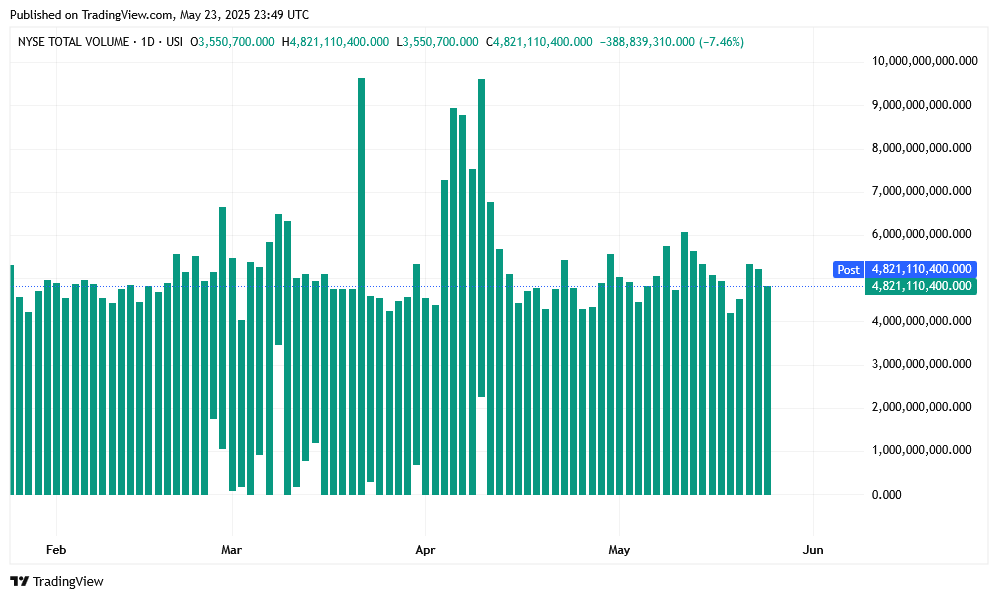
 Stocks were down across the board in mostly outside week down patterns. Monday saw markets open sharply lower following the Moody’s downgrade late Friday but were once again met with massive retail buying of well over $4 billion from small traders. The voracious appetite of retail continues abated as they continue to “Buy the Dip” every single time. By week’s end, those buyers were in the red and it remains to be seen who eventually will win this battle as the funds continue to feed the retail traders into the machine. If history is any predictor, eventually the retail traders will be consumed in a tsunami of selling that they create on their own. It always ends in a head on collision. It also begs the question, where is the leverage coming from to fuel this small-hand stock buying mania?
Hedge Funds Versus the Little Guy
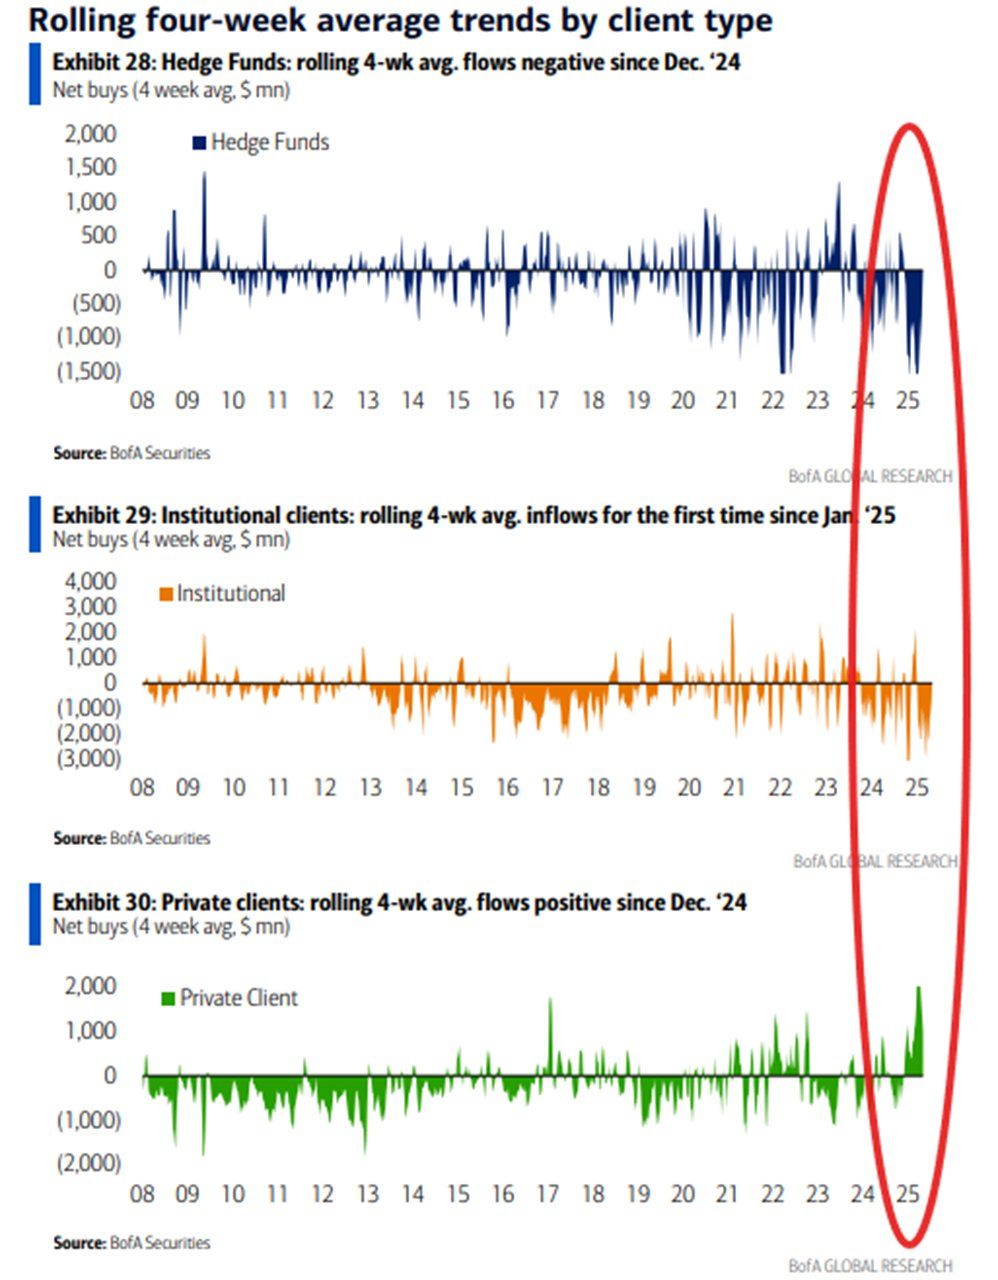 The battle continues between large (smart) money and small (dumb) money.
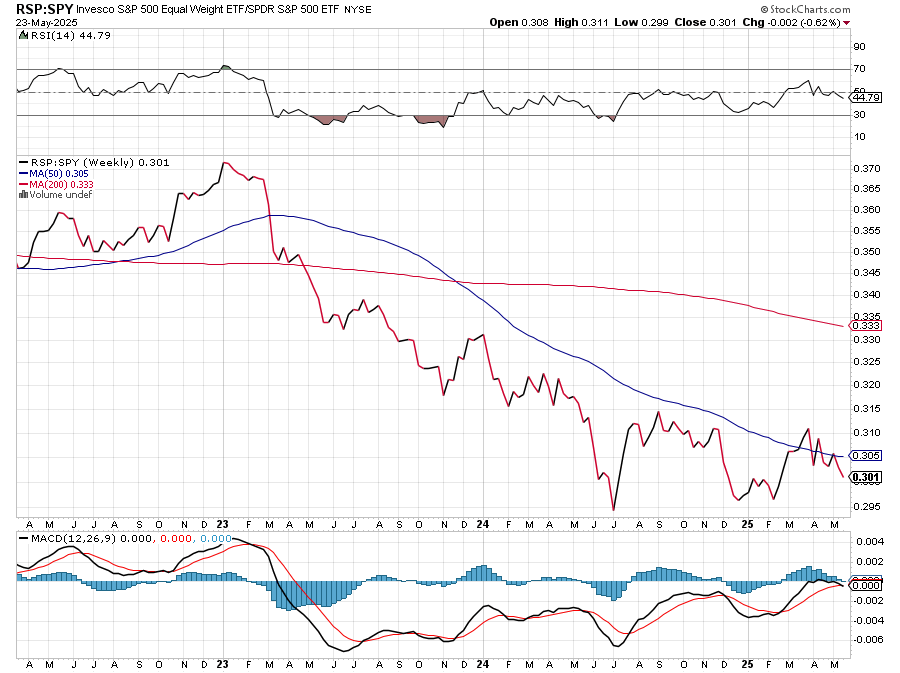
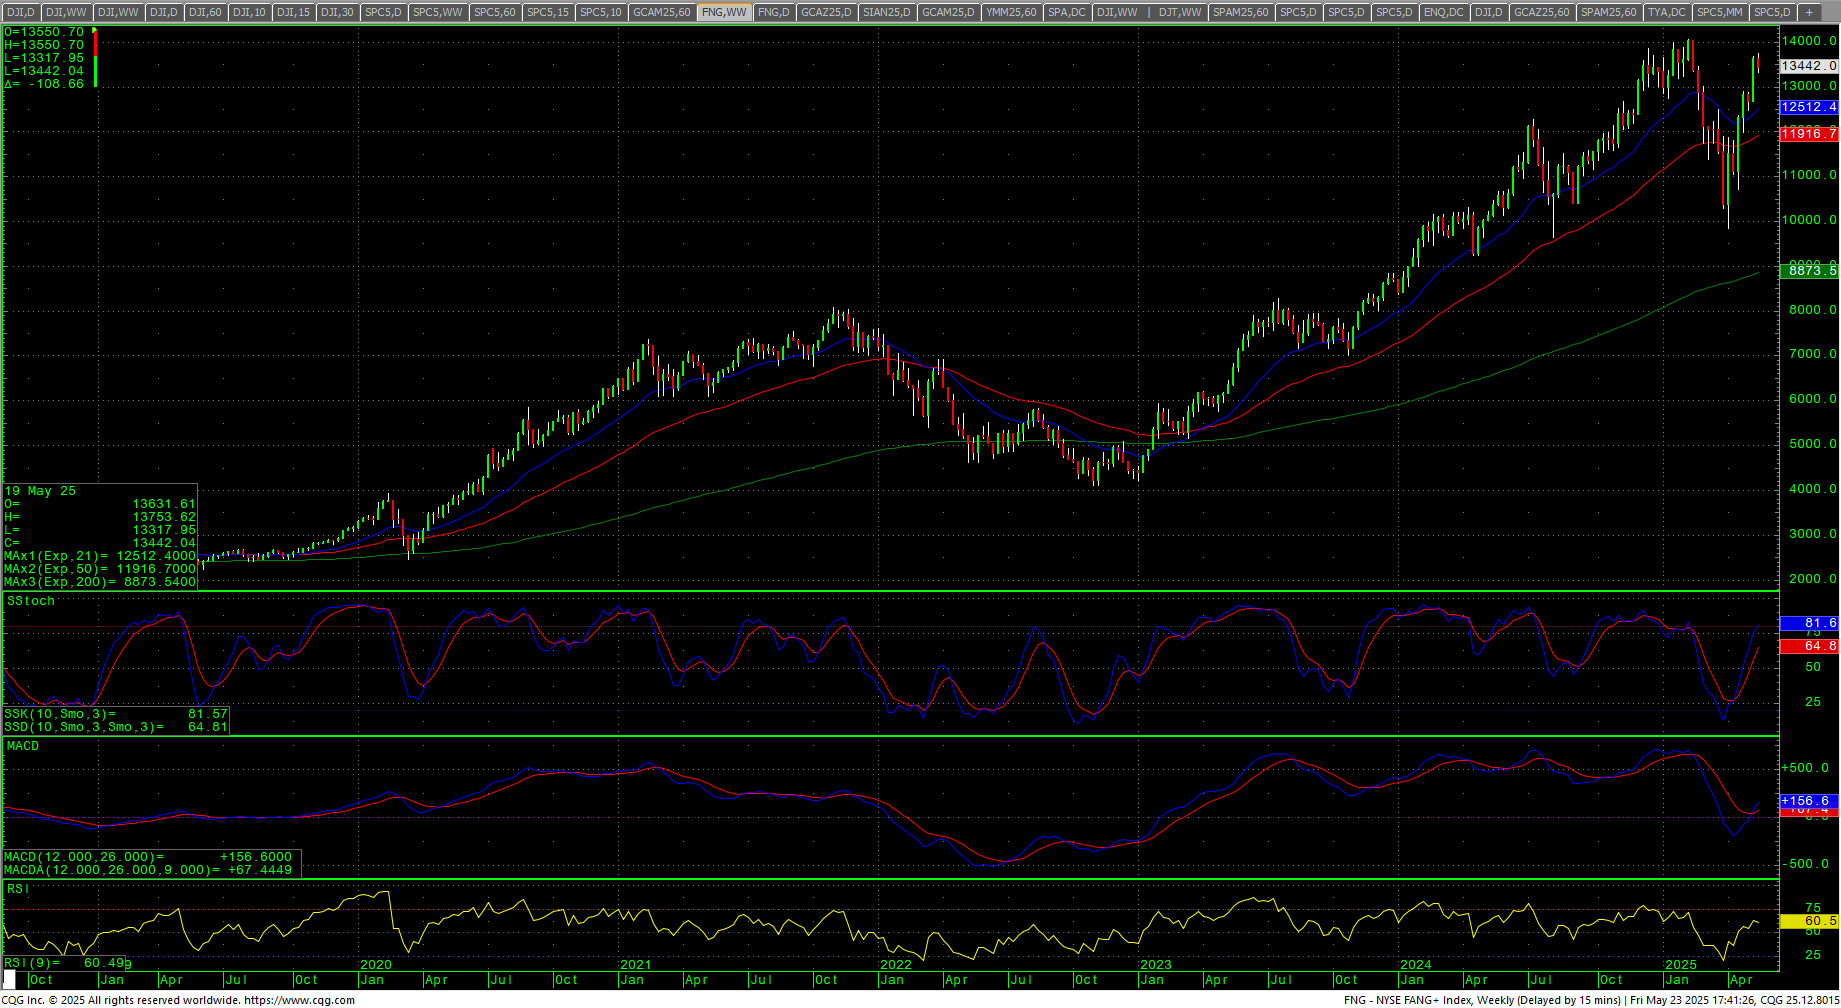
Only the FANG remains higher on the year right now and the Russell is still the worst performer overall. Indeed, the RSP:SPY may be threatening to hook lower once again in oversold territory.
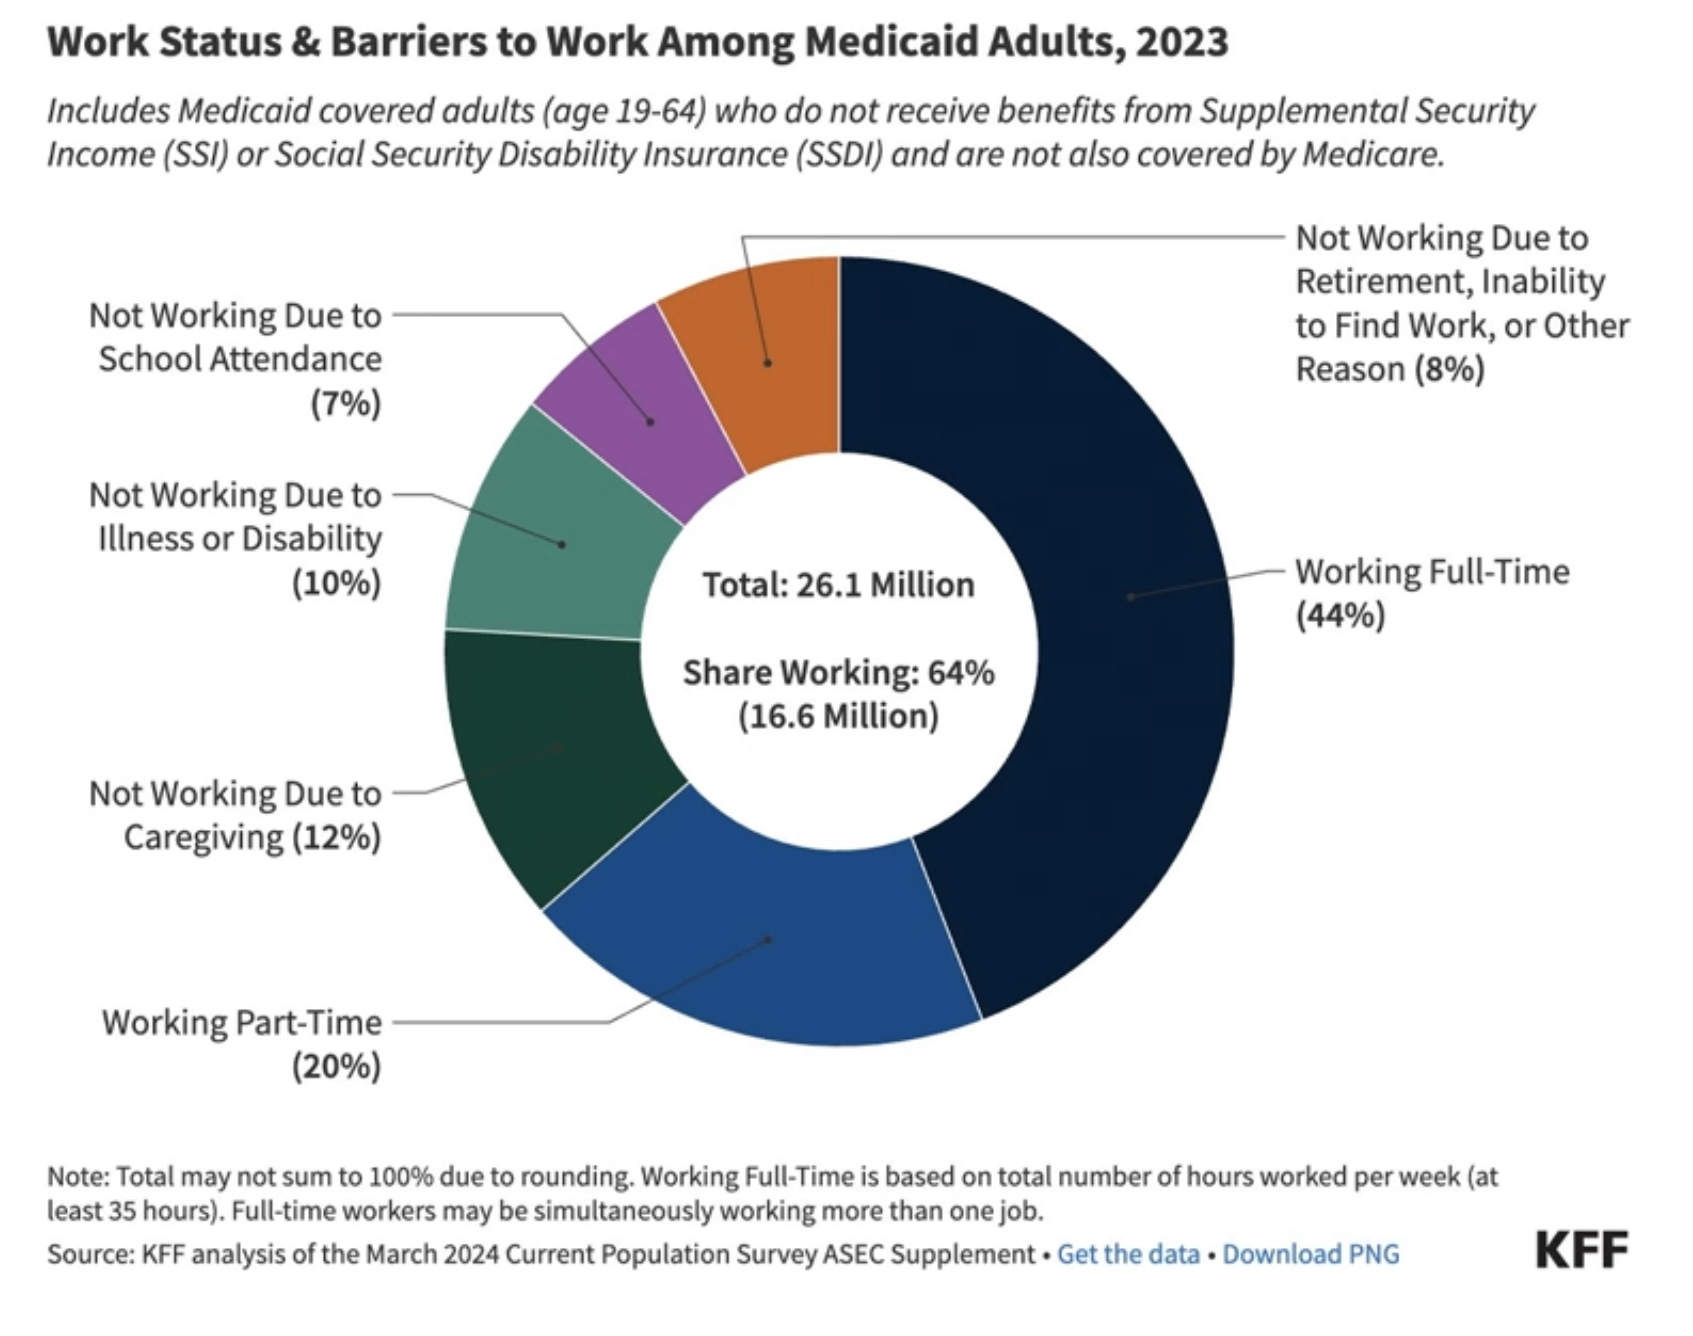
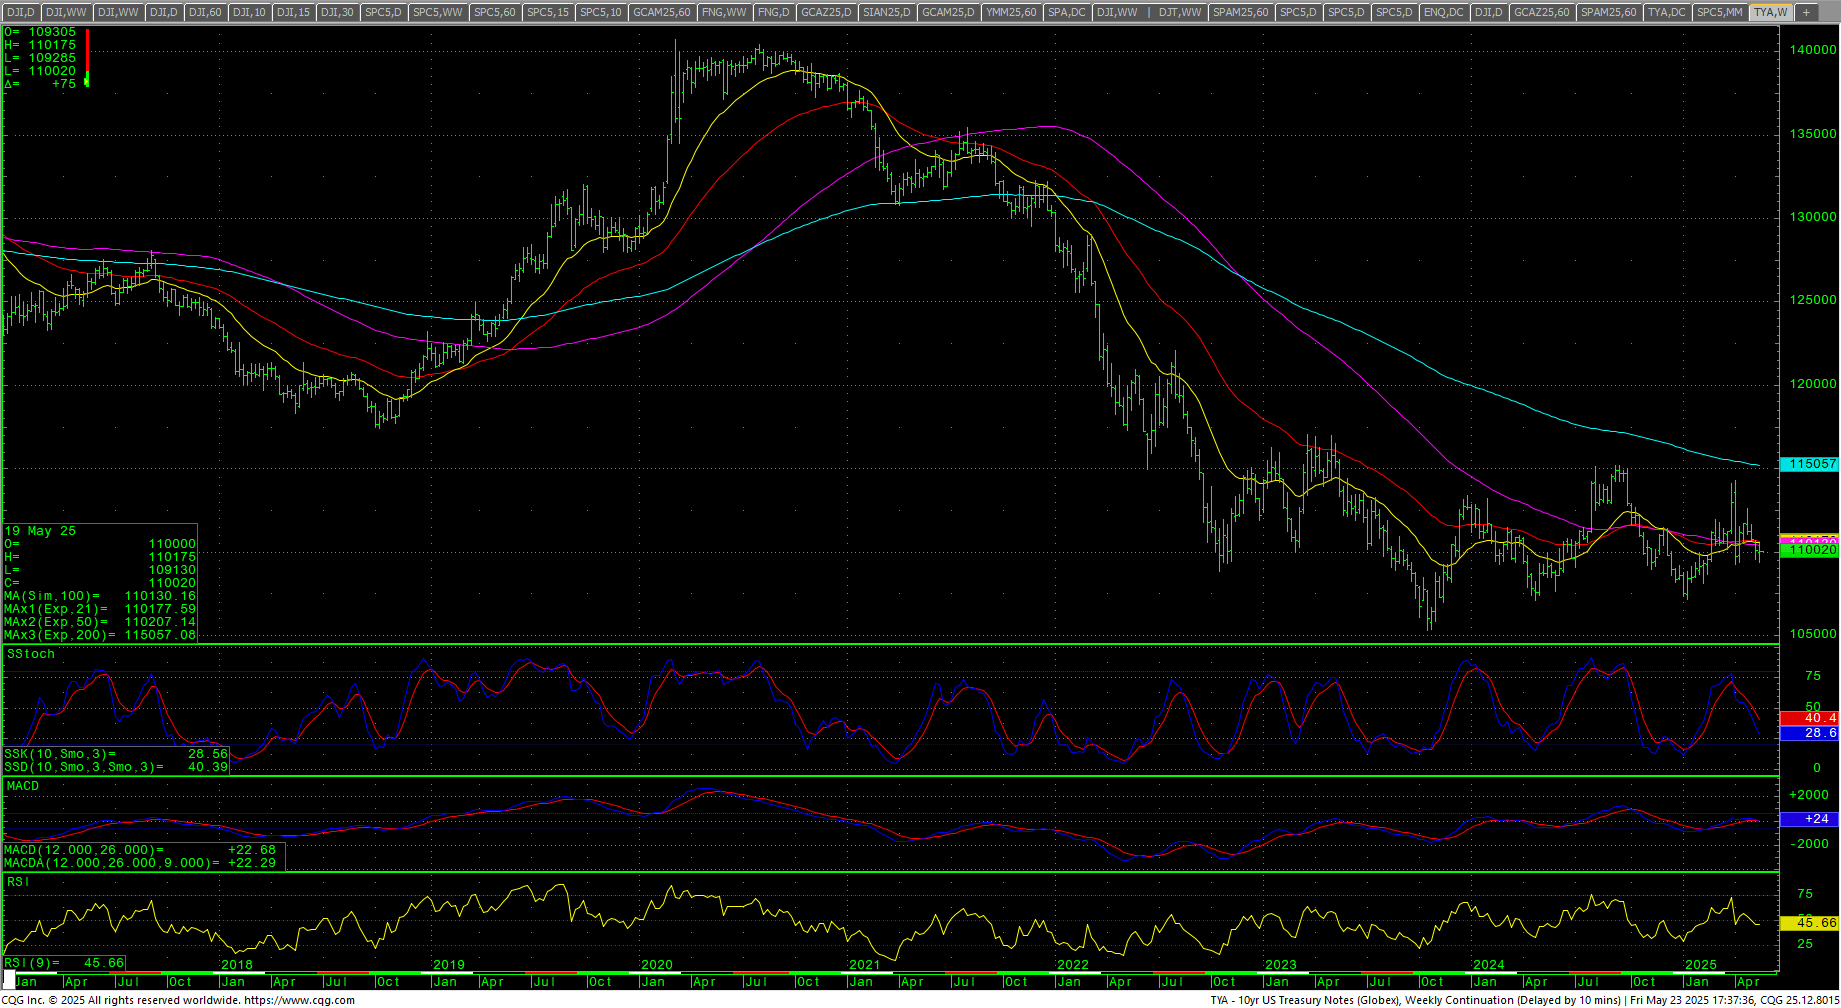
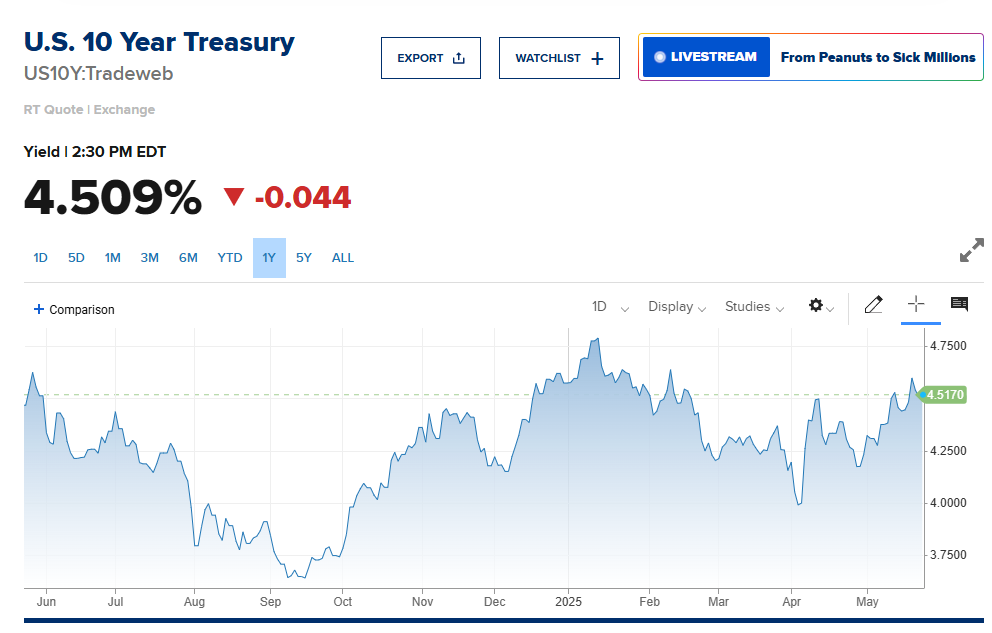
 Fixed-income ruled the week as the Dollar plunged and yields rose with the 10YR taking out 4.6% and the 30YR topping 5.14%…reaching the highest levels since October 2023. Intraweek, the 30YR flirted with 20-year highs. The 20YR auction was the lowest participation since February as bonds were also spooked by the budget-breaking bill being passed in the House where estimates range from as low as +$4 trillion to well over +$10 trillion being added to the current $36+ trillion in debt. It’s basically 2017 on steroids, where the tippy-top 20% gains a massive tax cut while benefits are slashed for the working poor. The flim-flam dragged out the old tropes of “young men playing video games in the basement,” which of course doesn’t represent anything remotely close to Medicaid recipients.
 We are now in Waffle-land, where the Fed is trapped between the looming potential for inflation thanks to Tariff Man and the reality that underlying fundamentals are slowing sharply and threatening stagflation. The bottom line is that the bond markets will continue to dictate reality for equities.
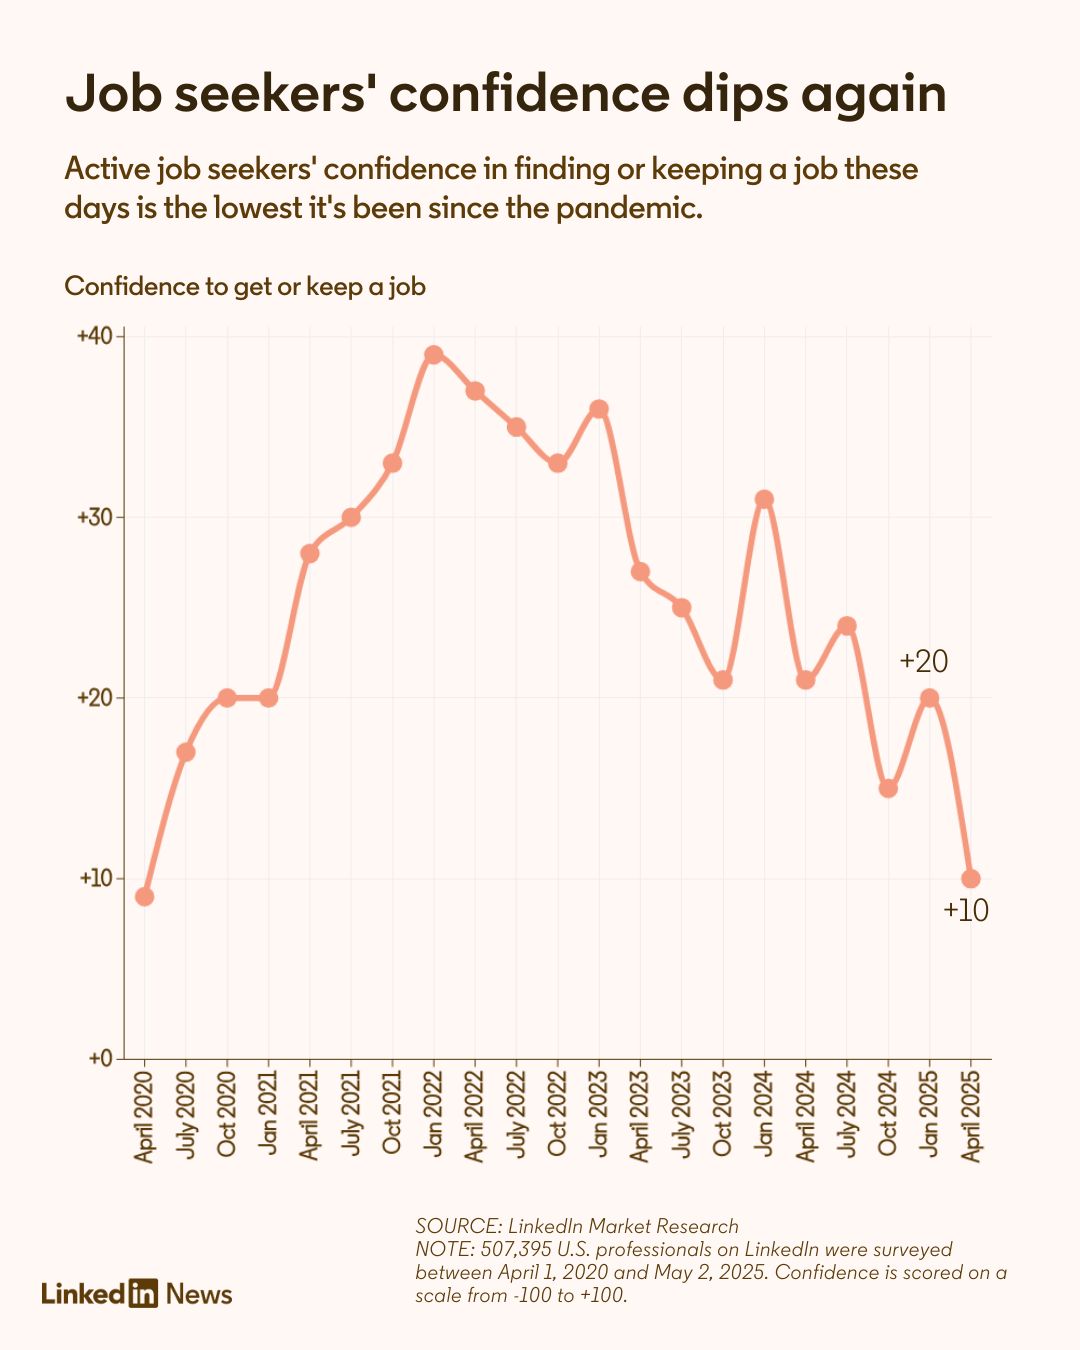
Consumer Sentiment is down sharply as citizens and businesses don’t think that “Strategic Uncertainty” is a “strategy.” This has sunk Job Seeking Confidence to levels not seen since the height of the Pandemic.
 SPX Daily Candles
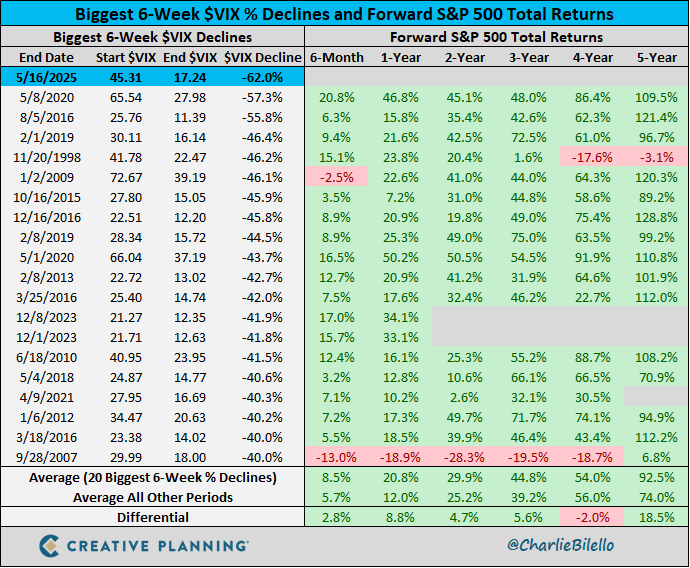
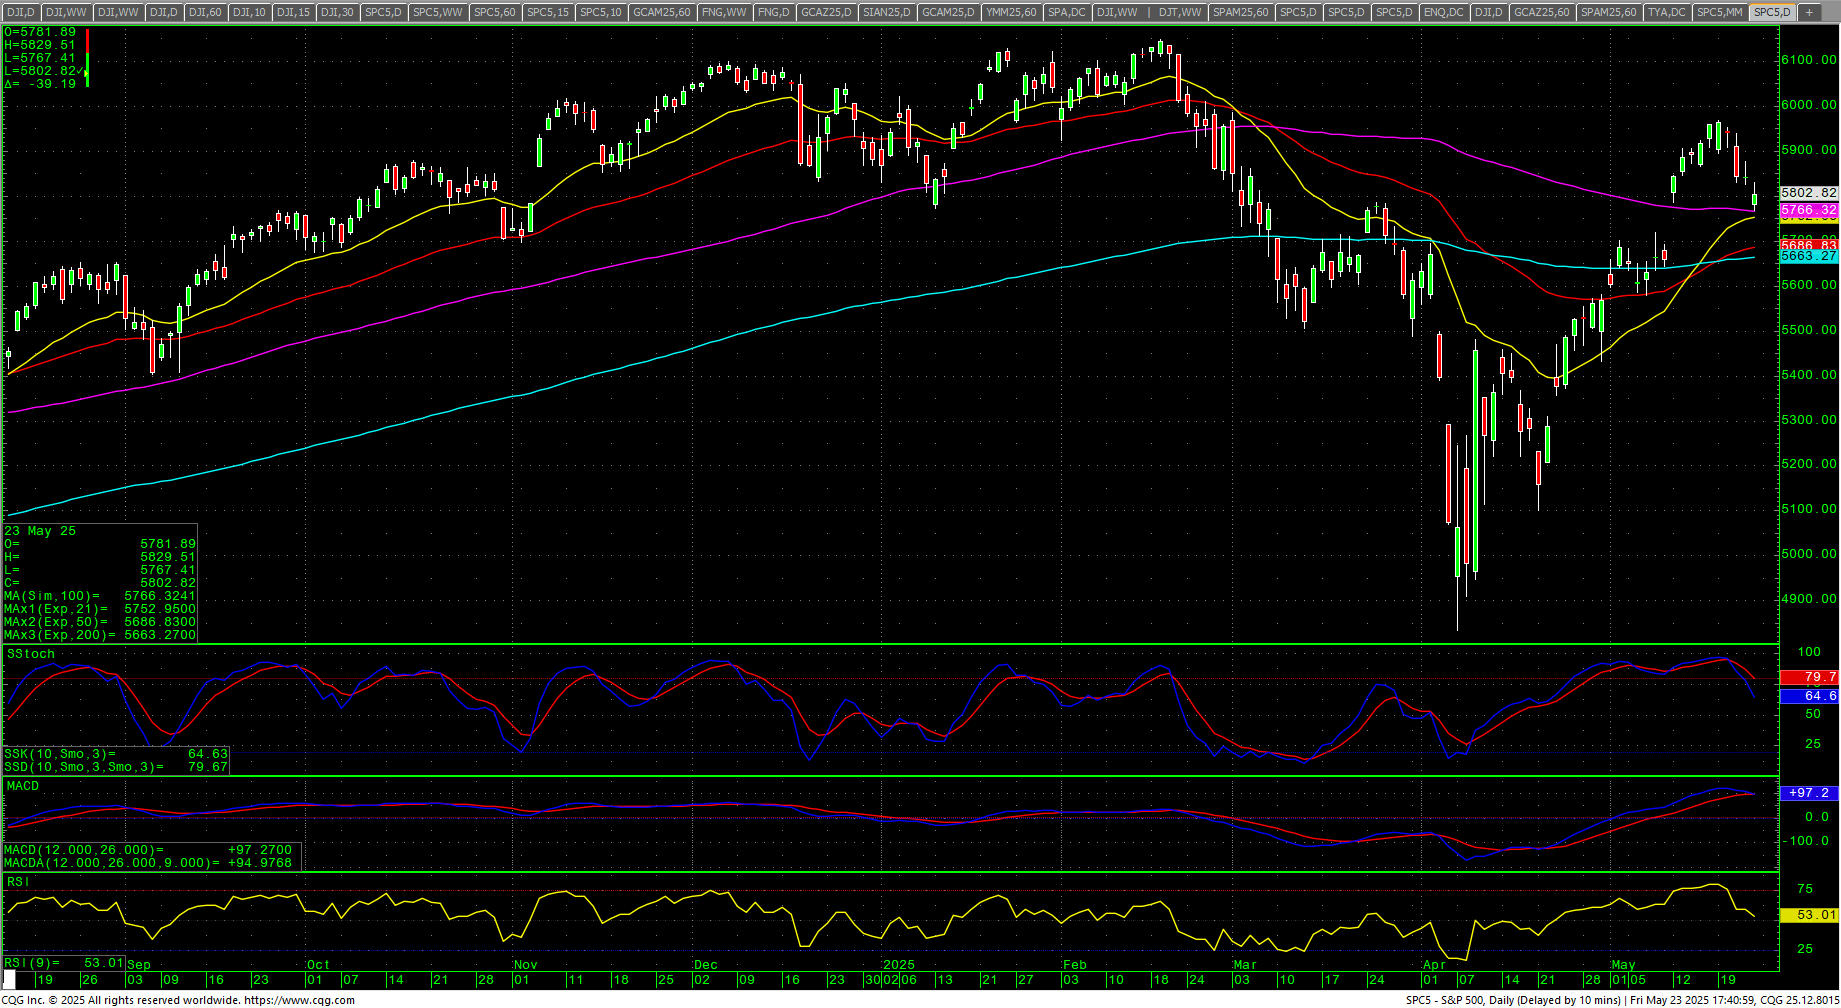 On 10 April 2025, the SPX issued a Death Cross…and on Monday’s retail-fueled rally, the SPX daily issued a Golden Cross. Both of these technical indicators occurred with sentiment at sharp extremes. Historically, whenever a market takes out the 200-day after trading below it in a break, it is often followed by a return to the 200-day. For the SPX, that sits at 5663.27 on Friday’s close. That’s 139.55 points or a further down move of -2.43%. As Charlie Bilello pointed out last week:
The 62% decline in the $VIX over the last 6 weeks is the biggest volatility crash in history.
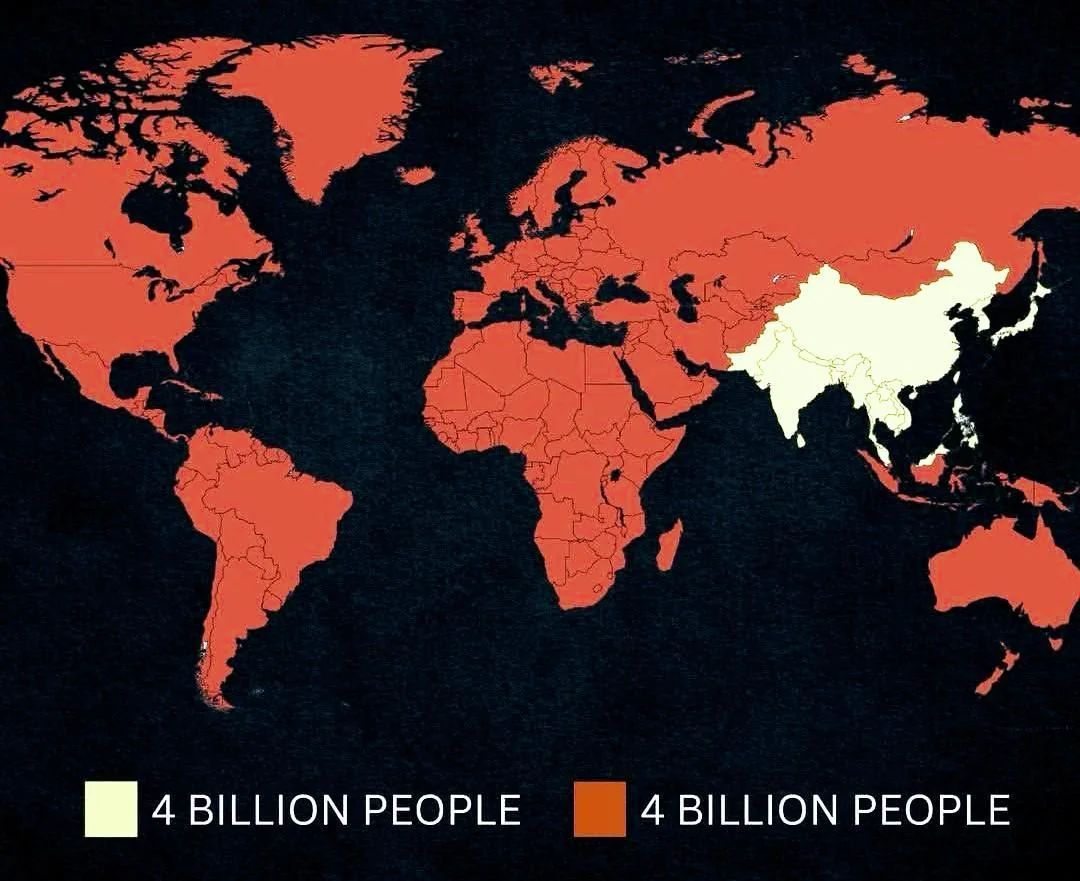 Is trade eventually going to come down to China versus the world, or will it be China AND the world against the USA if the USA continues to poke people in the eye? May the odds be ever in your favor. Bears such as Michael Burry are saying a 2008 event is coming in the next 12+ months,
MAGS (Magnificent 7) Weekly Candles
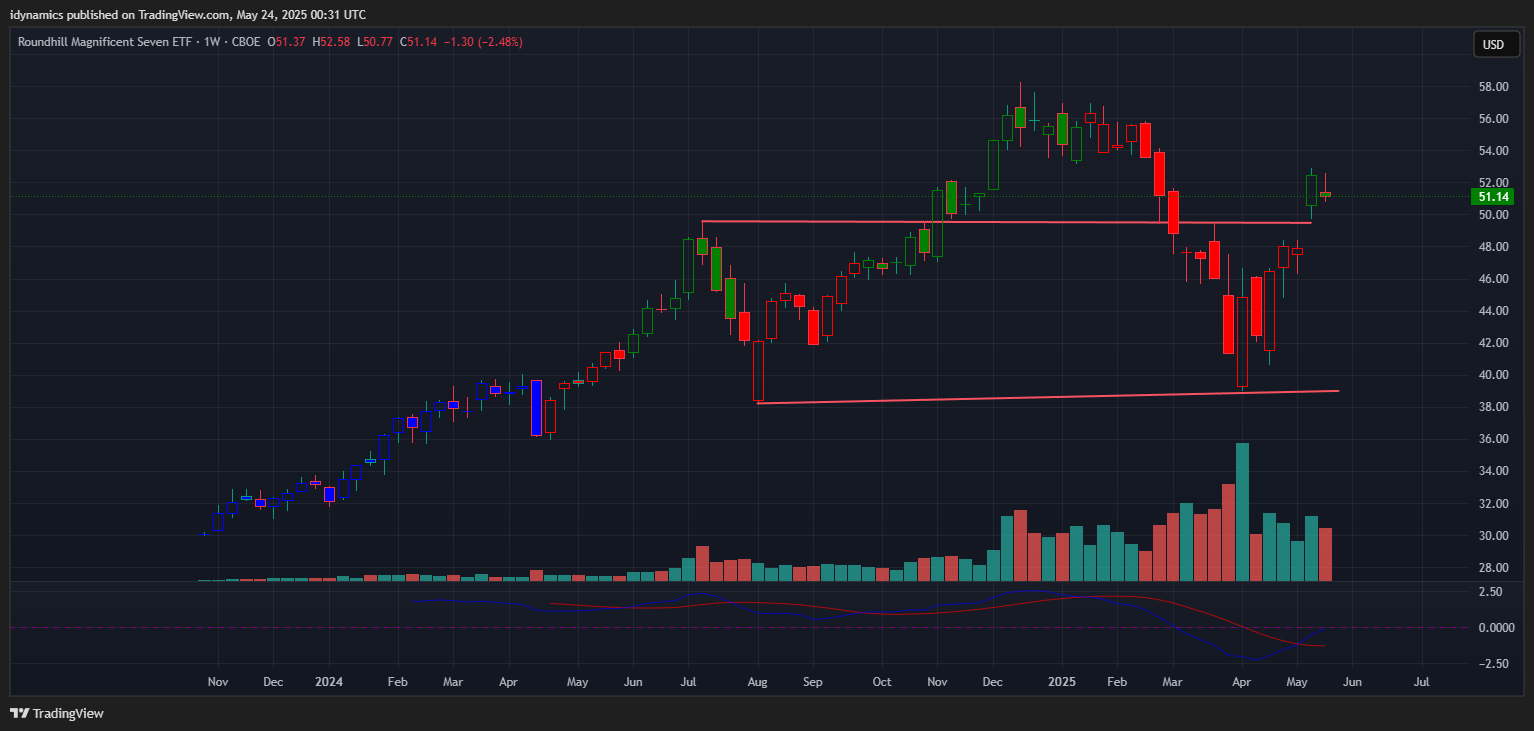 The MAGS (Magnificent 7) traded an inside week and closed on the low end of the range, down -2.48% on the week as prices remain above the critical right shoulder at 50 on the daily/weekly charts. Resistance remains key at 53.16. Daily closes over 53.16 will increase the bullish view for the chart and open potential for a test of the highs. A break back under 50 should accelerate selling again.
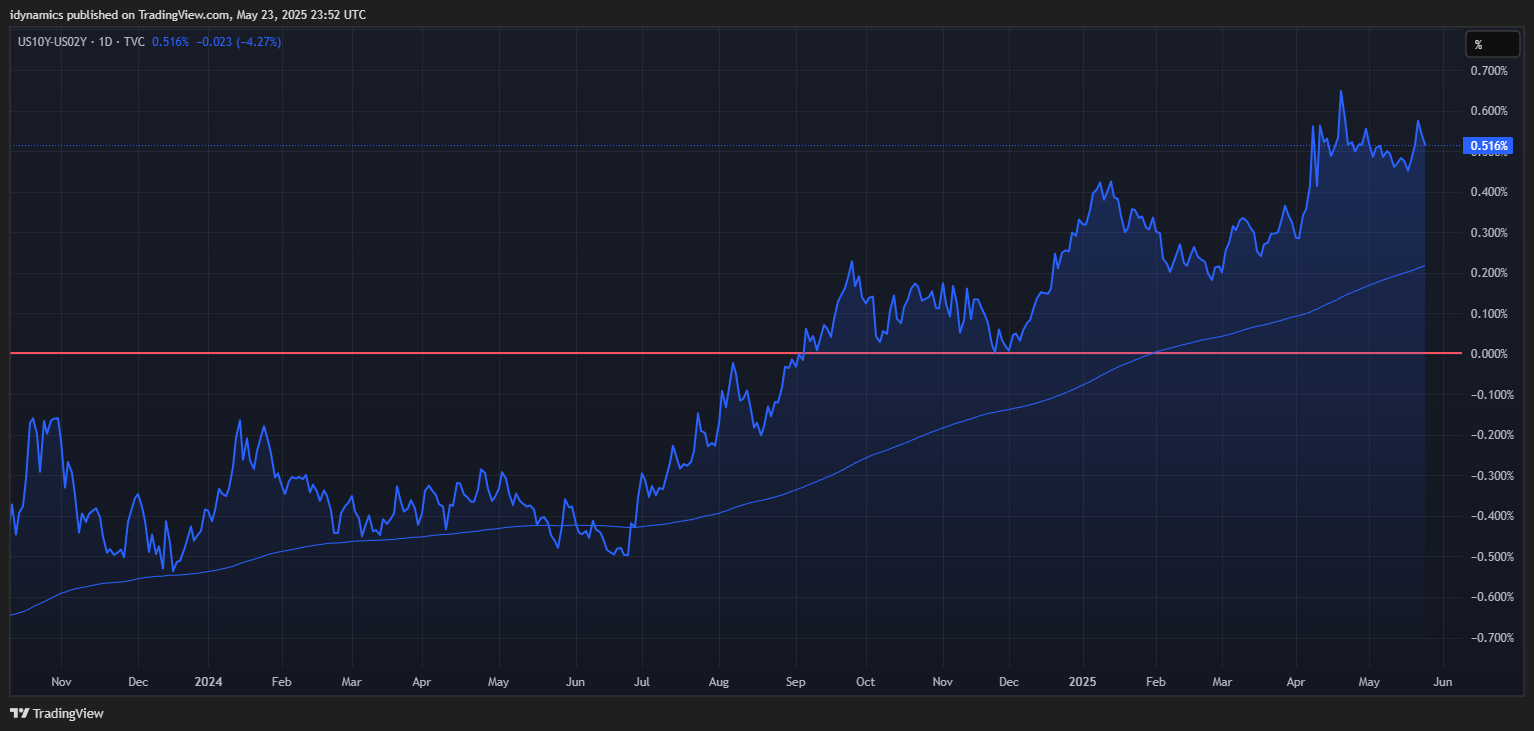
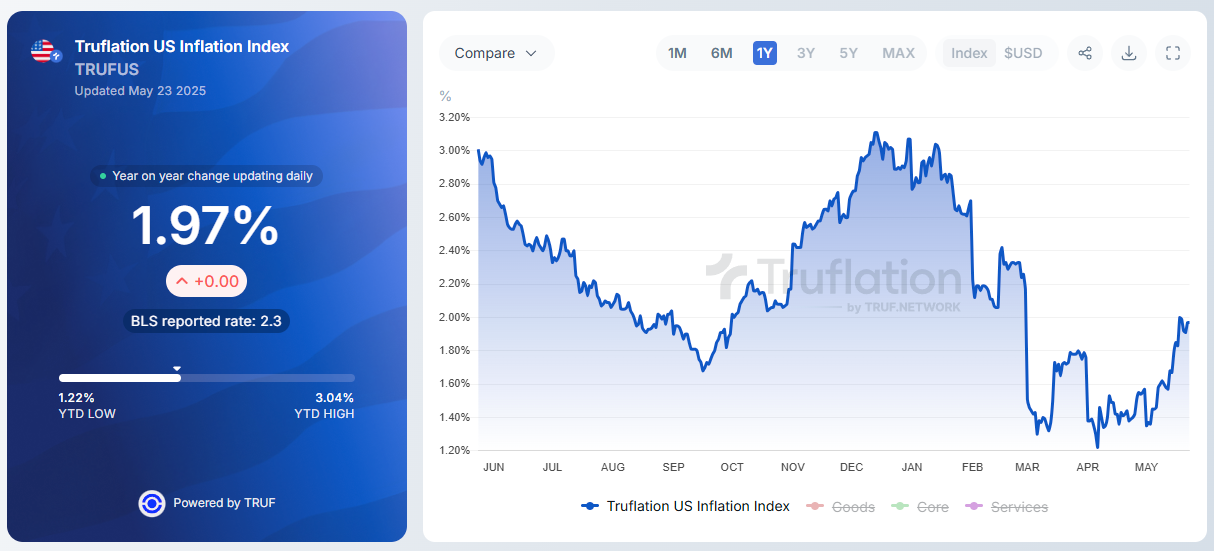
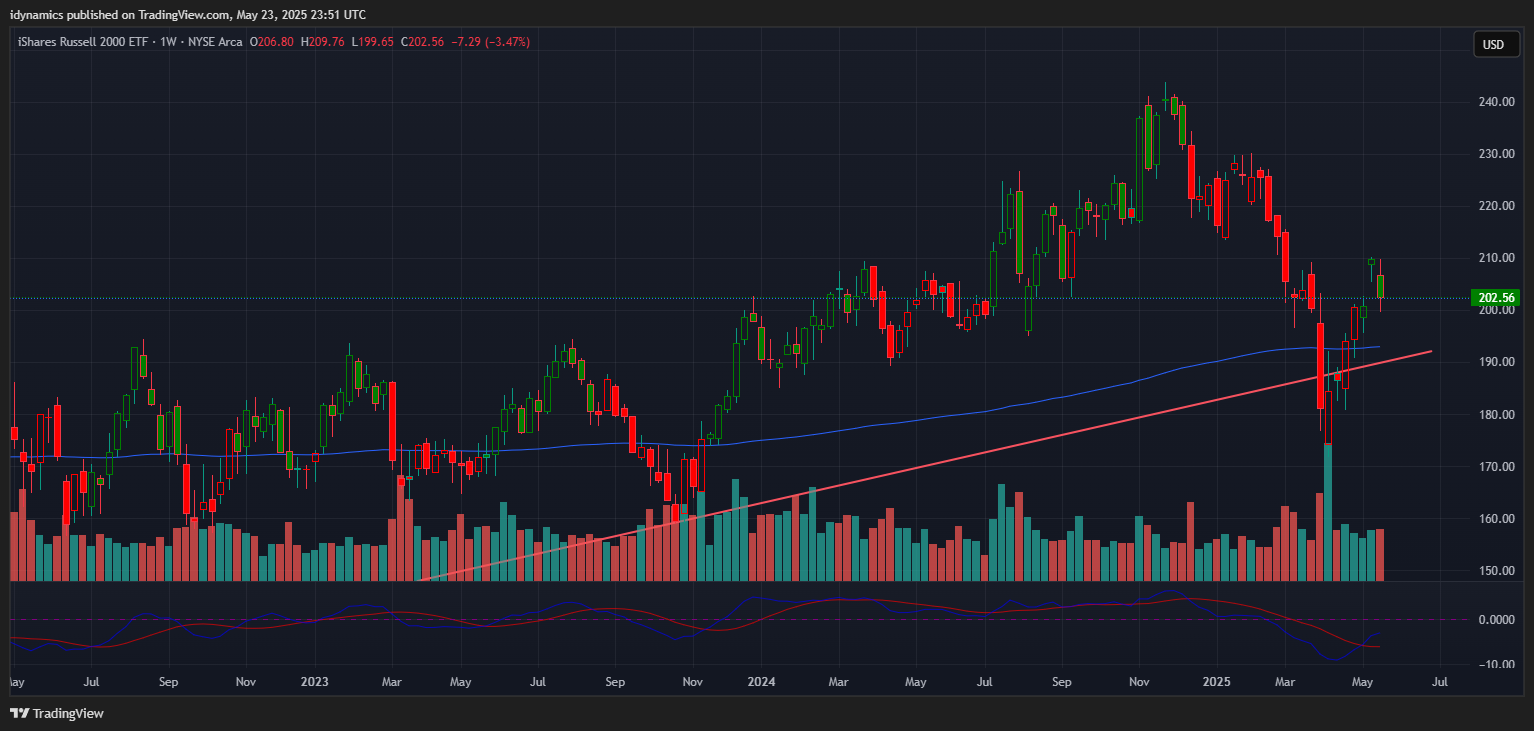
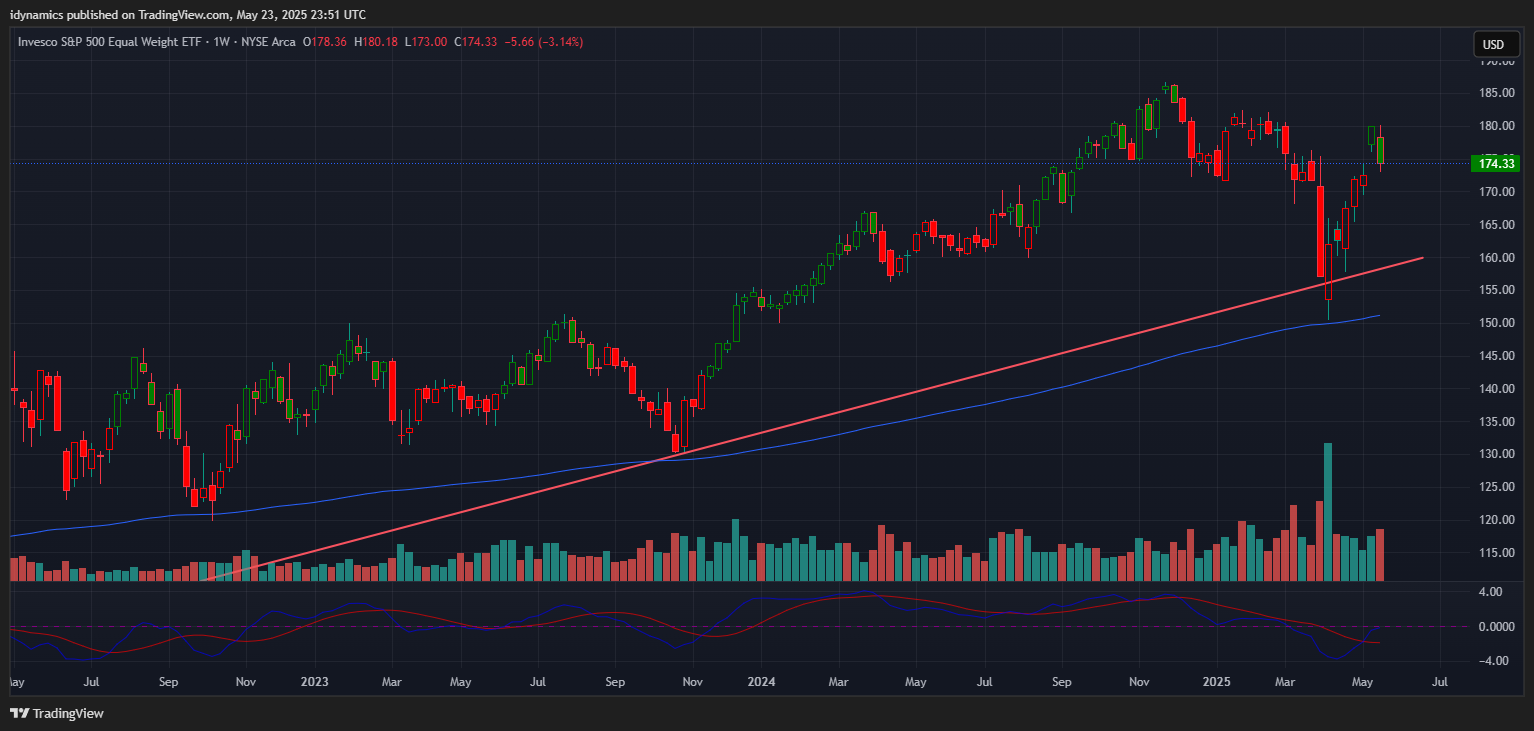
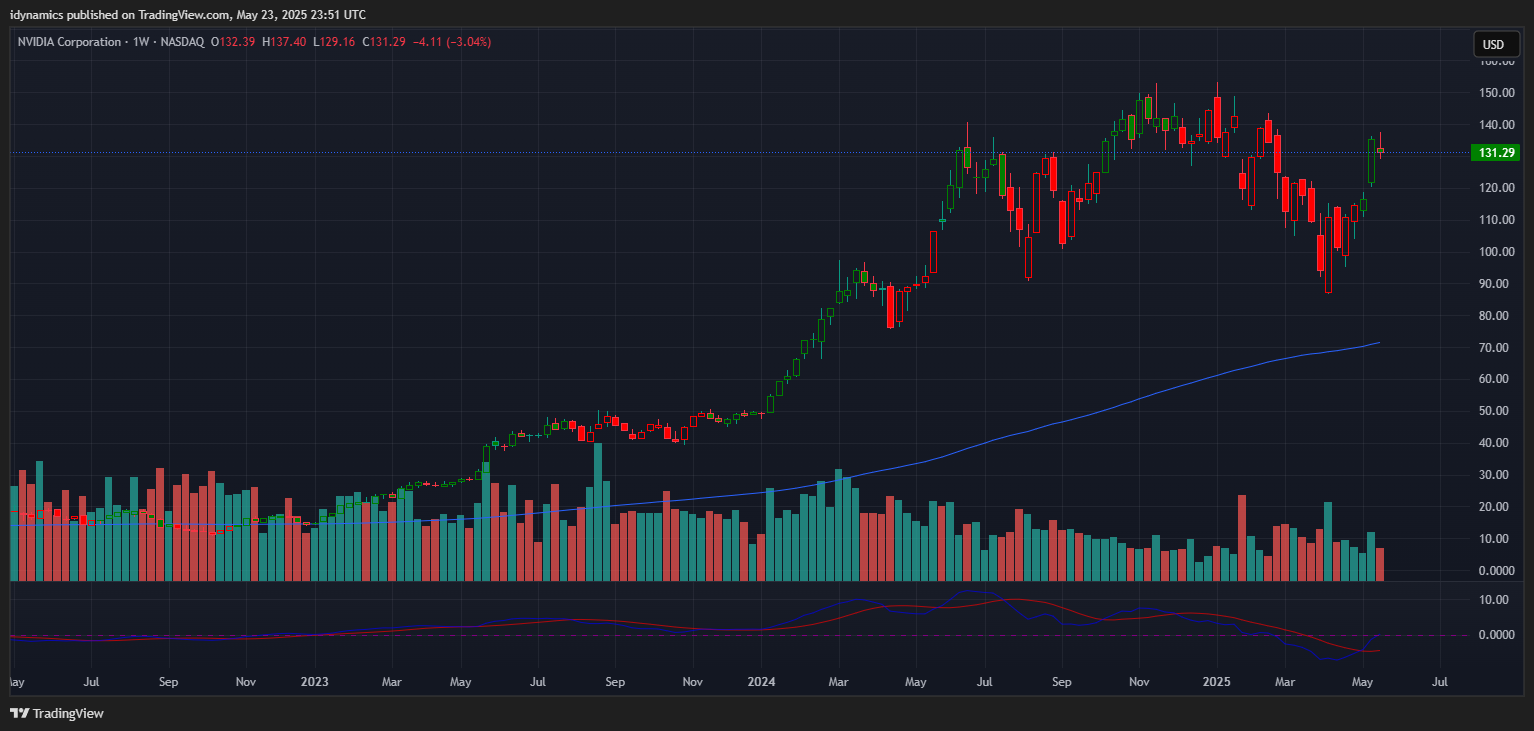
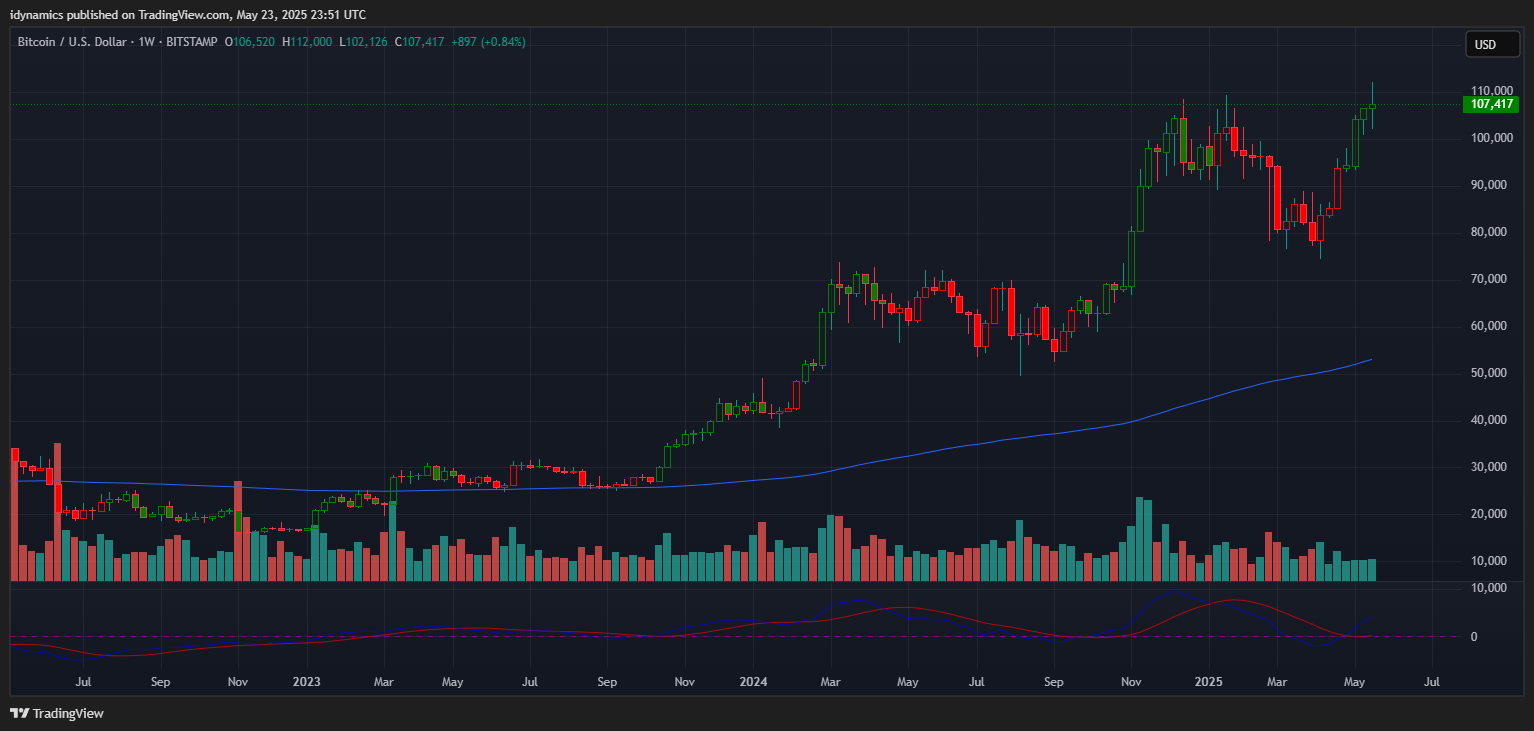
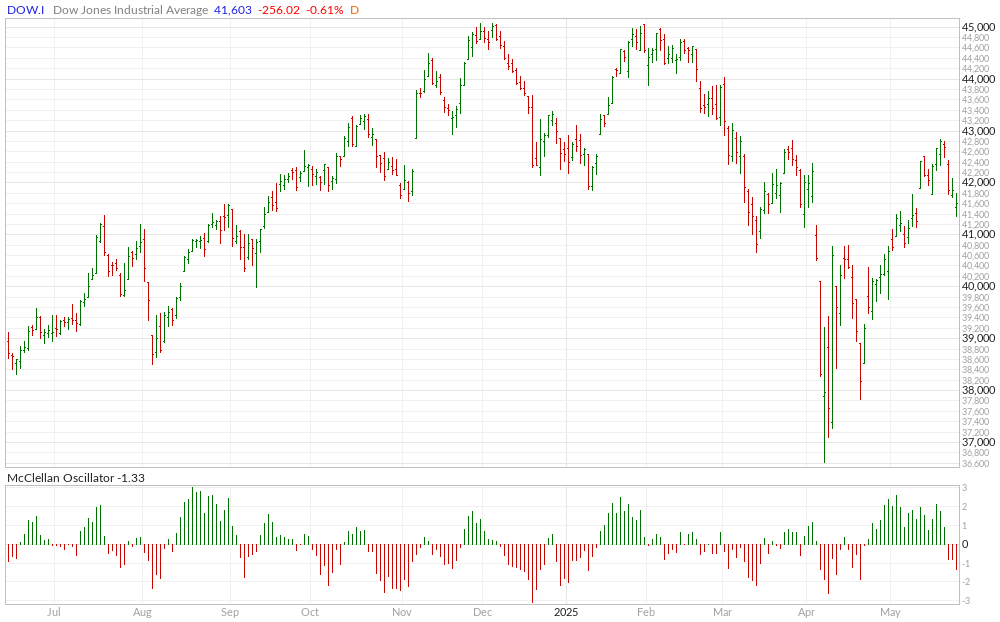
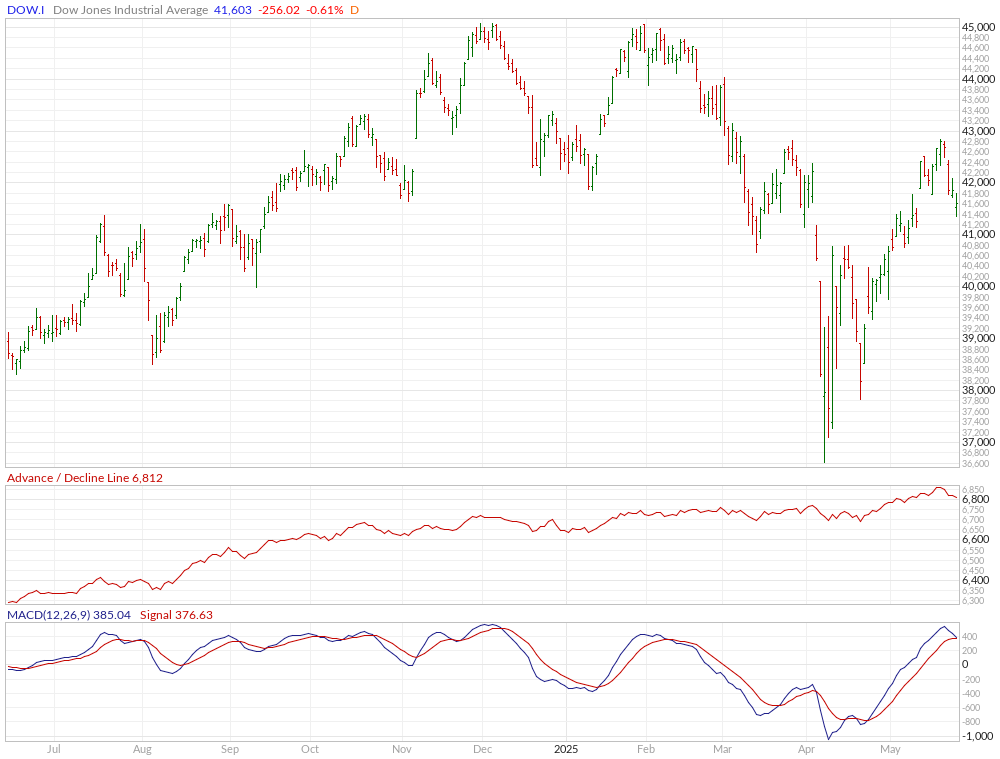
The RSP:SPY closed lower and the weekly is threatening to hook lower in an oversold position as the MACD is trying to turn back down. The IWM capitulated for the first bearish candle in seven weeks as it fell back and filled in the gaps from two weeks prior, down -3.47% for the week. The RSP was down -3.17% as it also broke the uptrend and filled in gaps. NVDA reversed lower after its crazy and explosive week, settling on the bottom of the range, down -3.04%. Bitcoin rallied to record highs and sold off late in the week to settle up +1.06% but leaving a Doji on the chart. McClellan Oscillators are confirming the recent weakness in the Dow. The Yield Curve continued to expand as the 10s rallied and 2s stayed flat, closing out the week at +0.516%. The 10YR yield soared to an intraweek high of 4.61% and closed higher at 4.509%. Truflation jumped to 1.97%.
10YR-2YR Yield Curve Daily

 VIX Weekly H-L-C
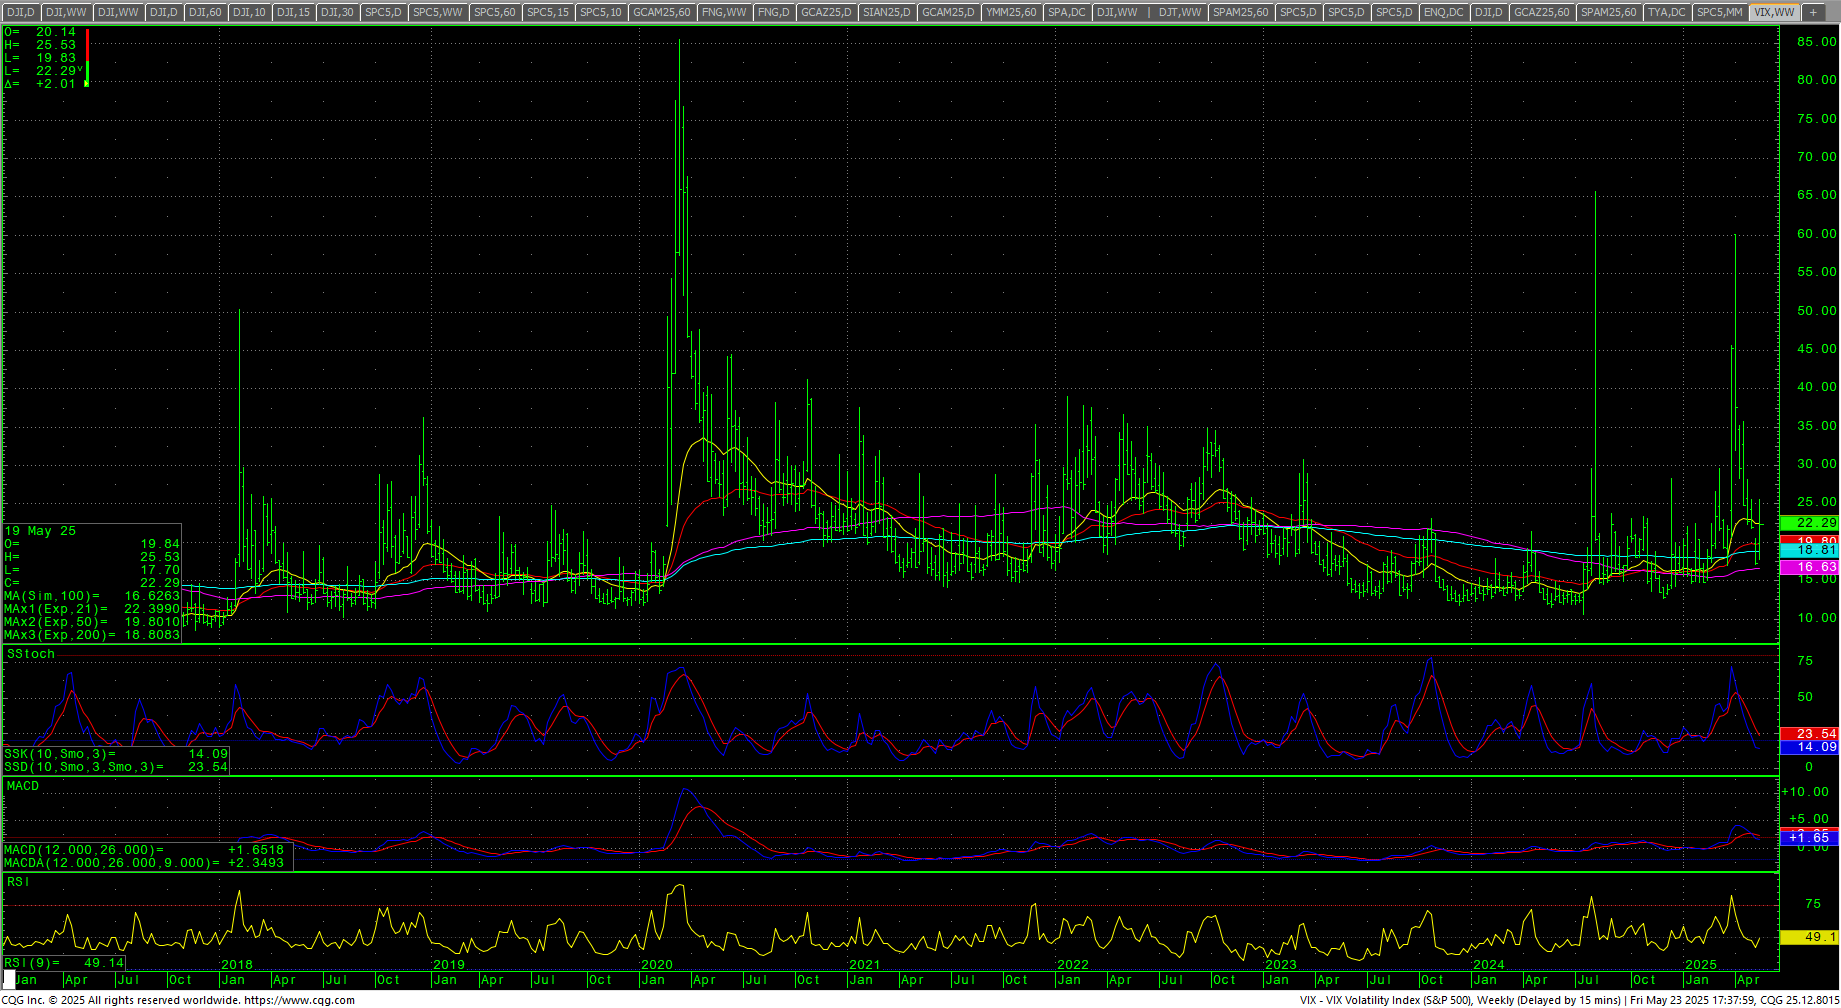
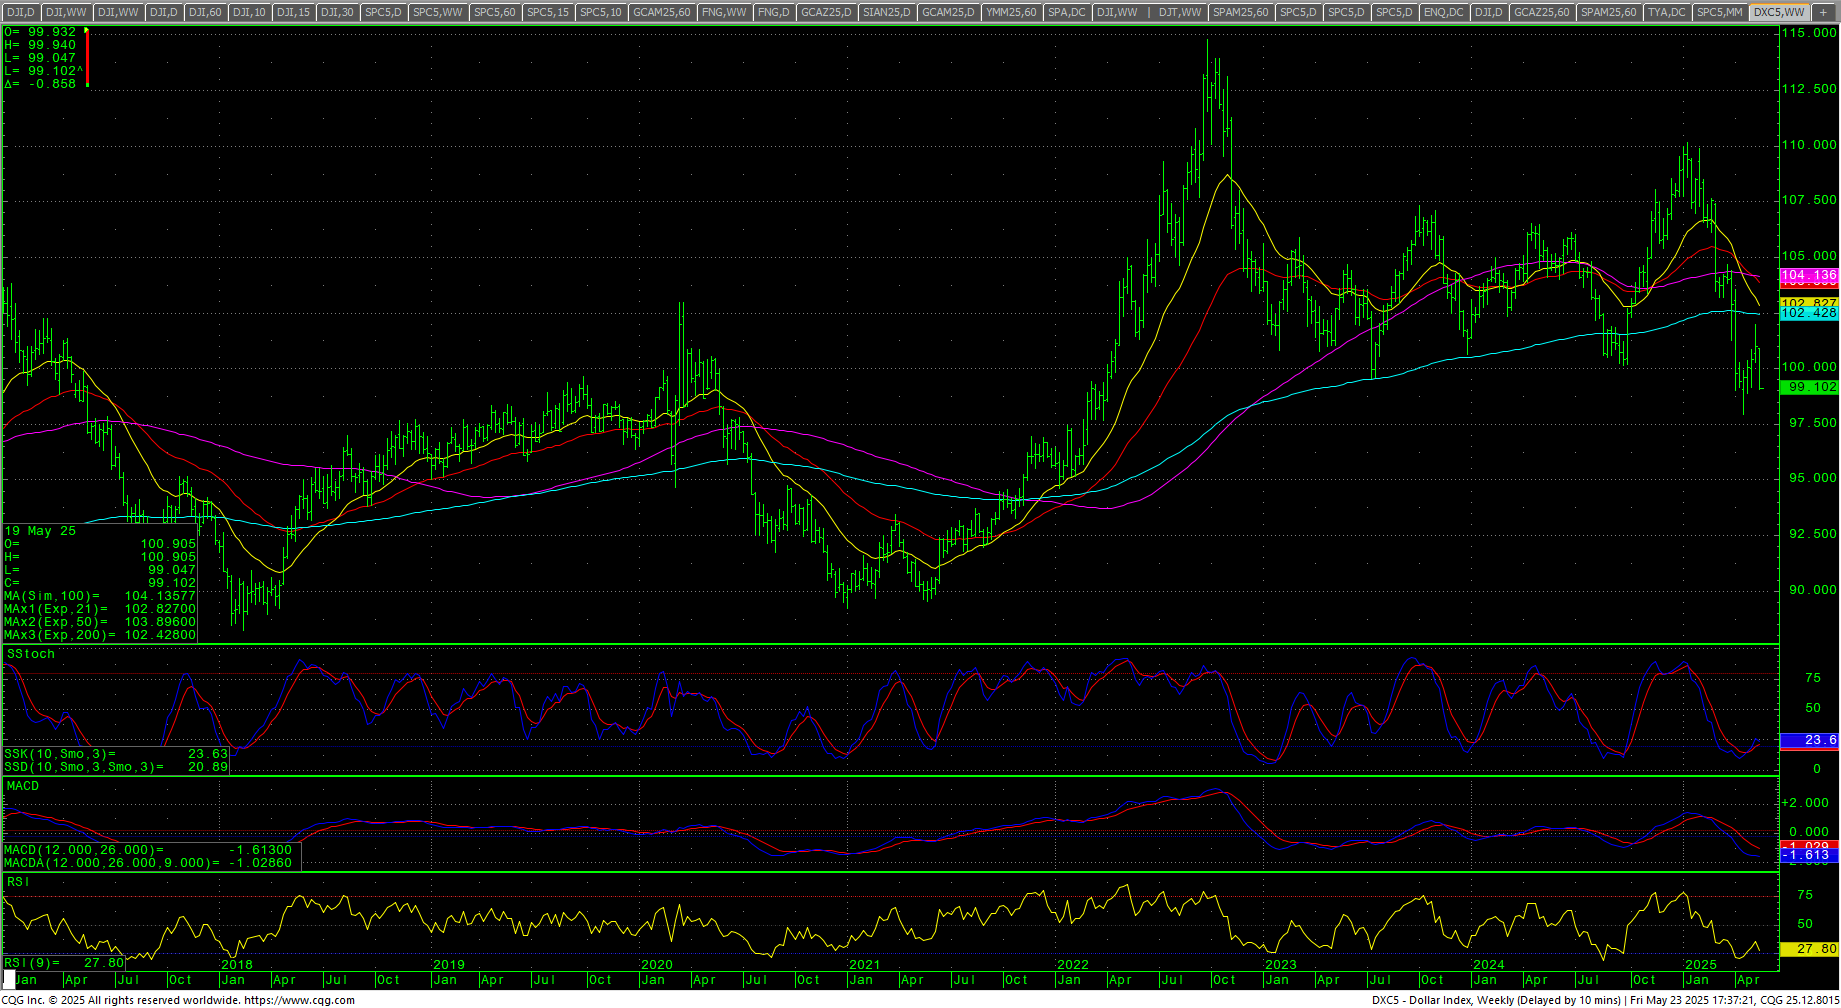
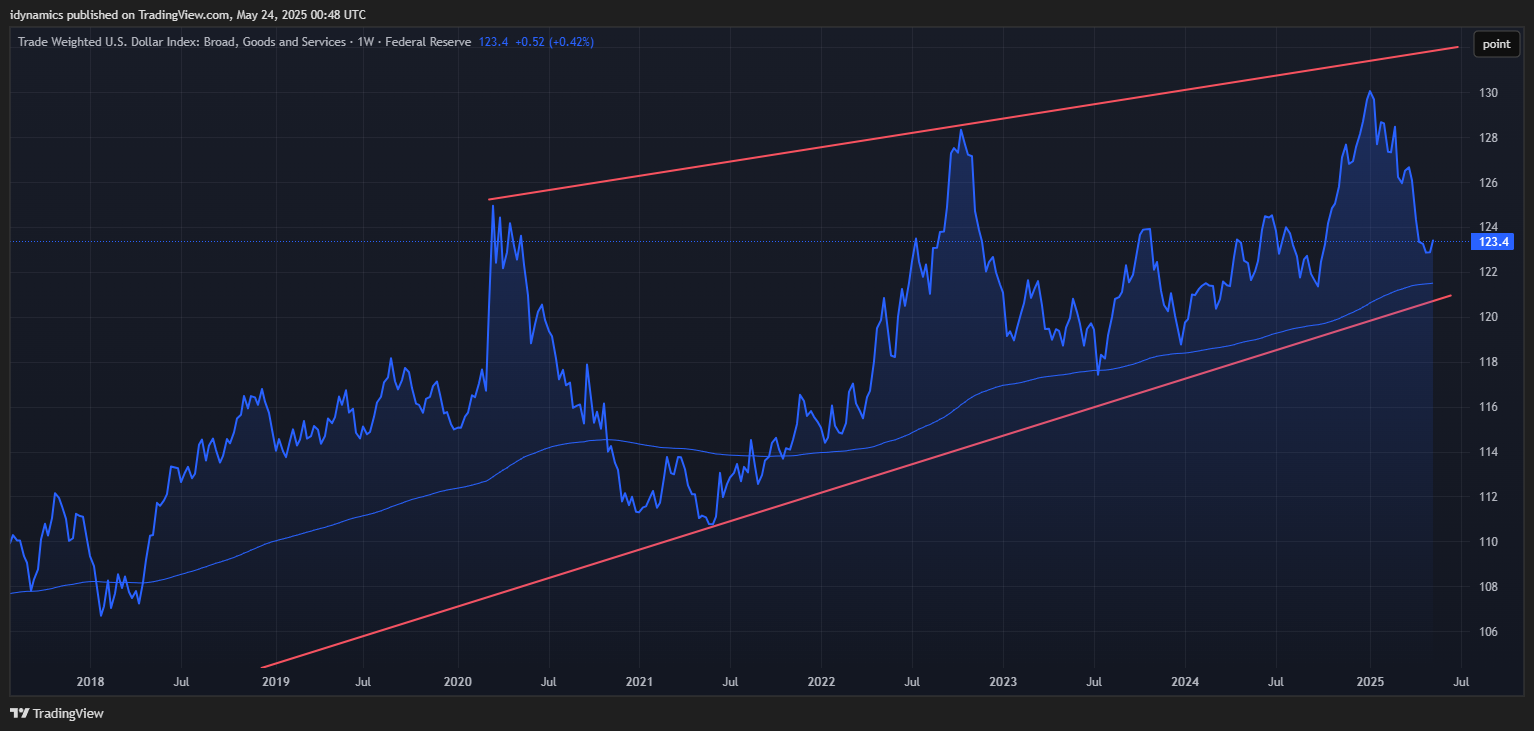
The VIX moved back over the 20 level after testing multi-year lows in the past week. The US Dollar dropped sharply and set a new weekly closing low for the move…the lowest since 28 March 2022, settling on the bottom of the range and back under par/100. Even the Trade Weighted Dollar has started to deteriorate.
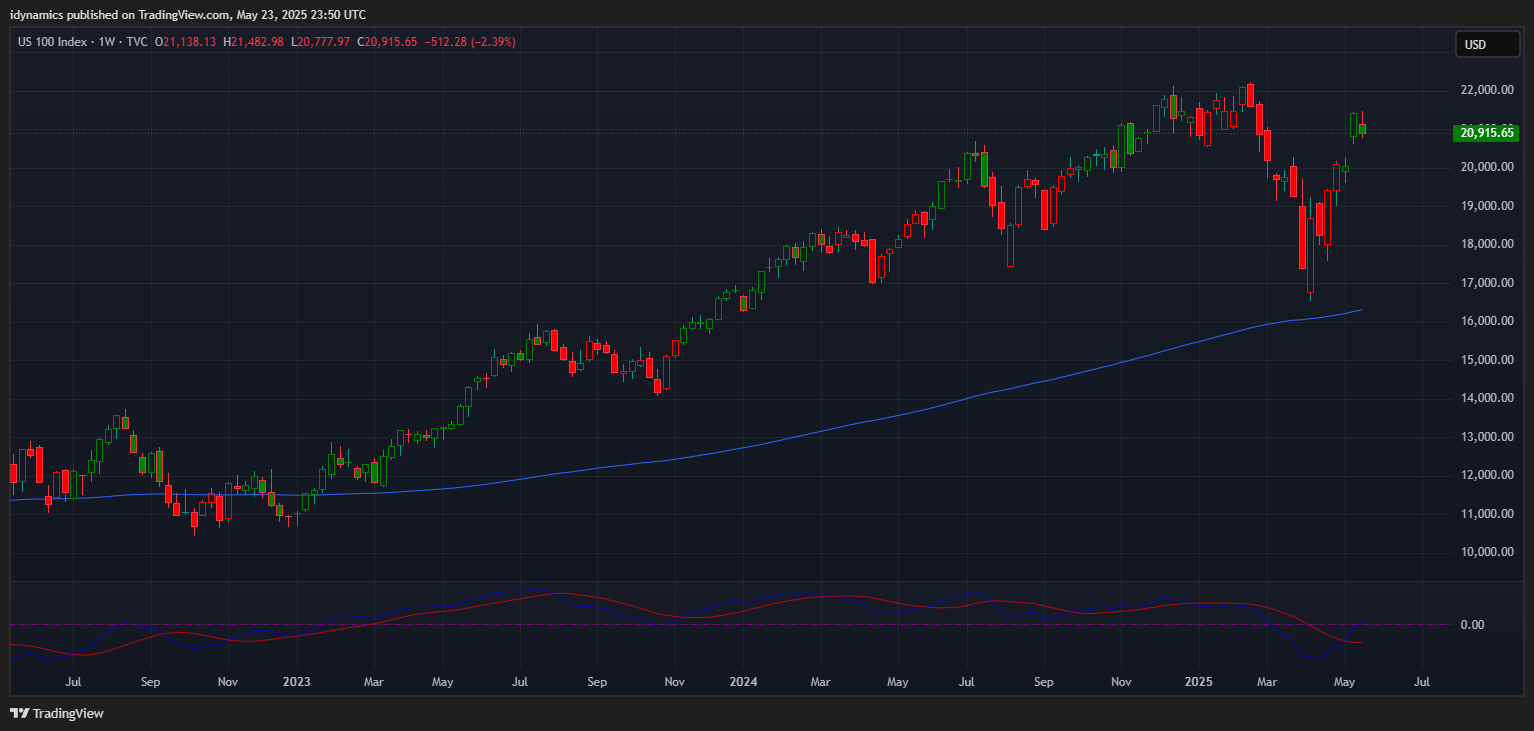
 Nasdaq 100 Weekly Candles
Daily Breadth 
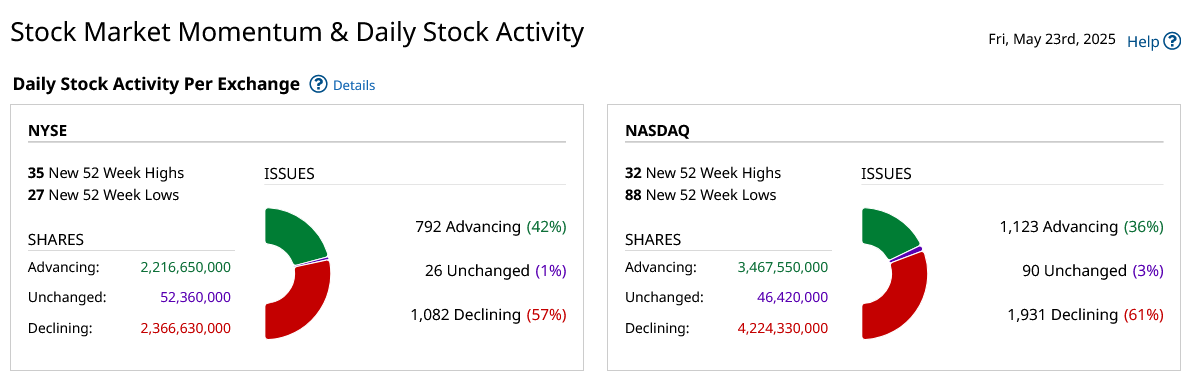
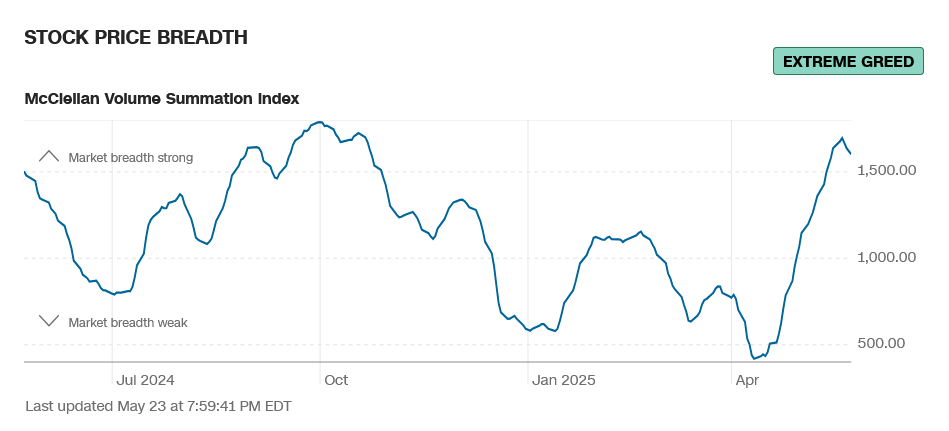
Breadth weakened late in the week. Sentiment remains in extreme greed.
CNN Fear & Greed Index
 AAII Investor Sentiment Survey
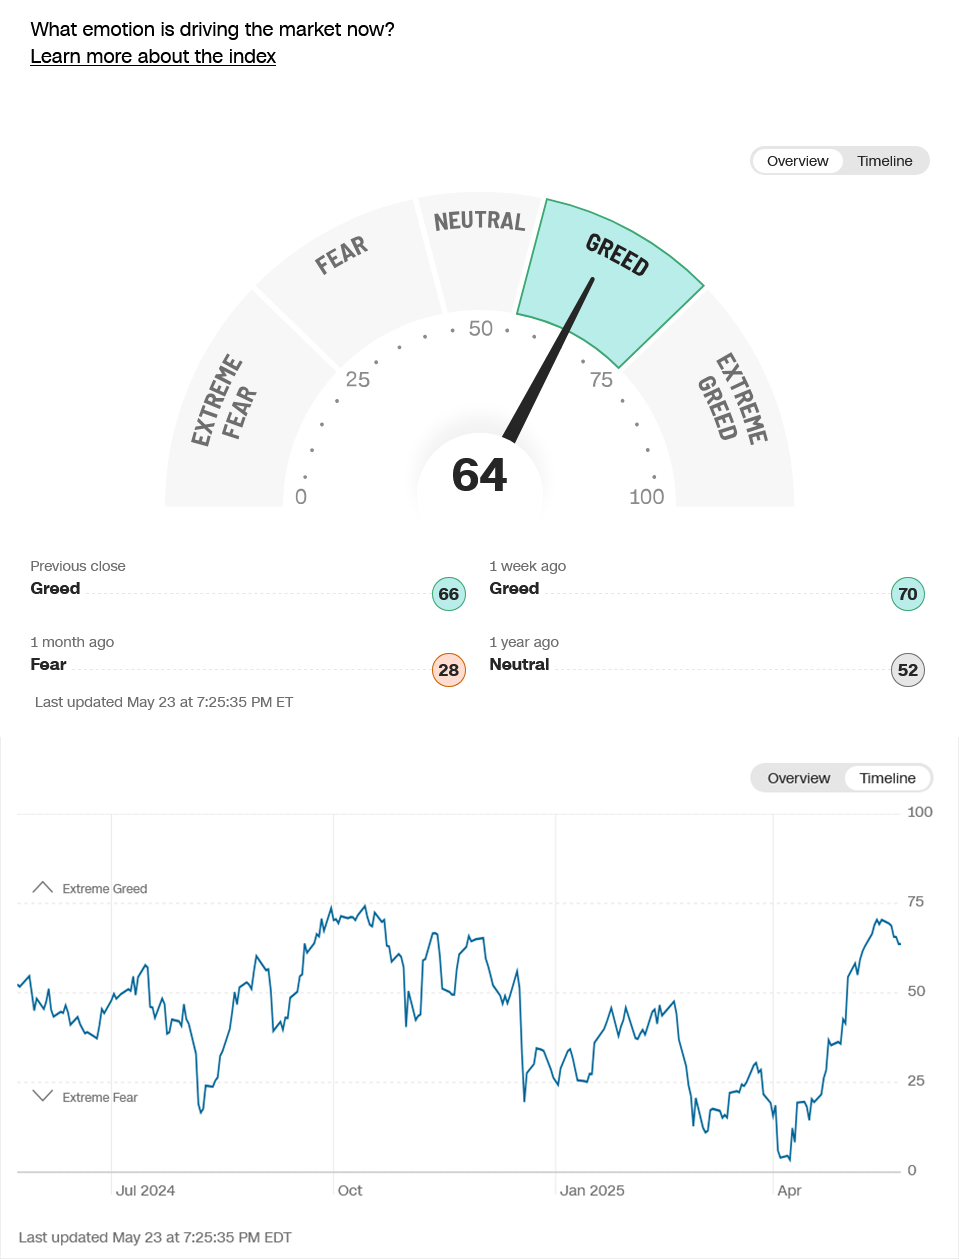
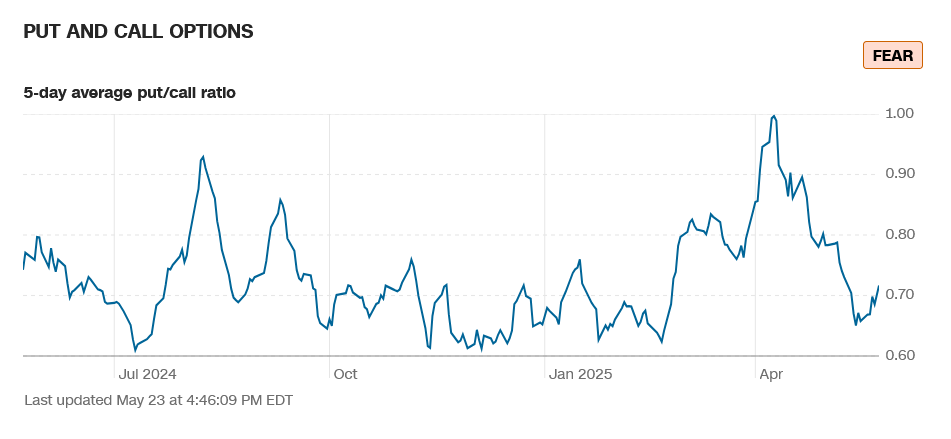
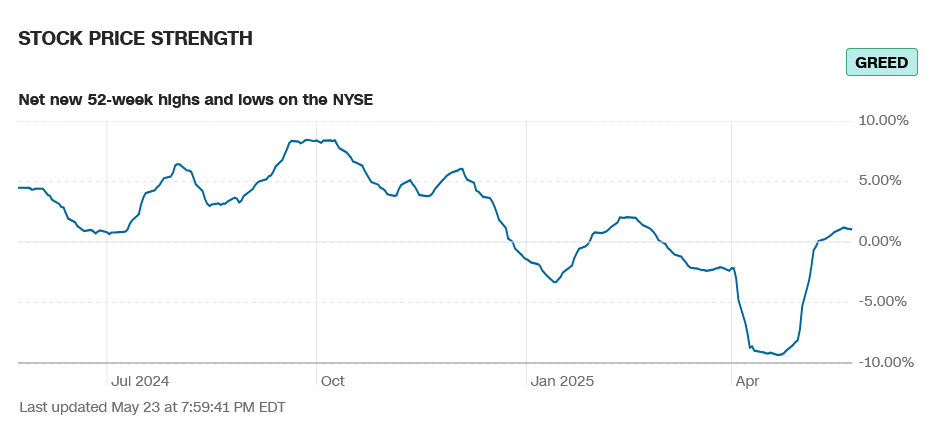
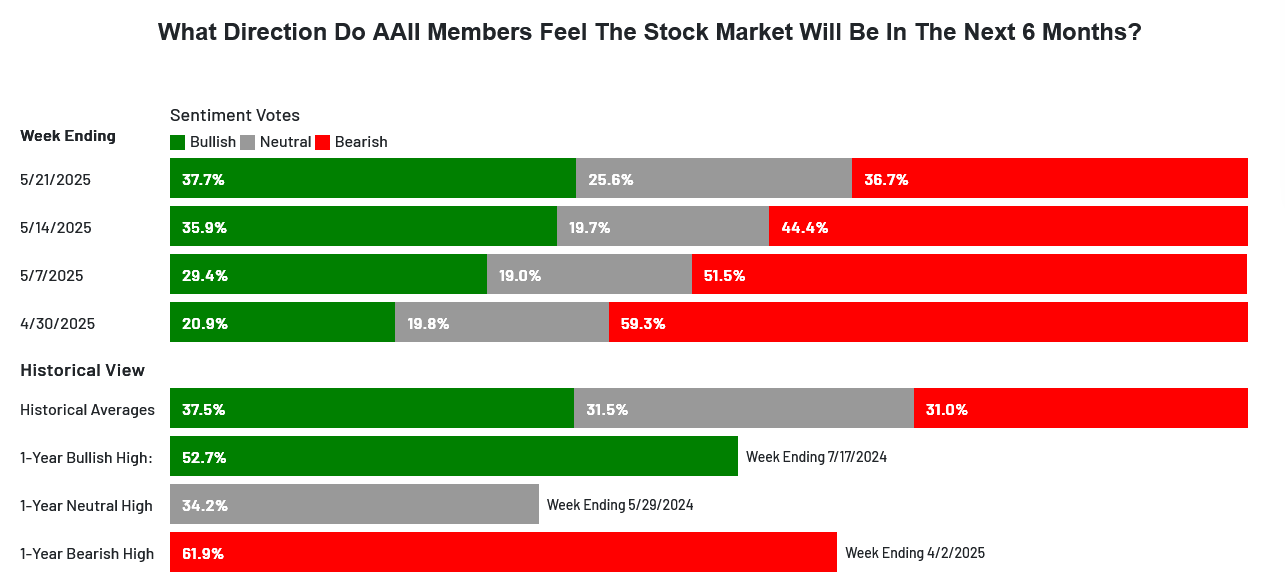 Sentiment is now in greed and extreme greed on several fronts. The CNN Fear and Greed Index moved down to 64 and now reads greed. It moved down from levels last seen in October 2024. Breadth moved lower on the week from new highs for 2025 and sentiment reads extreme greed. Latest AAII Sentiment Survey: Pessimism Dips. The Dow A/D ended at 6812, dropping from the previous week’s record high. The VIX moved higher and closed over 20 and was up +29.29%. The Put/Call moved to 0.72 and now reads fear. The 52-week, A/D moved up to +1.05% and reads greed. The Dow closed the week down -2.47%, closing on the bottom of an outside week down. The S&P ended down -2.61% on bottom of an outside week down. The Nasdaq Composite was down -2.47% and the Nasdaq 100 was down -2.39%. The FANG held the best, closing down -1.38%. The Russell was down -3.47%, breaking the weekly stretch for the first time in seven weeks. The 10-year notes closed down slightly in the middle of the weekly range. The yield on the 10YR increased to 4.509%.
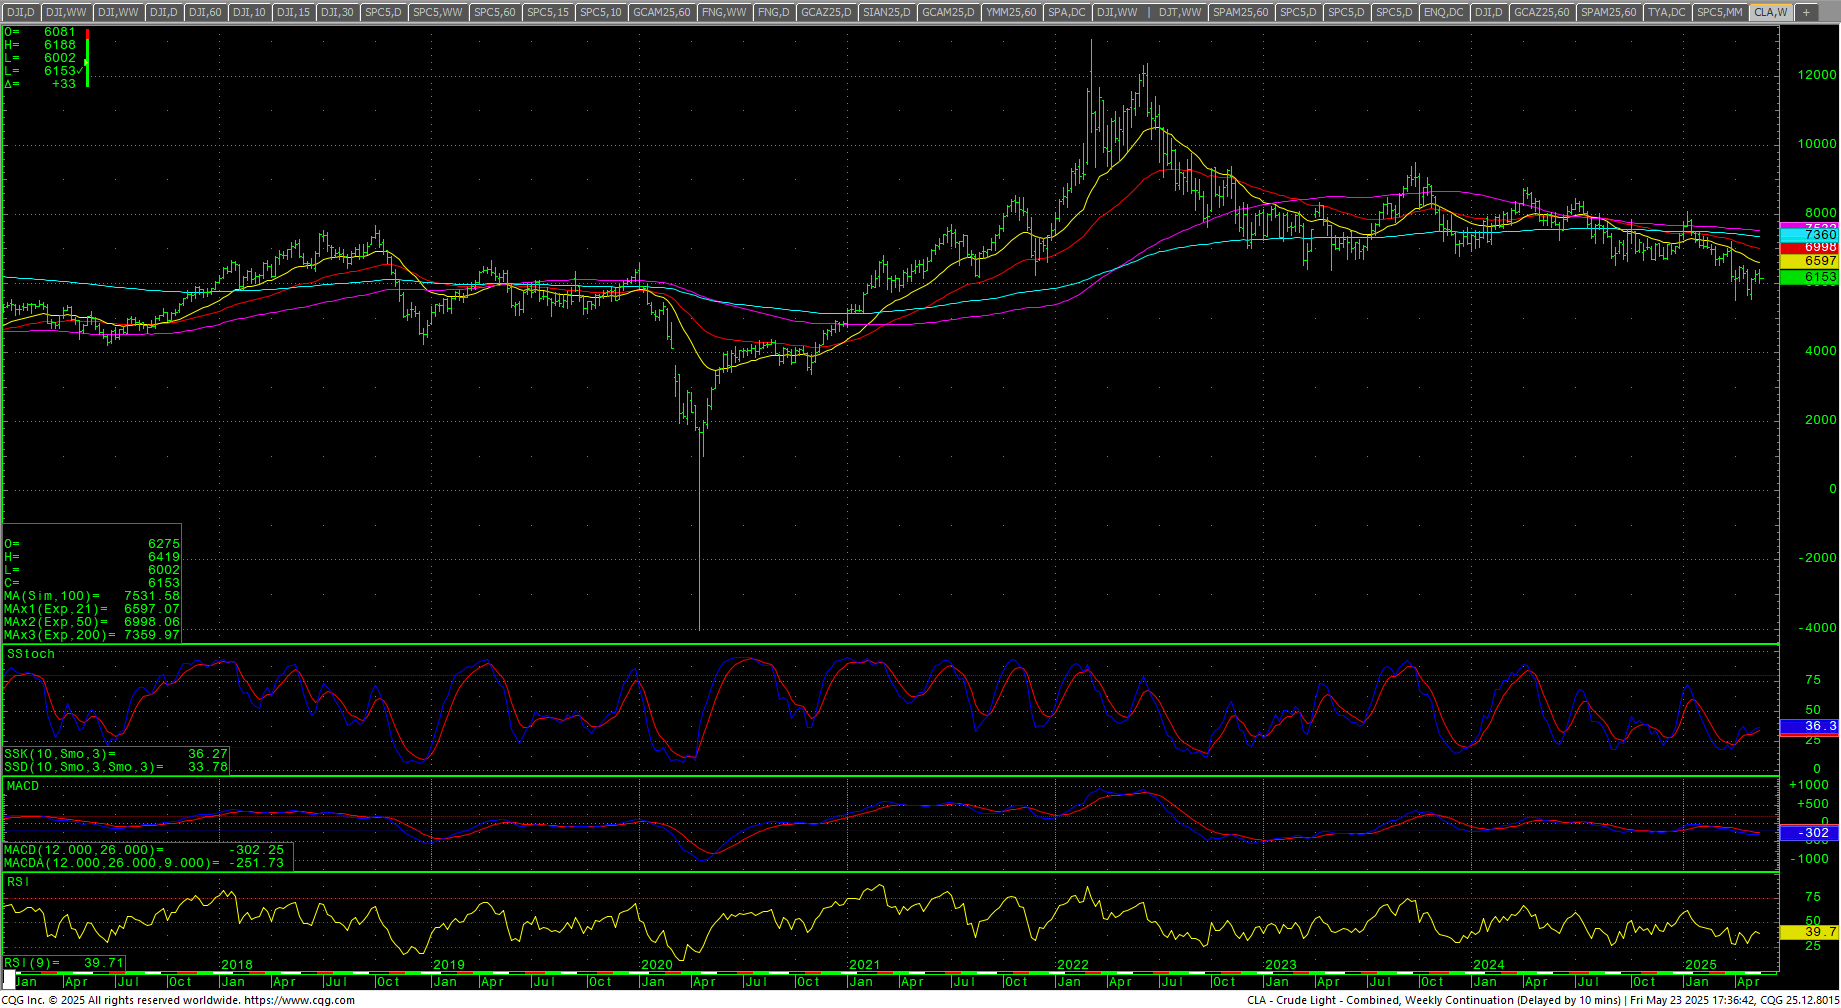
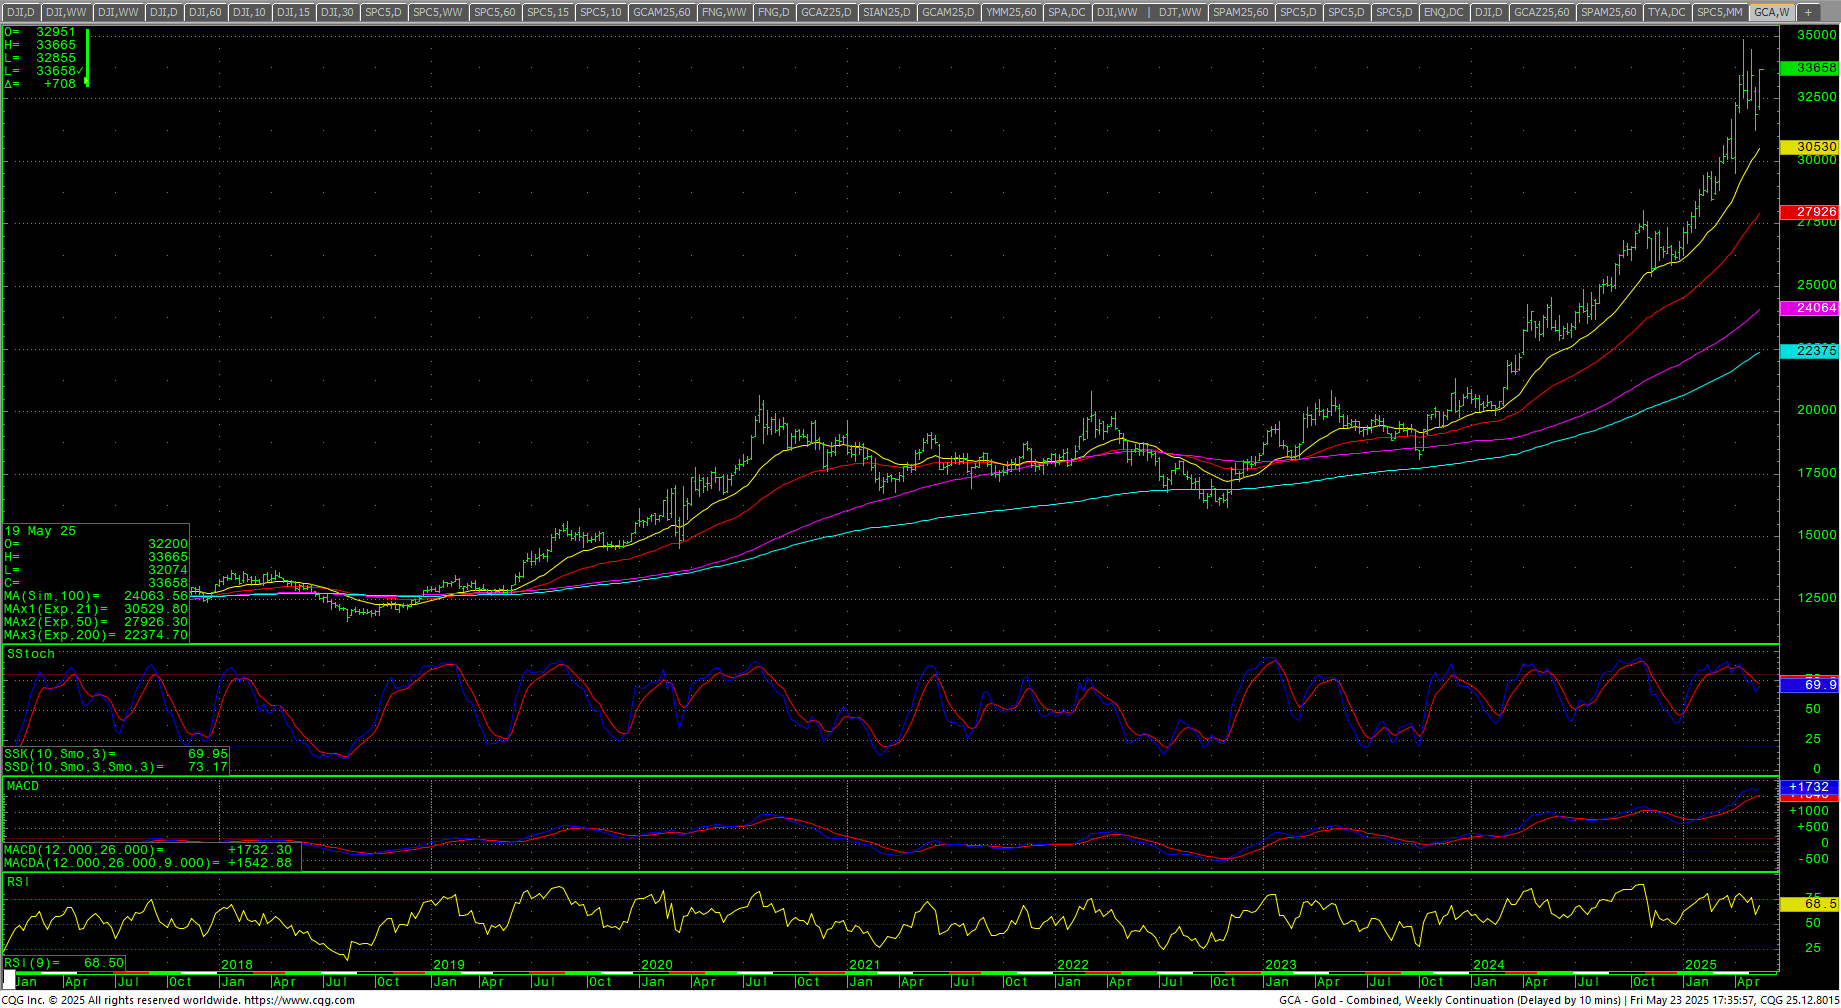
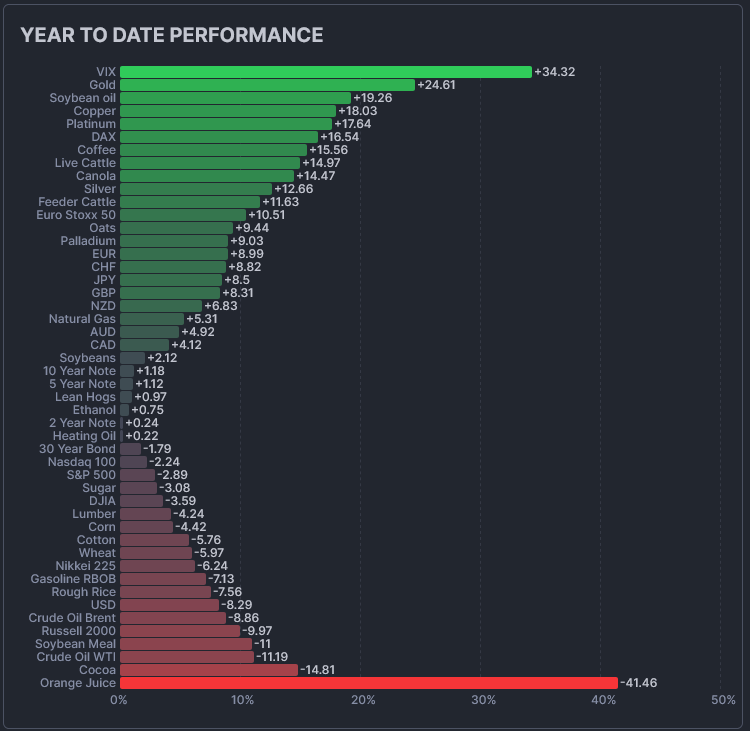 The CRB Index closed up +0.22%. Crude oil traded an outside week down and closed in the bottom end of the range as it remains just above multi-year lows under the critical $60 level. Gold rallied sharply and closed on the high of the week’s range at a new record high close for the weekly continuation chart. The CoT for the S&P 500 sees non-commercials exiting with dealers adding. The CFTC S&P 500 Non-Commercial Net Positions moved up to end -96.6K. Sellers have a 6 day window.
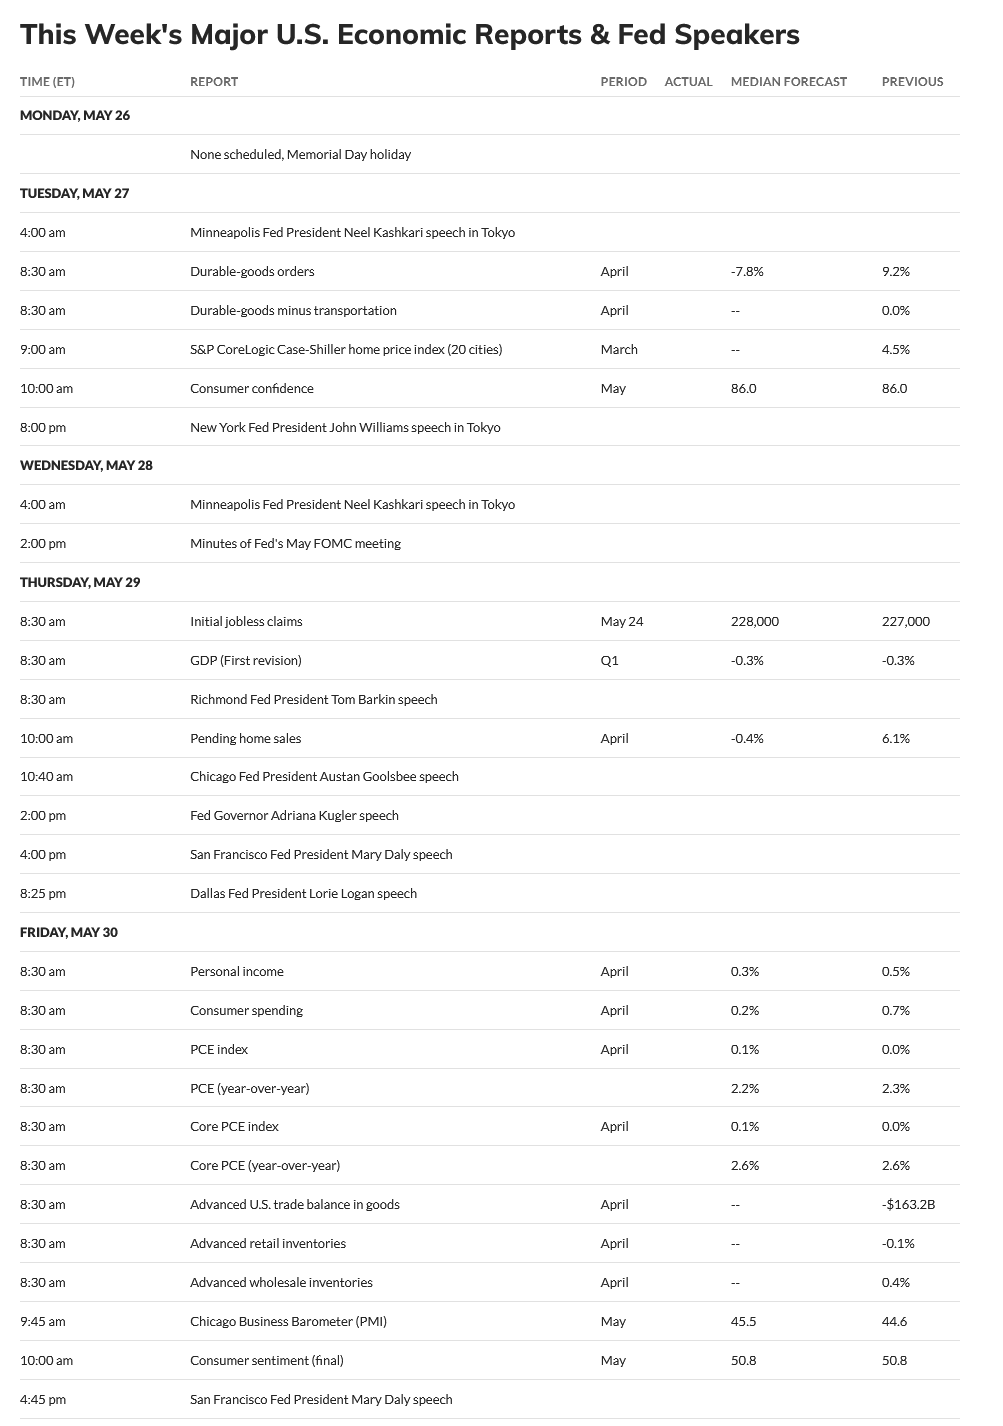
Timing Points
This Tursday/Friday marks CRITICAL timing, 29/30 May 2025. Thursday is Q1 GDP Revision (est: -0.3%). Friday is PCE (est: 0.1% and Core: 0.1% with YOY: 2.2%).
 Long Term Timing Thoughts
“It is looking more and more, from a cycles standpoint, that this will run well into Q4 2025/Q2 2026. Thus, a much more protracted and drawn-out bear and not the “flash crash” that everyone has gotten used to over the past two decades. That doesn’t mean we won’t have significant rallies, but chasing rallies is likely to be a losing strategy until this thing is spent…which very likely will not be until Q1/Q2 2026 at this point. The BIG focus will be late summer and fall of 2025…particularly late September this year.”
- 05/29-30 *** X critical
- 06/05 **
- 06/09 *** X bonds/interest rates/dollar
- 06/16-18 *** X critical, volatility/volume/wide ranges/extremes
Dow Jones Industrial Average
Dow Jones Industrial Average Weekly Candles
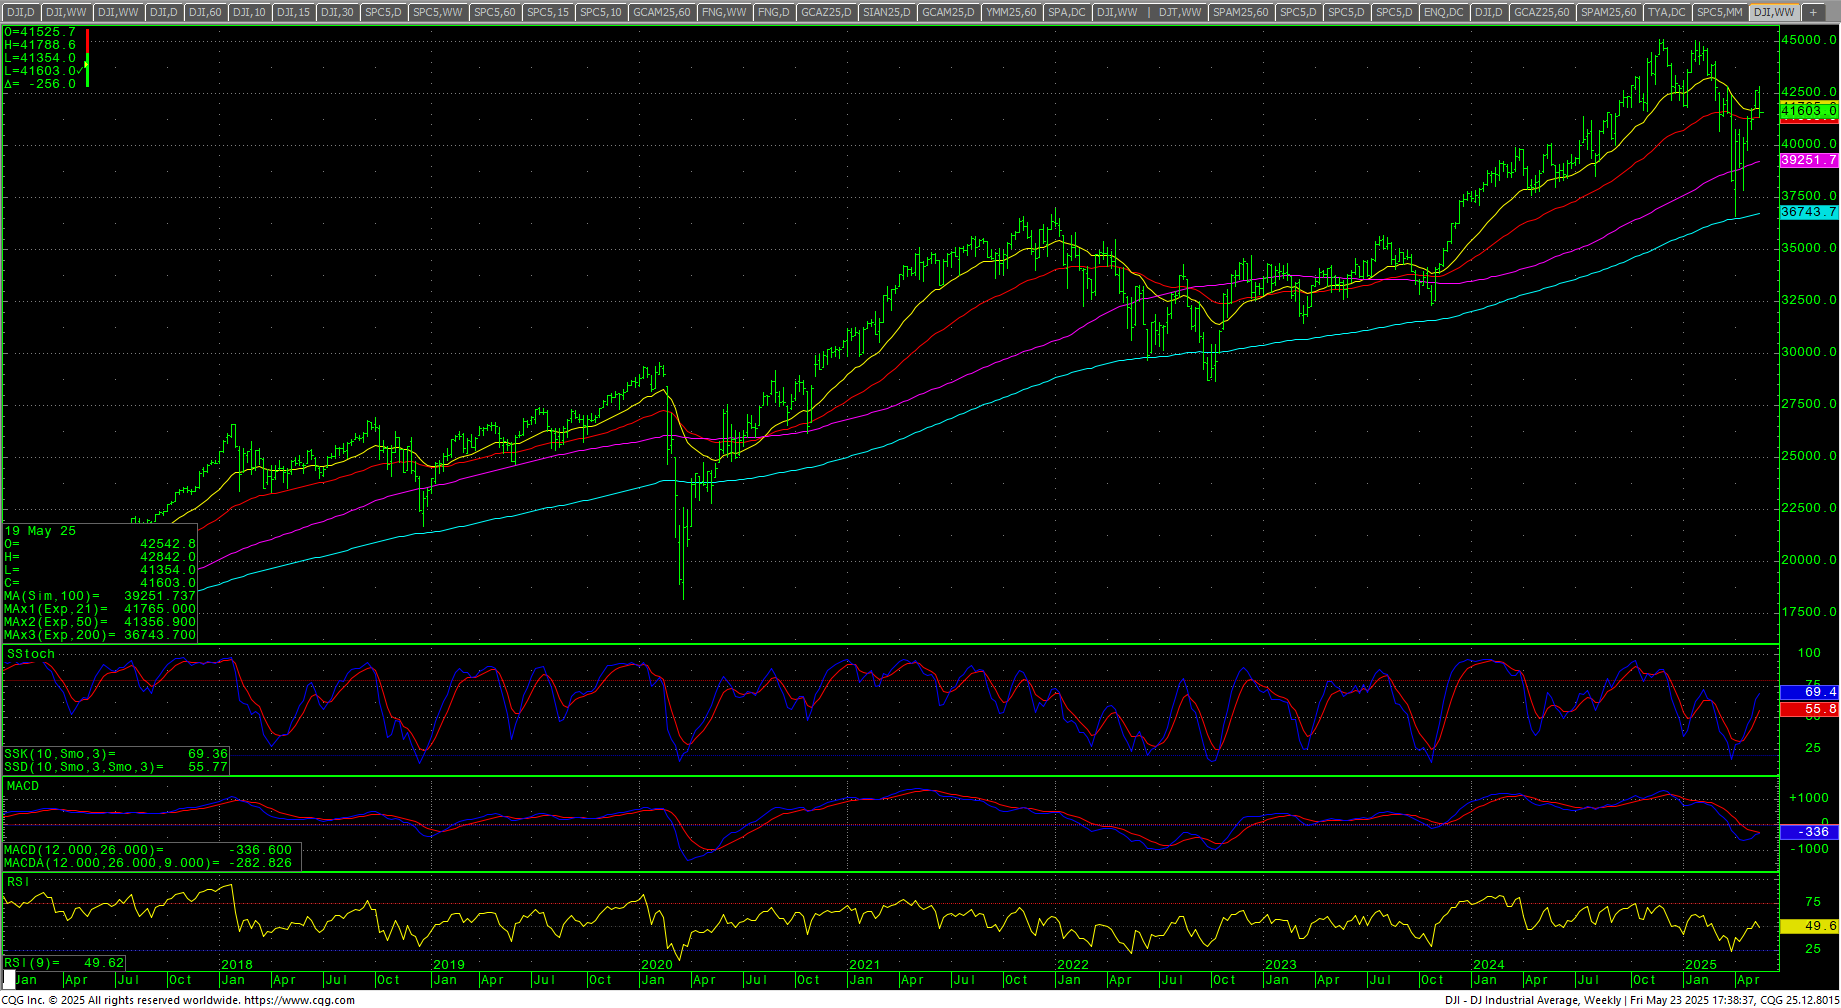
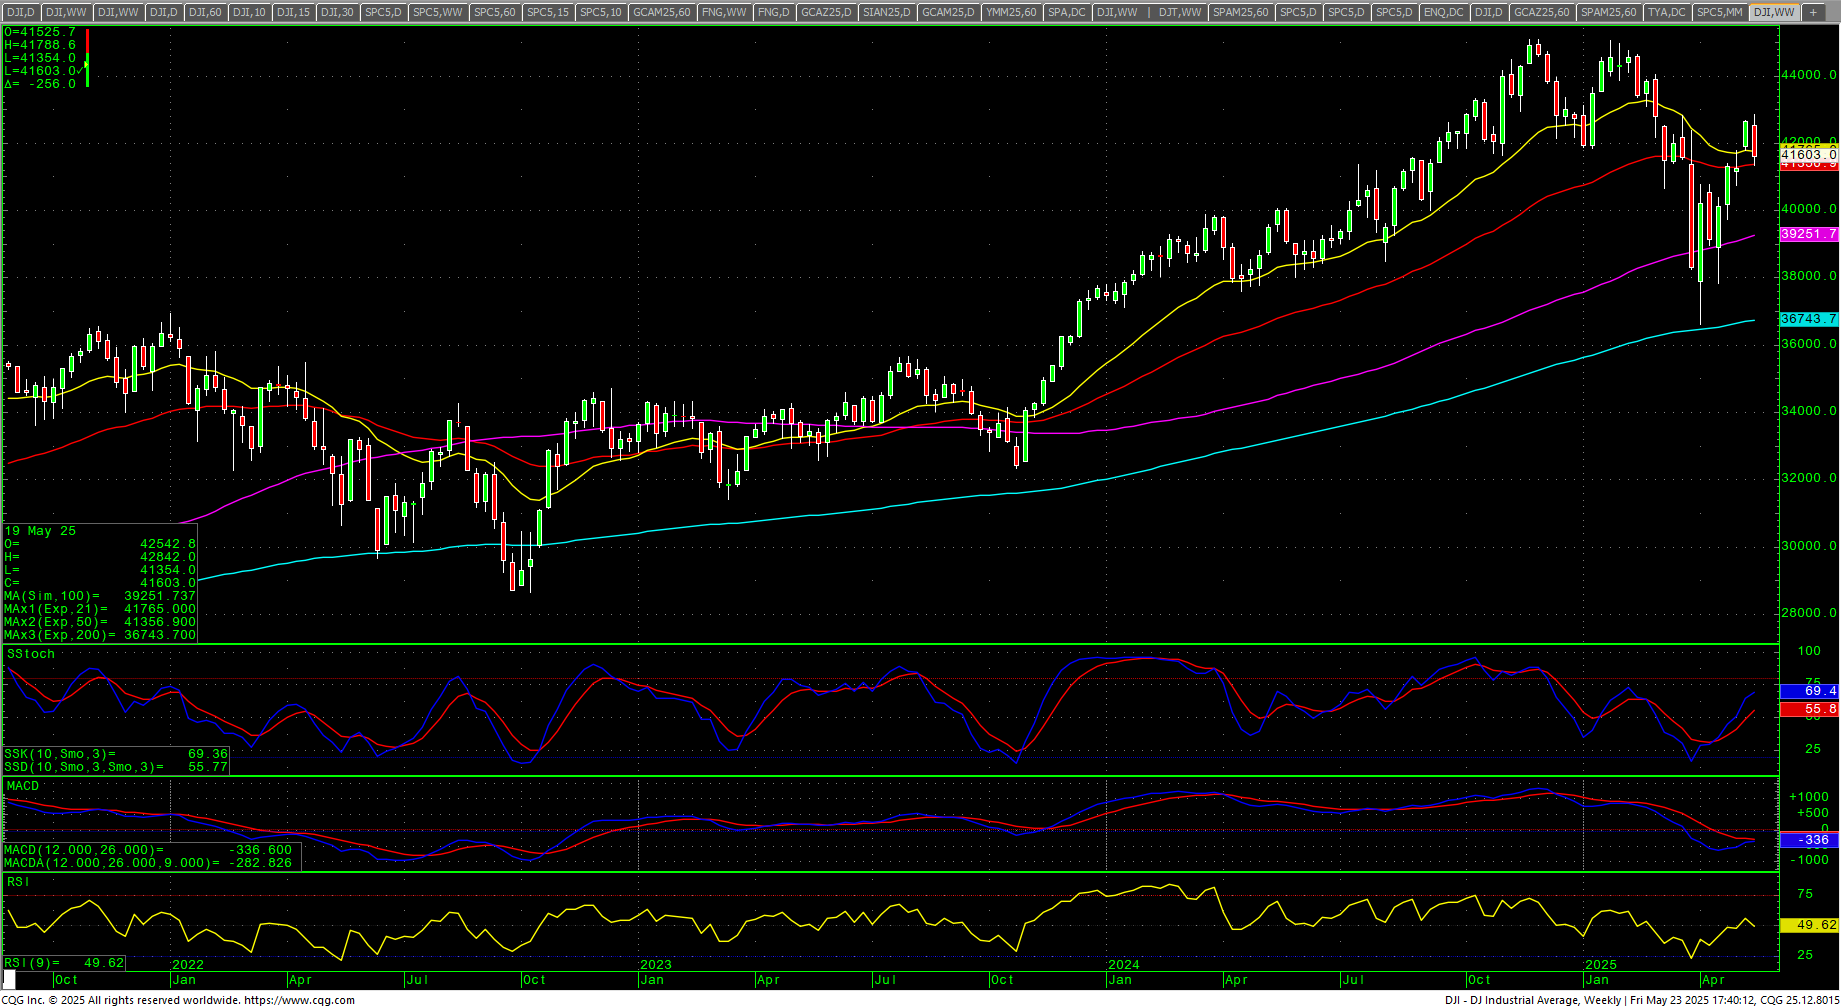 The Dow closed down -2.47% on the bottom of an outside reversal range. Prices filled in the gap from two weeks back on the China news. The daily has hooked lower from severely overbought and prices are back to the 50-day and 200-day MAs (which, like the SPX, are close to issuing a Golden Cross.) The weekly stochastics are still in an uptrend. Prices found a wall of Dark Pool money against a critical area overhead against the 26 March 2025 high at 42822 (intraday high is 42842) and the ‘final’ “Death Zone” from record highs. That zone remains at 42943 through 43061. The 200-day MA starts the week at 41632.6 and is trending slightly higher over the past week.
Dow Jones Industrial Average Weekly H-L-C
 Resistance is 41922, 42098 and near-term pivotal at 42273/42275 and remains critical at 42842 and the Death Zone level at 42943 through 43061 area. Daily closes above 43061 should minimally test 44034 and will open potential for a test of the all-time highs at 45050/45054/45074. Closes over 45074 opens counts toward 45244 and 45426 (Fibonacci target). Rallies with closes over 45426 will reopen longer-term monthly targets in the 47400 level with targets of 46568 and 46954.
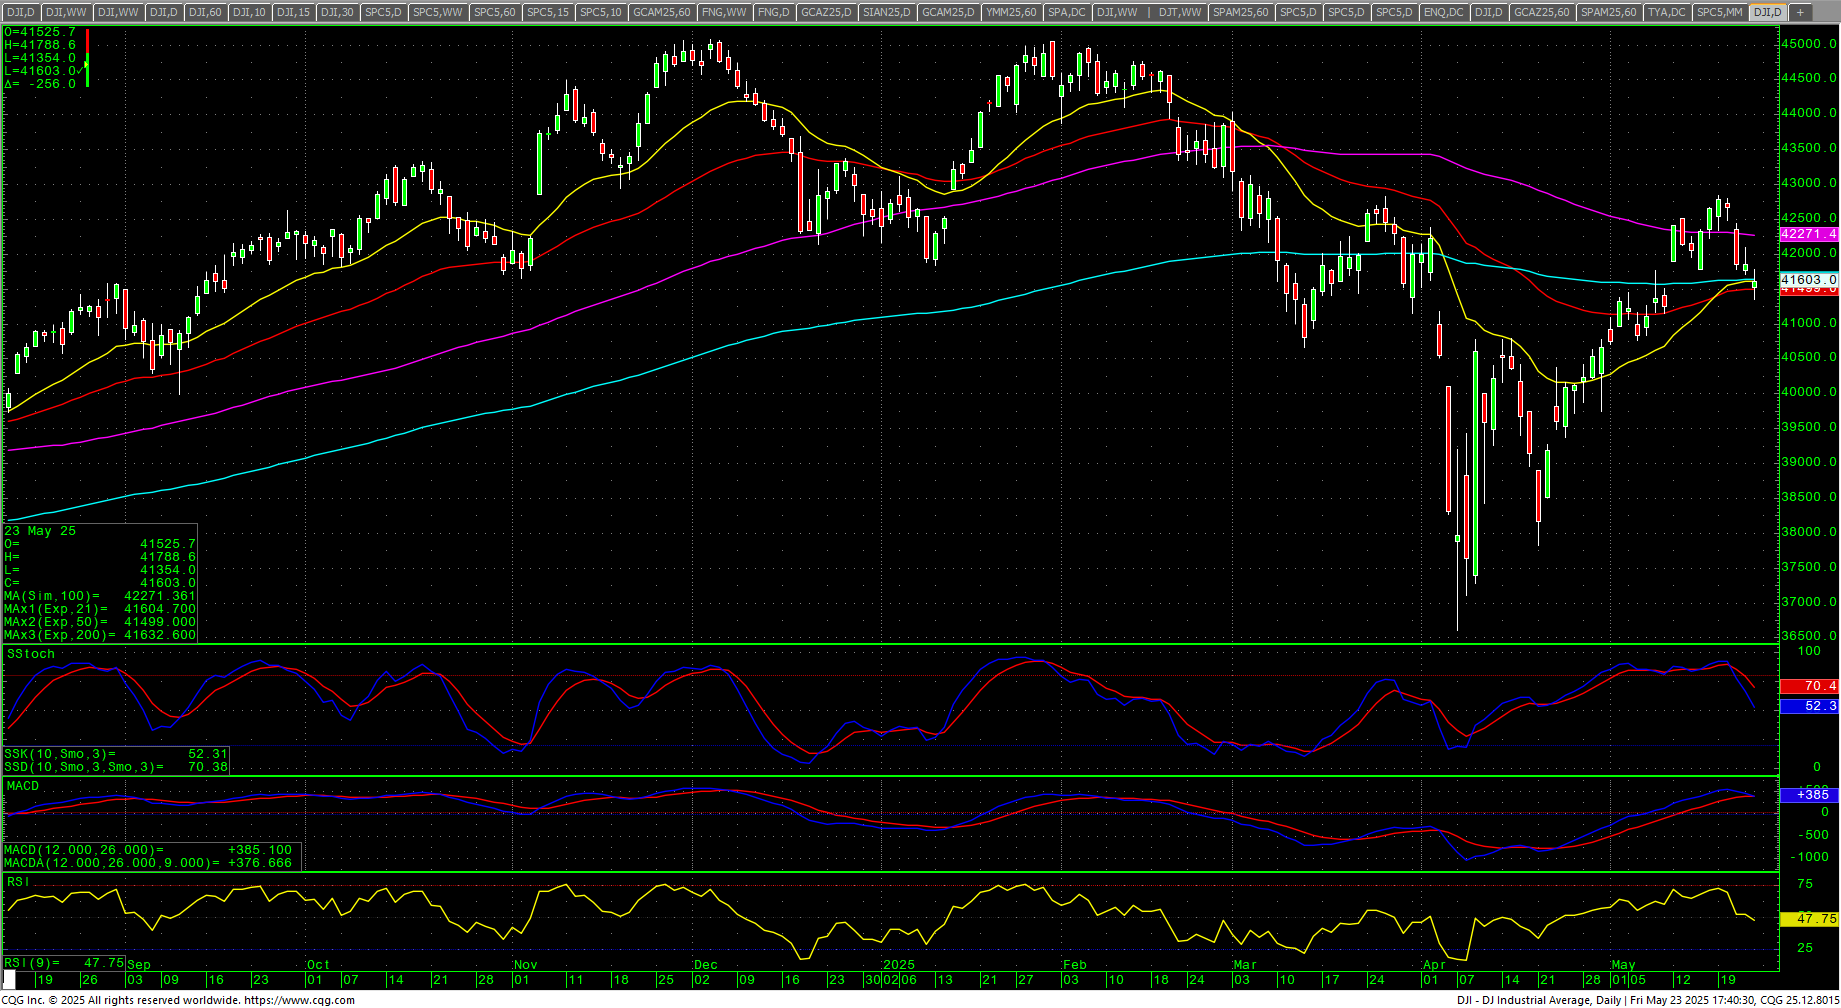
Dow Jones Industrial Average Daily Candles
Dow Jones Industrial Average Hourly H-L-C
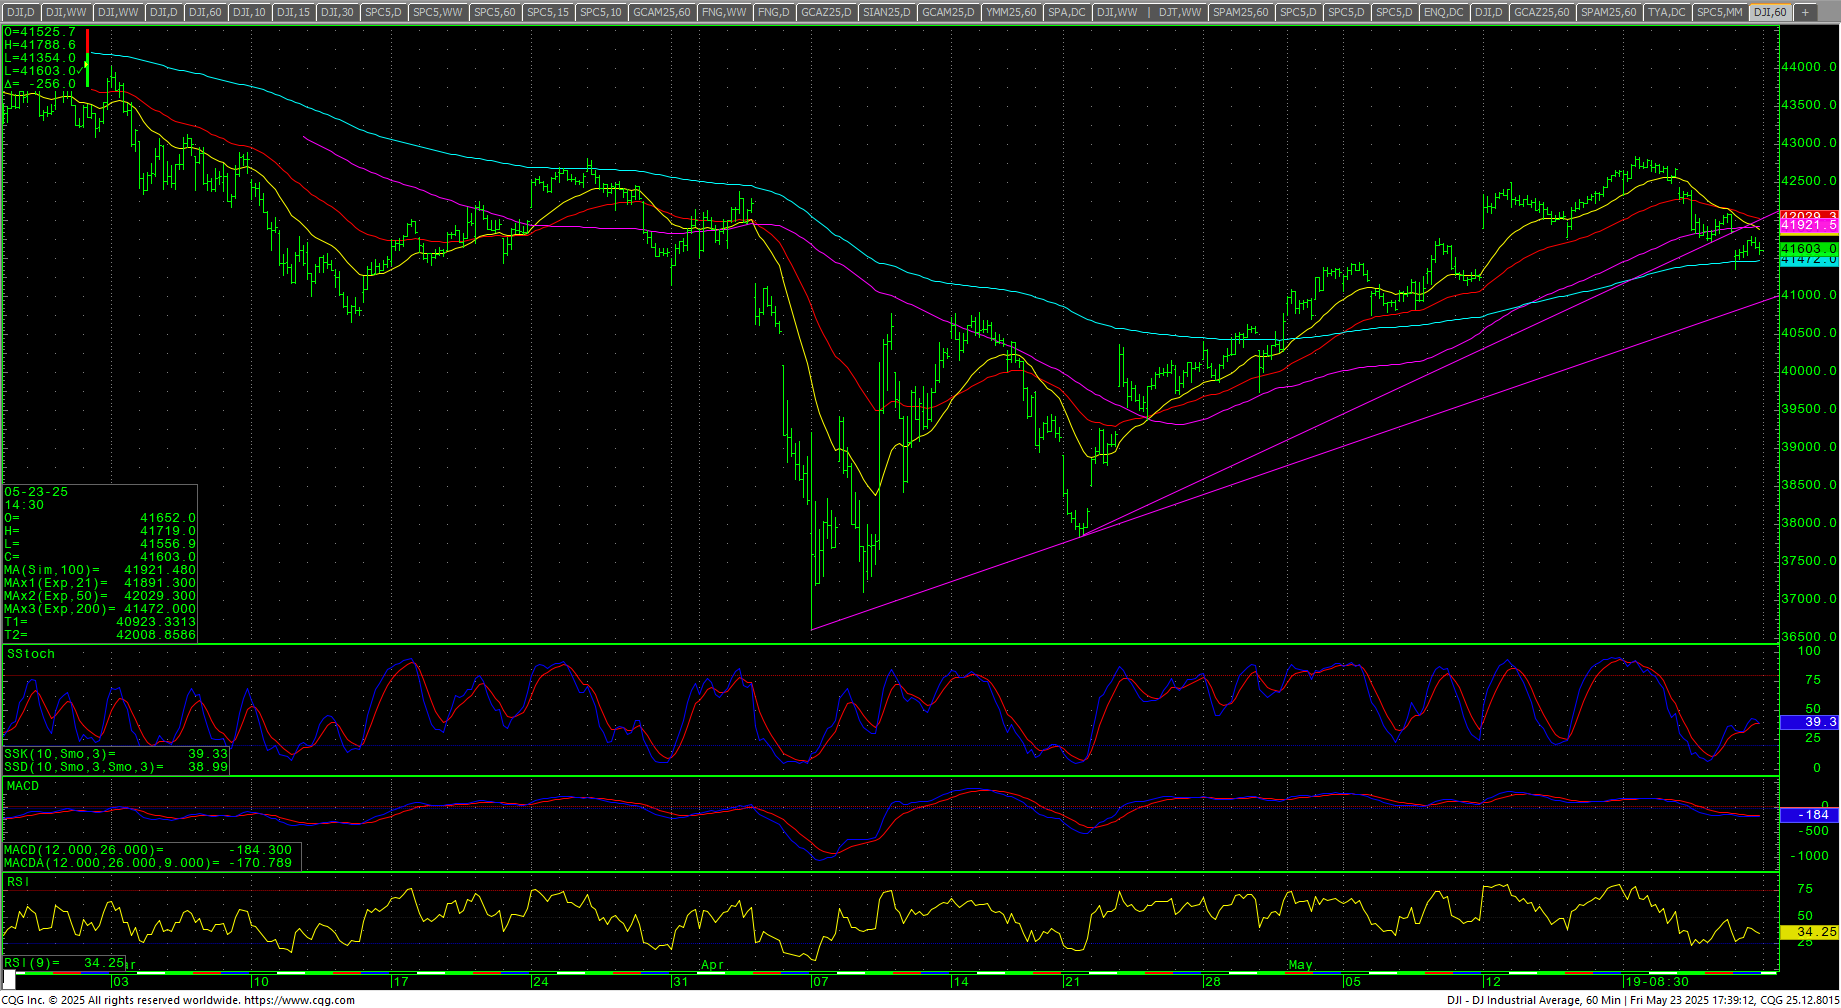 The hourly is neutral on Friday’s close with prices ending in the middle of the day’s range. Prices took out pivotal near-term support at 41769/41765. A further breakdown under 41765 sets up 41354 and 41235/41220. Closes under 41220 opens potential to 39638/39636 with support at 39933/39330. Closes under 39636 offer full counts to pivotal short-term support of 38923/38920 with support of 39718/39716. A breakdown under 38920 are bearish for a test of 38124 through 38039. Closes below 38039 should minimally test 37900 through 37828 and would open counts to retest the 36611 low with support at 37103.
| Resistance | Support |
|
|
S&P 500 Cash Index: SPX
S&P 500 Index Weekly H-L-C
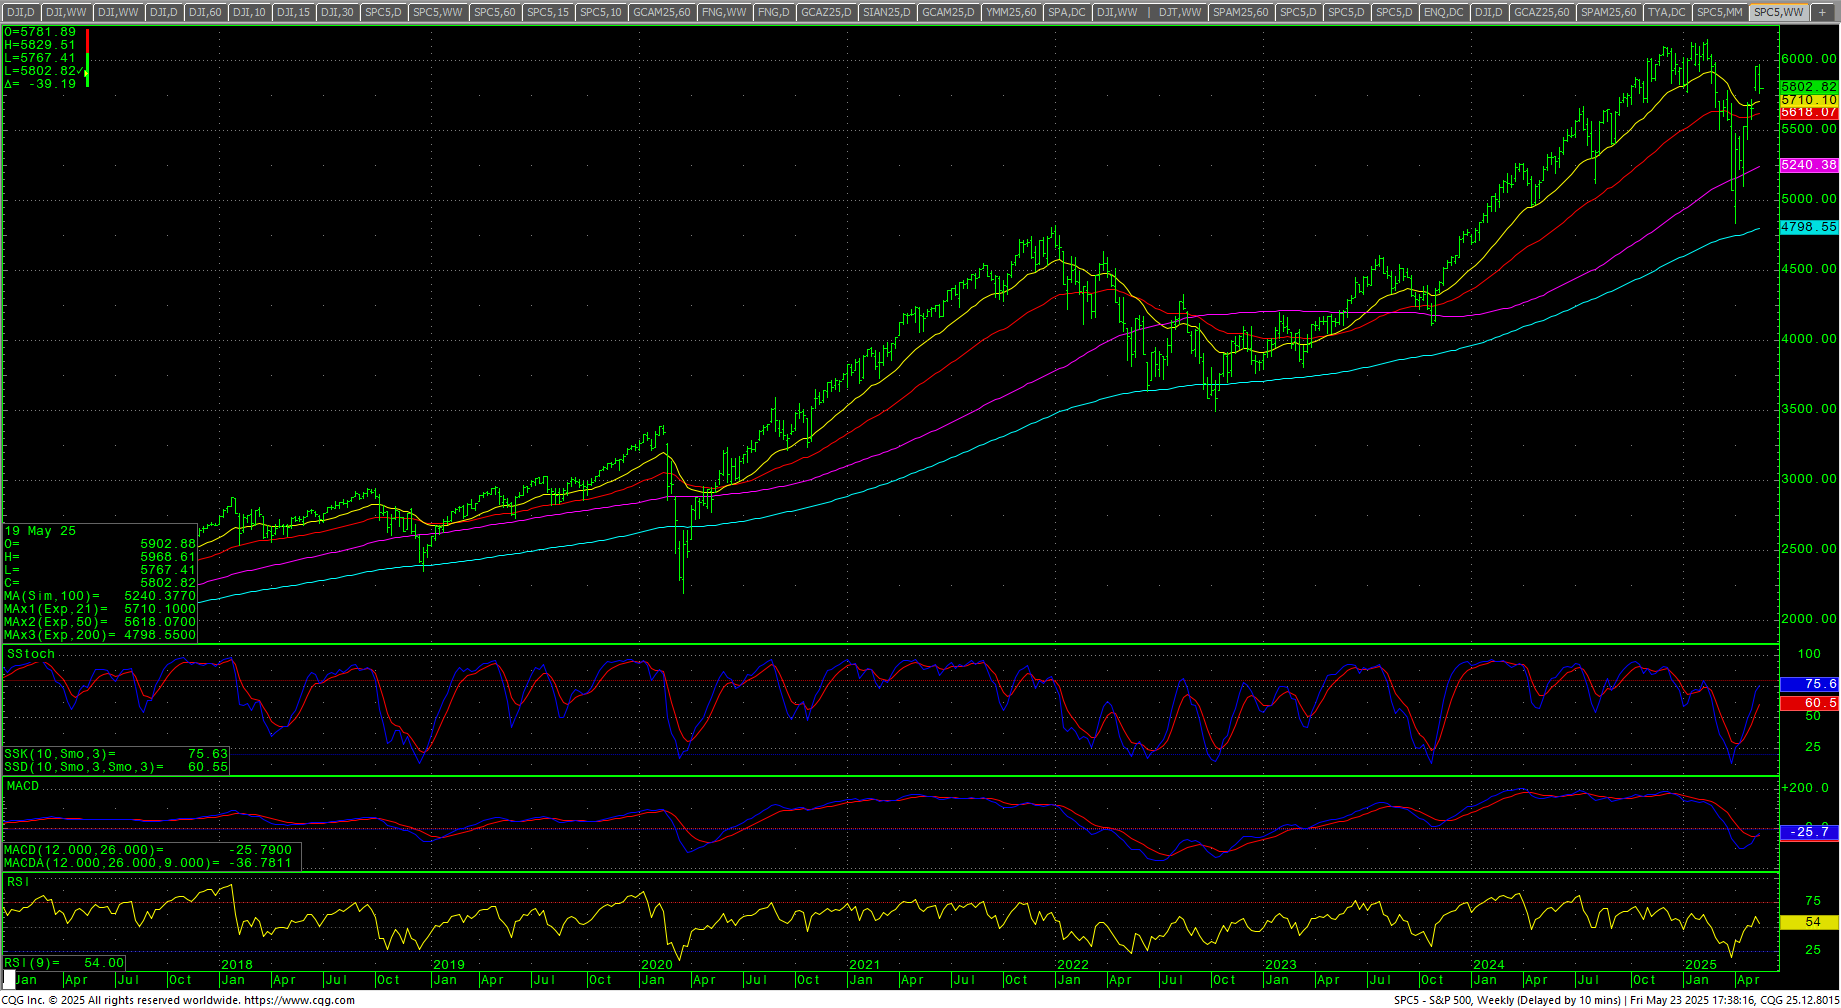 The S&P started the week sharply lower and then retail poured another $4+ billion into the ETFs for an outside day up and set the highs on Monday and then reversed the trend for an outside week down that has carried prices back into the gap area left on 12 May 2025. The daily chart has hooked lower from extreme overbought conditions and sentiment is in extreme greed. The 50-day MA moved back over the 200-day MA for a Golden Cross just one month after issuing a Death Cross. The weekly is still in an uptrend. The hourly is neural on Friday’s and threatening to hook lower again. The 200-day MA is 5663.27 and is creeping higher from its down trend.
SPY Weekly Candles
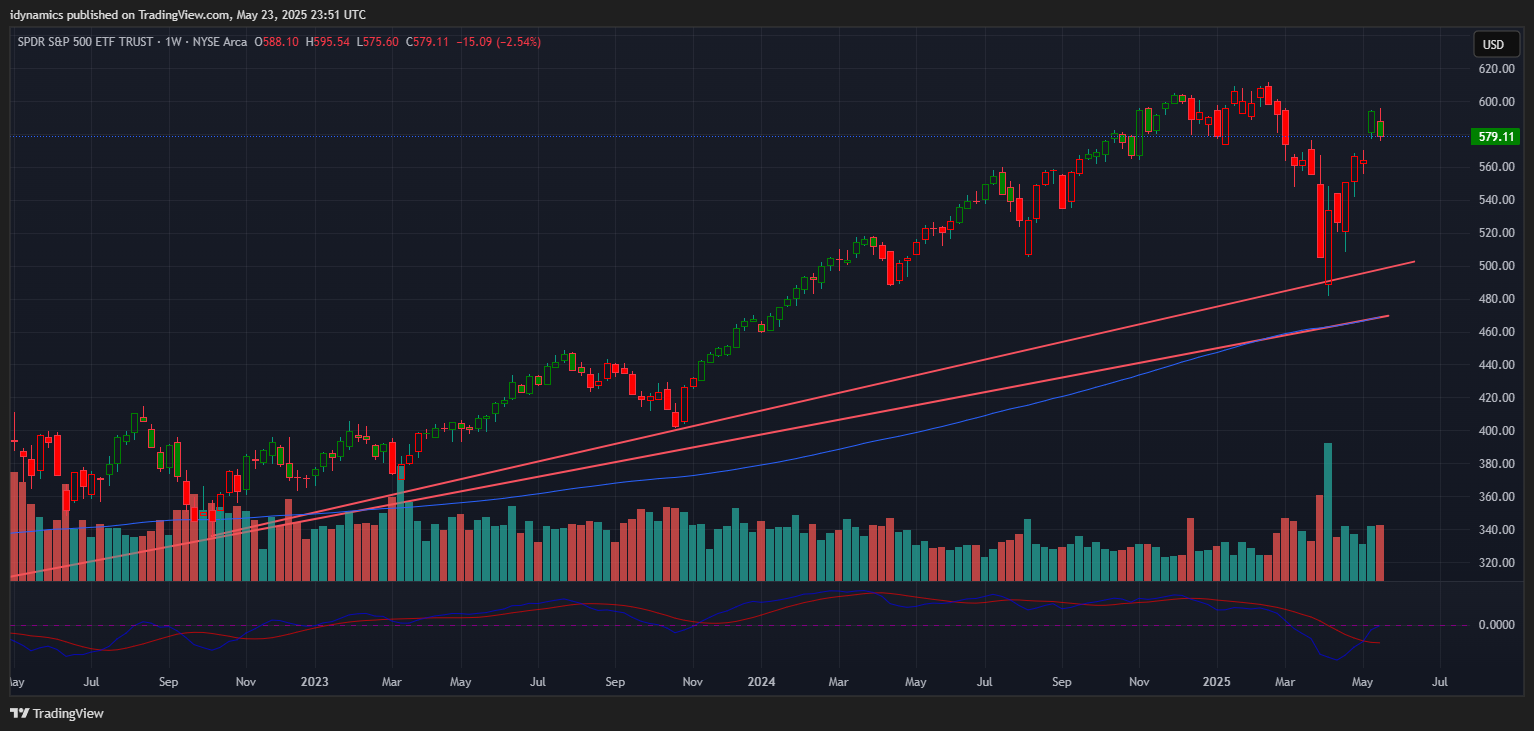 Resistance is 5844, 5868 and 5892/5894. A breakout over 5894 should test 5918/5921 with counts to 5968 and 5986. A drive over 5986 has potential to 6043 and opens counts to 6112/6114 and full counts into critical resistance at the intraday high of 6147.43. Rallies through 6148 should test 6160 with a shot at a target of 6180.35/6181. Closes over 6181 open counts to 6224 and 6296. Above 6296 can carry to 6368 with counts into the 6440 area. Closes over 6440 will open counts to 6584. A breakout over 6584 sets up 6638 and 6692.
S&P 500 Index Hourly H-L-C
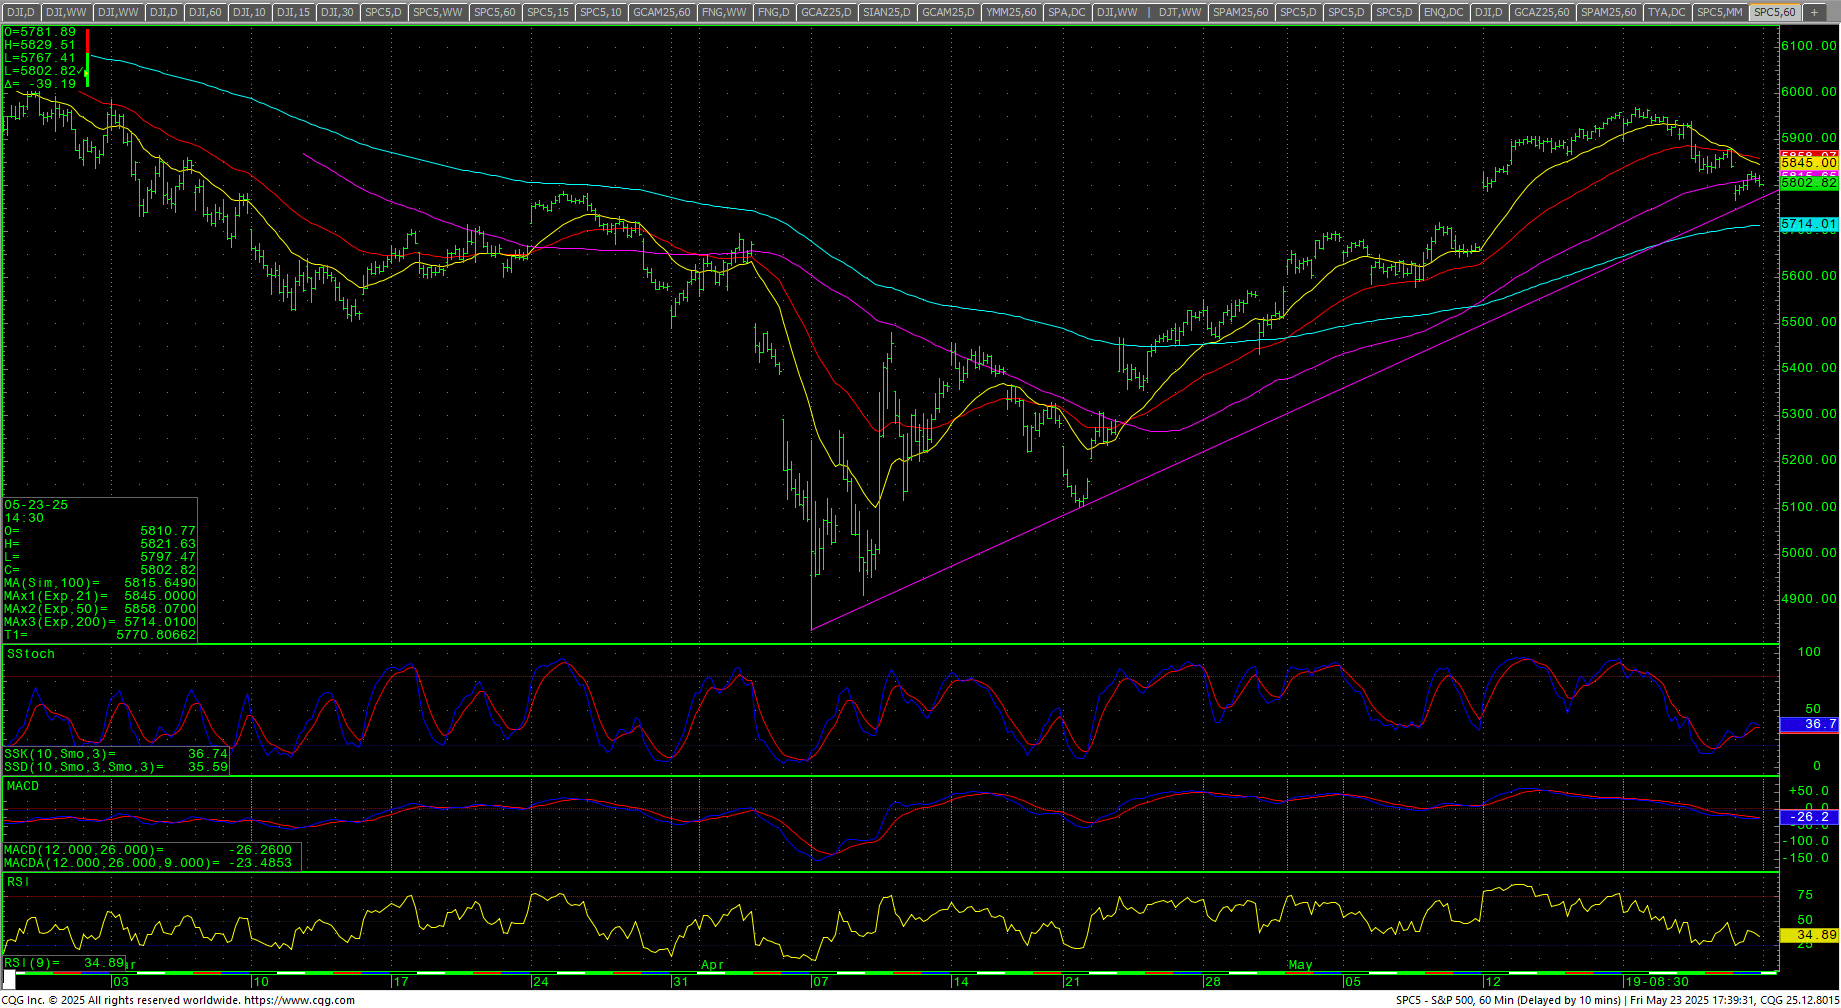 Support is pivotal at 5768/5765. Closes under 5765 suggest 5723/5720 and 5693 and full counts to 5530/5529. Closes 5529 will open counts to 5397/5396 with potential to pivotal near-term support at 5269/5265. A breakdown under 5265 sets up 5115/5100 with potential to open intermediate-term counts for a retest of the 4835 swing lows with support still at 4884/4880. Closes under 4880 are bearish and open counts to 4614 through 4586.
| Resistance | Support |
|
|
Charts courtesy of CQG, Inc., CNN, Koyfin, Trading View and AAII