
TECHNICAL ANALYSIS (by Intraday Dynamics)
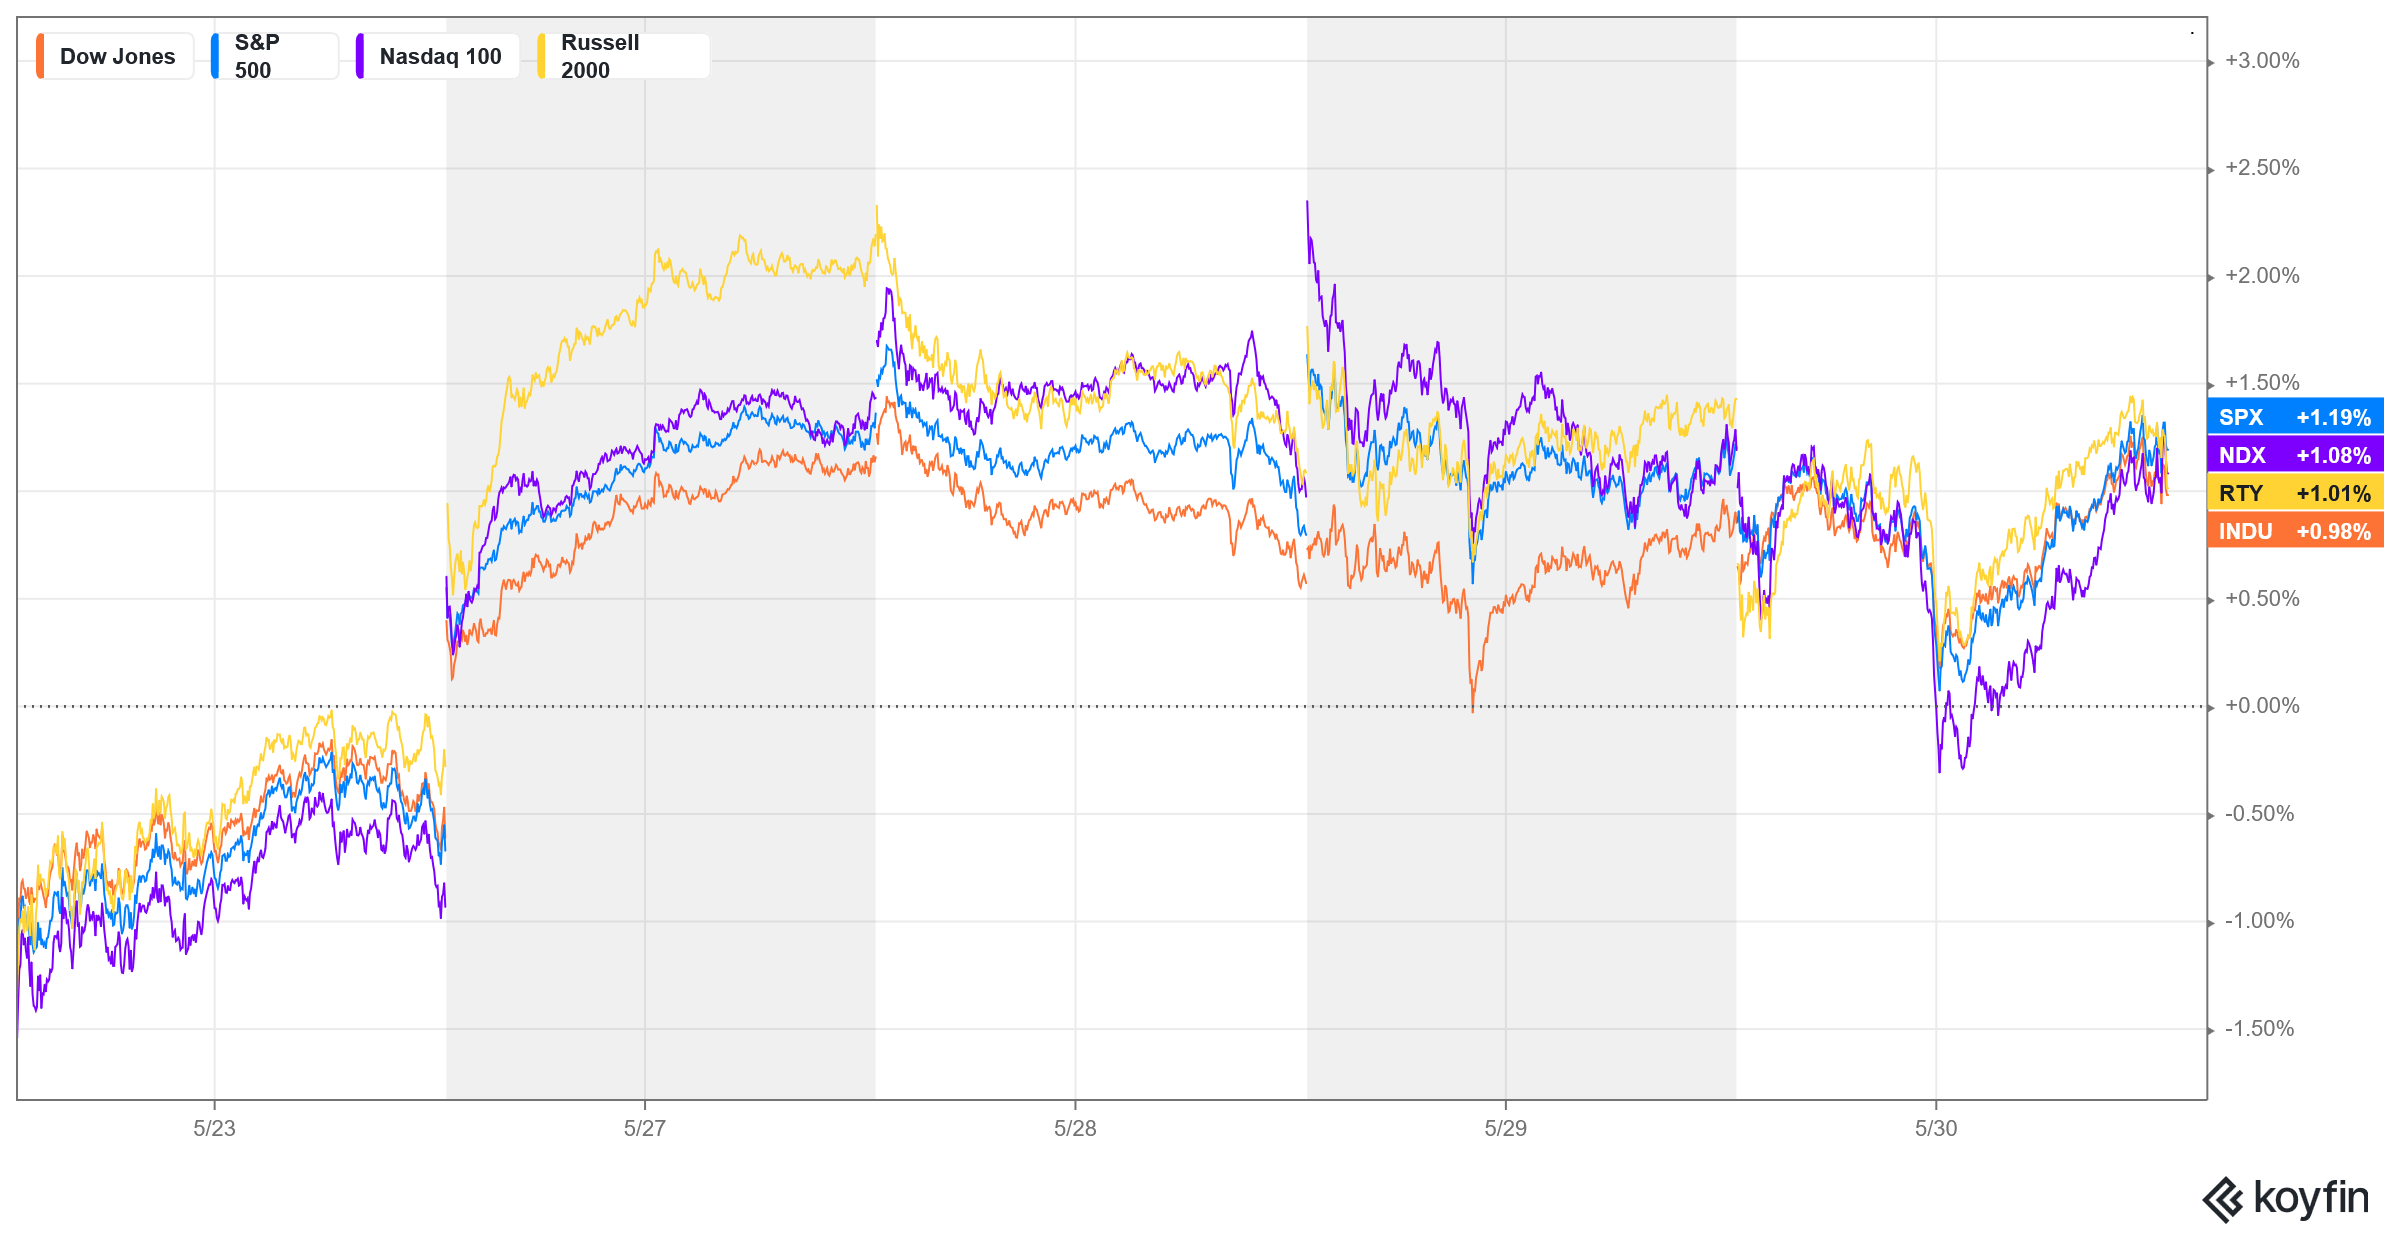
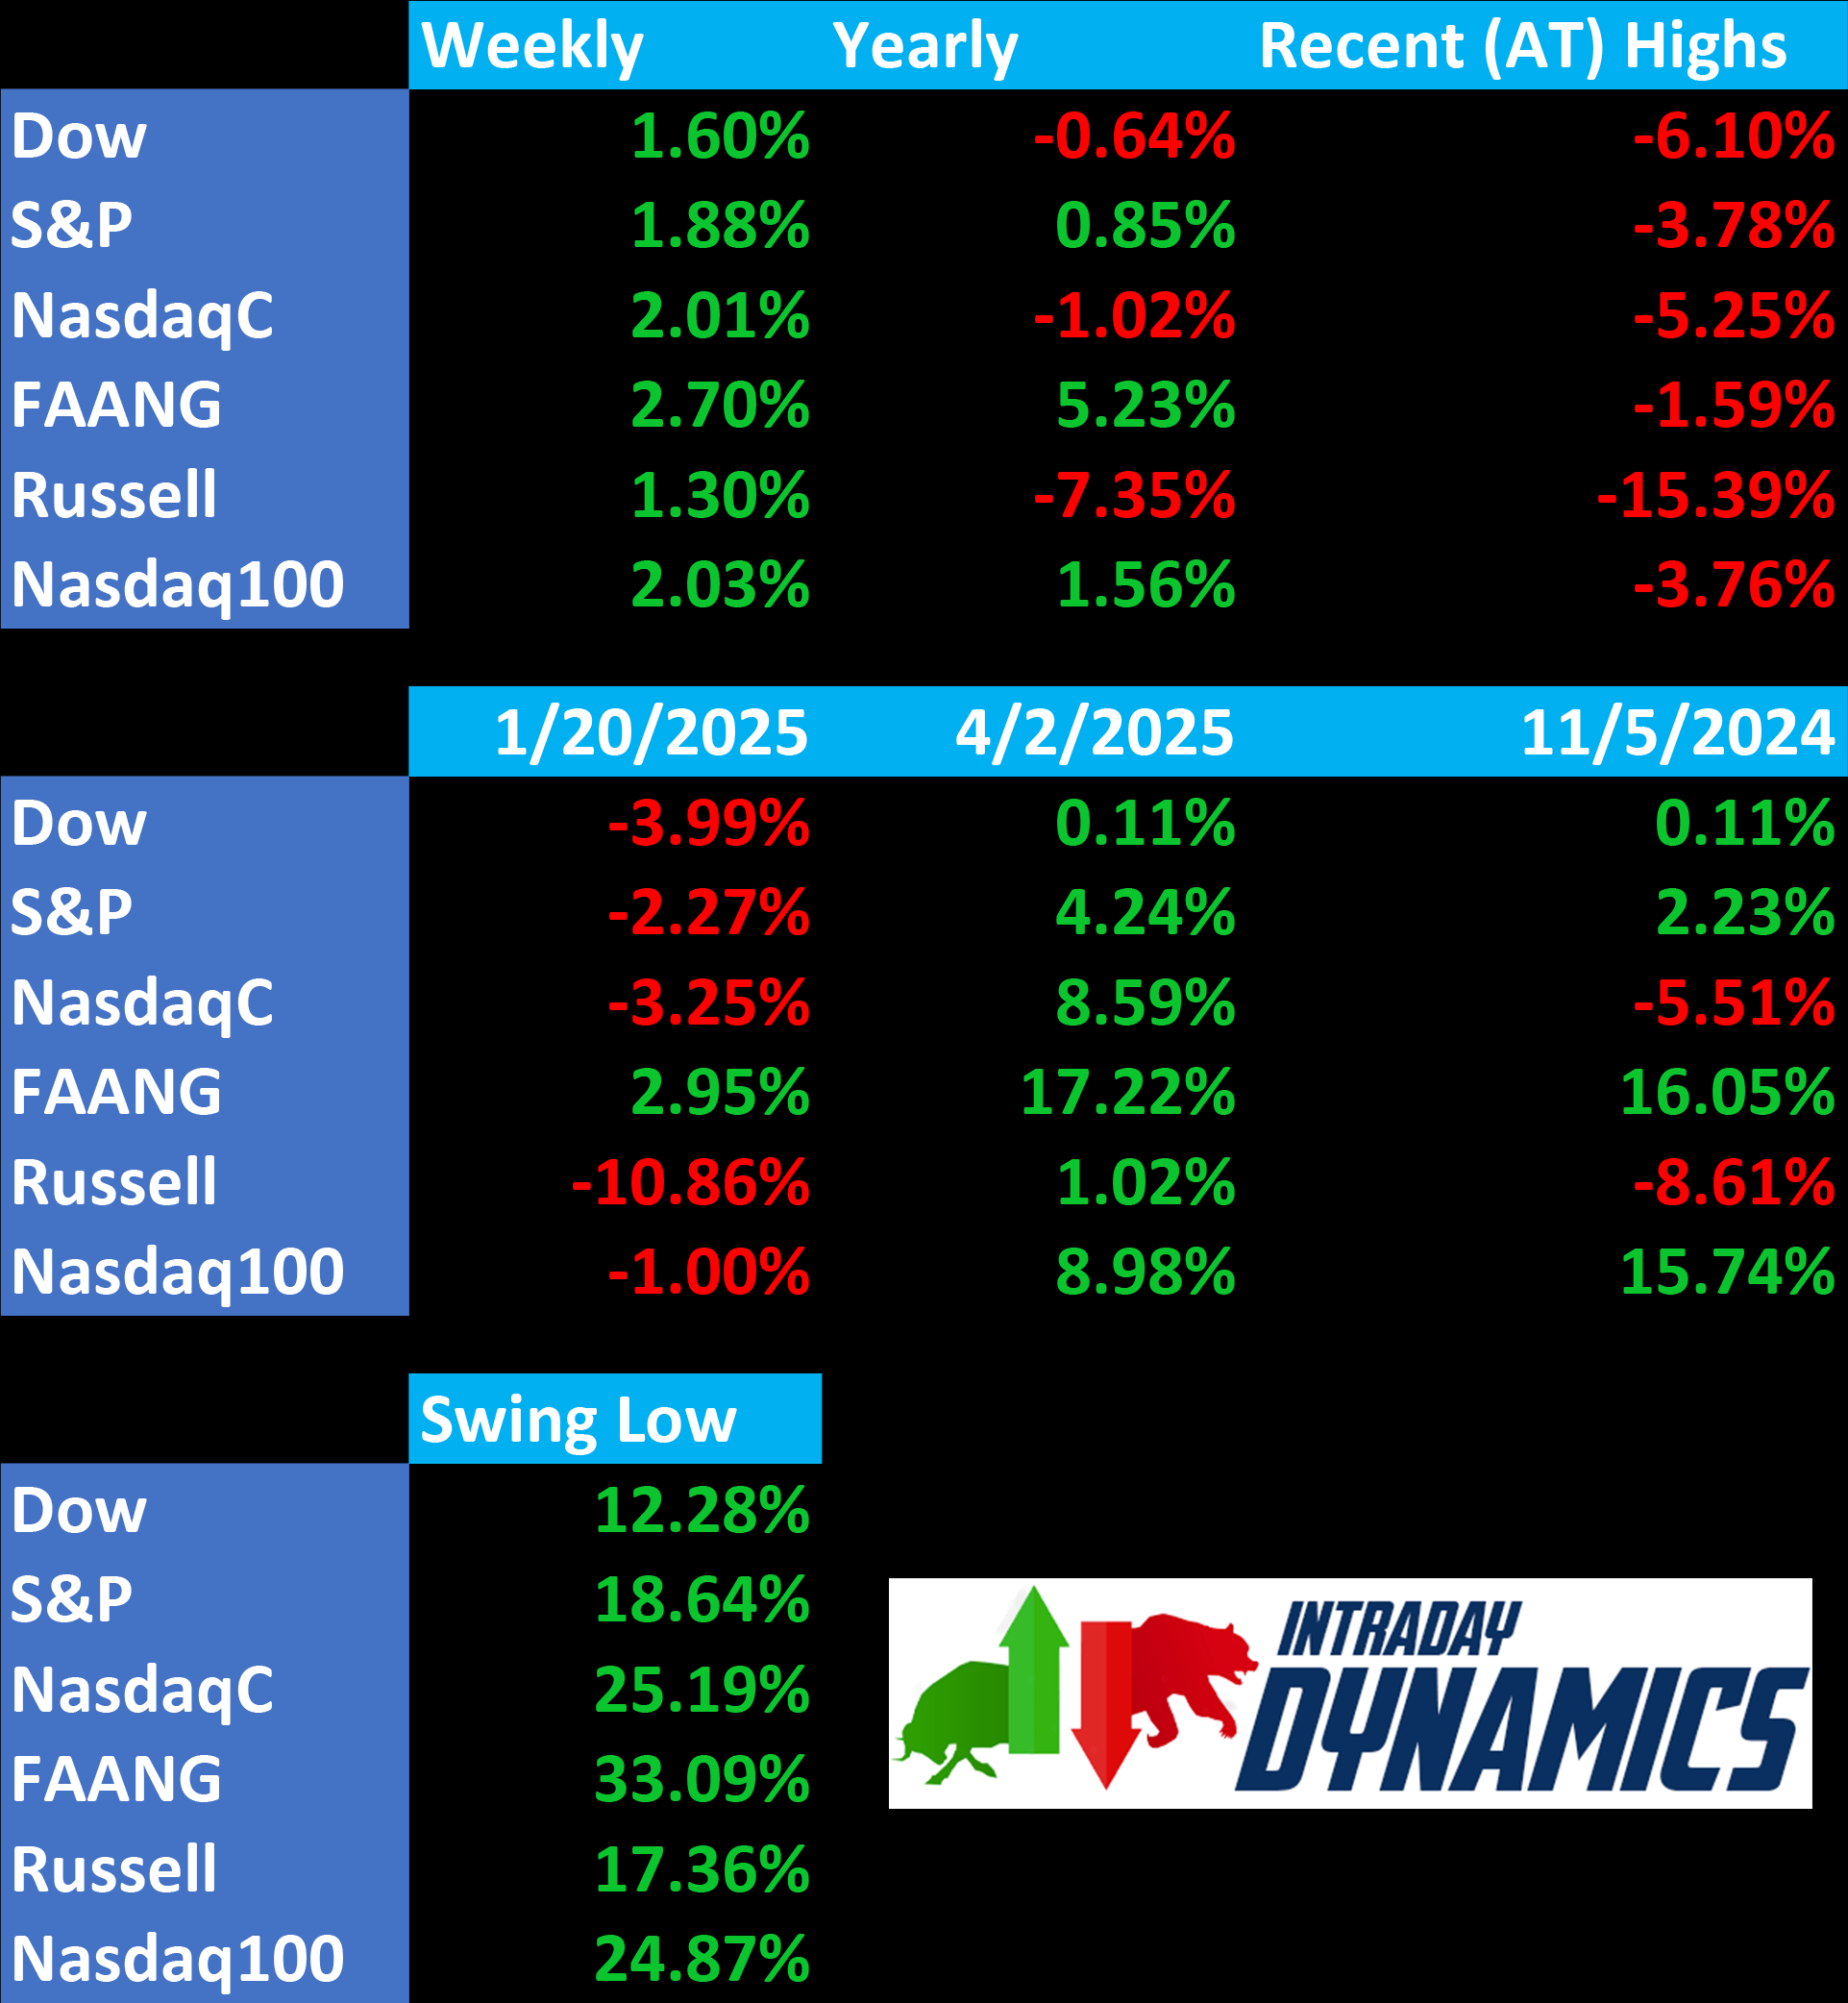
Major Indices Week of May 30, 2025
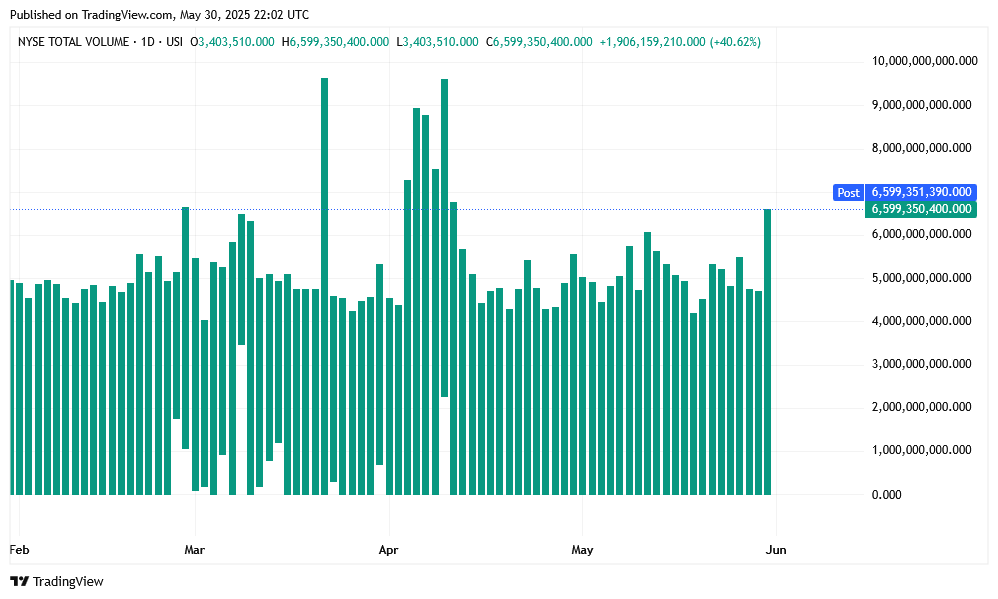
 NYSE Volume
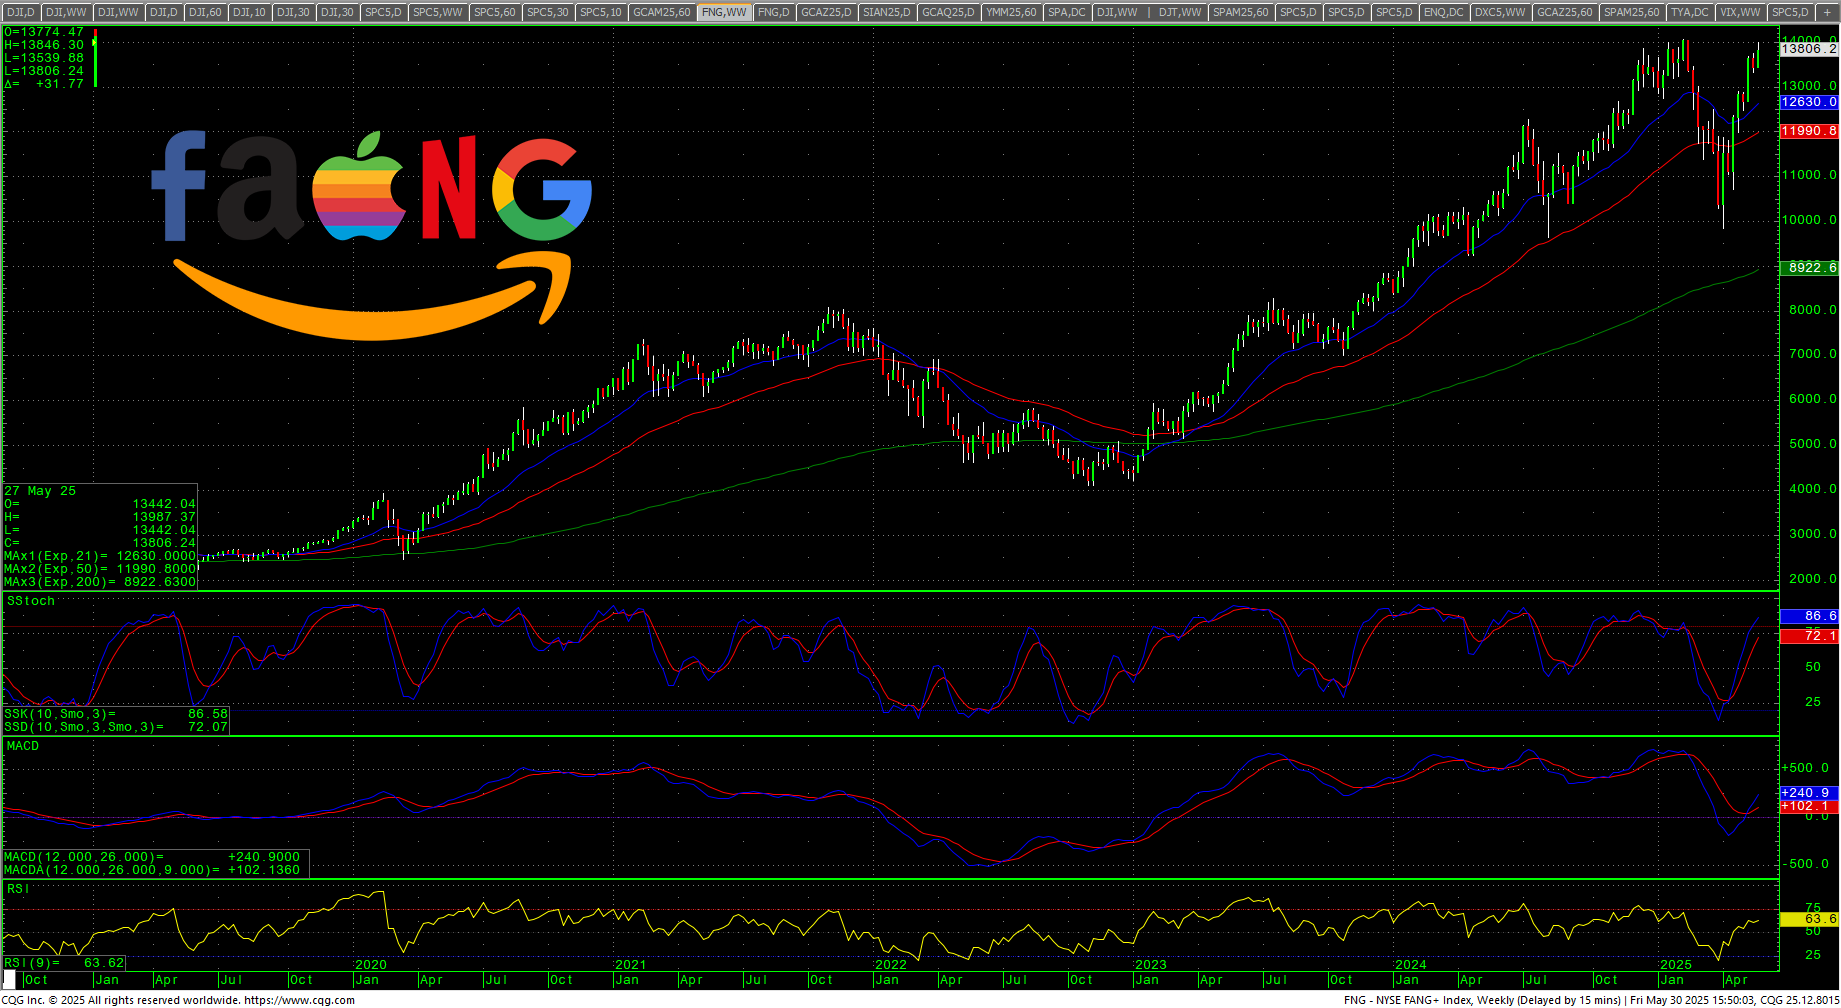
 NYSE FANG Daily Candles
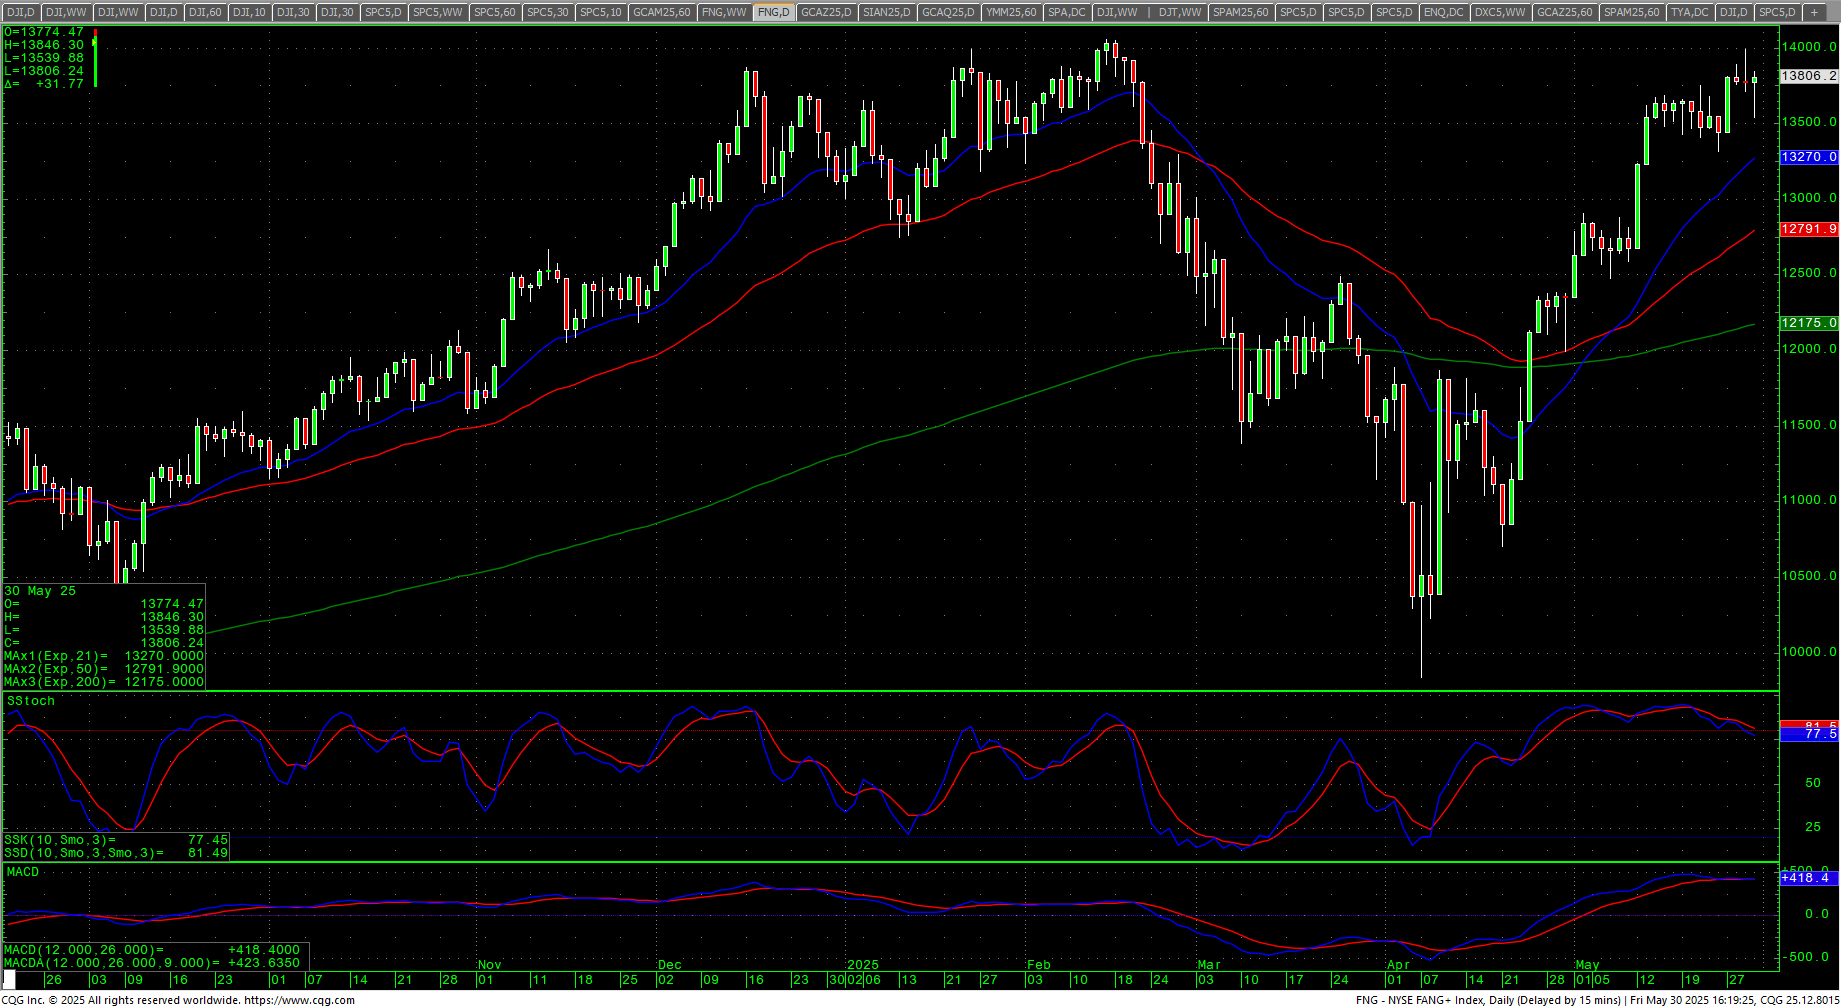 Stocks traded in choppy and tight weekly ranges with higher volume book balancing for the month’s end on Friday. Mostly inside week trades apart from the high-flying tech market as NVDA capped the latest quarter of MAG7 reporting with a bullish report. The FANG led the markets higher as that index came fractions from the ATH before backing off late in the week.
The previous Friday, prices were driven down by more tariff threats, and then we came off the long weekend with tariffs off again. This prompted Wall Street to start talking about “TACO Tuesday,” or, “The TACO Trade.”
“It’s a new week and we have the latest example of what an FT columnist has called the TACO trade engaging once again: Trump Always Chickens Out,” the podcast description reads. “In this case, it was Trump’s announcement late yesterday to delay the threat to slap 50% tariffs on the EU already to July 9 rather than June 1 (which he threatened on Friday).” –The Hill
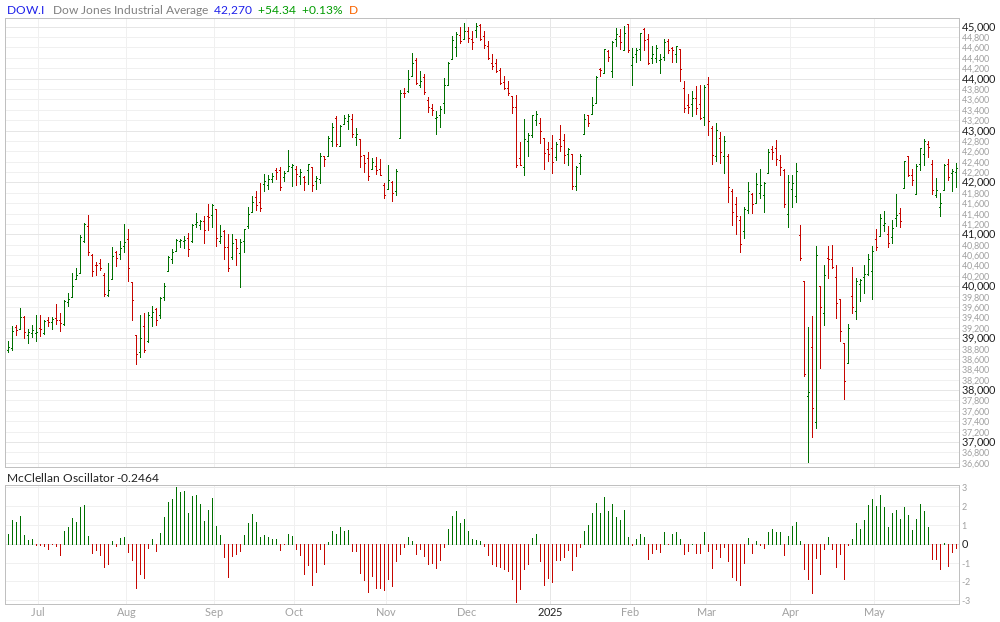
Dow Jones Industrial Average Monthly Candles
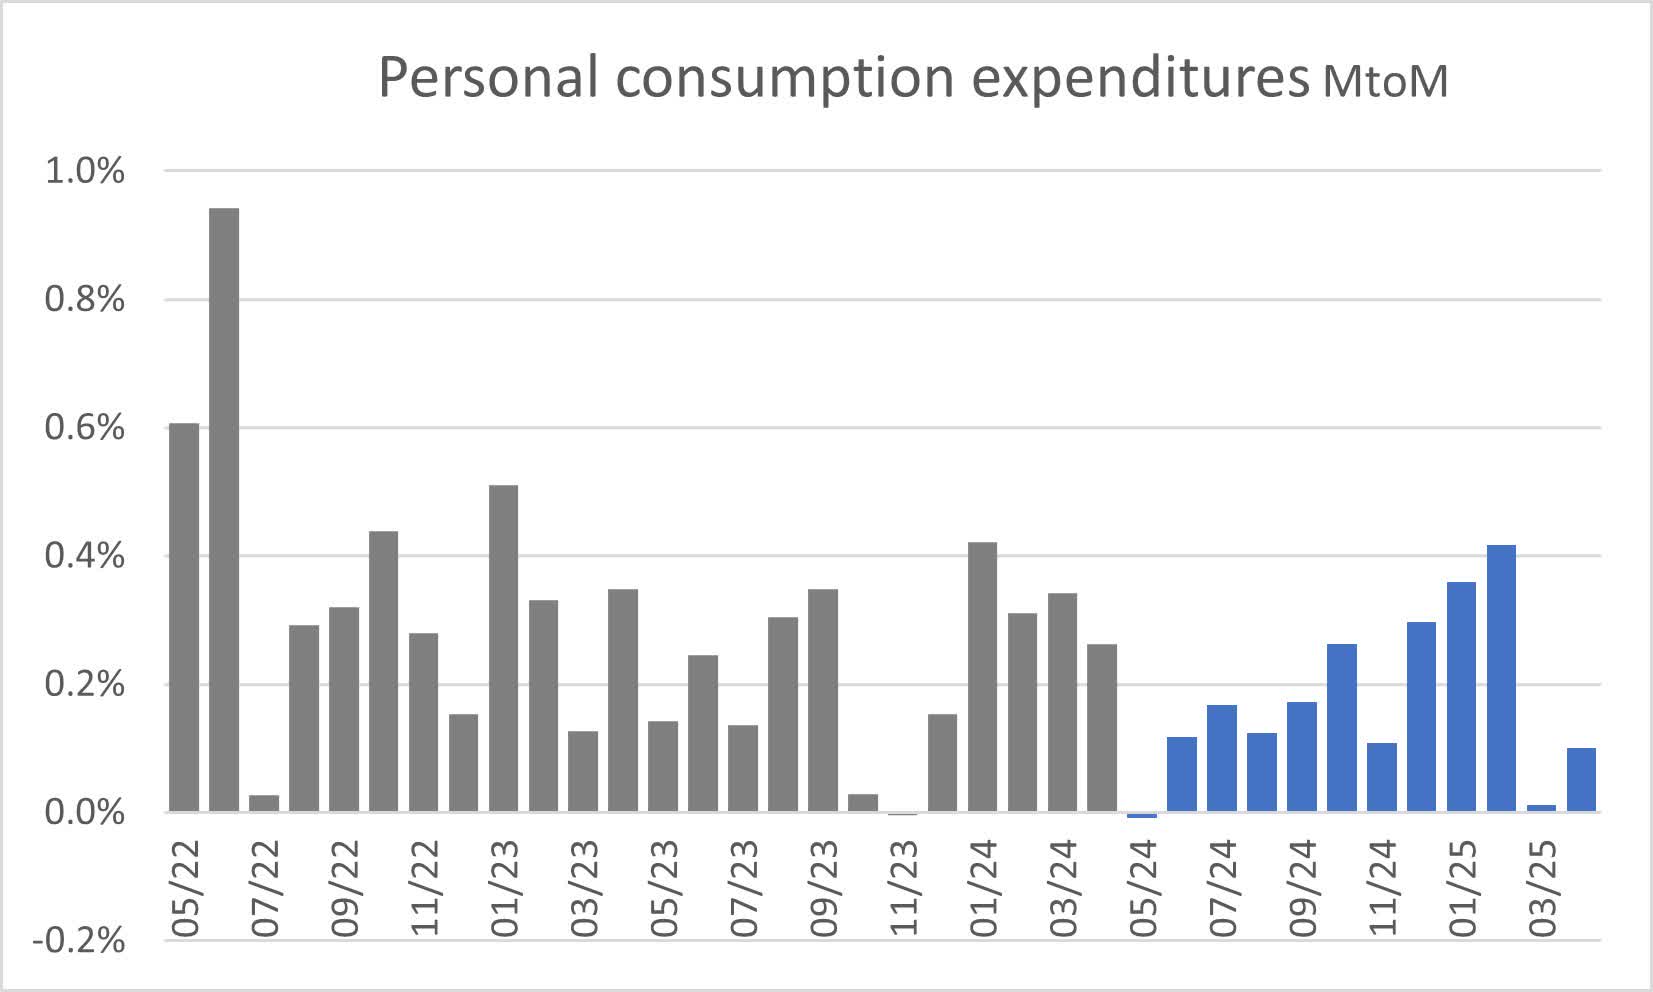
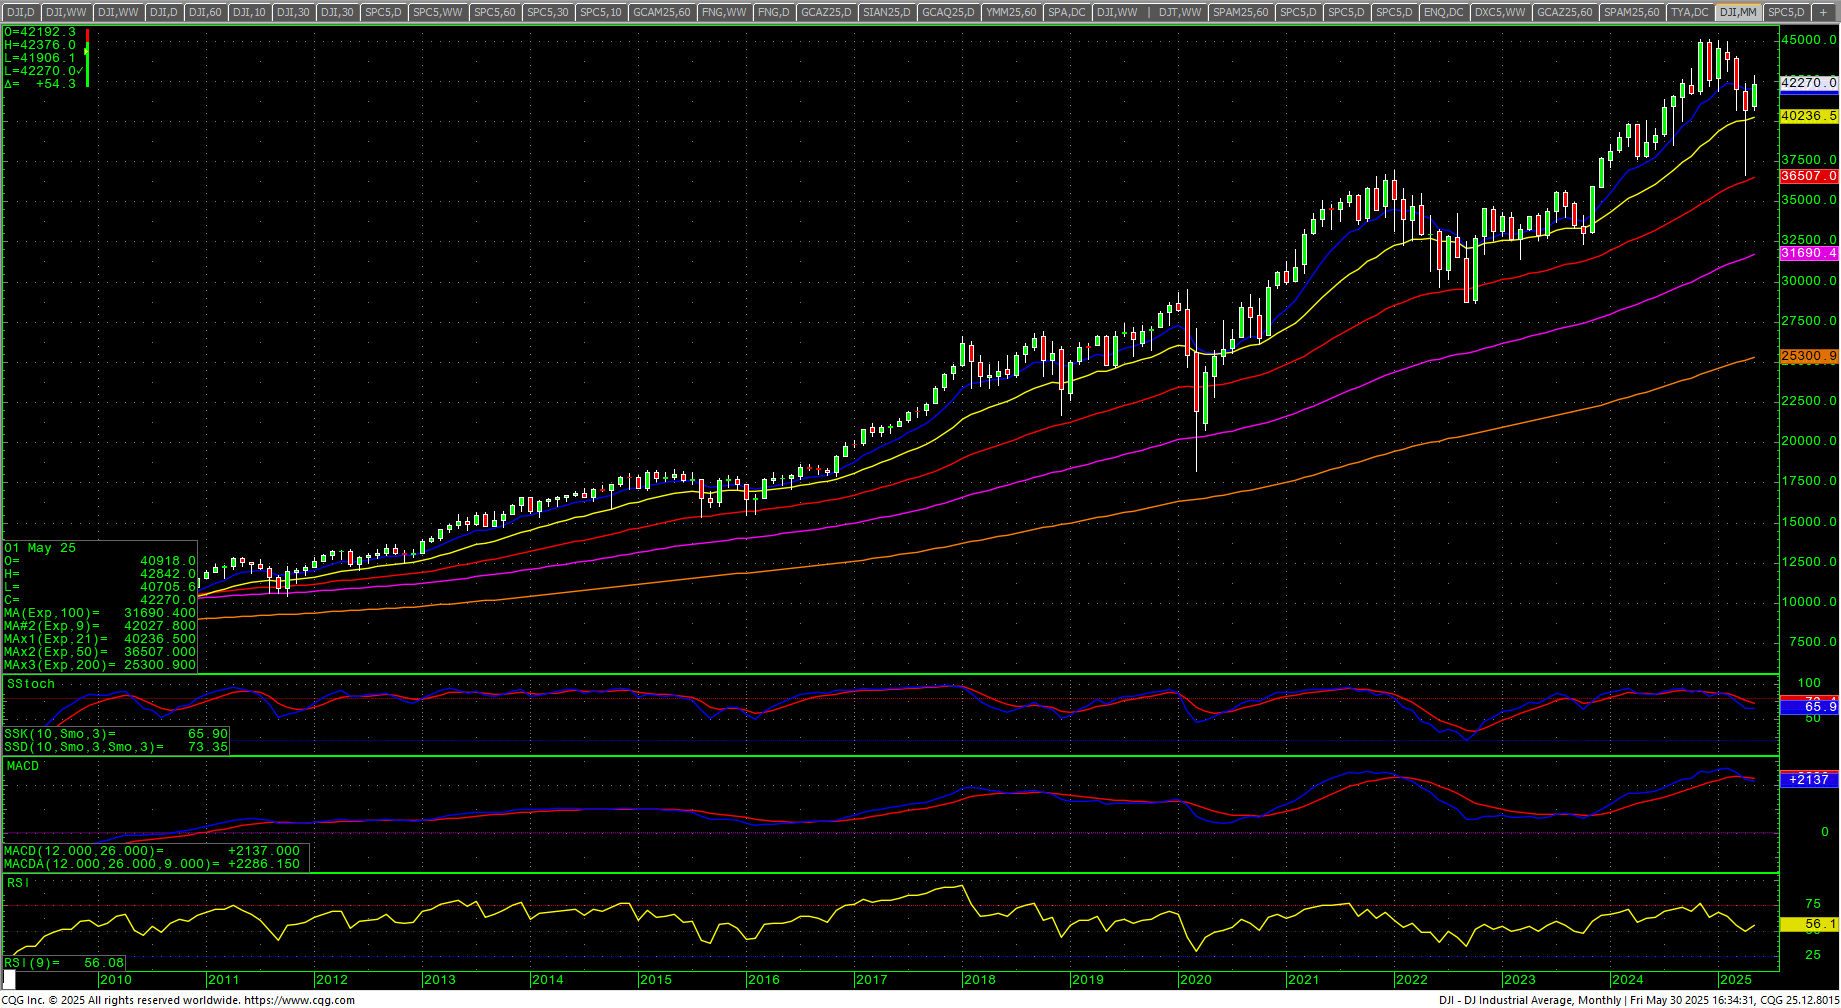 TACO or no TACO, the markets closed out the month of May in a bullish posture on follow through from the April Doji on the monthly chart. As a cap to the choppy week was a cool PCE reading. While the bonds seemed to champion the news with a decline in yields…between the PCE and the Q1 GDP revisions, the data seems to show the stilts under the economy are starting to get wobbly. Very wobbly.
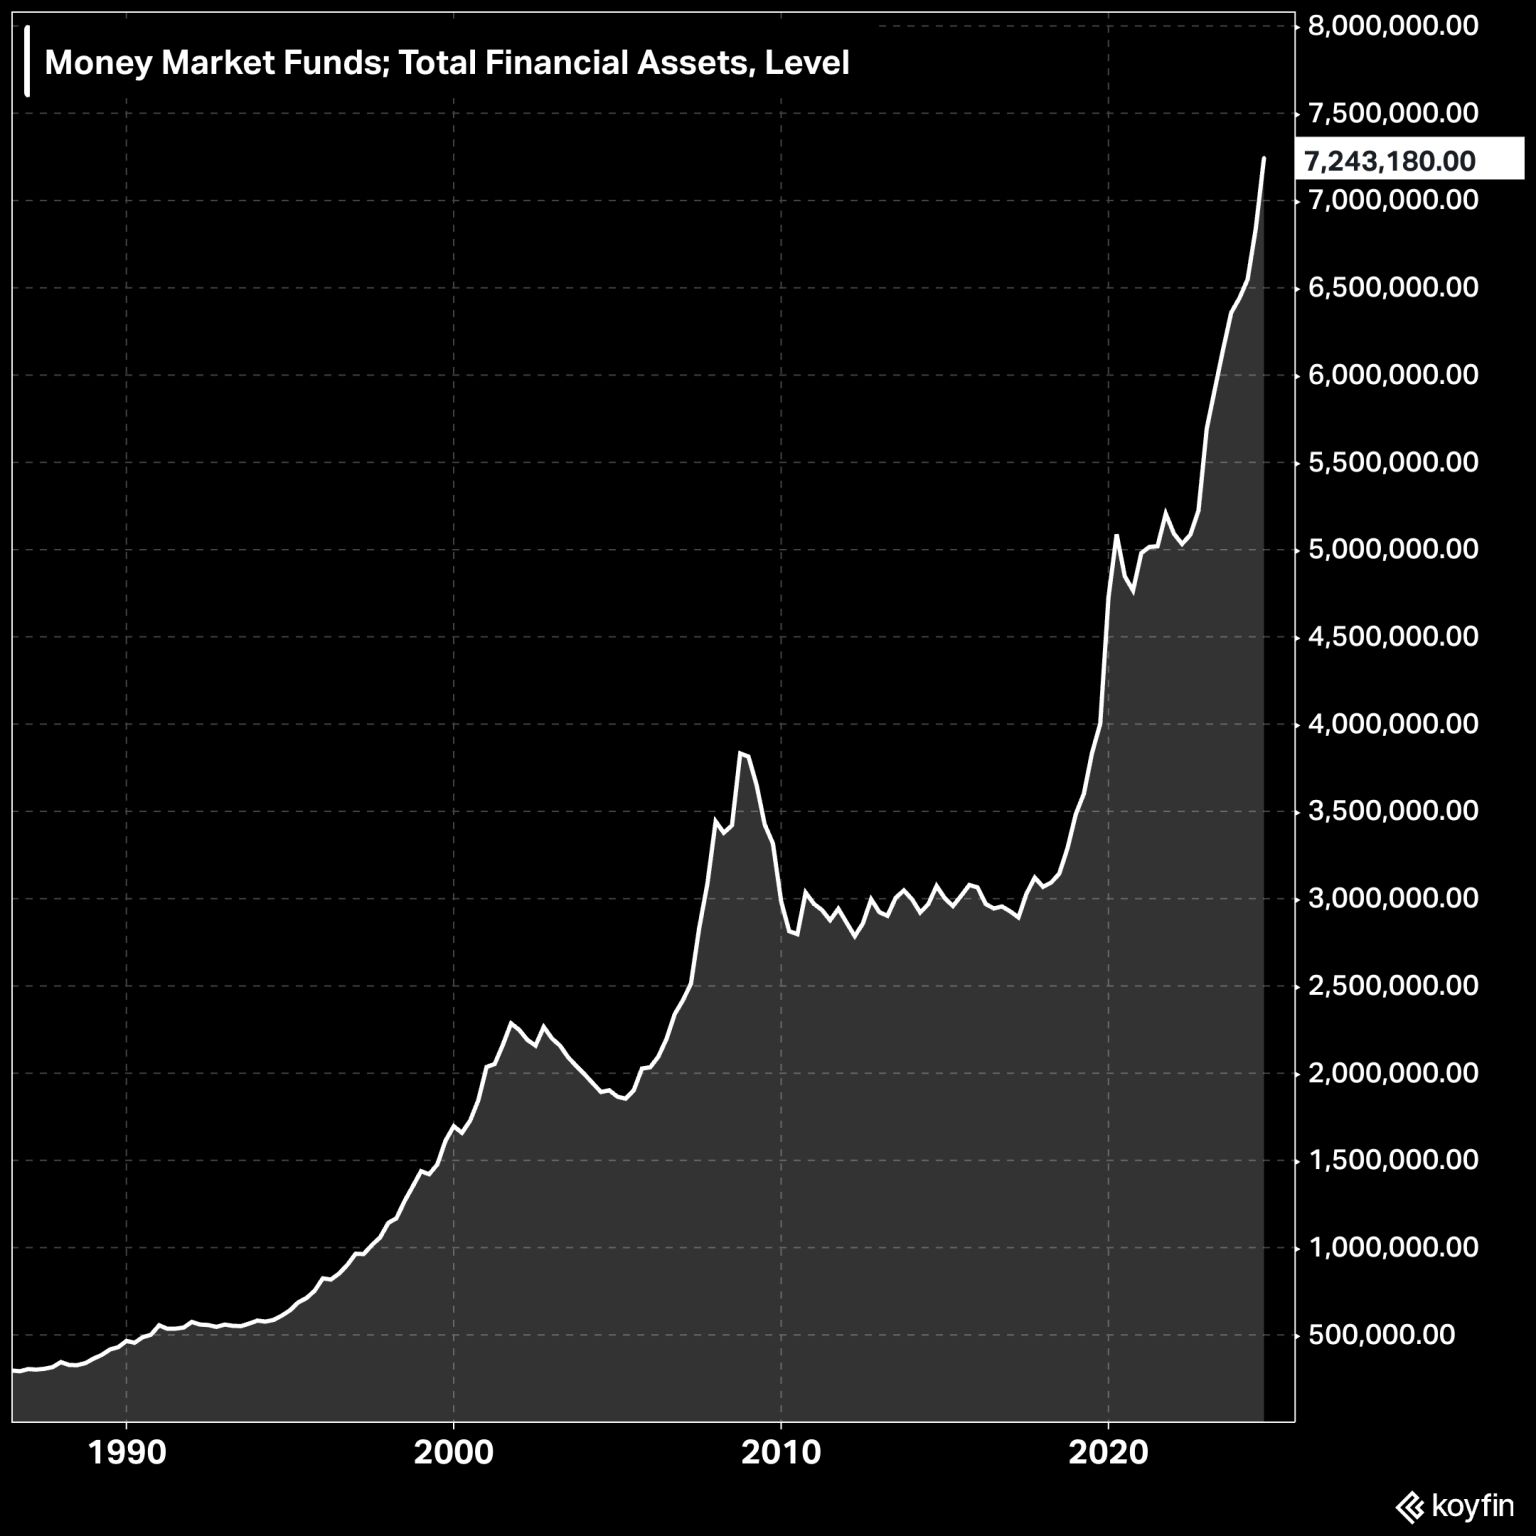
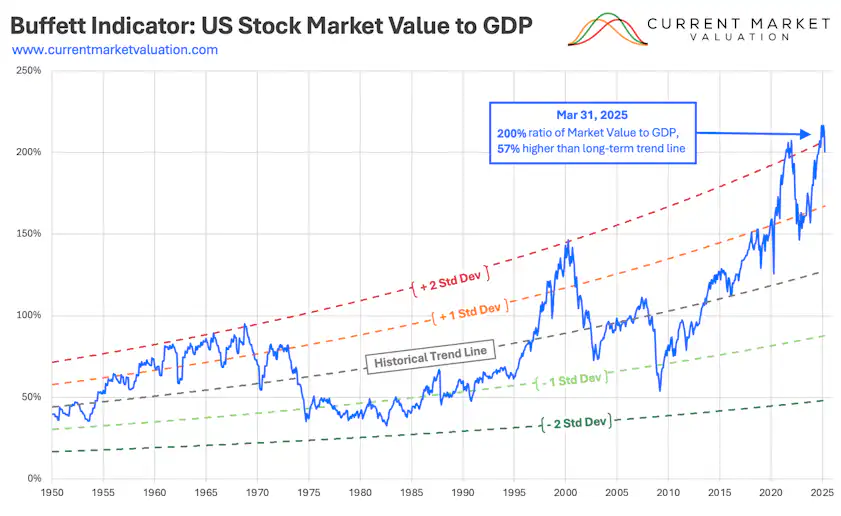
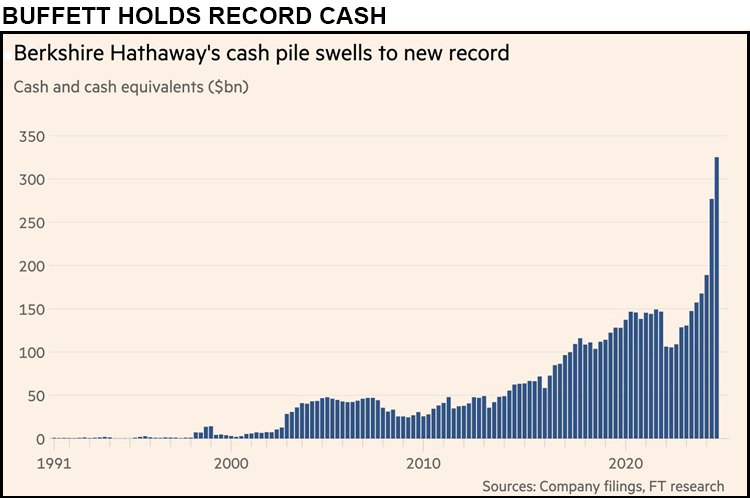
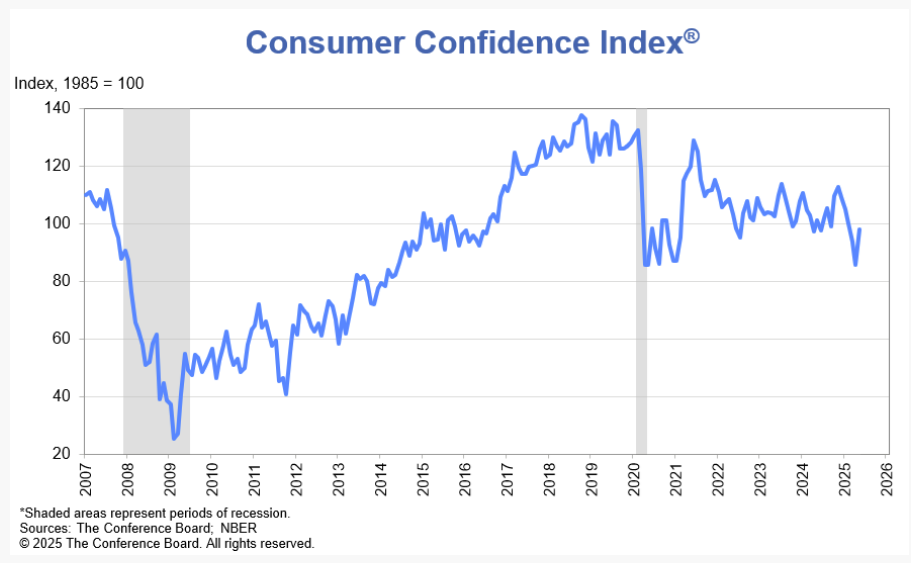 However, Consumer Confidence did perk up with the May rally in stocks…although it is important to note that sentiment readings continue to skew sharply along partisan lines. FMS cash levels remain low and Money Market funds are at record highs. What will the summer bring? Will we look back and say, “Sell in May and go away?” The “Buffet Indicator” remains at 2+ standard deviations while Berkshire holds the most cash ever recorded.
 Thursday/Friday marked some critical daily timing, how we come off these days trade will be critical to the short-term trends.
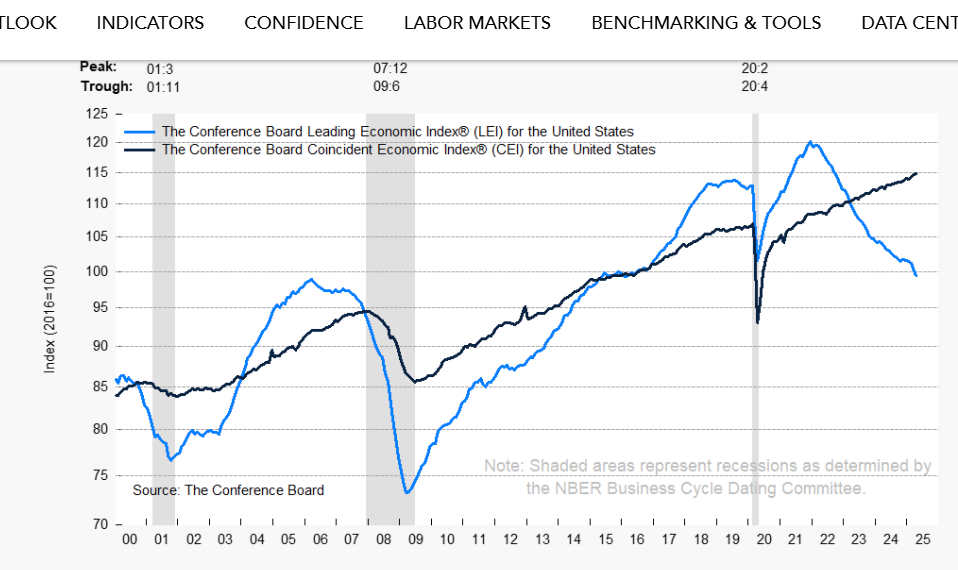
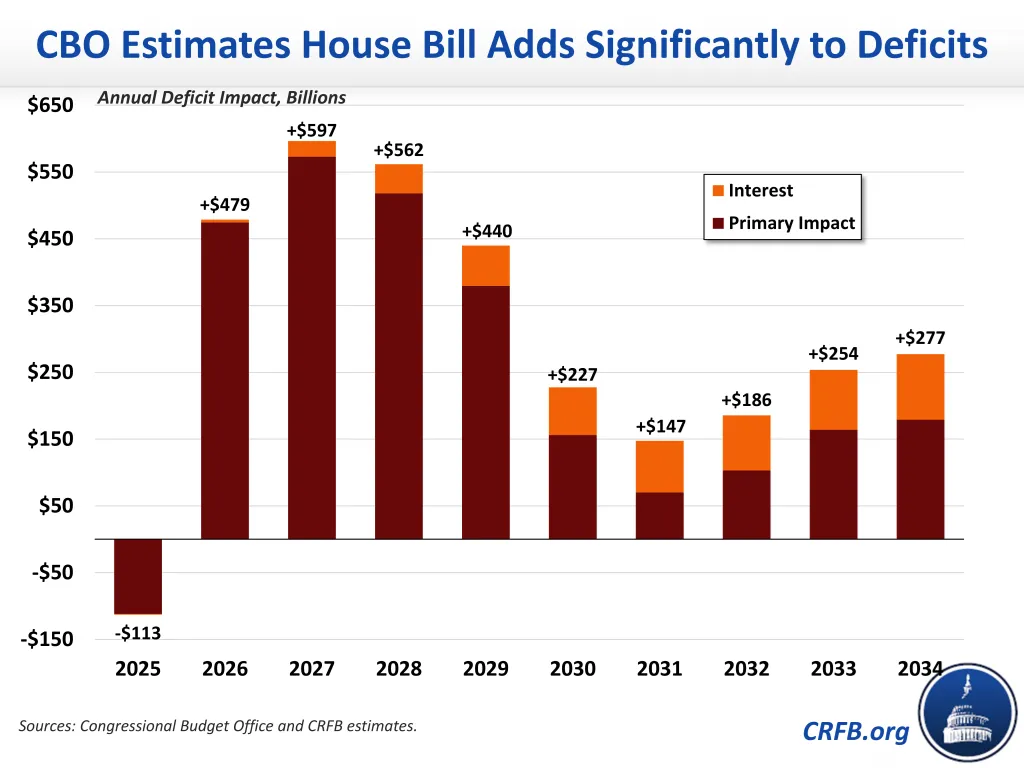 We remain in Waffle-land, where the Fed is trapped between the looming potential for inflation thanks to Tariff Man and the reality that underlying fundamentals are slowing sharply and threatening stagflation. These, coupled with the CBO estimates for a MASSIVE increase in the deficits keeps the Fed on the fence. The bottom line is that the bond markets will continue to dictate reality for equities. That said, the entire global economy is teetering and the rest of the world’s central banks are in a race to the bottom for rates. Leading Economic Indicators are moving toward recession levels.
 SPX Daily Candles
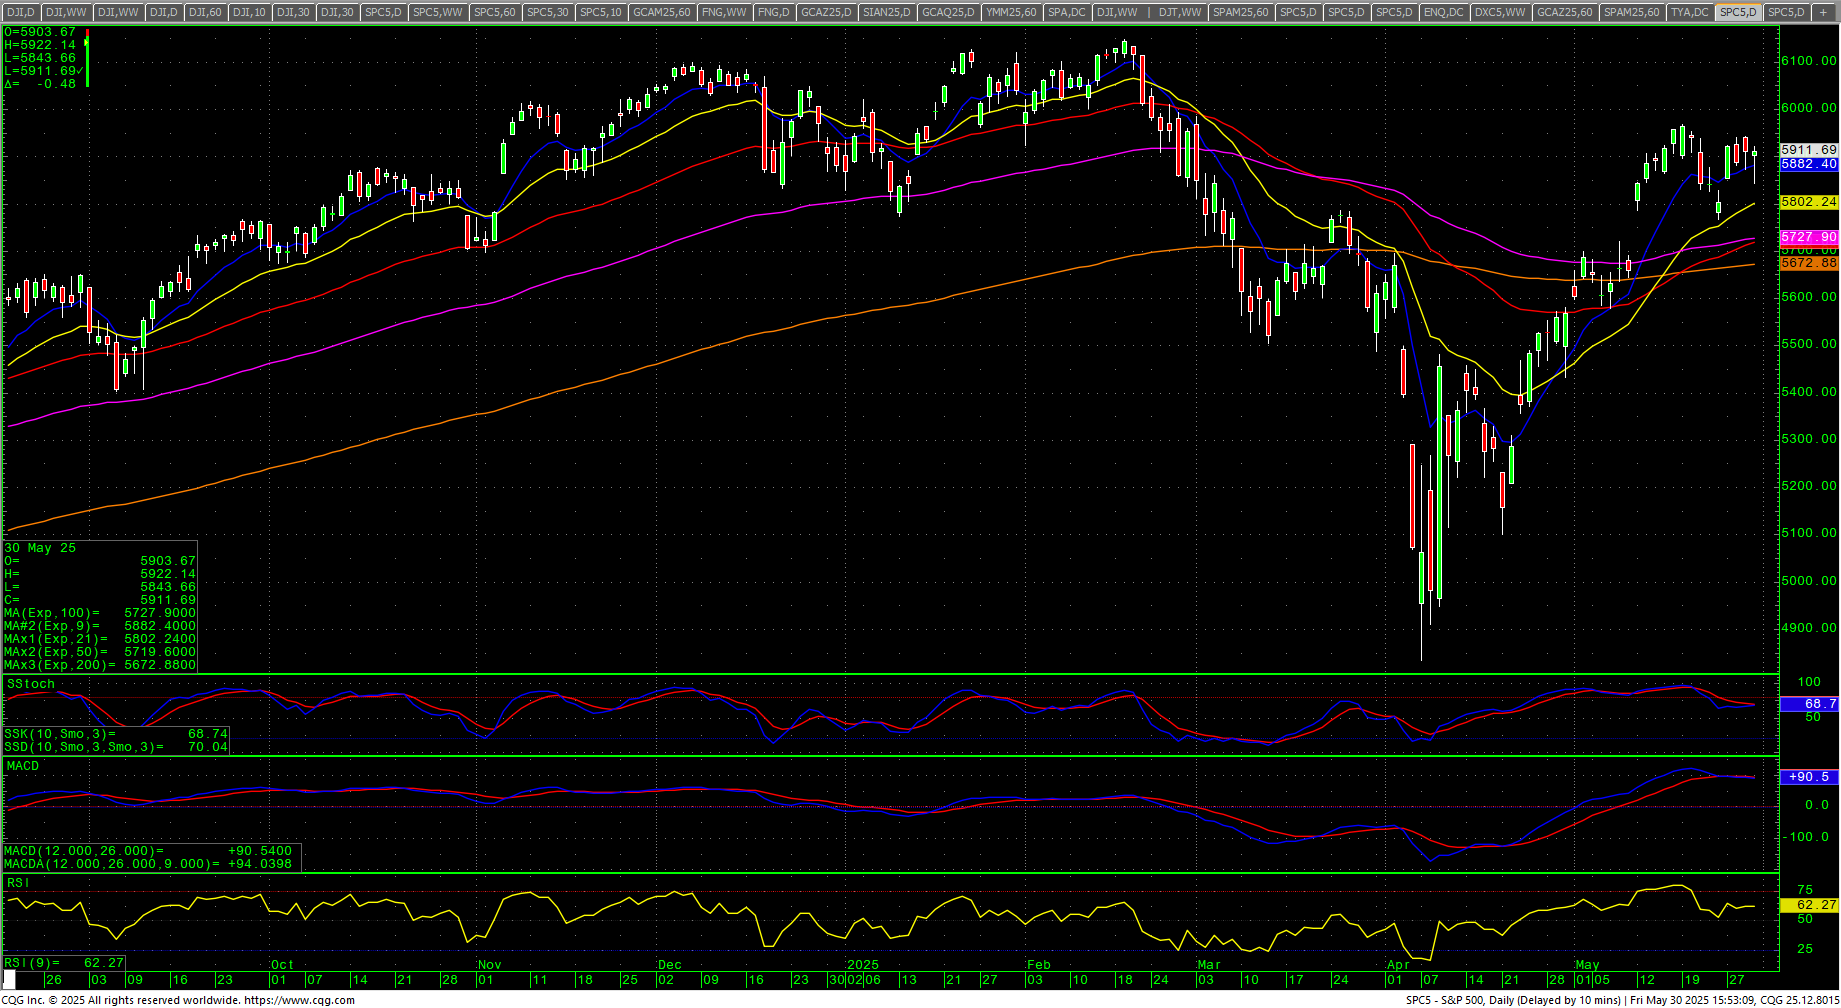 Remember that the SPX daily recently issued a Golden Cross. Historically, whenever a market takes out the 200-day after trading below it in a break, it is often followed by a return to the 200-day. For the SPX, that sits at 5672.88 and trending up on Friday’s close. That’s 238.81 points or a down move of -4.04%.
MAGS (Magnificent 7) Daily Candles
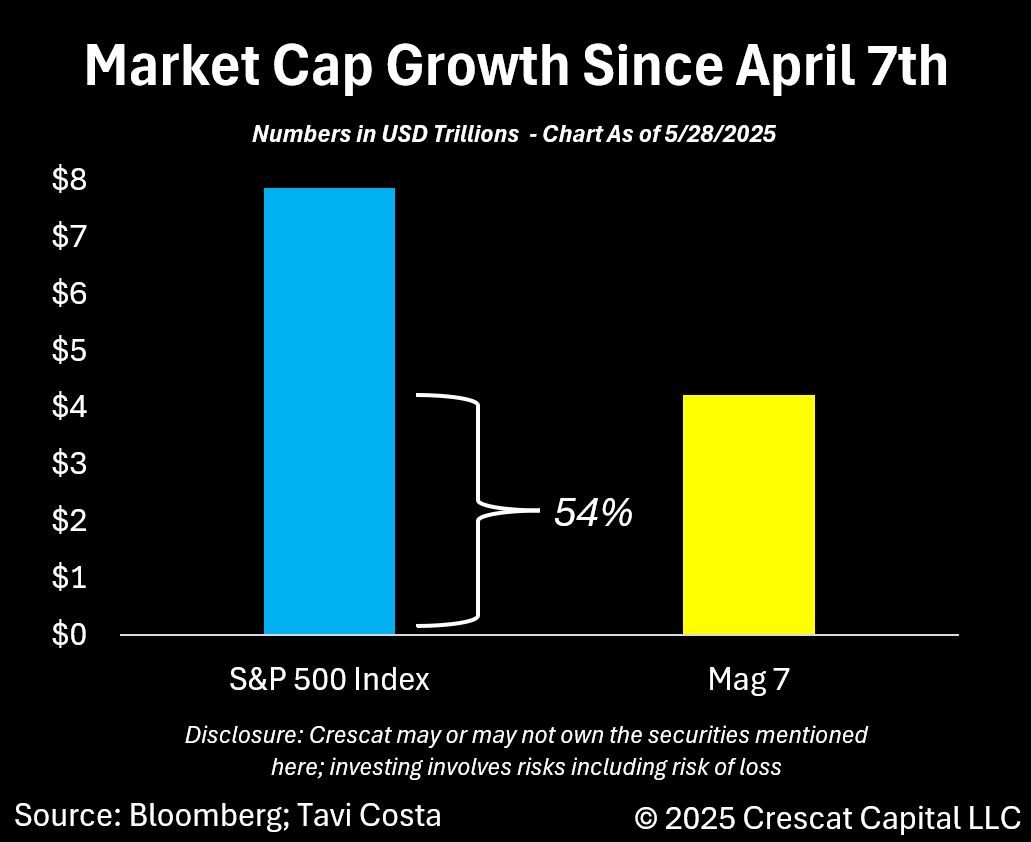
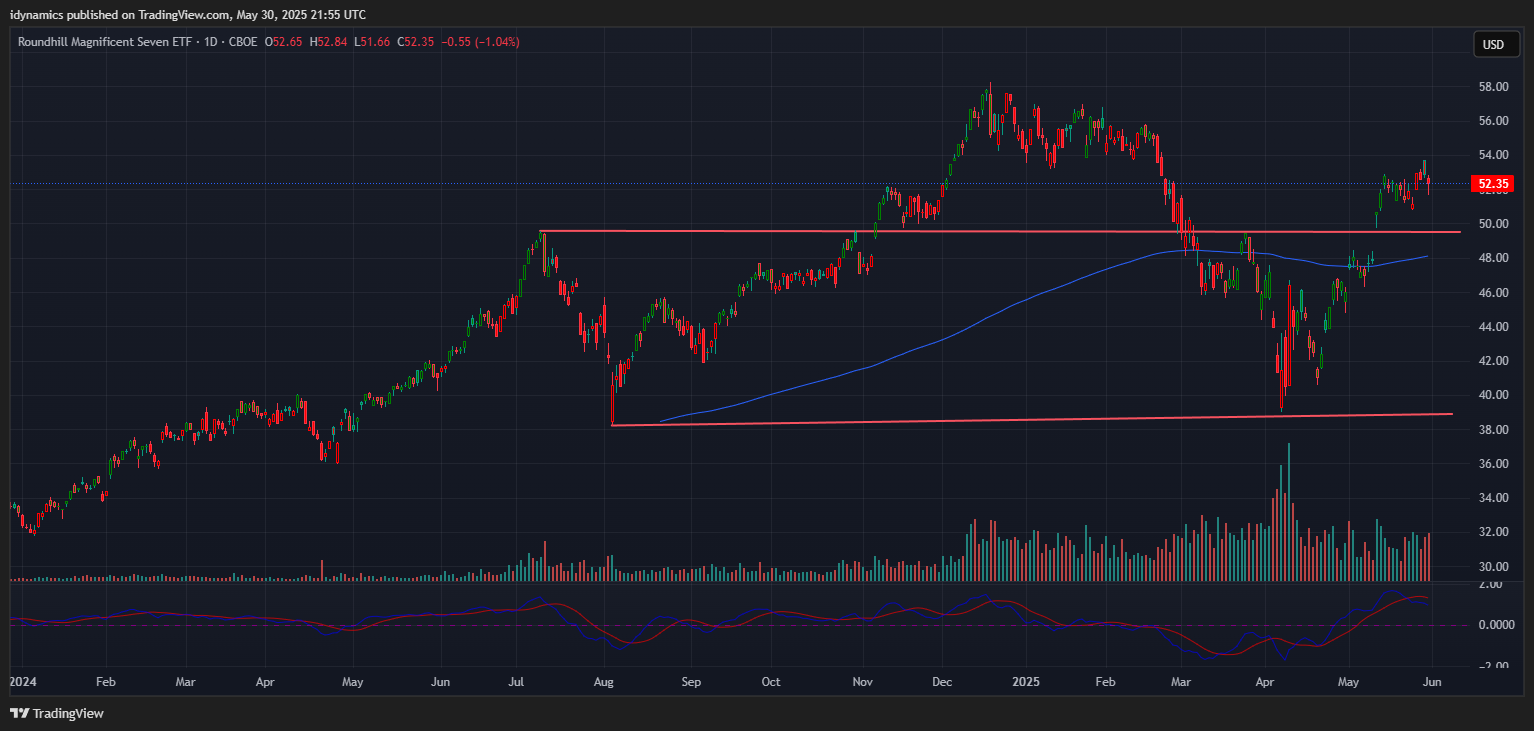 The MAGS (Magnificent 7) traded a new recovery high for the move as prices briefly took out critical resistance 53.16 before closing on the lower end of the weekly range and below the weekly close of two weeks prior. Right now, the 53.16/54.16 level remains critical. Daily closes over 54.16 will increase the bullish view for the chart and open potential for a test of the highs. A break back under 50 should accelerate selling again. The thinness of the market is a potential warning sign overall. Currently, the MAG7 accounts for 54% of the ENTIRE S&P 500 (SPX) market.
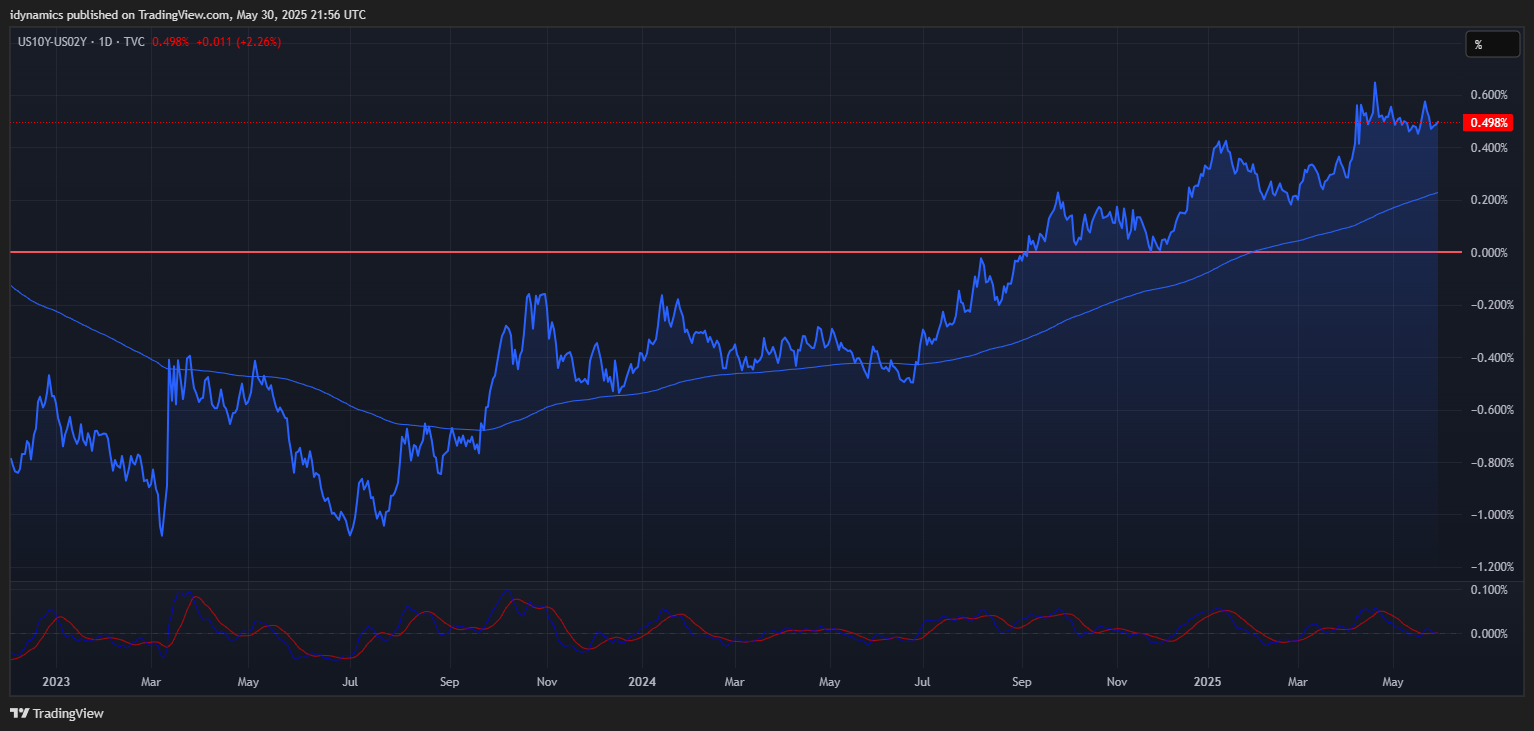
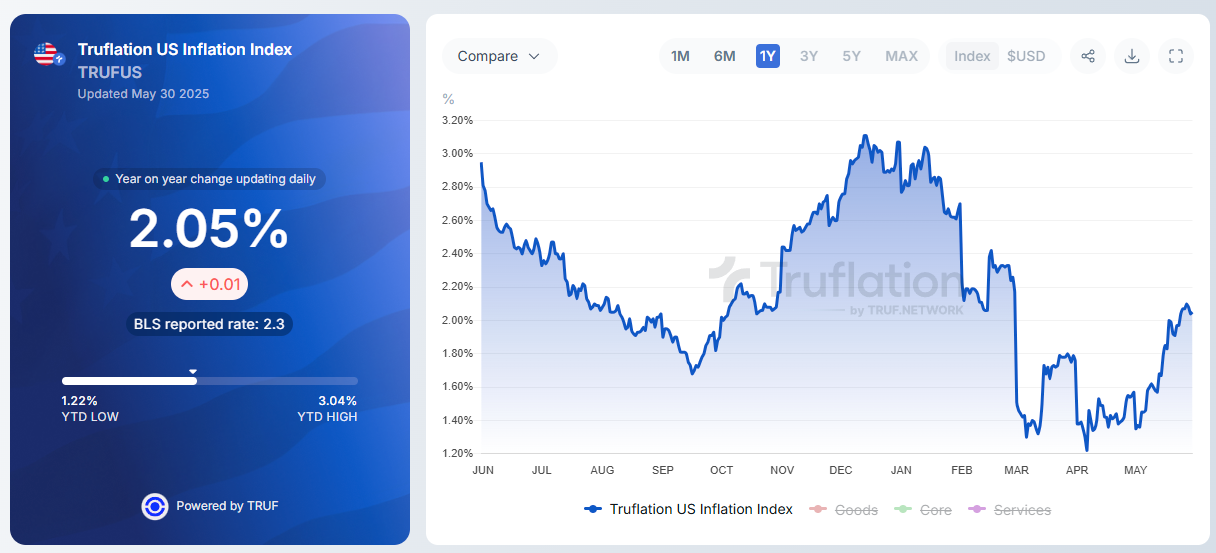
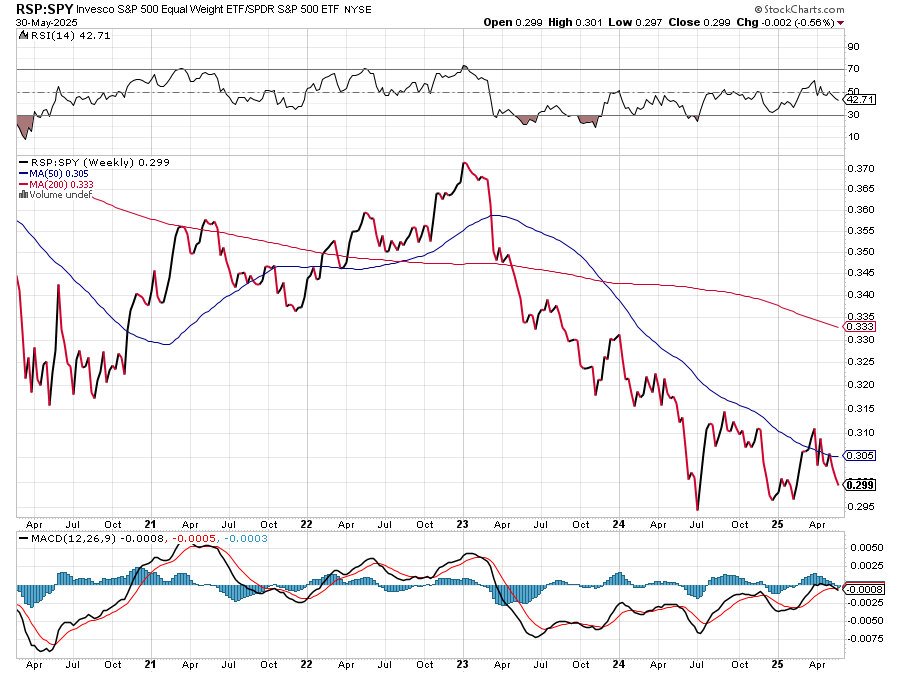
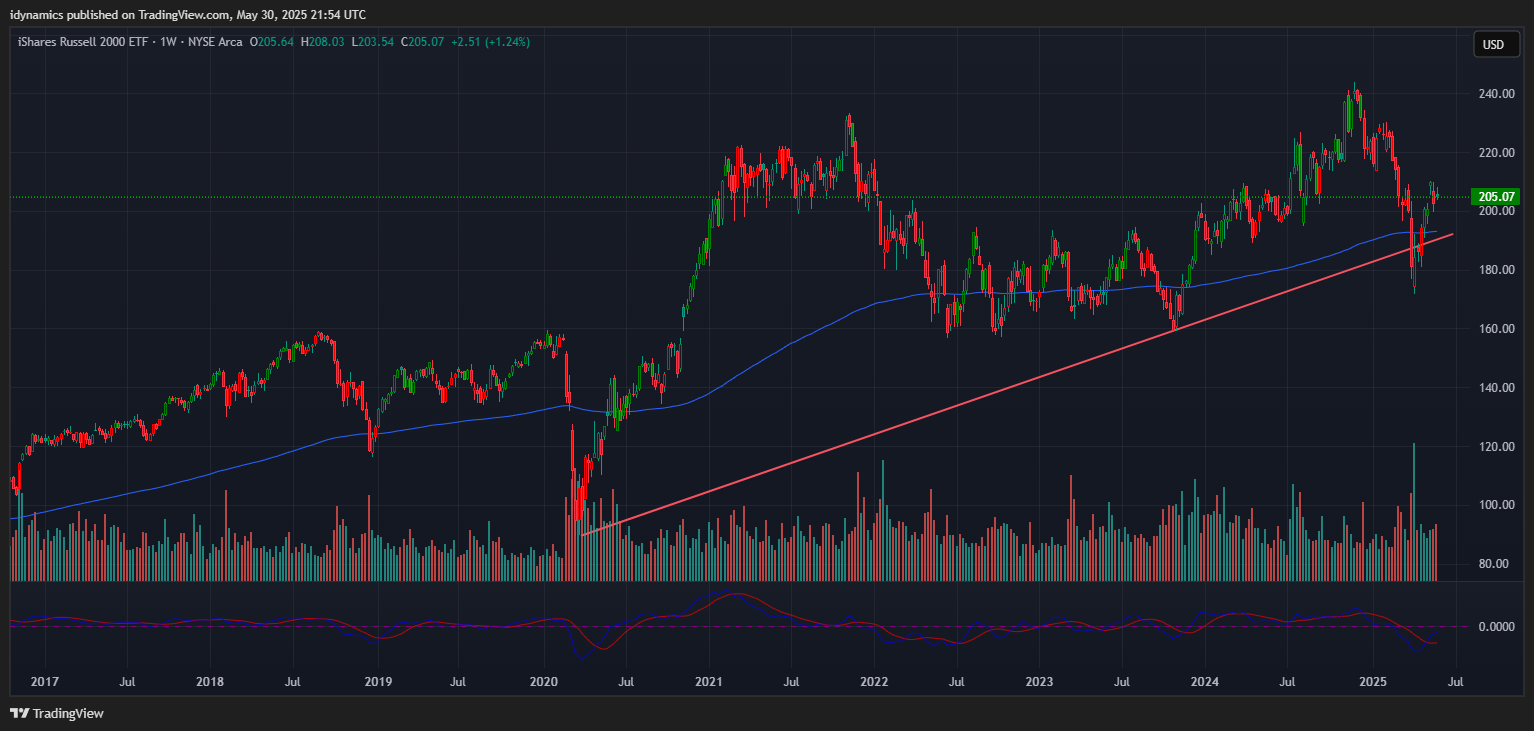
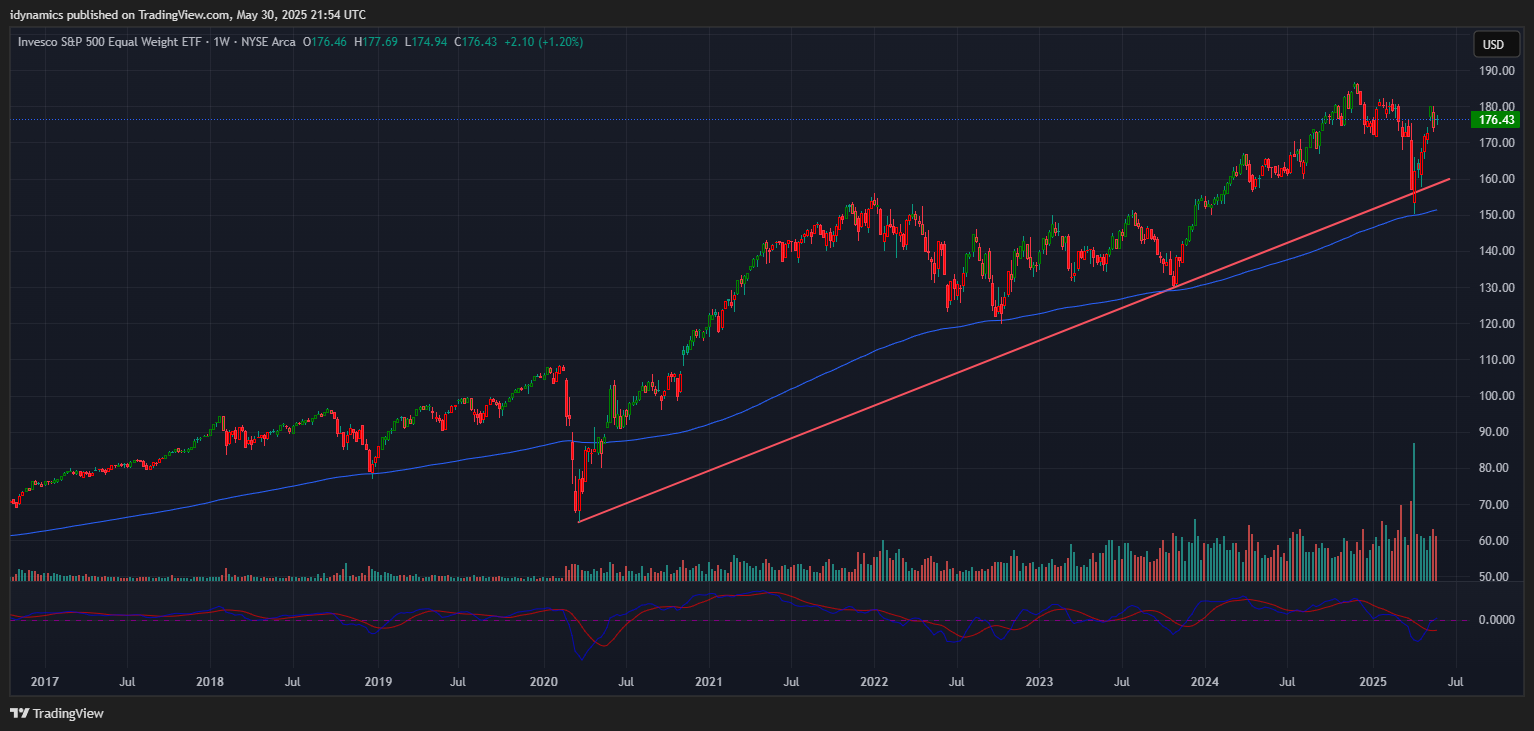
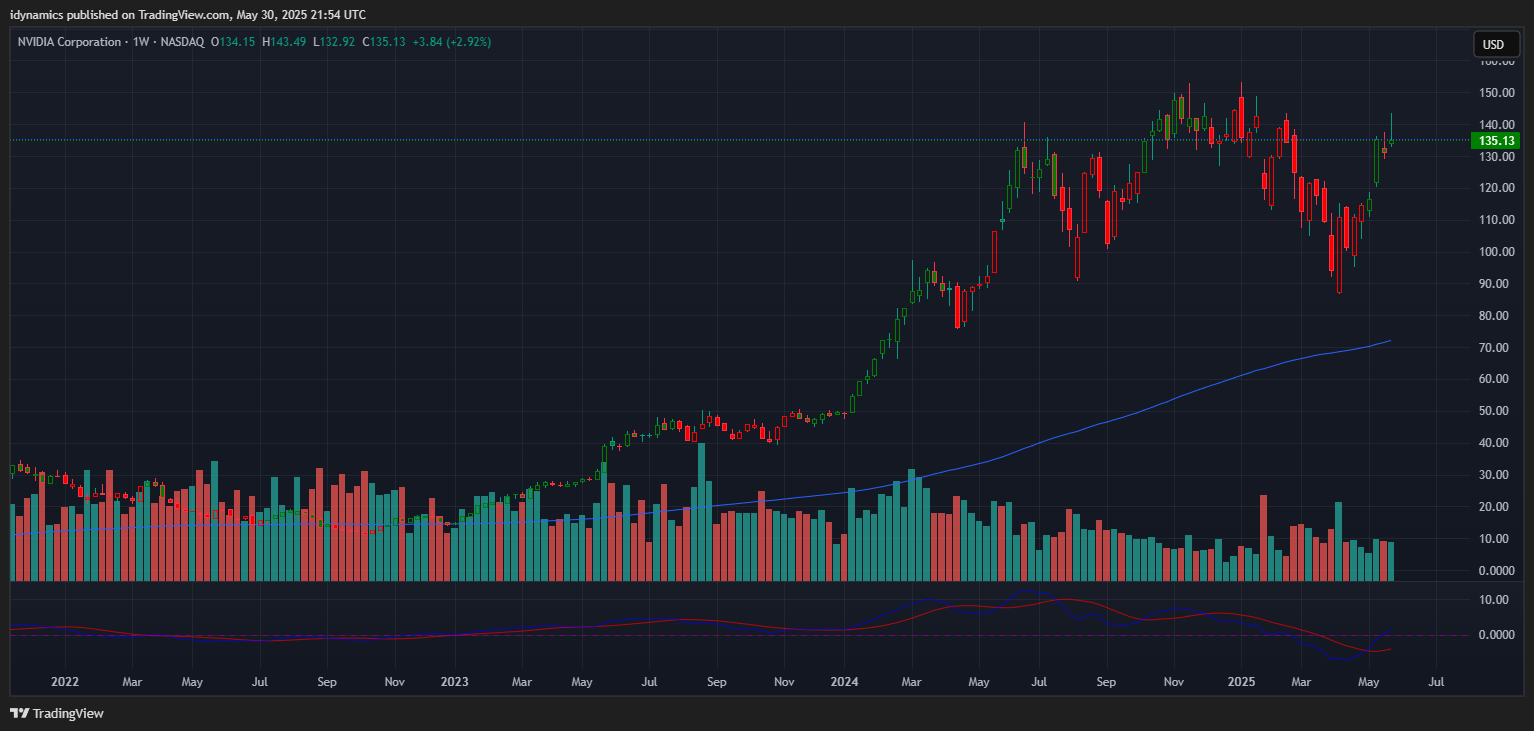
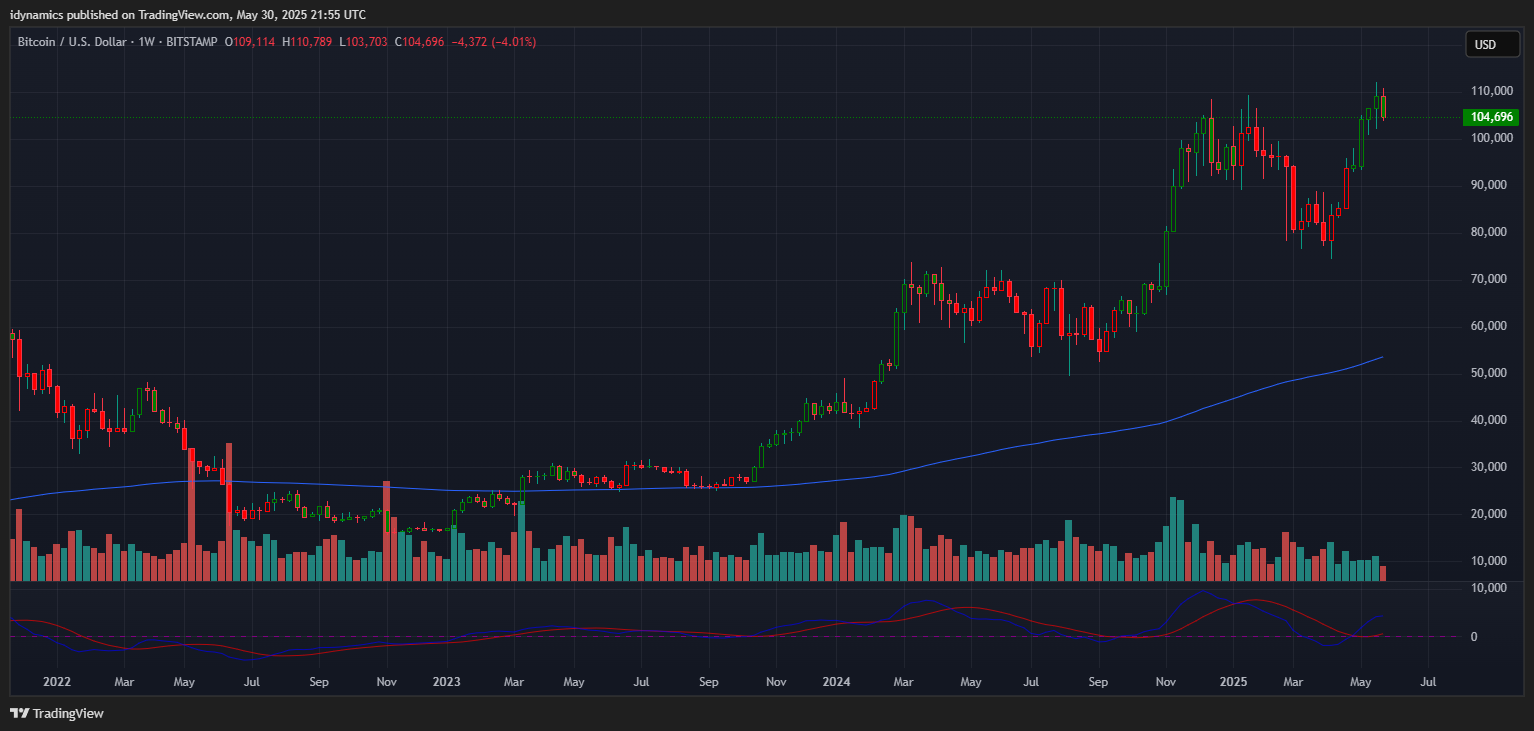
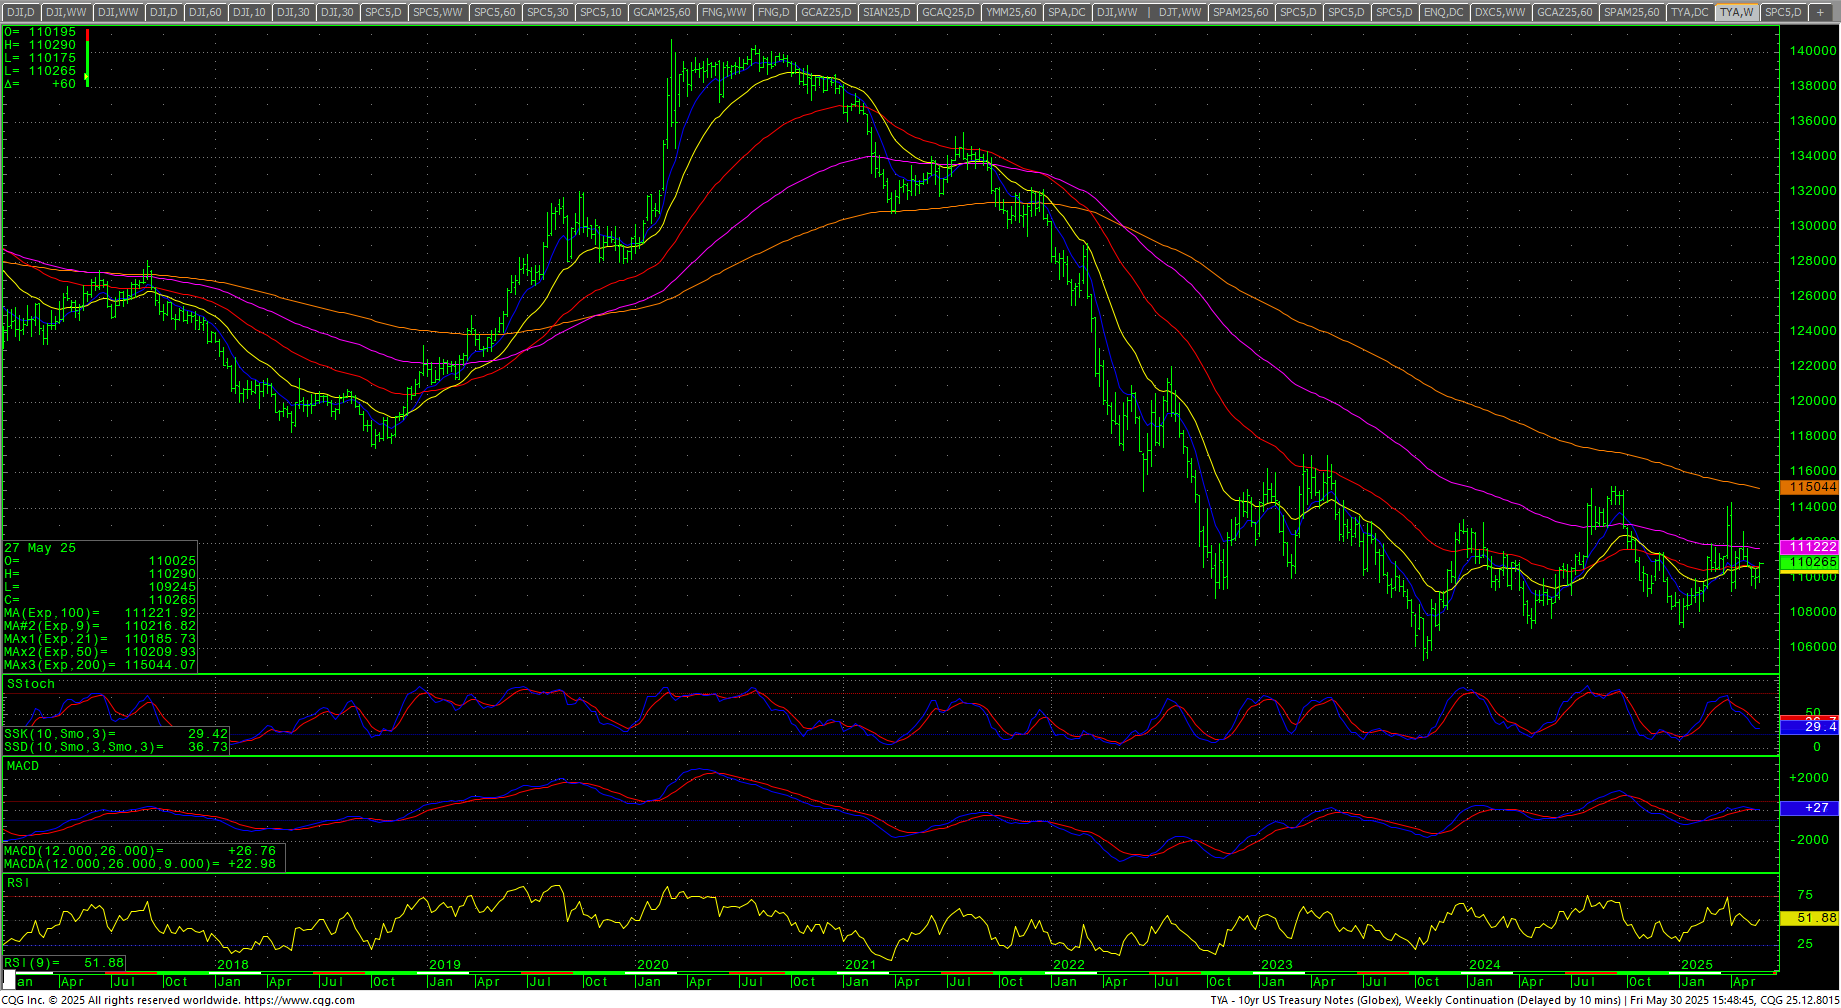
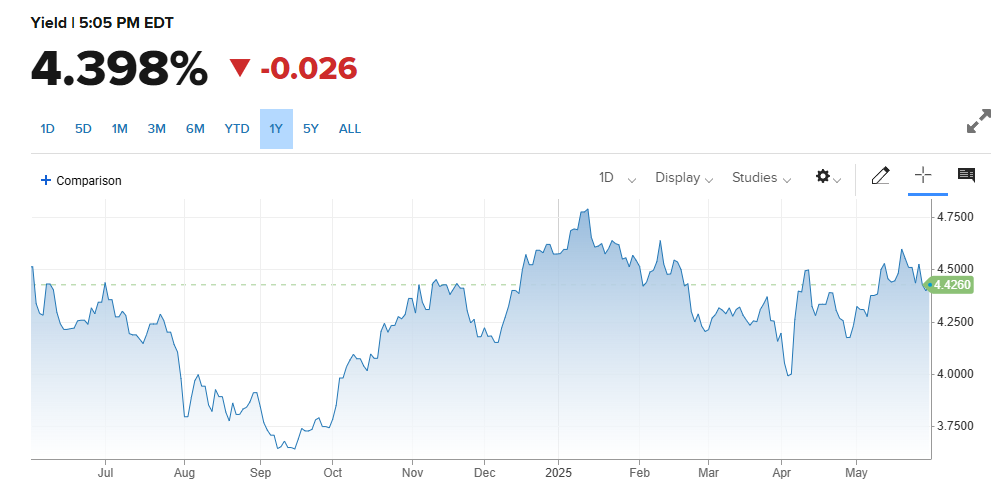
 The RSP:SPY closed lower once again as the weekly is threatening to hook lower in an oversold position and the MACD is turning back down. The IWM closed up +1.24% in the lower half of an inside week’s range. The RSP was up +1.20% on the middle of a tight inside week’s range. NVDA spiked higher to test the February tops before dropping to close on the low of the weekly range but up +2.92%. Bitcoin sold off and closed on the bottom of an inside week’s range. McClellan Oscillators are flat with the inside week. The Yield Curve expanded mid-week and then drifted lower, closing out the week at +0.498%. The 10YR yield declined throughout the week and closed lower at 4.398%. Truflation jumped to 2.05%.
10YR-2YR Yield Curve Daily

 VIX Weekly H-L-C
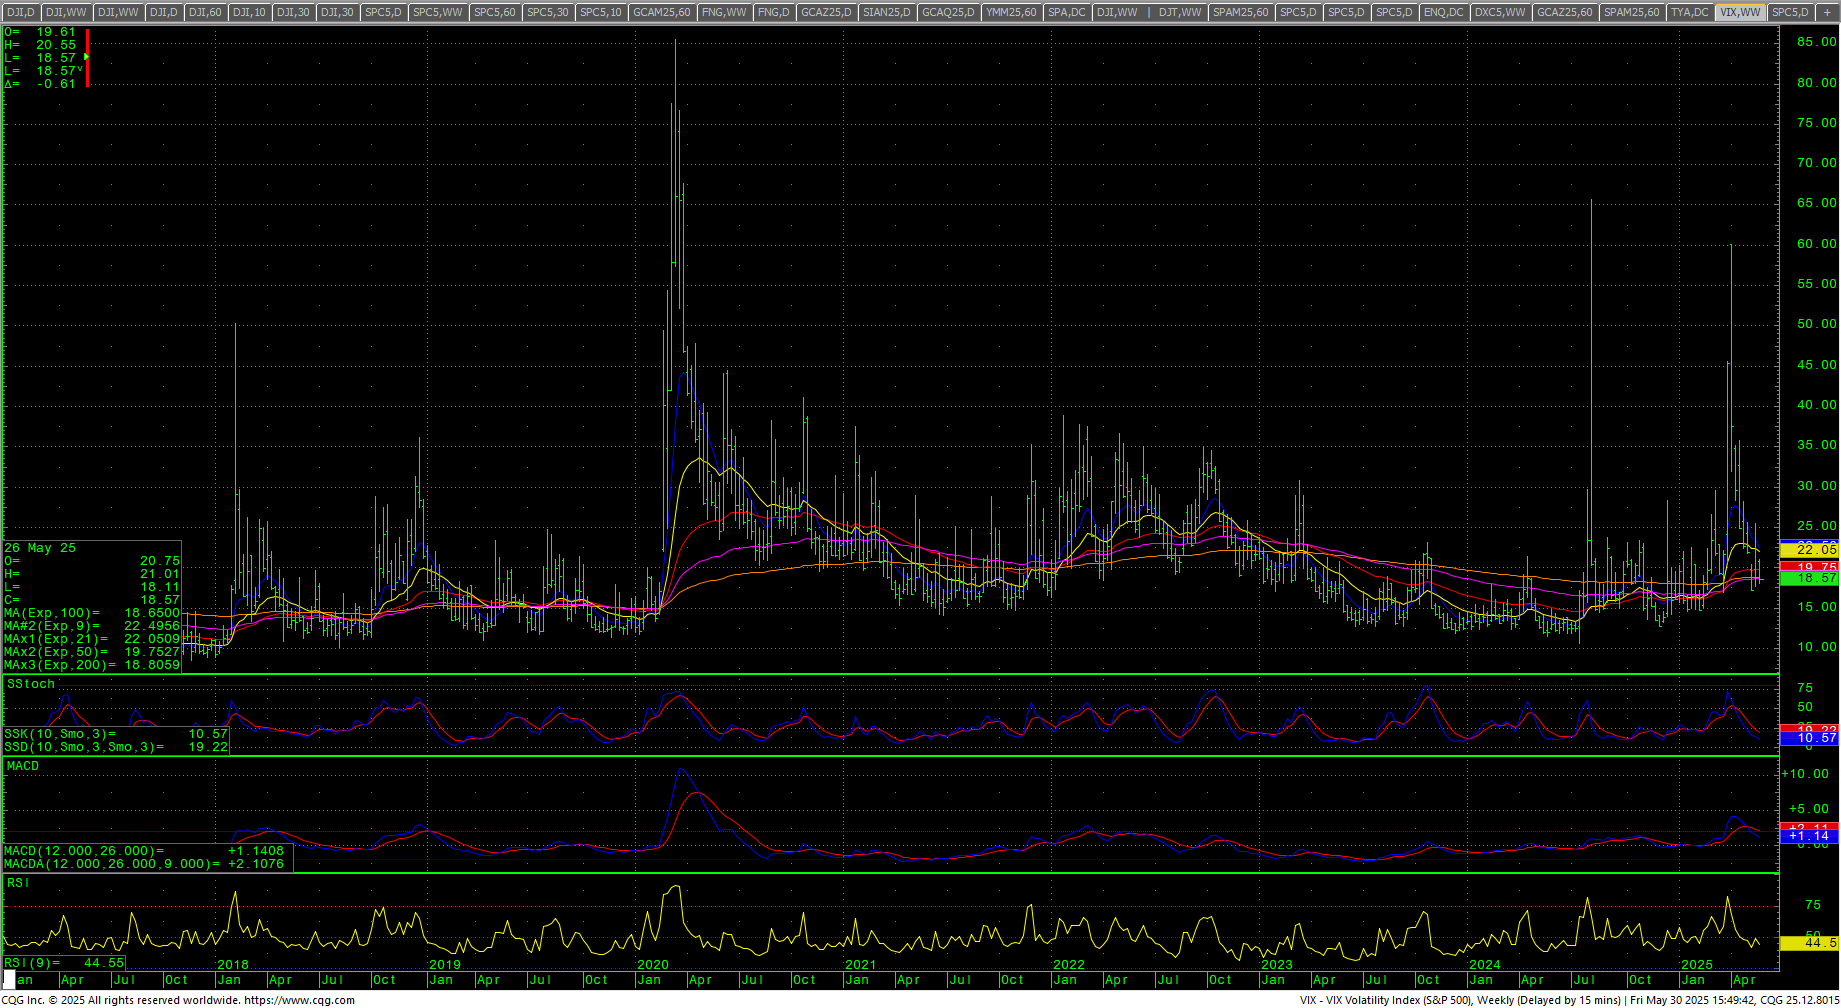
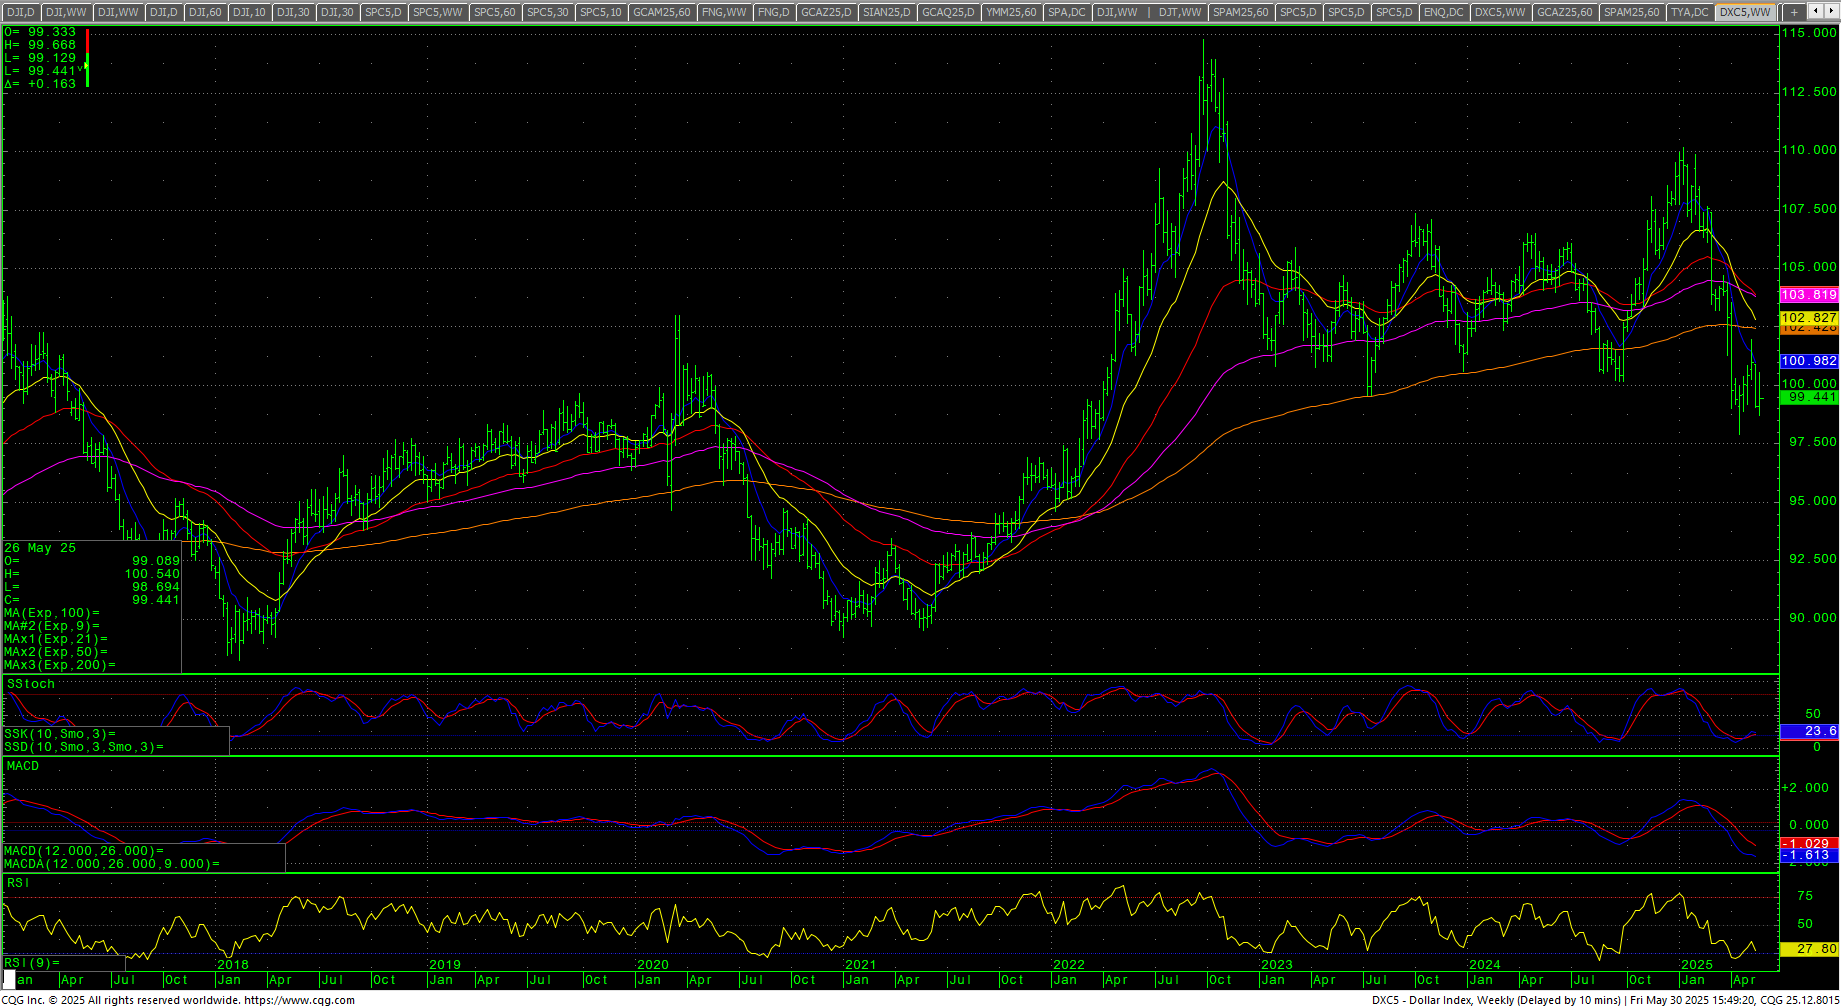
The VIX closed lower, on the bottom of an inside week’s range and back under the 20 level. The US Dollar closed the week higher but in the lower half of a reversal range and remains just under par/100.
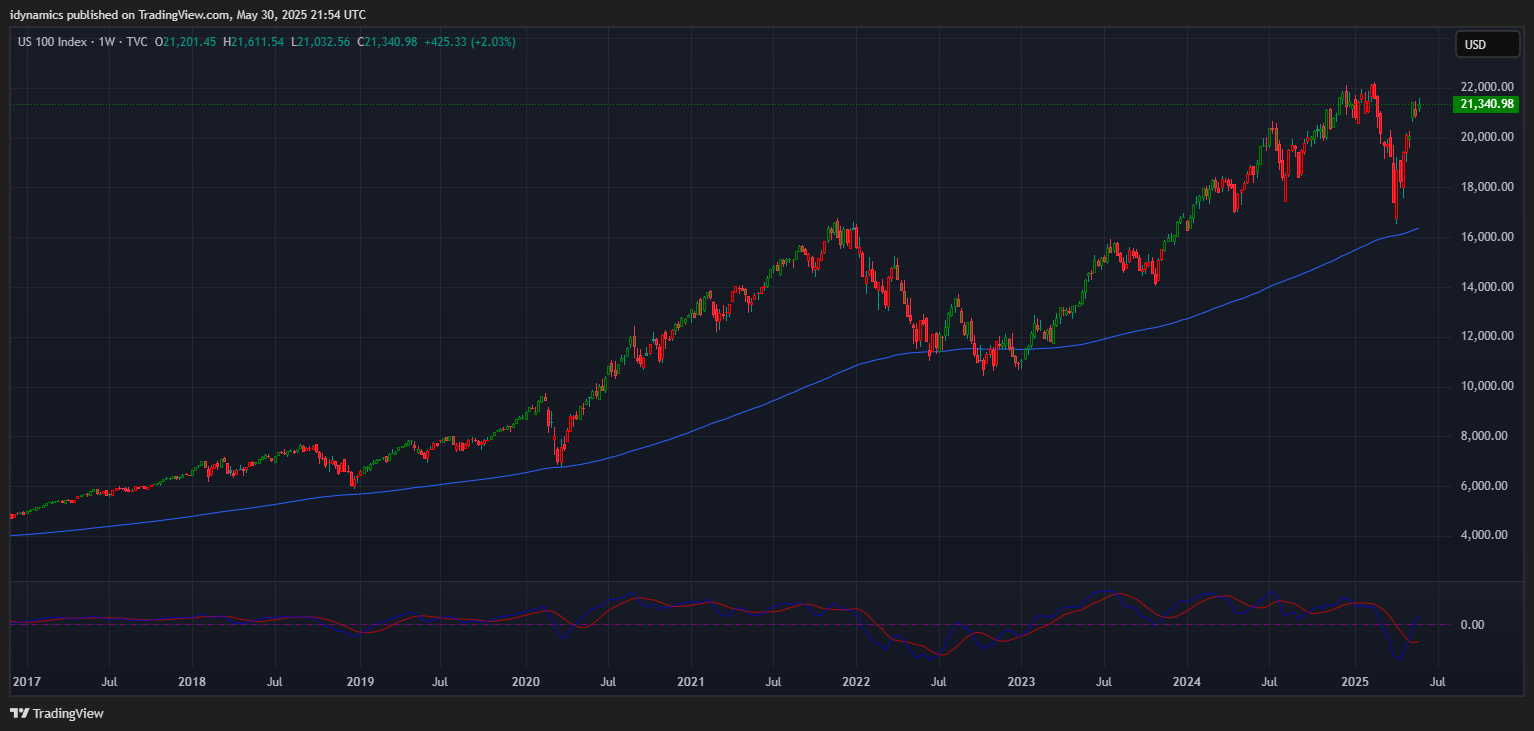
 Nasdaq 100 Weekly Candles
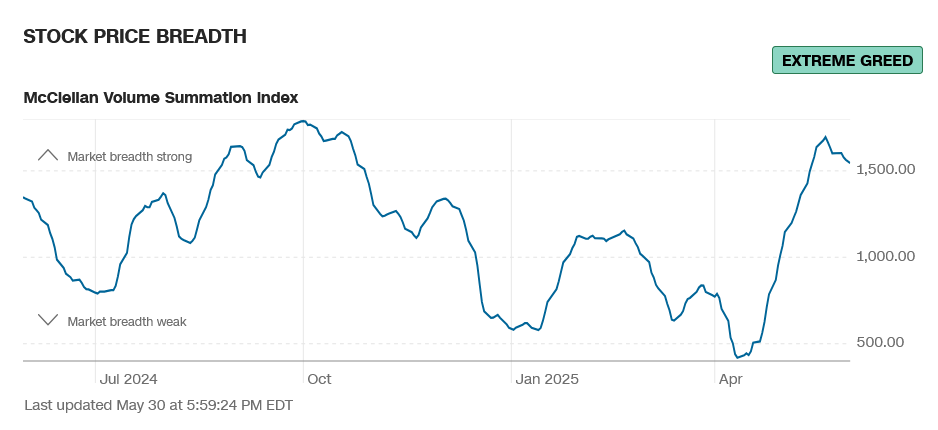
Daily Breadth 
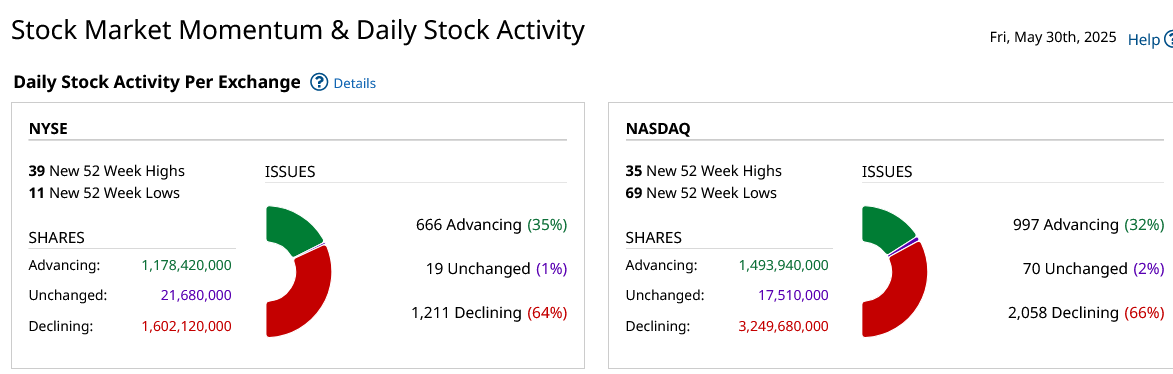
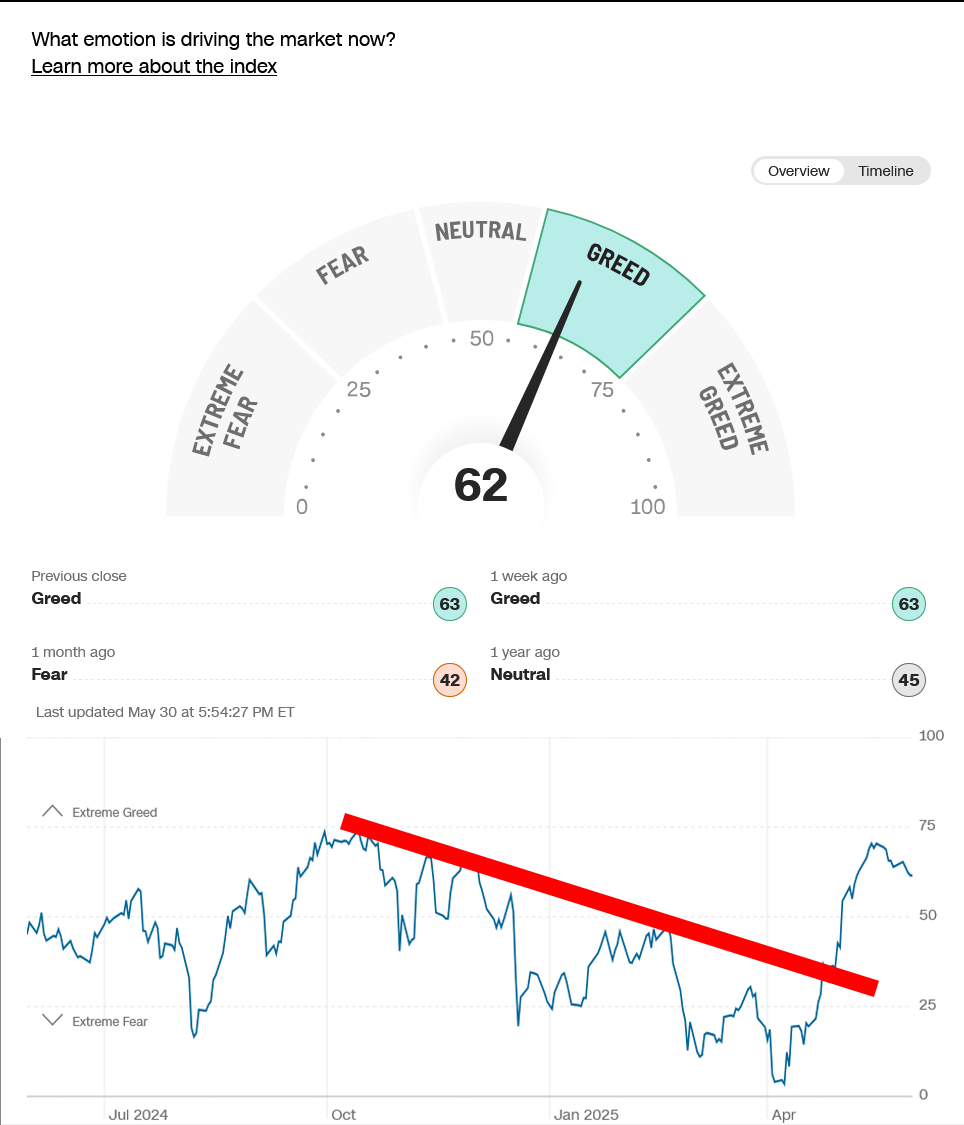
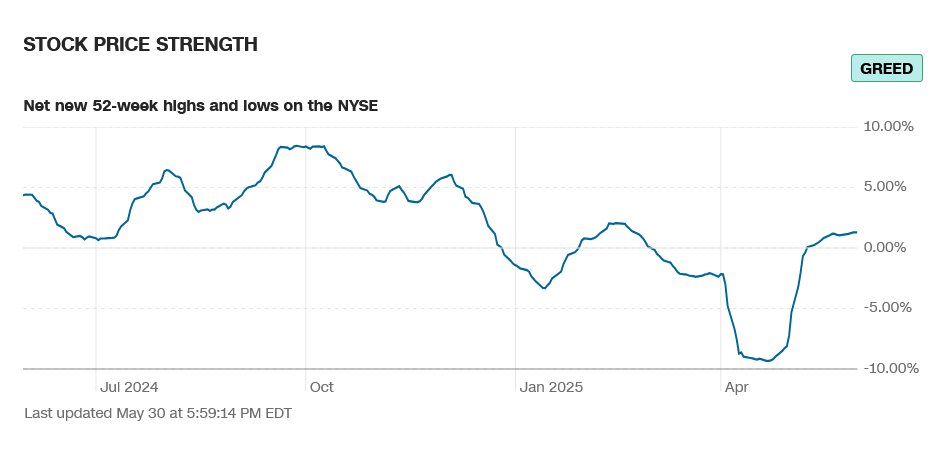
Breadth weakened late in the week. Sentiment remains in extreme greed.
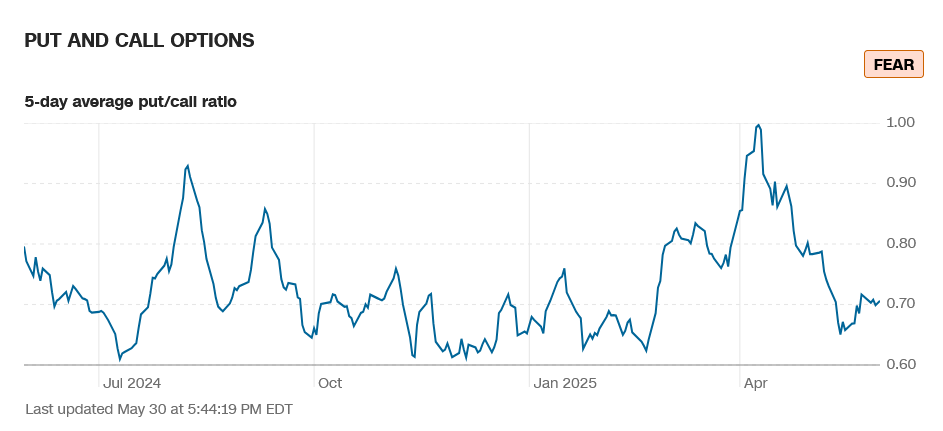
CNN Fear & Greed Index
 AAII Investor Sentiment Survey
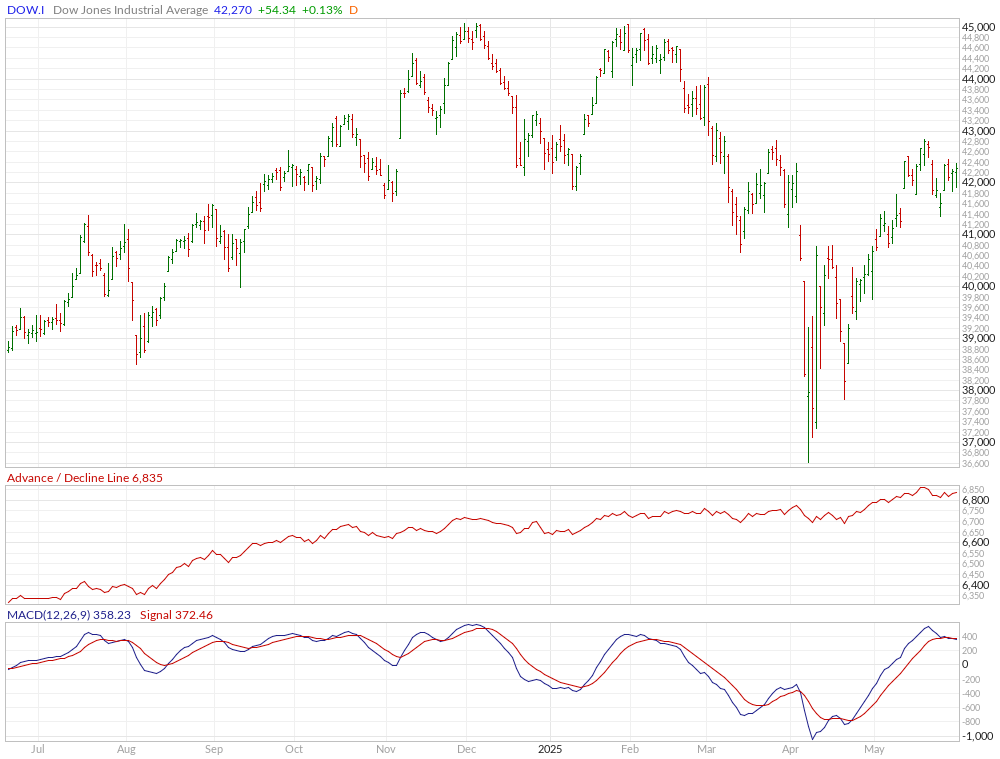
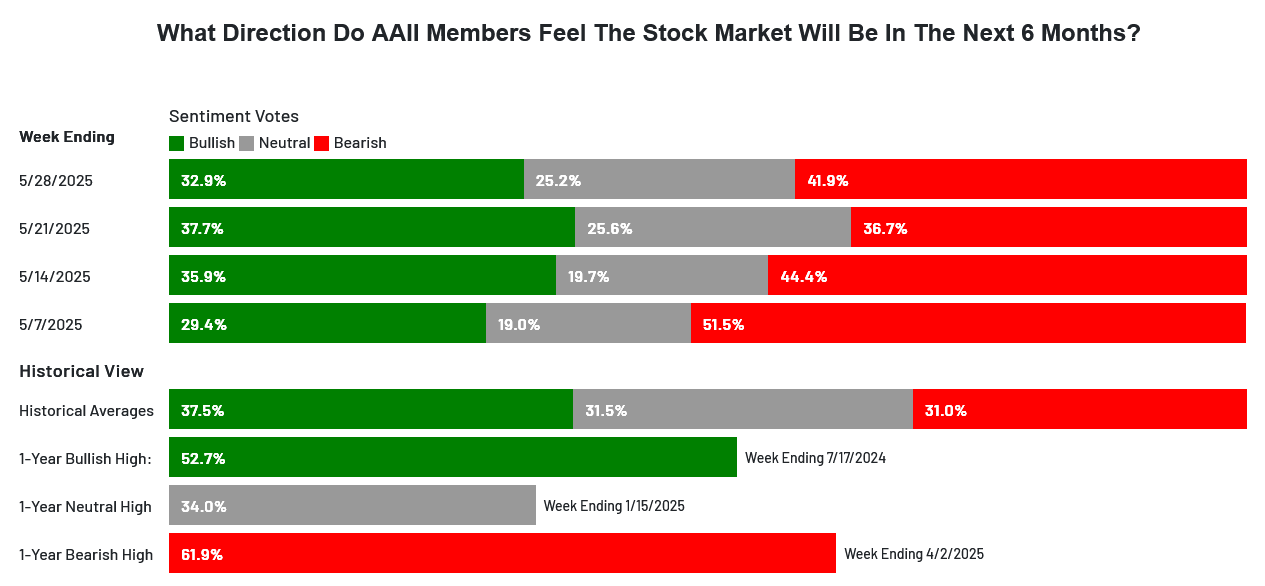 Sentiment remains in greed and extreme greed on several fronts. The CNN Fear and Greed Index moved to 62 and still reads greed. Breadth moved lower on the week from new highs for 2025 and sentiment reads extreme greed. Latest AAII Sentiment Survey: Pessimism Makes a Comeback. The Dow A/D moved up to 6835. The VIX moved lower and closed under 20 and was down -16.69%. The Put/Call sits at 0.71 and reads fear. The 52-week, A/D moved up to +1.29% and reads greed. The Dow closed the week up +1.60%, closing in the upper end of an inside week’s range. The S&P ended up +1.88% in the upper end of an inside week’s range. The Nasdaq Composite was up +2.01% and the Nasdaq 100 was up +2.03%. The FANG was the strongest again, closing up +2.70%. The Russell was up +1.29% in the middle of an inside week’s range. The 10-year notes closed back near a four-week high on the top of the range. The yield on the 10YR decreased to 4.398%.
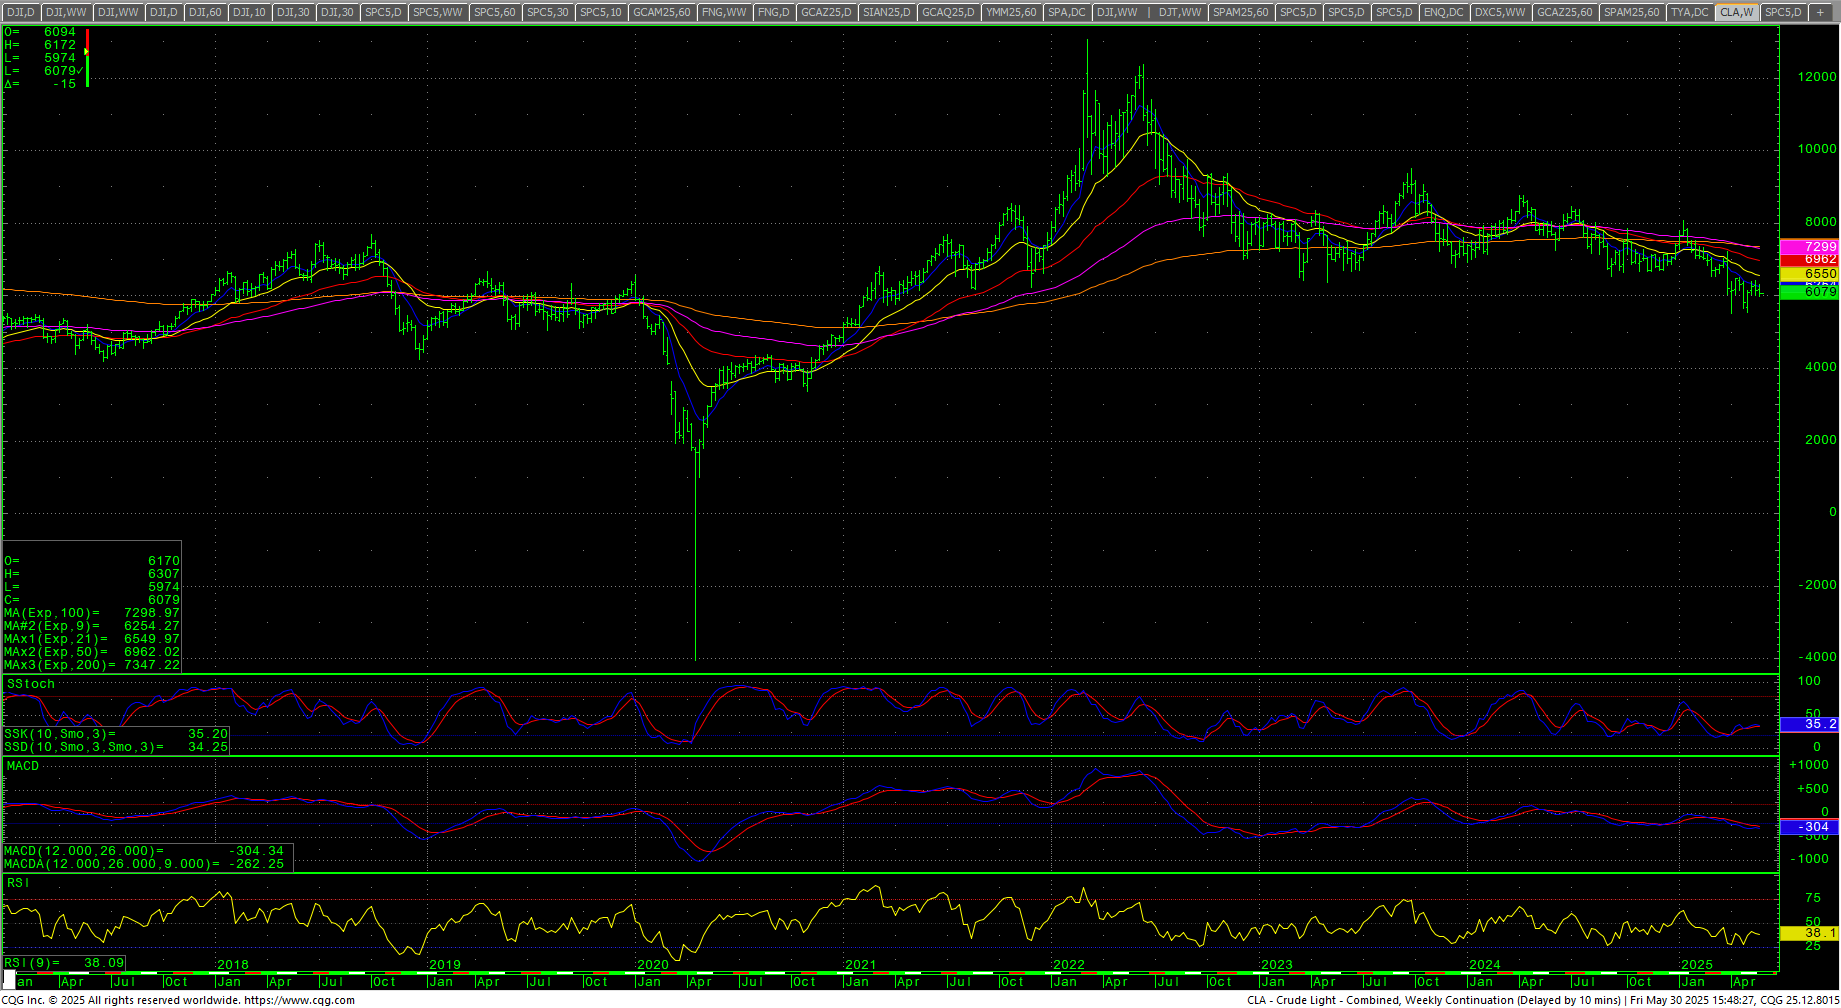
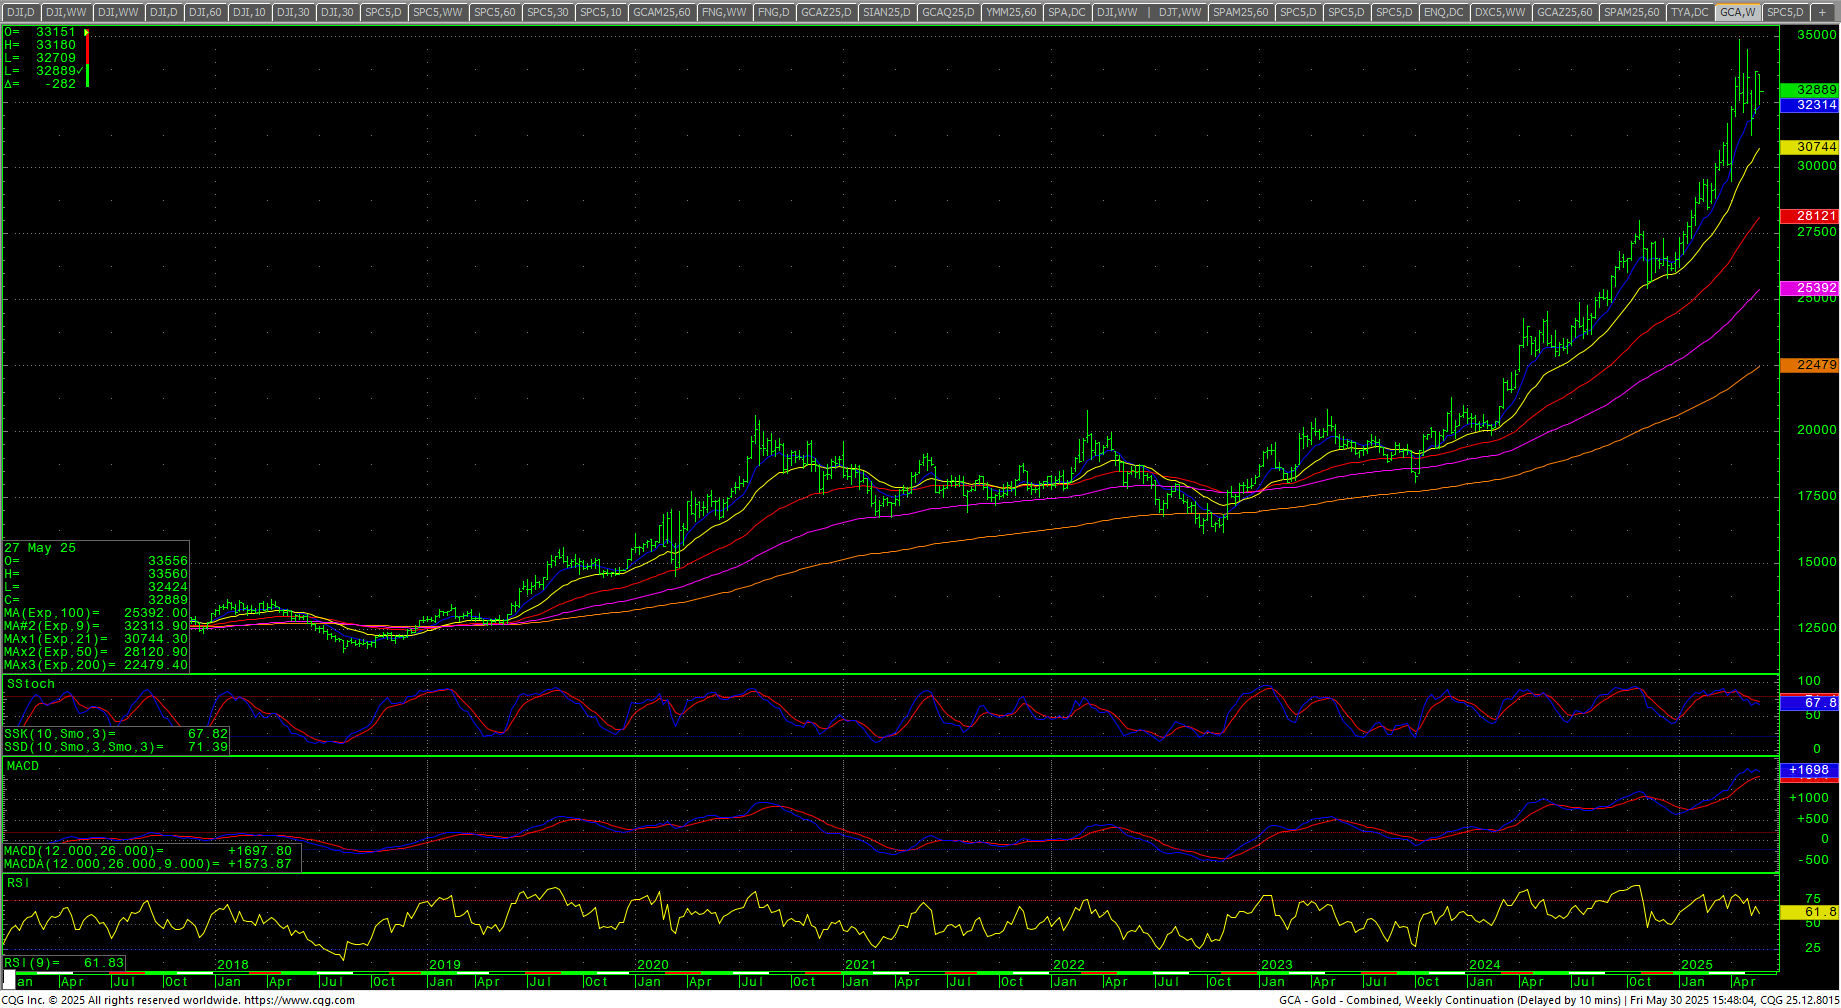
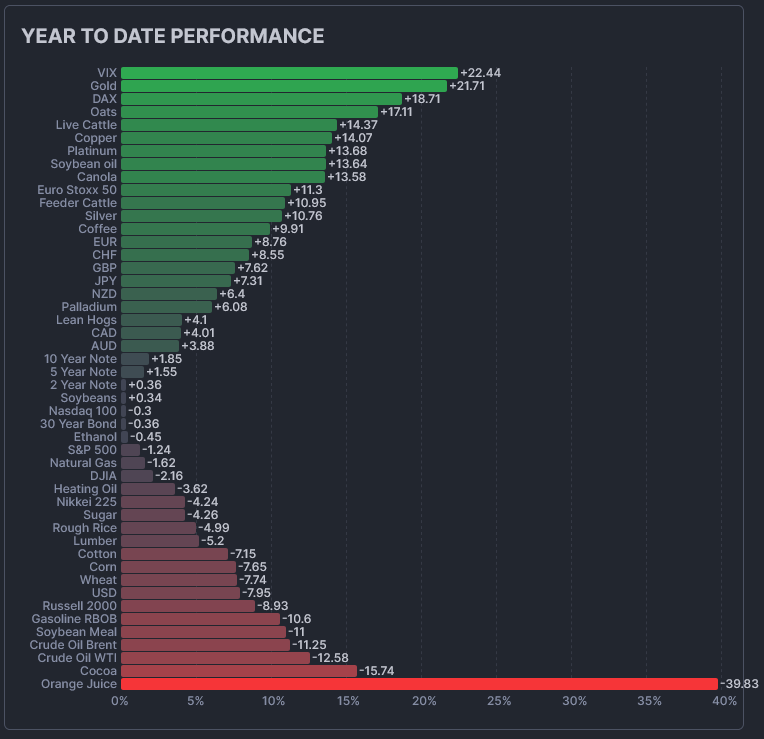 The CRB Index closed down -1.78%. Crude oil closed lower on the low end of the weekly range as prices hang just above the critical $60 level. Gold sold off all week on an inside week and settled in the lower half of the range following the previous week’s record high close for the weekly continuation chart. The CoT for the S&P 500 saw very little movement among commercials, dealers or speculators. The CFTC S&P 500 Non-Commercial Net Positions moved down to end at -53.0K. Sellers have a 6 day window.
Timing Points
Thursday marks minor cycle timing and the 9th is in focus now for the bonds and the dollar. Tuesday is Factory Orders for April (est: -3.2%). Thursday is ADP Employment data (est: +112K). Friday is Nonfarm Payrolls with some wide guesstimates right now of maybe +100K/+150K. 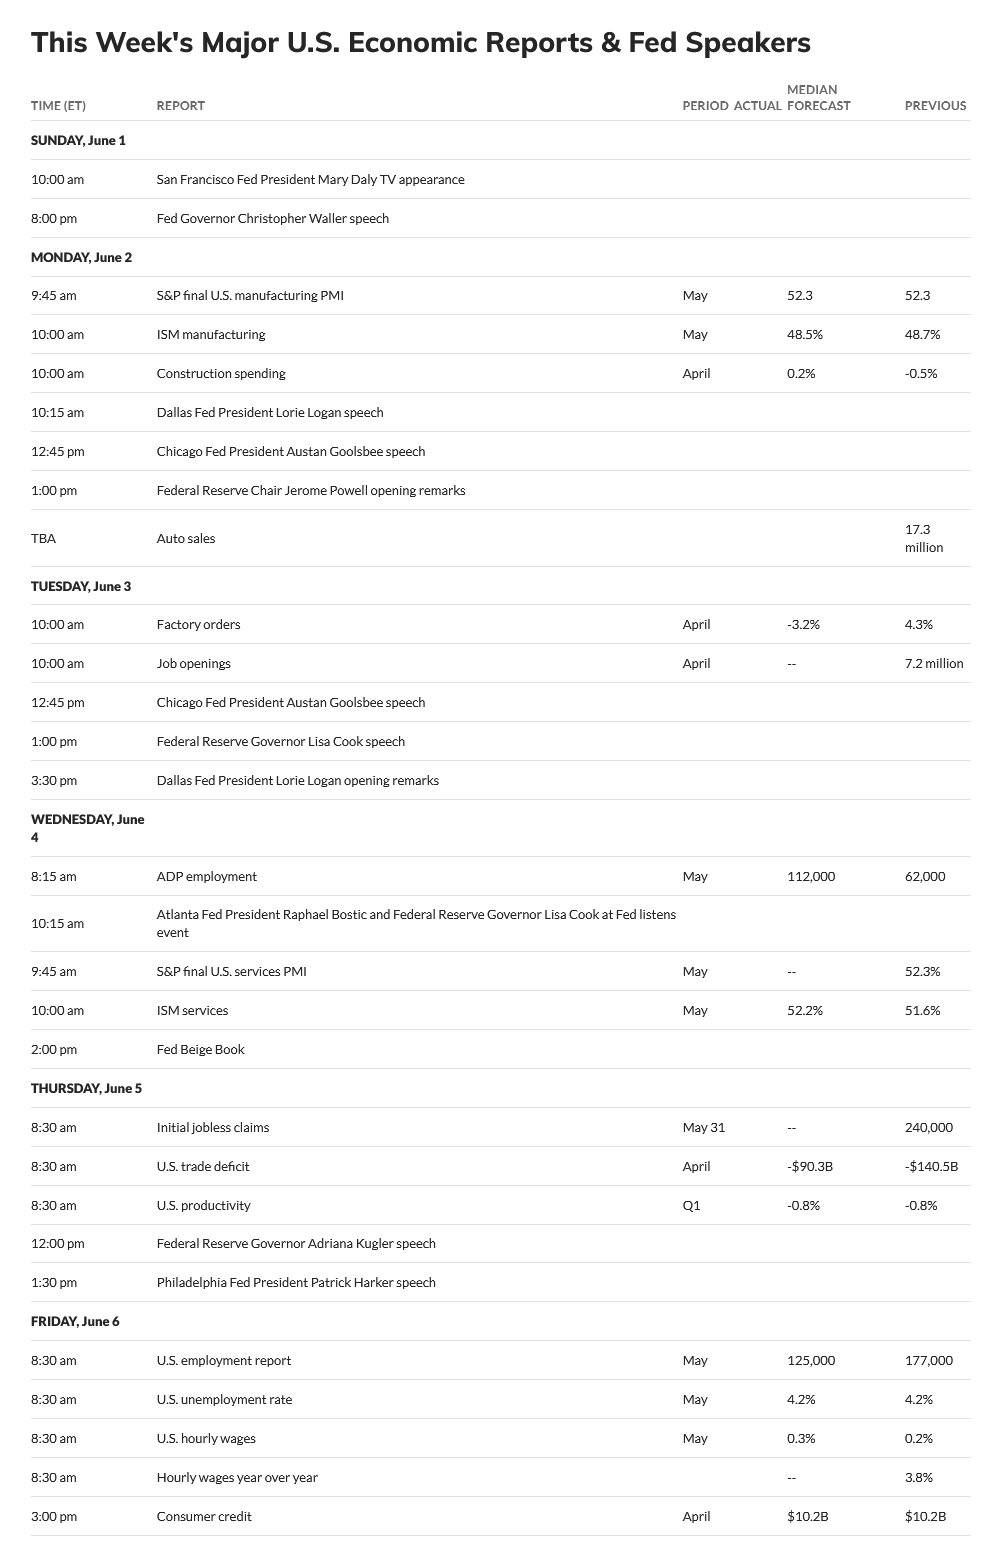
Long Term Timing Thoughts
“It is looking more and more, from a cycles standpoint, that this will run well into Q4 2025/Q2 2026. Thus, a much more protracted and drawn-out bear and not the “flash crash” that everyone has gotten used to over the past two decades. That doesn’t mean we won’t have significant rallies, but chasing rallies is likely to be a losing strategy until this thing is spent…which very likely will not be until Q1/Q2 2026 at this point. The BIG focus will be late summer and fall of 2025…particularly late September this year.”
- 06/05 **
- 06/09 *** X bonds/interest rates/dollar
- 06/16-18 *** X critical, volatility/volume/wide ranges/extremes
Dow Jones Industrial Average
Dow Jones Industrial Average Weekly Candles
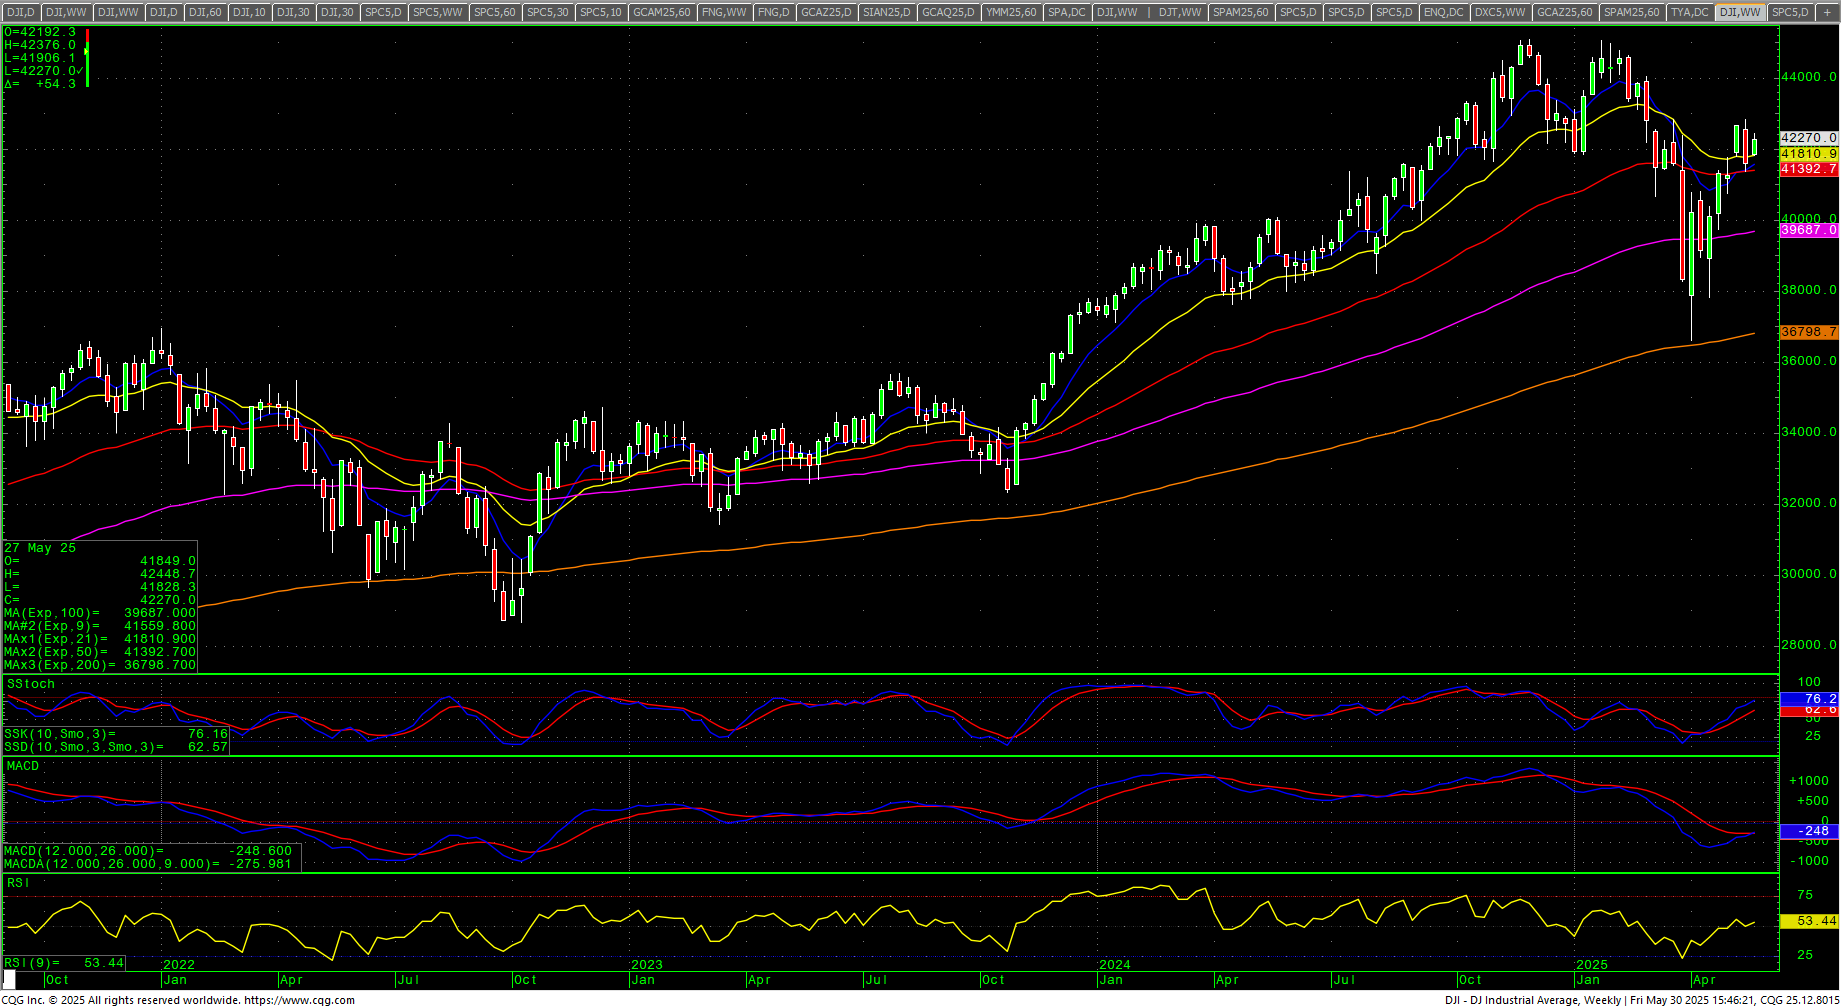 The Dow closed down +1.60% toward the upper end of an inside week’s range. The 50-day and 200-day MAs are close to issuing a Golden Cross. The weekly stochastics are still in an uptrend. Prices are still reacting to a critical area overhead against the 26 March 2025 high at 42822 (intraday high is 42842) and the ‘final’ “Death Zone” from record highs. That zone remains at 42943 through 43061. The 200-day MA starts the week at 41656.1 and is trending slightly higher.
Dow Jones Industrial Average Weekly H-L-C
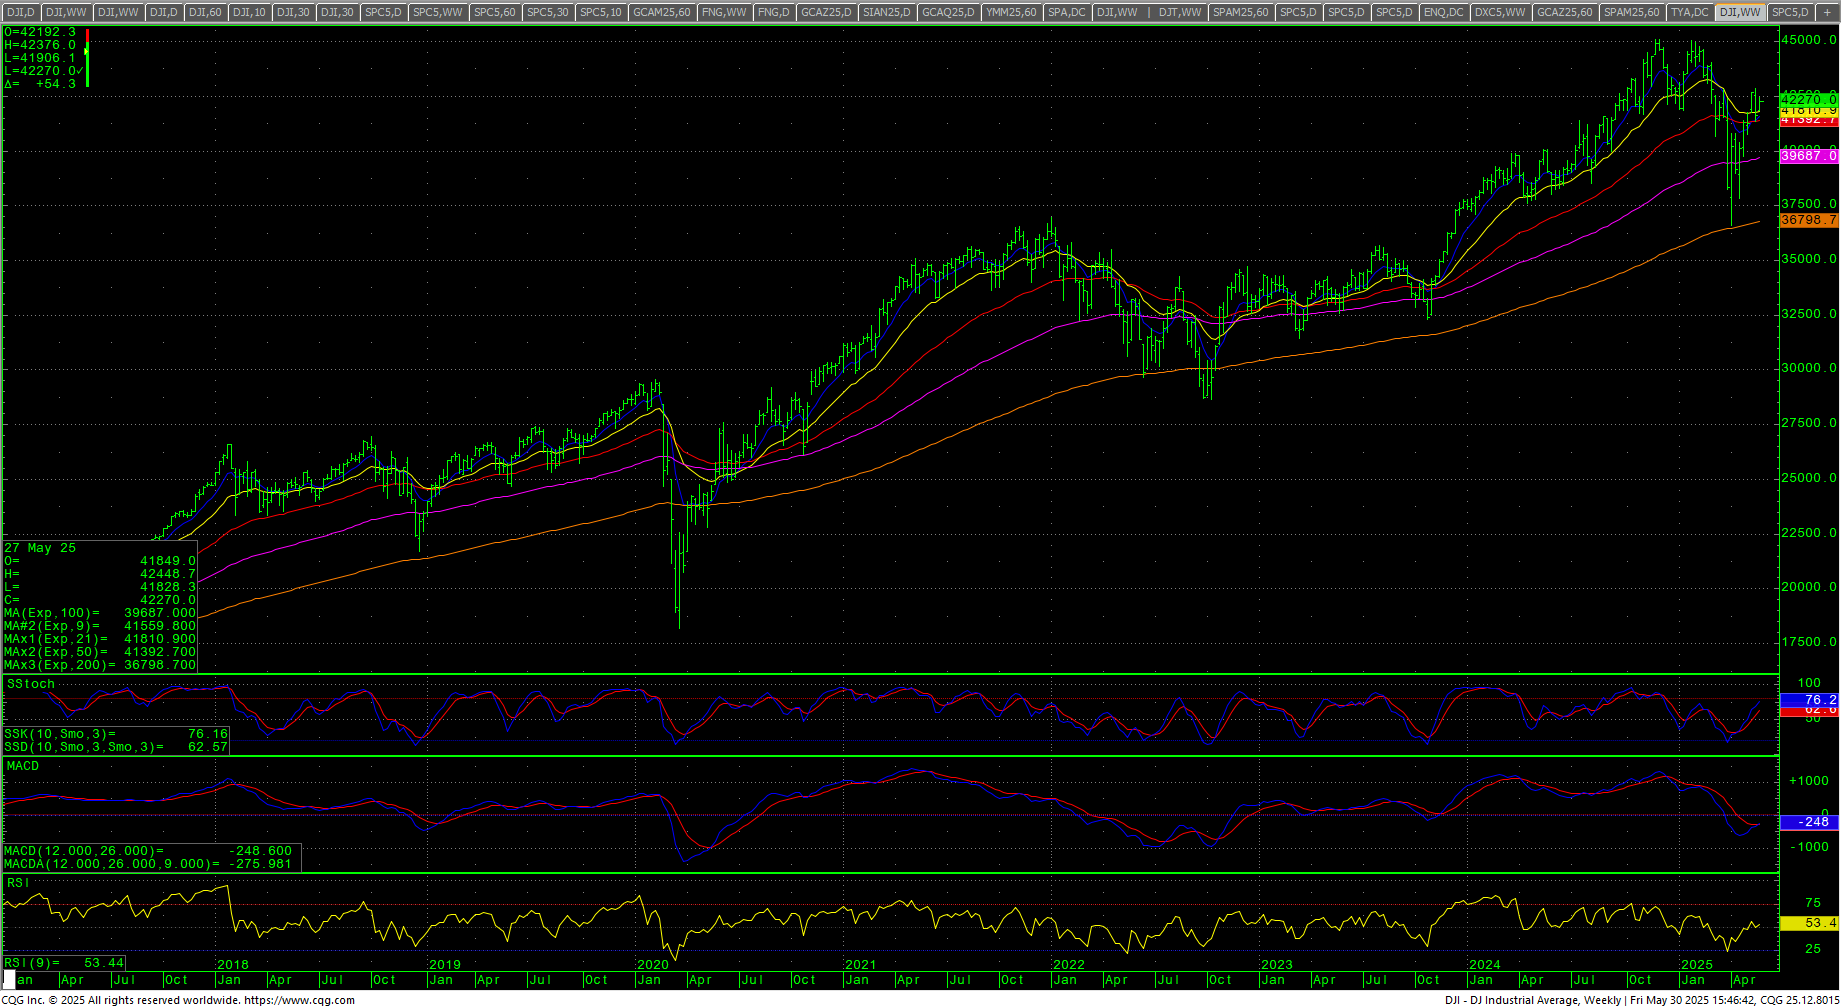 Prices closed right at near-term pivotal resistance at 42273/42275 and remains critical at 42842 and the Death Zone level at 42943 through 43061 area. Daily closes above 43061 should minimally test 44034 and will open potential for a test of the all-time highs at 45050/45054/45074. Closes over 45074 opens counts toward 45244 and 45426 (Fibonacci target). Rallies with closes over 45426 will reopen longer-term monthly targets in the 47400 level with targets of 46568 and 46954.
Dow Jones Industrial Average Hourly H-L-C
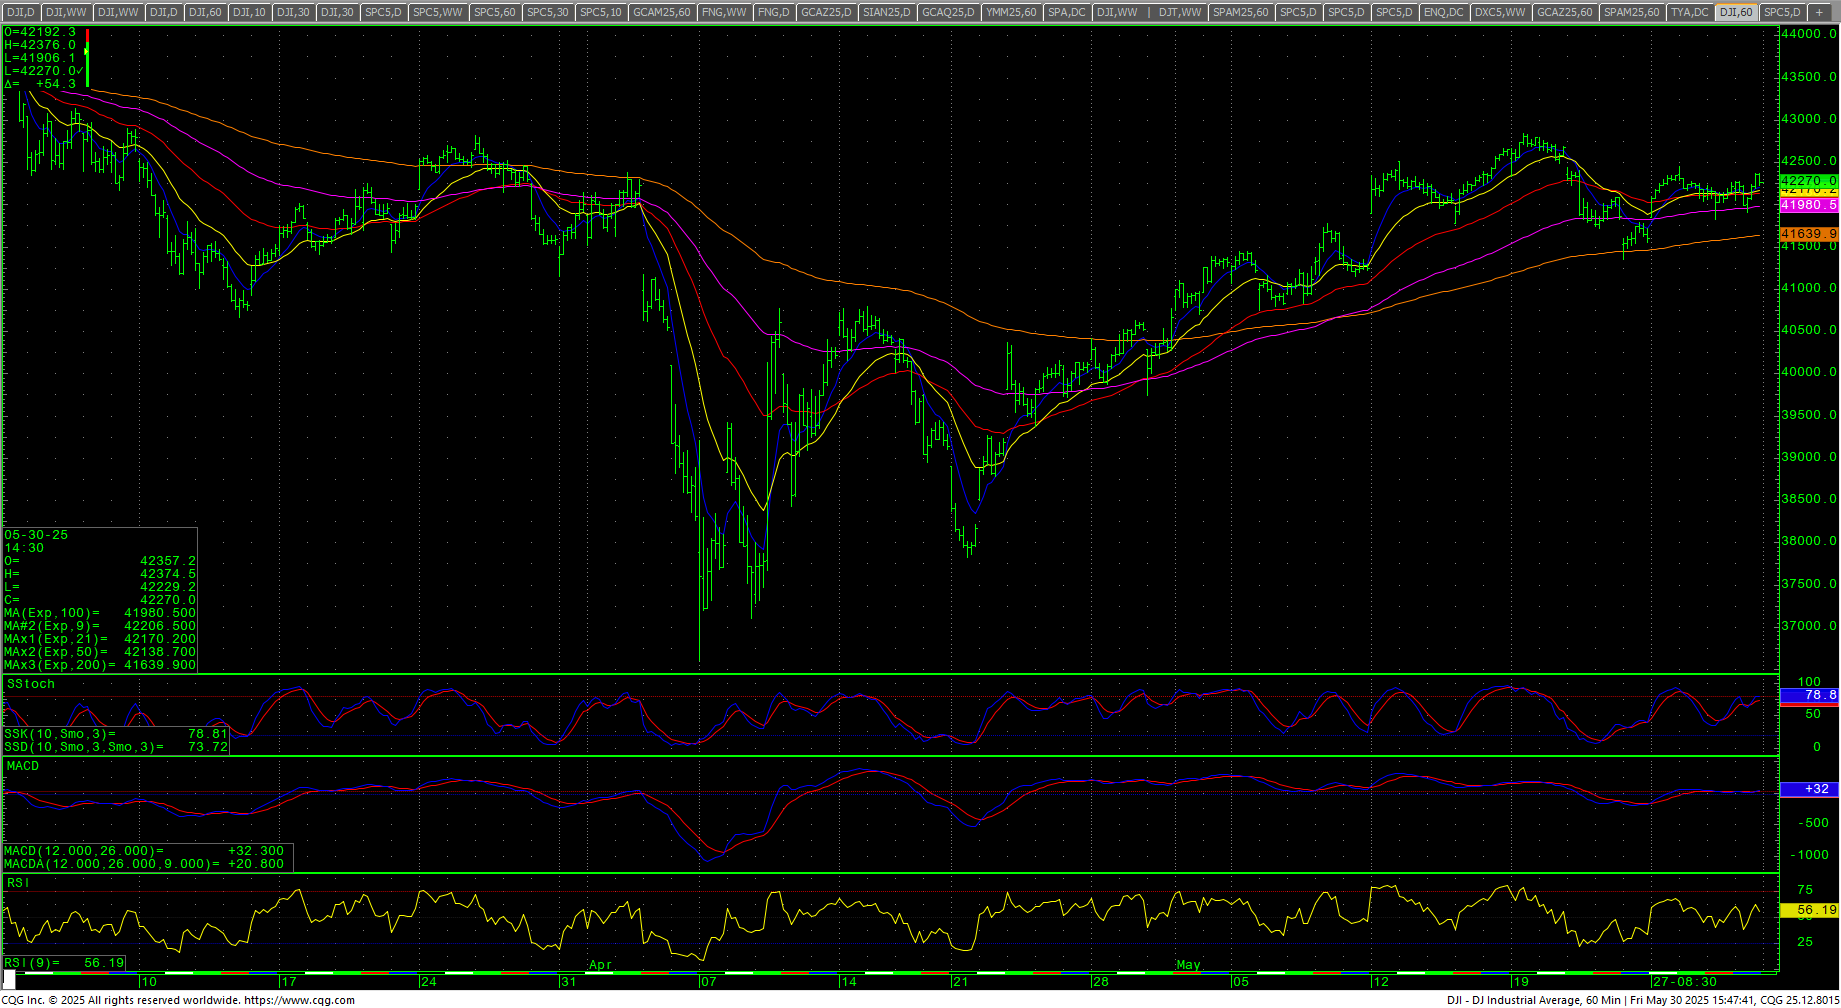 The hourly is slightly overbought on Friday’s close. Support is 41828 and pivotal near-term at 41769/41765. A breakdown under 41765 sets up 41354 and 41235/41220. Closes under 41220 opens potential to 39638/39636 with support at 39933/39330. Closes under 39636 offer full counts to pivotal short-term support of 38923/38920 with support of 39718/39716. A breakdown under 38920 are bearish for a test of 38124 through 38039. Closes below 38039 should minimally test 37900 through 37828 and would open counts to retest the 36611 low with support at 37103.
| Resistance | Support |
|
|
S&P 500 Cash Index: SPX
S&P 500 Index Weekly H-L-C
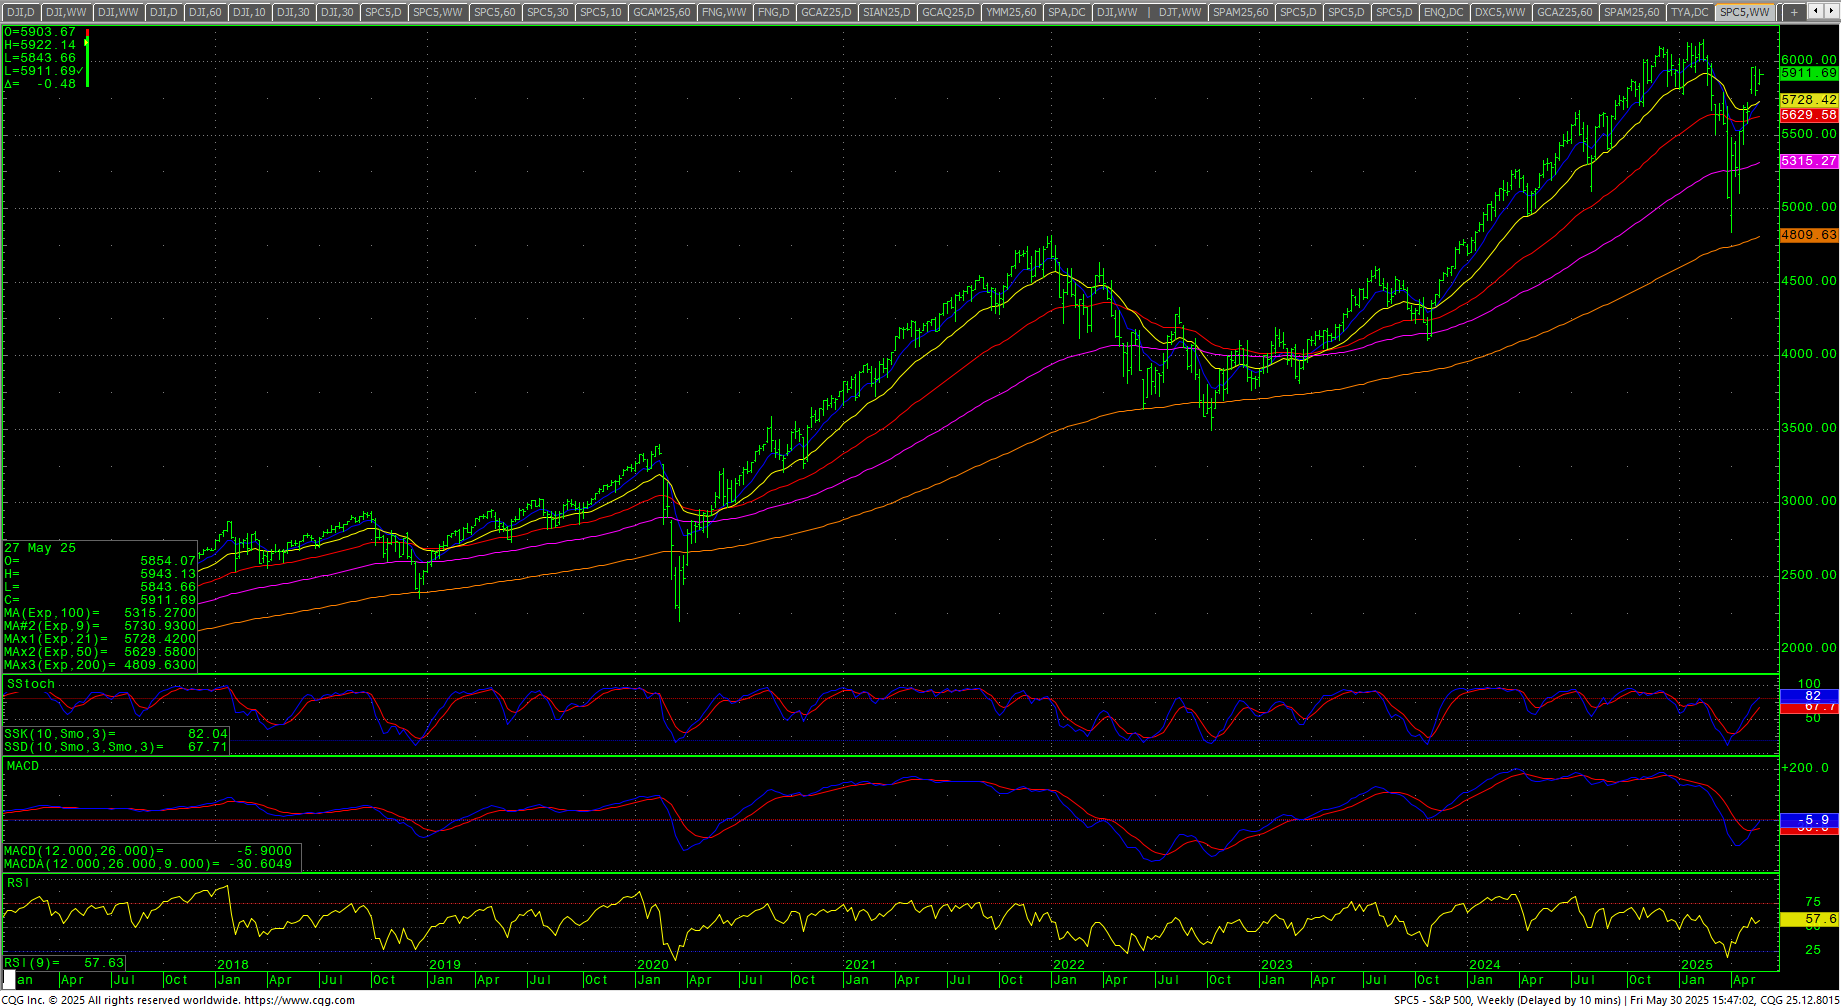 The S&P gapped higher and then chopped around on an inside week’s range (although the futures set a new swing high for he move in overnight trade on Monday). The daily chart is still in a sell signal from extreme overbought conditions. The 50-day MA is back over the 200-day MA for a Golden Cross just one month after issuing a Death Cross. The weekly is still in an uptrend. The hourly is neural on Friday’s and threatening to hook lower again. The 200-day MA is 5672.88 and is creeping higher from its down trend.
SPY Daily Candles
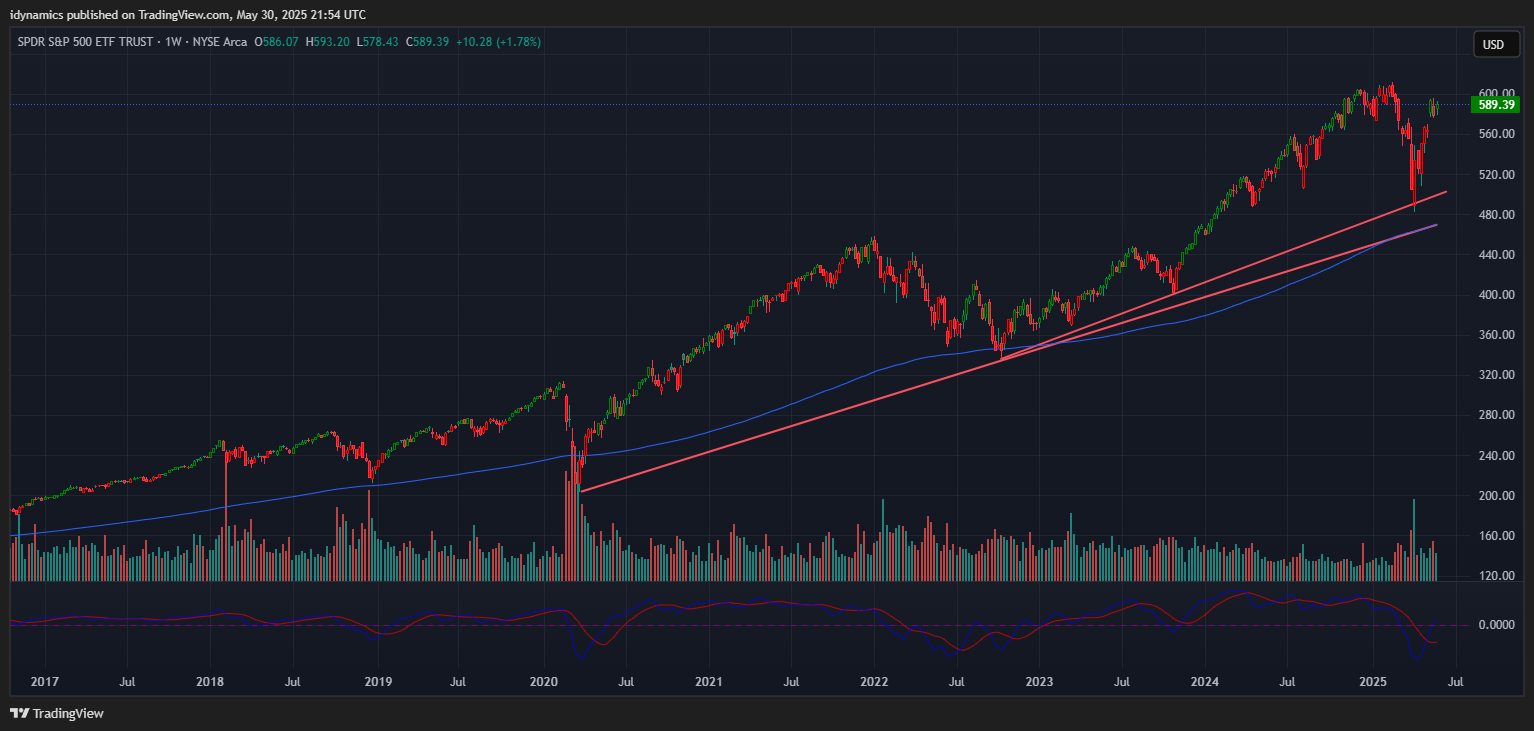 Resistance is 5918/5921, 5968 and 5986. A drive over 5986 has potential to 6043 and opens counts to 6112/6114 and full counts into critical resistance at the intraday high of 6147.43. Rallies through 6148 should test 6160 with a shot at a target of 6180.35/6181. Closes over 6181 open counts to 6224 and 6296. Above 6296 can carry to 6368 with counts into the 6440 area. Closes over 6440 will open counts to 6584. A breakout over 6584 sets up 6638 and 6692.
S&P 500 Index Hourly H-L-C
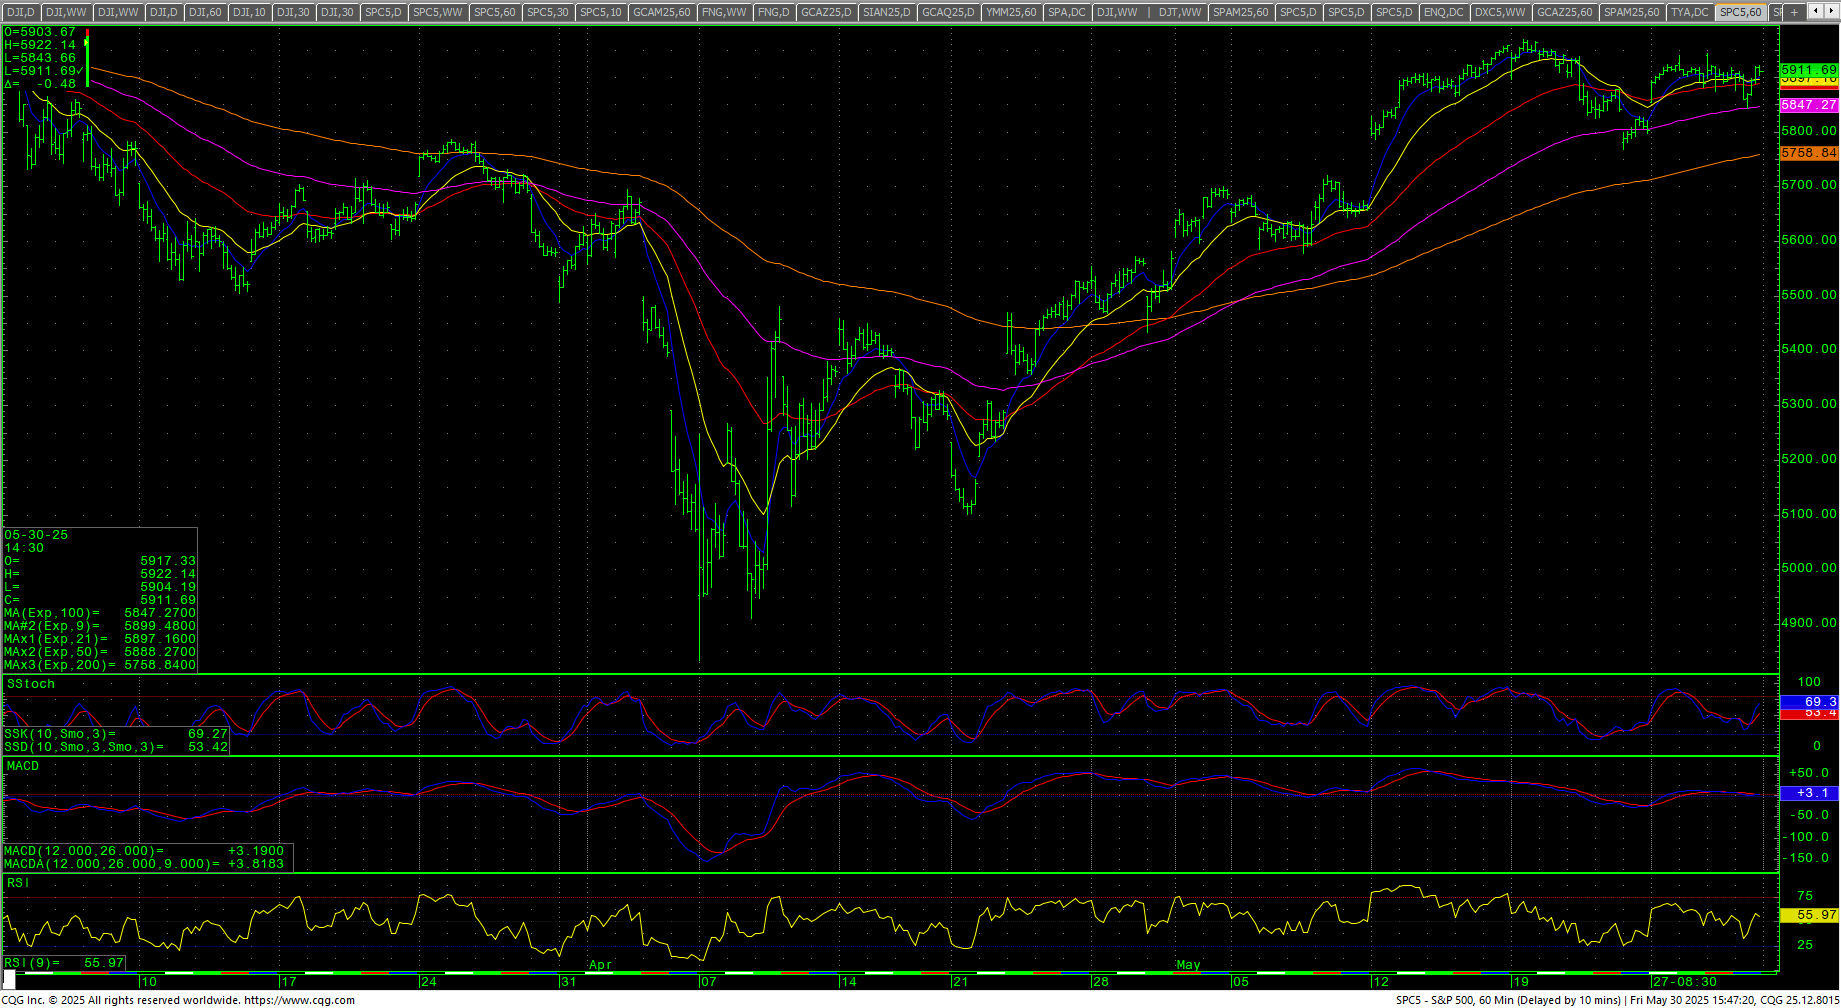 Support is 5802, 5751 and 5699/5696. A breakdown under 5696 sets up a move 5530/5529. Closes 5529 will open counts to 5397/5396 with potential to pivotal near-term support at 5269/5265. A breakdown under 5265 sets up 5115/5100 with potential to open intermediate-term counts for a retest of the 4835 swing lows with support still at 4884/4880. Closes under 4880 are bearish and open counts to 4614 through 4586.
| Resistance | Support |
|
|
Charts courtesy of CQG, Inc., CNN, Koyfin, Trading View and AAII