
TECHNICAL ANALYSIS (by Intraday Dynamics)
Major Indices Week of June 6, 2025
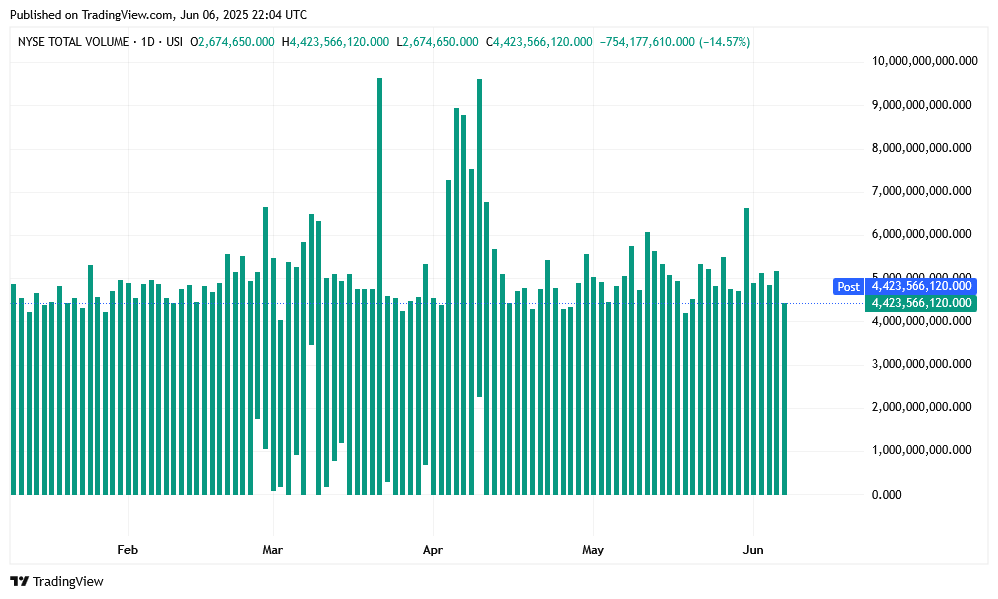
 NYSE Volume
NYSE FANG Daily Candles
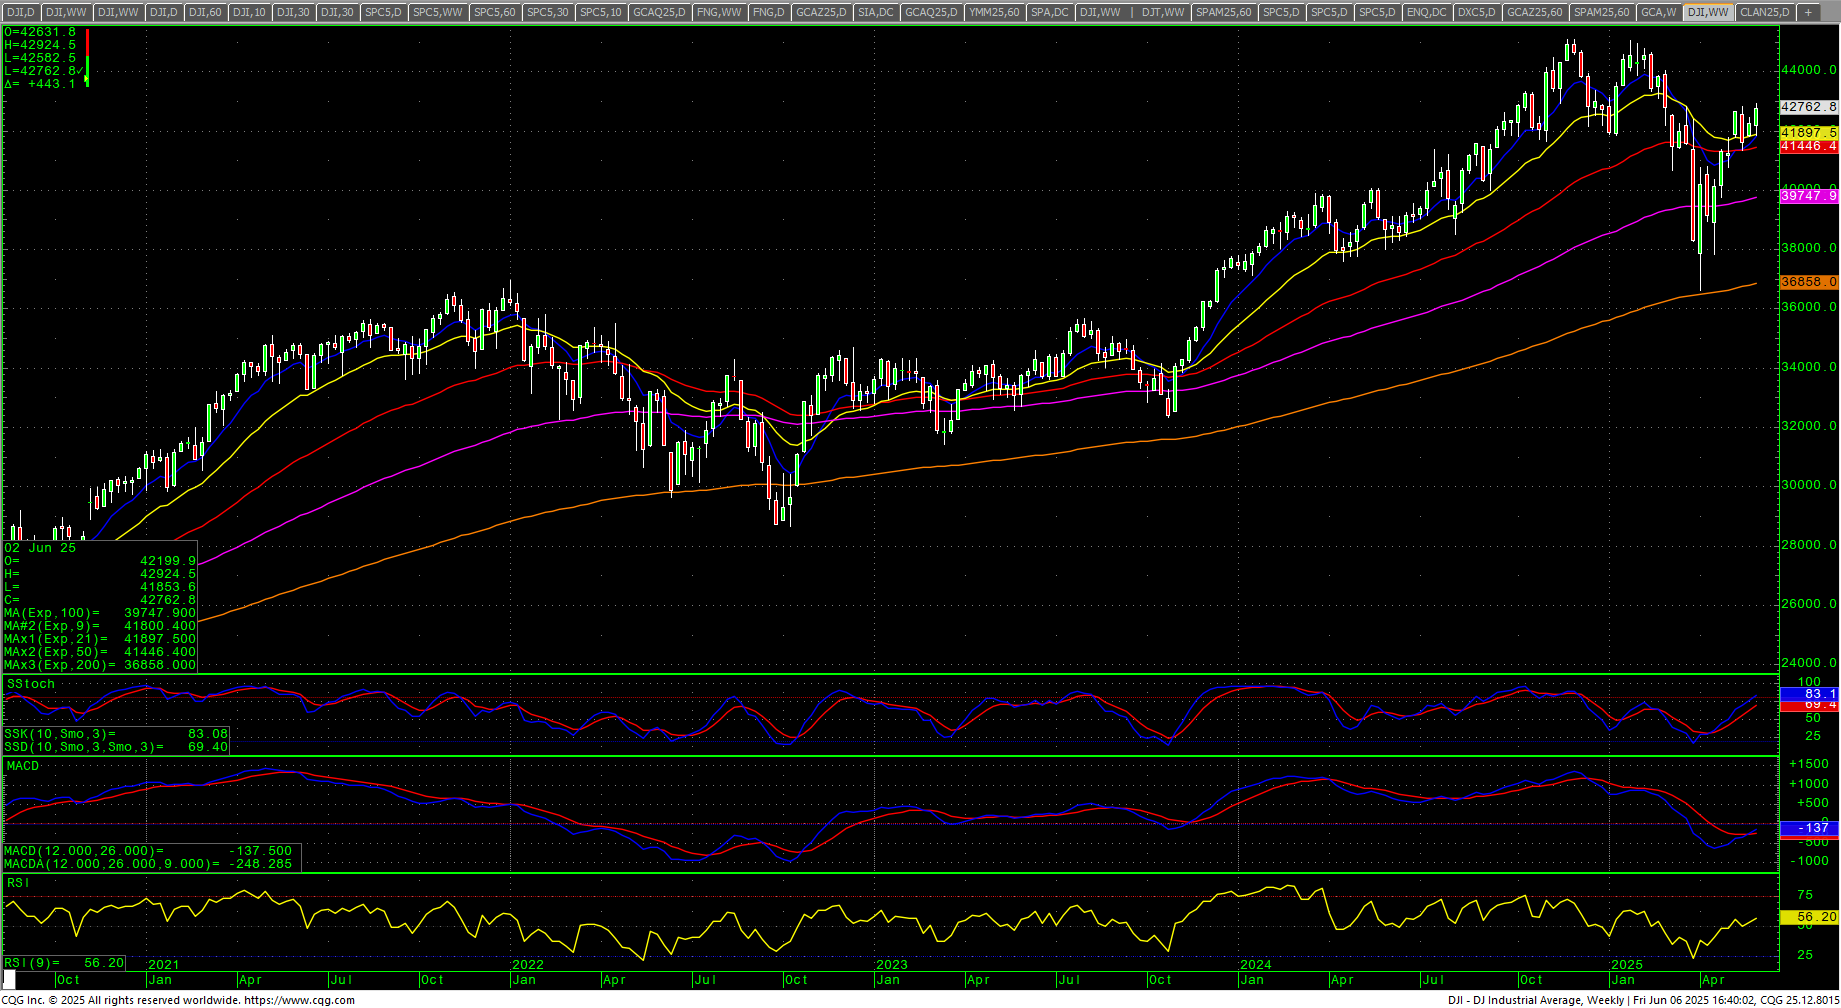
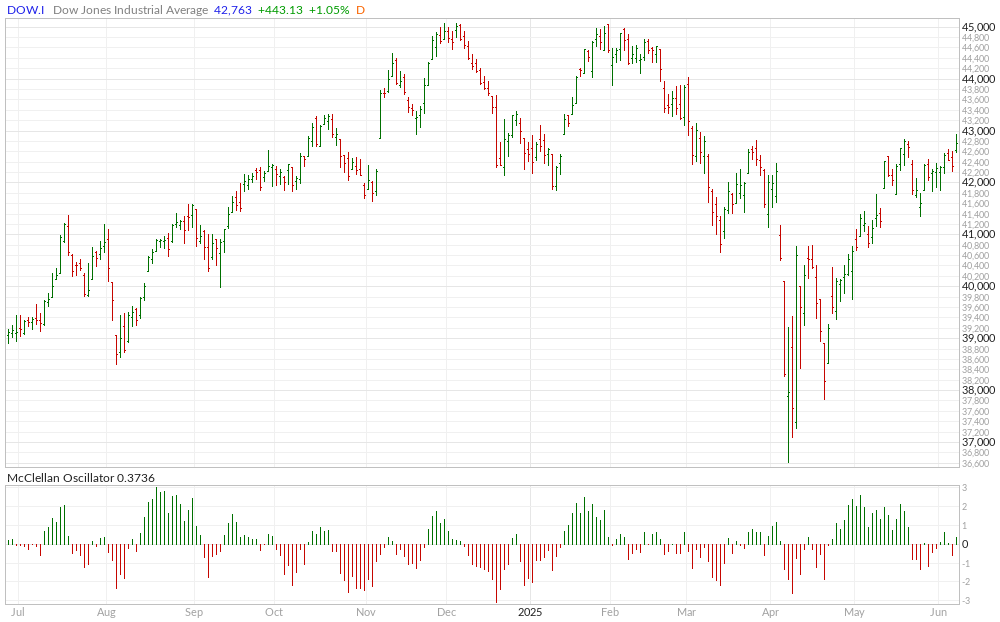
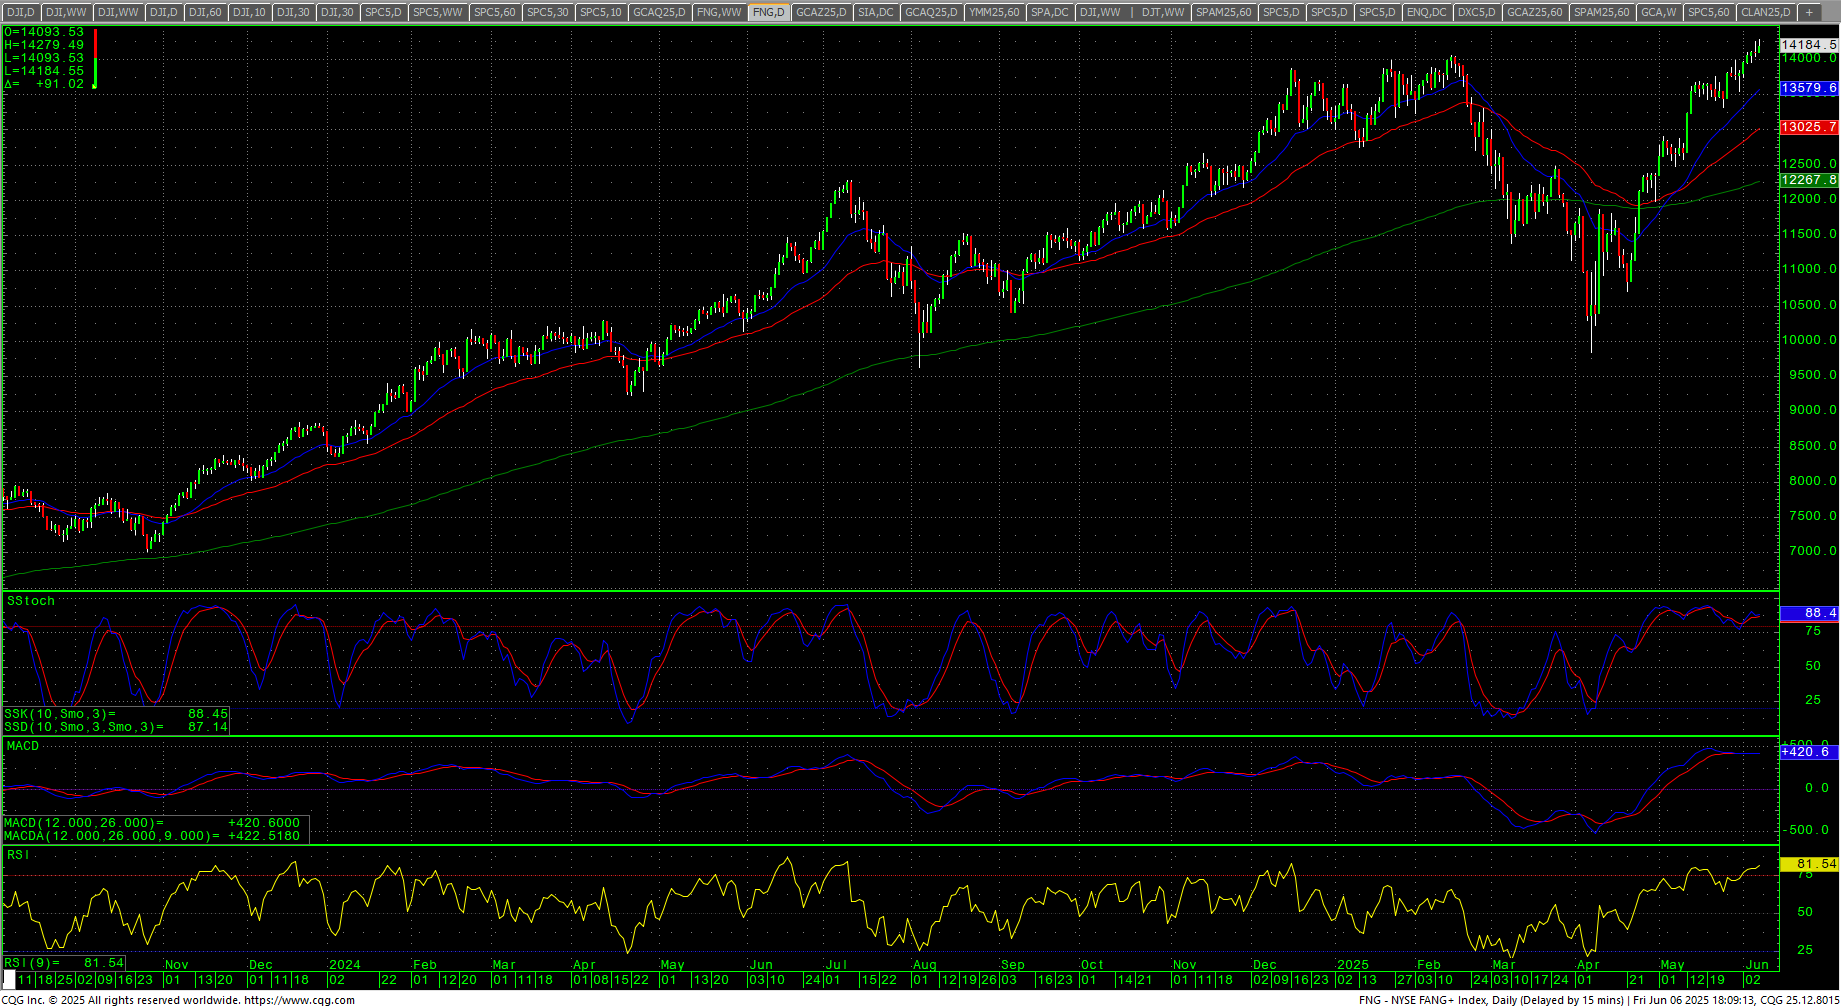 Stocks traded higher throughout most of the week with prices moving to new recovery highs and, in the case of the NYSE FANG, a new all-time high. The secondary markets were strong, and the S&P touched and closed above the 6000 level. The Dow traded right into the ‘final’ “Death Zone” from record highs. That zone remains at 42943 through 43061. Until prices clear that area with closes…this is a place where intermediate-term traders should be thinking about selling this market.
Dow Jones Industrial Average Weekly Candles
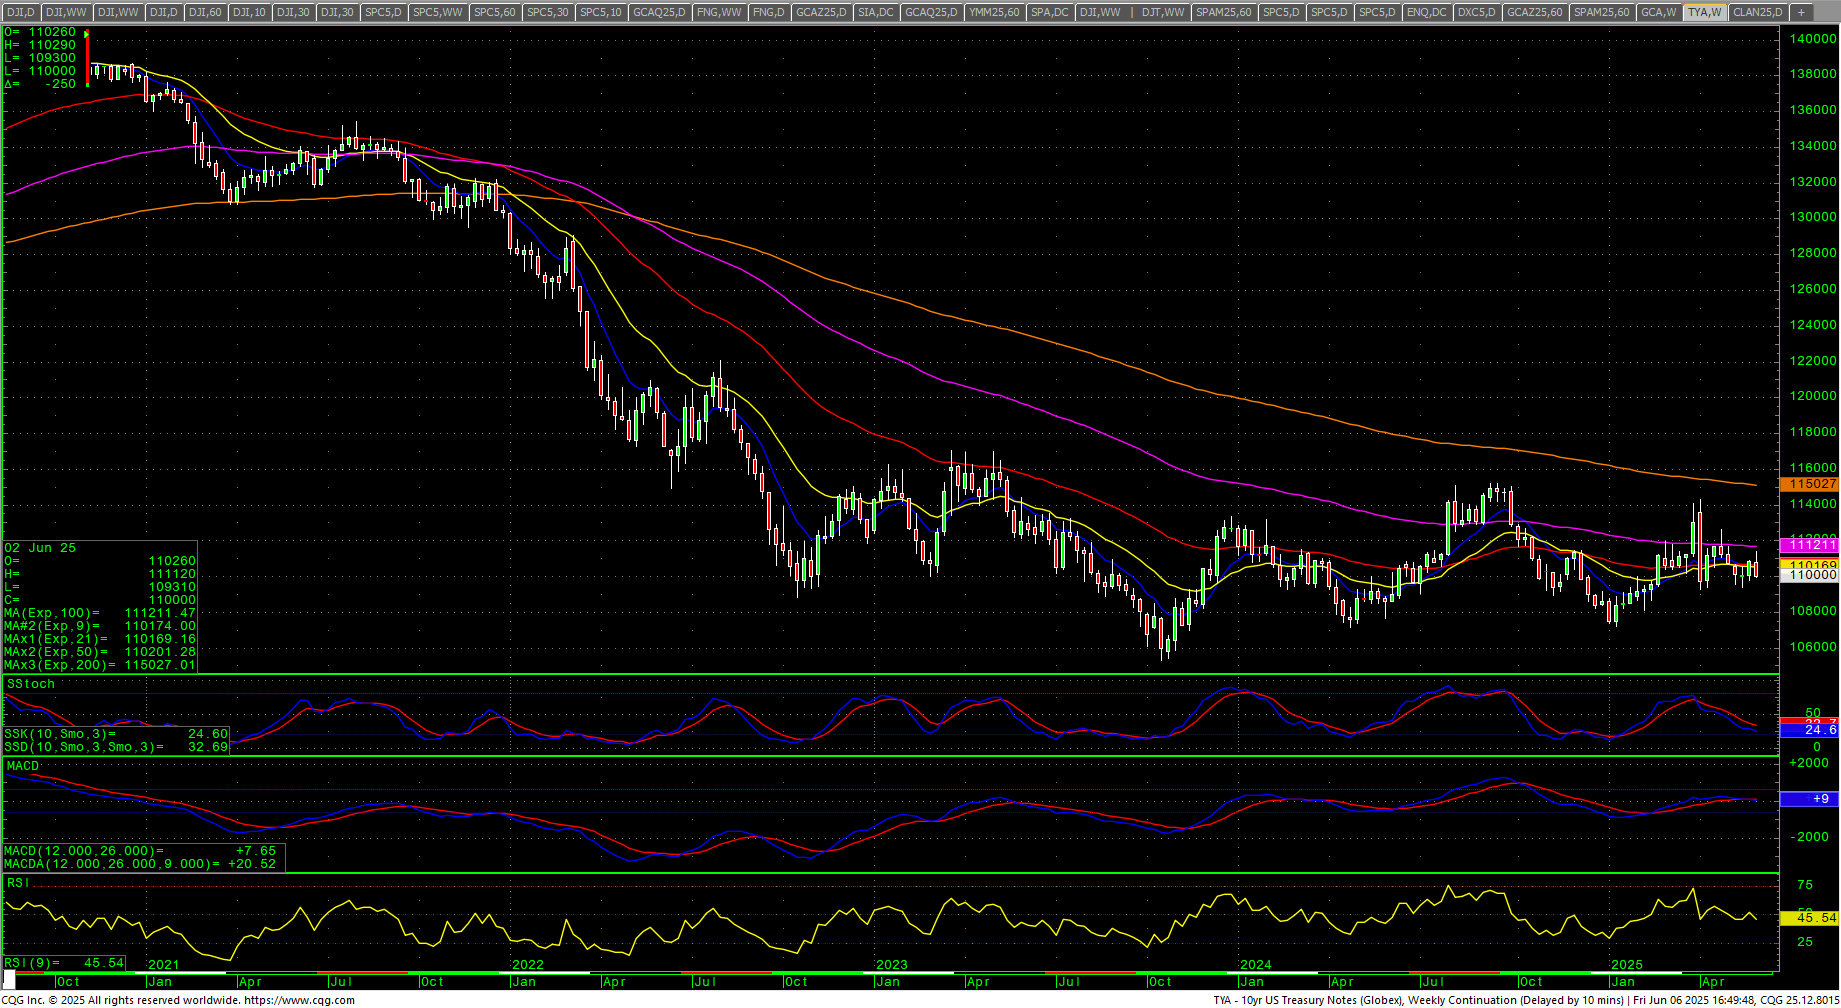
 Initially, Thursday’s minor timing looked to setup reversals, but the Nonfarm Payrolls data on Friday sent stocks soaring (on weak volume) along with bond yields. Bonds collapsed on the day and the 10YR moved back above 4.50%. Even the 2YR soared on Friday, closing the day above 4%. The BIG problem with the data on Friday is the “establishment” take versus the number of downward revisions on the previous numbers and the rest of the labor market data that shows fractures in the employment outlook in the USA…mirroring what we are seeing across Europe. The actual data in Household Surveys show losses in the past six months of -870K jobs. Eventually, the real data will catch up with the pedestrian data. There now is -625K workers that simply are OUT of the labor force in the past year…they do not get counted, which is why the May Unemployment numbers do not account for the labor force dropouts. In addition, Manufacturing Jobs DROPPED by 8K in May. Almost every single category, except food and metals, in U.S. manufacturing saw declines in the May report. The actual payrolls increase was around +40K in May, in line with the ADP number released on Wednesday. Expect a -100K revision for June numbers.
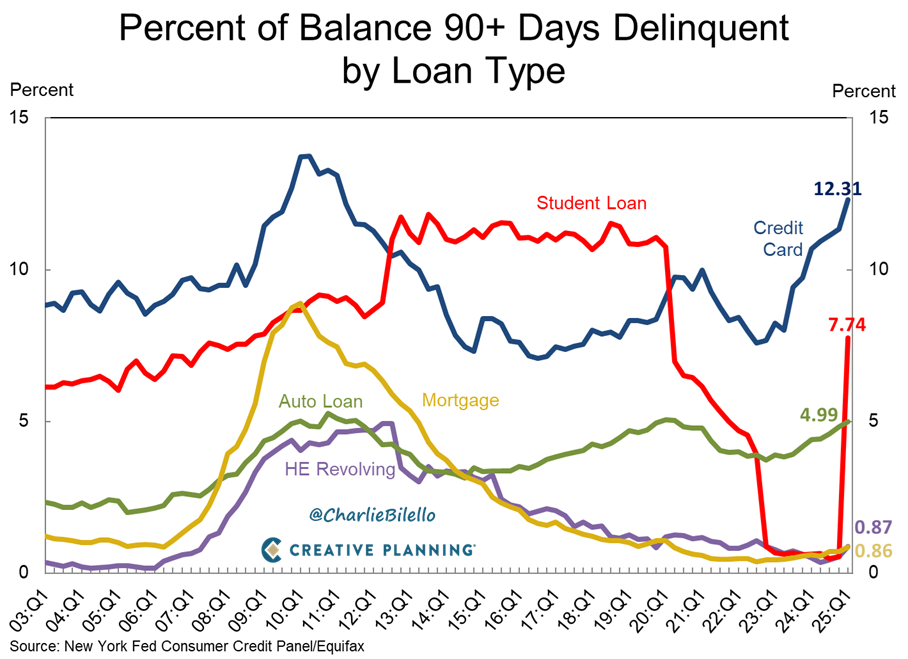
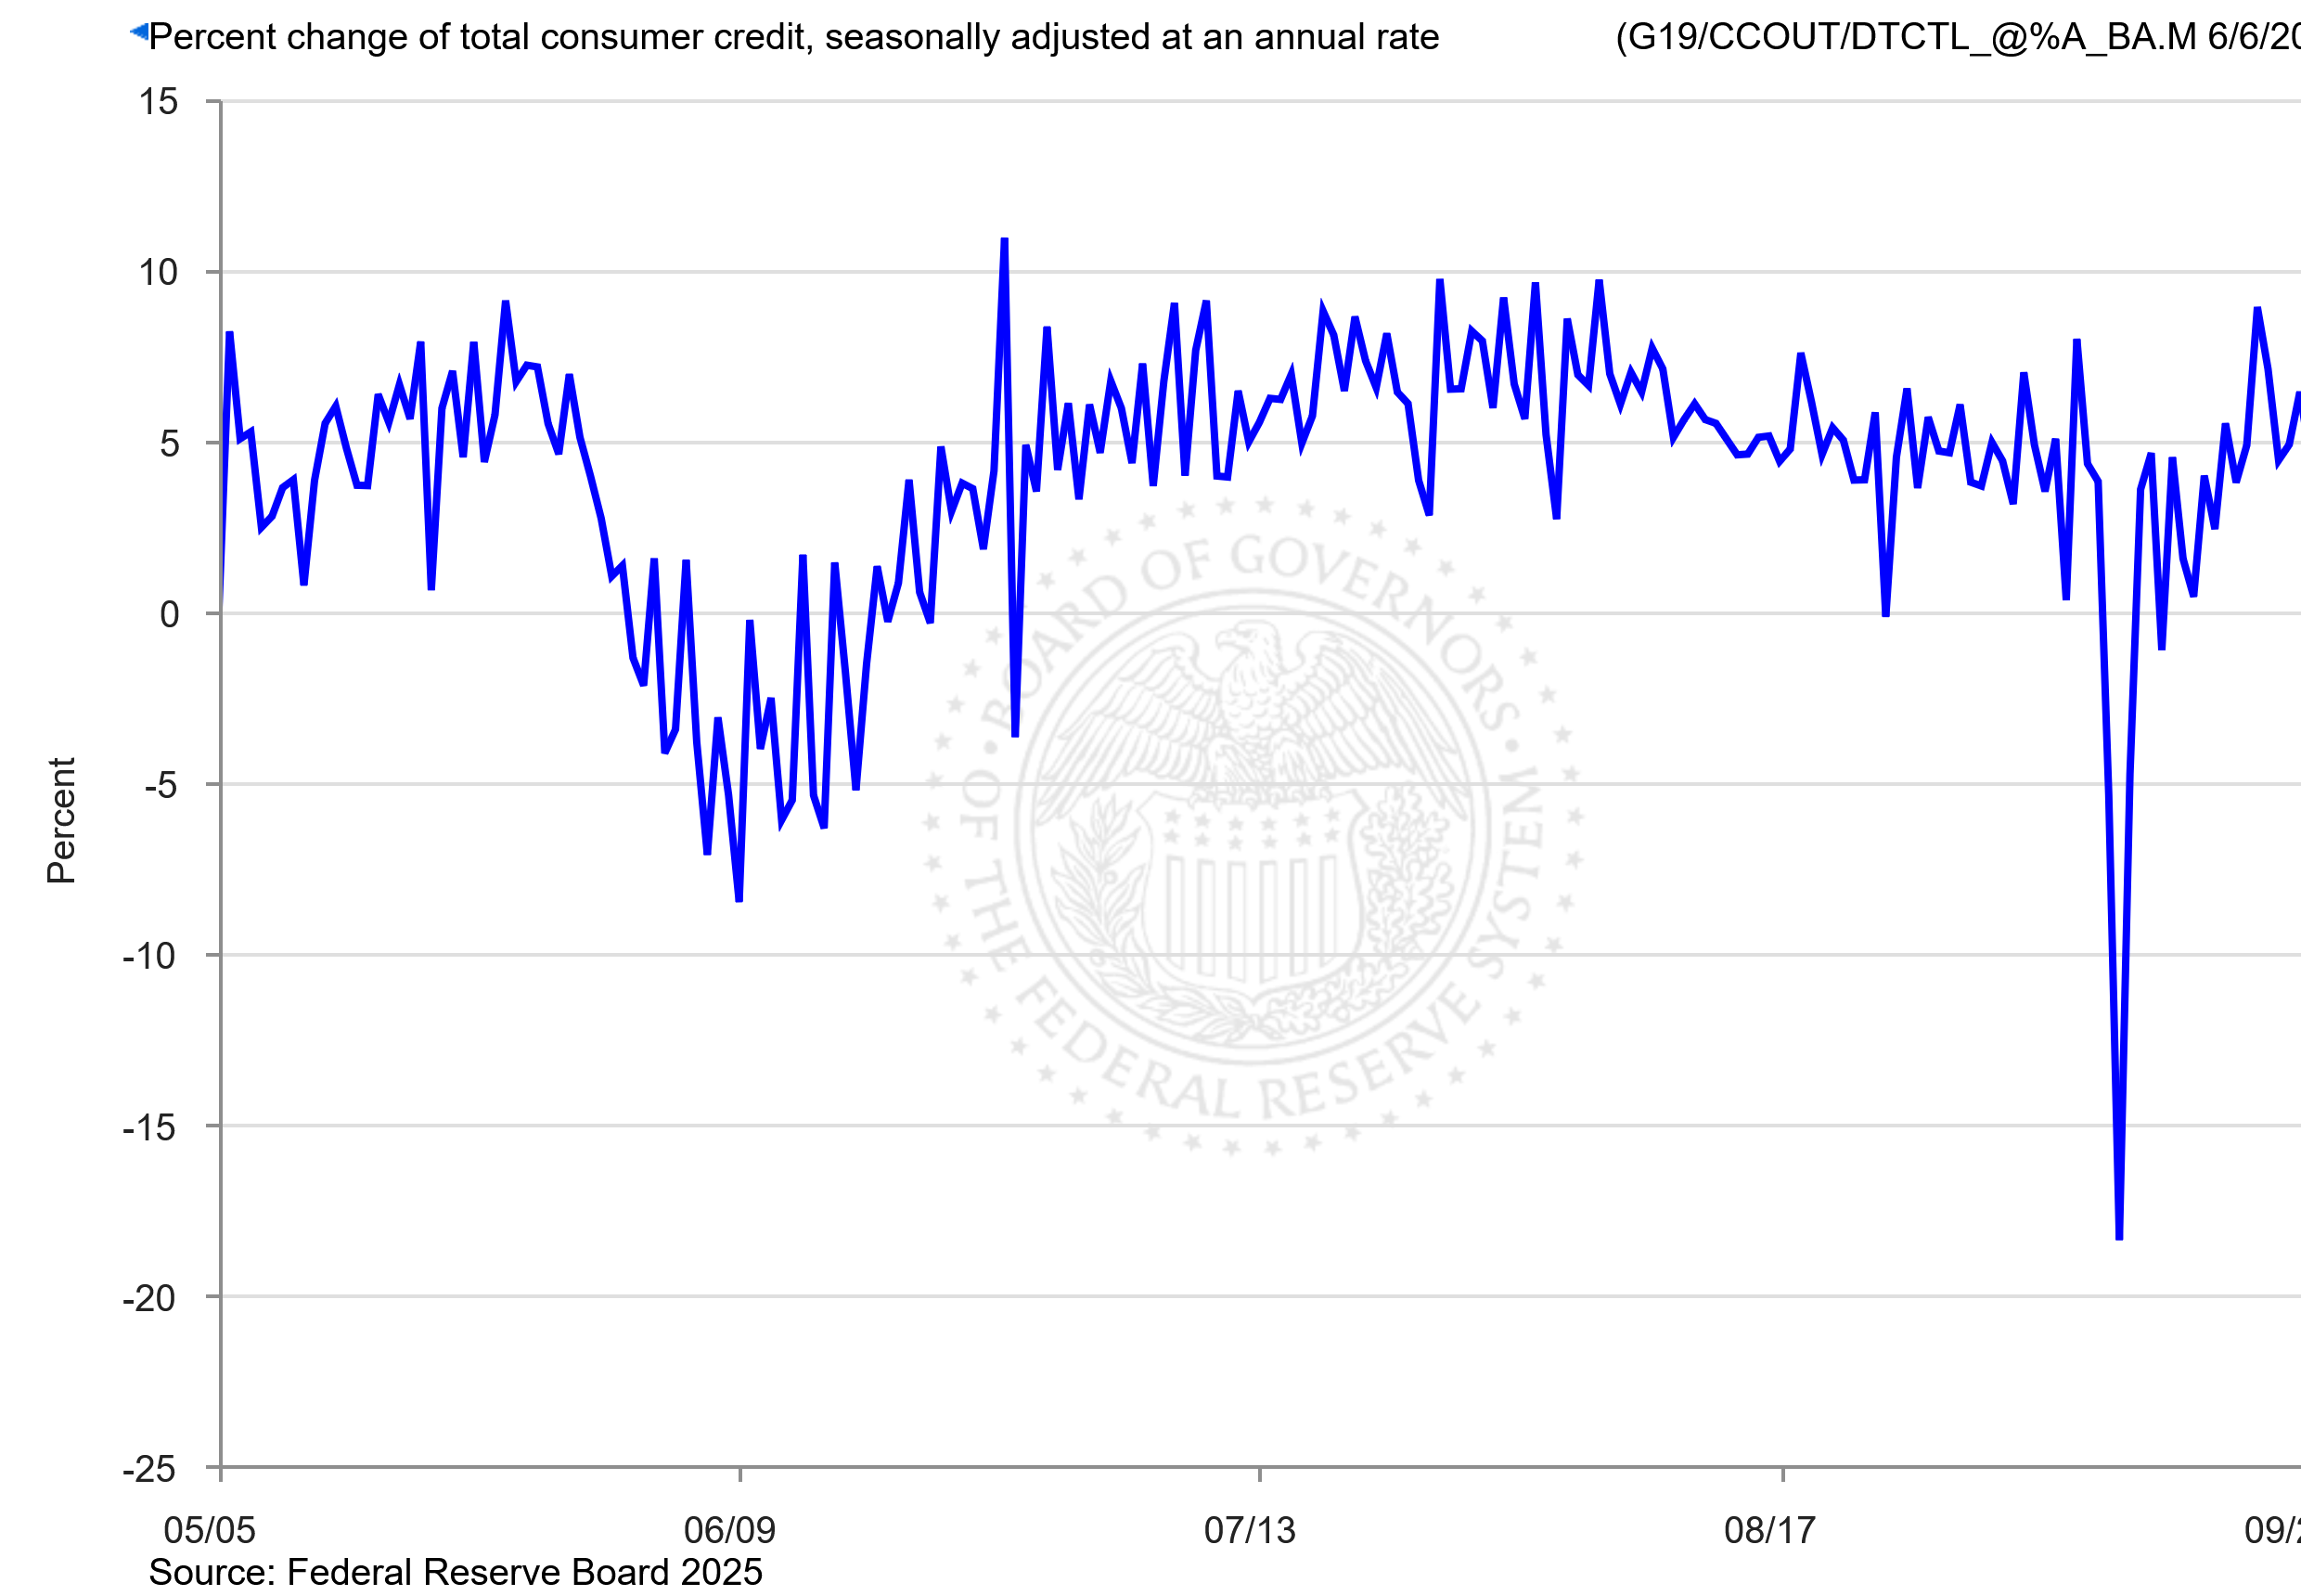
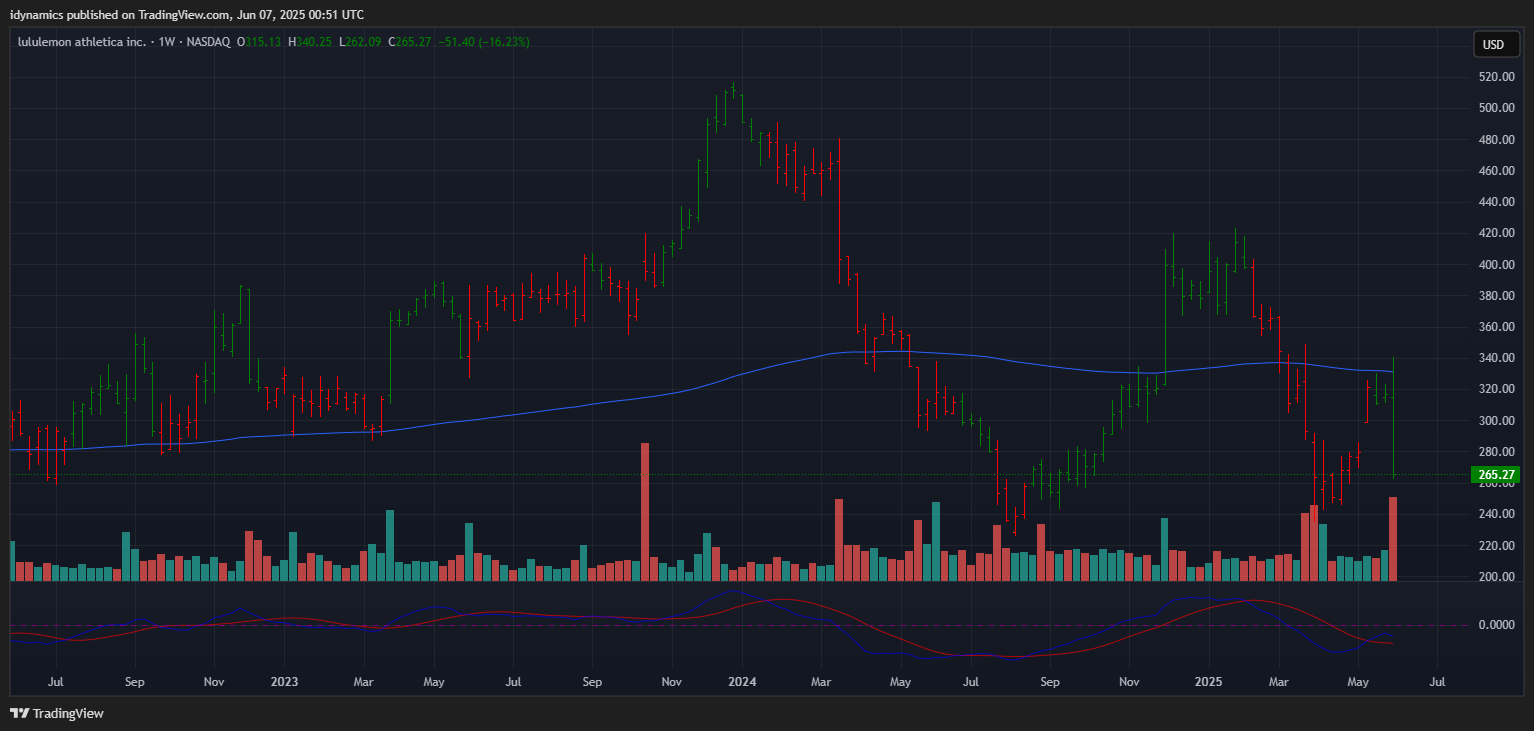
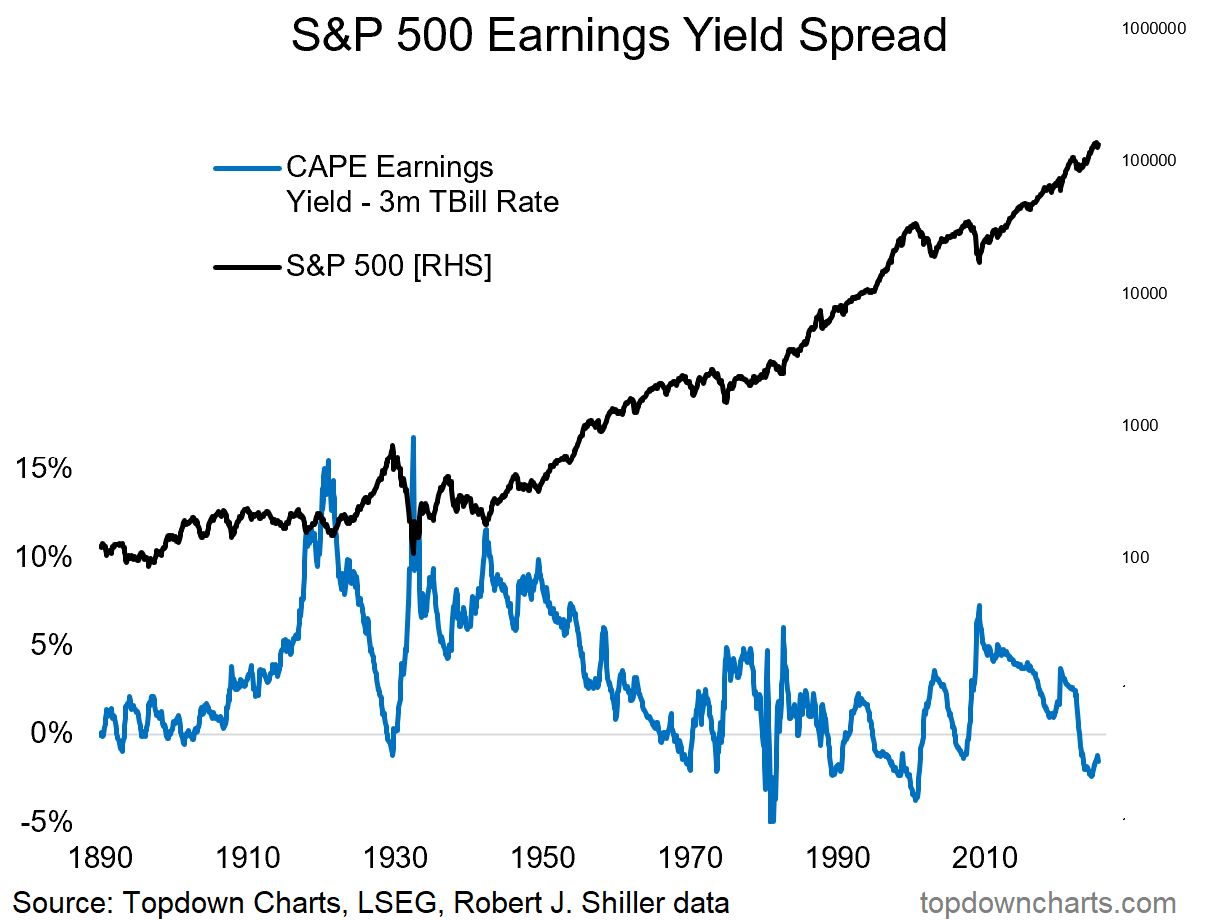 The yield spreads on the S&P are stretched to historical extremes while CAPE Earnings tumble. Delinquencies in consumer debt more accurately reflect what the CPS Household Surveys are showing…consumers are stretched. Consumers continue to live off debt while delinquencies are rising. LULU continues to be a canary in the coalmine for consumers, closing down -16.23% on the week.
SPX Daily Candles
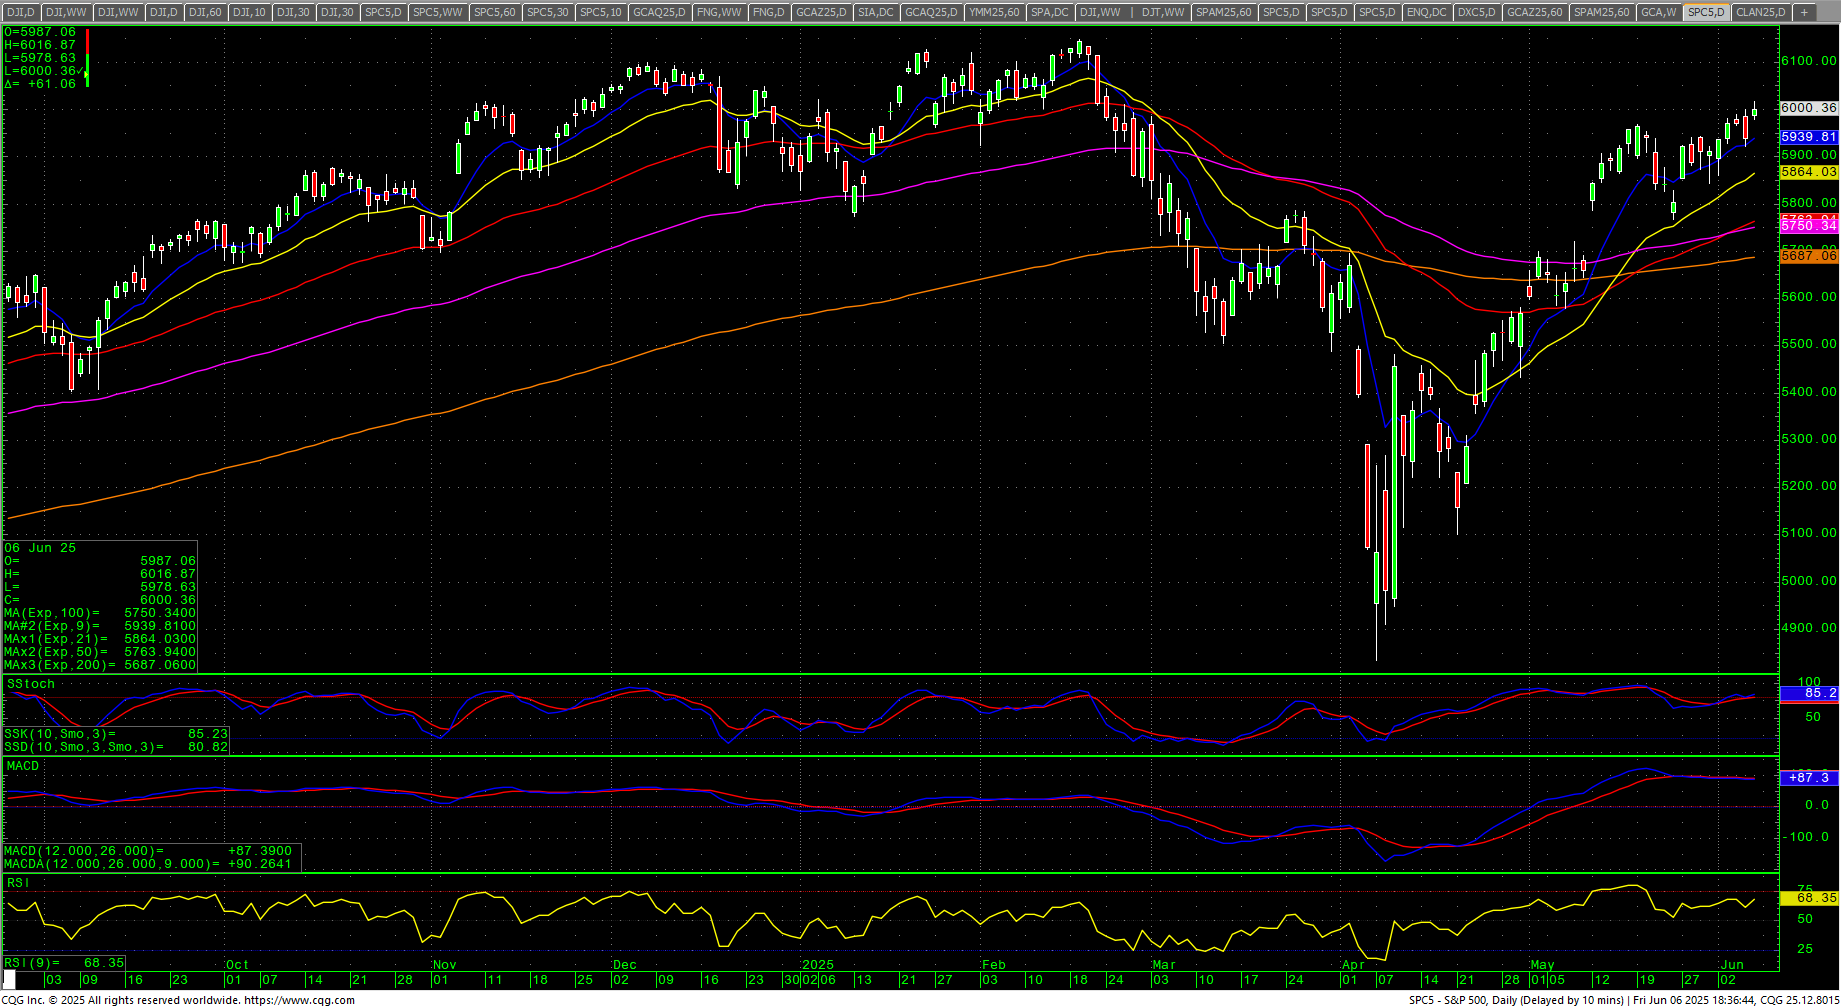 The SPX daily remains bullish after issuing the Golden Cross. There is still a strong probability that the SPX will return to the 200-day MA for a retest. For the SPX, that sits at 5687.06 and trending up on Friday’s close. That’s 313.30 points or a down move of -5.36%.
MAGS (Magnificent 7) Weekly Candles
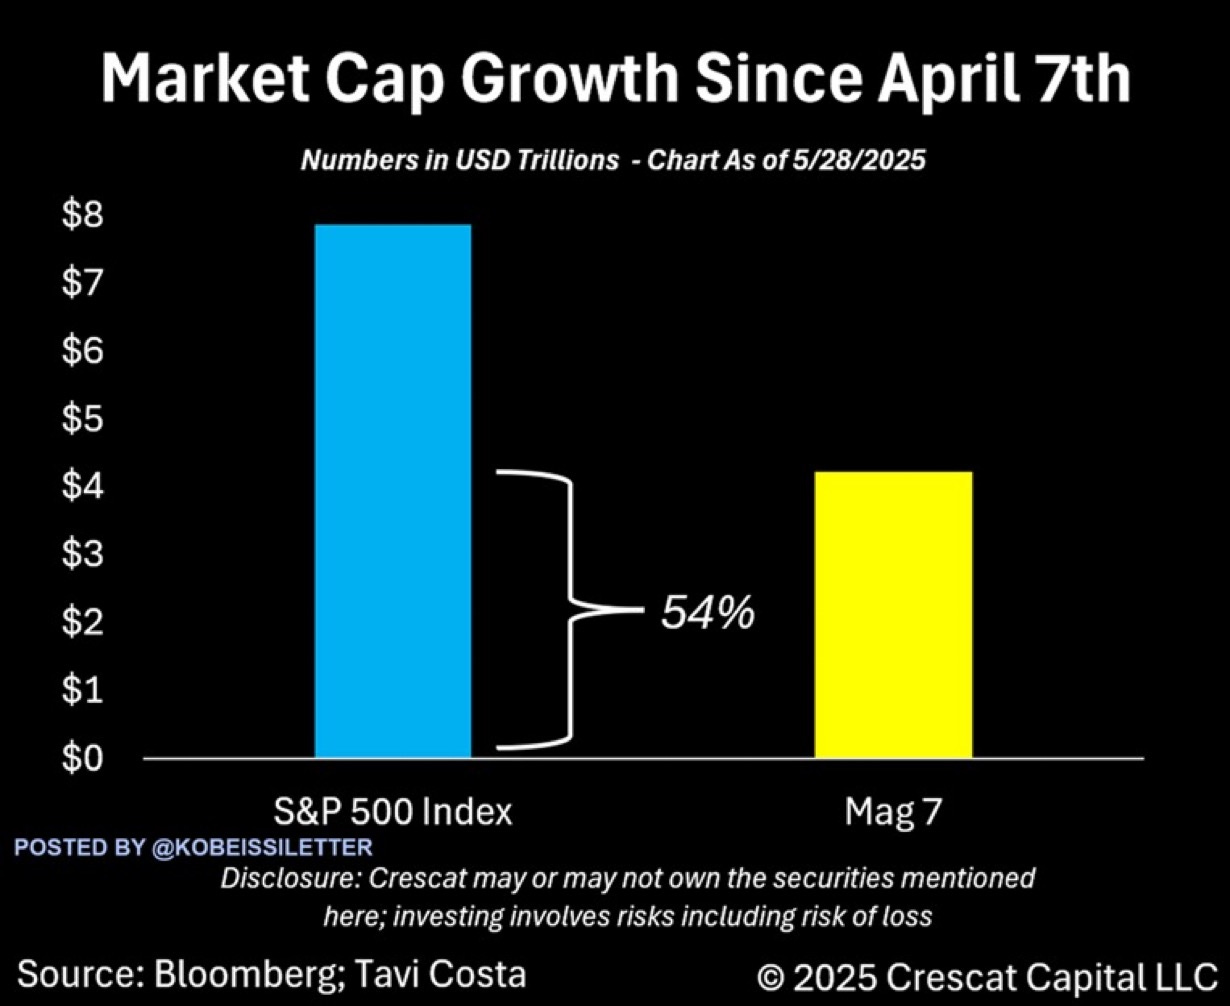
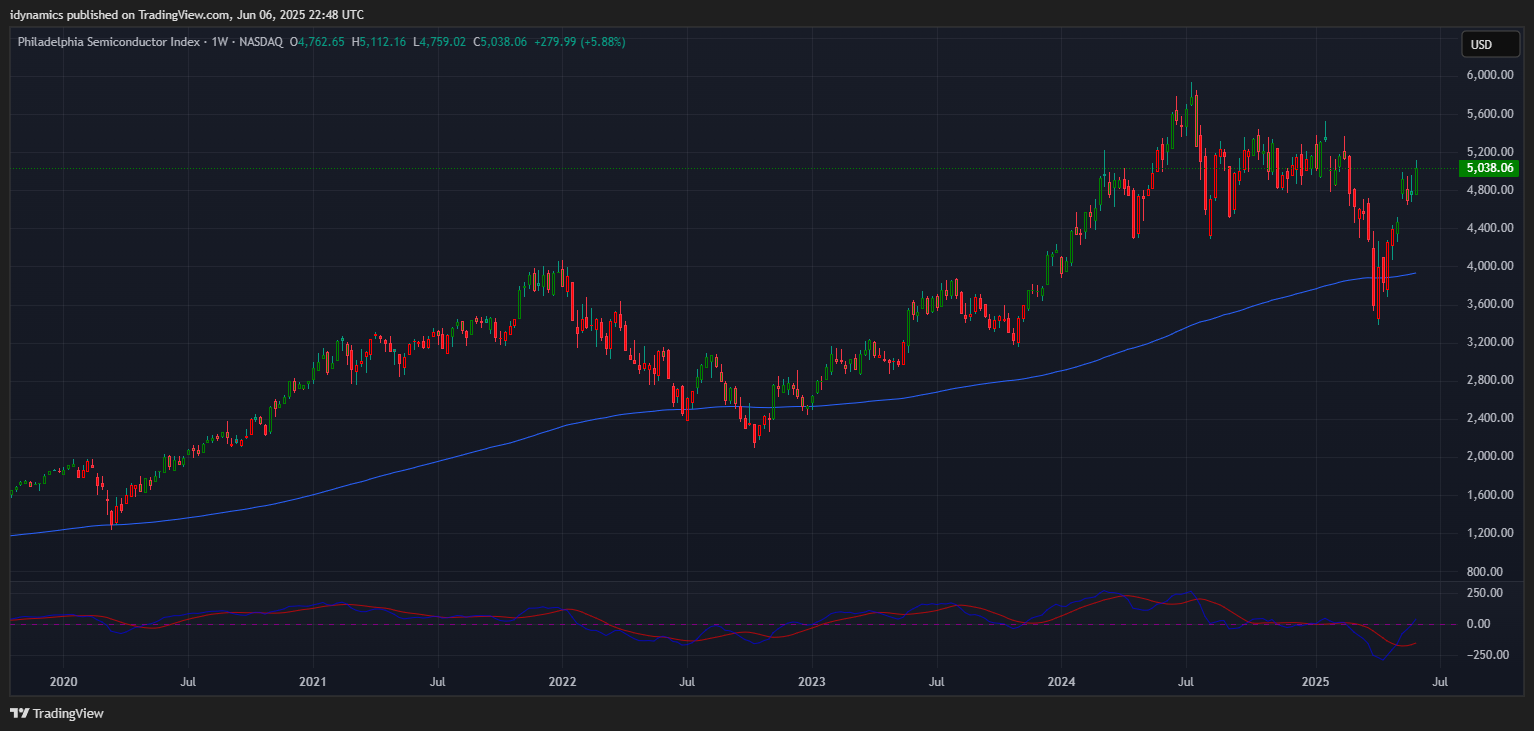
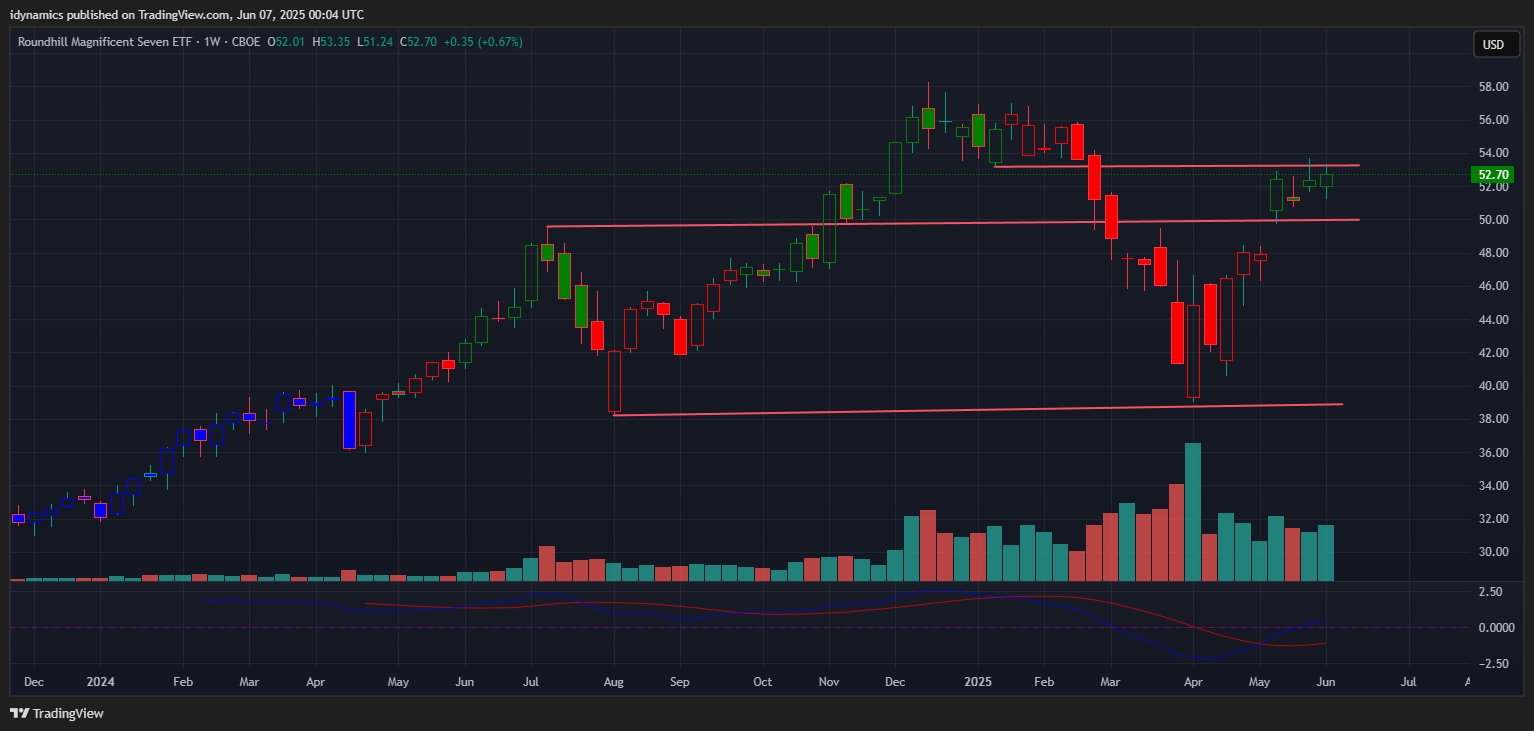 The MAGS (Magnificent 7) closed out the week up +0.67% at a new weekly recovery high for the move. Right now, the 53.16/54.16 level remains critical. Daily closes over 54.16 will increase the bullish view for the chart and open potential for a test of the highs. A break back under 50 should accelerate selling again. The thinness of the market is a MAJOR potential warning sign overall. Currently, the MAG7 accounts for 54% of the ENTIRE S&P 500 (SPX) market. The PHLX Semiconductor Index closed above critical resistance at 4970 and the next big resistance is at 5296/5331.
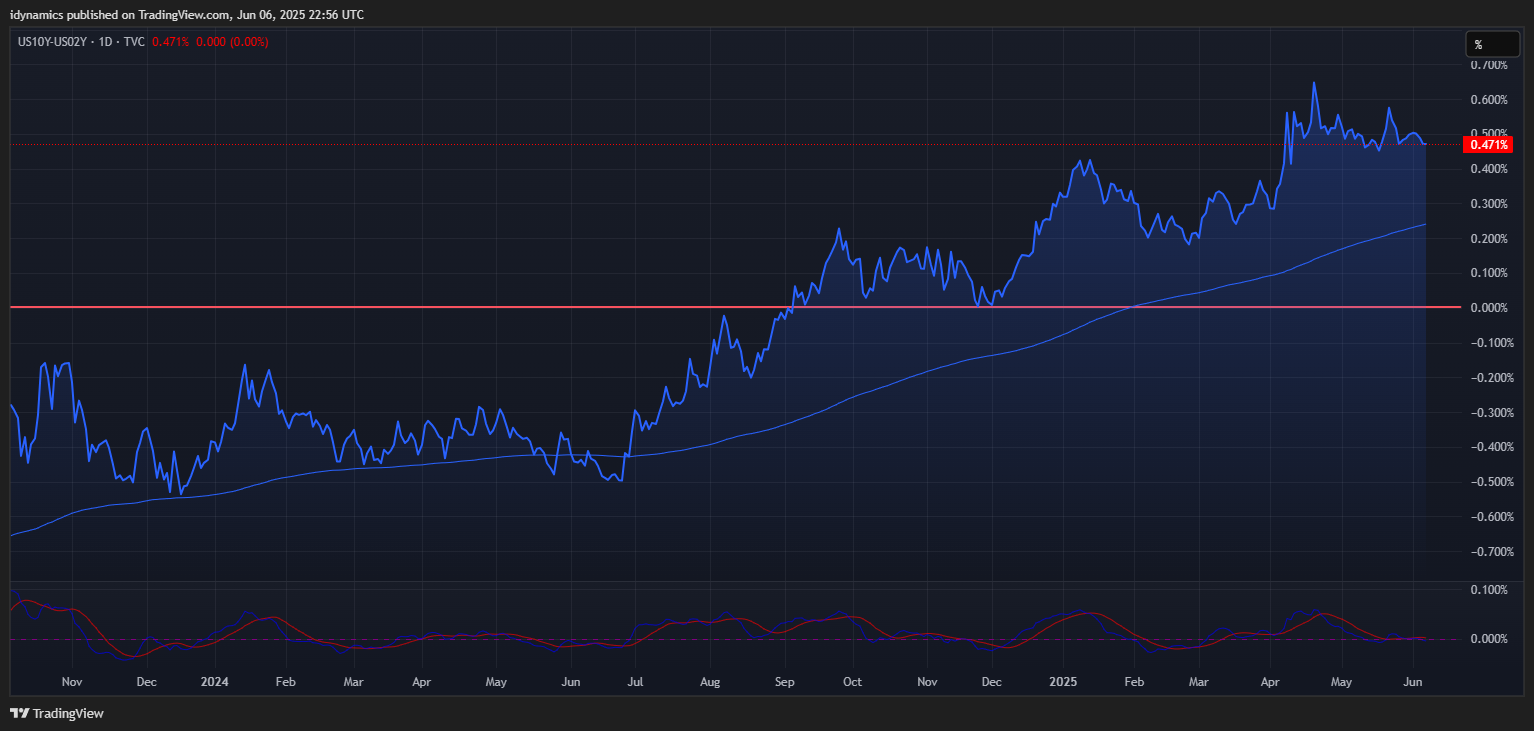
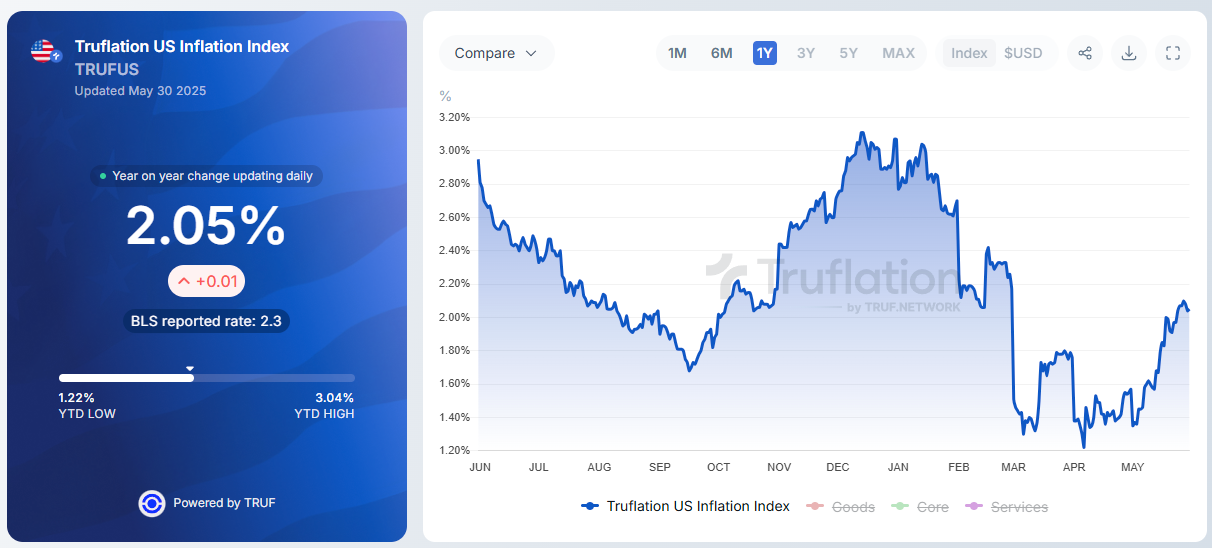
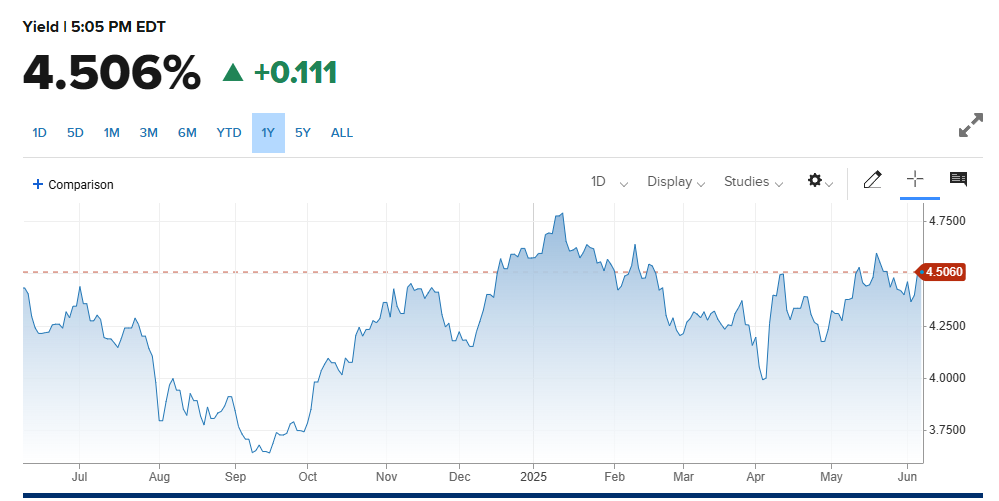
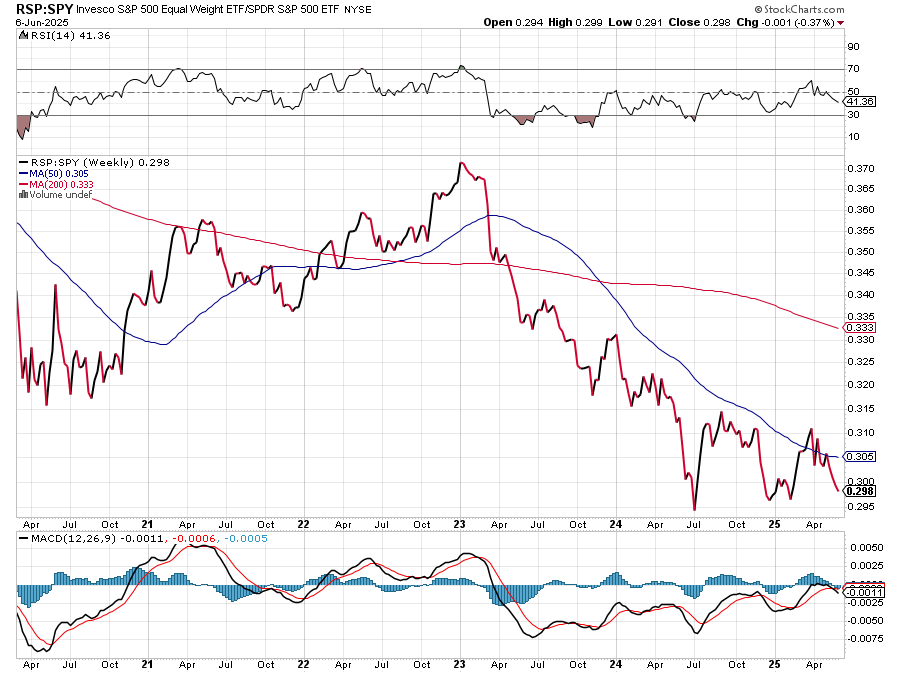
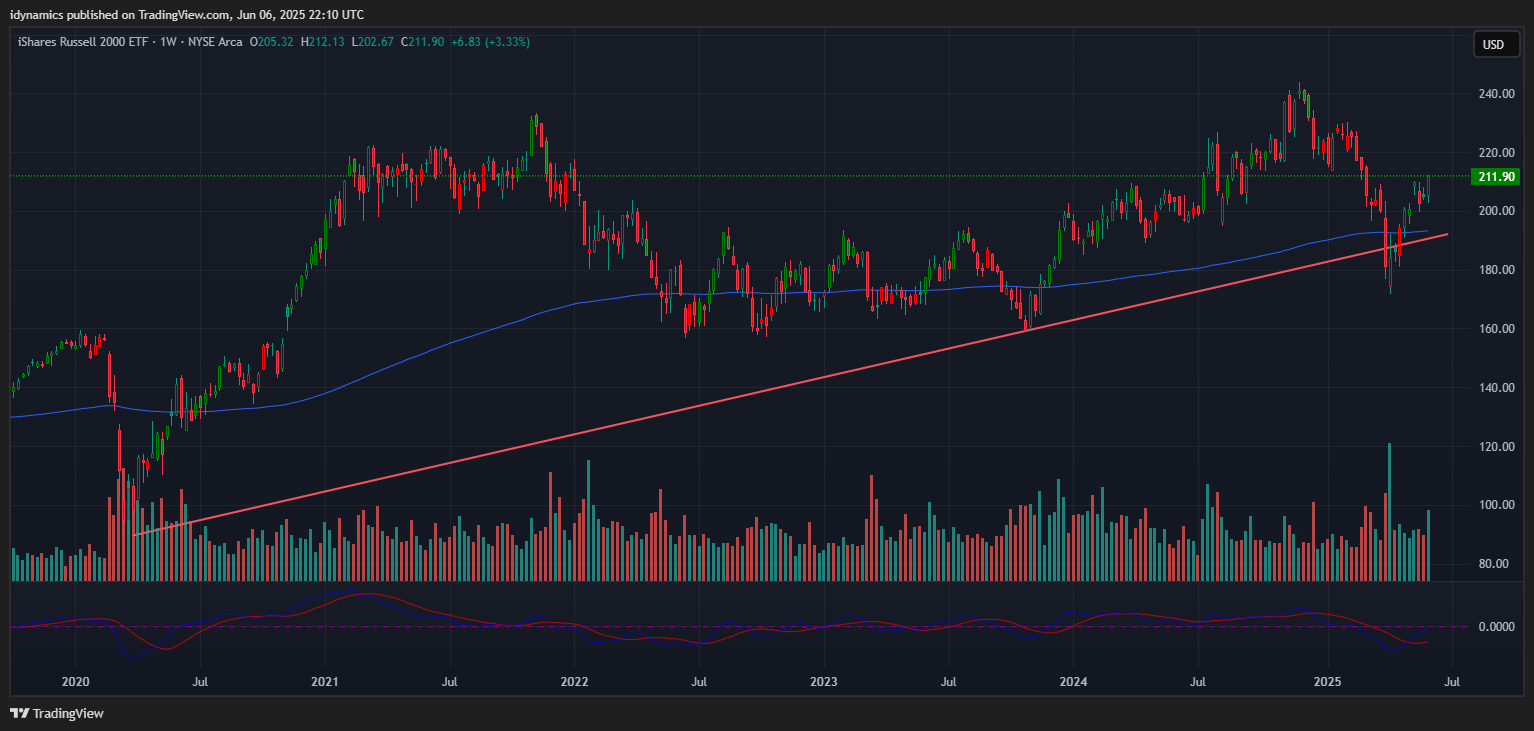
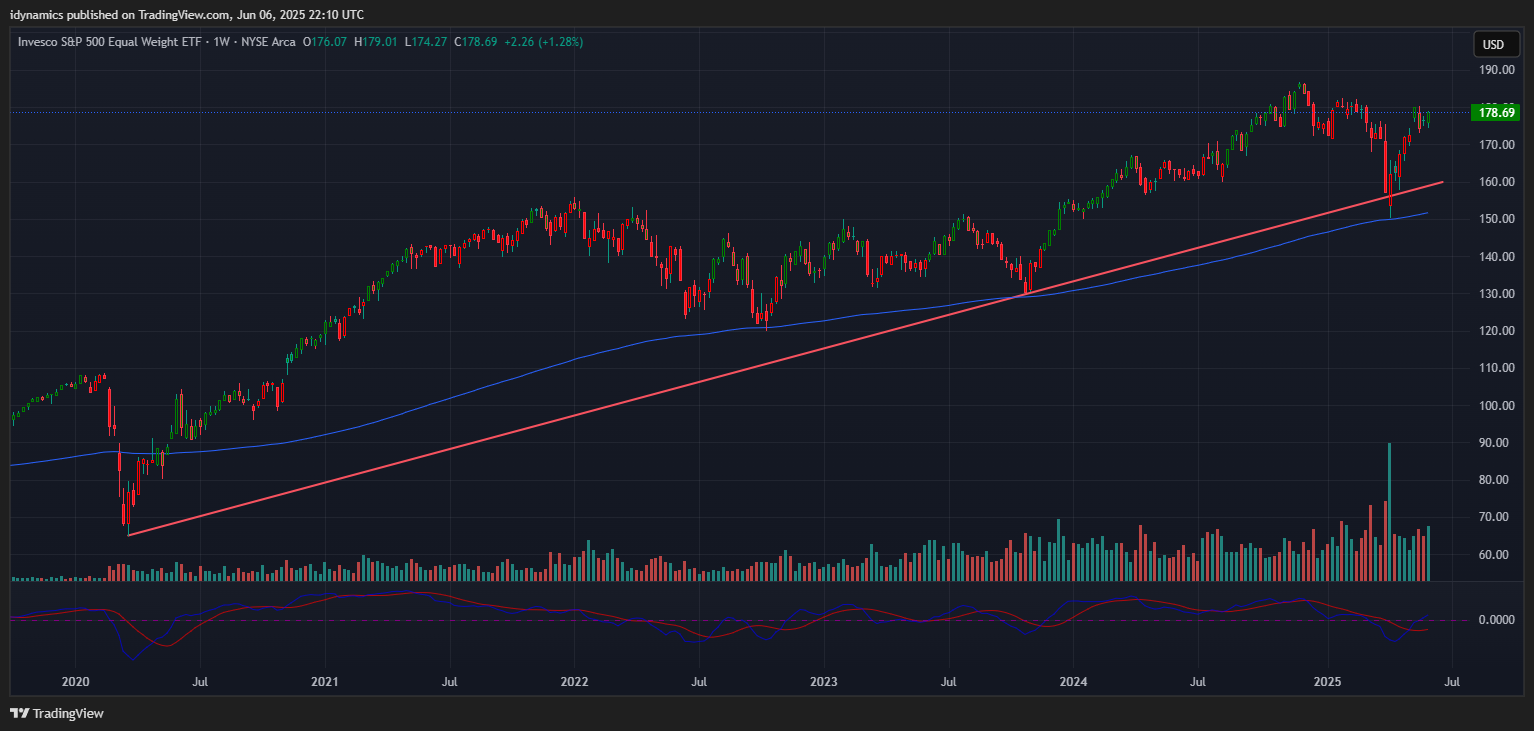
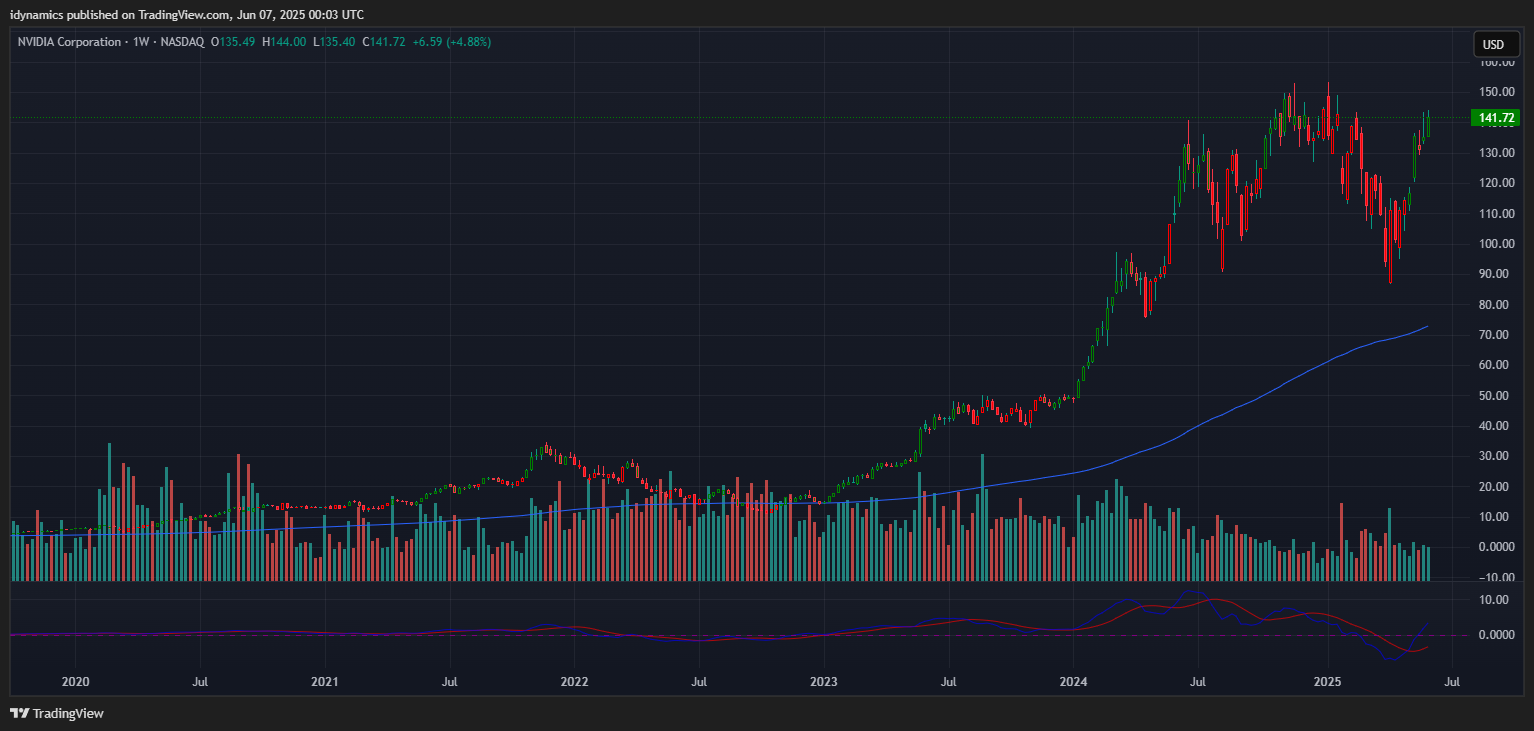
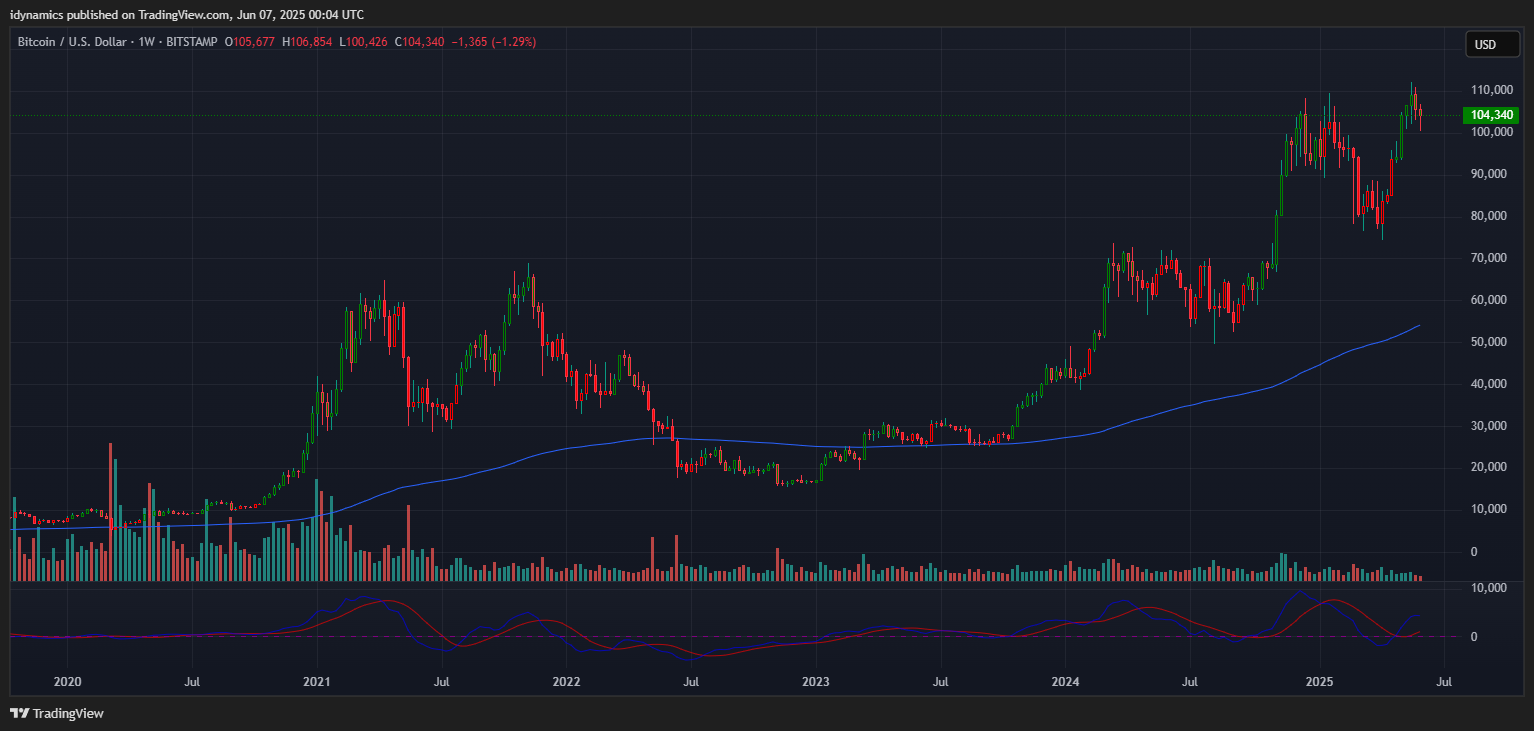
The RSP:SPY closed lower yet again as the weekly is hooking lower in an oversold position and the MACD is turning back down. The IWM closed up sharply +3.33% on the top of an outside week up. The RSP was up +1.28% on the top of an outside week up. The most valuable company on earth, NVDA led the overall market once again and closed on the weekly high, very near a record weekly high close for that chart…ending the week up +4.88%. Bitcoin was lower on the week by -1.17% as it continues to retrace from its latest ATH. McClellan Oscillators are confirming the rally in the Dow. The Yield Curve narrowed as the 2YR surged above 4%, closing out the week at +0.471%. The 10YR yield soared Friday and closed higher at 4.506%. Truflation steadied at 2.05%.
10YR-2YR Yield Curve Daily

 VIX Weekly Candles
 VIX Weekly Candles
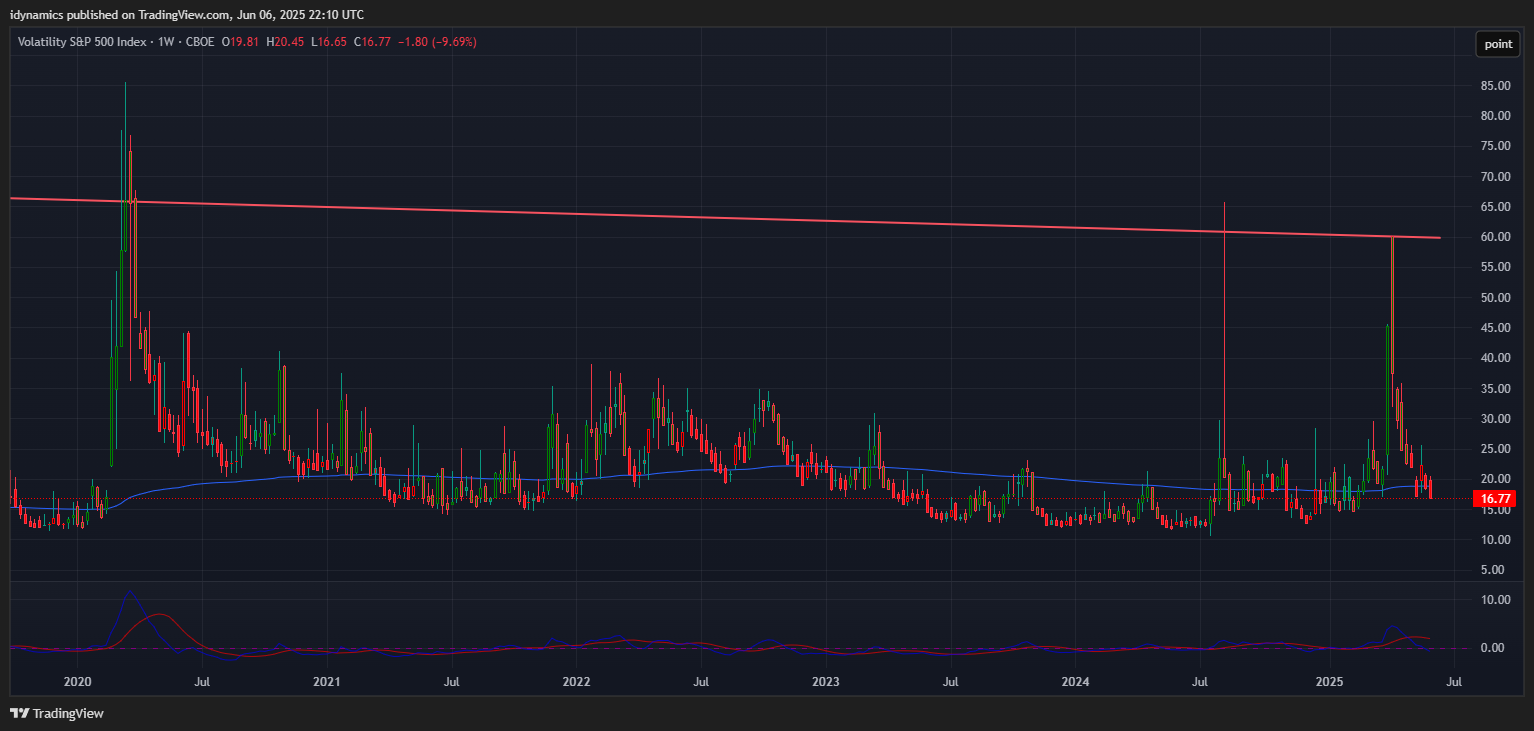
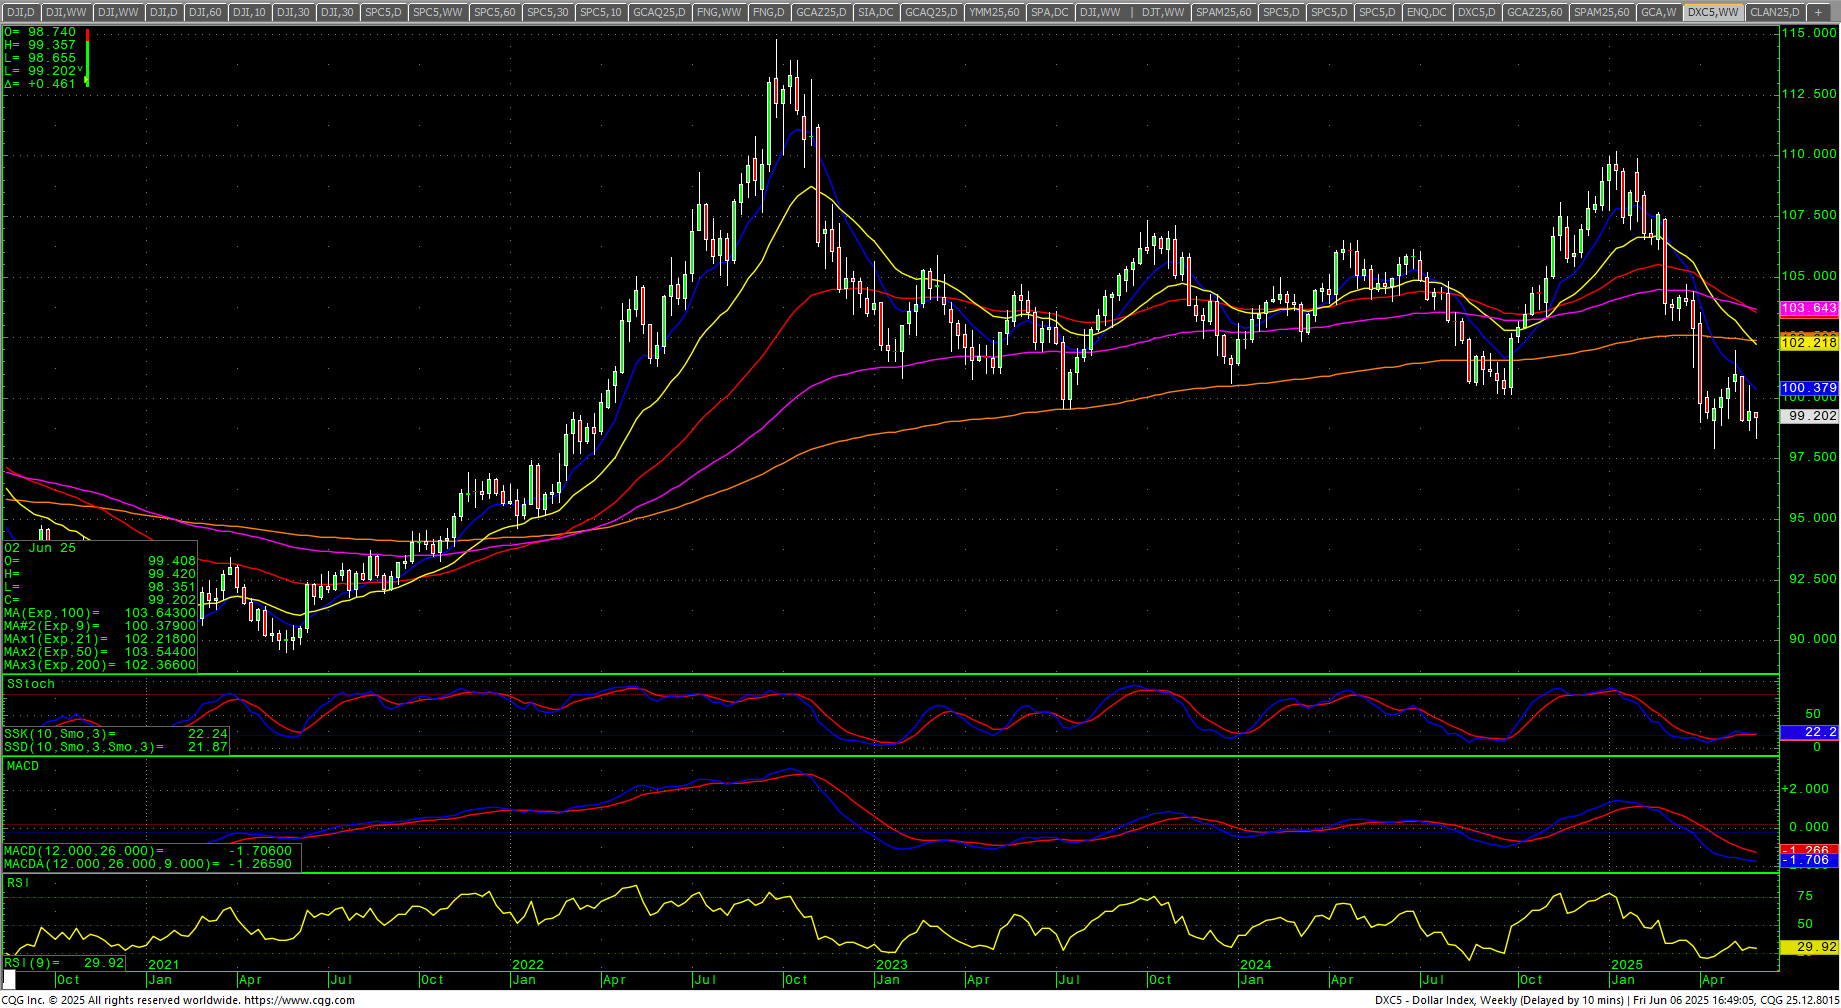
The VIX closed sharply lower, on the bottom of an the week’s range and back under the 20 level, down -9.69%. The US Dollar closed the week lower but in the upper half of the range and remains just under par/100, closing down -0.24% on the week.
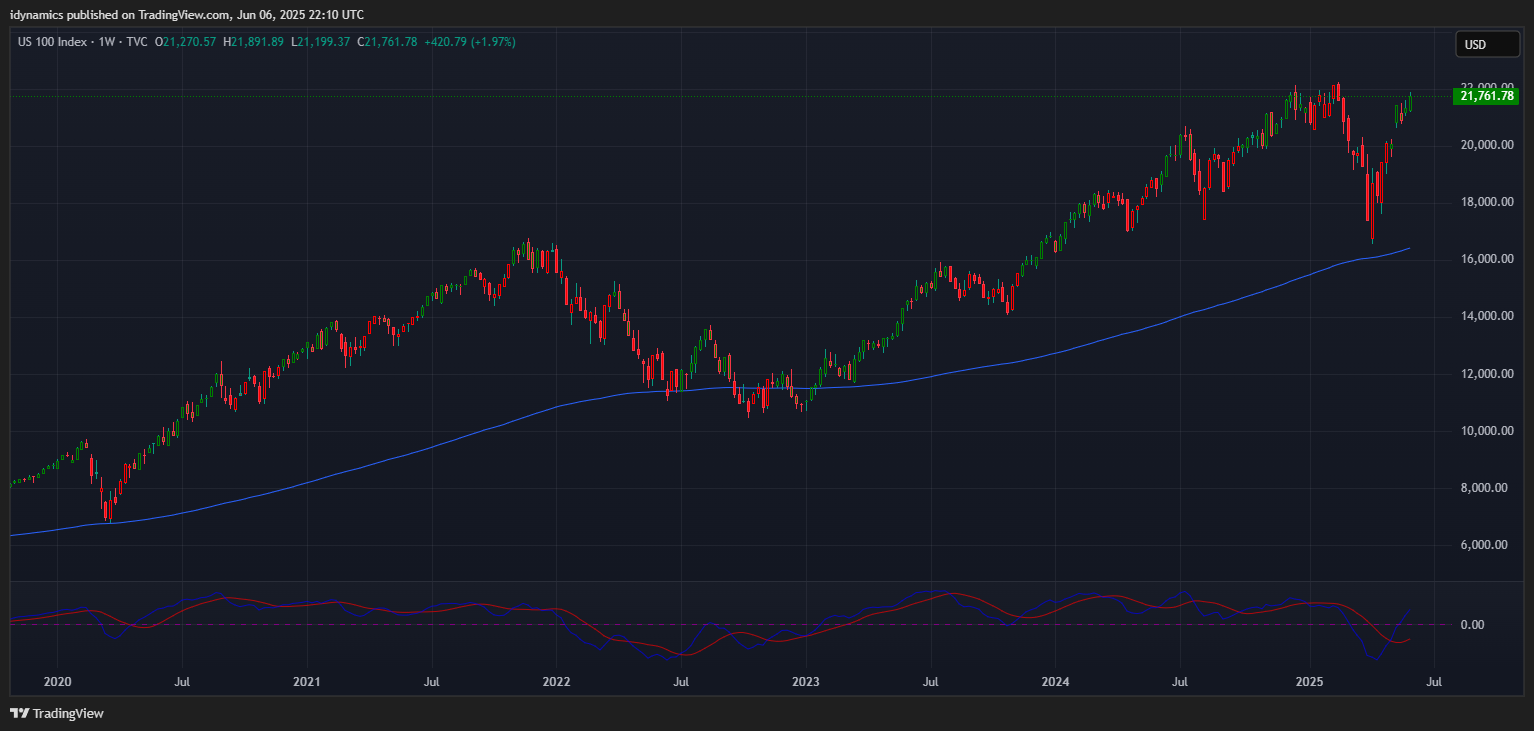
 Nasdaq 100 Weekly Candles
 Nasdaq 100 Weekly Candles
Daily Breadth 
 Daily Breadth
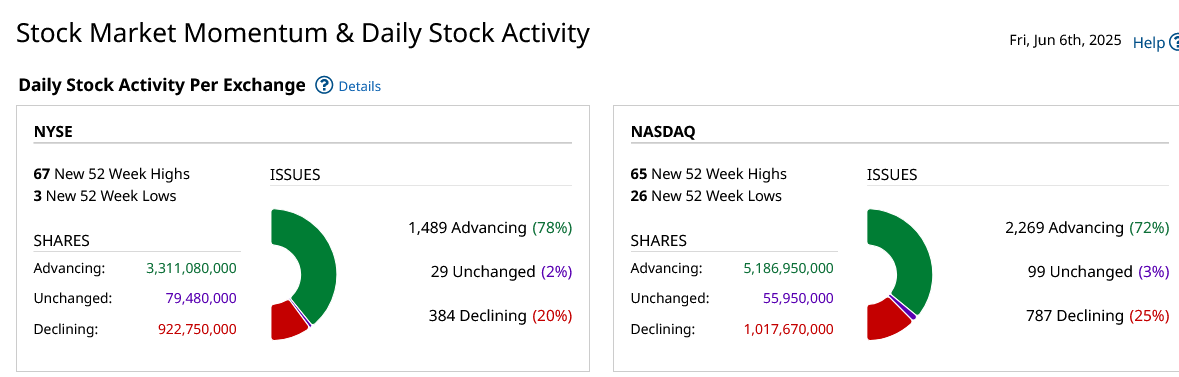
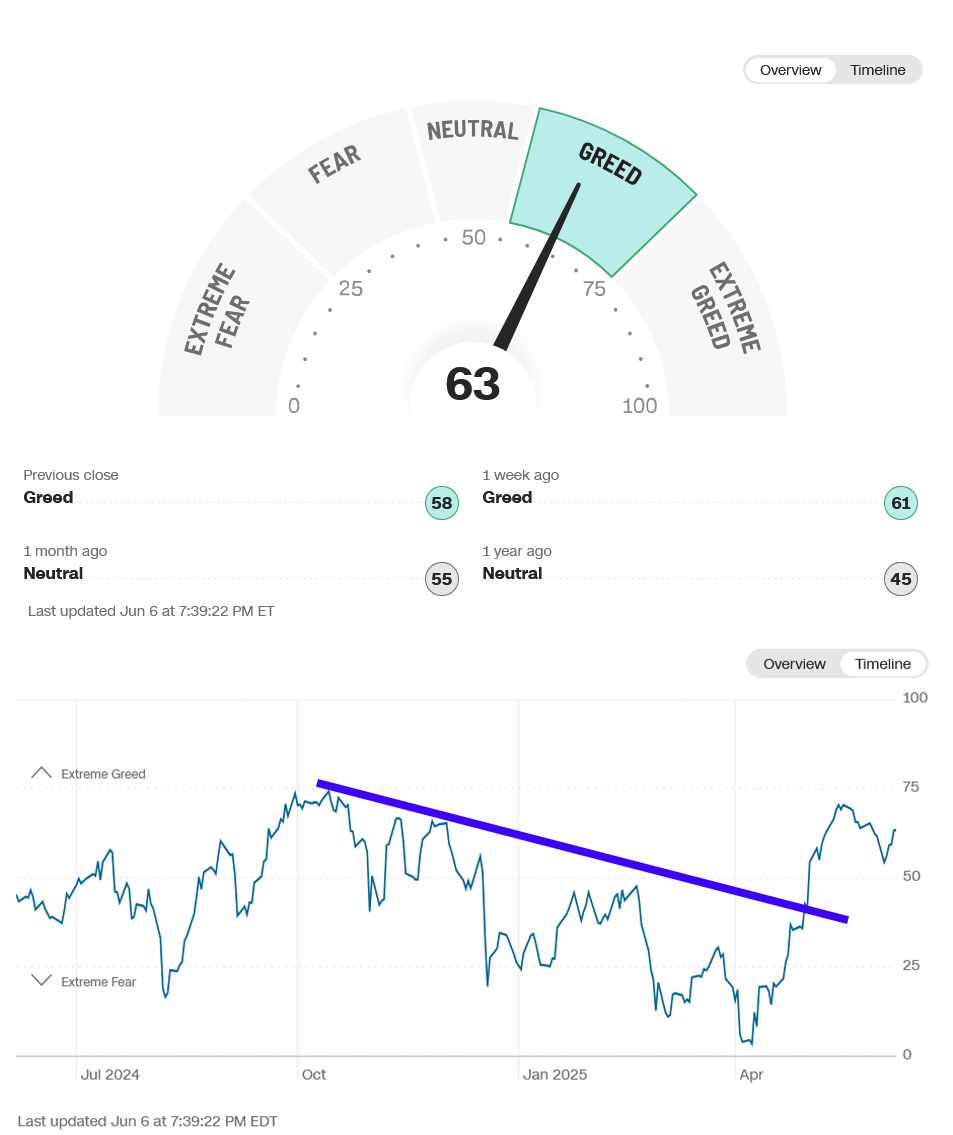
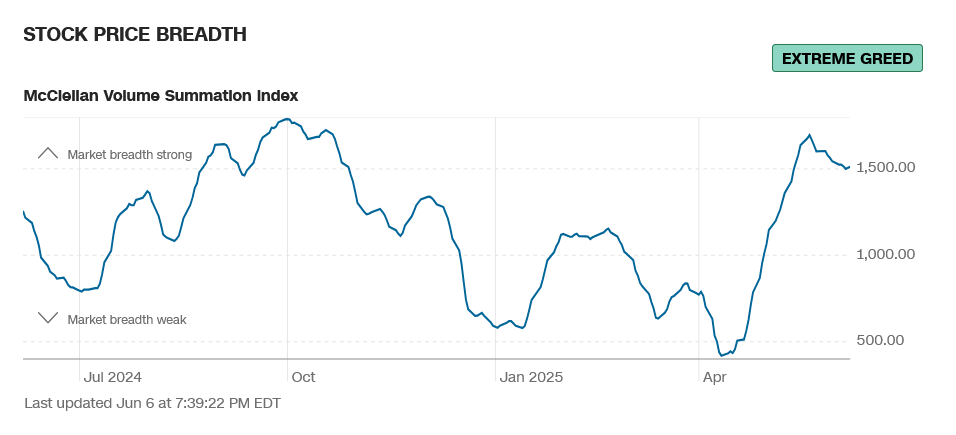
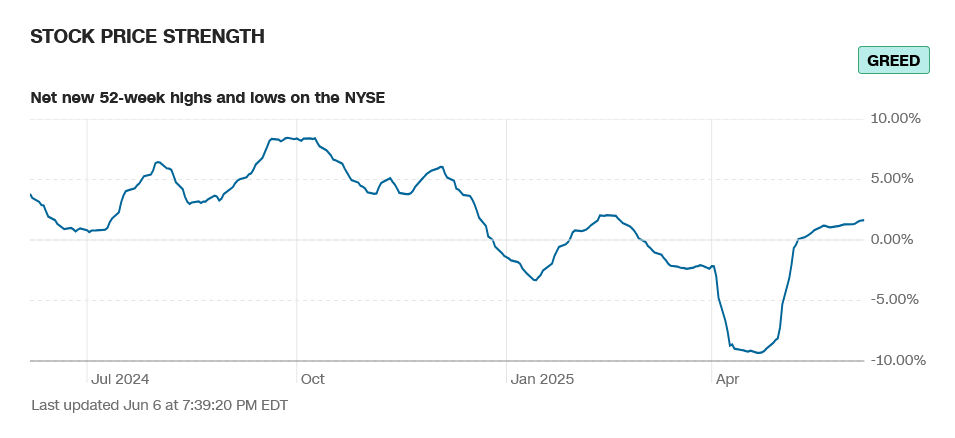
Breadth strengthened late in the week. Sentiment remains in extreme greed.
CNN Fear & Greed Index
 AAII Investor Sentiment Survey
 AAII Investor Sentiment Survey
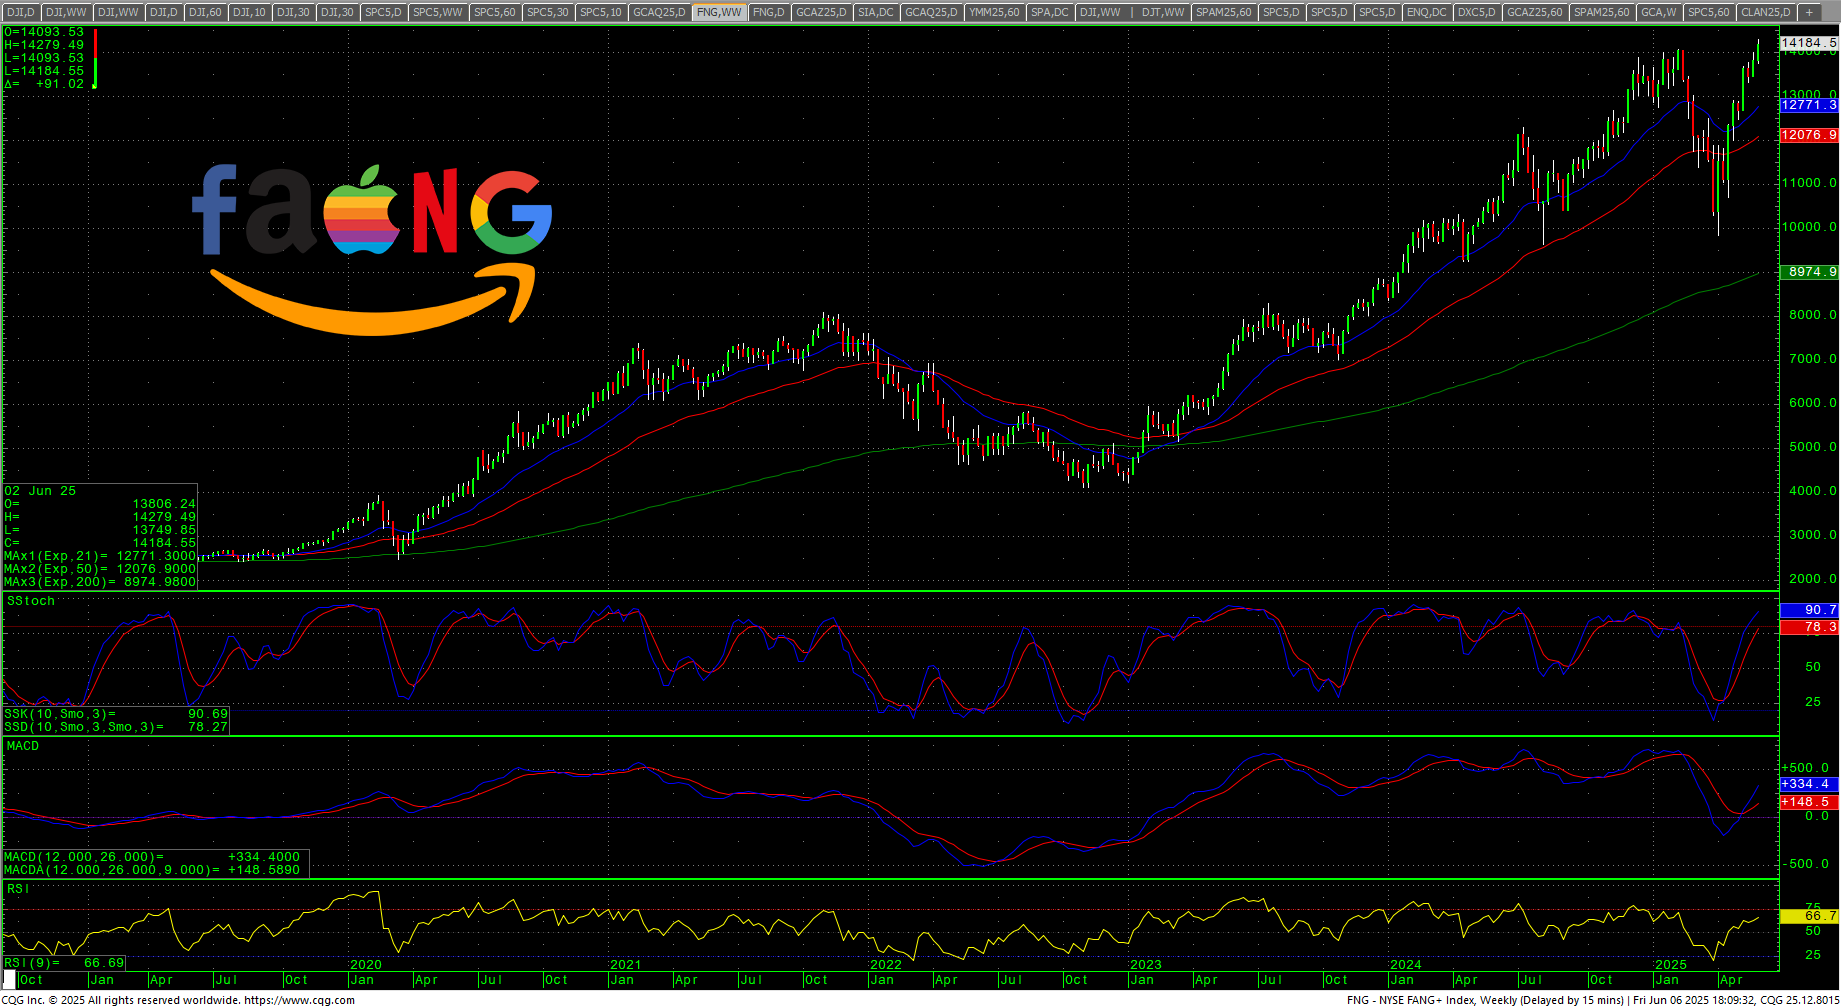
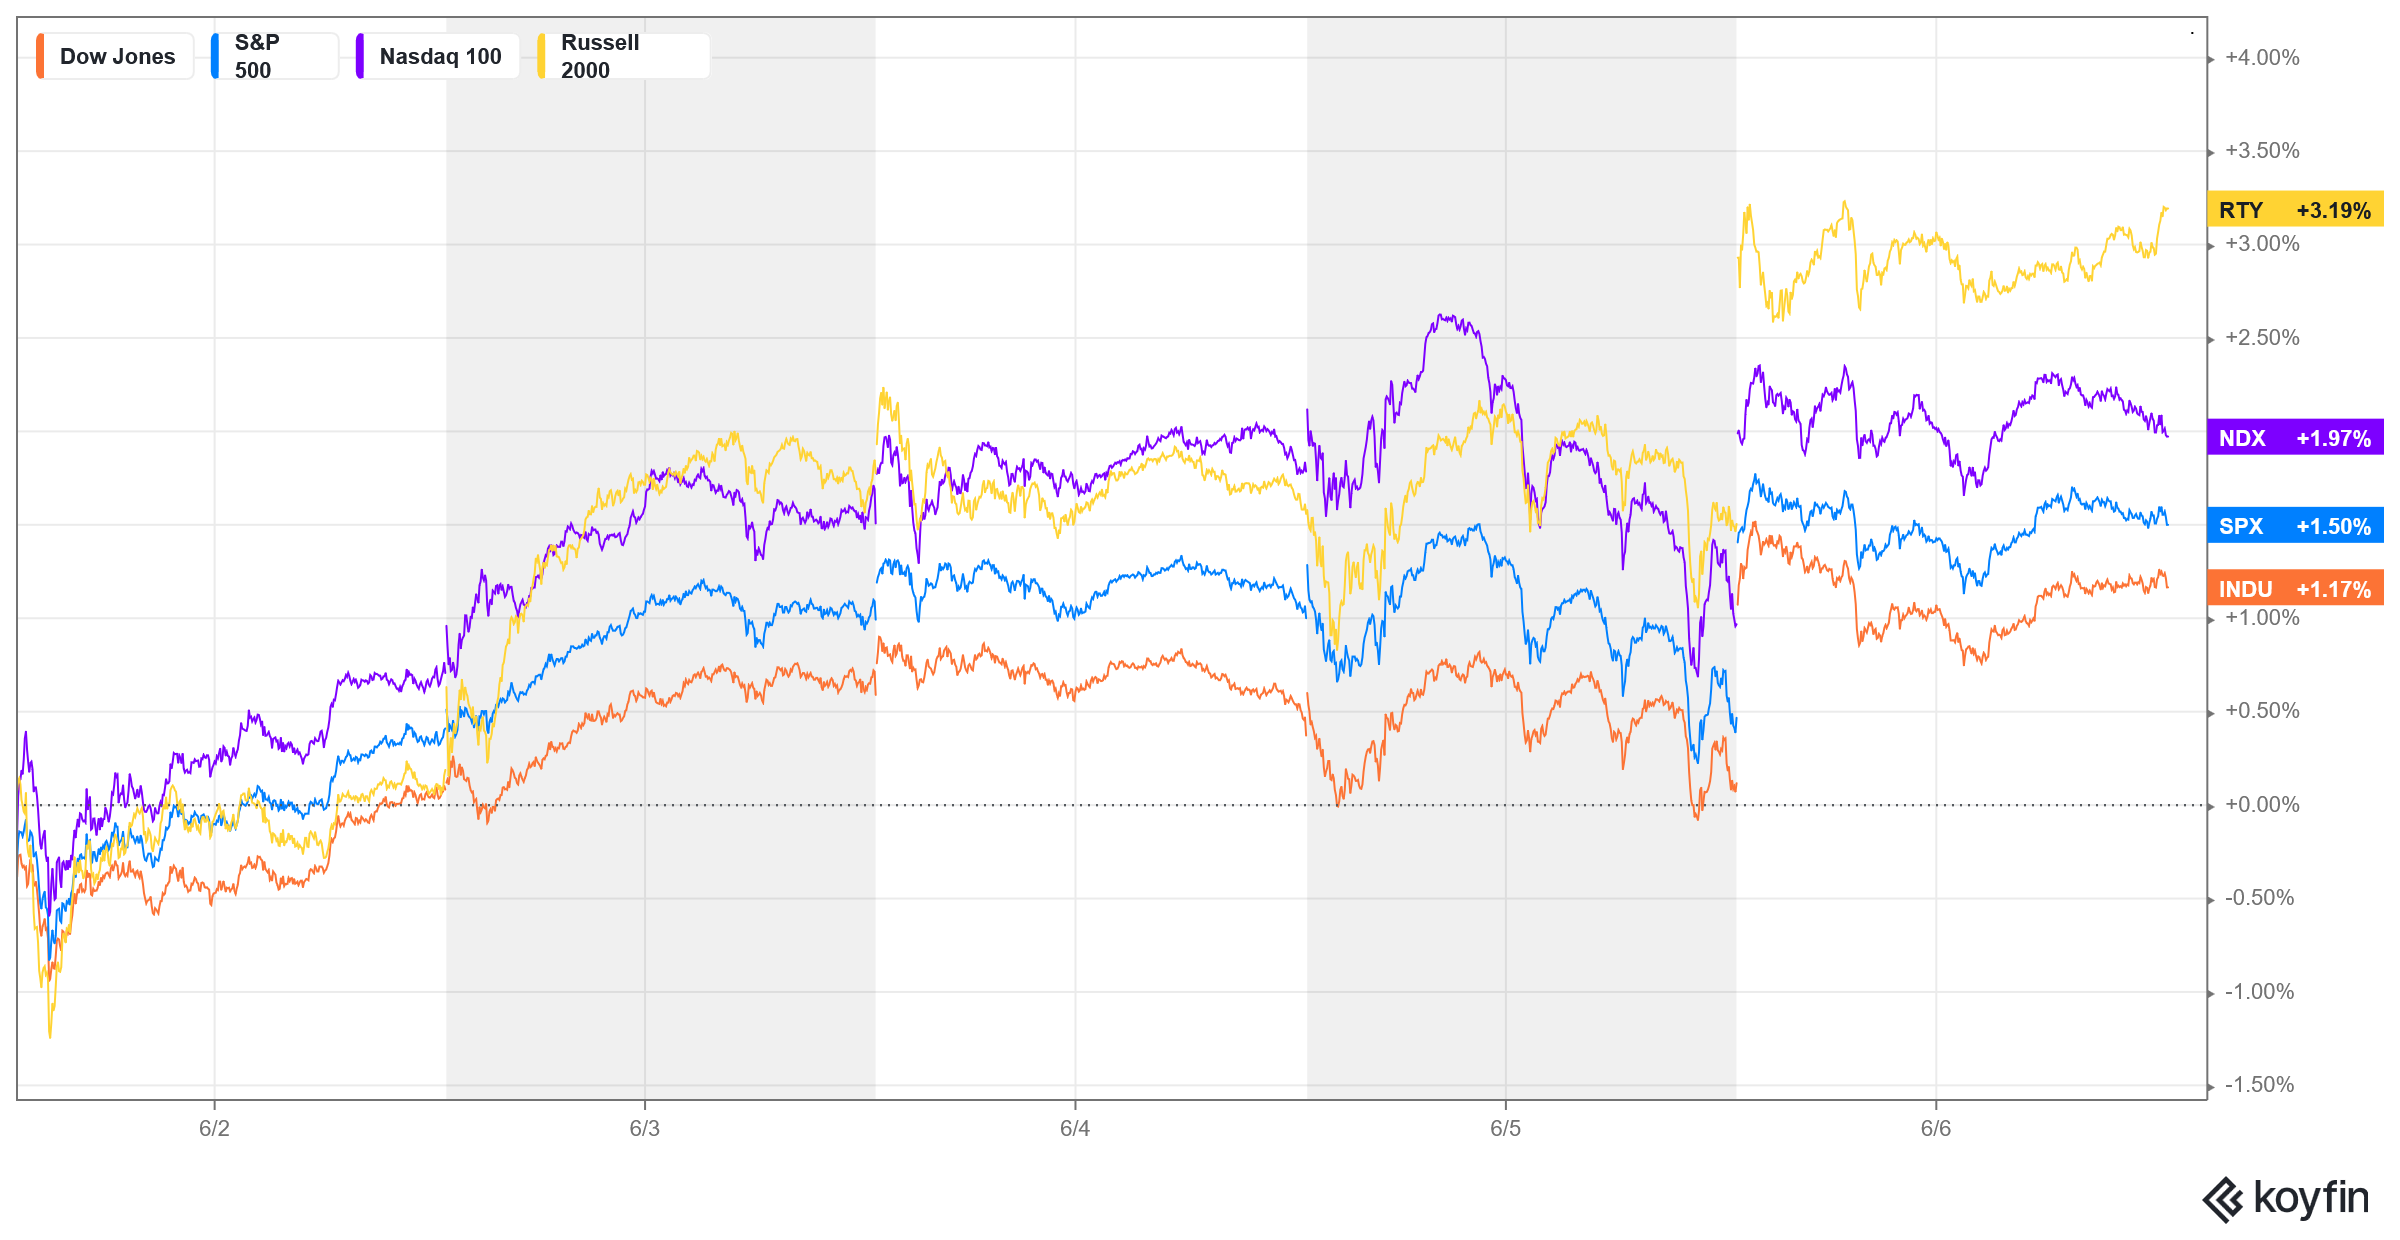
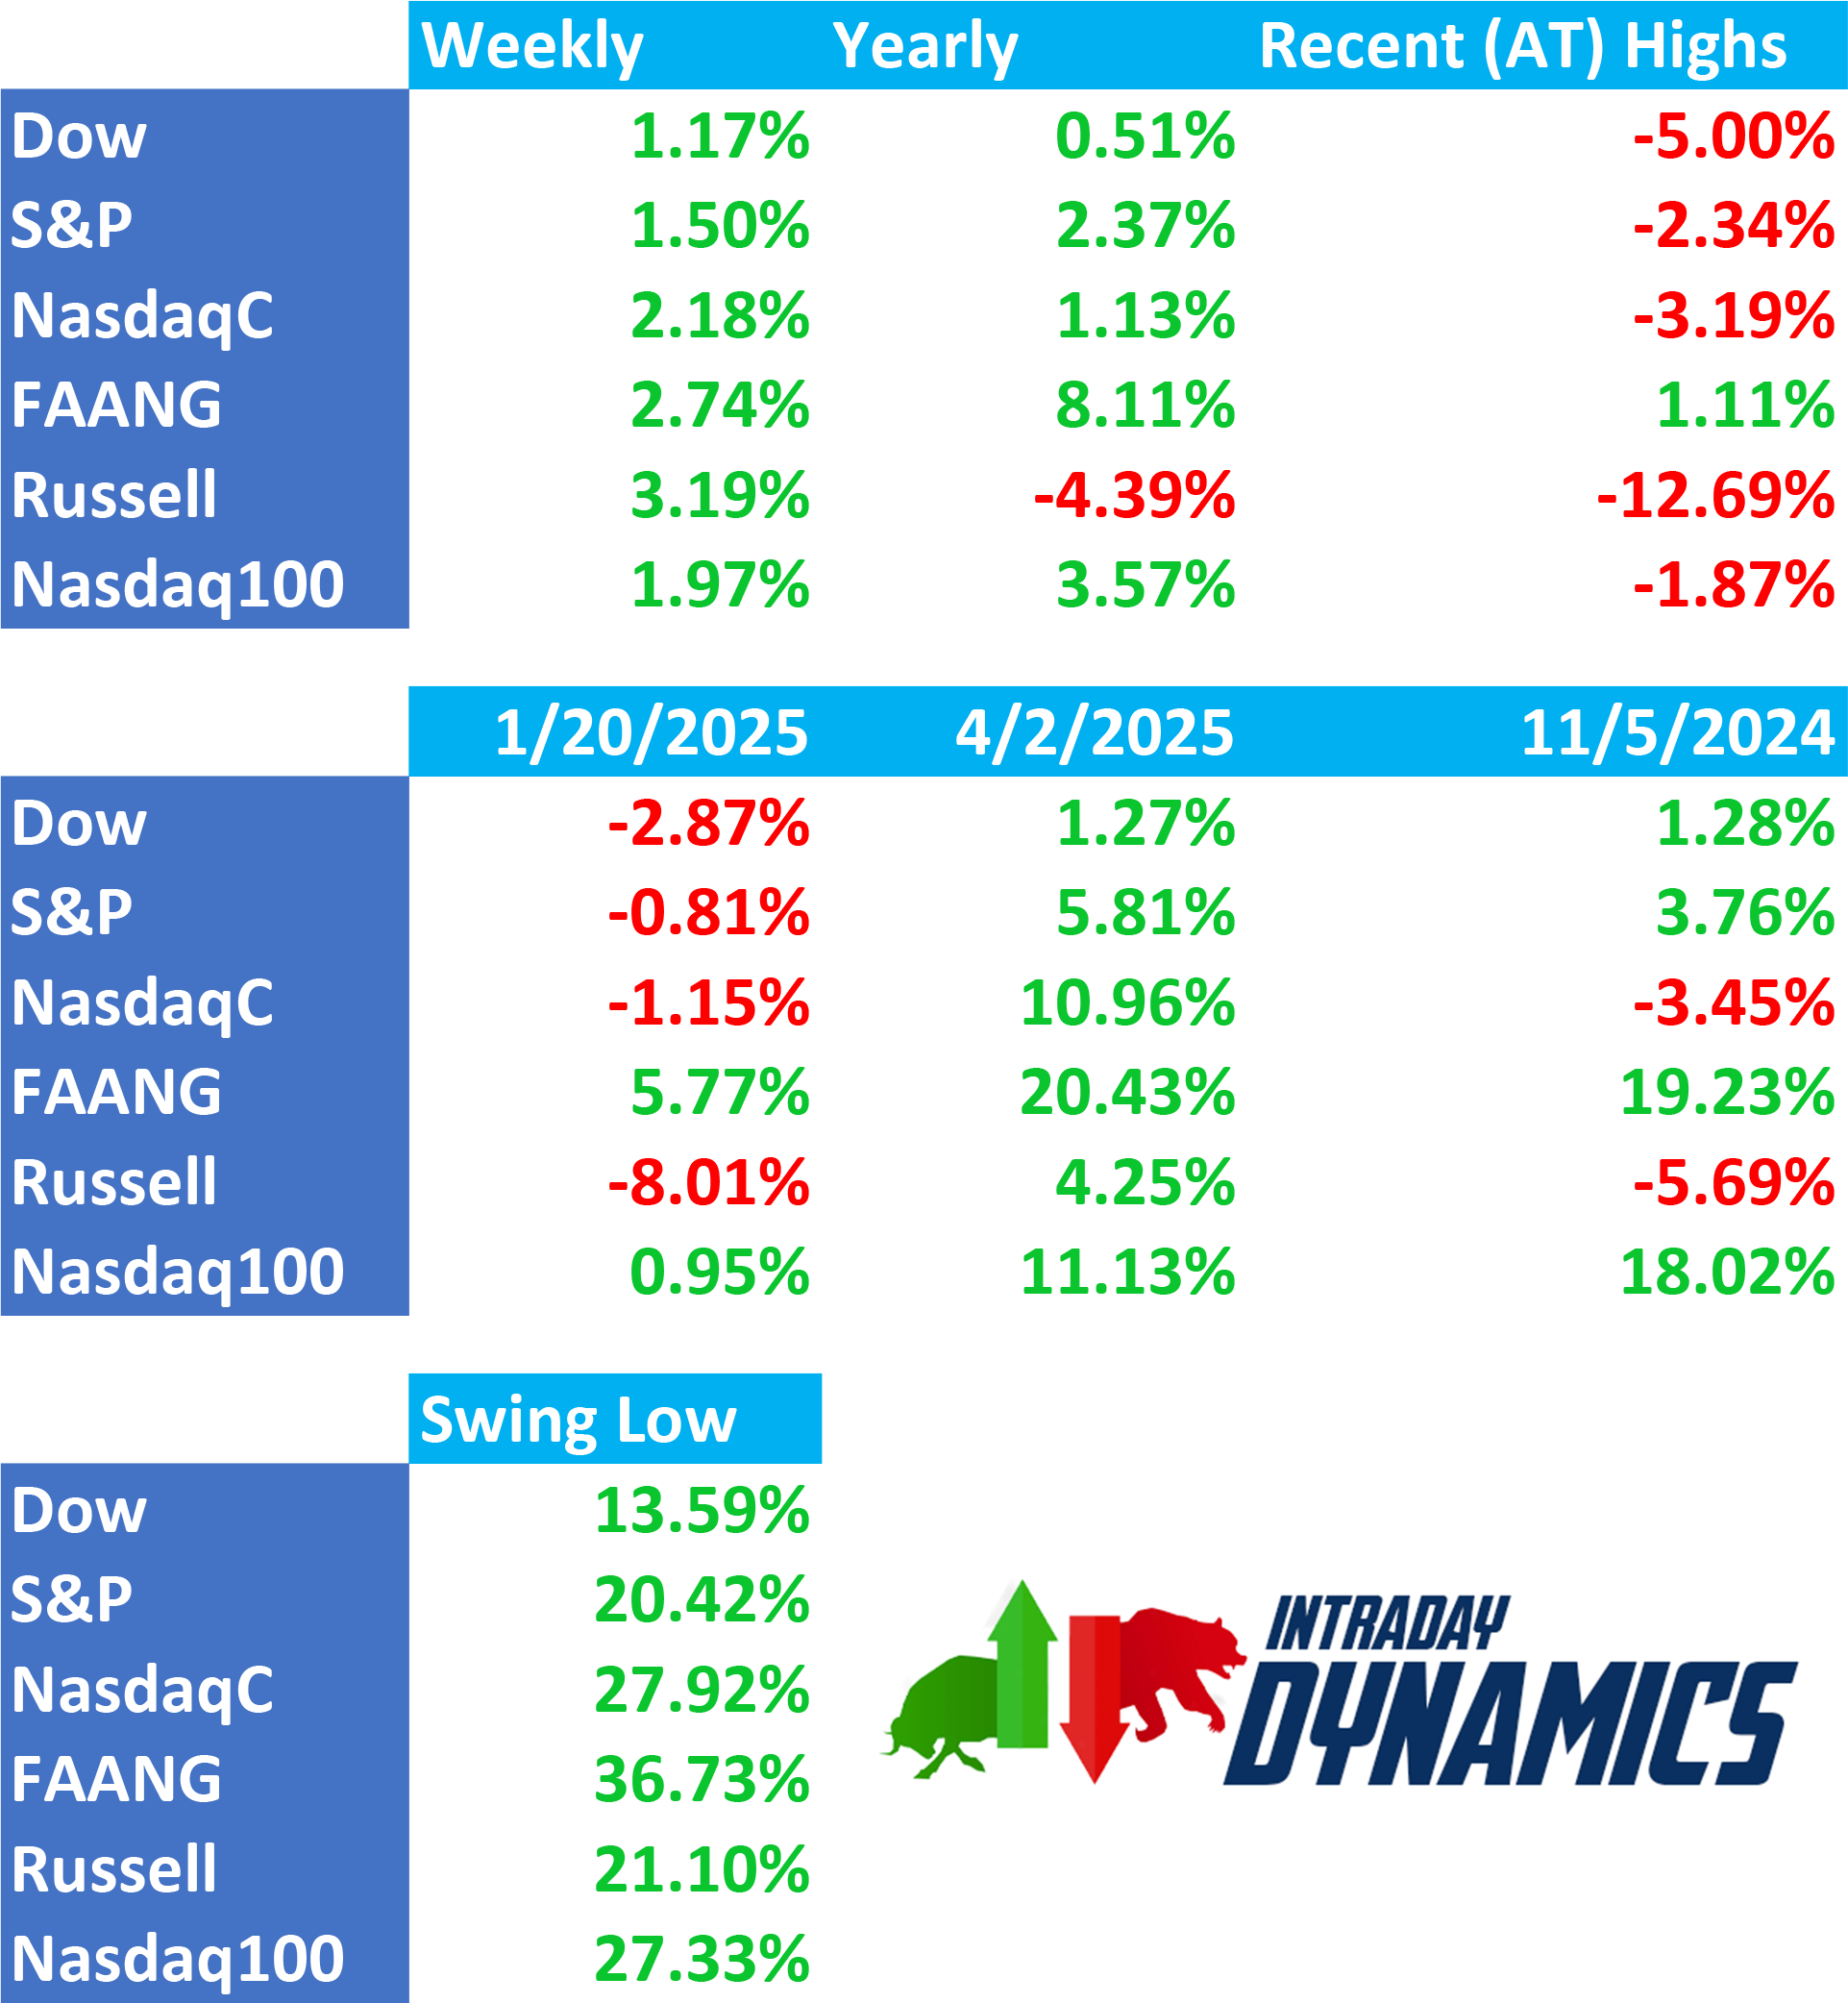
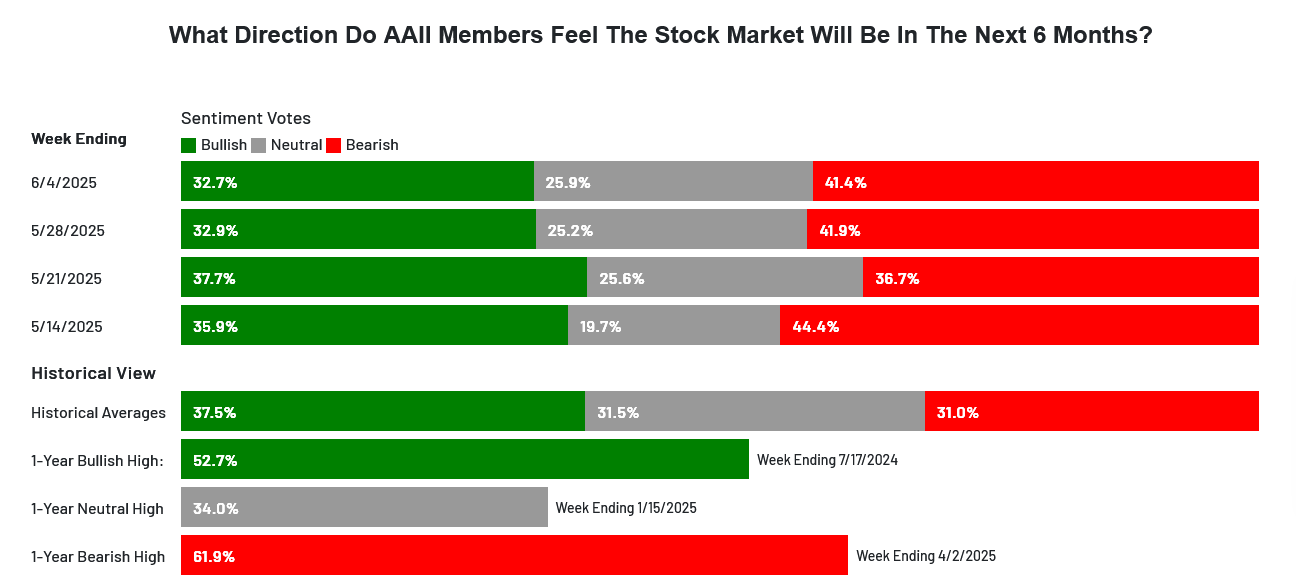 Sentiment remains in greed and extreme greed on several fronts. The CNN Fear and Greed Index moved to 63 and still reads greed. Breadth improved on the week and sentiment reads extreme greed. Latest AAII Sentiment Survey: Neutral Sentiment Increases. The Dow A/D moved up to 6852 and is near a record high again. The VIX moved lower and closed under 20 and was down -9.69%. The Put/Call sits at 0.71 and reads fear. The 52-week, A/D moved up to +1.65% and reads greed. The Dow closed the week up +1.17%, closing in the upper end of the week’s range. The S&P ended up +1.50% in the upper end of the week’s range. The Nasdaq Composite was up +2.18% and the Nasdaq 100 was up +1.97%. The NYSE FANG was the strongest again, closing up +2.74% at a new ATH. The Russell was up +3.19% on the top of an outside week’s range. The 10-year notes plunged late in the week and closed on the bottom of a reversal range. The yield on the 10YR increased to 4.506%.
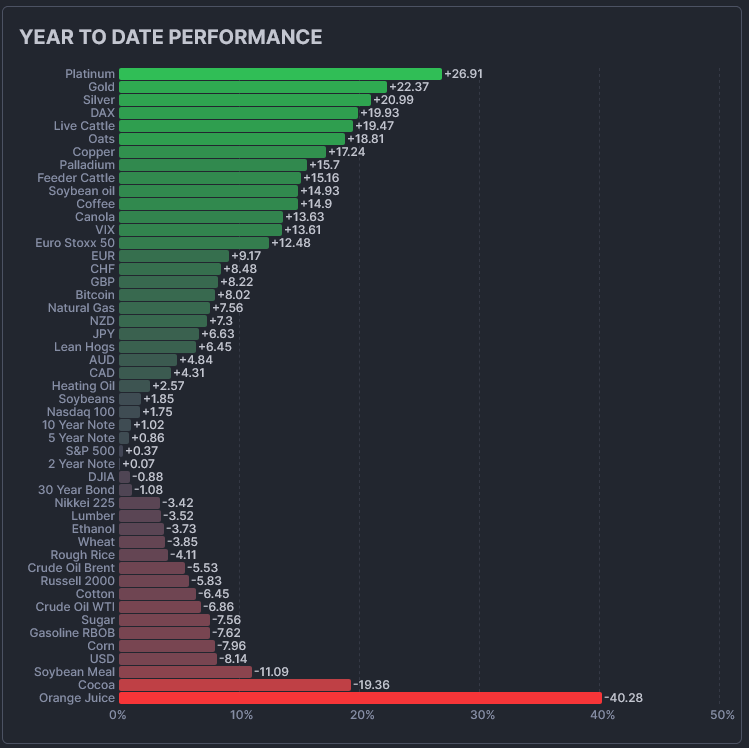
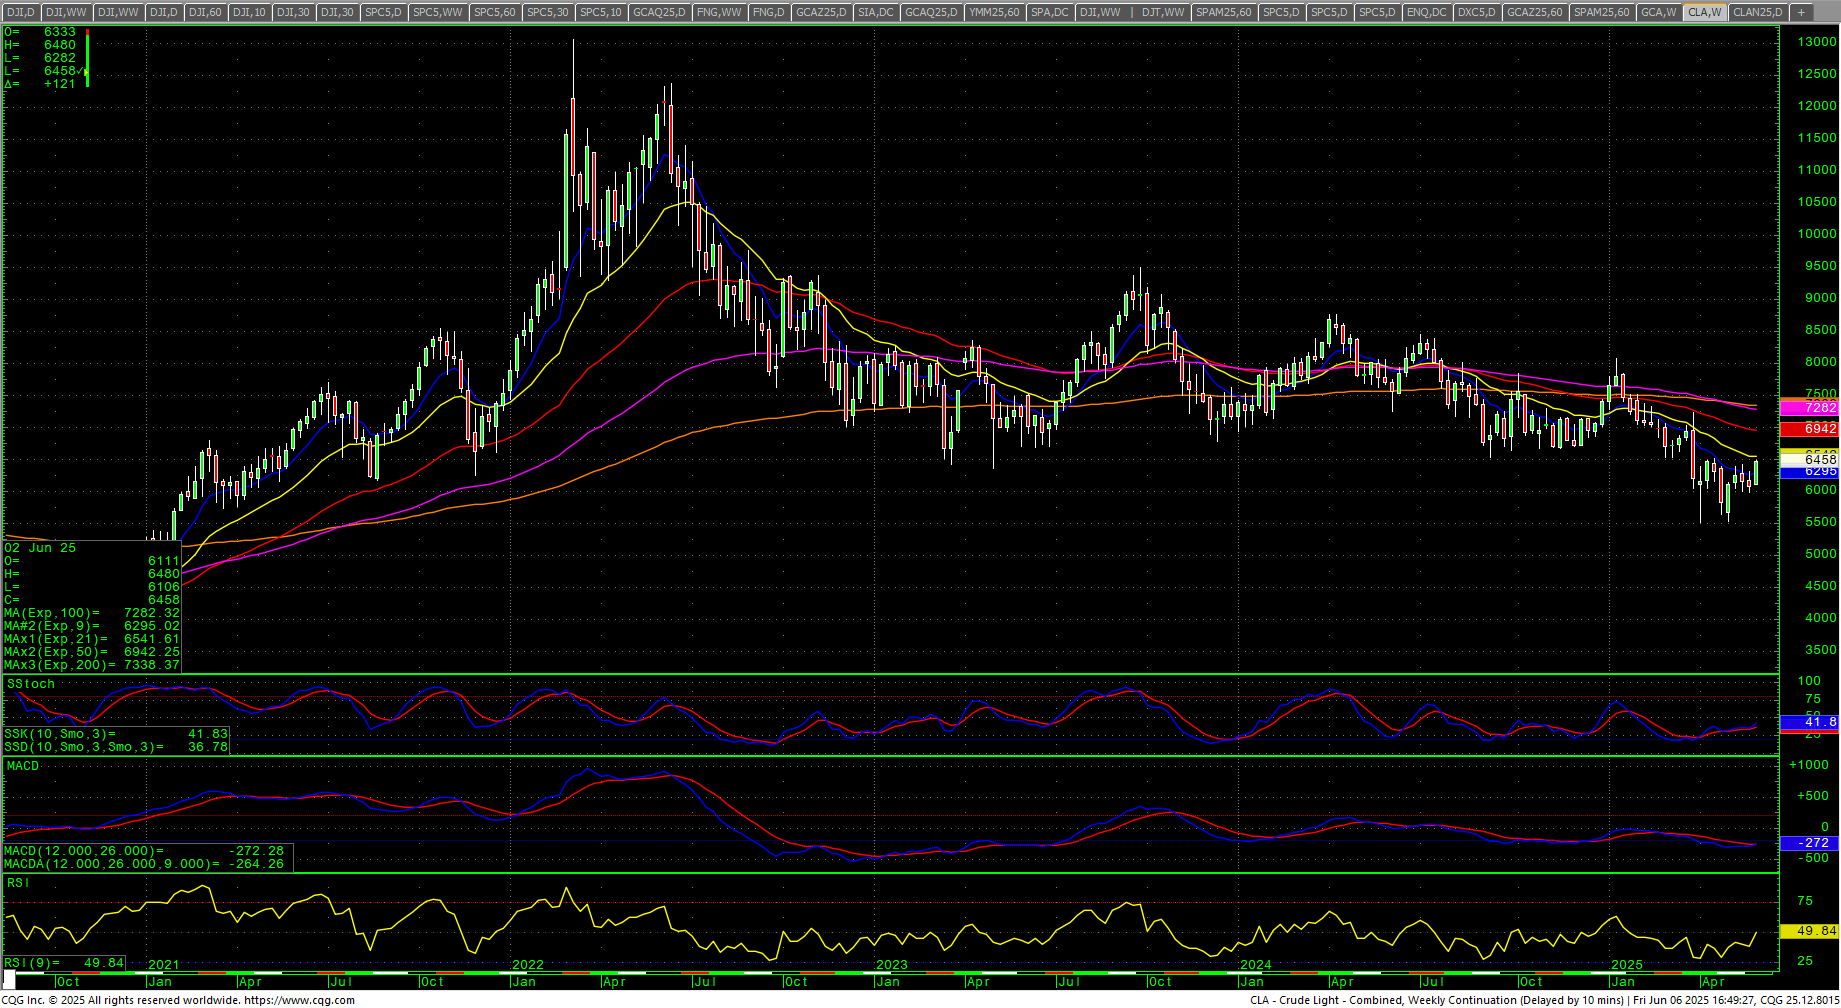
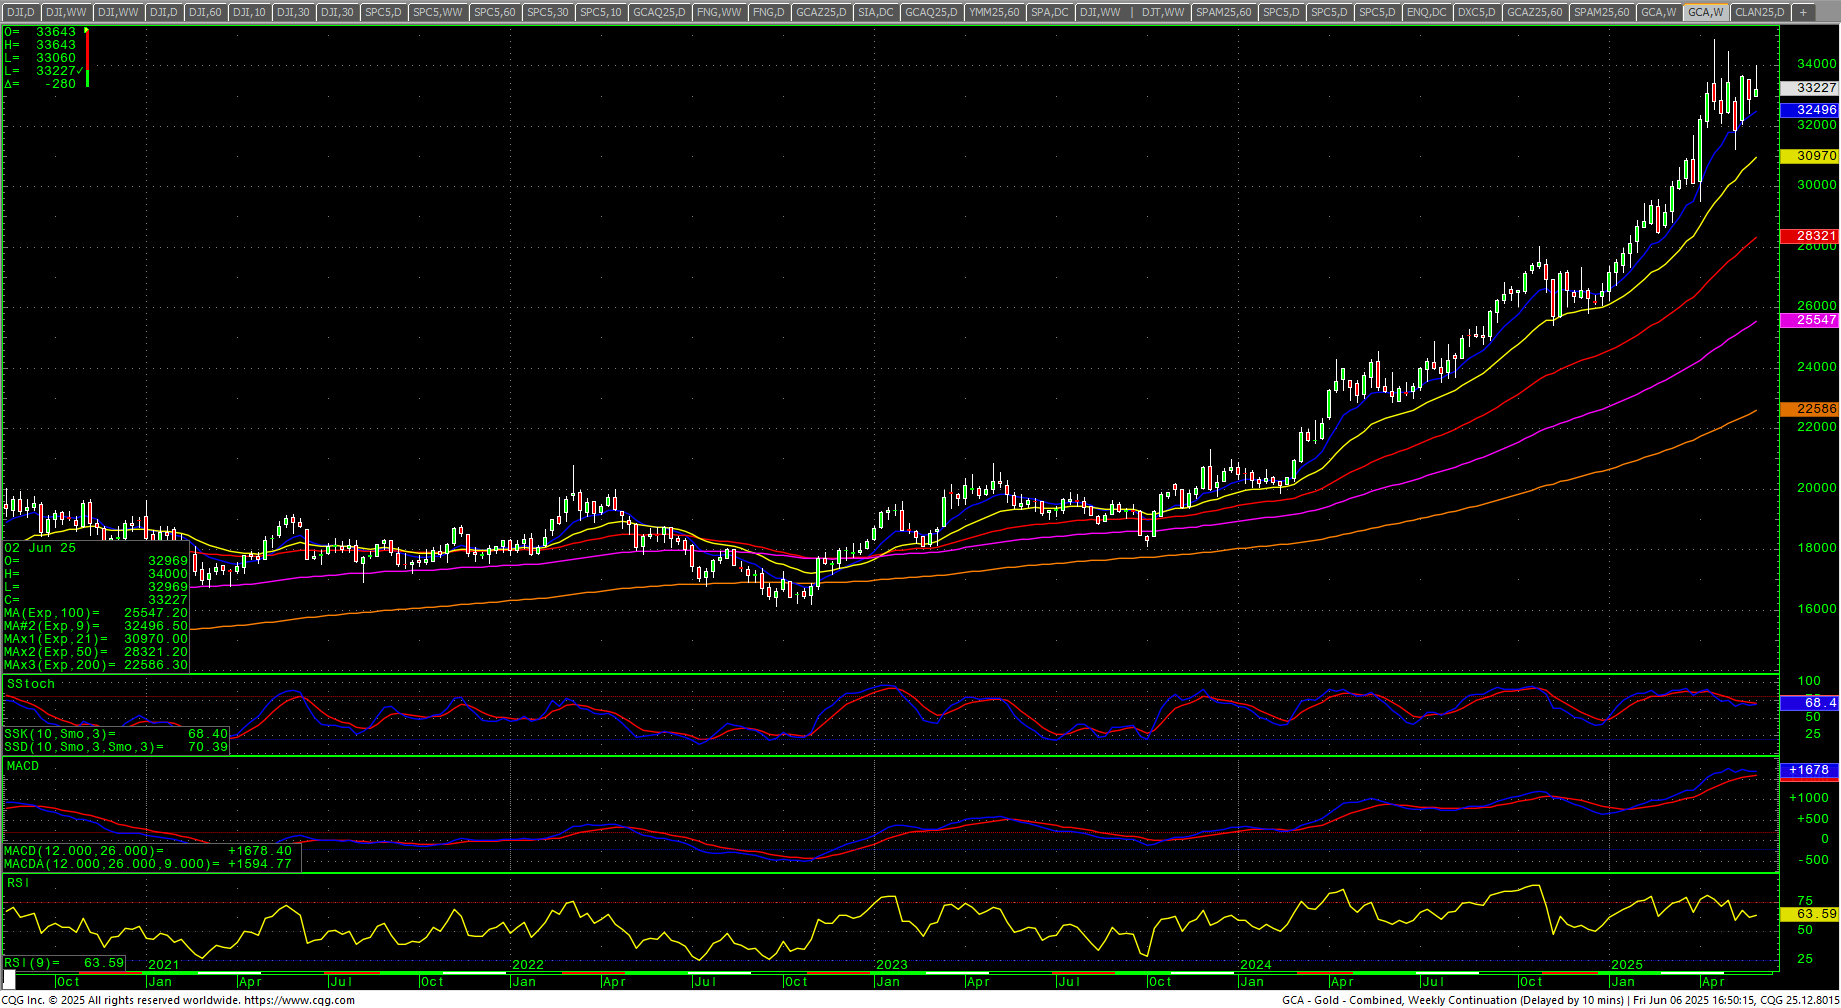
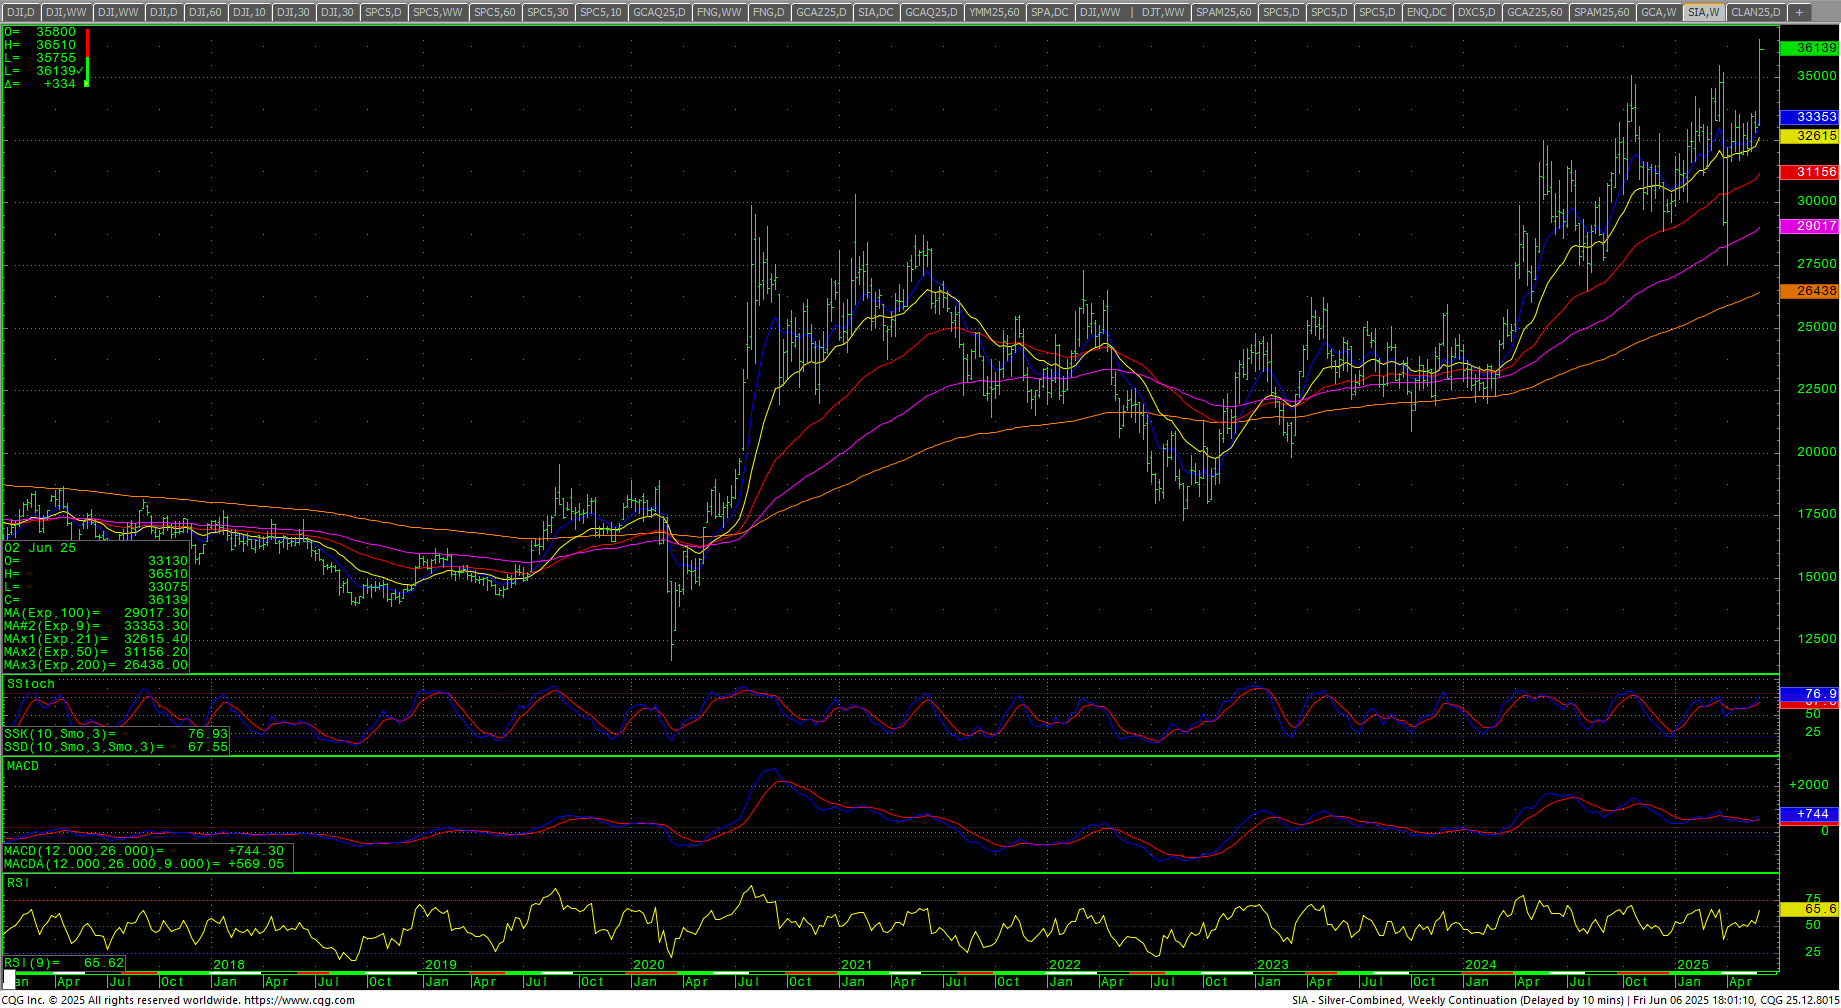
The CRB Index jumped +2.78%. Crude oil rallied sharply and closed on the week’s high at the highest weekly close since 14 April 2025. Gold closed higher but in the bottom of the weekly range but Silver exploded to new highs for the move and closed above the $36 level, up over +9% on the week. The CoT for the S&P 500 saw slight movement up for non-commercials while asset managers are flat. The CFTC S&P 500 Non-Commercial Net Positions moved up to end at -69.4K.
Timing Points
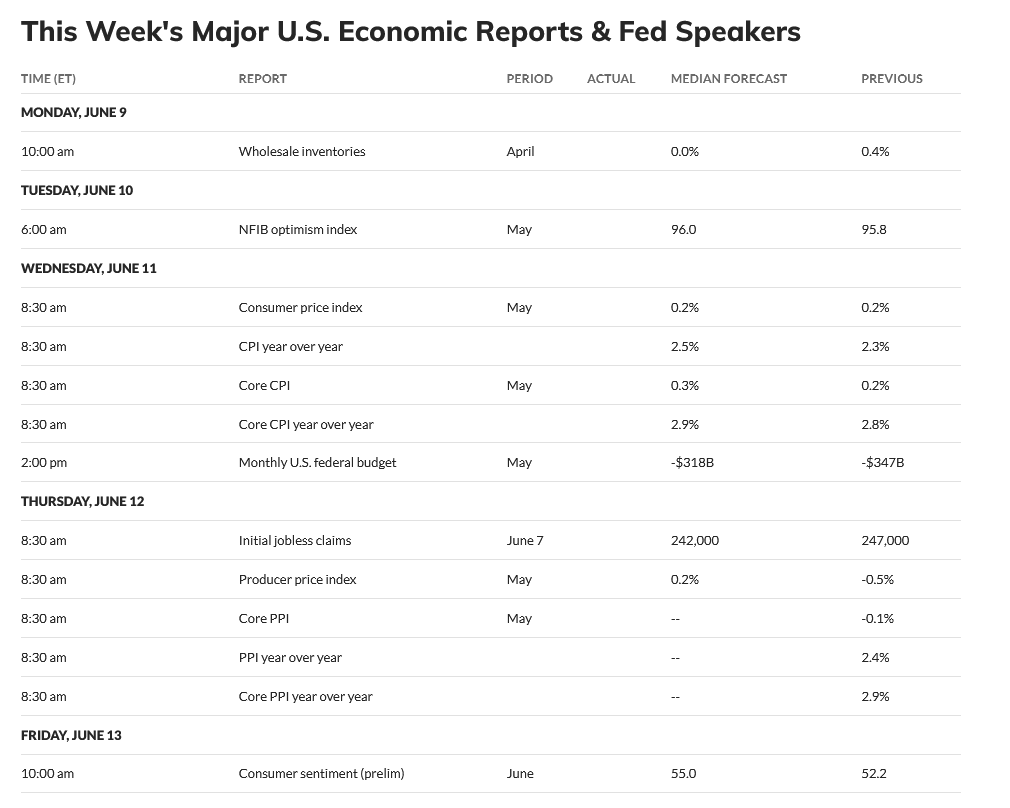
Today marks critical cycle timing with focus on the bonds and the Dollar. The 16th to the 18th marks extremely critical timing with potential for volatility extremes. Wednesday is CPI and Core CPI (est: +0.2%/+0.3%/YOY +2.9%). Thursday is PPI and Core PPI (est: +0.02%).
Long Term Timing Thoughts
“It is looking more and more, from a cycles standpoint, that this will run well into Q4 2025/Q2 2026. Thus, a much more protracted and drawn-out bear and not the “flash crash” that everyone has gotten used to over the past two decades. That doesn’t mean we won’t have significant rallies, but chasing rallies is likely to be a losing strategy until this thing is spent…which very likely will not be until Q1/Q2 2026 at this point. The BIG focus will be late summer and fall of 2025…particularly late September this year.”
- 06/09 *** X bonds/interest rates/dollar
- 06/16-18 *** X critical, volatility/volume/wide ranges/extremes
Dow Jones Industrial Average
Dow Jones Industrial Average Weekly H-L-C
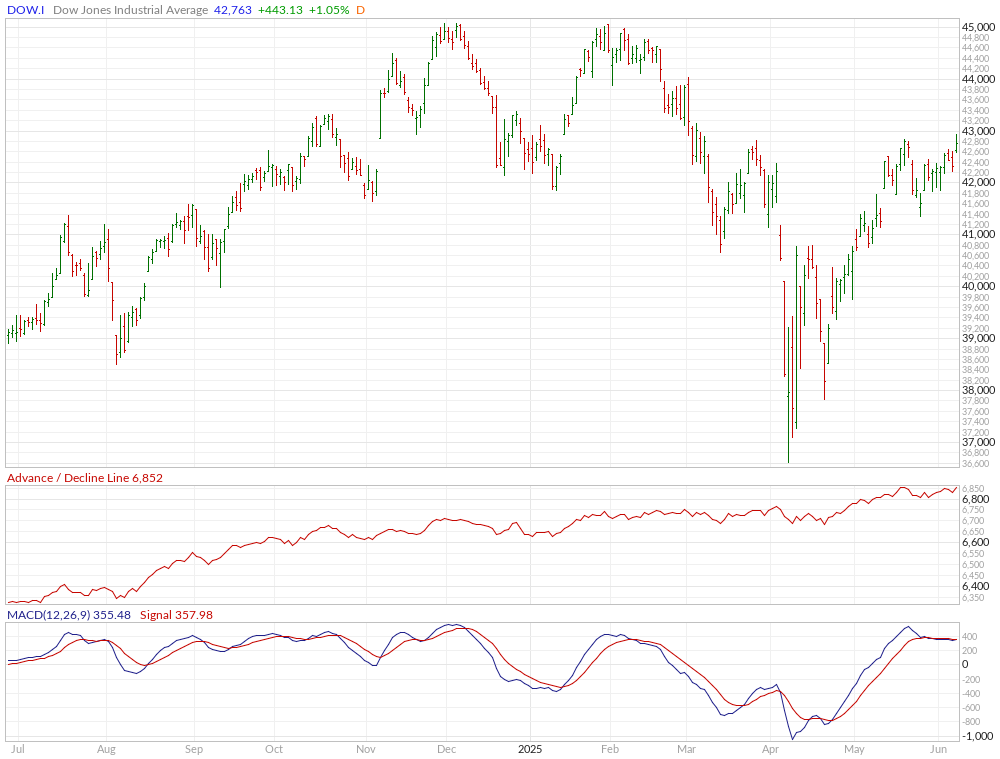
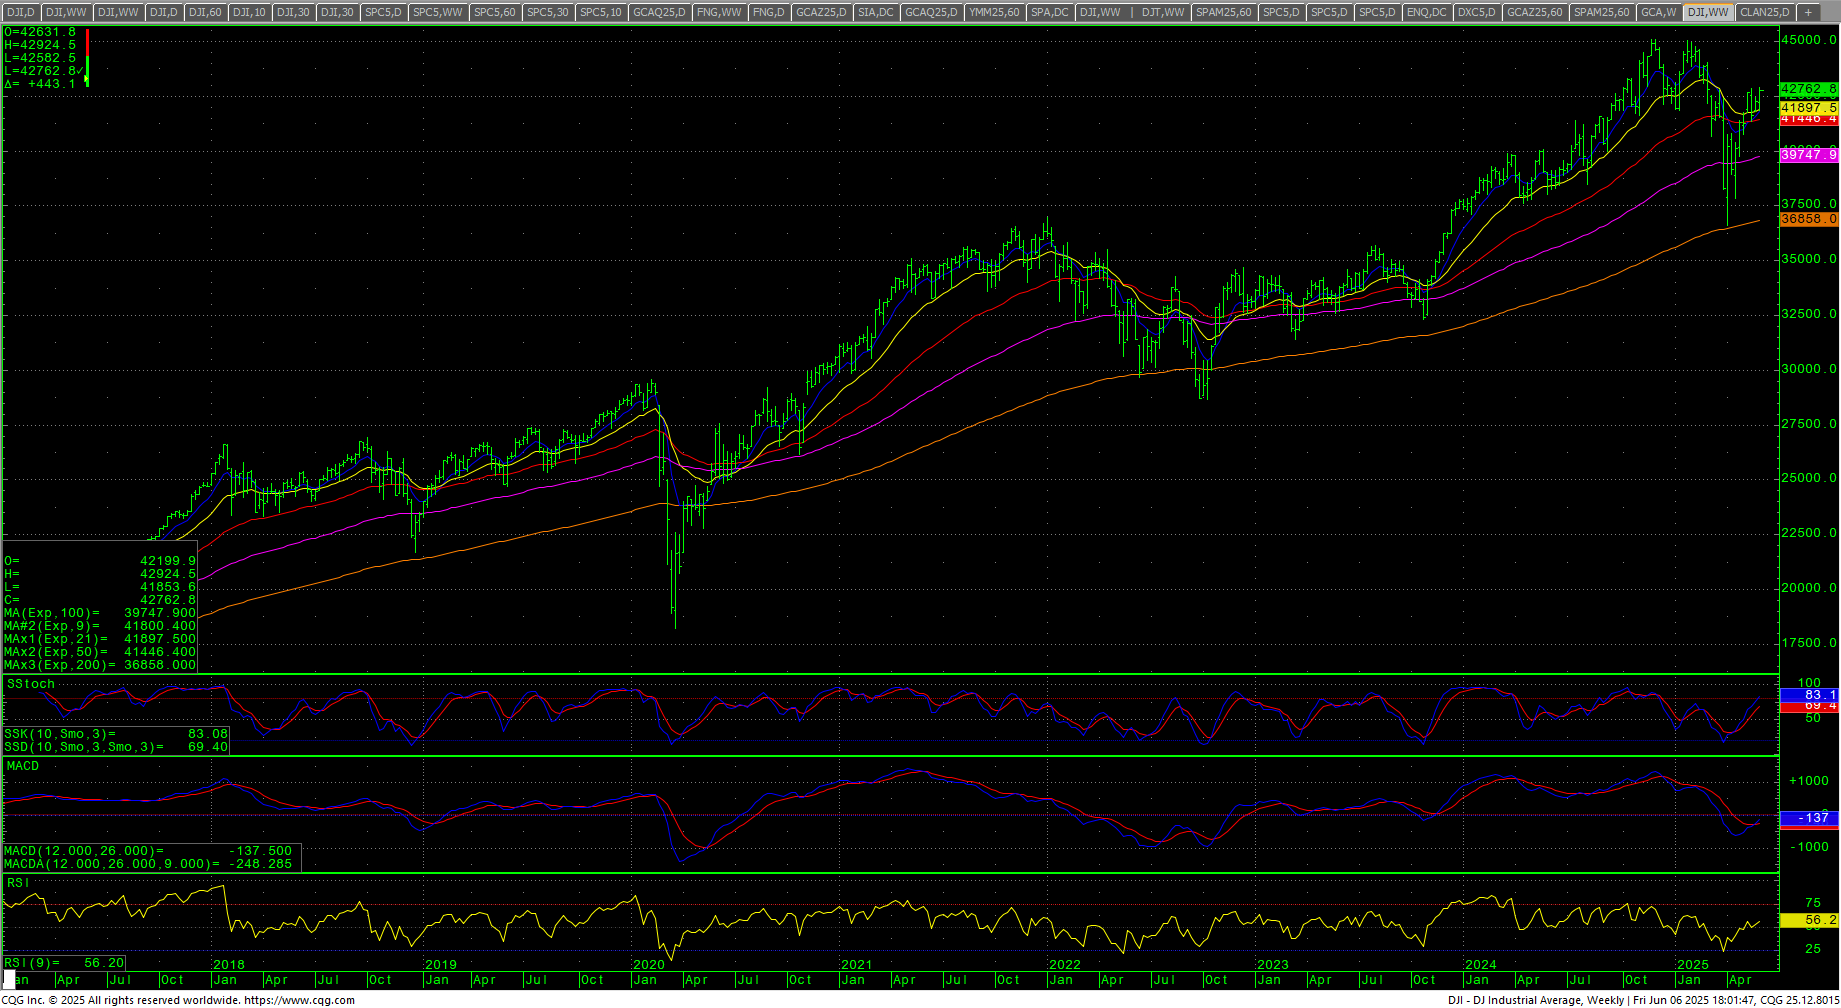 The Dow closed up +1.17% toward the upper end of the week’s range, setting a new weekly high close for the recovery as prices are now testing the ‘final’ “Death Zone” from record highs. That zone remains at 42943 through 43061. The 50-day and 200-day MAs have issued a Golden Cross. The weekly stochastics are still in an uptrend. The daily stochastics have hooked back up with a preliminary bearish divergence. The The 200-day MA starts the week at 41695.70 and is trending higher.
Dow Jones Industrial Average Daily Candles
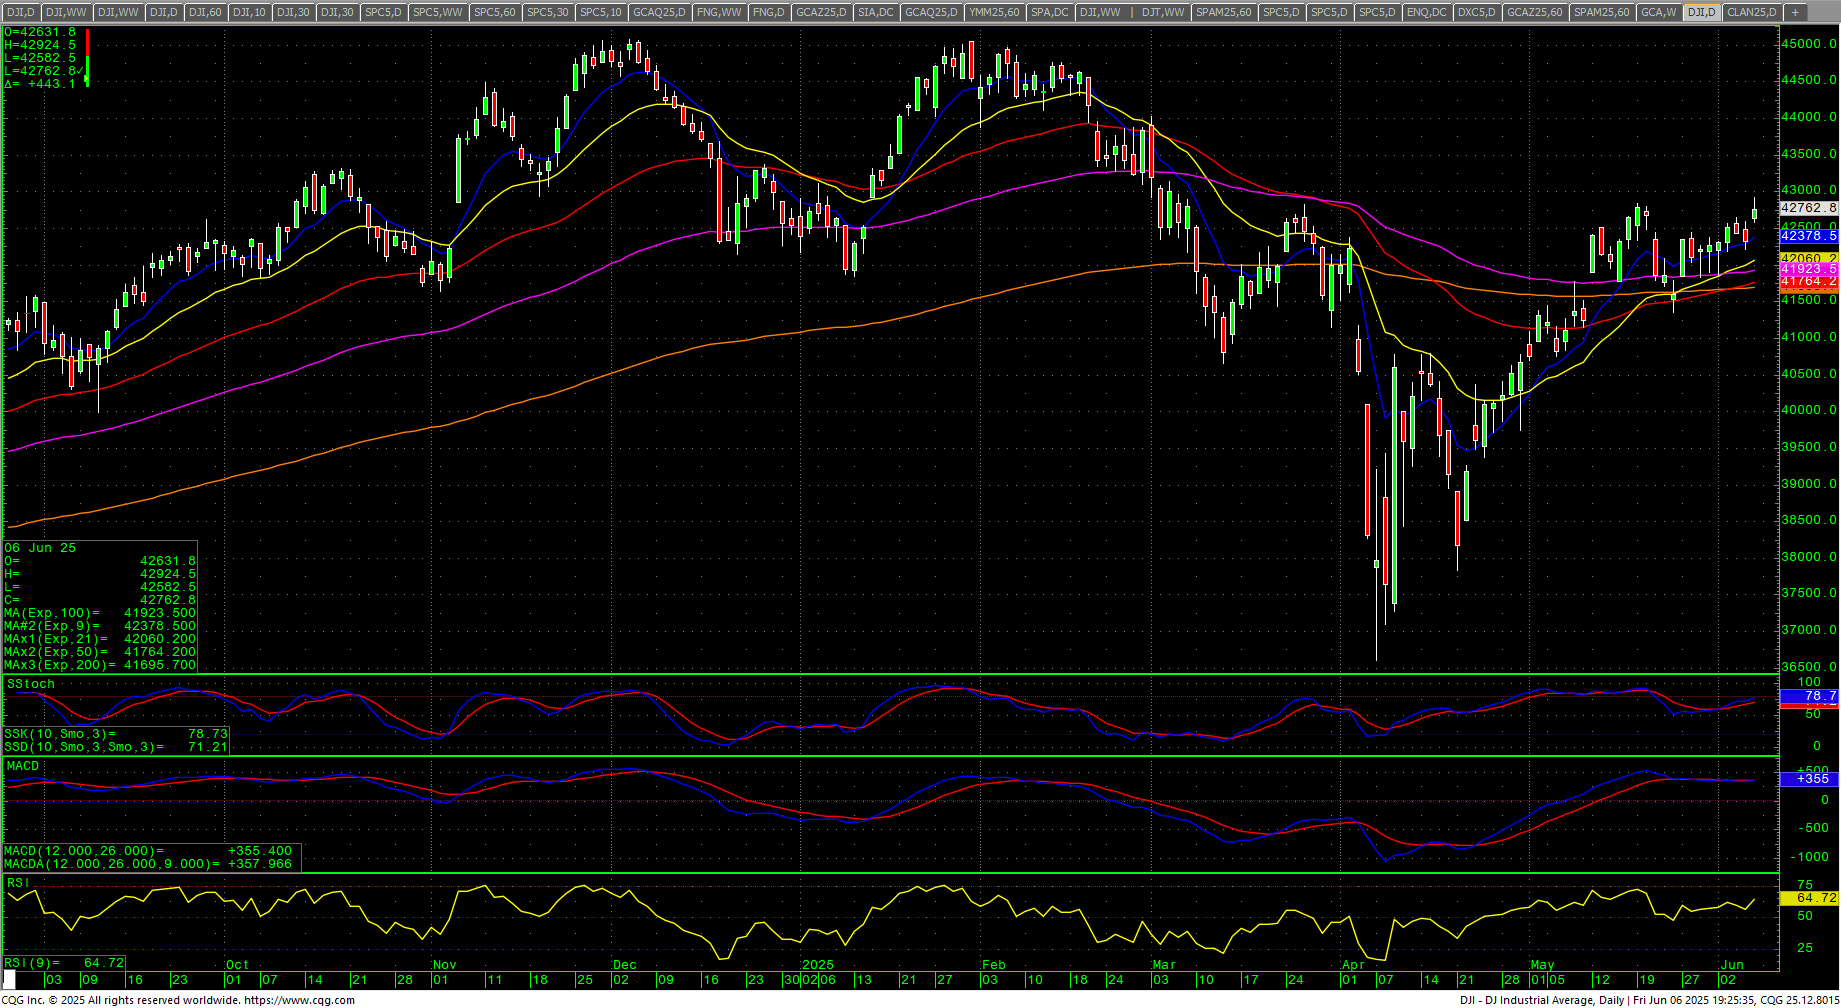 Resistance at critical at 42842 and the Death Zone level at 42943 through 43061 area. Daily closes above 43061 should minimally test 44034 and will open potential for a test of the all-time highs at 45050/45054/45074. Closes over 45074 opens counts toward 45244 and 45426 (Fibonacci target). Rallies with closes over 45426 will reopen longer-term monthly targets in the 47400 level with targets of 46568 and 46954.
Dow Jones Industrial Average Hourly H-L-C
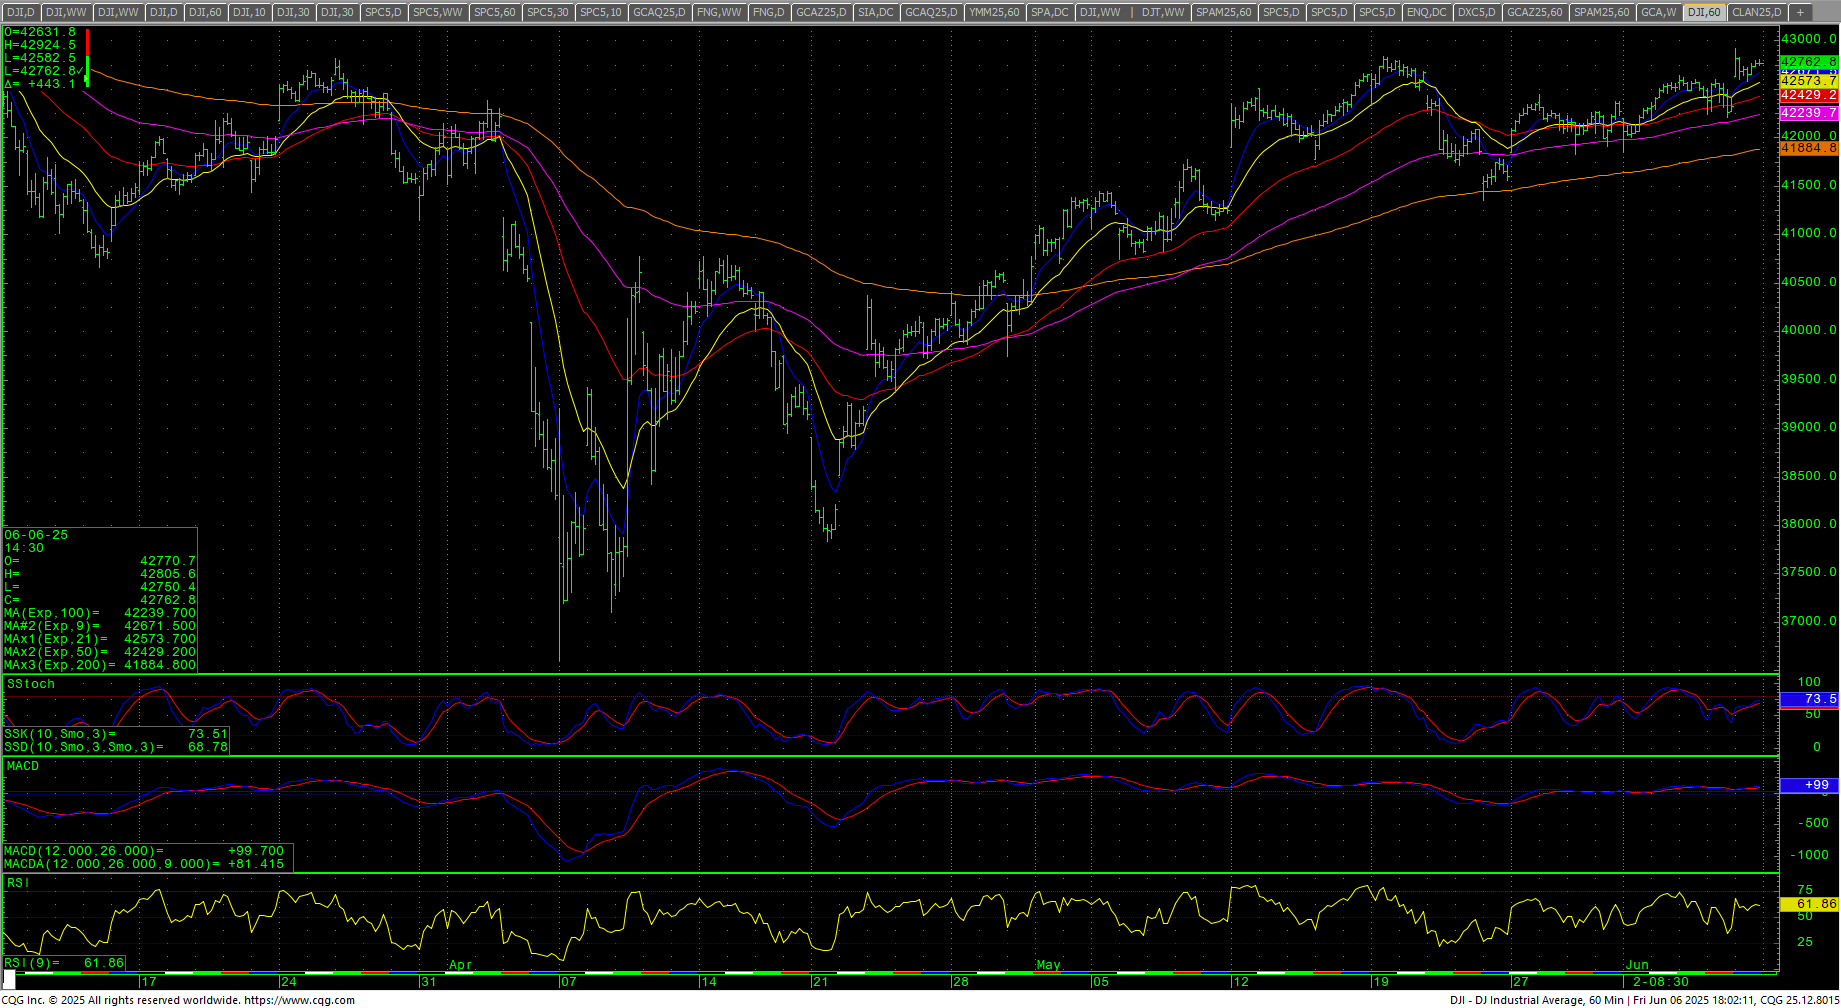 The hourly is slightly overbought on Friday’s close with multiple bearish divergences. Support is 42553 and 42324. Under 42324 sets up 42139 with counts to pivotal near-term support at 41953/41950. Closes under 41950 sets up 41434/41354. A breakdown under the 41354 area will set up 40513. Closes under 40513 are near-term bearish for test of 39768/39745. Closes under 39745 offer full counts to pivotal short-term support of 39023/39020. A breakdown under 39020 are bearish for a test of 38189 through 38101. Closes below 38101 should minimally test 37828 and would open counts to retest the 36611 low with support at 37103.
| Resistance | Support |
|
|
S&P 500 Cash Index: SPX
S&P 500 Index Weekly H-L-C
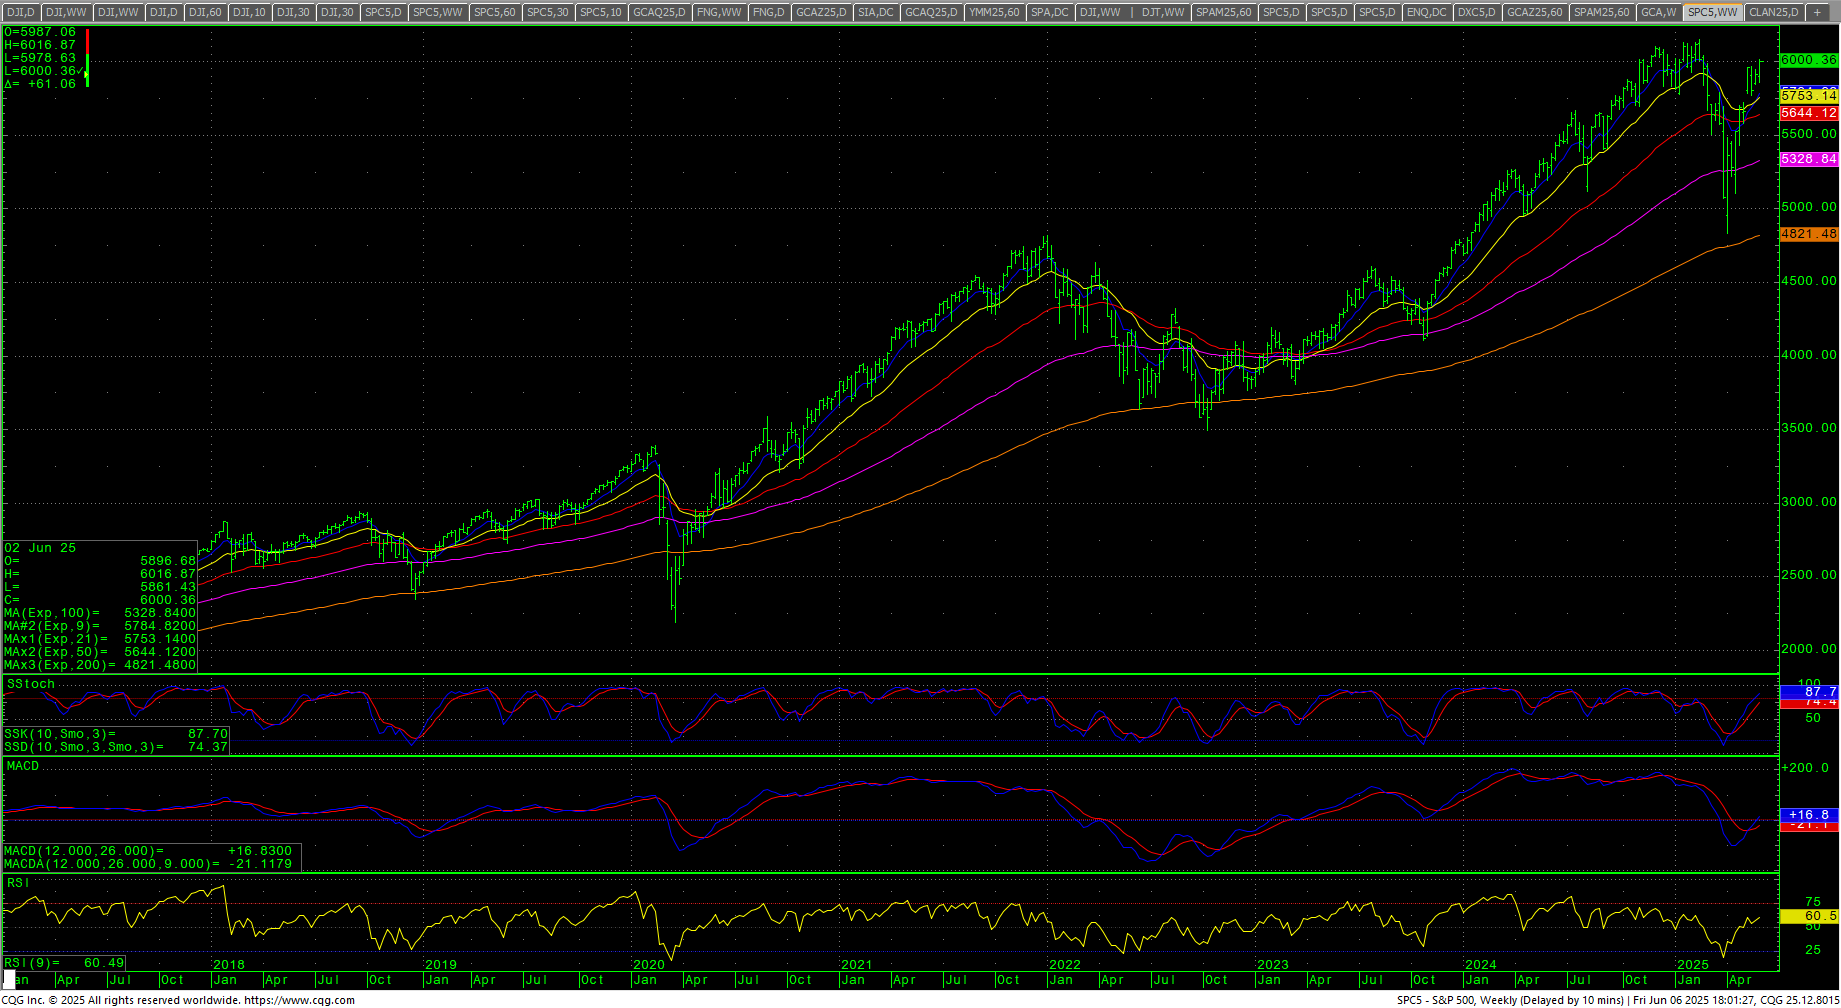 The S&P leapt to new highs for the drive and closed right at the critical 6000 level. The daily chart is now flashing a preliminary bearish divergence with the new highs for the drive. The RSI is in a bearish divergence and the MACD is extremely overbought. The weekly is still in an uptrend. The hourly is slightly overbought on Friday’s move and is also in a preliminary bearish divergence. The 200-day MA is 5687.06 and is trending higher.
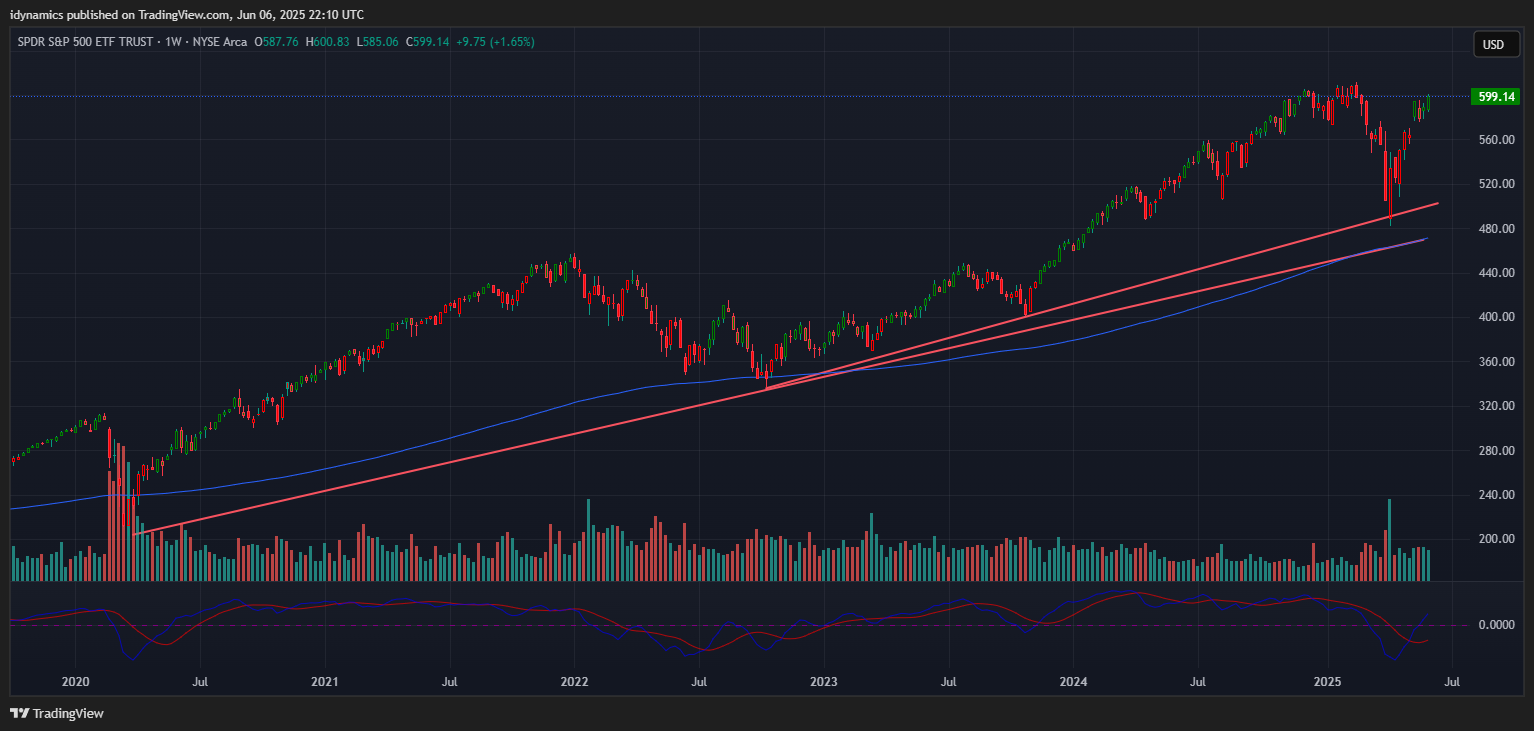
SPY Weekly Candles
 Resistance is 6016/6017 and 6064. A drive over 6043 opens counts to 6112/6114 and full counts into critical resistance at the intraday high of 6147.43. Rallies through 6148 should test 6160 with a shot at a target of 6180.35/6181. Closes over 6181 open counts to 6224 and 6296. Above 6296 can carry to 6368 with counts into the 6440 area. Closes over 6440 will open counts to 6584. A breakout over 6584 sets up 6638 and 6692.
S&P 500 Index Hourly H-L-C
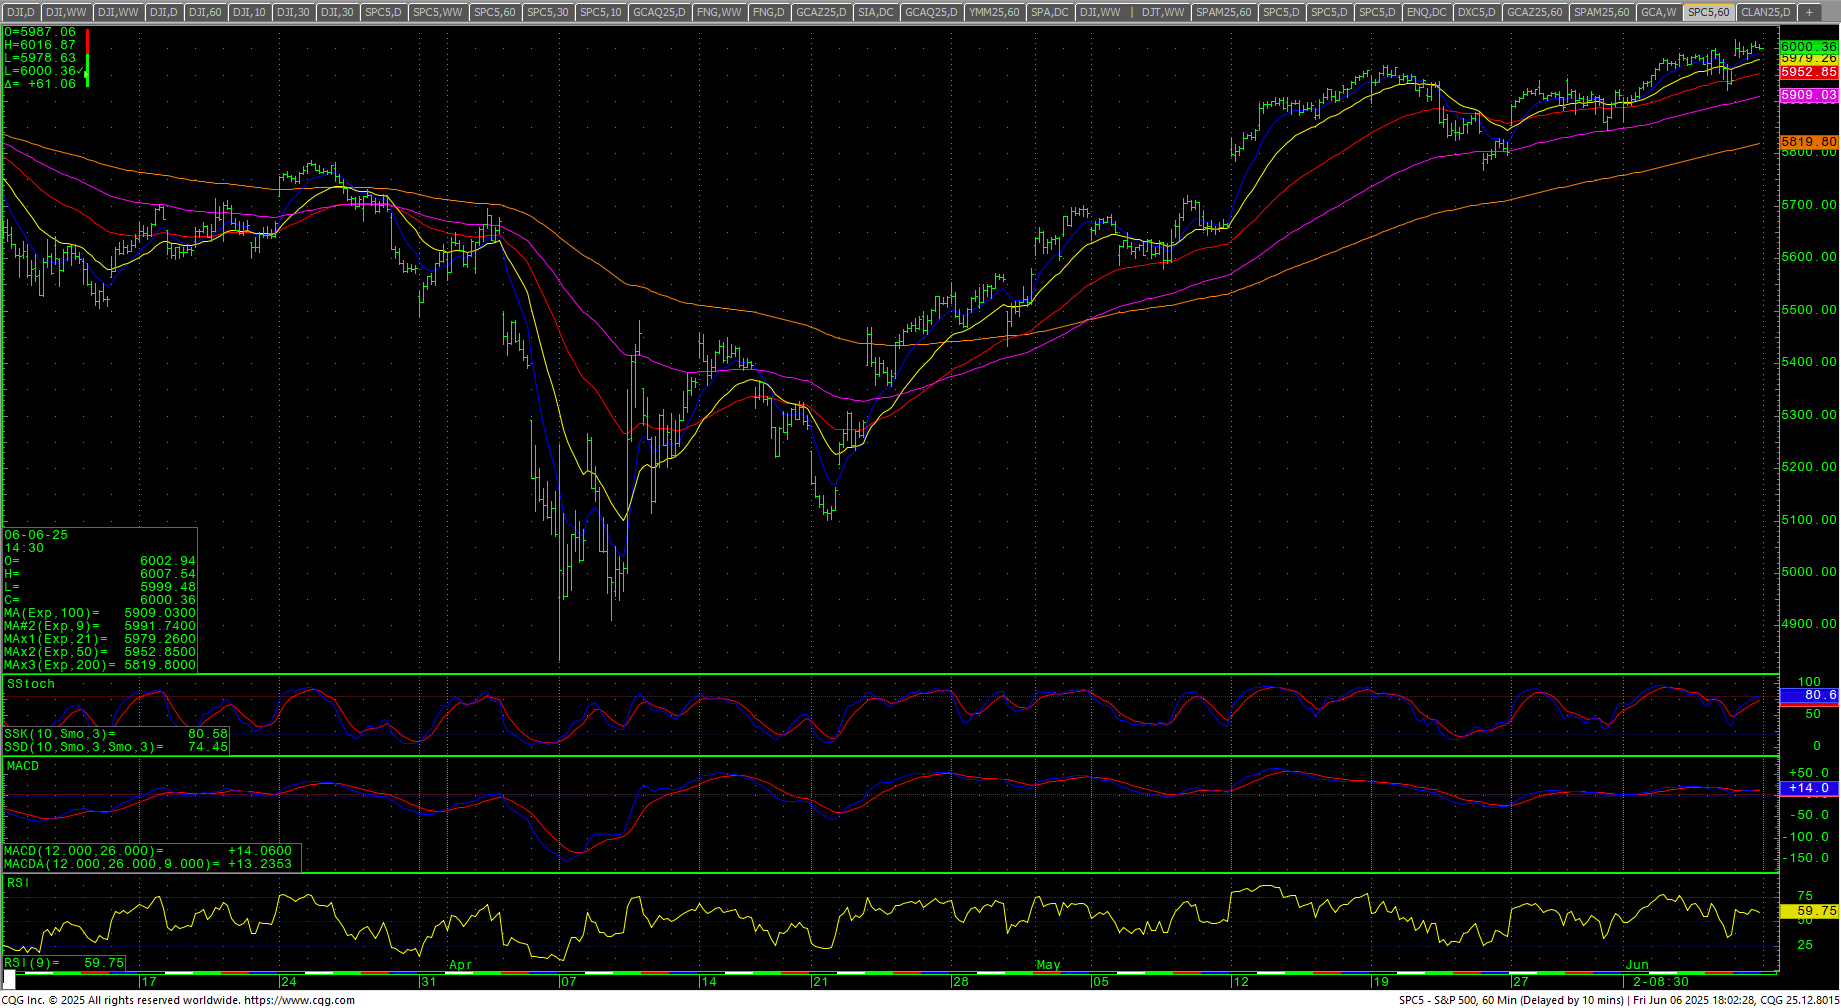 Support is 5957/5955, 5921, 5892 and 5863/5860. A breakdown under 5860 sets up a move to 5737. Closes under 5737 will open counts to 5566/5565. Trading under 5565 opens counts to 5425 with potential to pivotal near-term support at 5287/5284. A breakdown under 5284 sets up 5130/5114 with potential to open intermediate-term counts for a retest of the 4835 swing lows with support still at 4884/4880. Closes under 4880 are bearish and open counts to 4614 through 4586.
| Resistance | Support |
|
|
Charts courtesy of CQG, Inc., CNN, Koyfin, Trading View and AAII