
TECHNICAL ANALYSIS (by Intraday Dynamics)
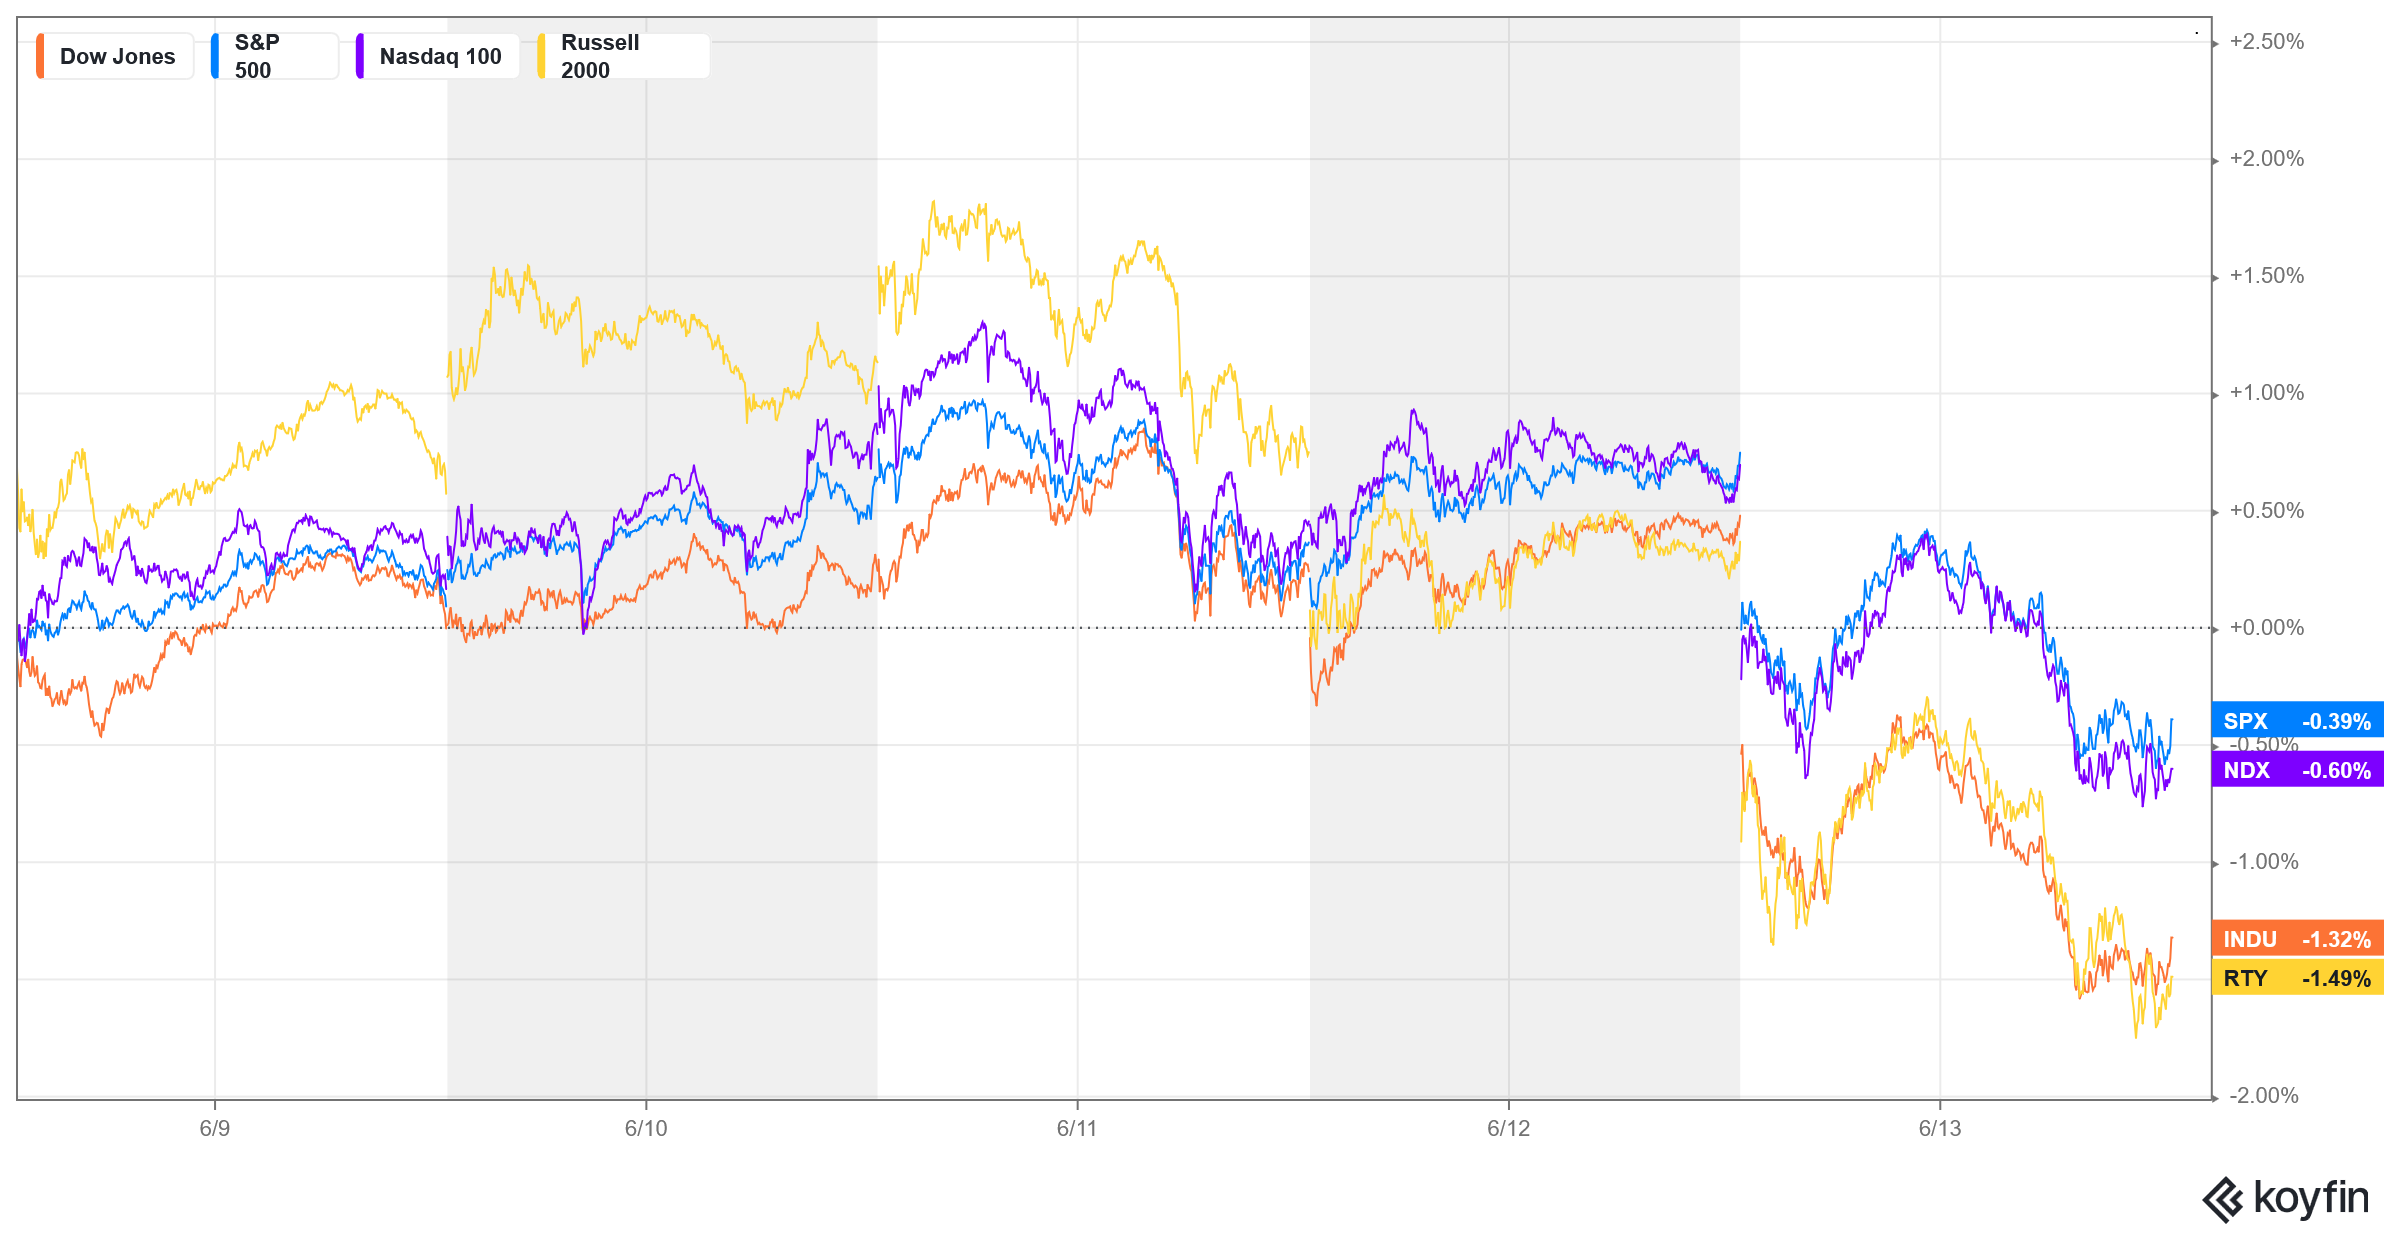
Major Indices Week of June 13, 2025
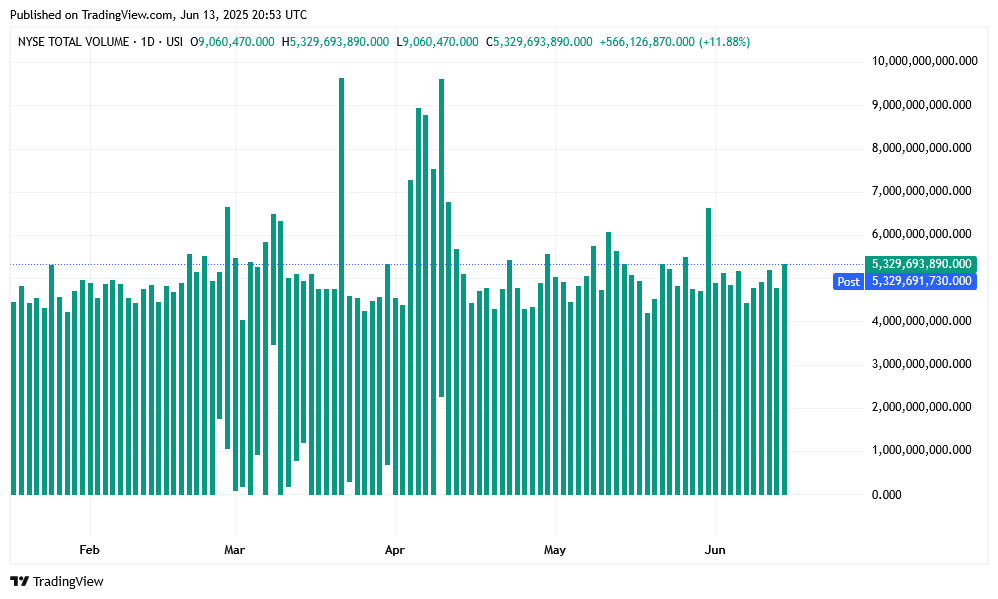
 NYSE Volume

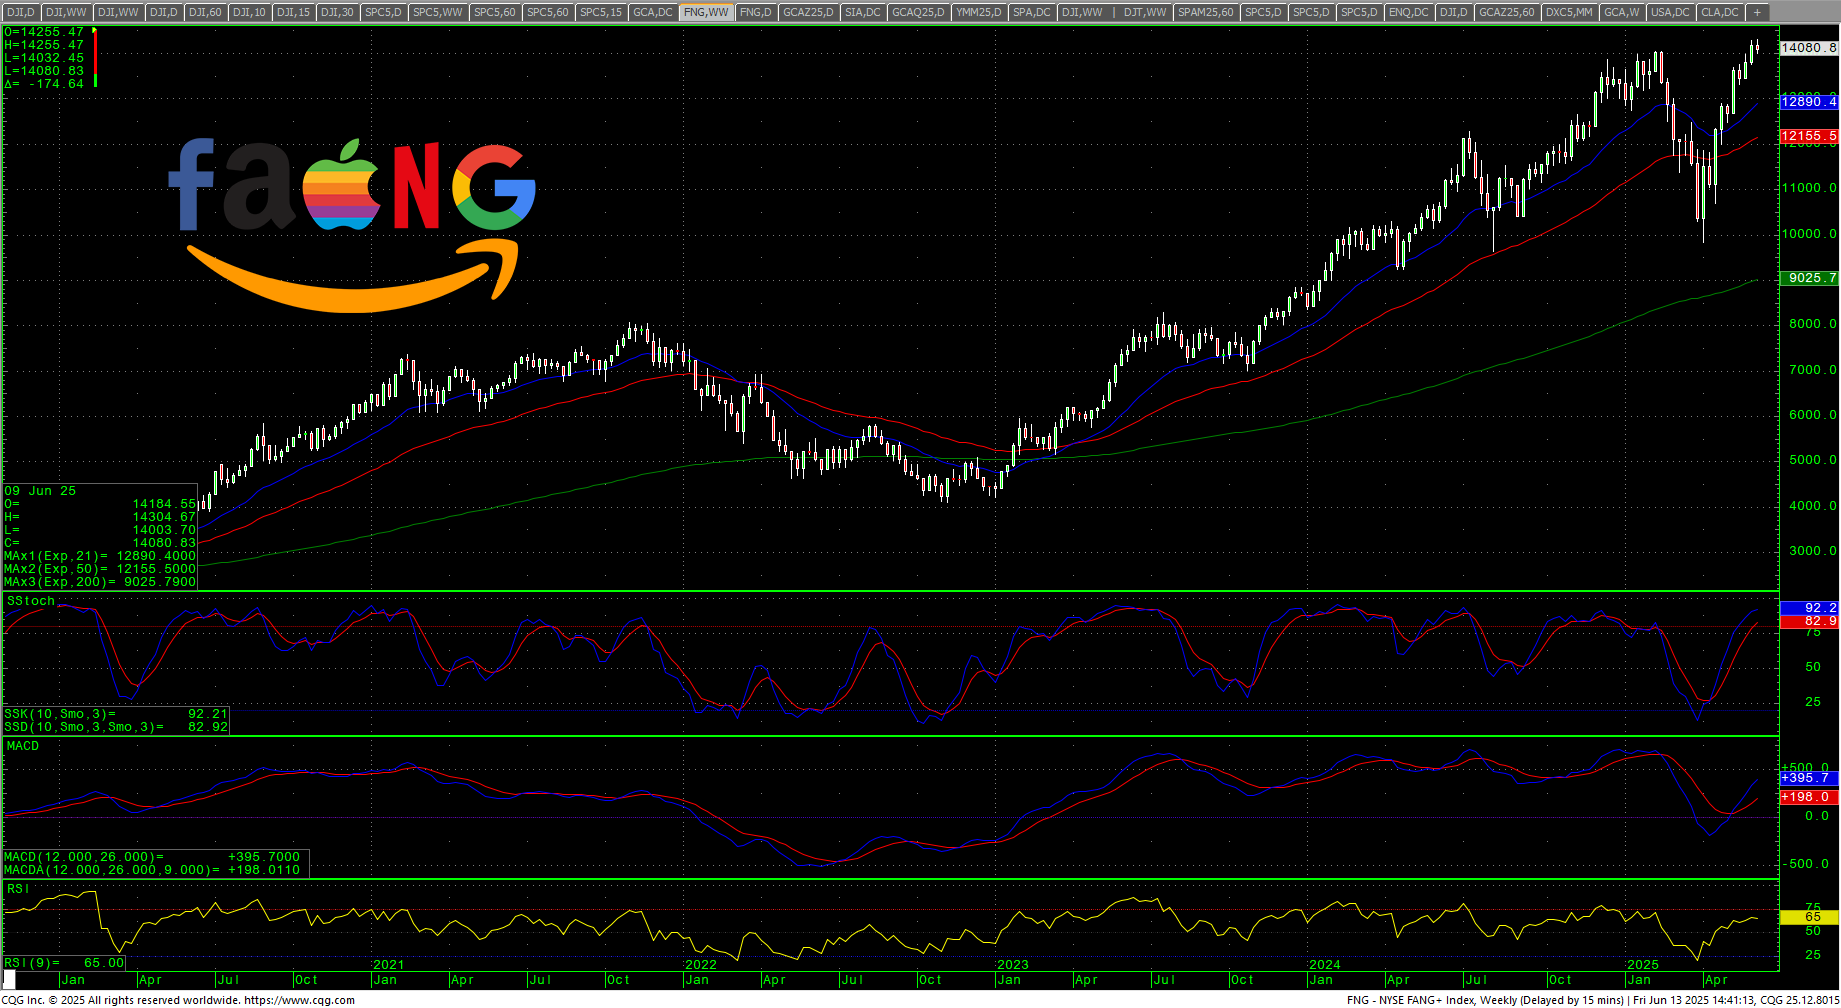
 NYSE FANG Daily Candles
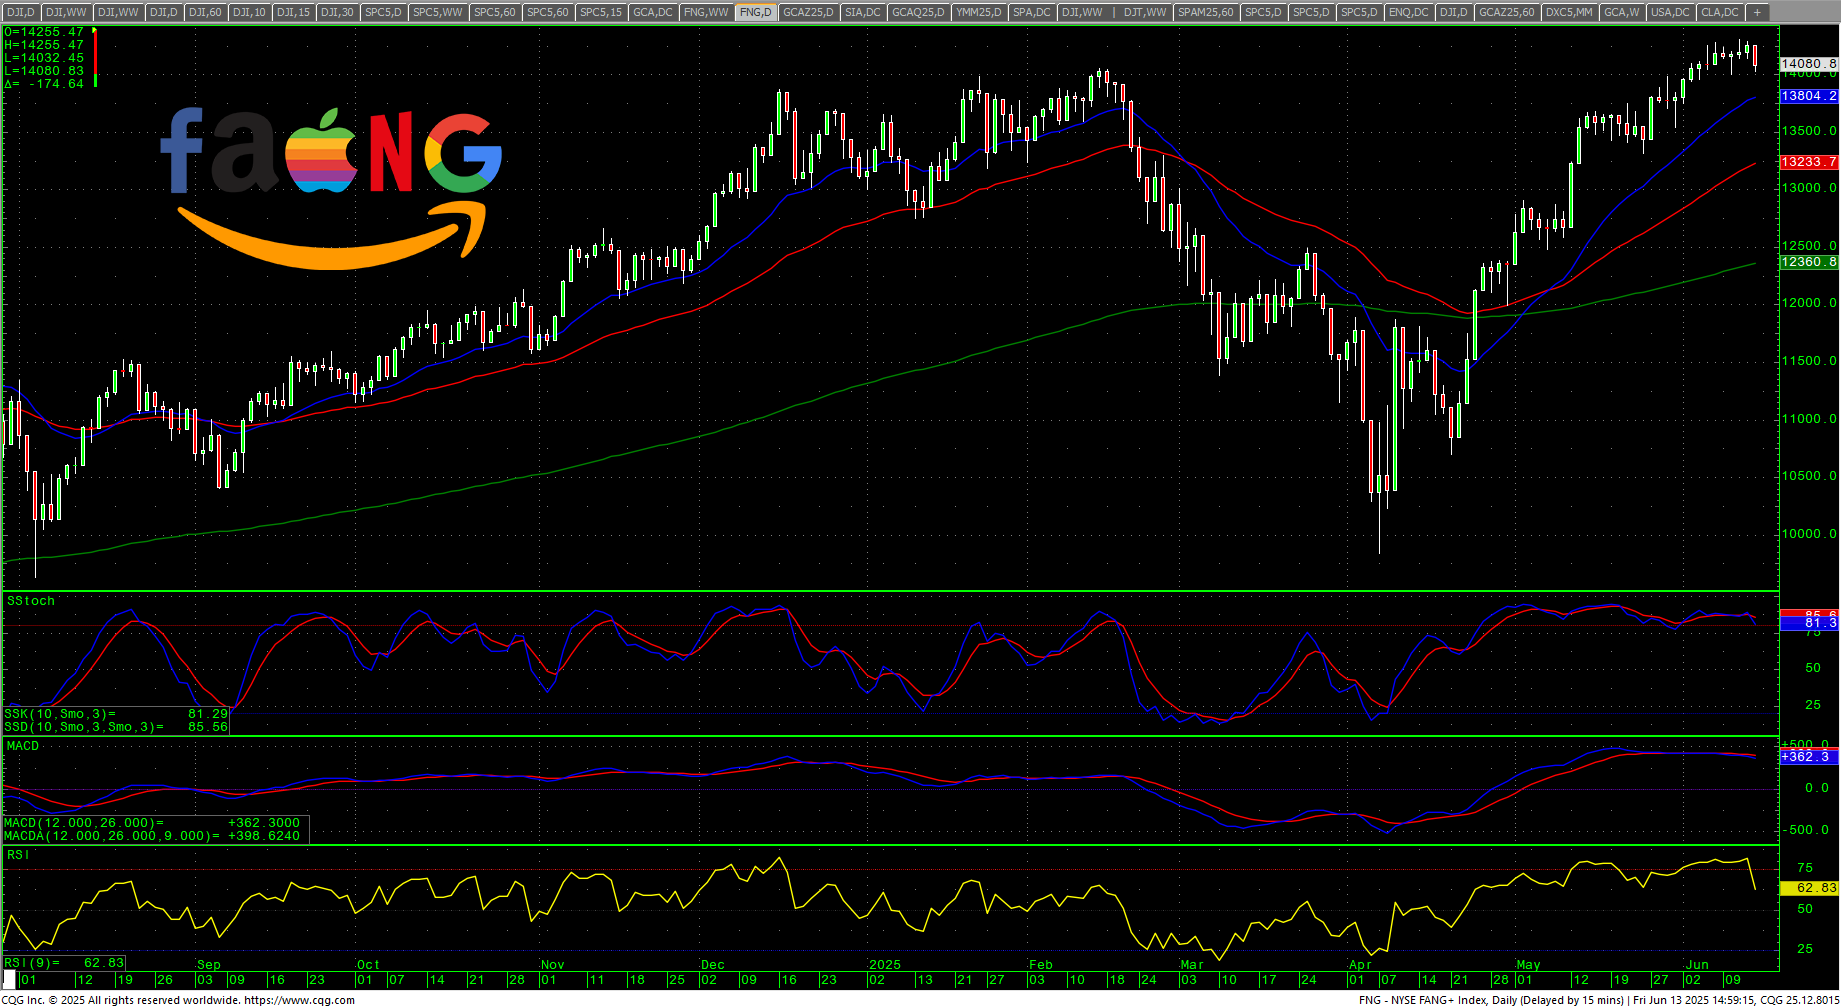 Stocks moved higher early in the week the NYSE FANG hitting new all-time highs and the Dow trading right into the ‘final’ “Death Zone” from record highs (intraday high on Wednesday was 43115.6). That zone remains at 42943 through 43061. As mentioned last week; “Until prices clear that area with closes…this is a place where intermediate-term traders should be thinking about selling this market.”
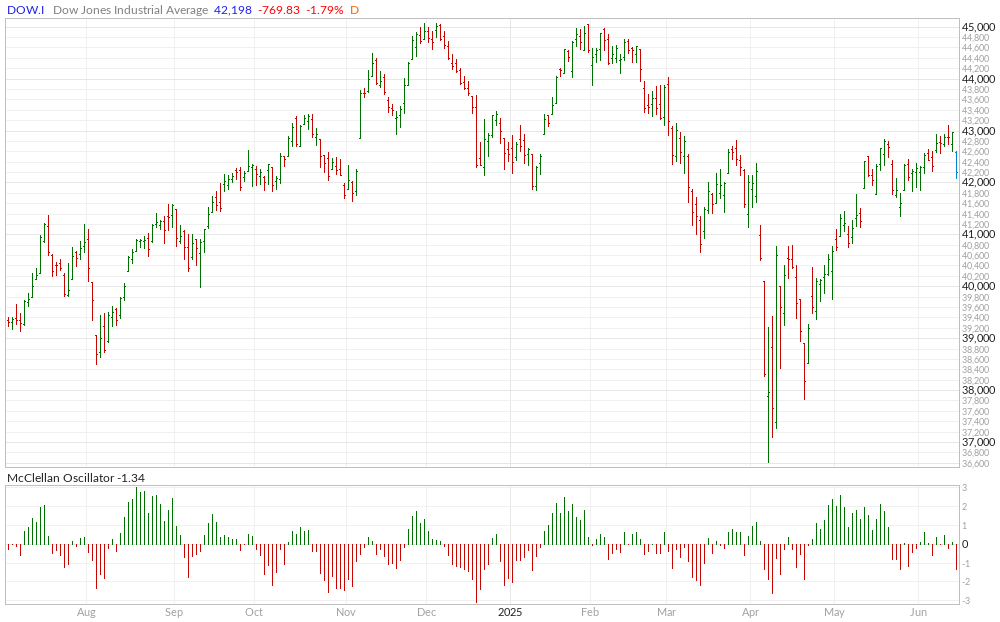
Dow Jones Industrial Average Weekly Candles
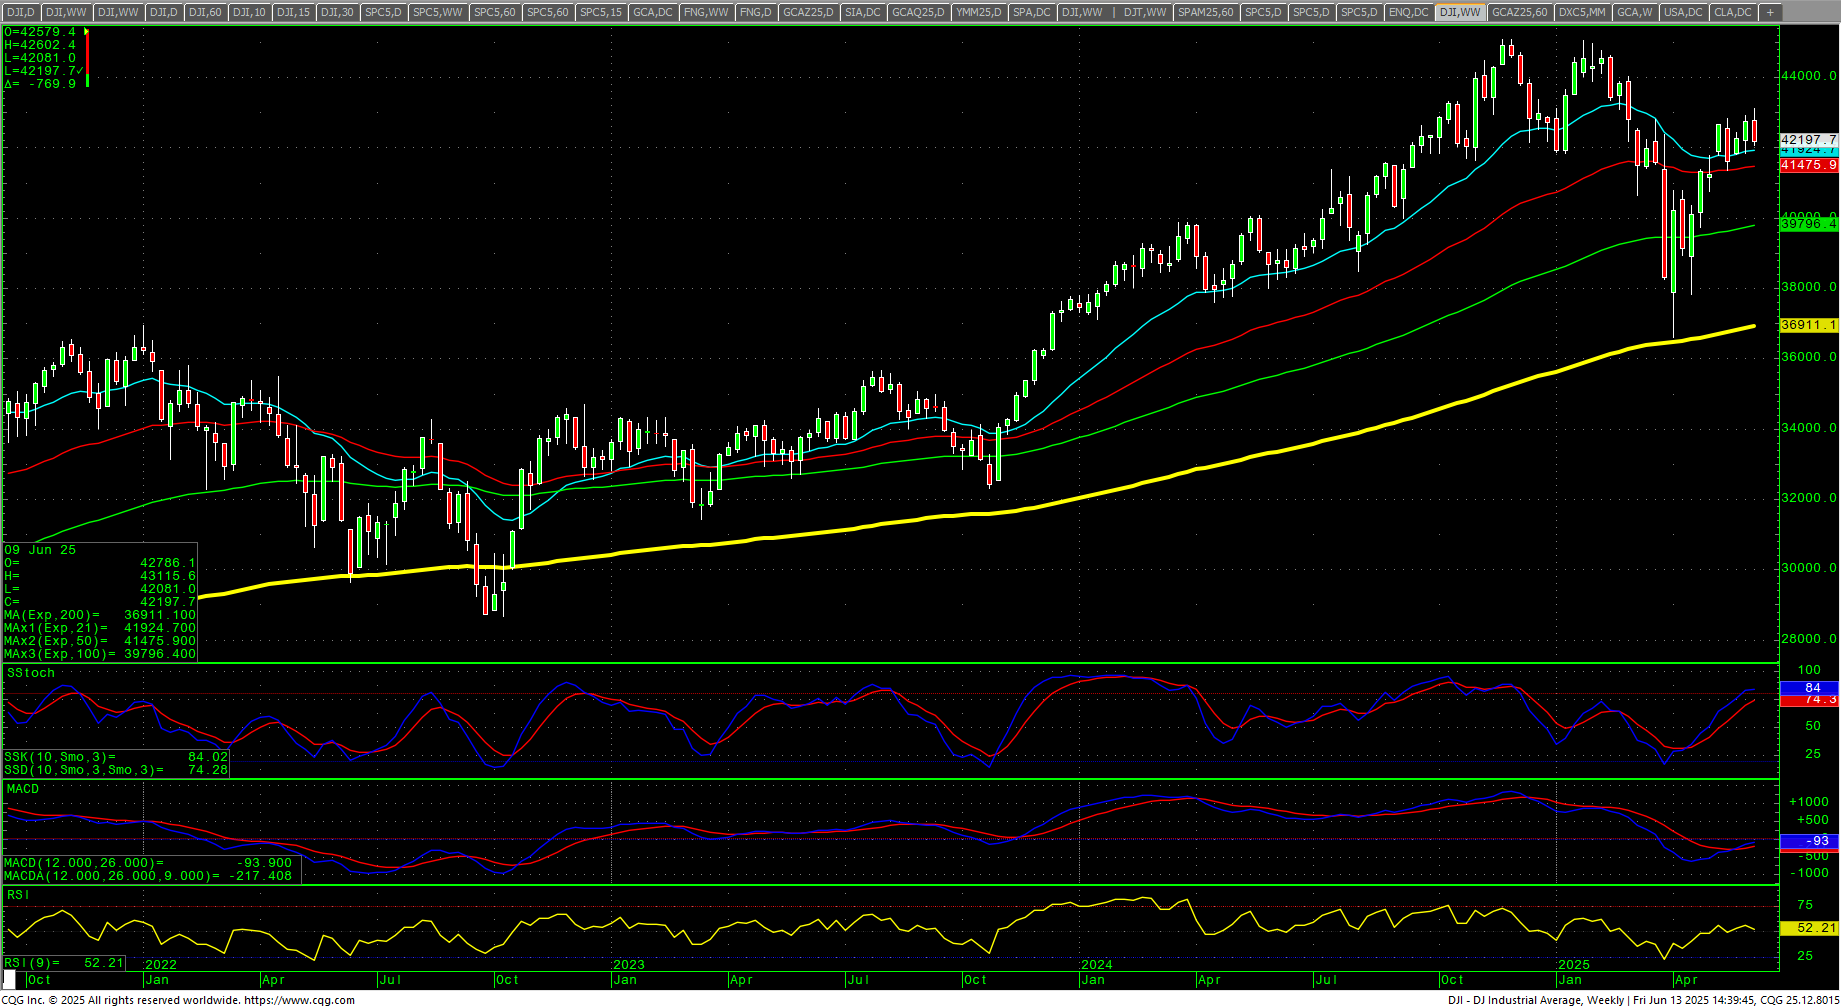 Prices were buoyed mid-week on cooler than expected inflation data but then blindsided Friday on geopolitical tension as Israel engaged in strikes on Iran, with Iran hitting back during Friday’s session where stocks declined sharply while energy exploded higher. This left the markets mostly in downside reversals on some overbought weekly charts. The question now, with the Dow having initially rejected the “Death Zone,” is whether this begins a new move lower or is a one-off. A one-off would invoke the maxim; “When the missiles start flying, it’s time to start buying.”
The reality is that we are now entering a 6-9 month window of extremely volatile longer-term cycles. I am going to issue a cycle timing update this weekend outlining the patterns as we head into Fall 2025. Repeating the comments from the past month:
Long Term Timing Thoughts
“It is looking more and more, from a cycles standpoint, that this will run well into Q4 2025/Q2 2026. Thus, a much more protracted and drawn-out bear and not the “flash crash” that everyone has gotten used to over the past two decades. That doesn’t mean we won’t have significant rallies, but chasing rallies is likely to be a losing strategy until this thing is spent…which very likely will not be until Q1/Q2 2026 at this point. The BIG focus will be late summer and fall of 2025…particularly late September this year.”
So, we are right on the cusp of entering another period where volatility can increase.
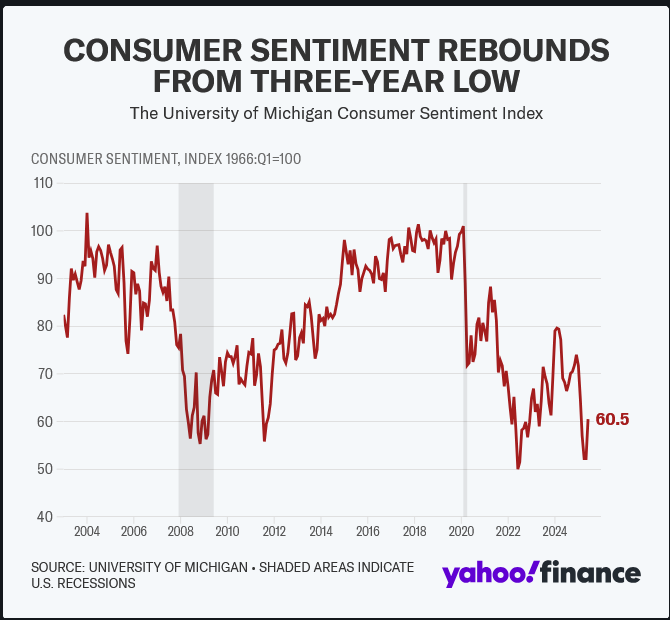
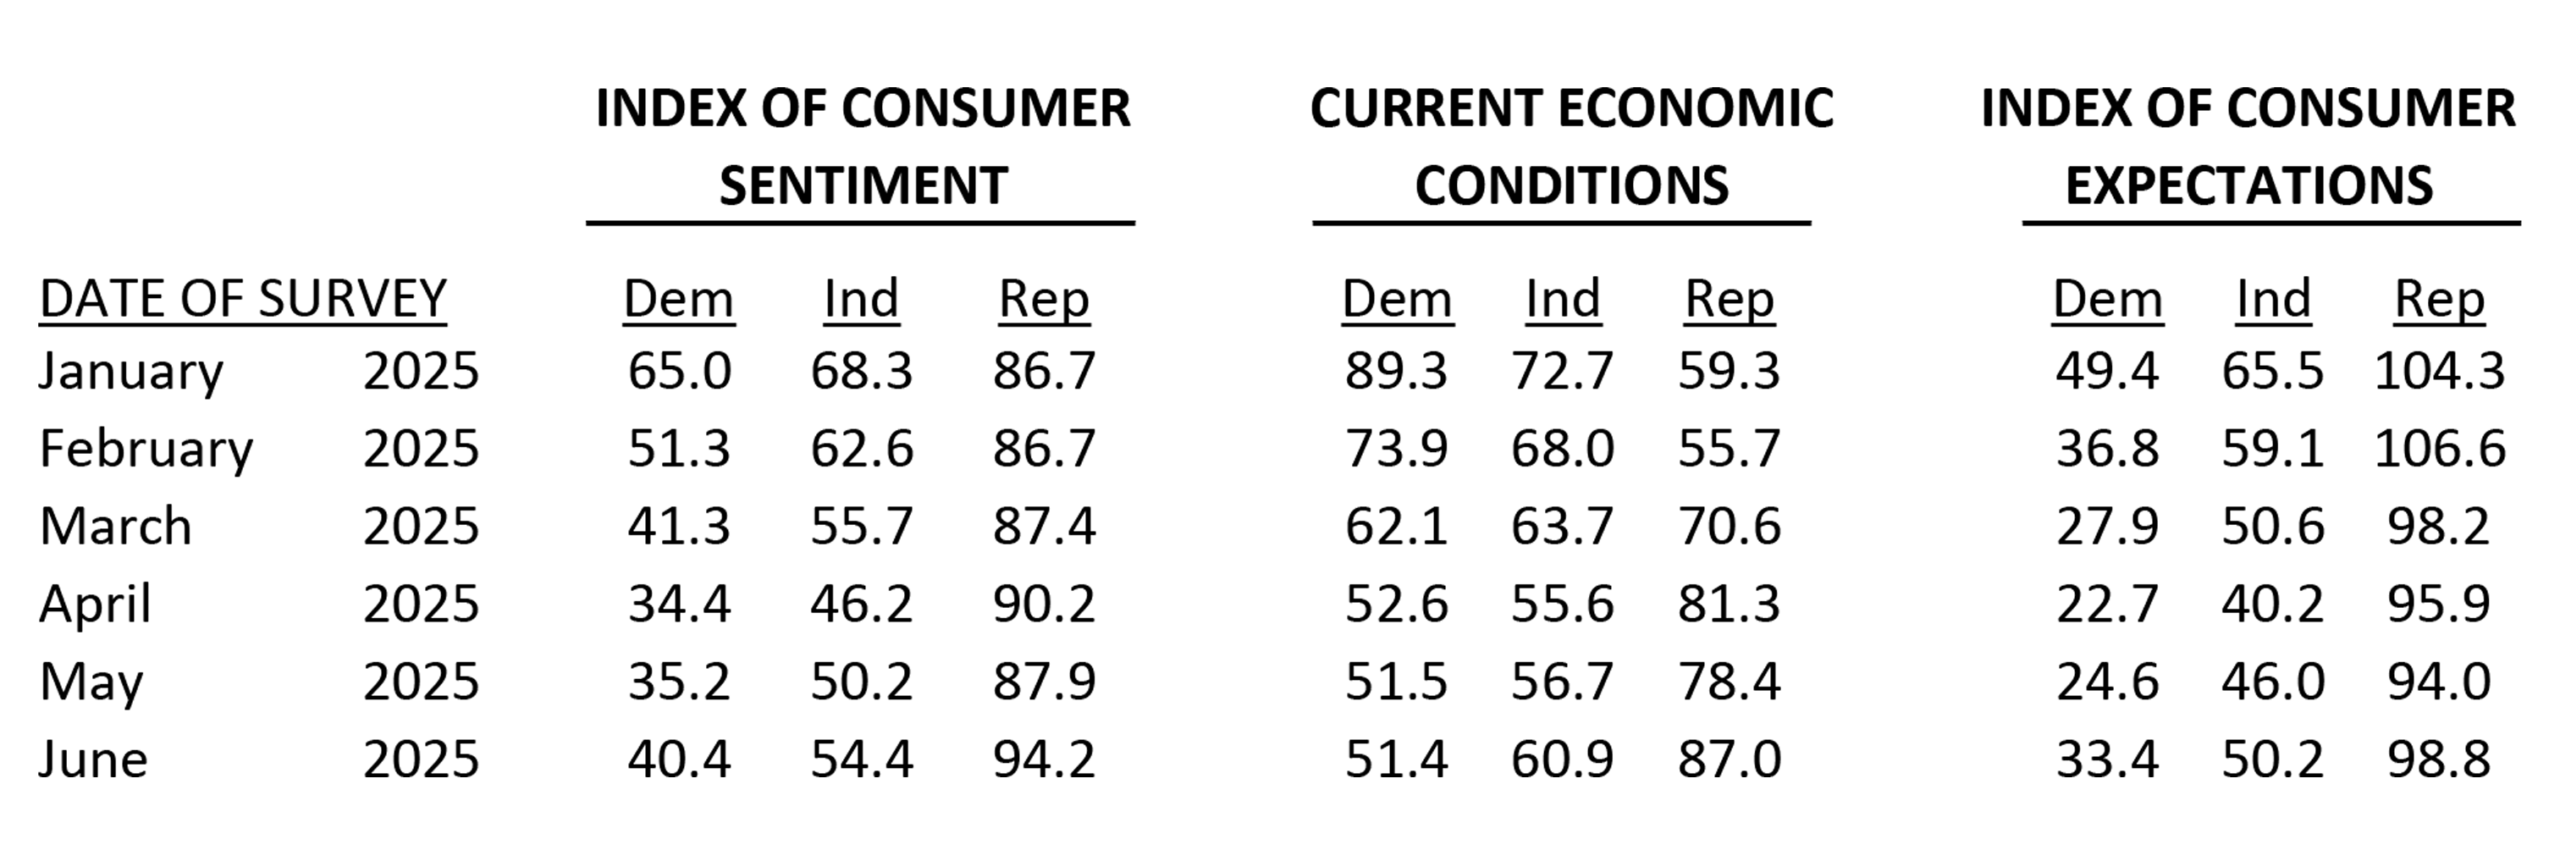 In addition to softer inflation data (which represents more of a deflationary threat), Consumer Sentiment jumped in May. The sentiment readings continue to be extremely partisan…as if the respondents are living on two completely different planets, with right-leaning respondents radically bullish and left-leaning and independent respondents mostly bearish.
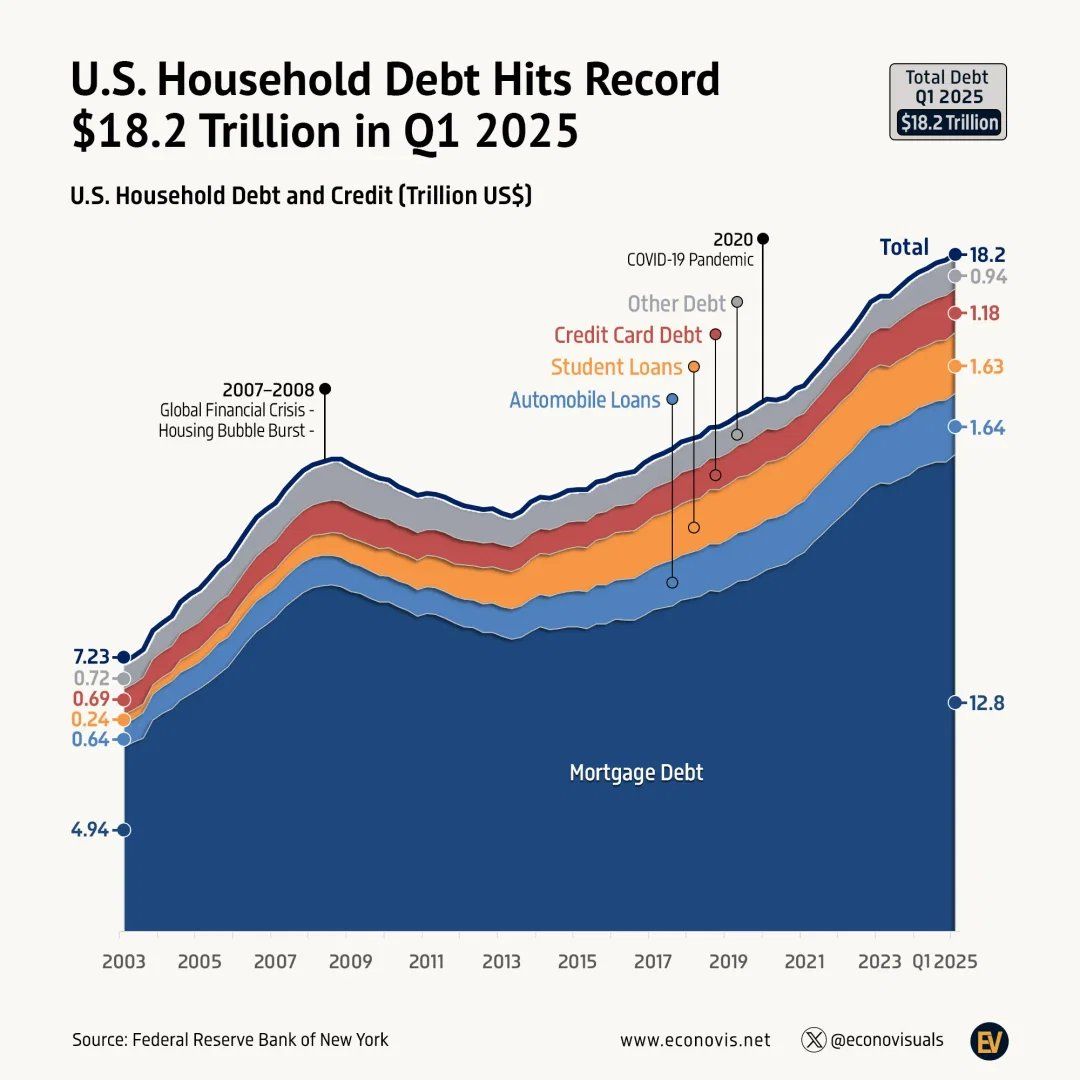
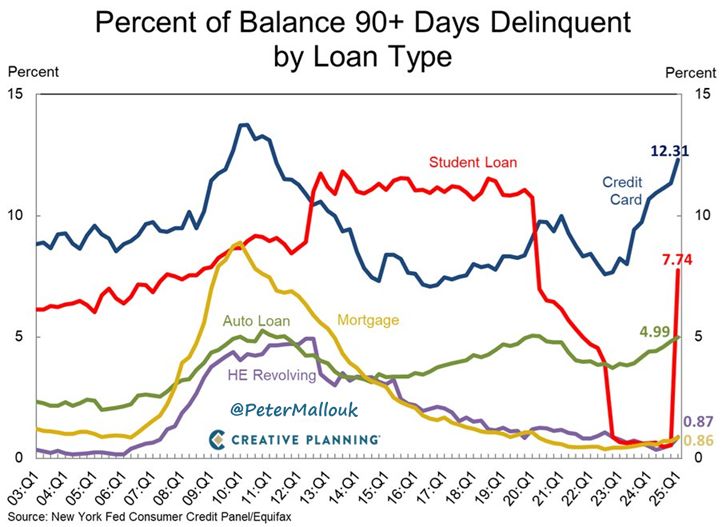
Regardless of partisanship, consumers remain maxed out…which is another reason the CPI/PPI are cool. People are just not spending money as the debt levels have reached extremes at the same time that delinquencies are rising on many fronts. If energy prices take off, it could be lights out for consumers.
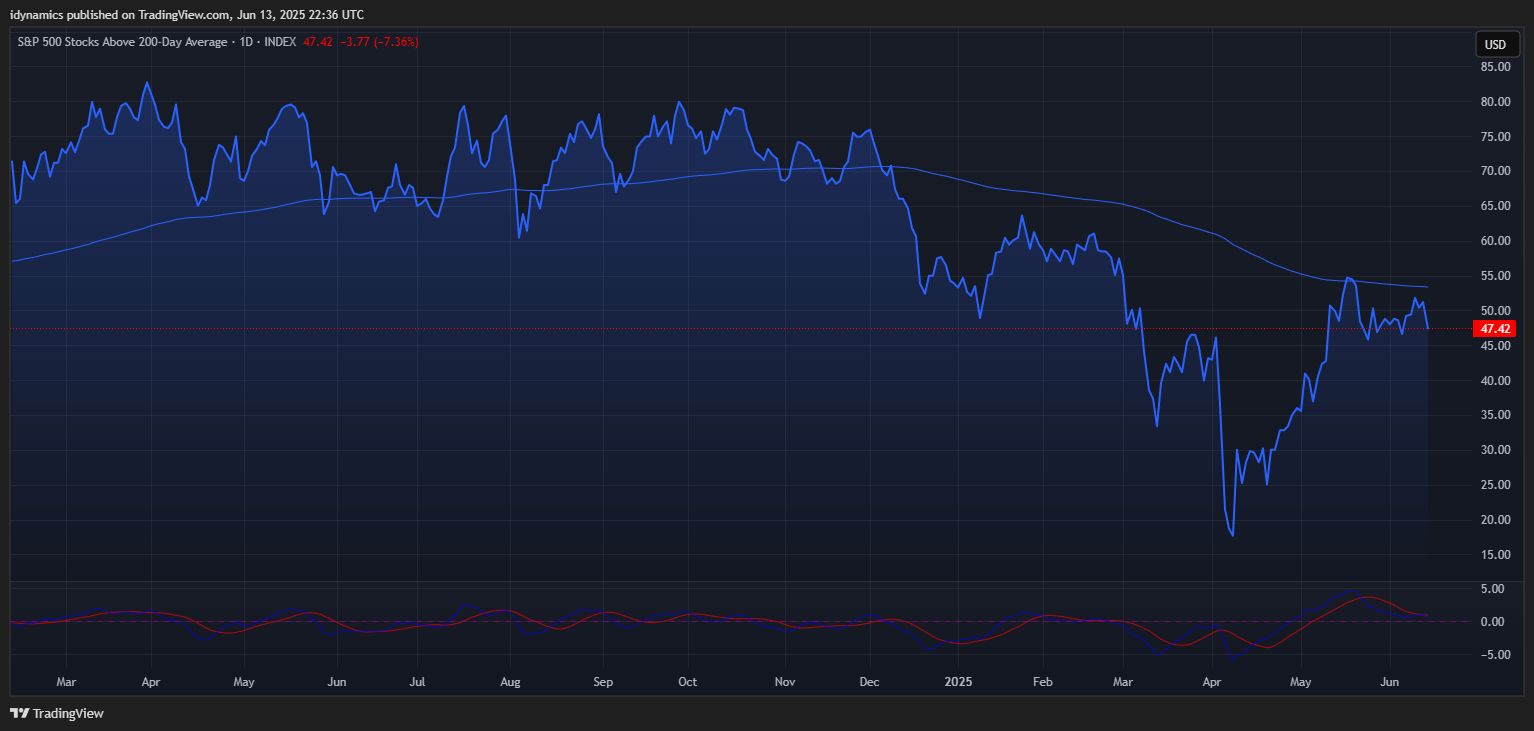
 Another divergence for the recent bullish market action is breadth. Overall breadth is quite weak compared to where it was when we were setting the highs earlier this year. The percentage of SPX stocks above their 200-day MA ended Friday at 47.42%. It hit a high of 63.61% in February 2025 and 72.92% in September 2024.
S&P 500 Stocks Above the 200-day MA
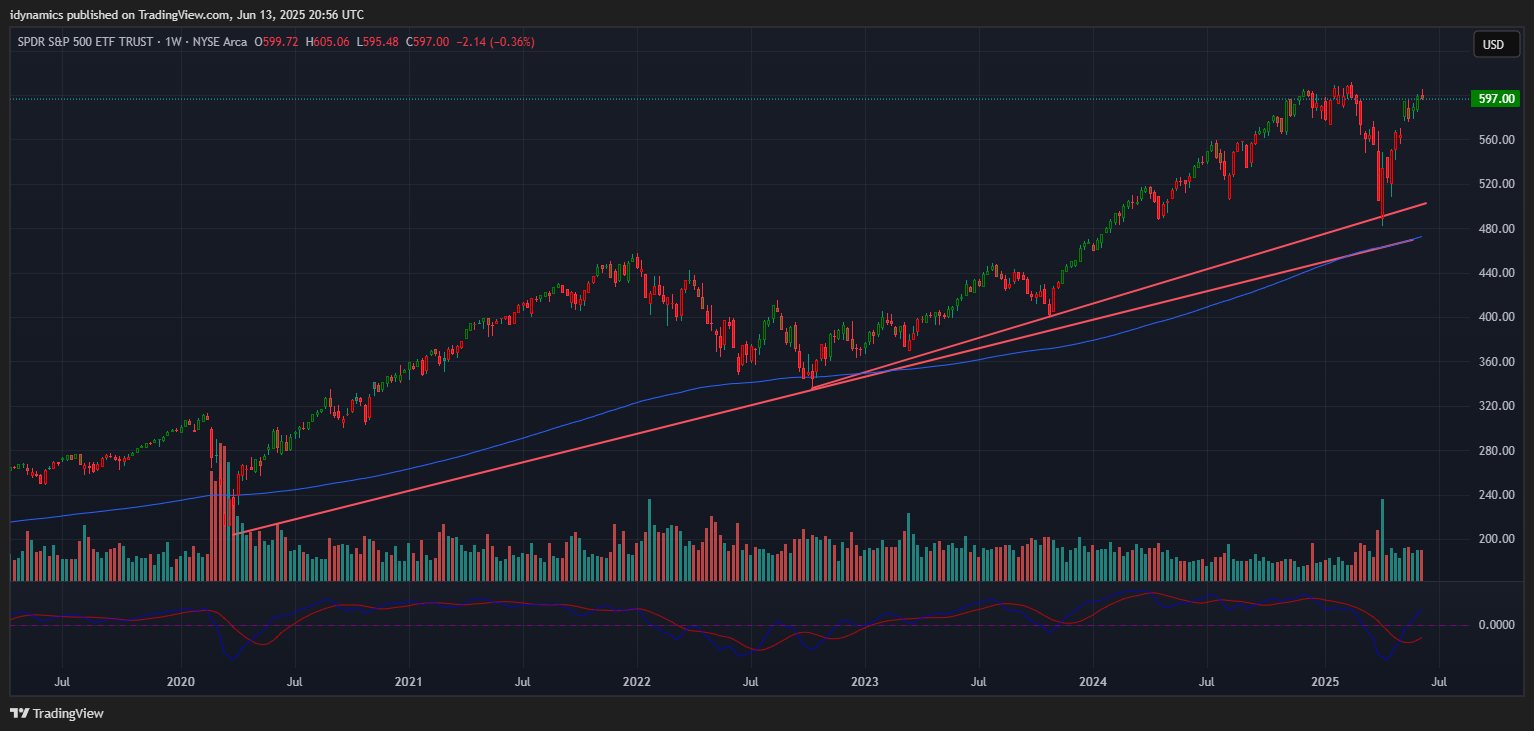
 SPX Daily Candles
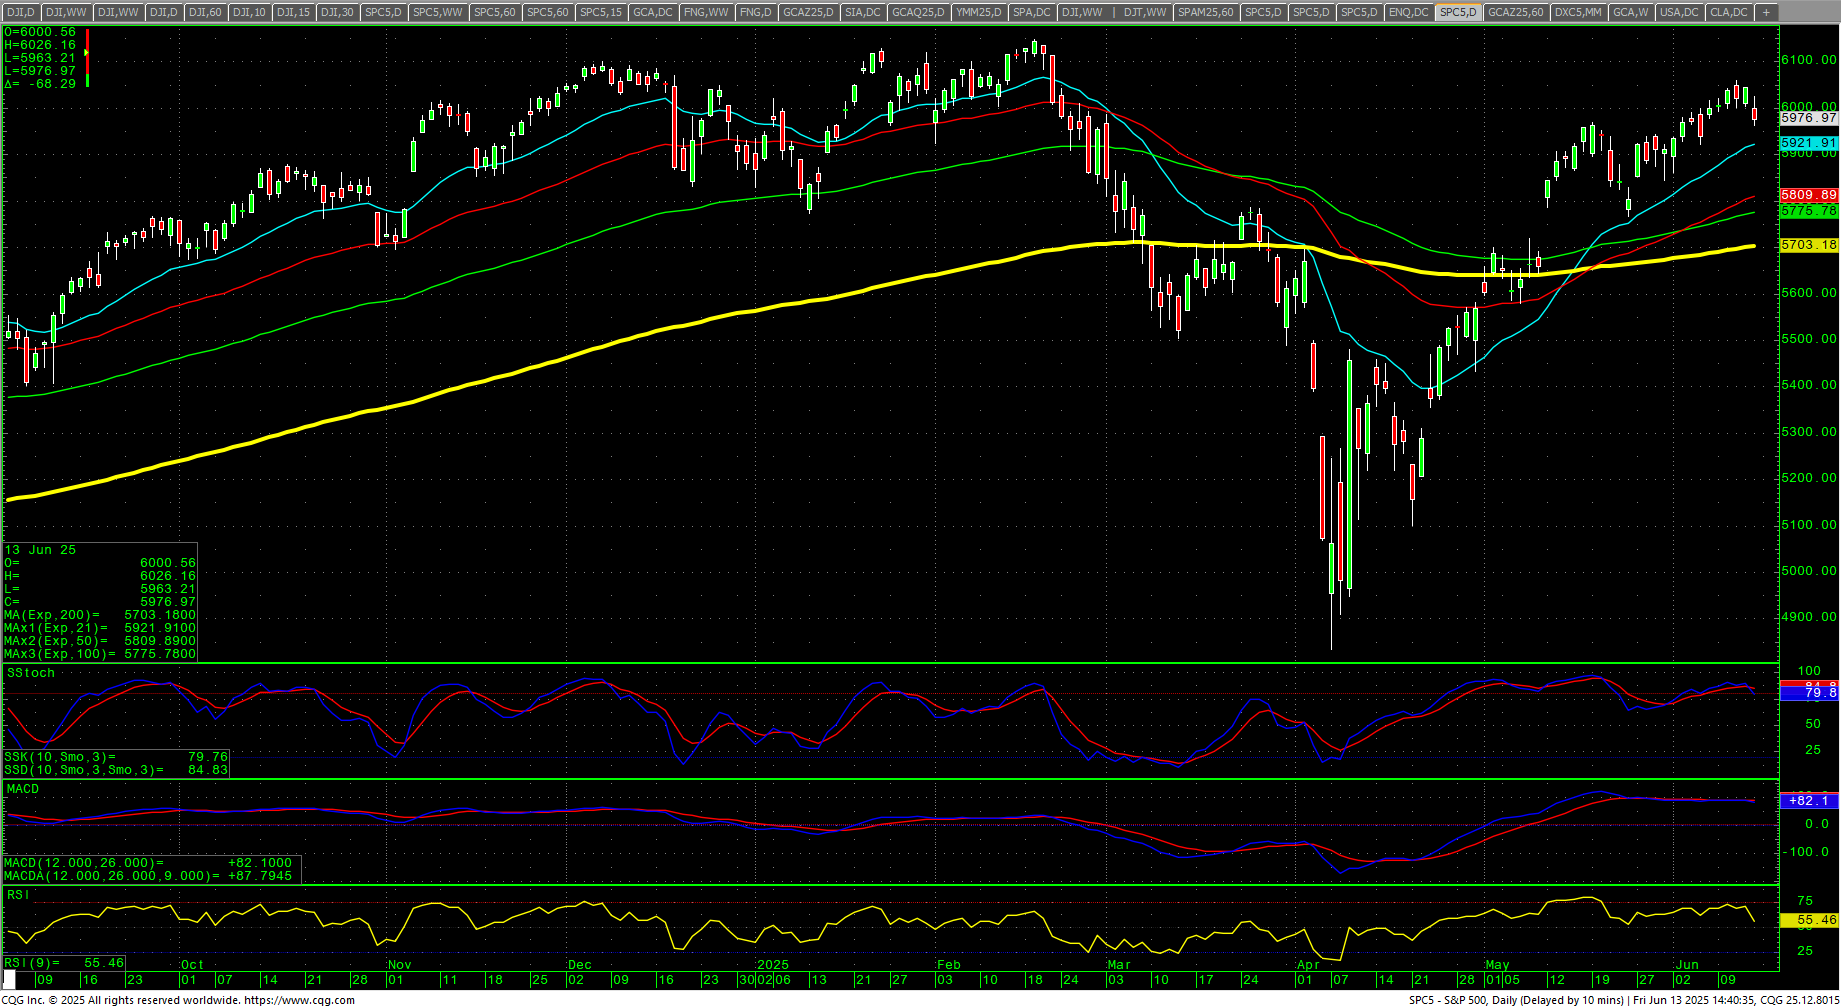 The SPX daily is reacting to some extreme overbought conditions with some divergences and the MACD pegged. The stochastics and the RSI are reacting to bearish divergences while the 200-day MA is creeping back toward its record high reading of 5710.51 set on 7 March 2025. There is still a strong probability that the SPX will return to the 200-day MA for a retest. For the SPX, that sits at 5703.18 and trending up on Friday’s close. That’s 275.59 points or a down move of -4.72%.
MAGS (Magnificent 7) Weekly Candles
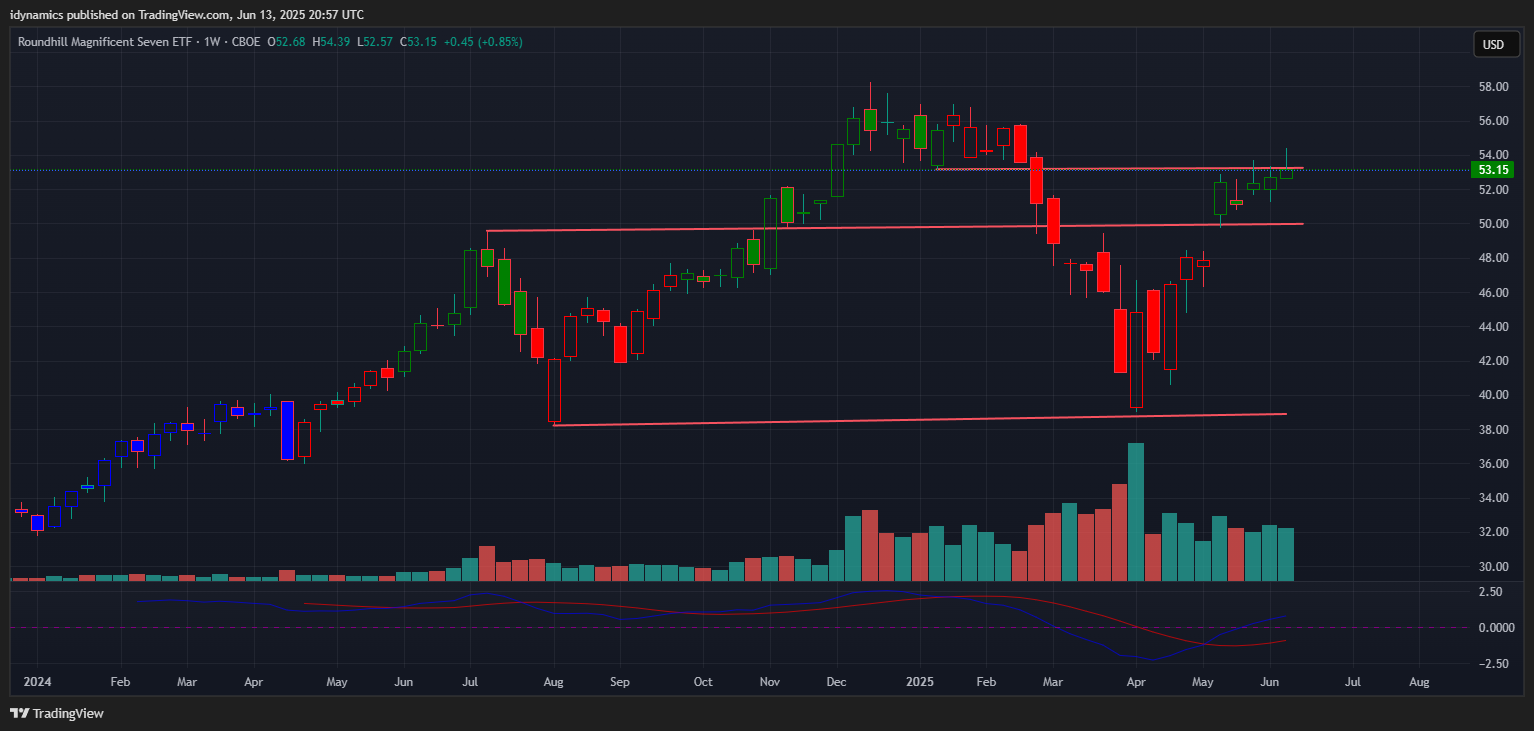 The MAGS (Magnificent 7) closed out the week up +0.45% at a new weekly recovery high for the move but in the low end of the range after prices traded slightly above critical resistance at 54.16. The 53.16/54.16 level remains critical. Daily closes over 54.16 will increase the bullish view for the chart and open potential for a test of the highs. A break back under 50 should accelerate selling again.
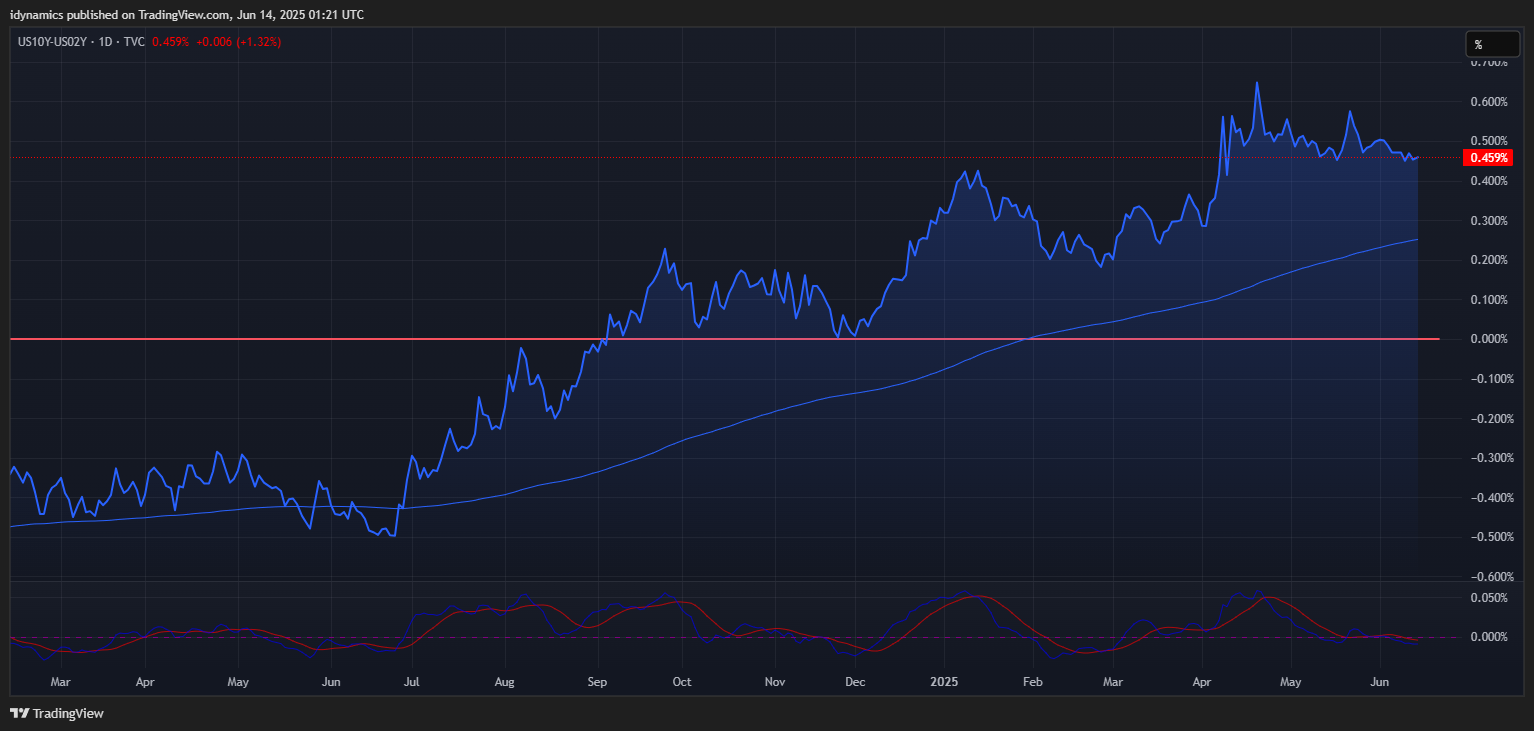
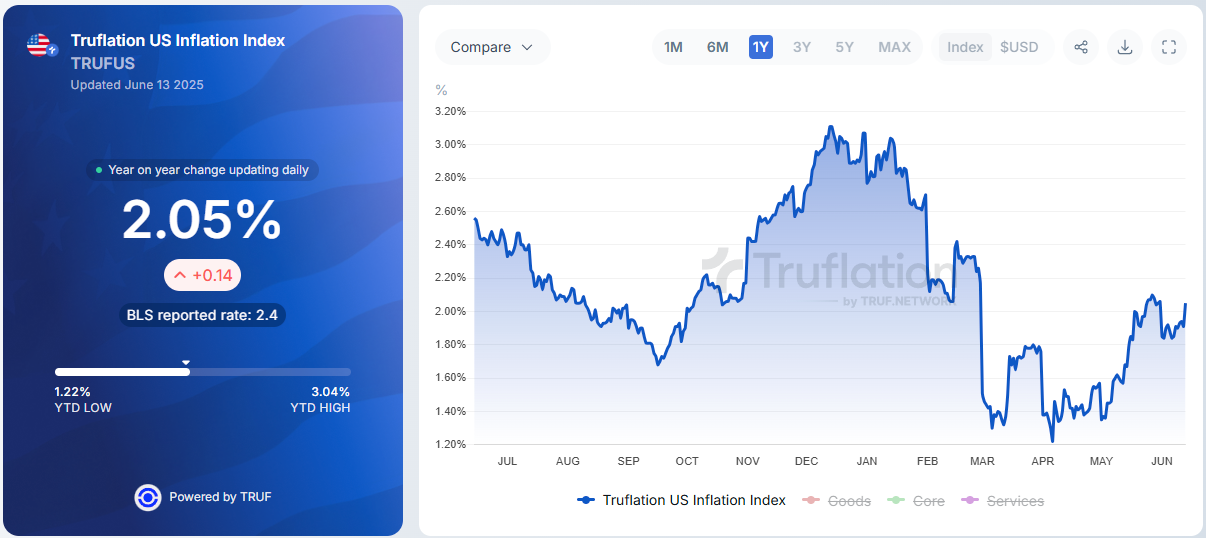
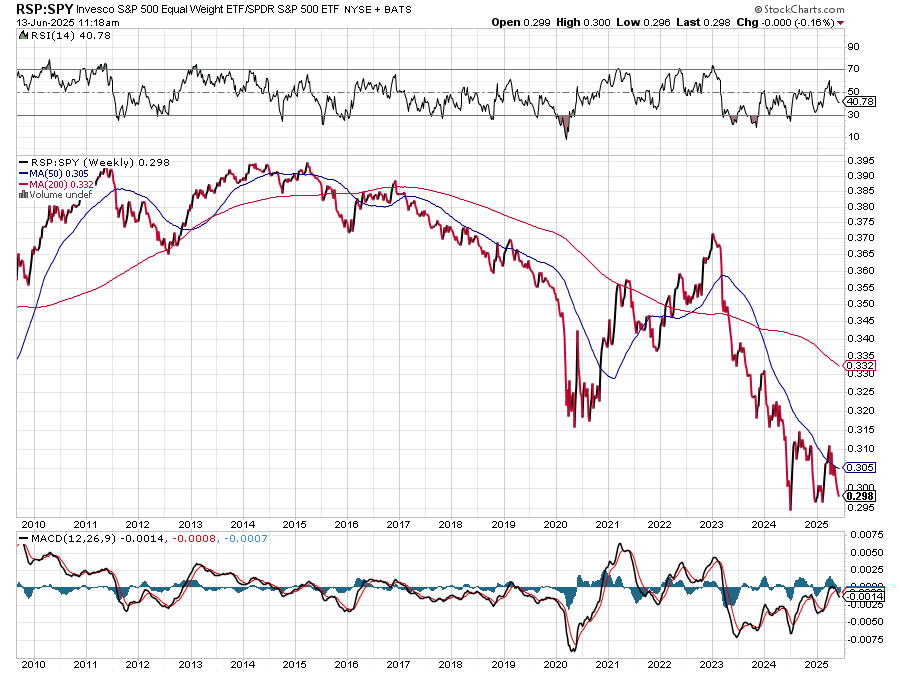
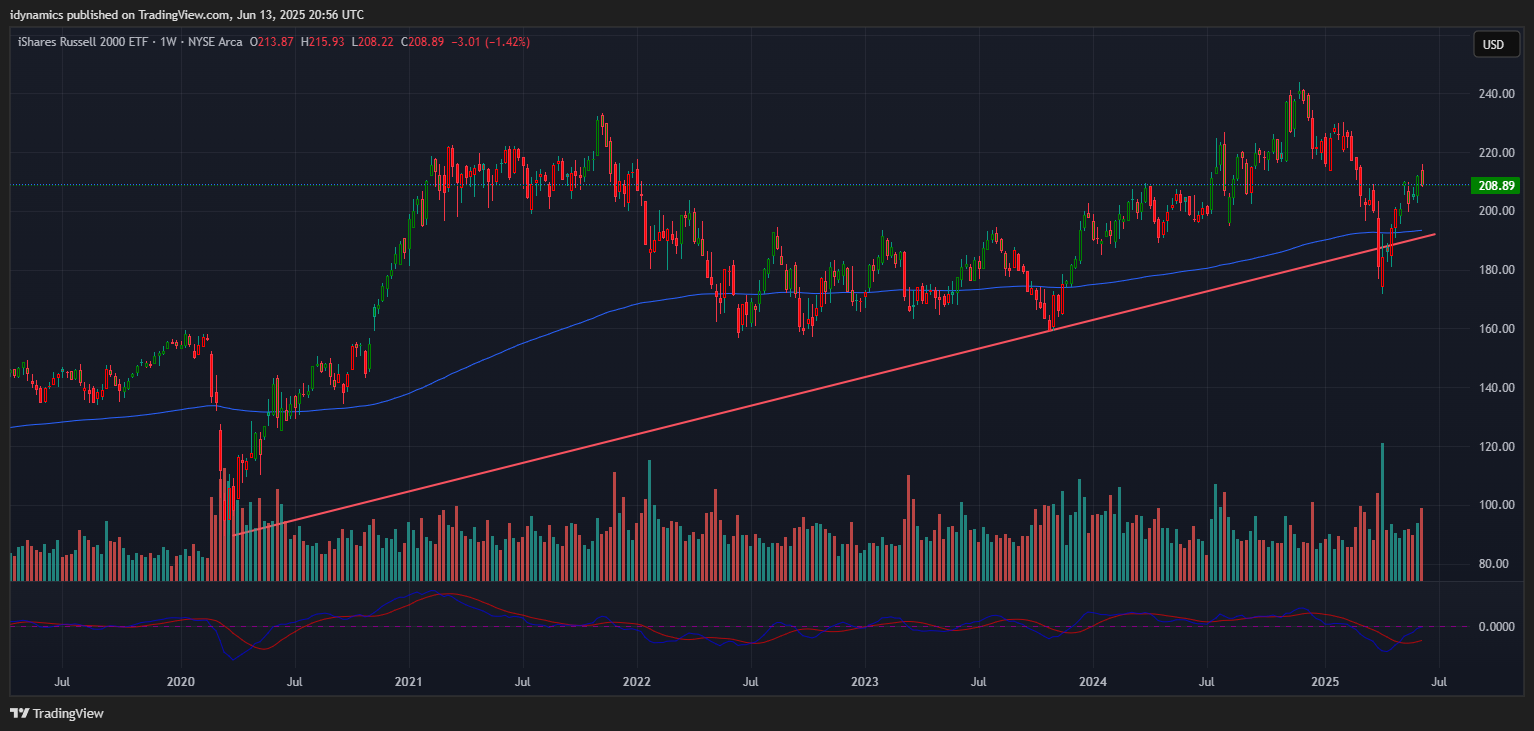
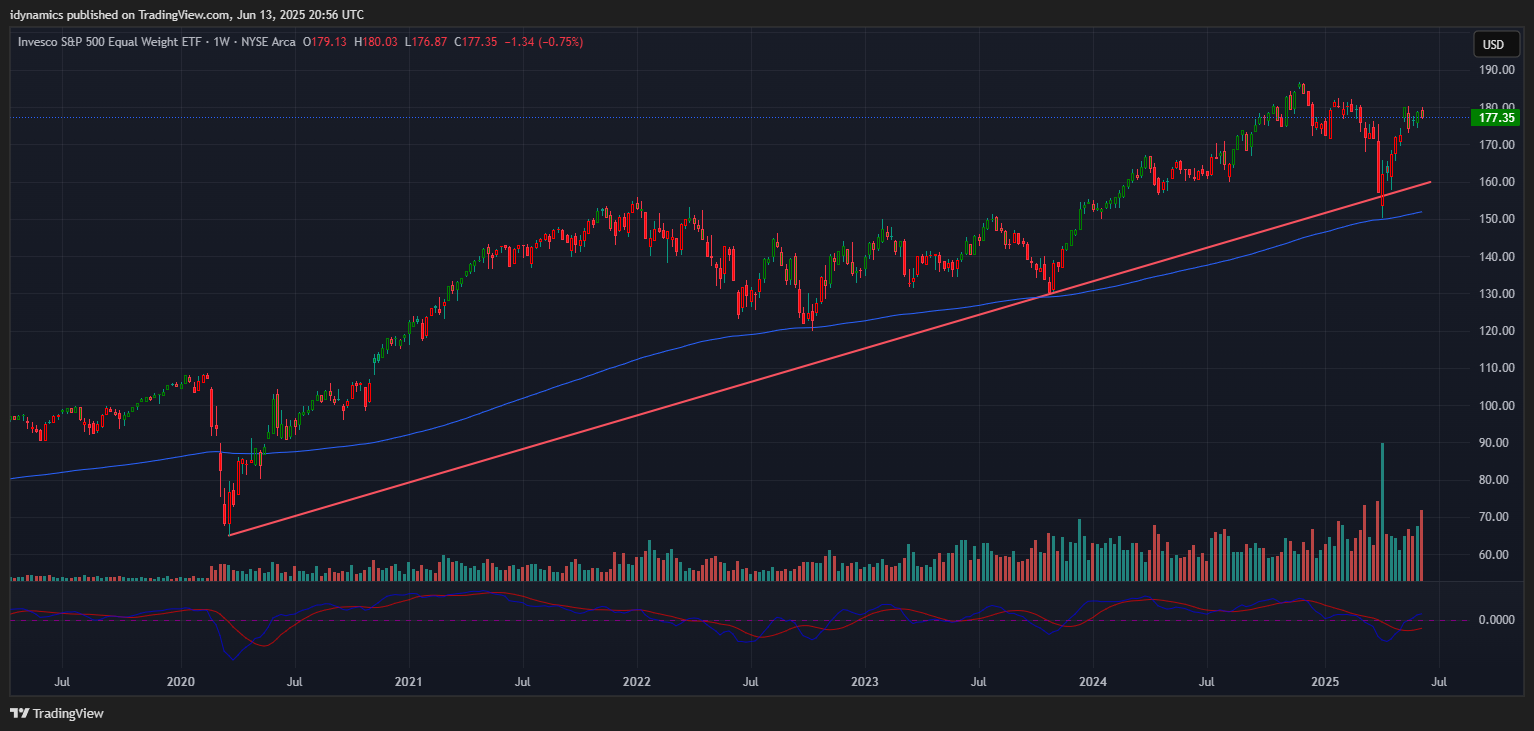
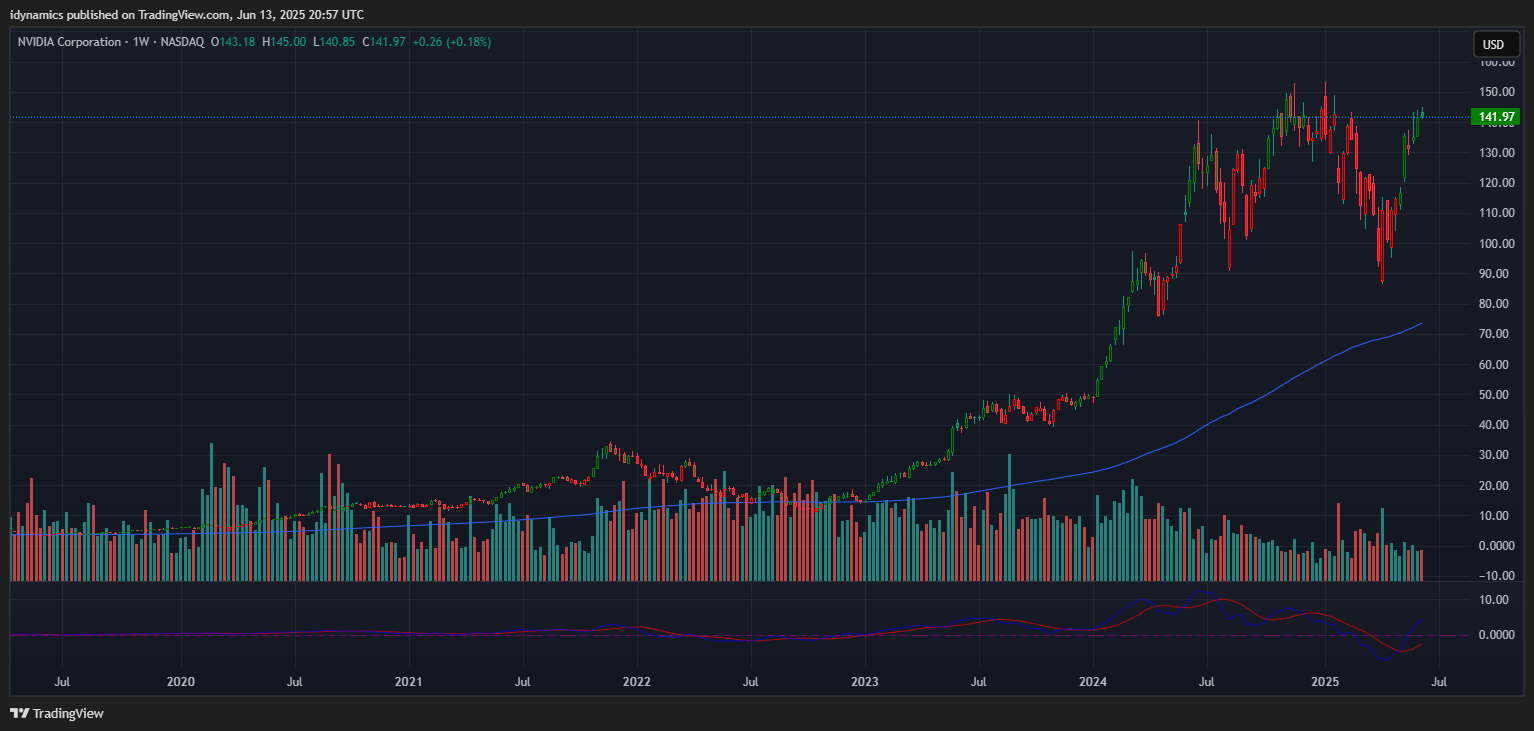
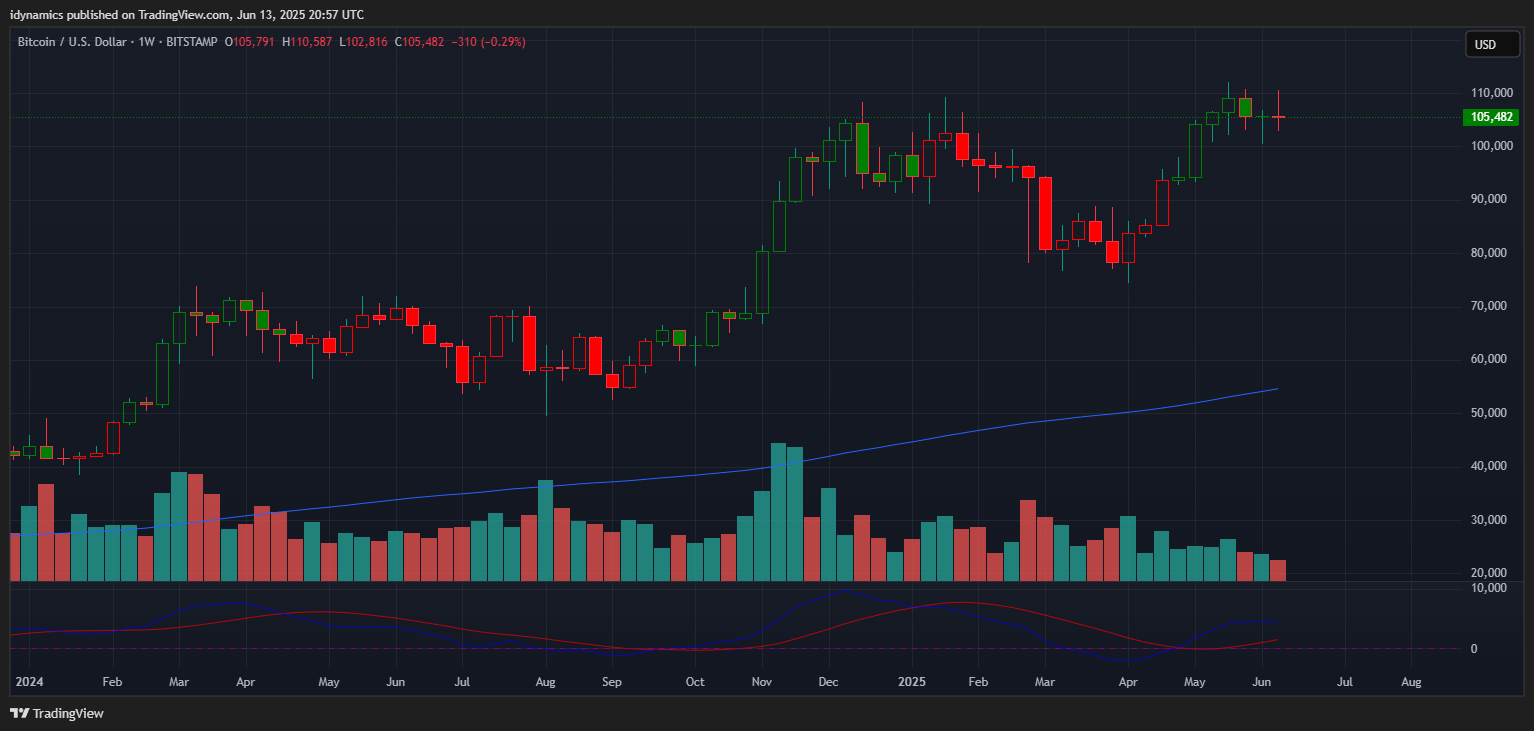
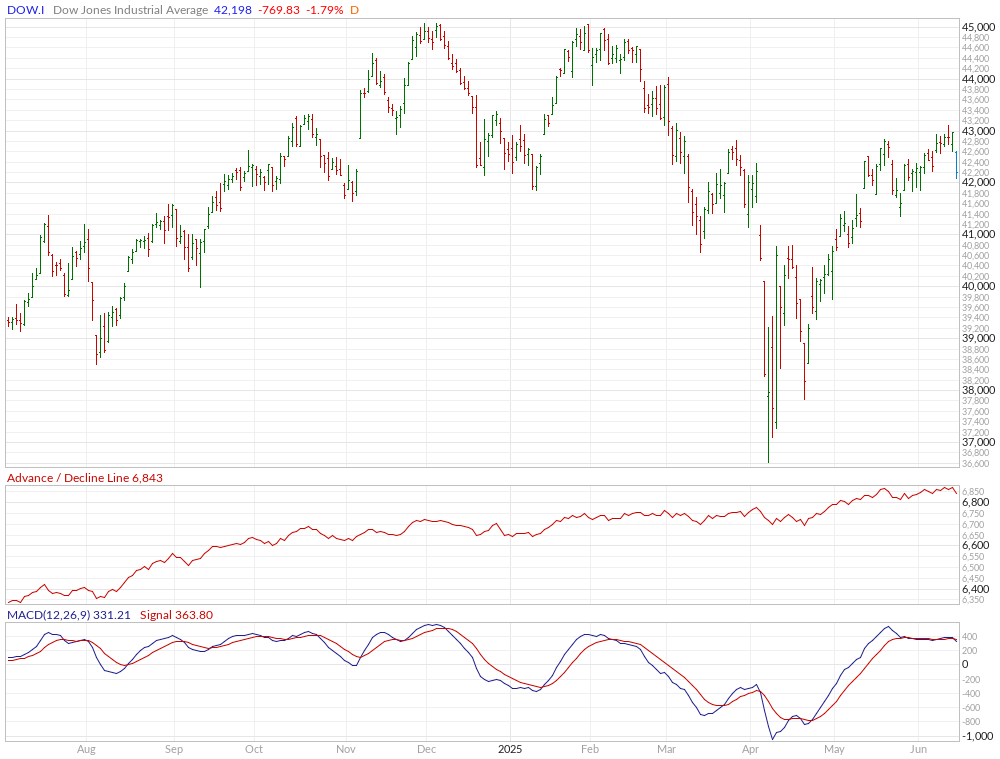
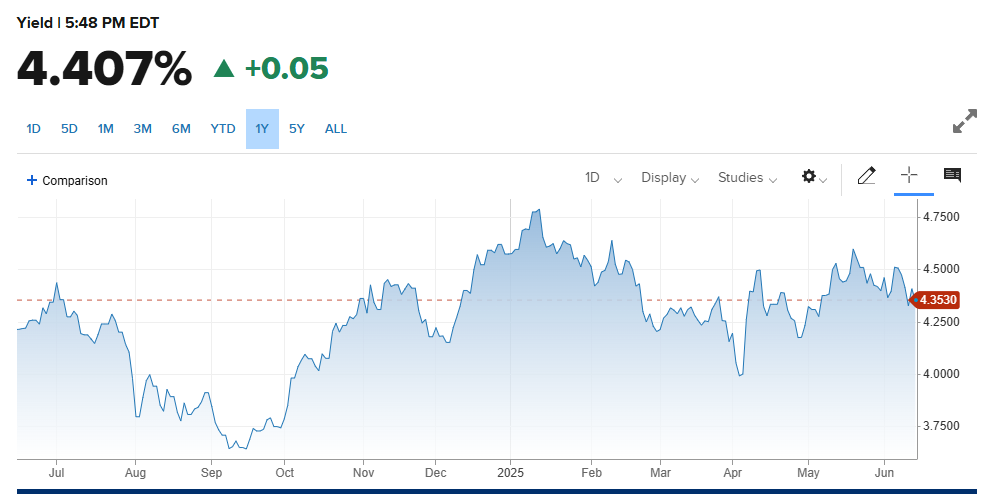
The RSP:SPY remains weak (another signal of weak breadth). The weekly is hooking lower in an oversold position and the MACD is turning back down. The IWM staged a large downside reversal and closed on the weekly lows, down +3.01%. The RSP was down -0.75% on the bottom of a downside reversal range. NVDA traded an extremely tight week and closed on the lows but managed a small gain of +0.18%. Bitcoin was unchanged, settling down -0.10% on the bottom half of the week’s range. McClellan Oscillators are confirming the selloff in the Dow on Friday. The Yield Curve continued to narrow closing out the week at +0.4596%. The 10YR yield declined on the week and closed lower at 4.407%. Truflation is steady at 2.05%.
10YR-2YR Yield Curve Daily
 VIX Weekly H-L-C
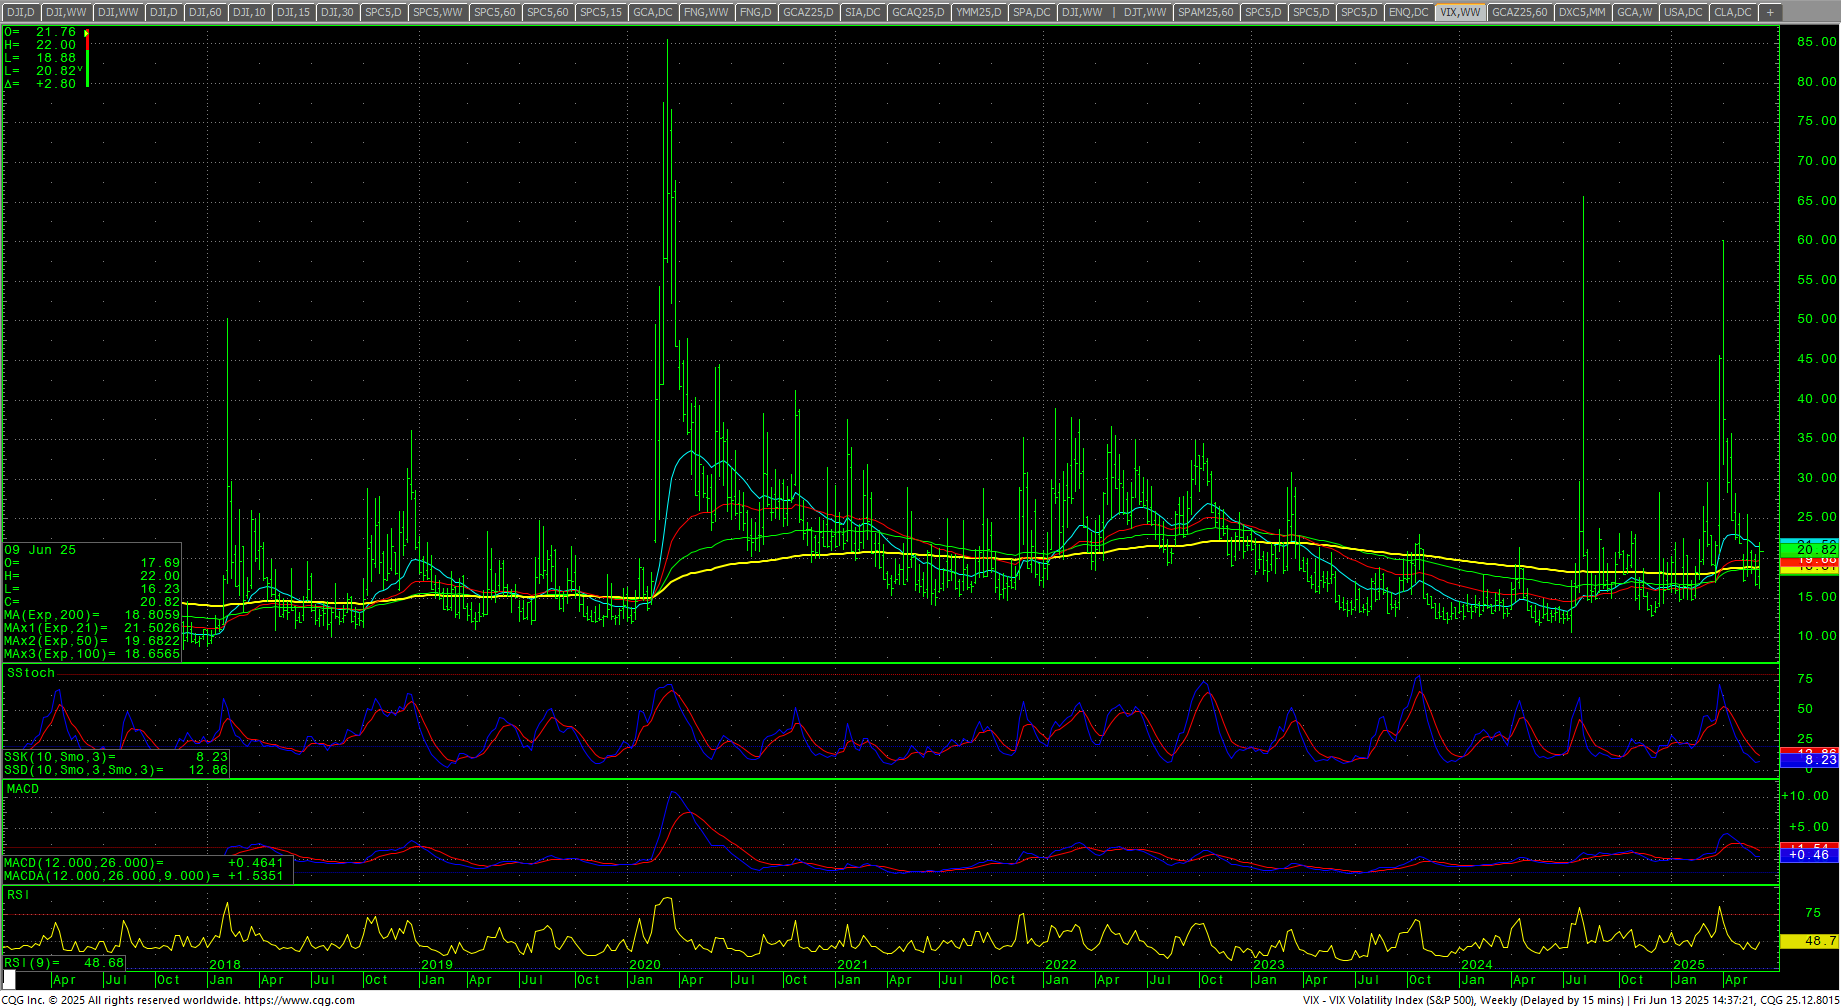
The VIX traded an upside reversal and closed on the highs, back above the 20 level, up +24.15%. The US Dollar traded to the lowest levels since 28 March 2022 and set the lowest weekly close since 21 February 2022, down -1.07% on the week.
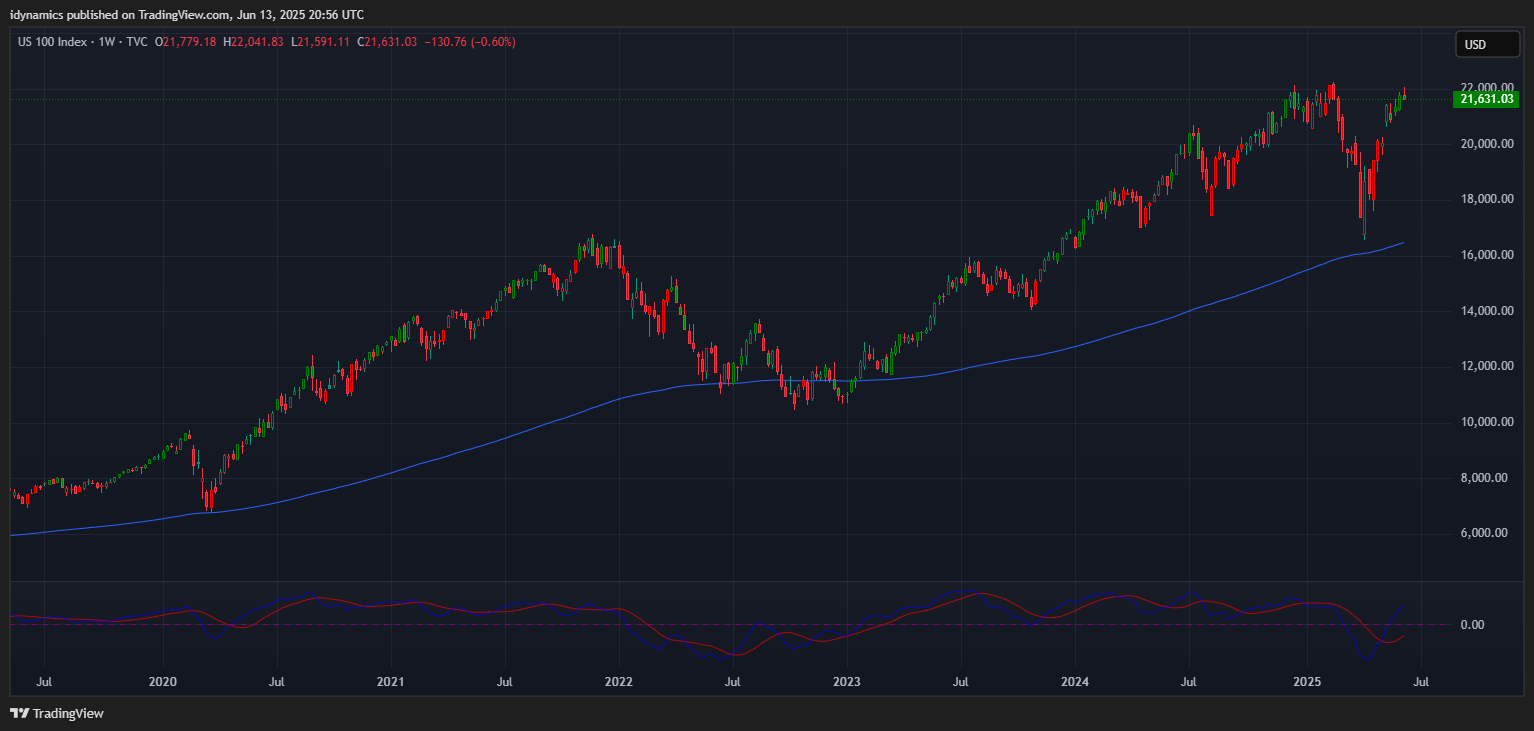
 Nasdaq 100 Weekly Candles
Daily Breadth 
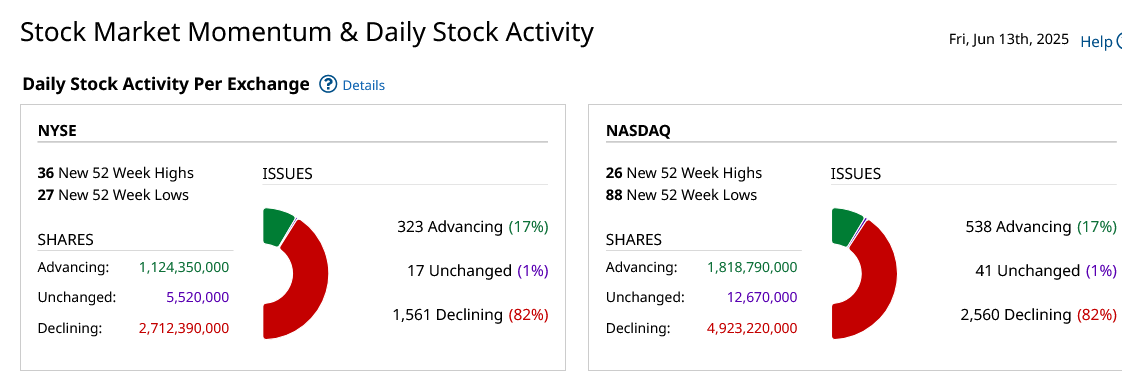
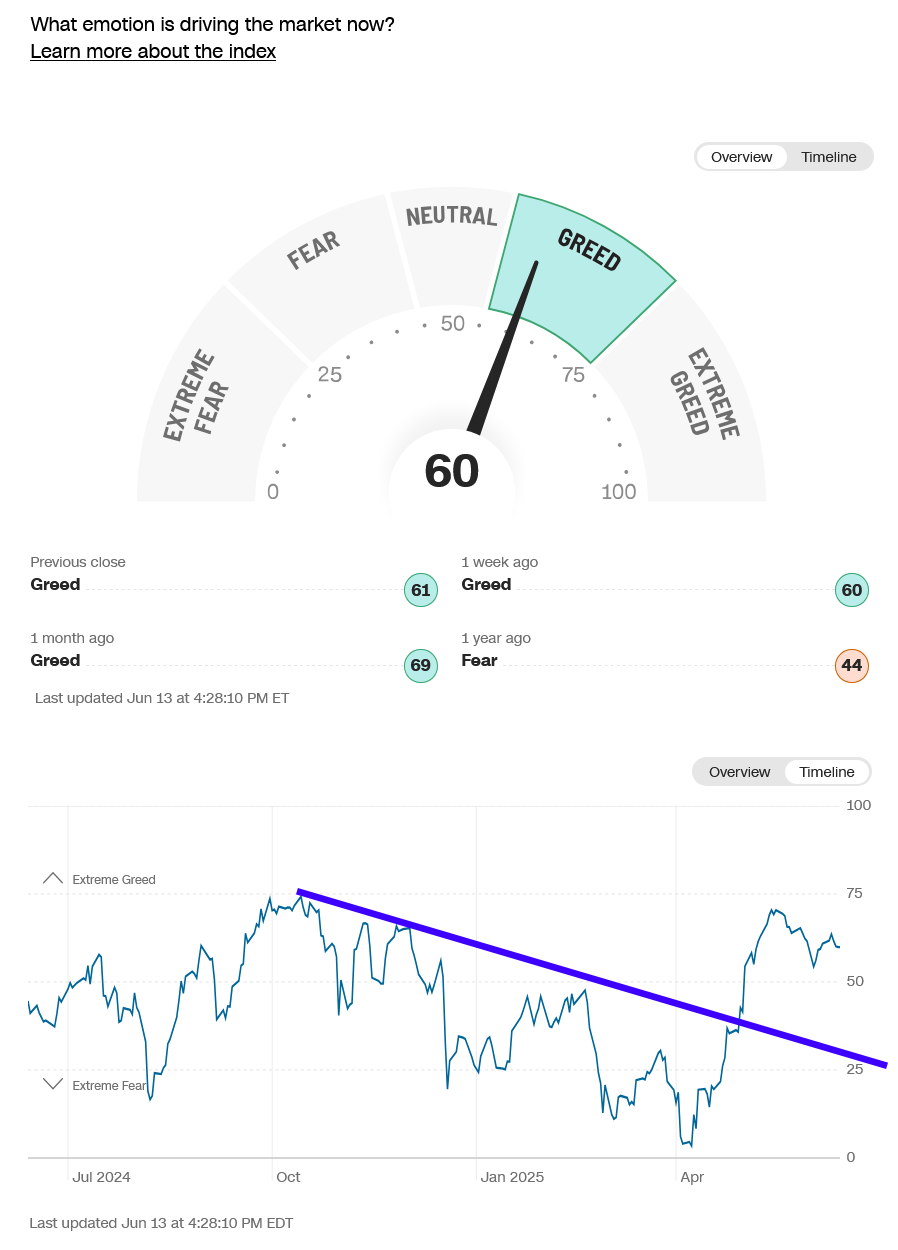
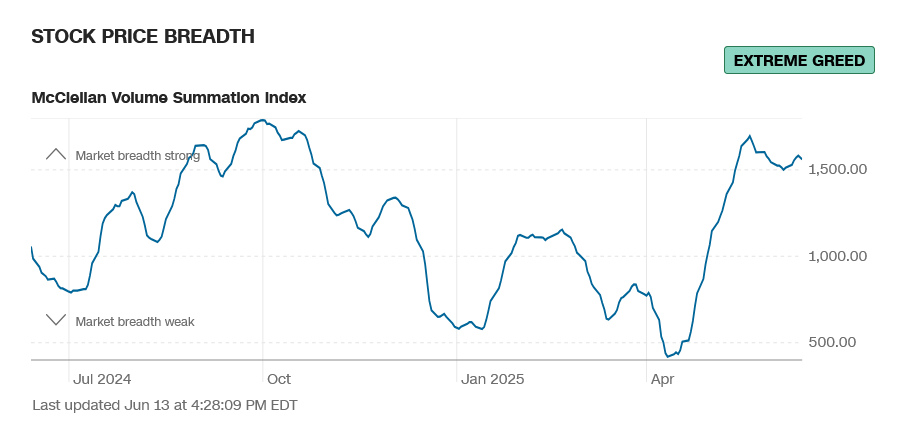
Breadth collapsed late in the week. Sentiment remains in extreme greed.
CNN Fear & Greed Index
 AAII Investor Sentiment Survey
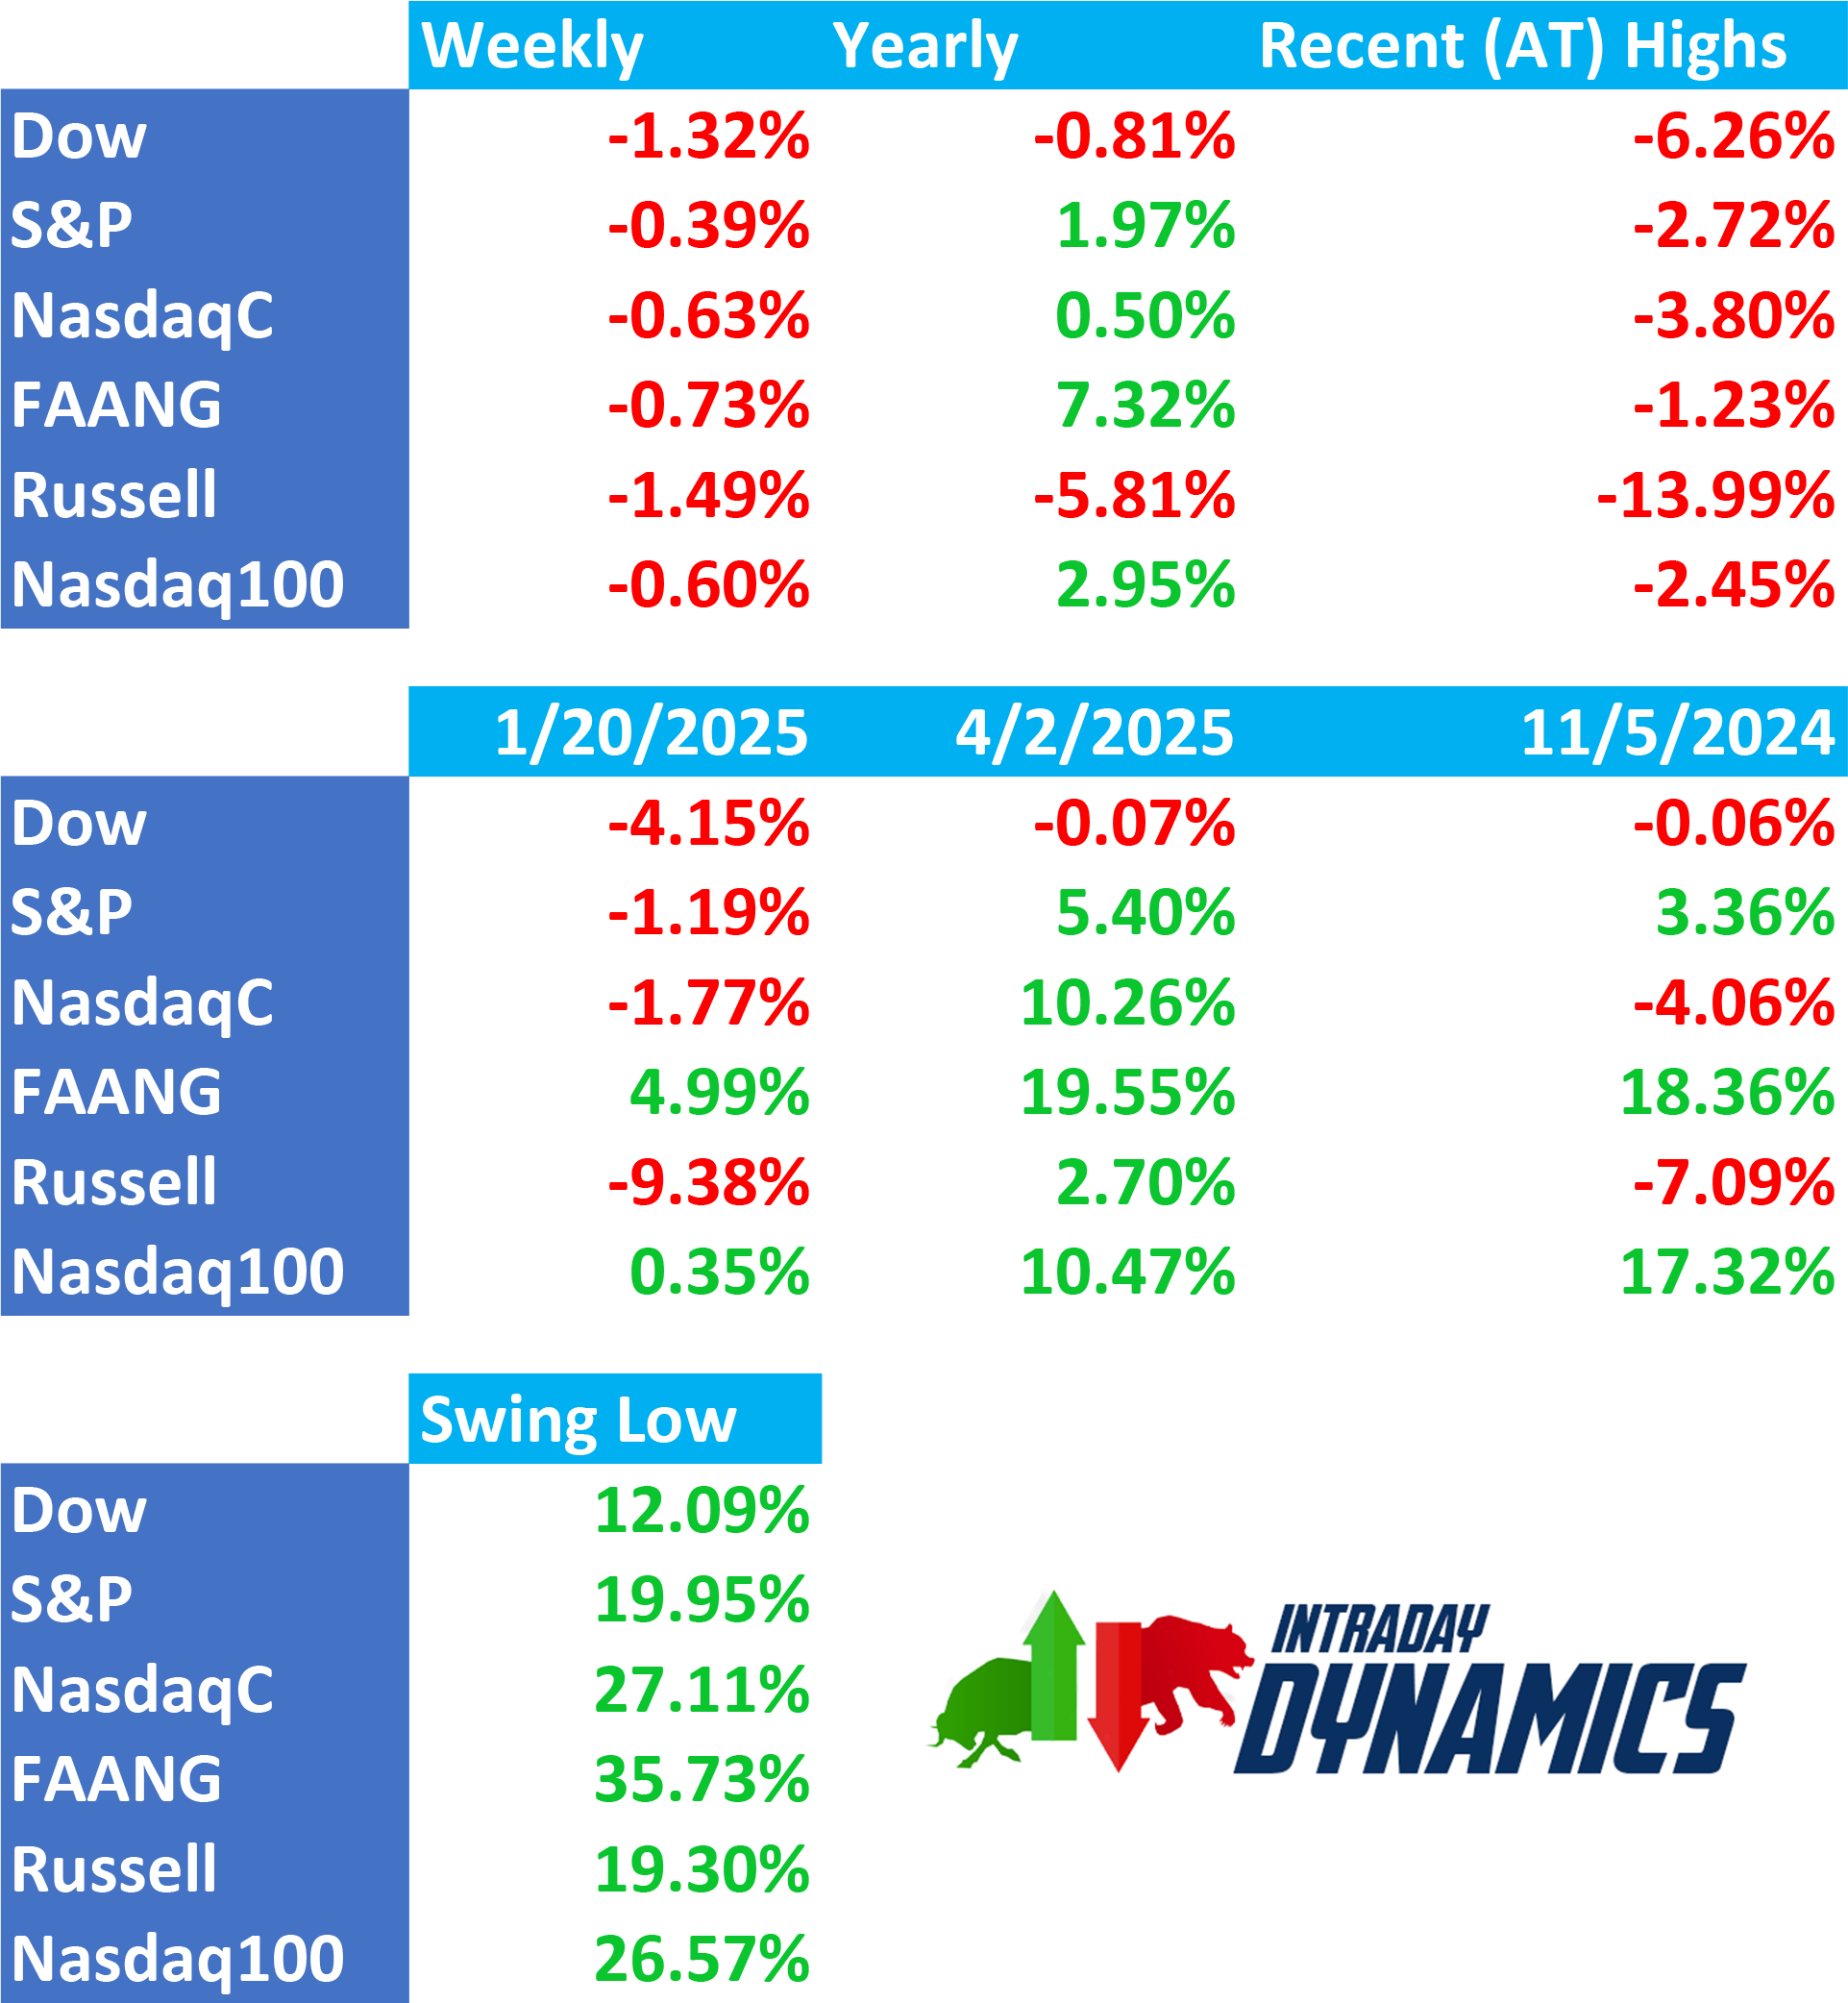
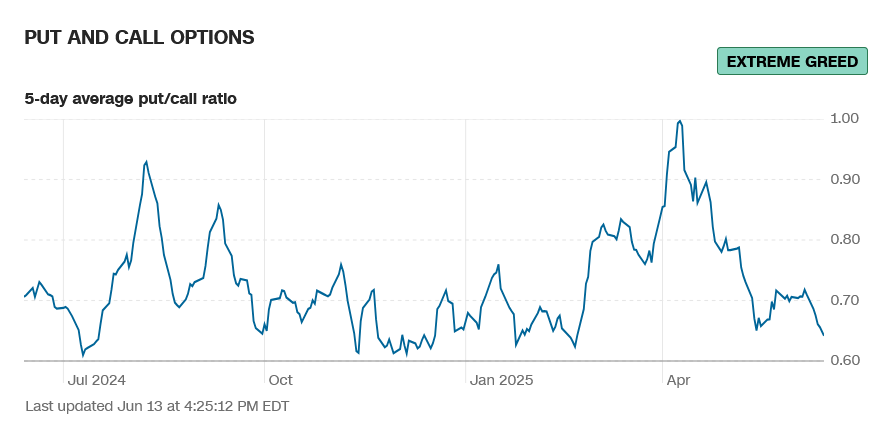
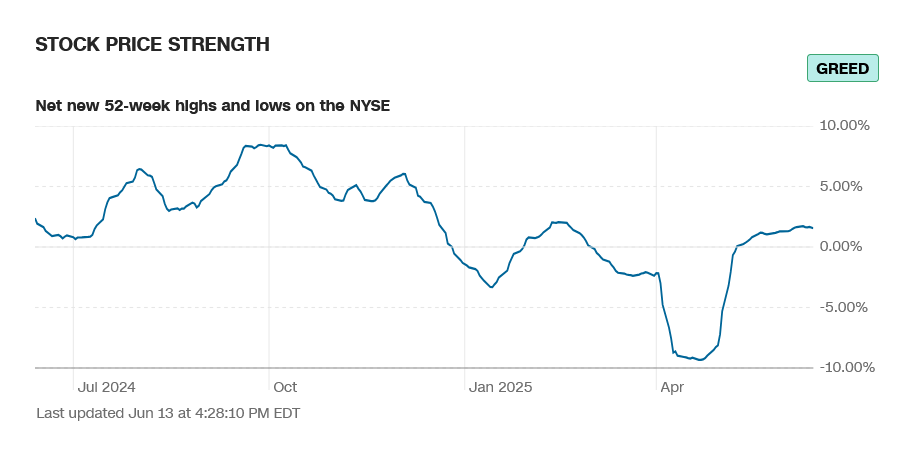
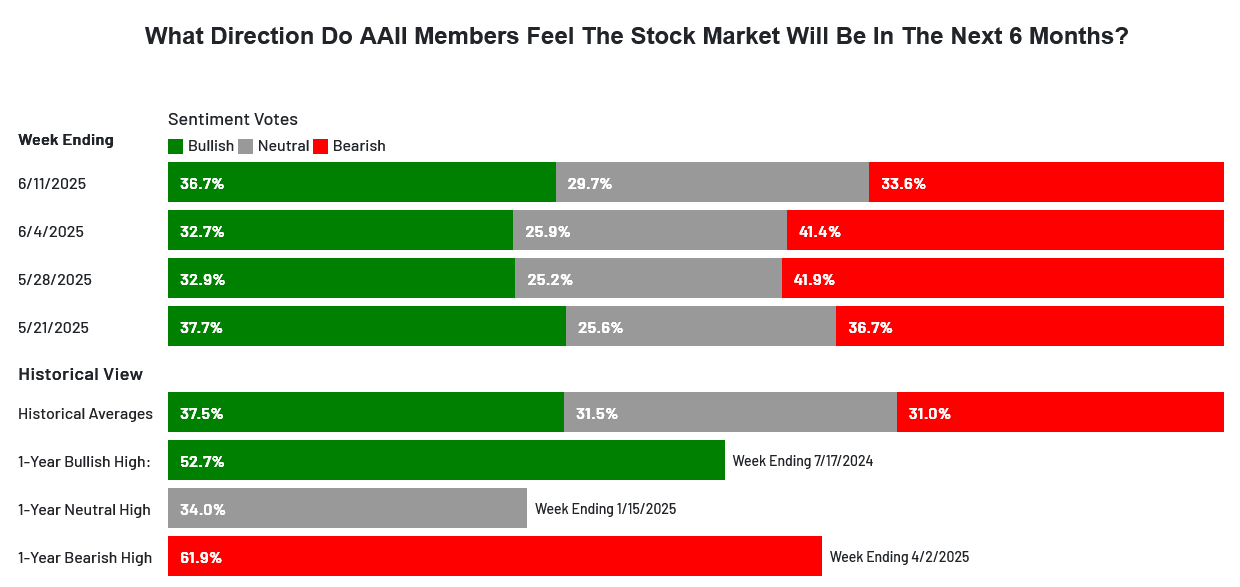 Sentiment remains in greed and extreme greed on several fronts. The CNN Fear and Greed Index moved to 60 and still reads greed. Breadth flattened out on the week and sentiment reads extreme greed. Latest AAII Sentiment Survey: Pessimism Falls as the bulls out number the bears for the first time since 29 January 2025. The Dow A/D moved down to 6843, moving away from a record high again. The VIX moved higher and closed above 20 on top of a reversal week up, +24.15%. The Put/Call dropped to 0.64 and reads extreme greed. The 52-week, A/D was flat at +1.66% and reads greed. The Dow closed the week down -1.32%, closing on the bottom end of a reversal week down. The S&P ended down -0.39% in the bottom of a reversal range. The Nasdaq Composite was down -0.63% and the Nasdaq 100 was down -0.60%. The NYSE FANG set a record high intraweek and reversed to close down -0.73%. The Russell was down -1.49% on the bottom of a reversal week down. The 10-year notes closed higher, in the middle of the weekly range. The yield on the 10YR decreased to 4.407%.
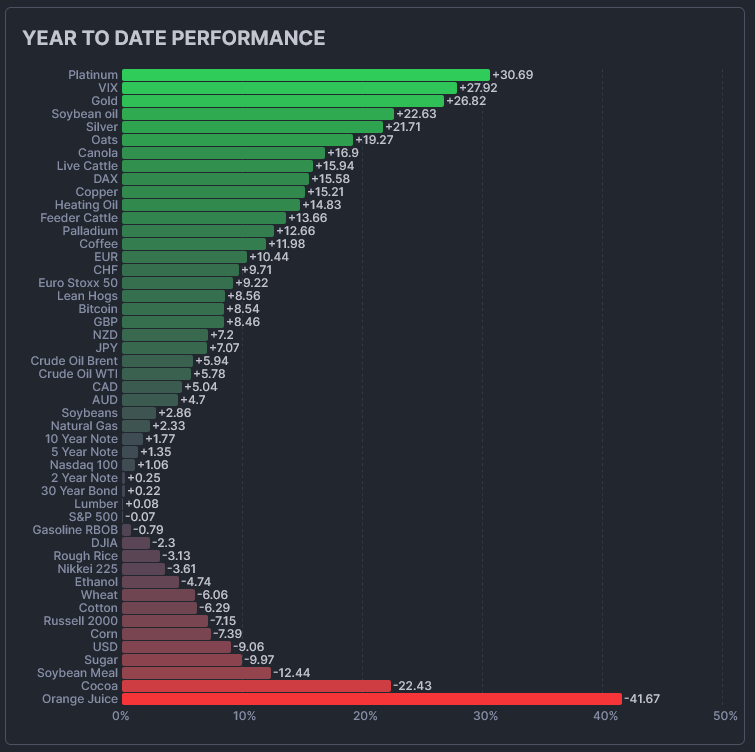
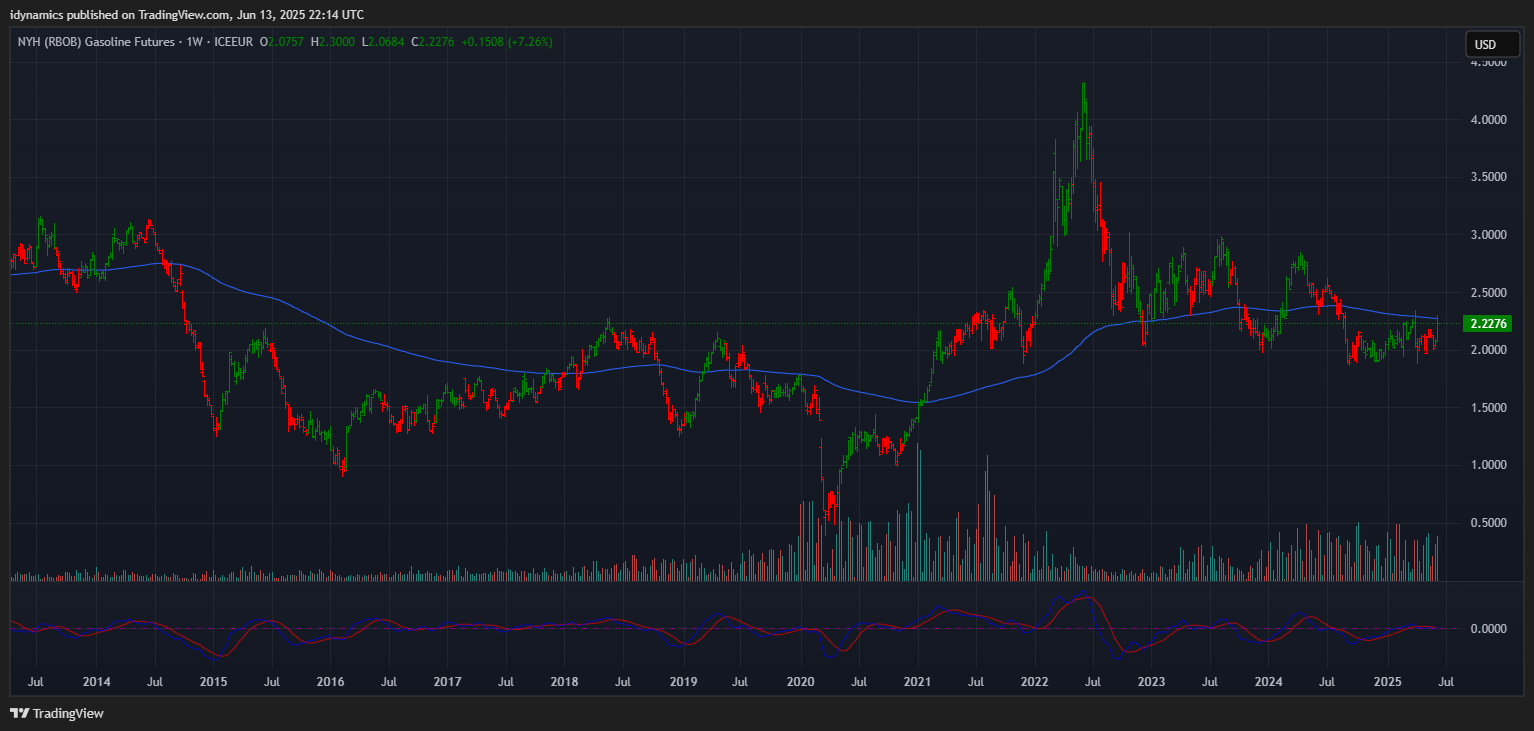
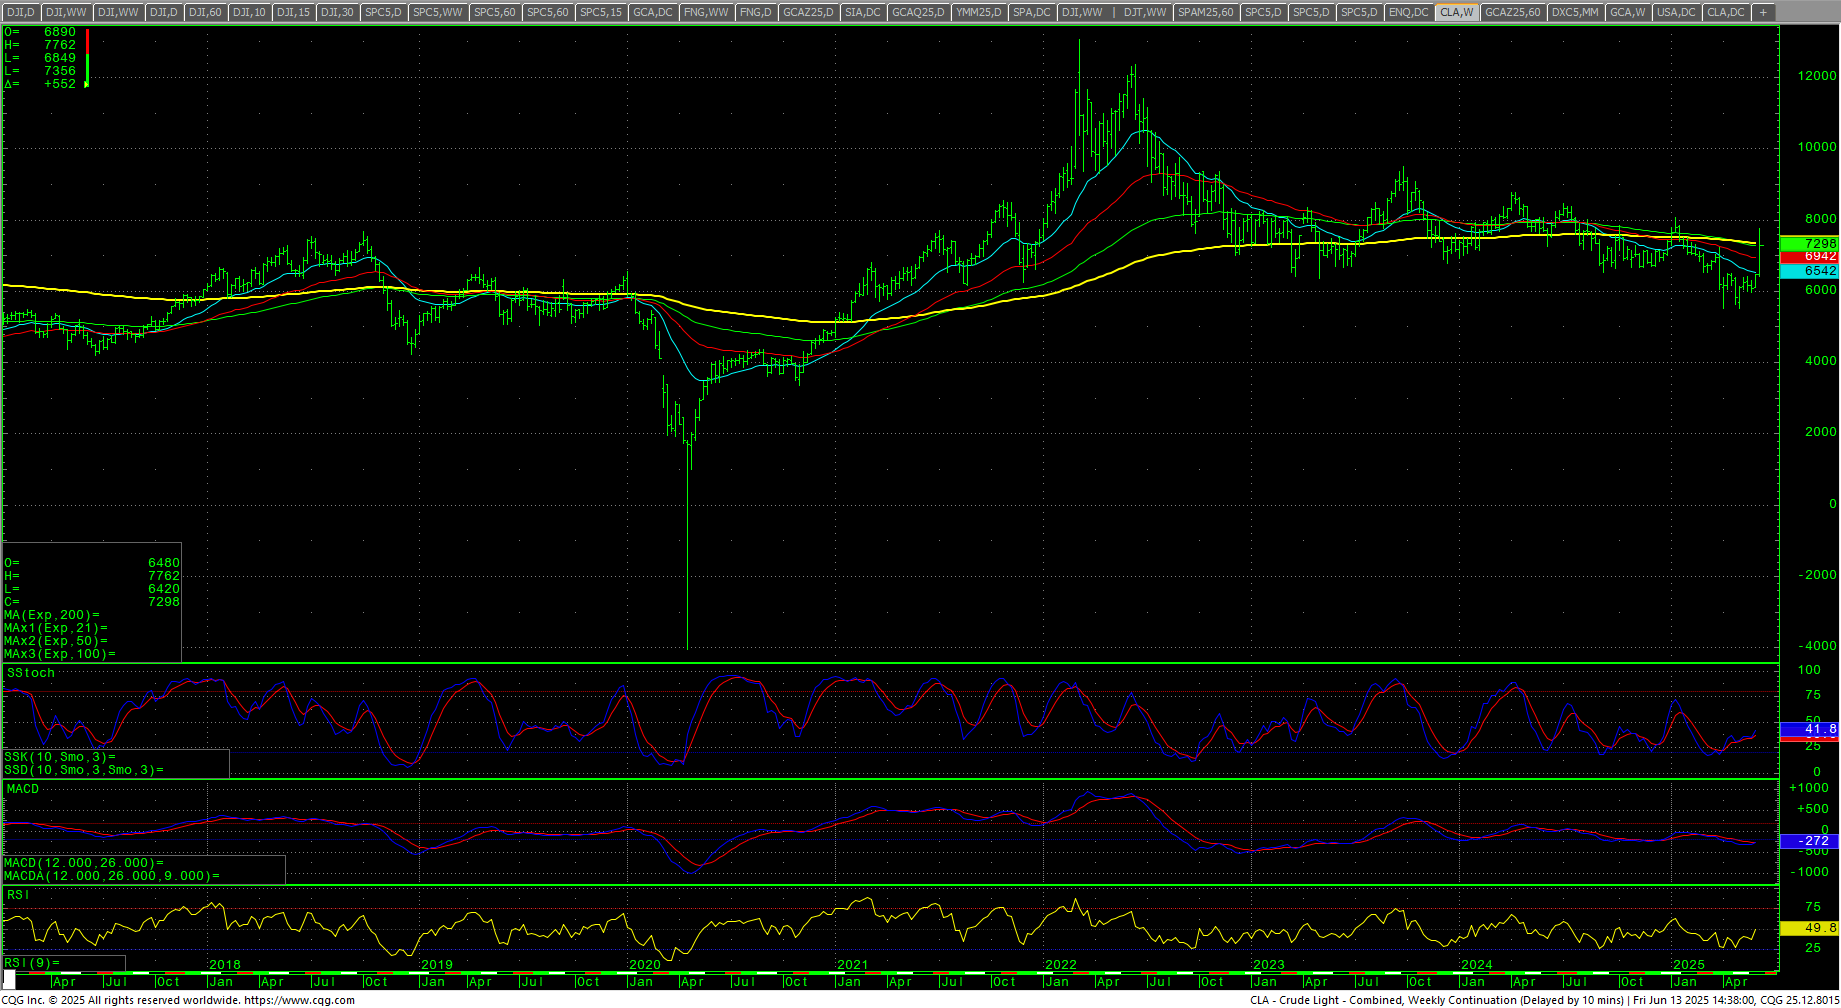
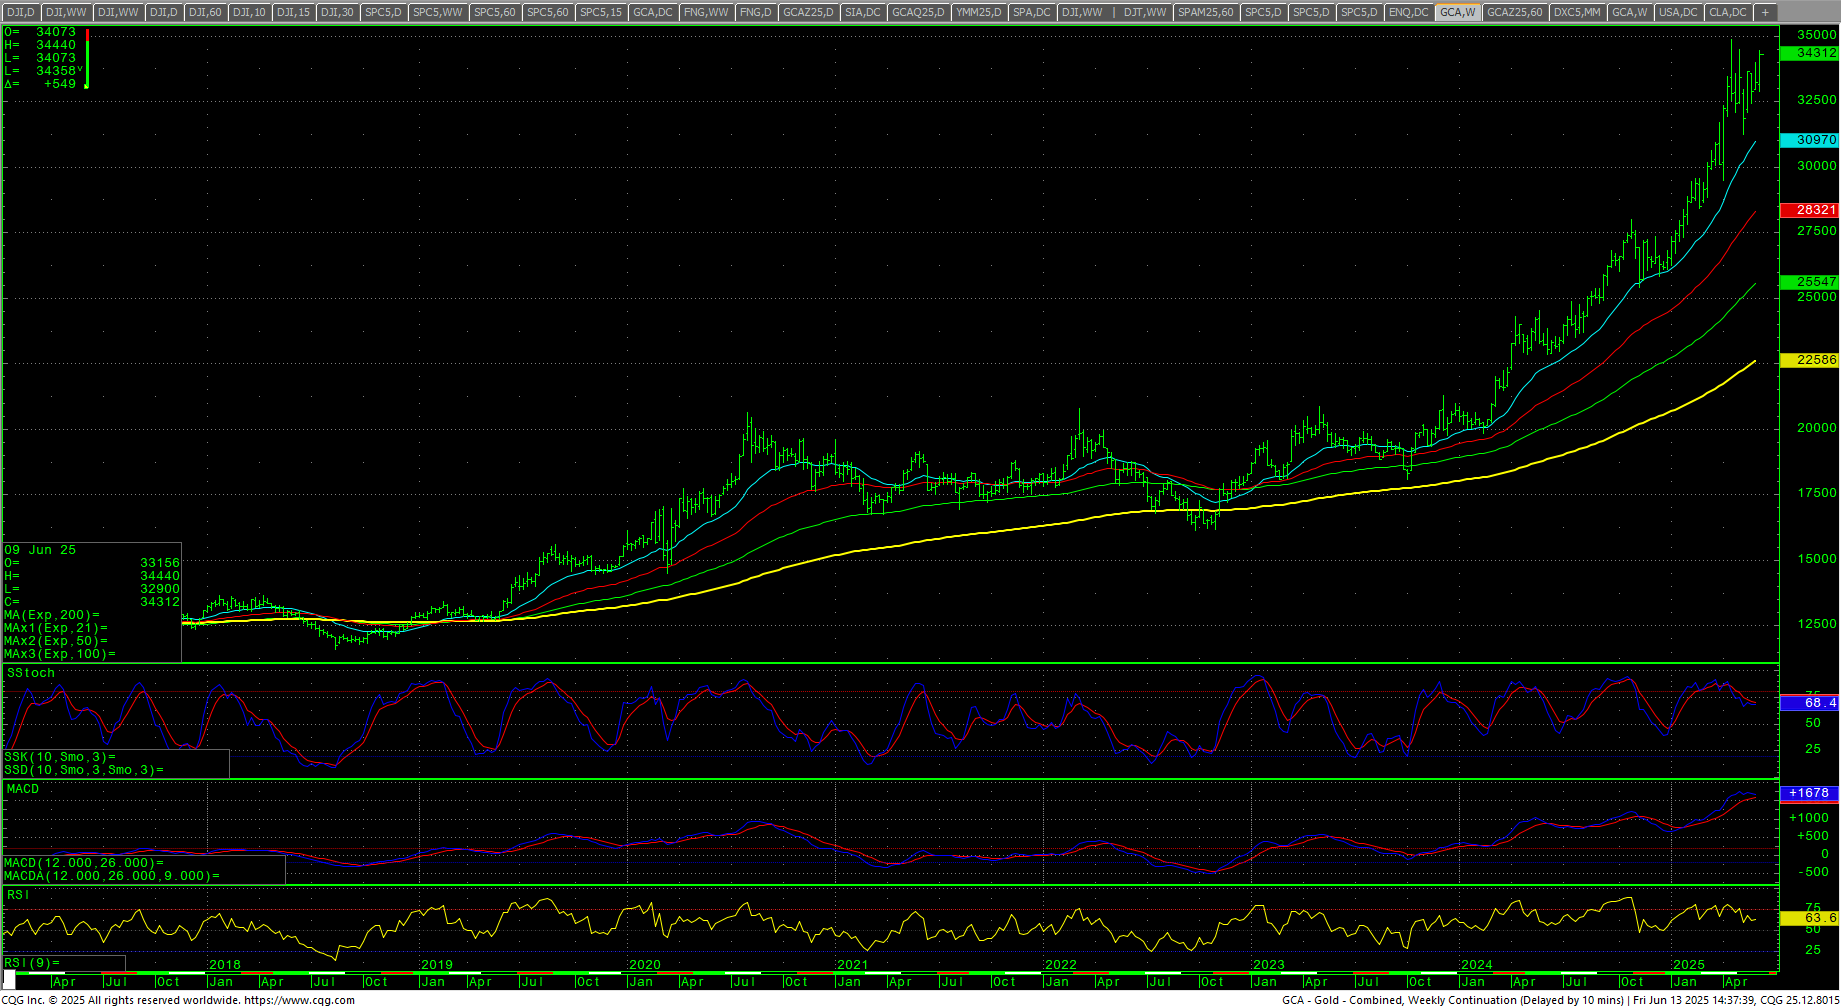
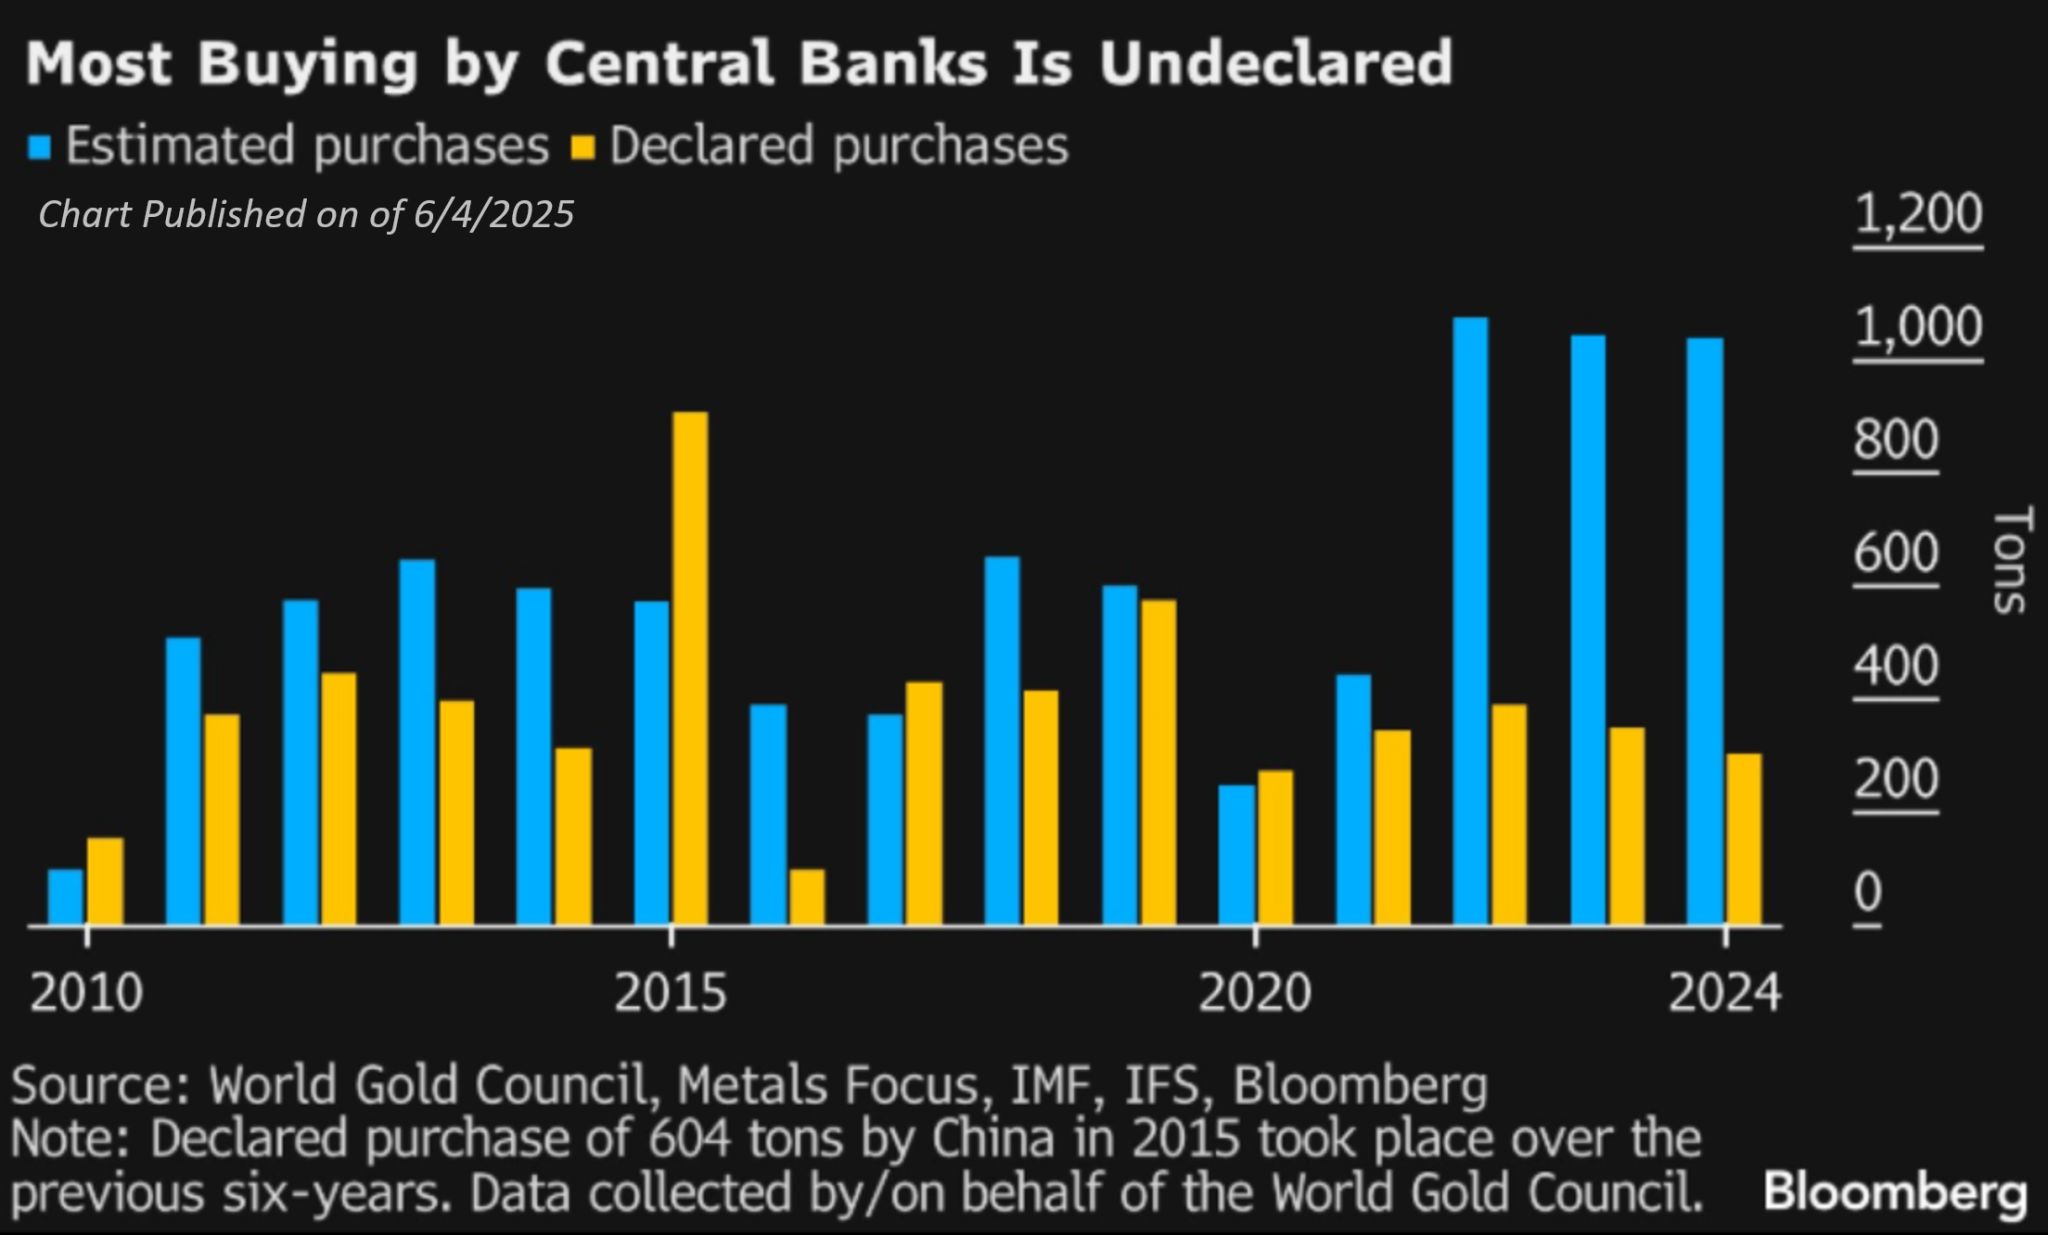
The CRB Index jumped +1.47%. Crude oil exploded higher on conflict, setting a five month high before backing off late on Friday. Gold rallied with spot Comex futures setting a record high weekly close above the $3400 level. Another thing about the Gold is that the recent massive Central Bank buying went mostly undeclared for the past three years. The CoT for the S&P 500 saw slight movement up for dealers and commercials while non-commercials liquidated. The CFTC S&P 500 Non-Commercial Net Positions moved up sharply to end at -127.7K which may indicate new shorts.
Timing Points
Monday through Wednesday marks critical cycle timing with potential for volatility/volume/wide ranges/extremes. This kicks off a period of heightened cycle activity that runs into Fall of this year and continues into Q1/Q2 of 2026. Tuesday is Retail Sales data for May (est: -0.6%) and Capacity Utilization (est: 77.7%). Wednesday is Housing Starts (etc: 1.37M) and Building Permits (est: 1.44M) and FOMC and the Powell press conference. Friday is LEI (est: -0.1%).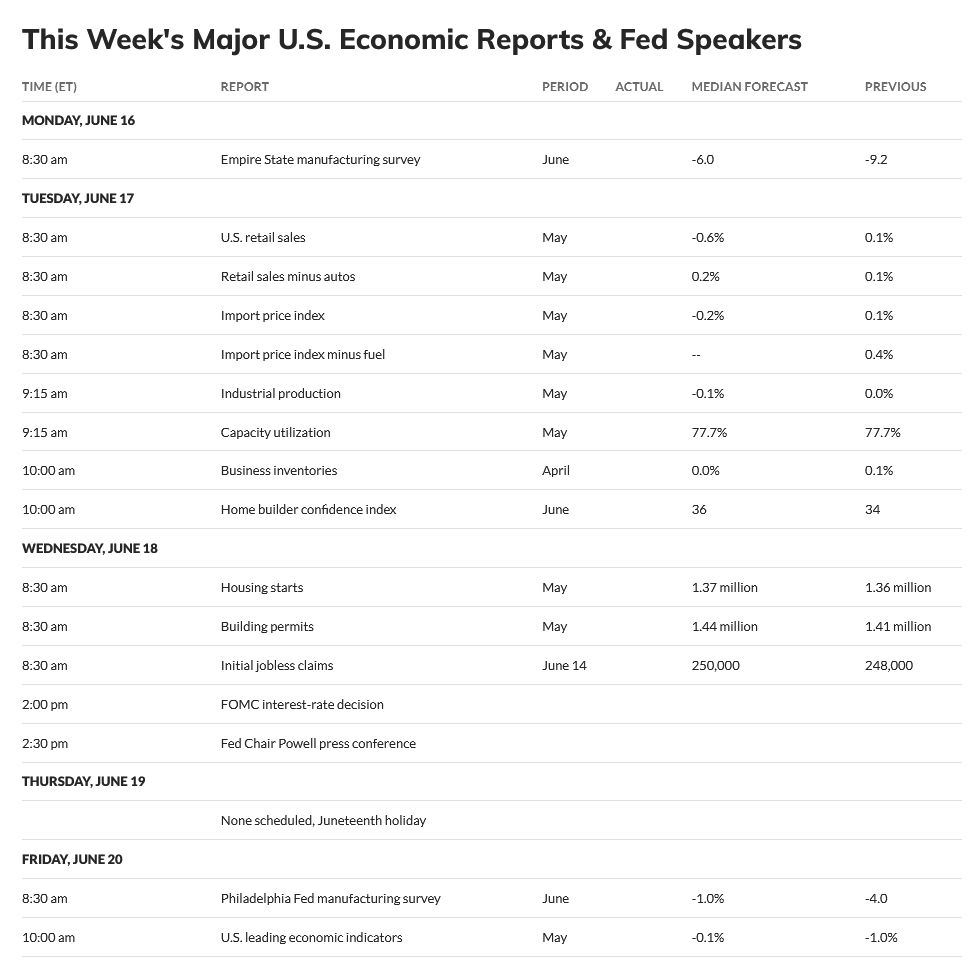
- 06/16-18 *** X critical, volatility/volume/wide ranges/extremes
- 06/20-24 *** X
- 07/03 *** X
- 07/10 **
- 07/17 **
- 07/23-24 *** X
- 08/01 *** X
- 08/05 *** X kicks off critical week through
- 08/08 *** X through
- 08/11 *** X critical week
Dow Jones Industrial Average
Dow Jones Industrial Average Weekly H-L-C
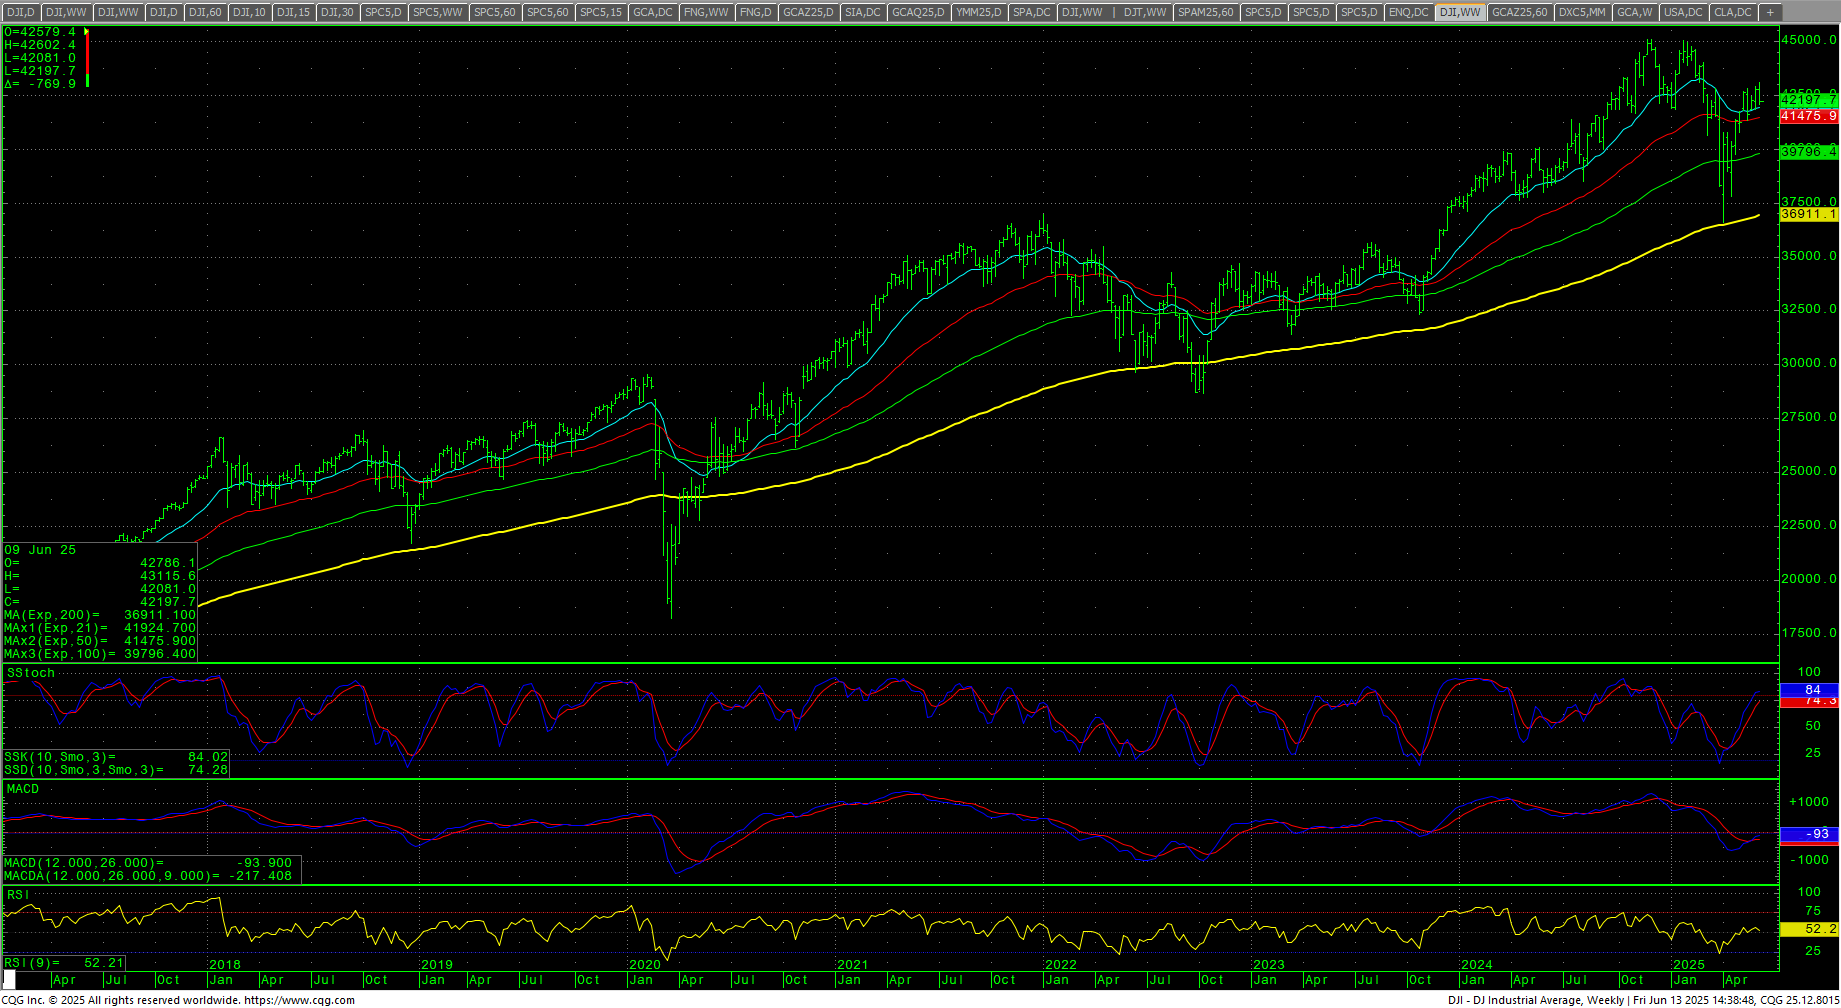 The Dow closed the week down -1.32% on the bottom of the weekly range after prices traded to, and rejected the ‘final’ “Death Zone” from record highs. That zone remains at 42943 through 43061 (intraday high on Wednesday was 43115.6). The 50-day and 200-day MAs remains in a Golden Cross. The weekly stochastics are still in an uptrend. The daily stochastics are hooking lower from a bearish back up with a preliminary bearish divergence. The MACD is also in a bearish divergence. The RSI came down from and overbought reading and a bearish divergence. The 200-day MA starts the week at 41746.20 and is trending higher.
Dow Jones Industrial Average Daily Candles
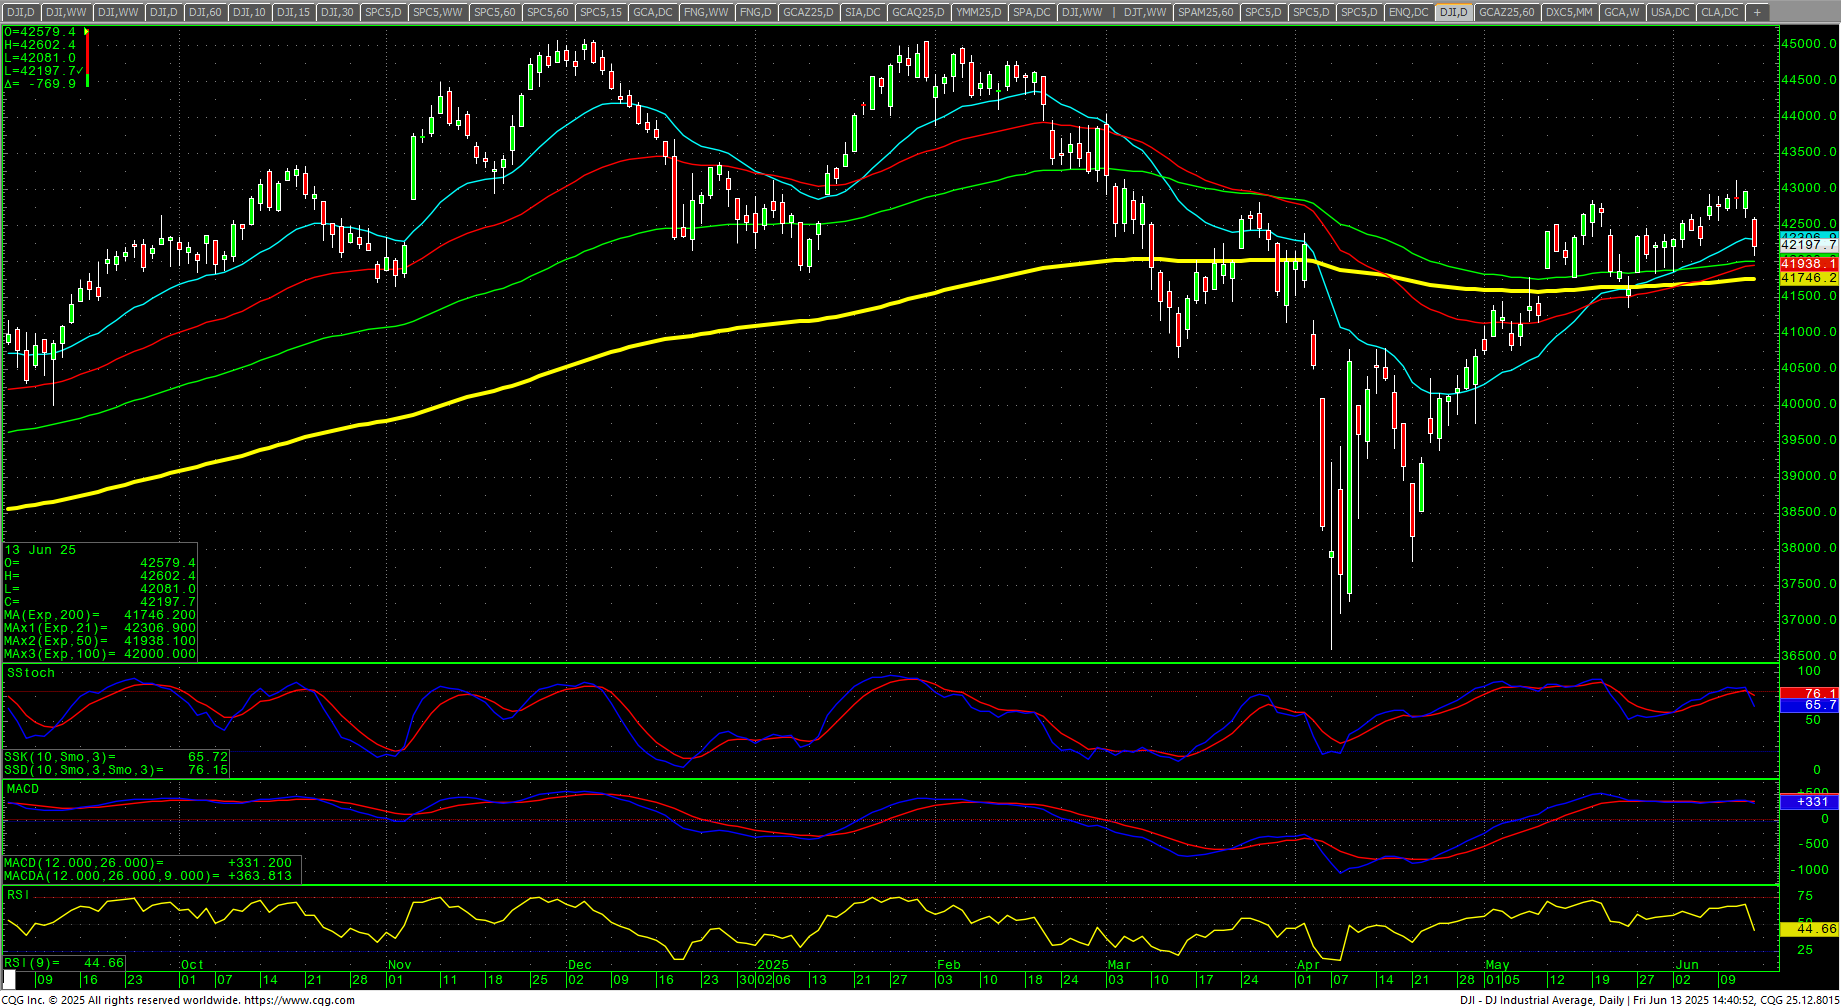 The hourly is oversold on Friday’s close. Support is near-term pivotal support at 42025/42020. Closes under 42020 set up 41580 through 41427. A breakdown under the 41427 area will set up 41105 with counts to critical short-term support at 40631/40628. Closes under 40628 are near-term bearish for test of 39096/39864. Closes under 39864 offer full counts to 38237/38146. Closes below 38146 should minimally test 37828 and would open counts to retest the 36611 low with support at 37103.
Dow Jones Industrial Average Hourly H-L-C
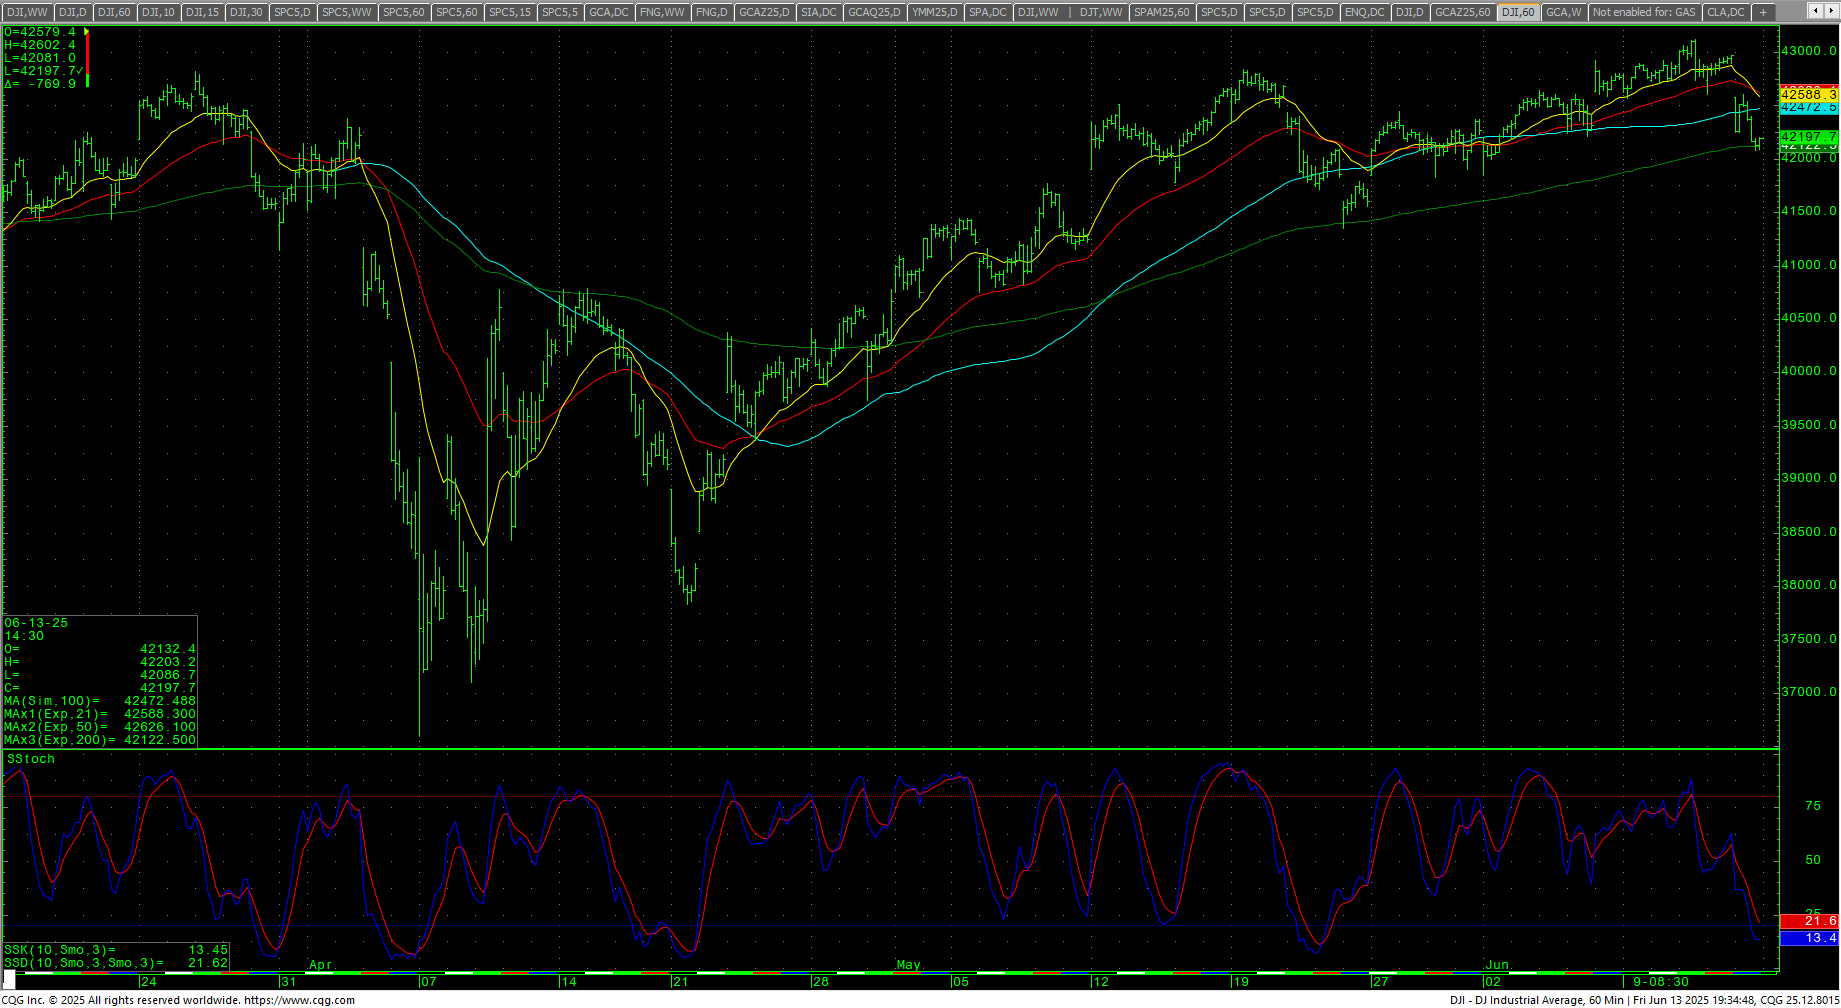 Resistance is 42325, 42477, 42598 and pivotal at 42720/42725. A drive above 42725 can test 42856/42871 and suggest a test of critical resistance at the Death Zone level at 42943 through 43061/43115 area. Daily closes above 43115 should minimally test 44034 and will open potential for a test of the all-time highs at 45050/45054/45074. Closes over 45074 opens counts toward 45244 and 45426 (Fibonacci target). Rallies with closes over 45426 will reopen longer-term monthly targets in the 47400 level with targets of 46568 and 46954.
| Resistance | Support |
|
|
S&P 500 Cash Index: SPX
S&P 500 Index Weekly H-L-C
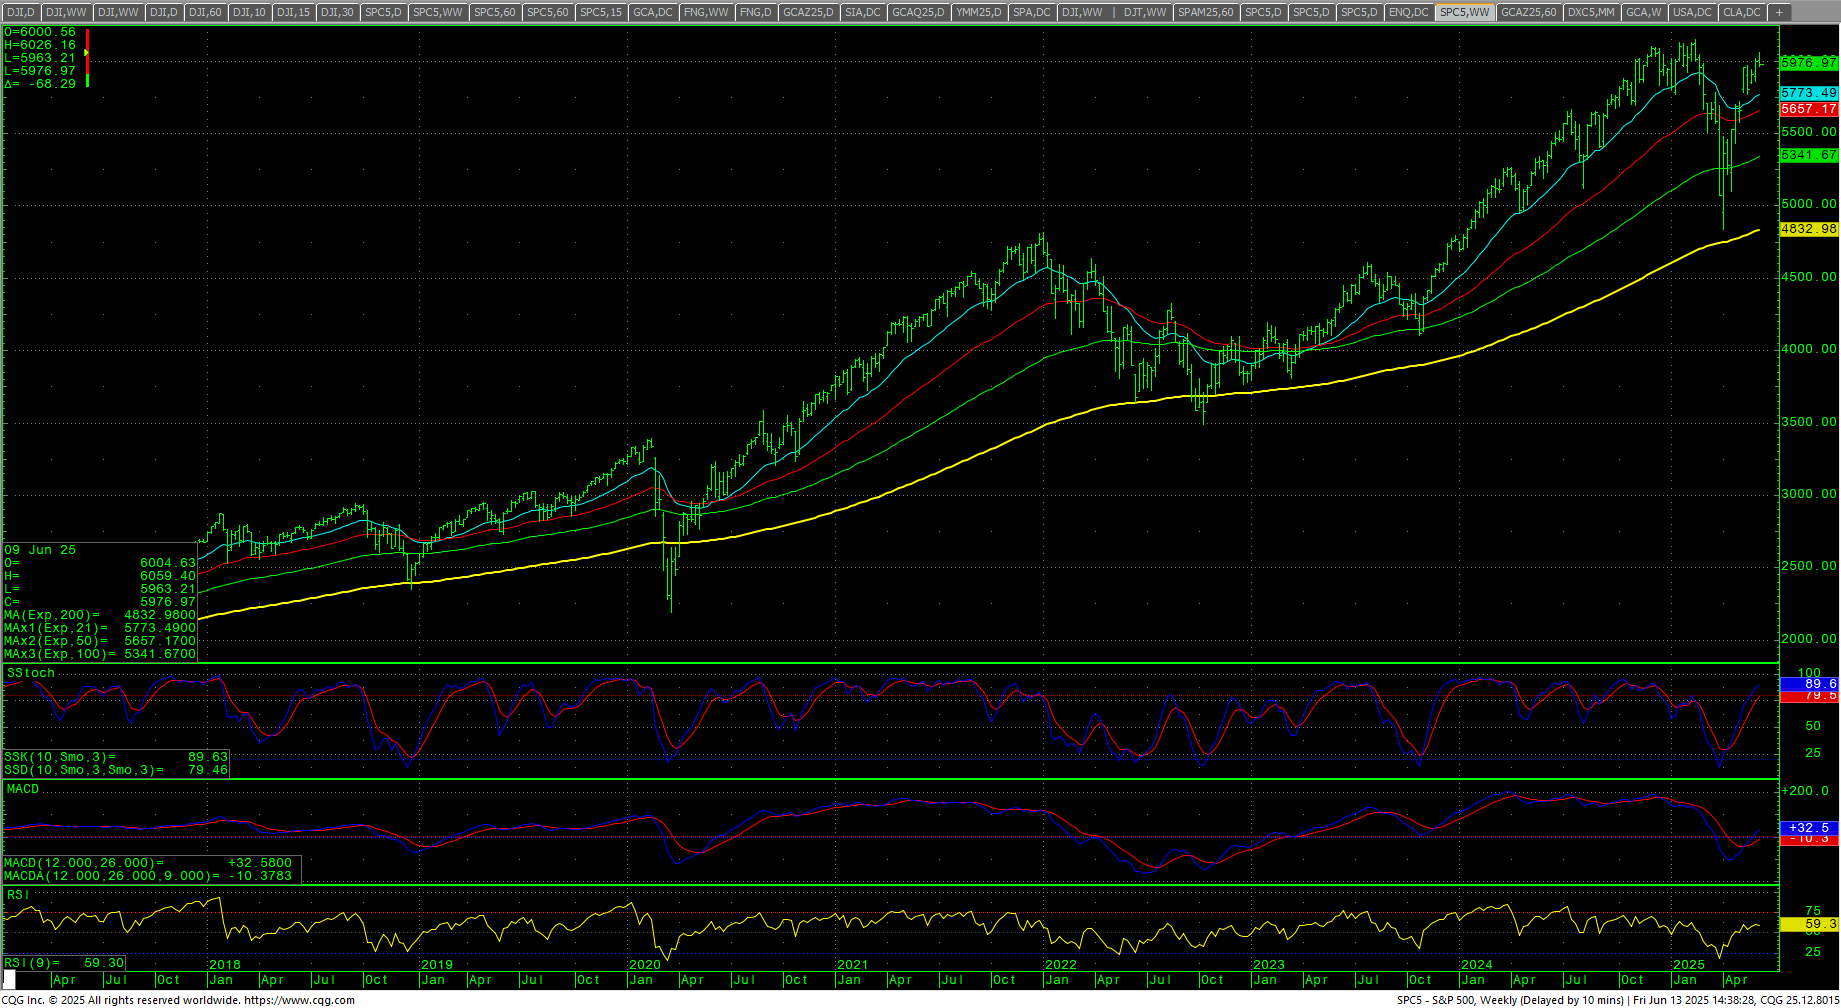 The S&P traded into new highs for the drive before reversing on the week in Friday’s selloff as the daily reacts to an overbought preliminary bearish divergence. The RSI and the MACD are reacting to bearish divergences. The weekly is still in an uptrend. The hourly is slightly oversold on Friday’s move. The 200-day MA is 5703.18 and is trending higher.
SPY Weekly Candles
 Prices closed right at support of 5976. Further declines can test 5951/5947 with pivotal near-term support at 5926/5924. A breakdown under 5924 sets up a move to 5913 with pivotal short-term support at 5878/5875. Trading under 5875 opens counts to 5767 with trading support at 5840. Closes under 5767 count to 5448/5447 with counts to critical support 5302/5298. A breakdown under 5298 sets up 5141/5123 with potential to open intermediate-term counts for a retest of the 4835 swing lows with support still at 4884/4880. Closes under 4880 are bearish and open counts to 4614 through 4586.
S&P 500 Index Hourly H-L-C
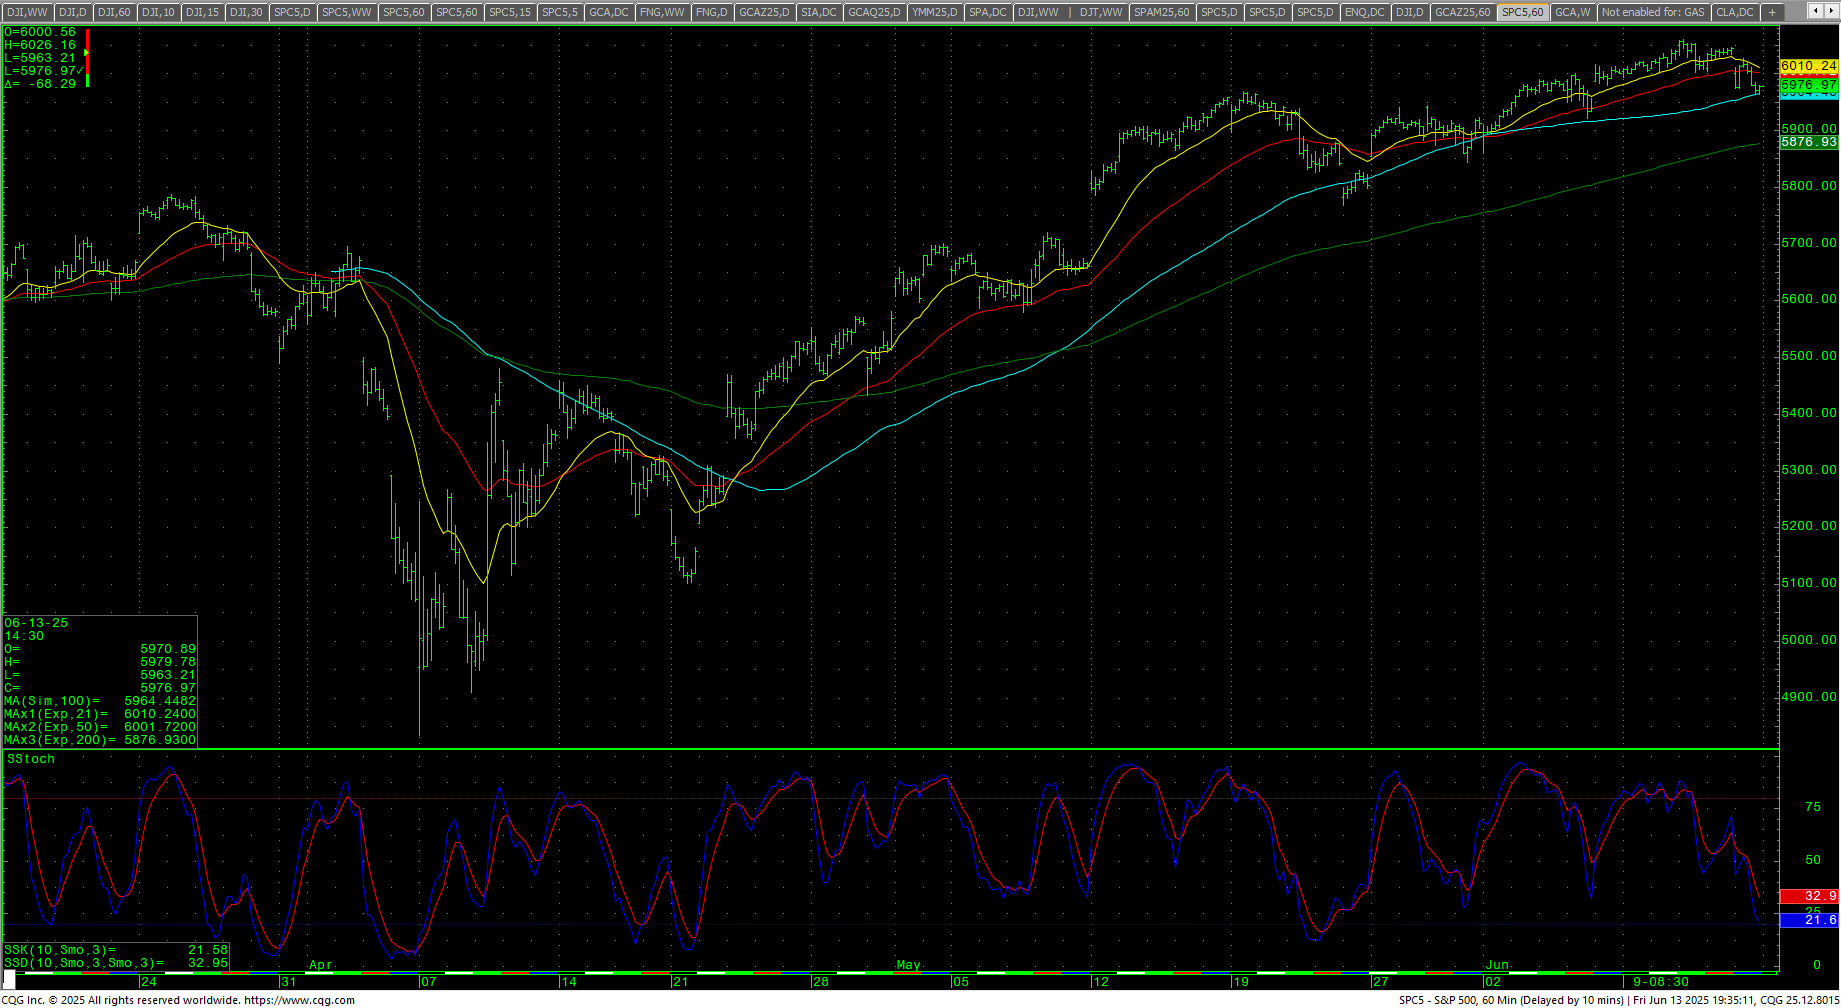 Resistance is 5984/5986, 5999/6000, 6012 and 6023/6025. A drive over 6025 can retest 6059/6061 with counts to 6112/6114 and full counts into critical resistance at the intraday high of 6147.43. Rallies through 6148 should test 6160 with a shot at a target of 6180.35/6181. Closes over 6181 open counts to 6224 and 6296. Above 6296 can carry to 6368 with counts into the 6440 area. Closes over 6440 will open counts to 6584. A breakout over 6584 sets up 6638 and 6692.
| Resistance | Support |
|
|
Charts courtesy of CQG, Inc., CNN, Koyfin, Trading View and AAII