
TECHNICAL ANALYSIS (by Intraday Dynamics)
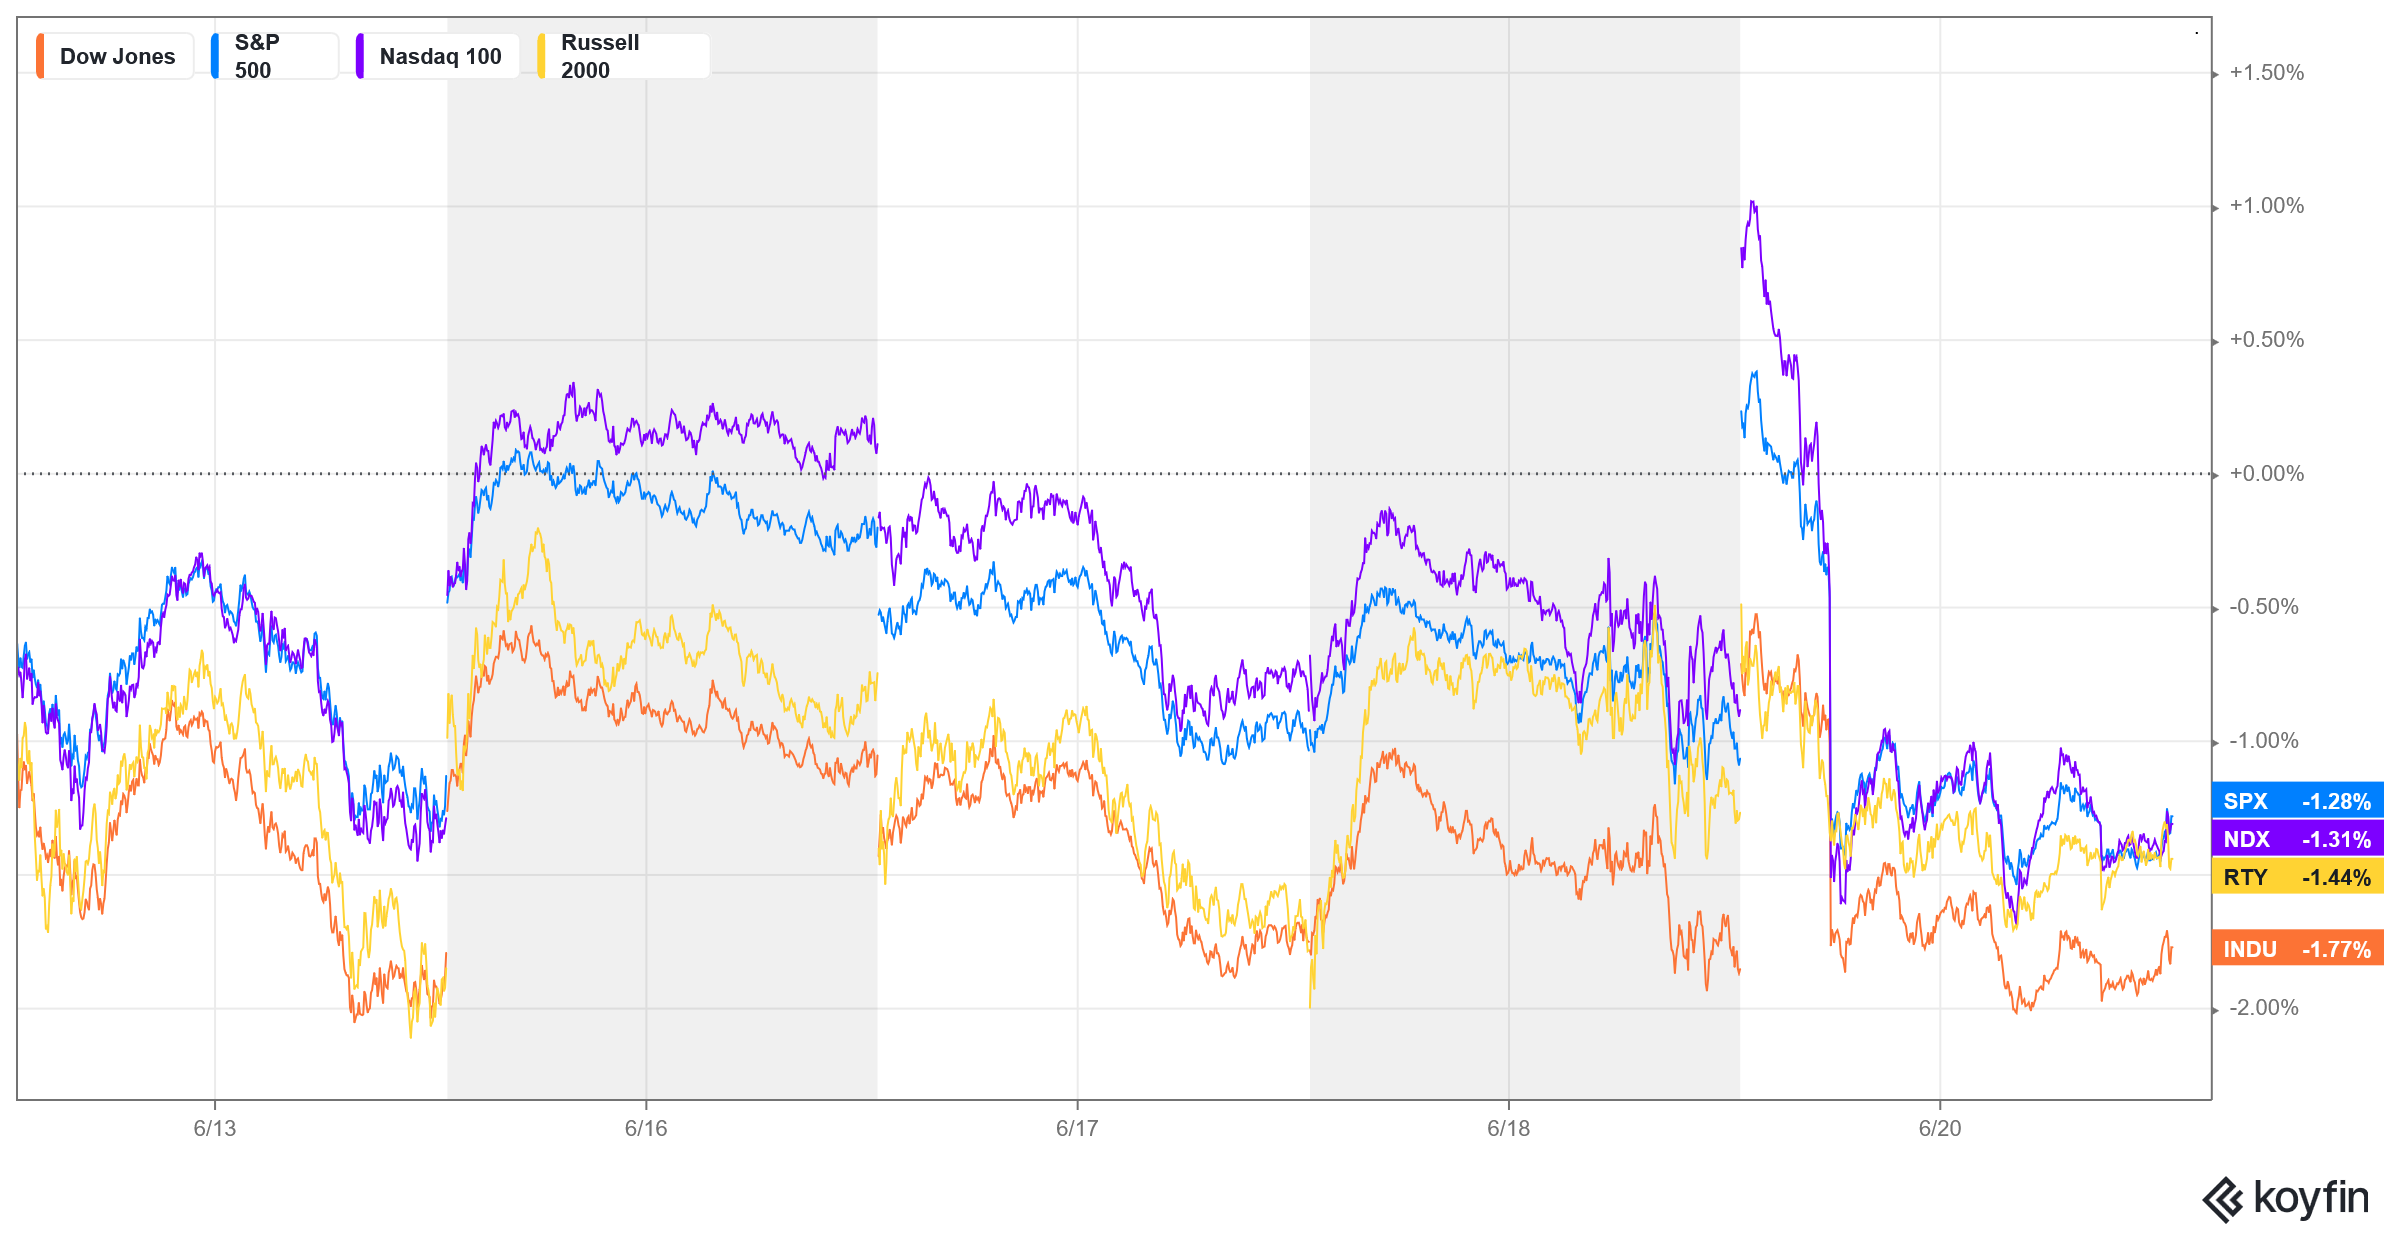
Major Indices Week of June 20, 2025
 NYSE Volume

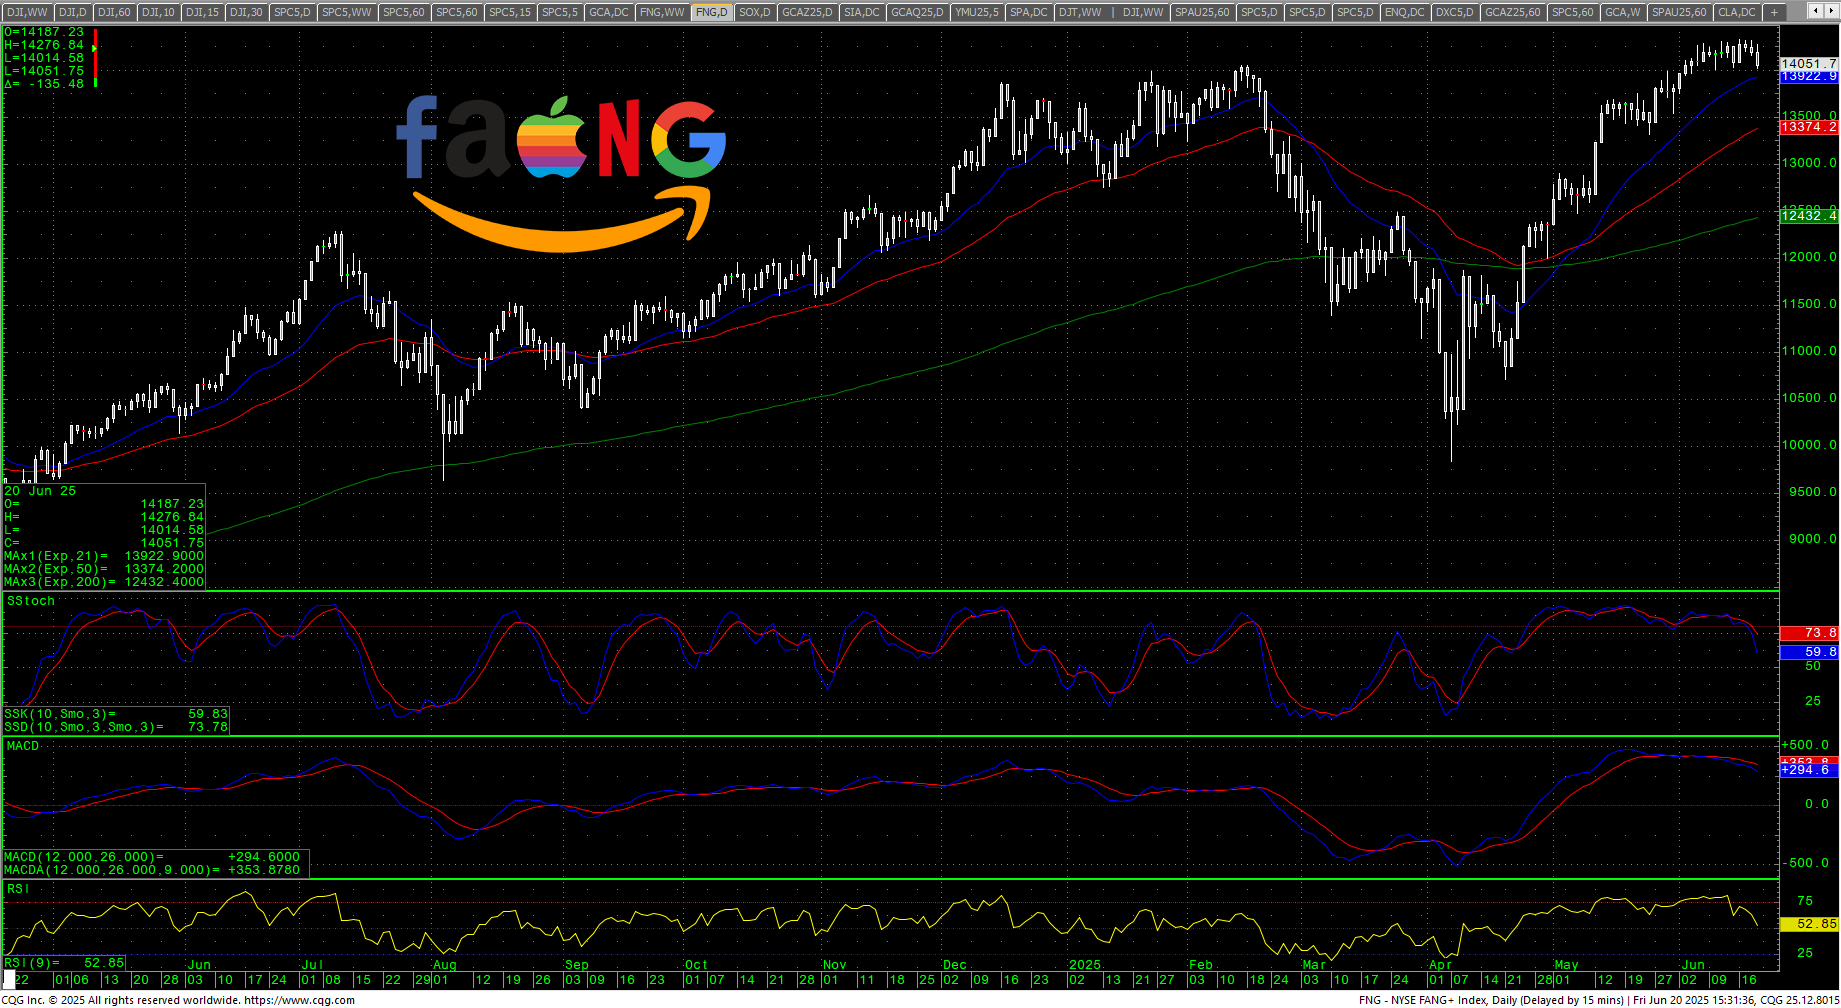
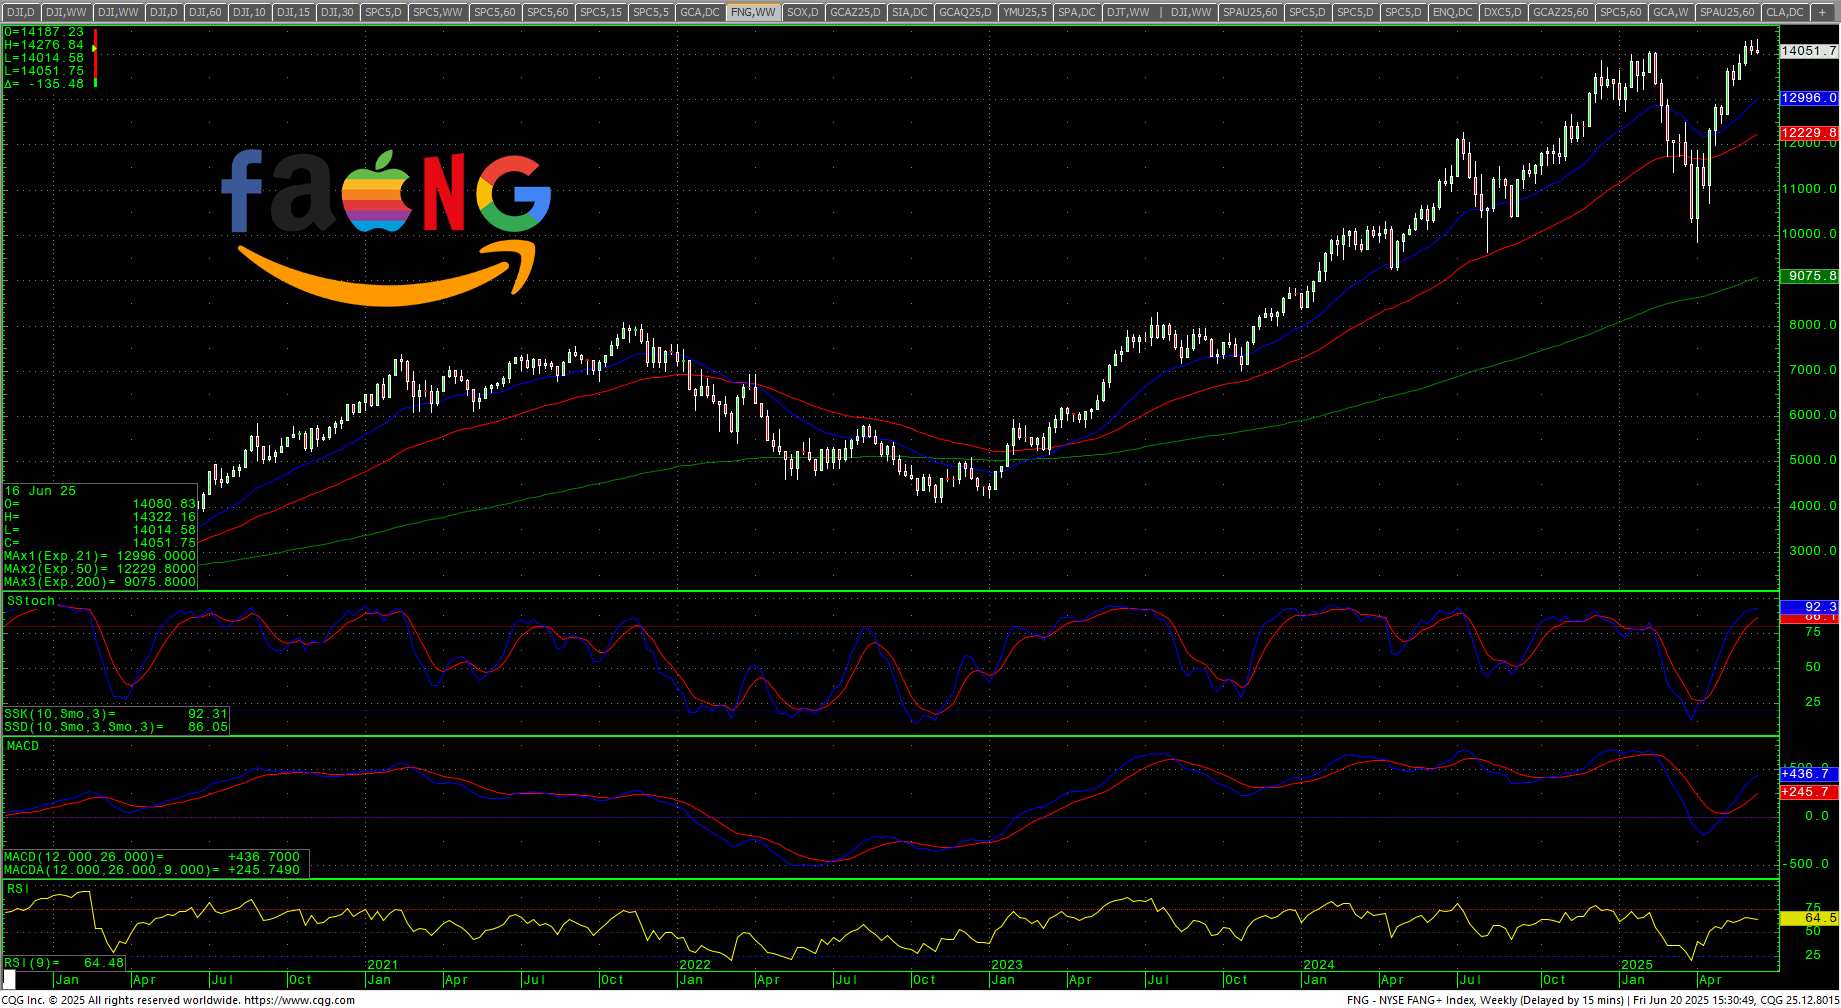
 NYSE FANG Daily Candles
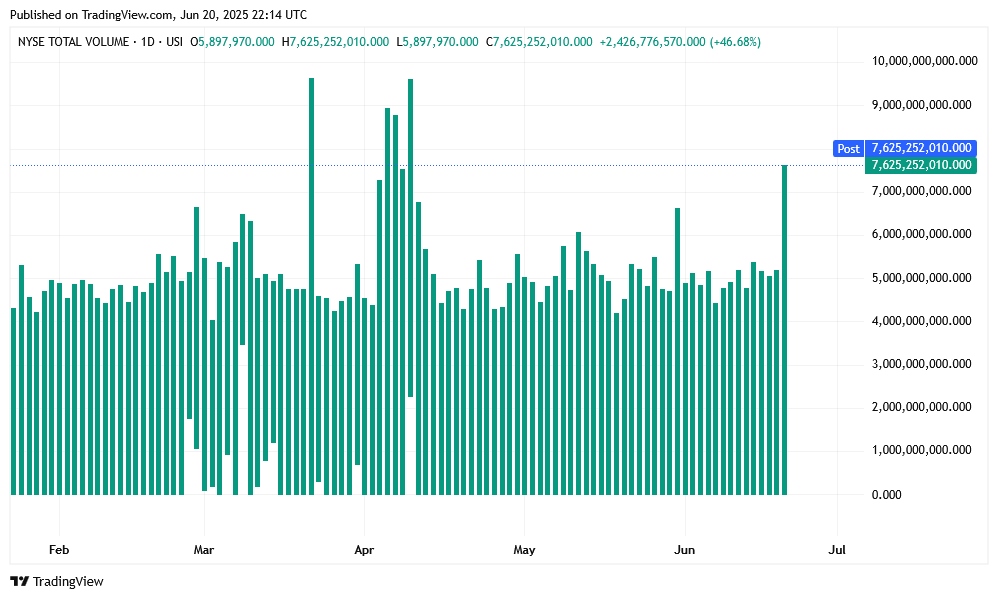
 Stocks ended the week flat to mostly lower in a shortened trading week. Friday’s historical “Quadruple Witching Day” saw high volume, but did not see massive volatility. The $6.8 trillion “OpEx” was expected to see massive volatility in the final 30 minutes and that never materialized. Volume was high at 7.636M but dwarfed the previous “Quad” on 20 March 2025 when it hit 9.636M.
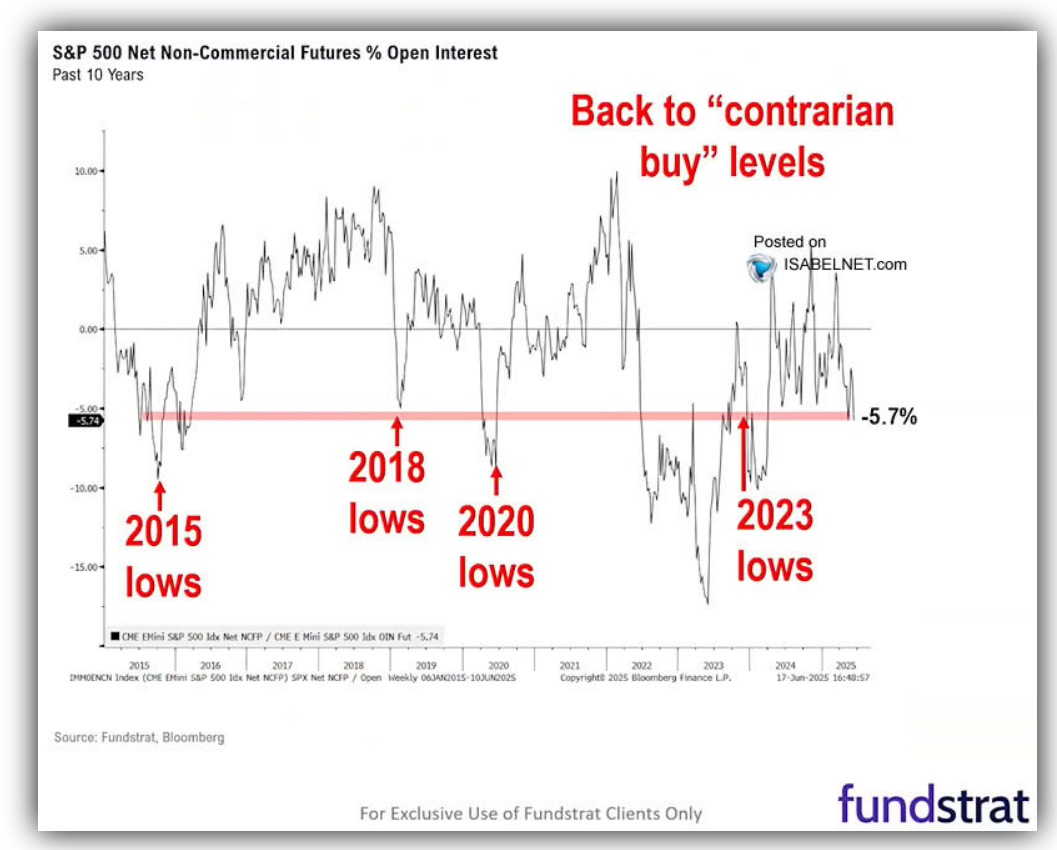 Prices are relatively quiet given the global/geopolitical movements and non-commercial sentiment is drifting back toward contrarian levels.
The FOMC held steady again and released their latest “dot plot,’ which really just shows that they are digesting data rather than predicting. European Central Banks continue to slash and it seems like major economies are in a race to the bottom with the Swiss going ZIRP with talk of negative rates forthcoming. The reality is ZIRP is not a monetary policy, it is an admission that things have gone seriously wrong.
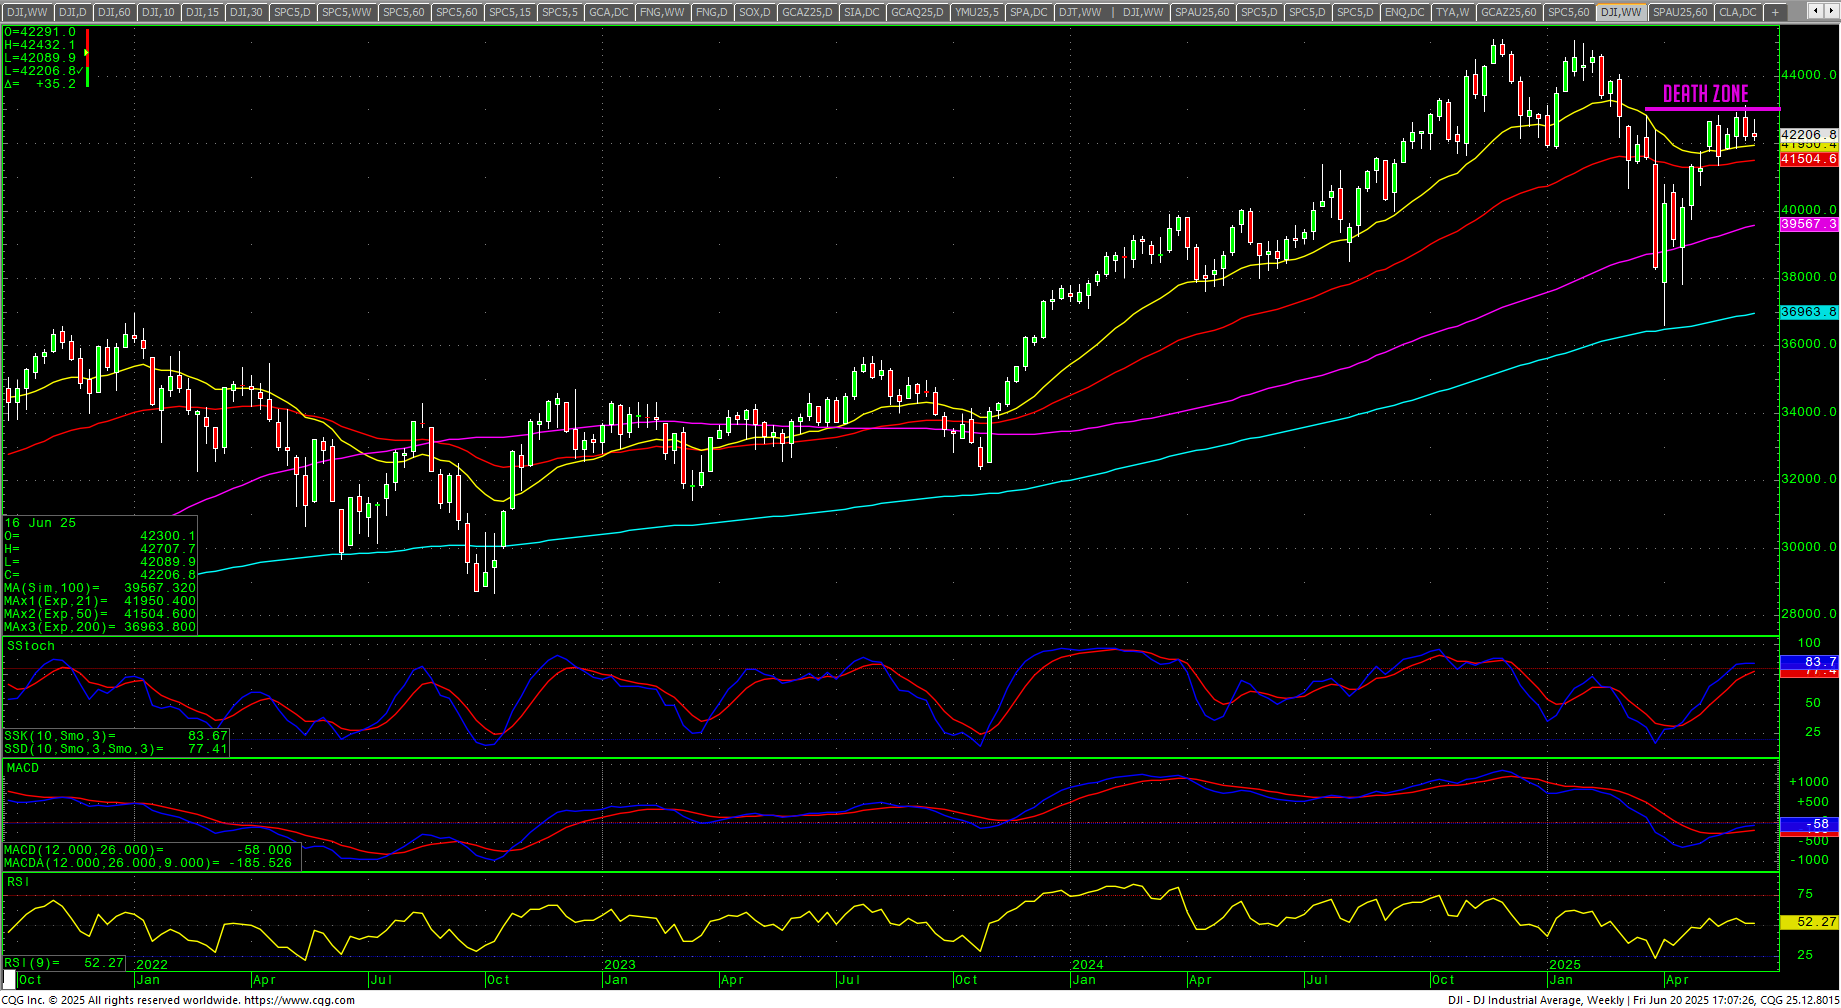
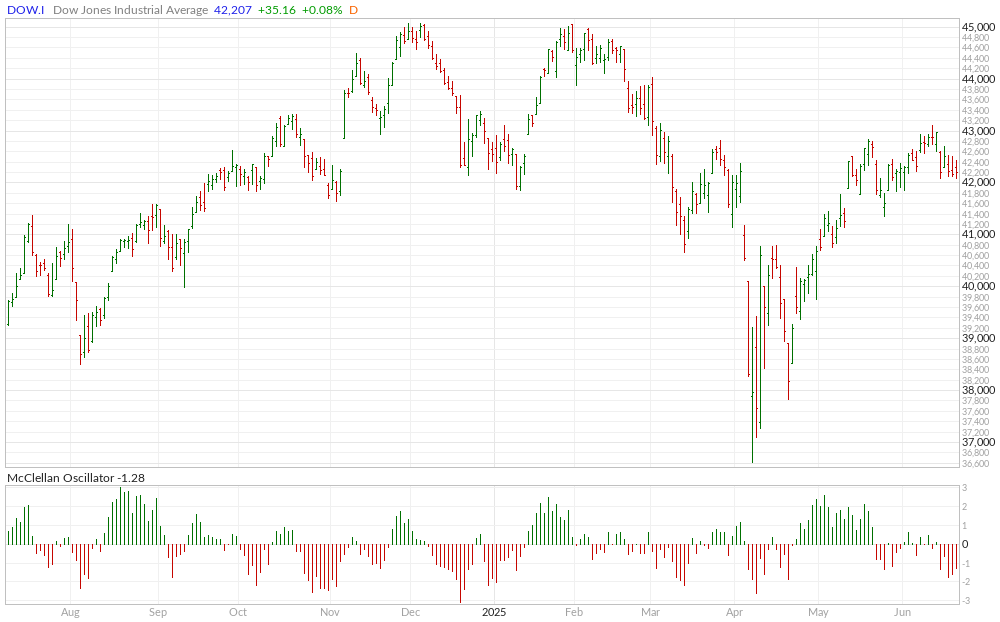
Dow Jones Industrial Average Weekly Candles
 For an update on the longer-term timing outlook, please see the latest update. Early July kicks off a massive longer-term window where the confluence of potential tariffs coupled with invocations to “Listen to the Voice of God” will converge. That is, unless the magic of “two weeks” happens yet again.
From the recent posts:
The reality is that we are now entering a 6-9 month window of extremely volatile longer-term cycles. I am going to issue a cycle timing update this weekend outlining the patterns as we head into Fall 2025.
Long Term Timing Thoughts
“It is looking more and more, from a cycles standpoint, that this will run well into Q4 2025/Q2 2026. Thus, a much more protracted and drawn-out bear and not the “flash crash” that everyone has gotten used to over the past two decades. That doesn’t mean we won’t have significant rallies, but chasing rallies is likely to be a losing strategy until this thing is spent…which very likely will not be until Q1/Q2 2026 at this point. The BIG focus will be late summer and fall of 2025…particularly late September this year.”
So, we are right on the cusp of entering another period where volatility can increase.
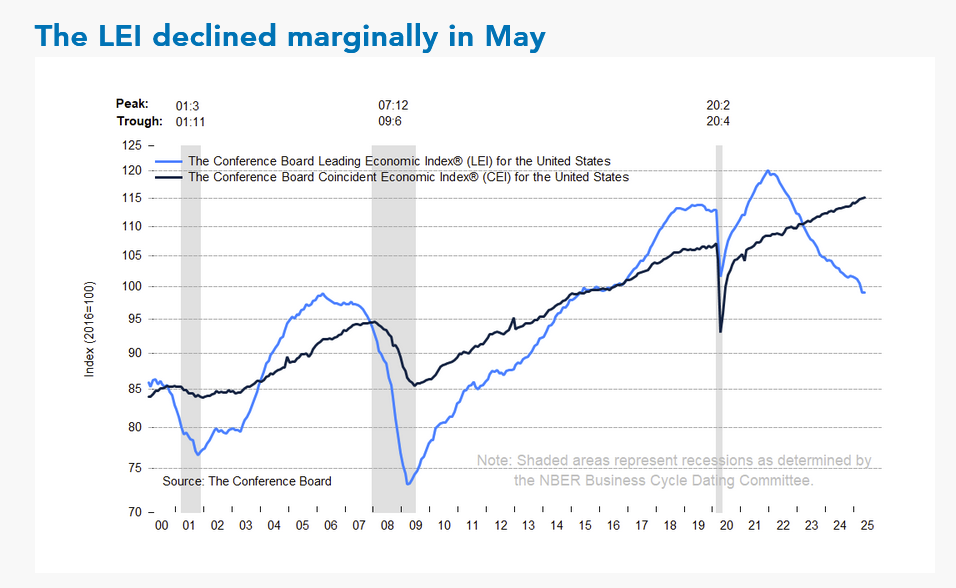
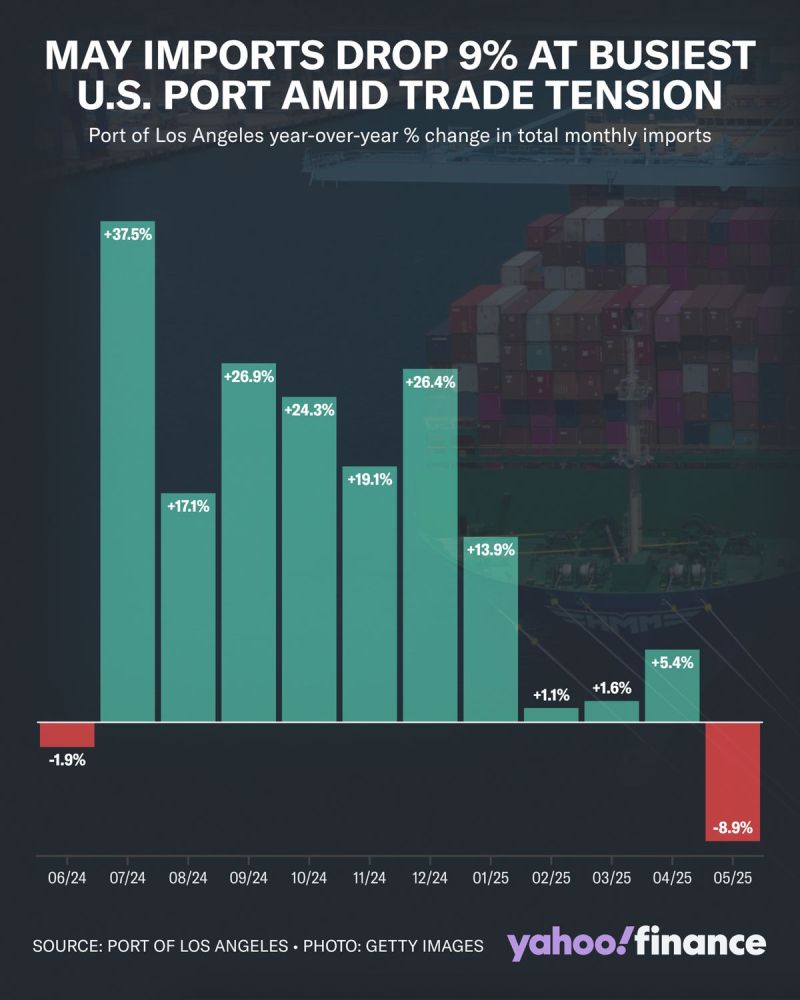 Leading Economic Indicators continue to decline, and Imports have dropped off sharply. Based on the front-running of the tariffs at the start of 2025, we are now on the precipice of seeing the actual impact of higher tariffs/taxes on imported goods.
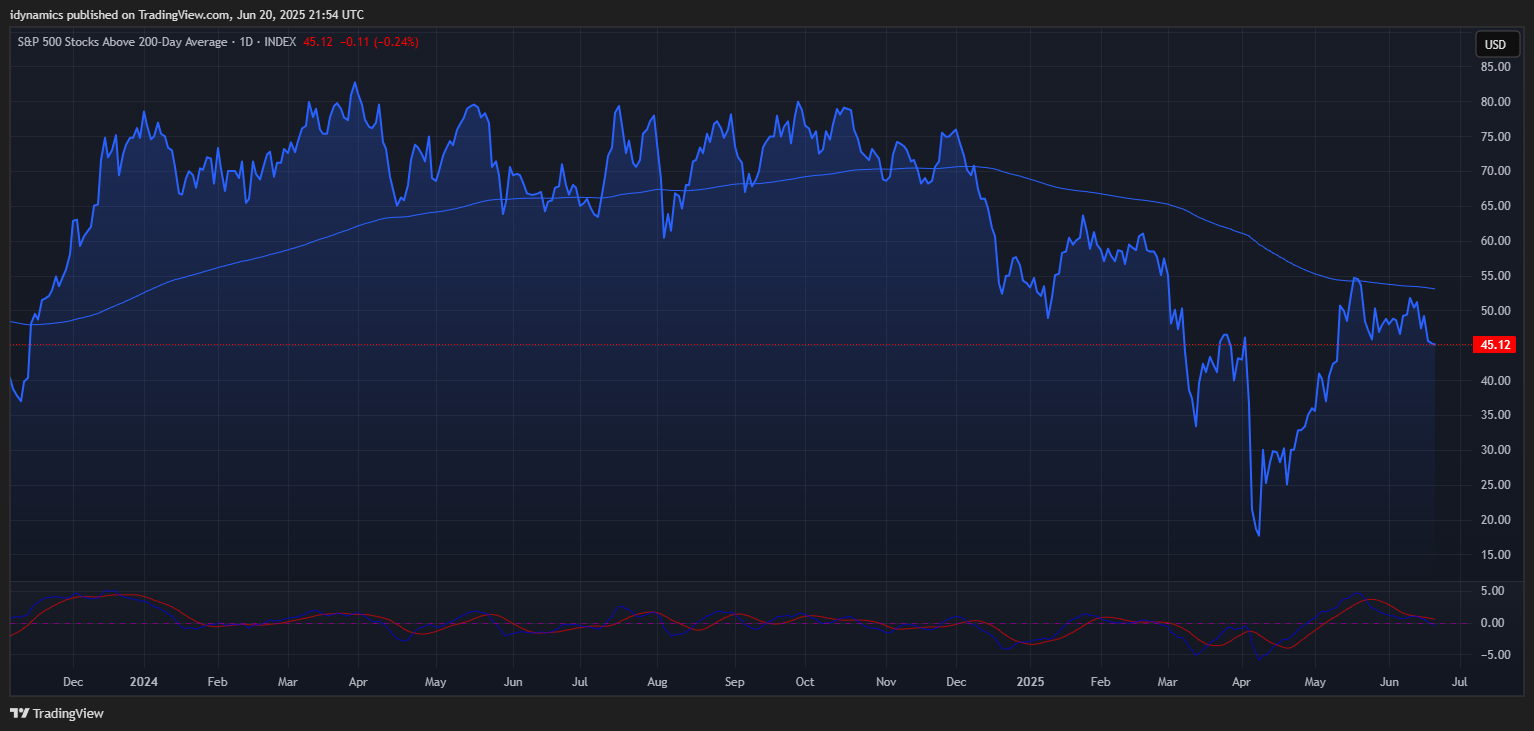
Another divergence for the recent bullish market action is breadth. Overall breadth is quite weak compared to where it was when we were setting the highs earlier this year. The percentage of SPX stocks above their 200-day MA ended Friday at 45.12%. It hit a high of 63.61% in February 2025 and 72.92% in September 2024.
S&P 500 Stocks Above the 200-day MA
 SPX Daily Candles
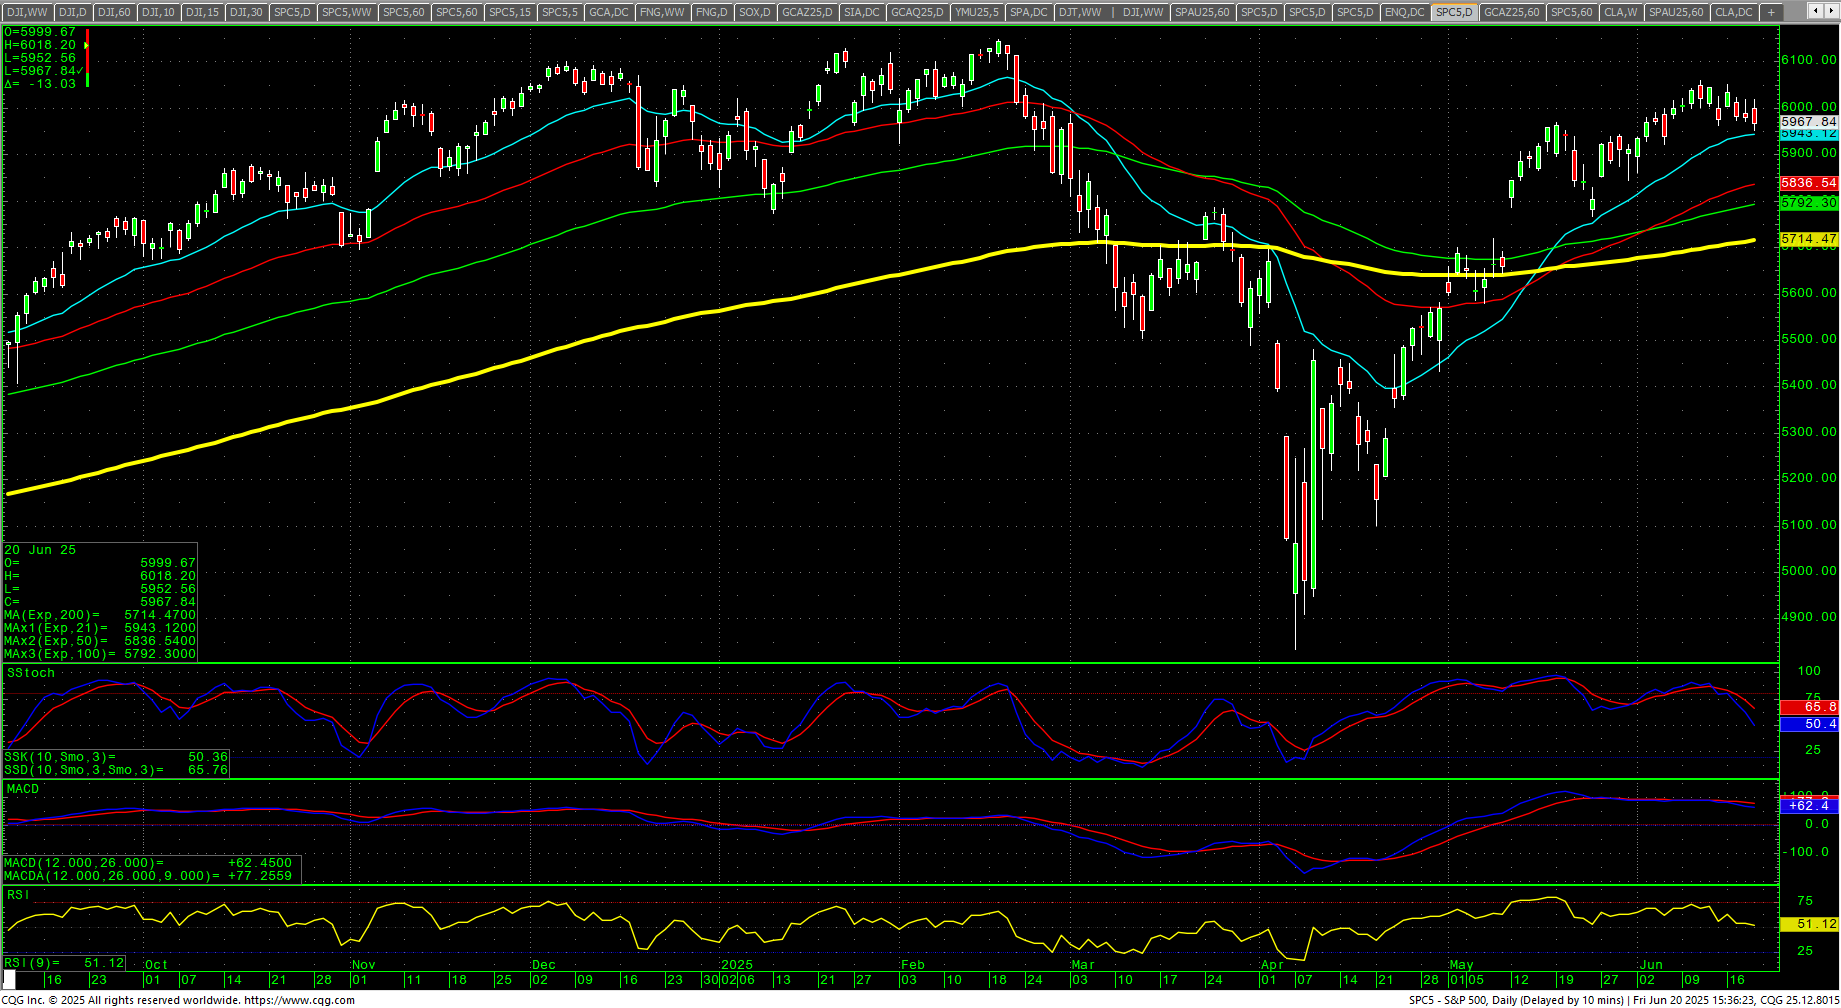 The SPX daily is reacting to some extreme overbought conditions with some bearish divergences and the MACD pegged. The stochastics and the RSI are reacting to bearish divergences while the 200-day MA has moved into a new record high, eclipsing the previous high set on 7 March 2025. There is still a strong probability that the SPX will return to the 200-day MA for a retest. For the SPX, the Exponential 200-day MA sits at 5714.47 and trending up on Friday’s close. That’s 253.37 points or a down move of -4.34%.
MAGS (Magnificent 7) Daily Candles
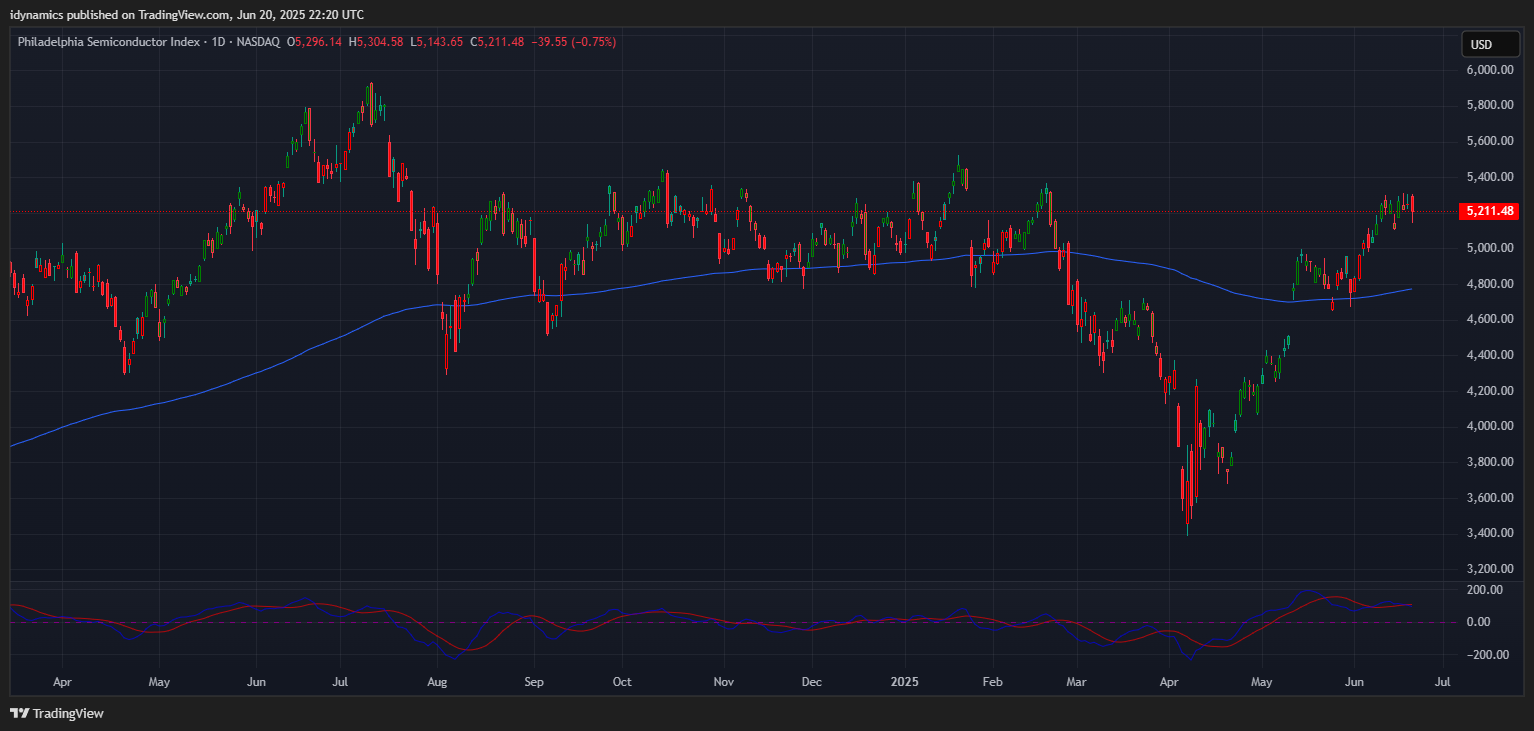
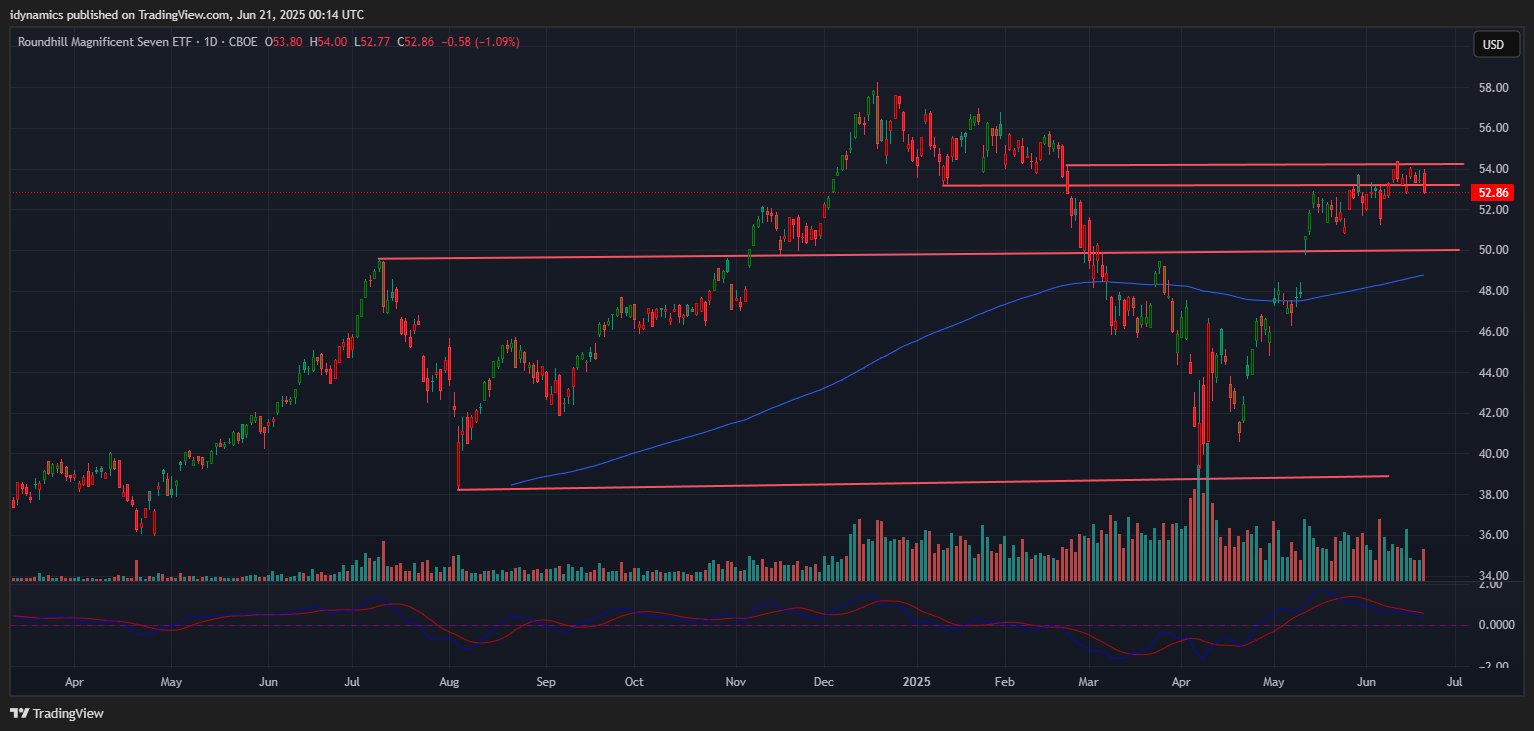 The MAGS (Magnificent 7) closed out the week down -0.29% on the bottom of the week’s range as prices continue test critical resistance at 54.16. The 53.16/54.16 level remains critical. Daily closes over 54.16 will increase the bullish view for the chart and open potential for a test of the highs. A break back under 50 should accelerate selling again. The weakness in the SOX chart is something to pay attention to in the present. In addition, the MAG7 is running away with the market while the “493” suck wind.
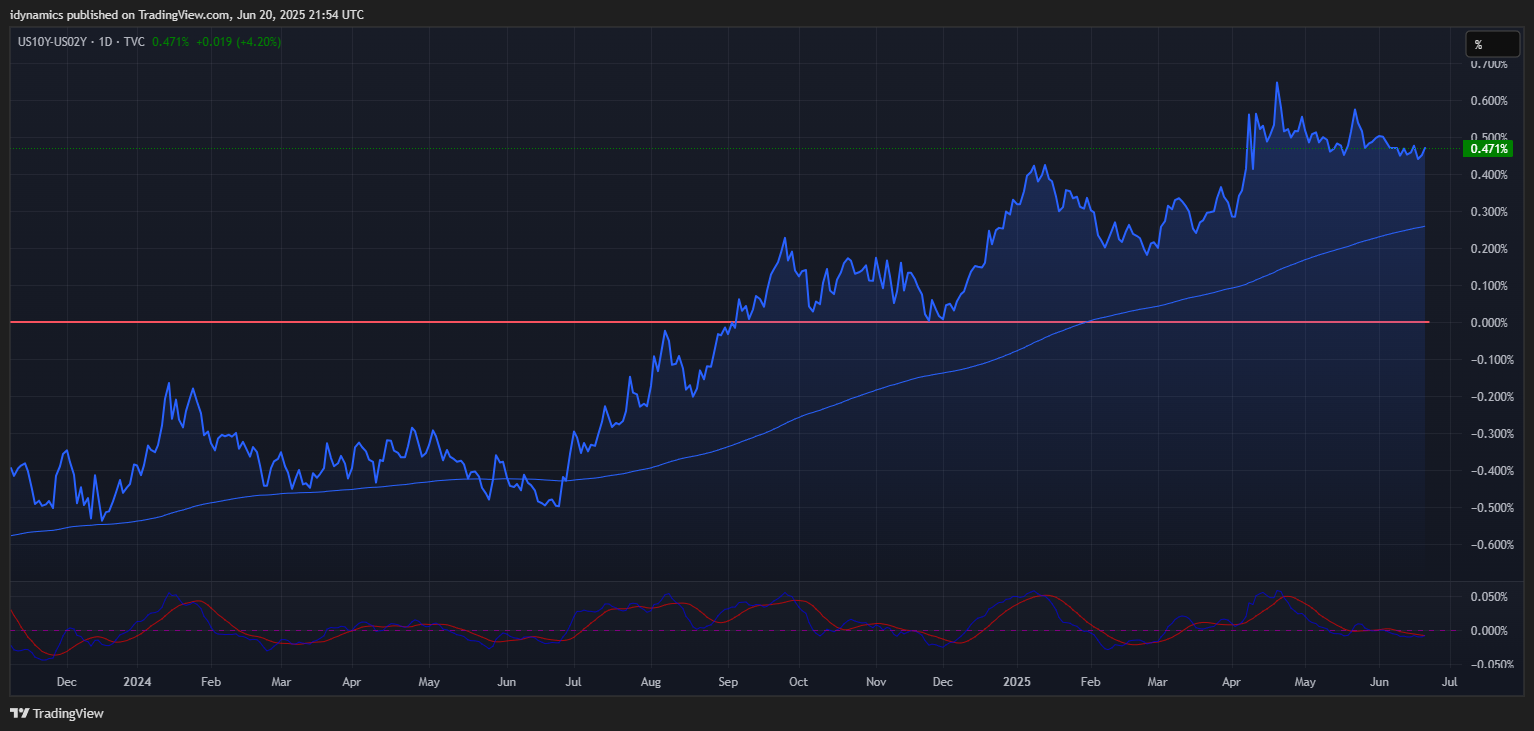
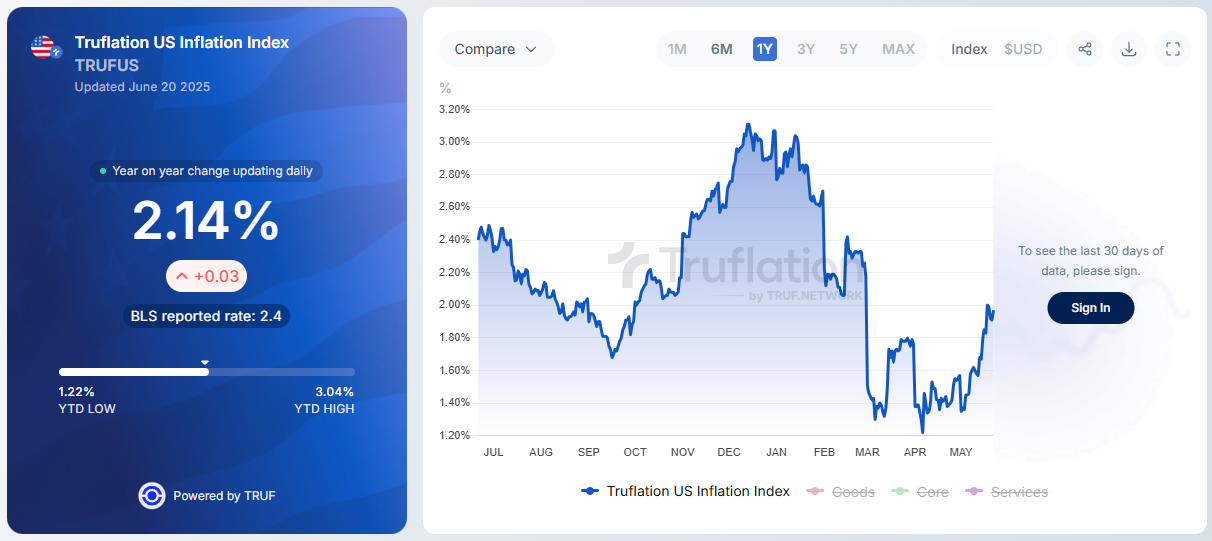
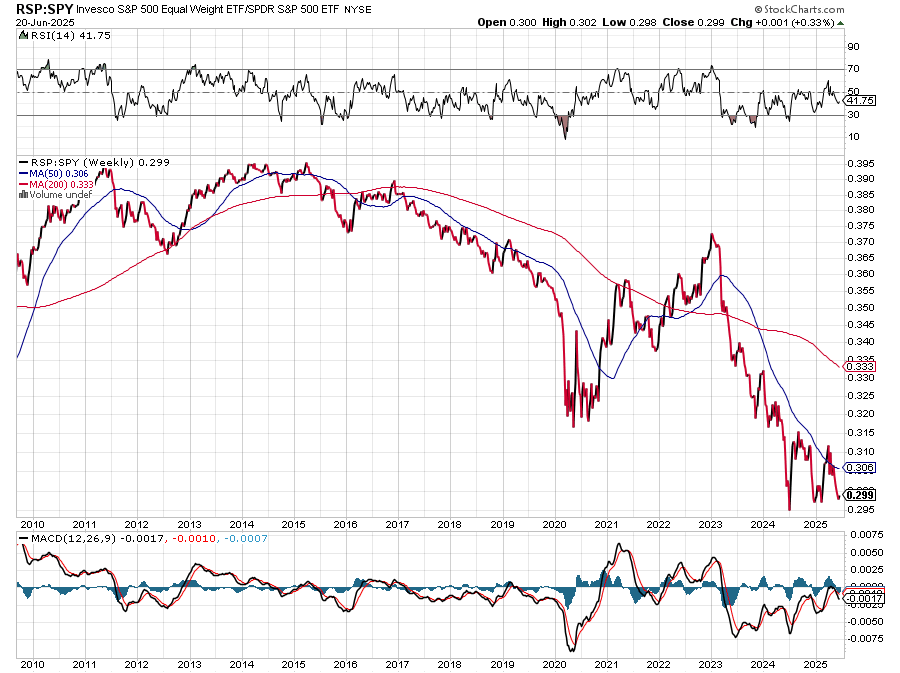
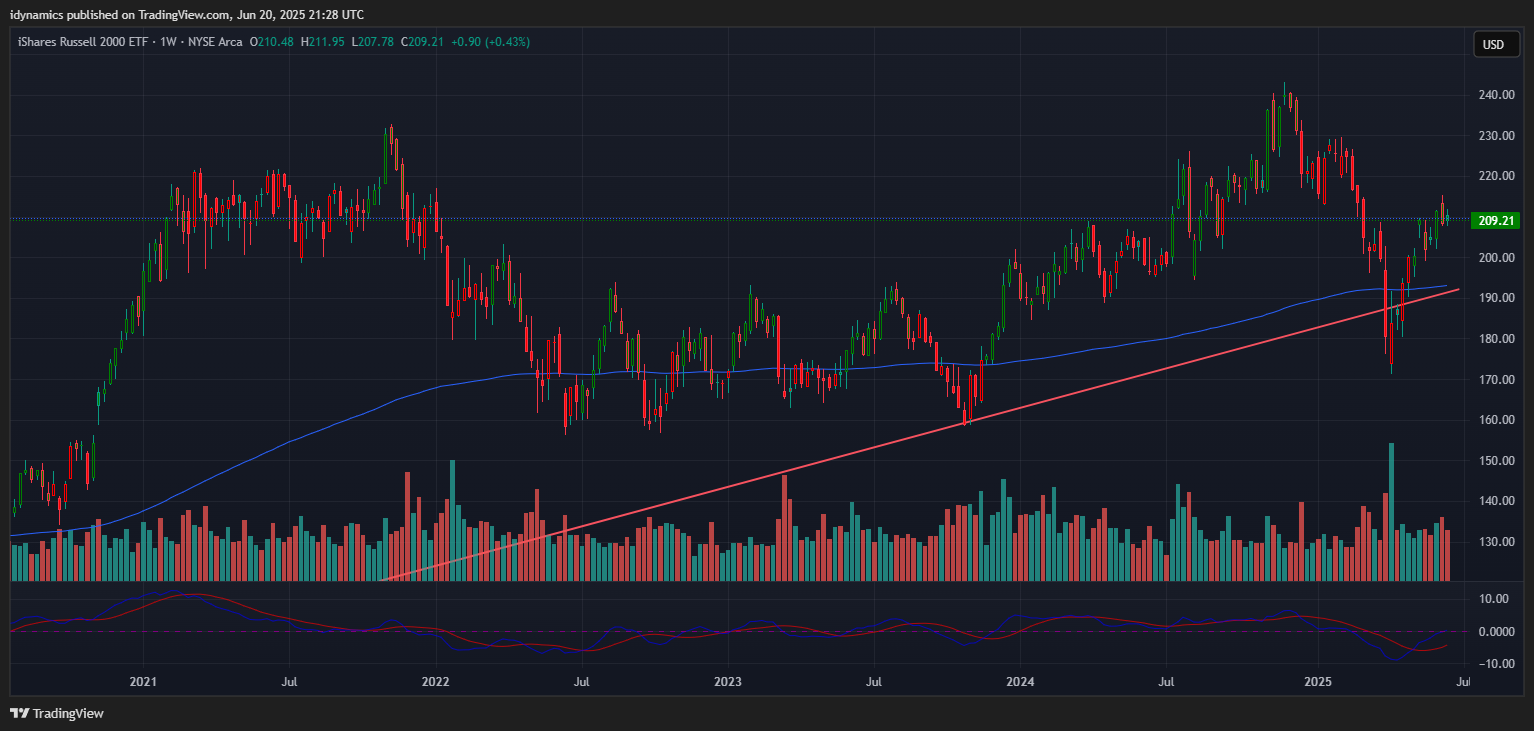
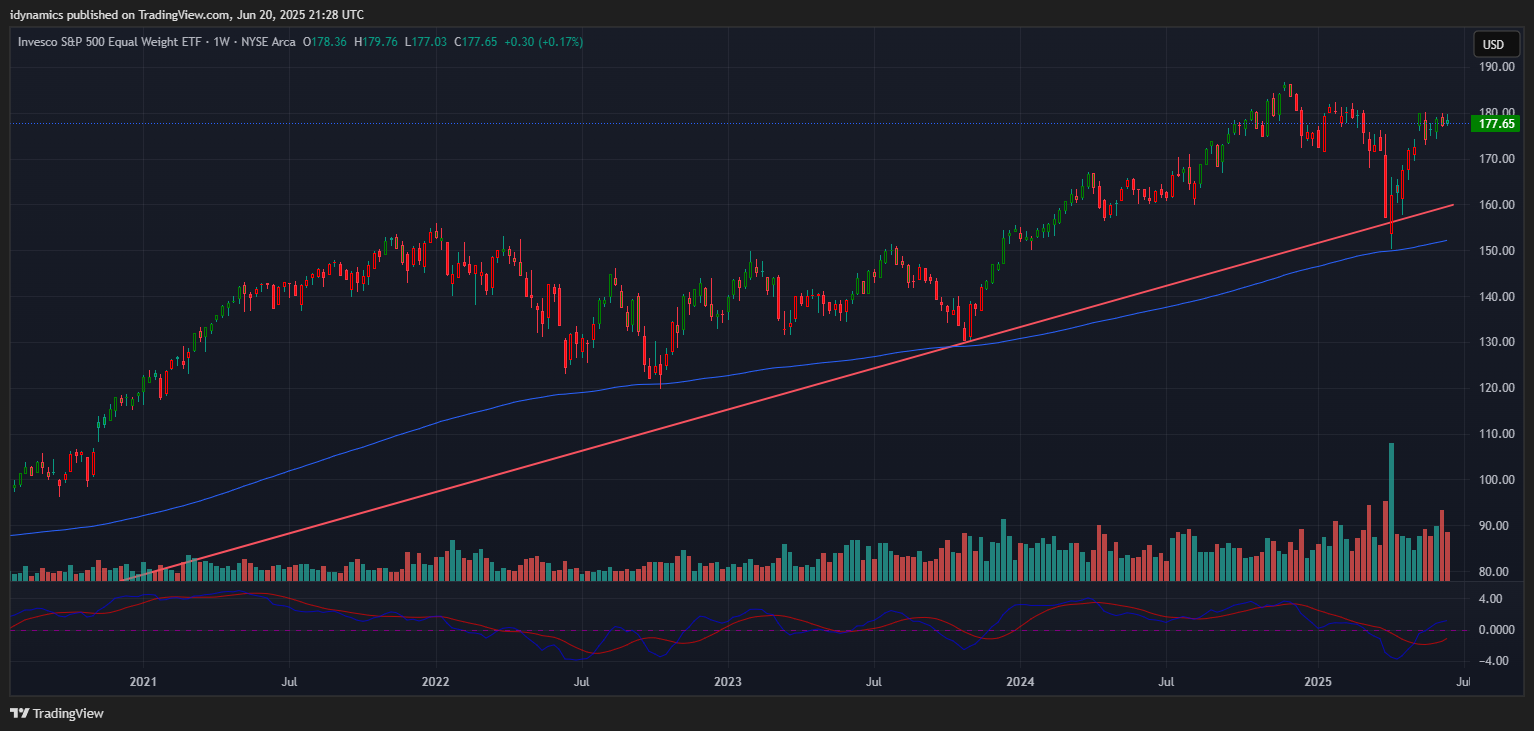
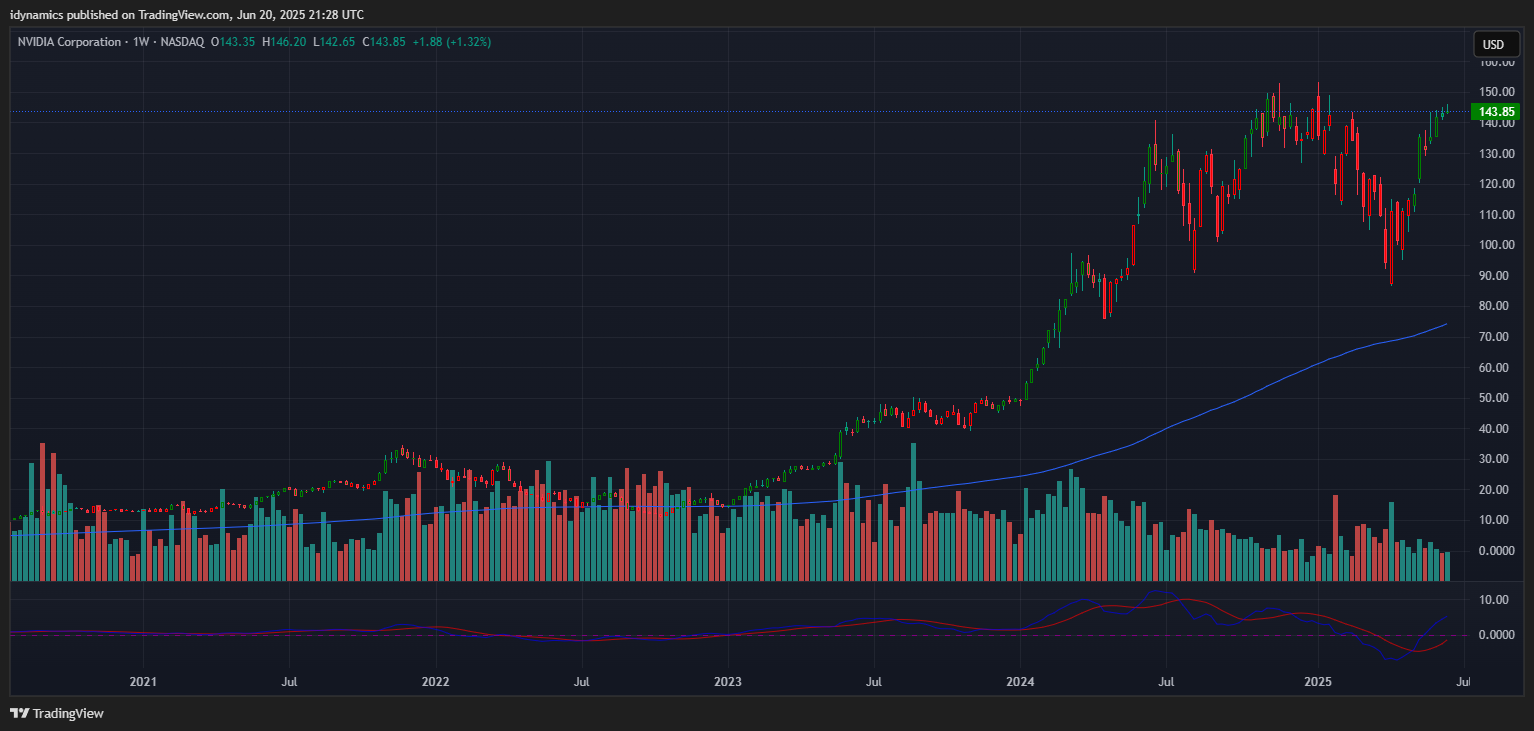
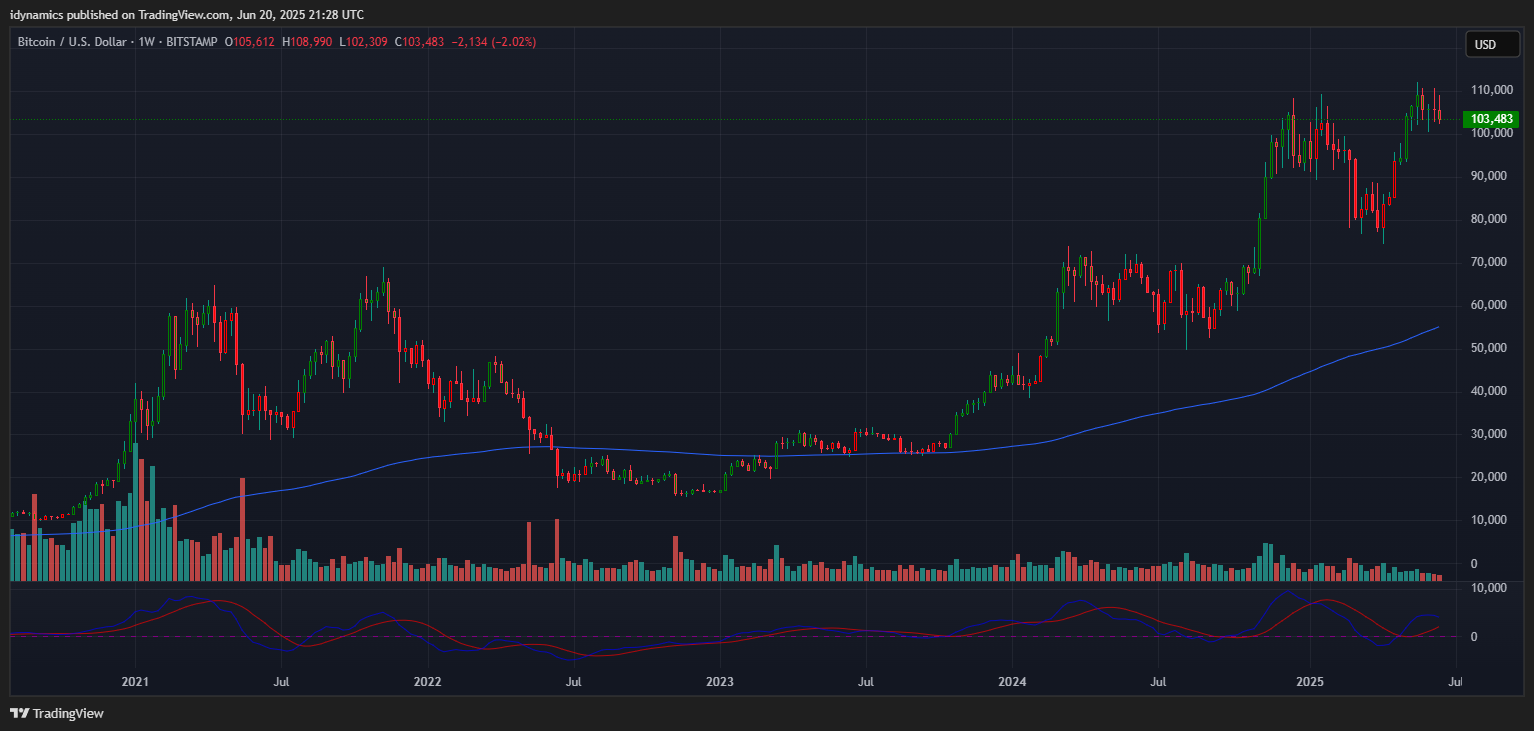
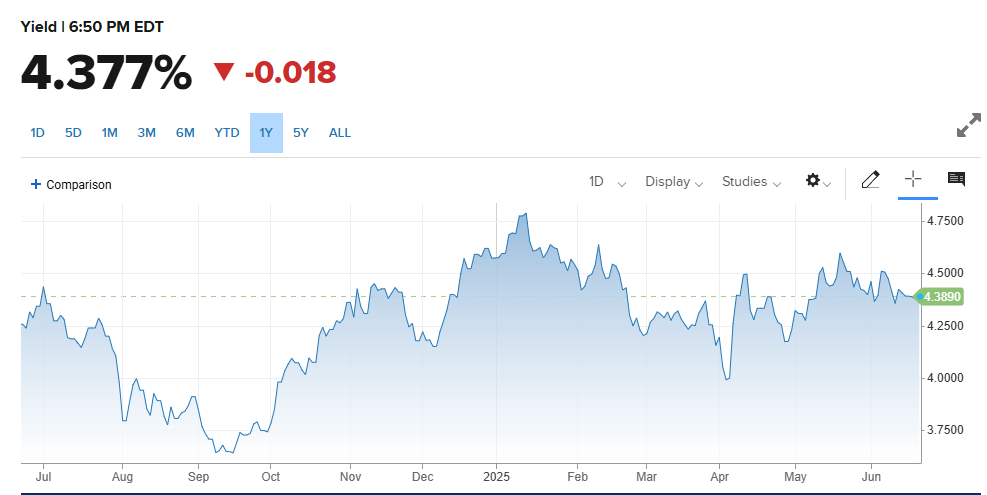
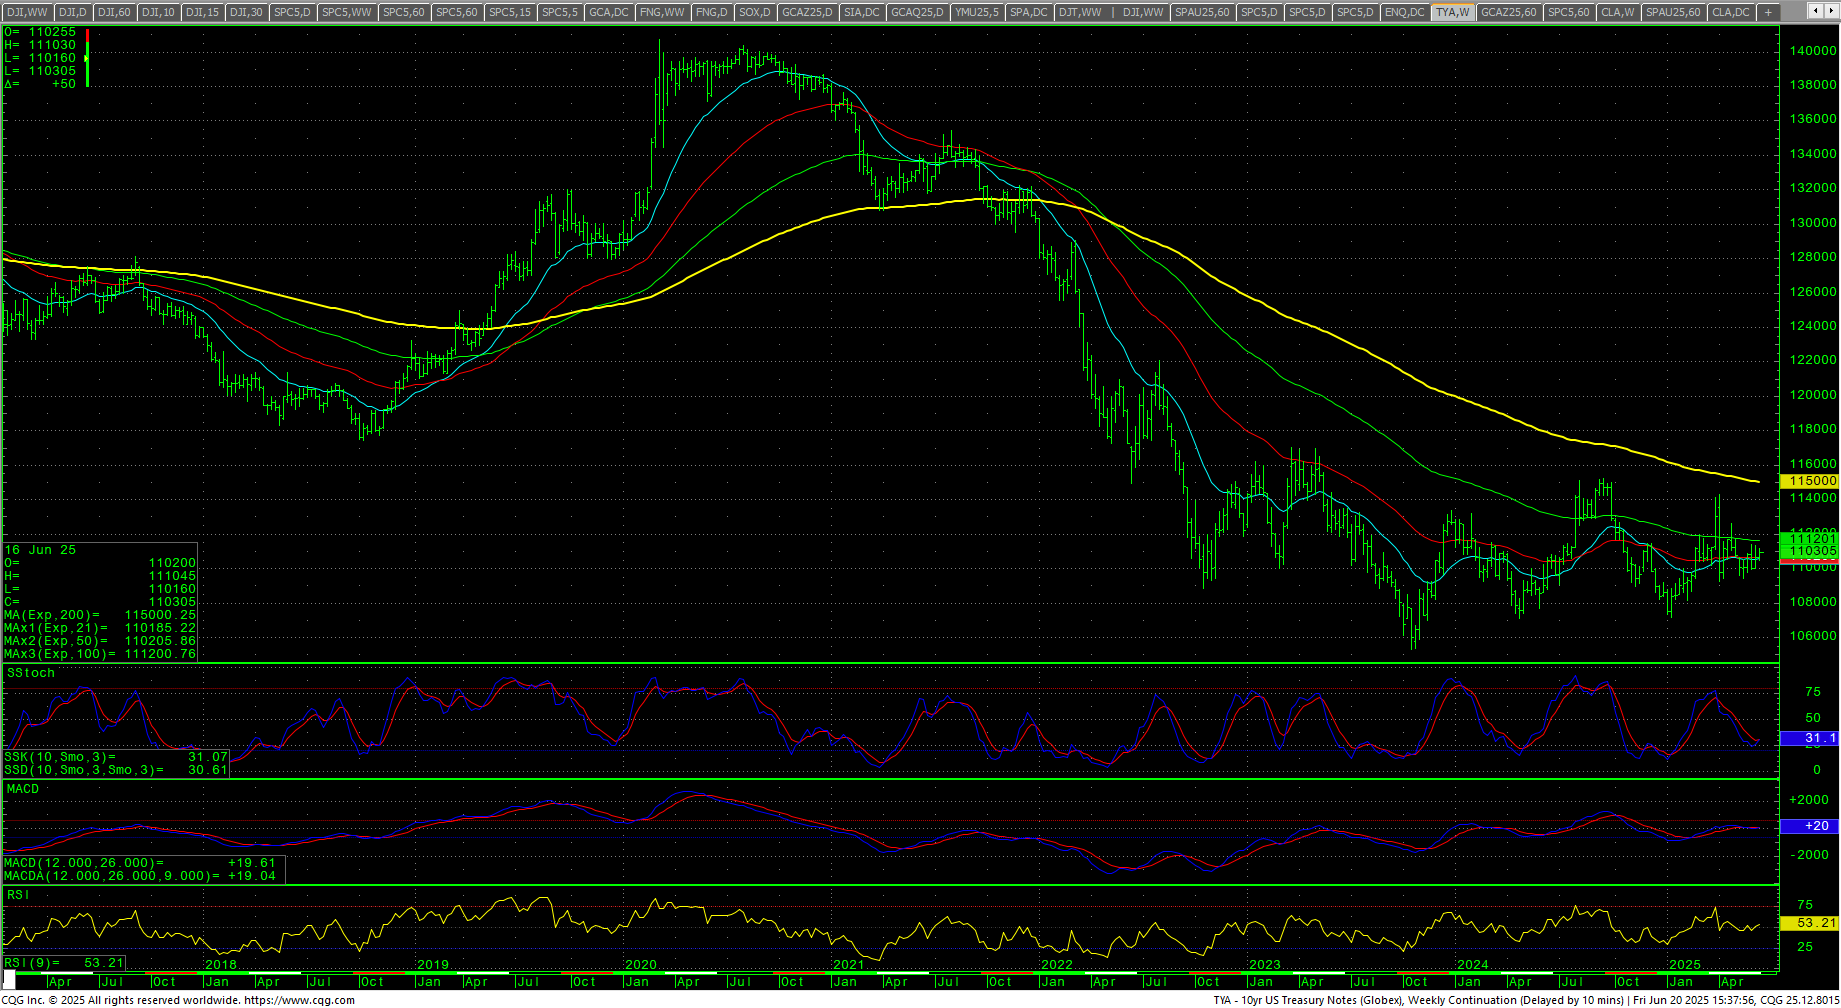
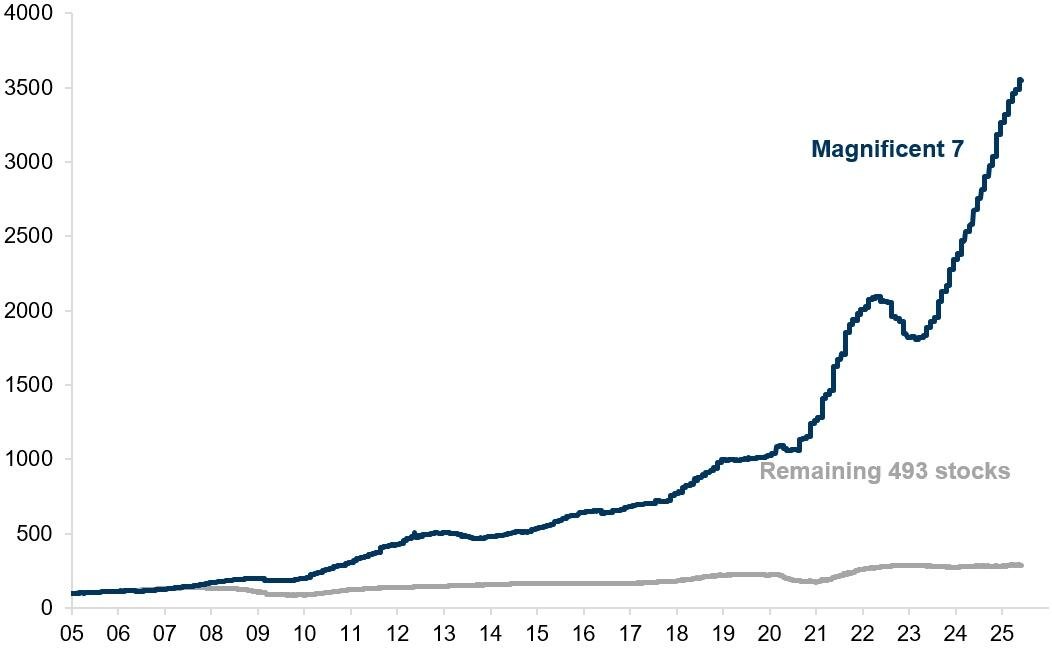 The RSP:SPY remains weak (another signal of weak breadth). The weekly is hooking lower in an oversold position and the MACD is turning back down. The IWM closed higher, +0.90% on the bottom of a tight range. The RSP was up +0.17% on the bottom of a tight range. NVDA traded a new recovery high and set a new recovery high close, up +1.32%. Bitcoin closed on the bottom of the weekly range in a bearish candle, settling down -2.15%. McClellan Oscillators are confirming the selloff in the Dow. The Yield Curve expanded slightly on the week, closing at +0.471%. The 10YR yield declined on the week and closed lower at 4.377%. Truflation rose to 2.14%.
10YR-2YR Yield Curve Daily
 VIX Weekly Candles
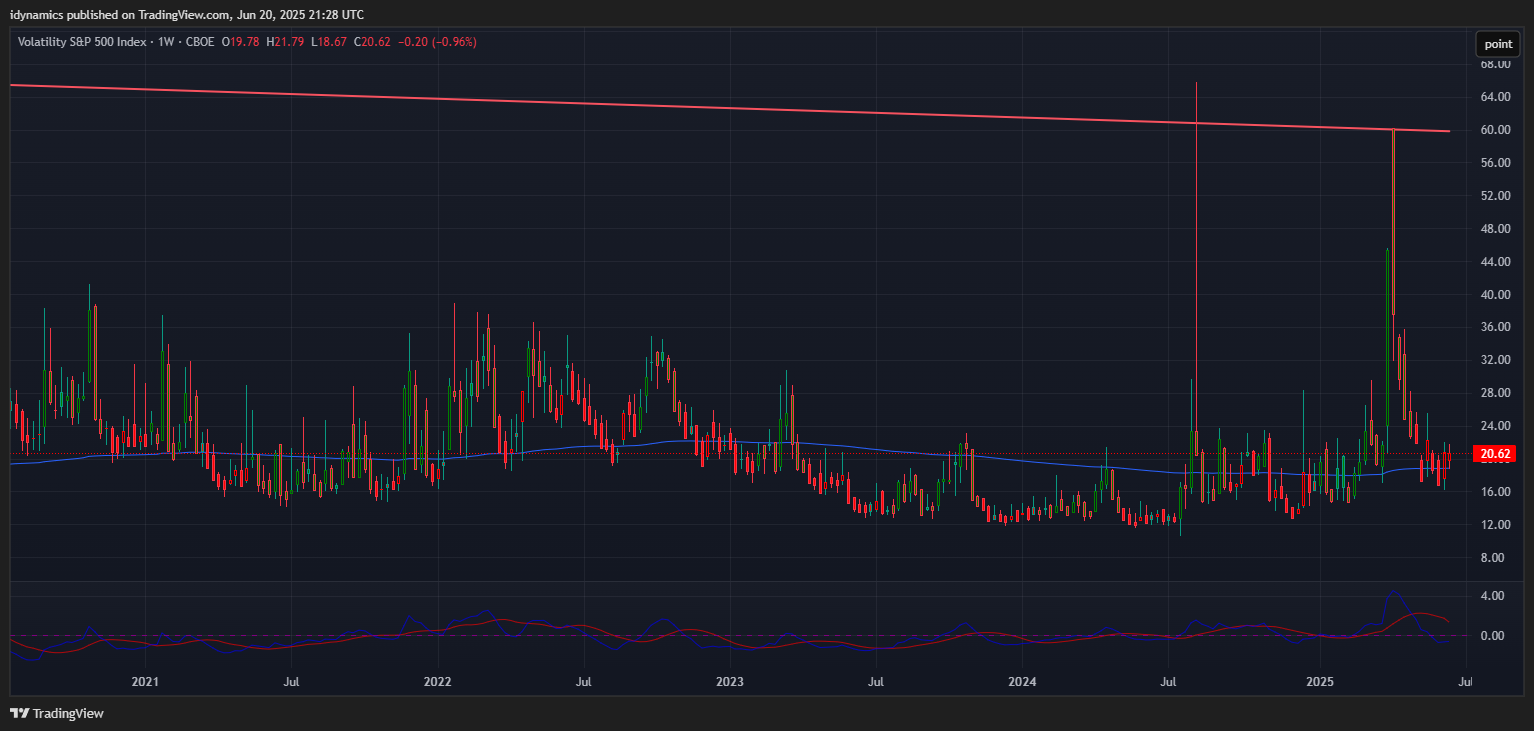
The VIX closed the week lower but still above the 20 level, ending the week down -0.96%. The US Dollar rebounded slightly to close up +0.65% on the week.
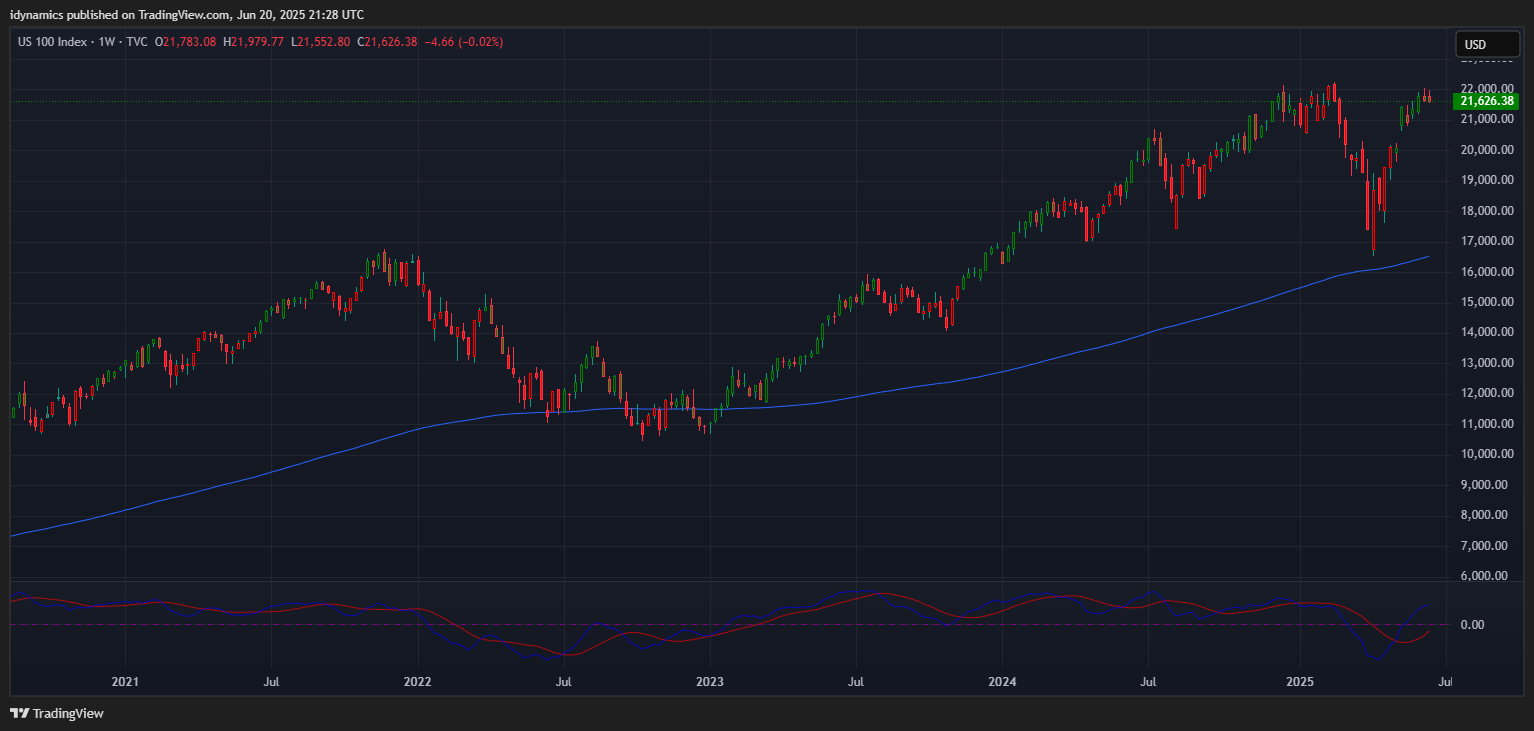
 Nasdaq 100 Weekly Candles
Daily Breadth 
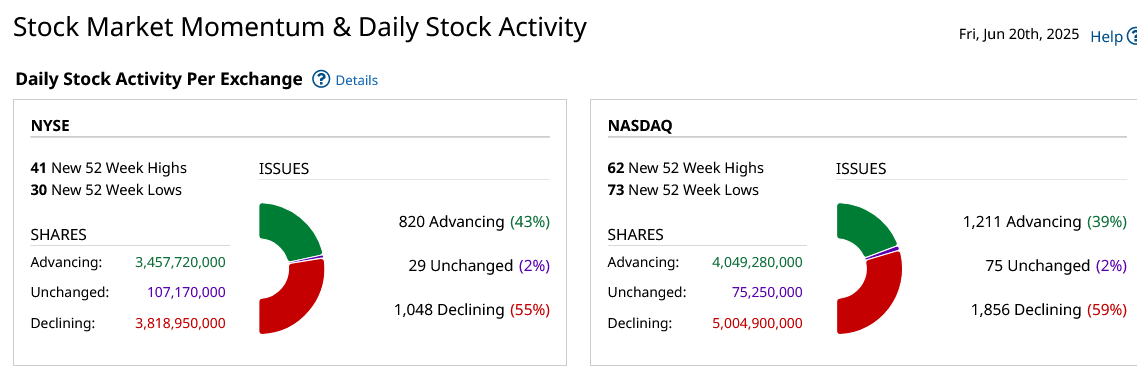
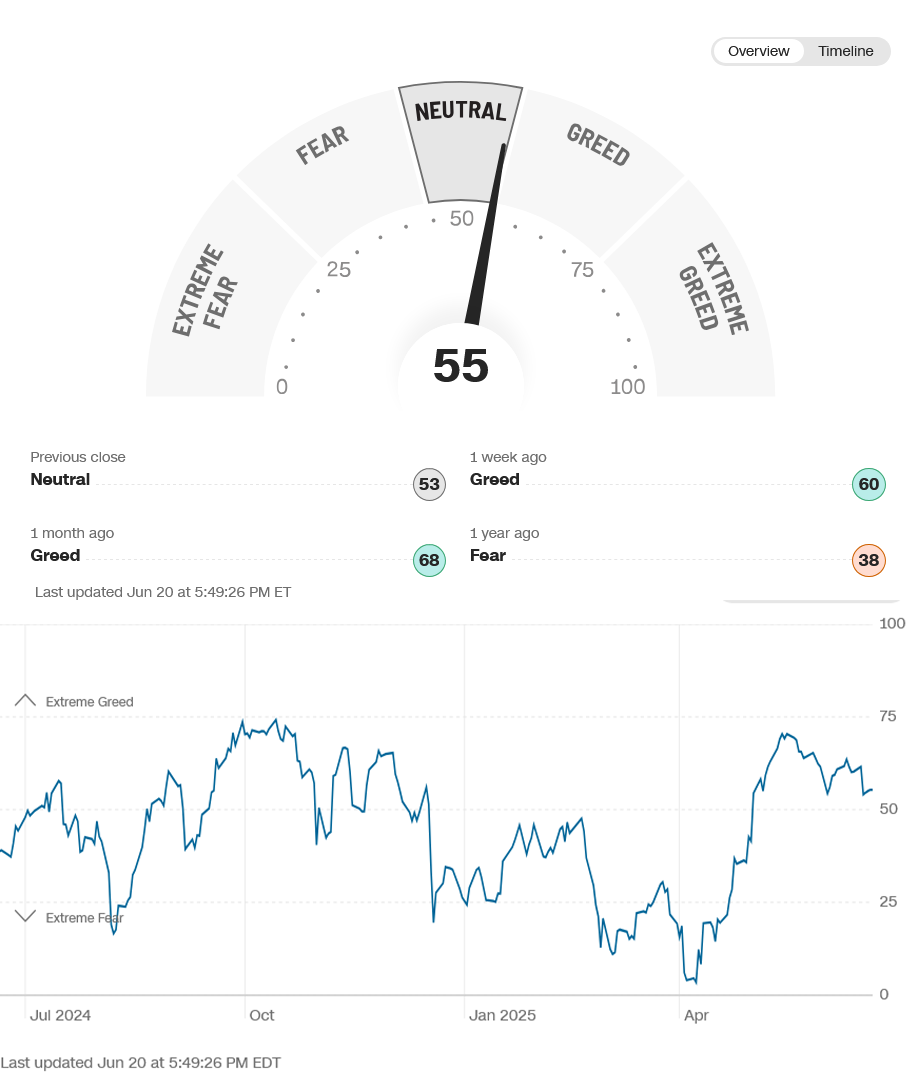
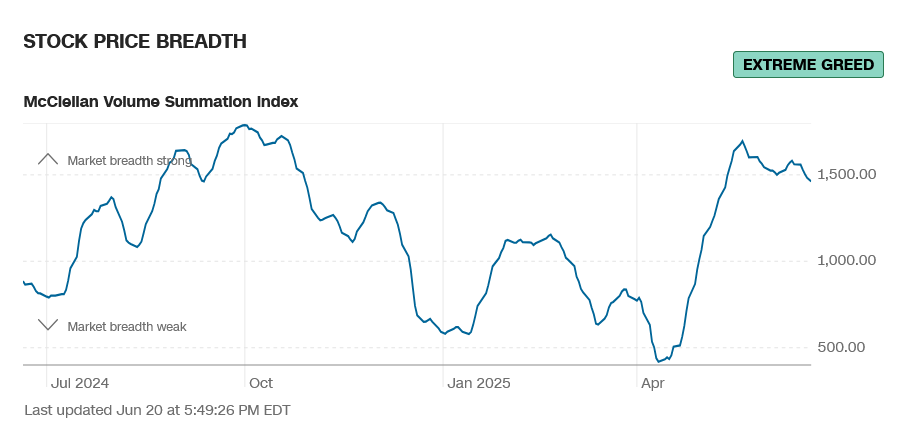
Breadth weakened again last week. Sentiment remains in extreme greed.
CNN Fear & Greed Index
 AAII Investor Sentiment Survey
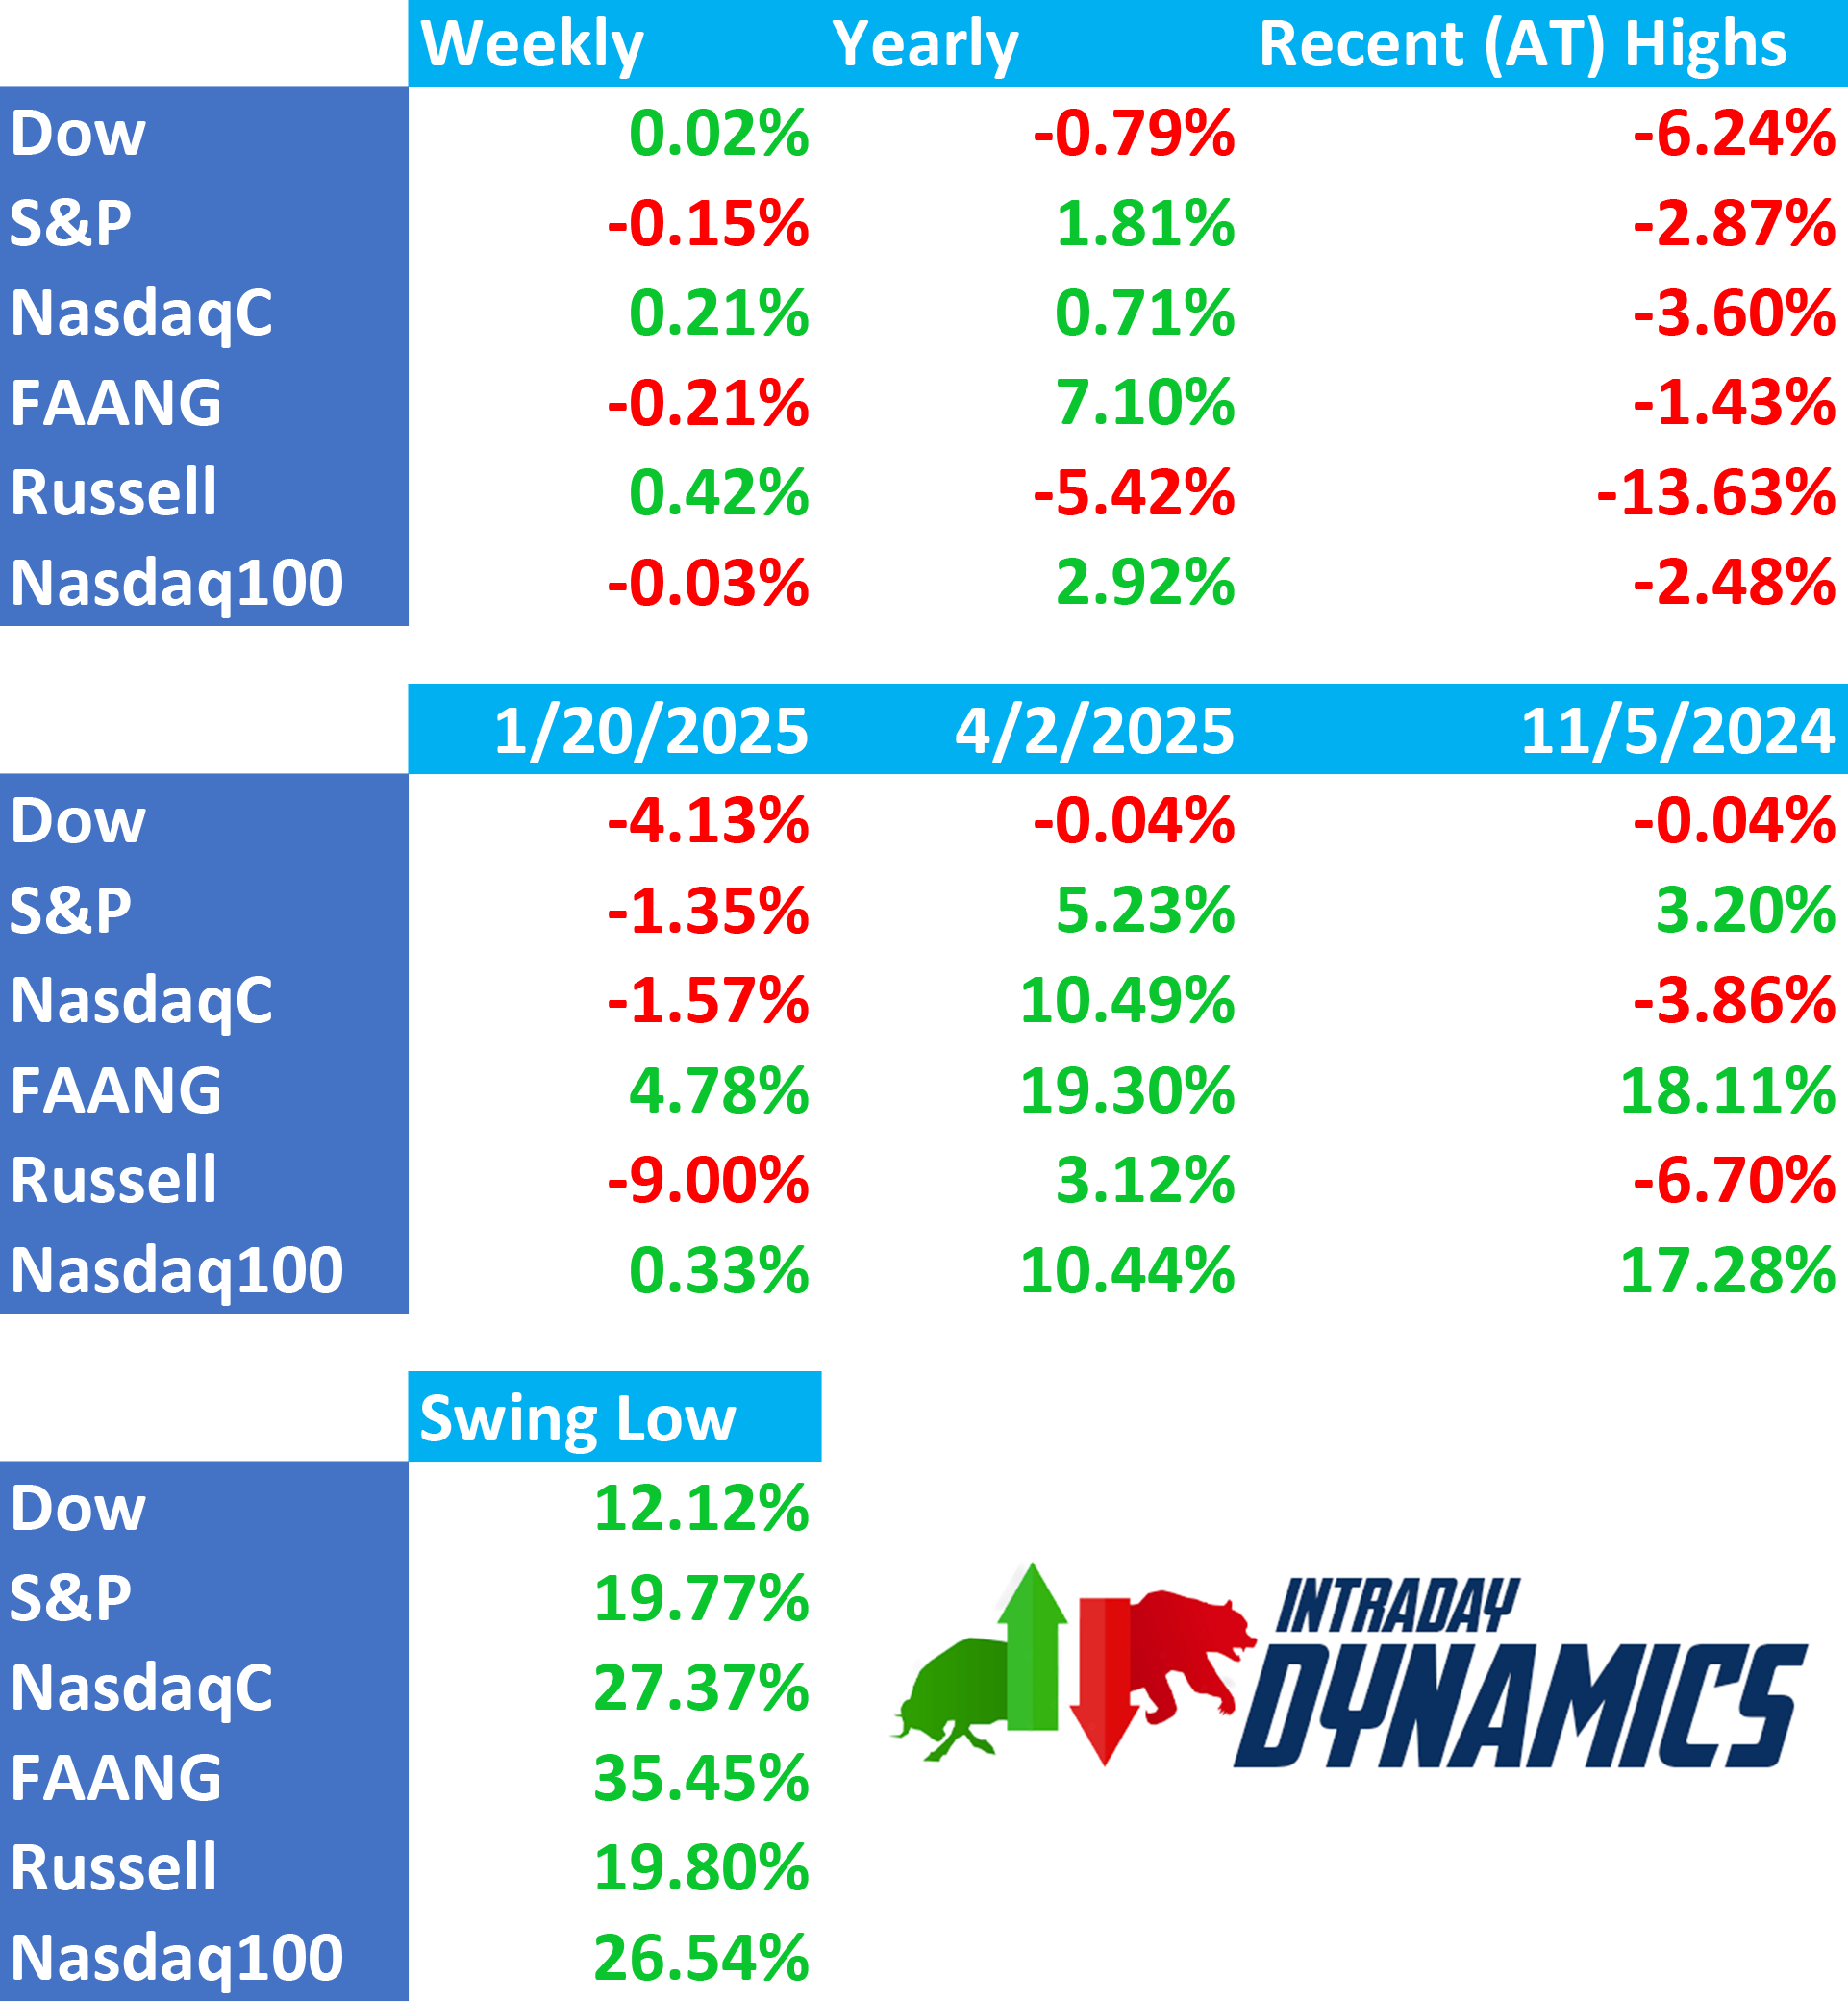
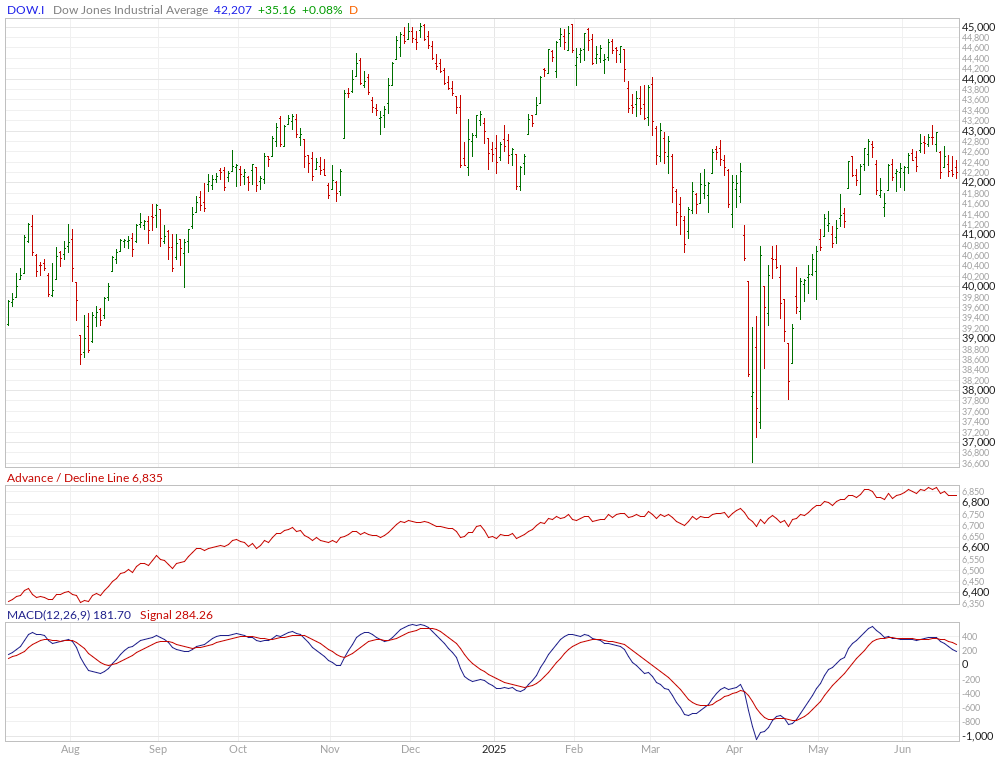
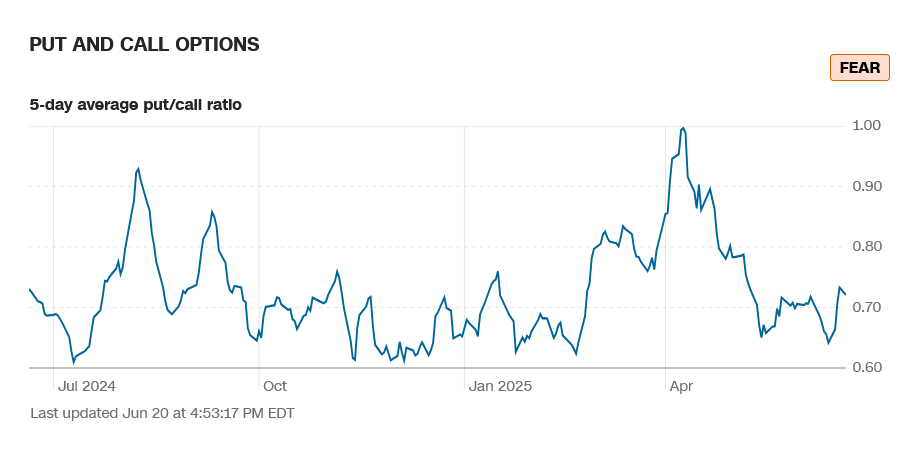
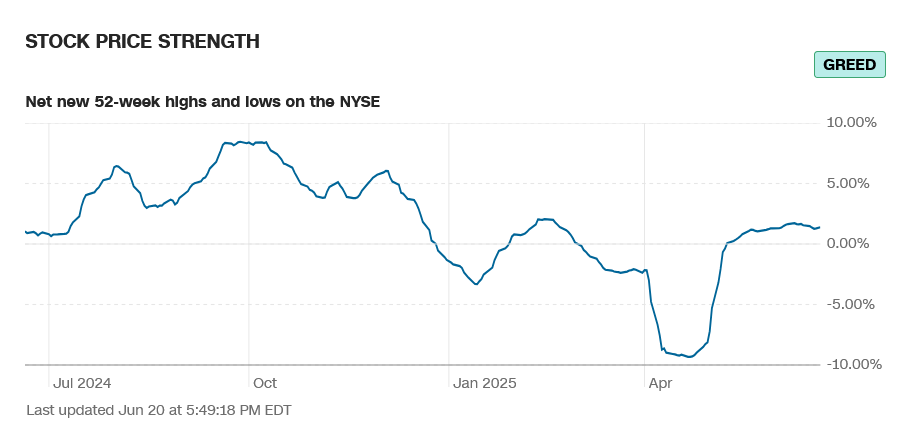
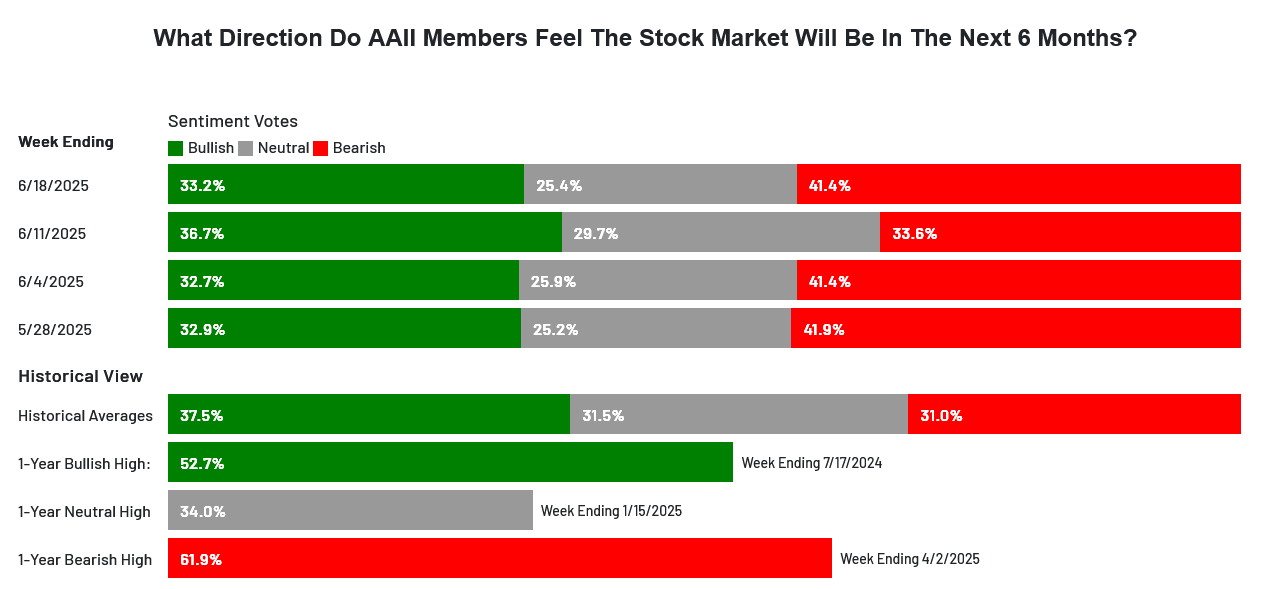 Sentiment remains in greed and extreme greed on several fronts. The CNN Fear and Greed Index moved to 55 and now reads neutral. Breadth declined on the week and sentiment reads extreme greed. Latest AAII Sentiment Survey: Pessimism Falls as the bulls dropped under the bears again. The Dow A/D moved down to 6835, moving away from a record highs. The VIX closed the week lower and remains above 20, ending the week down -0.96%. The Put/Call rose to 0.72 and reads fear. The 52-week, A/D was flat at +1.39% and reads greed. The Dow closed the week up +0.02%, closing on the bottom end the week. The S&P ended down -0.15% in the bottom of the range. The Nasdaq Composite was up +0.29% and the Nasdaq 100 was down -0.03%. The NYSE FANG moved off the record high to close down -0.21%. The Russell was up +0.42% on the bottom of a the range. The 10-year notes closed higher, in the top end of a tight inside week’s range. The yield on the 10YR decreased to 4.377%.
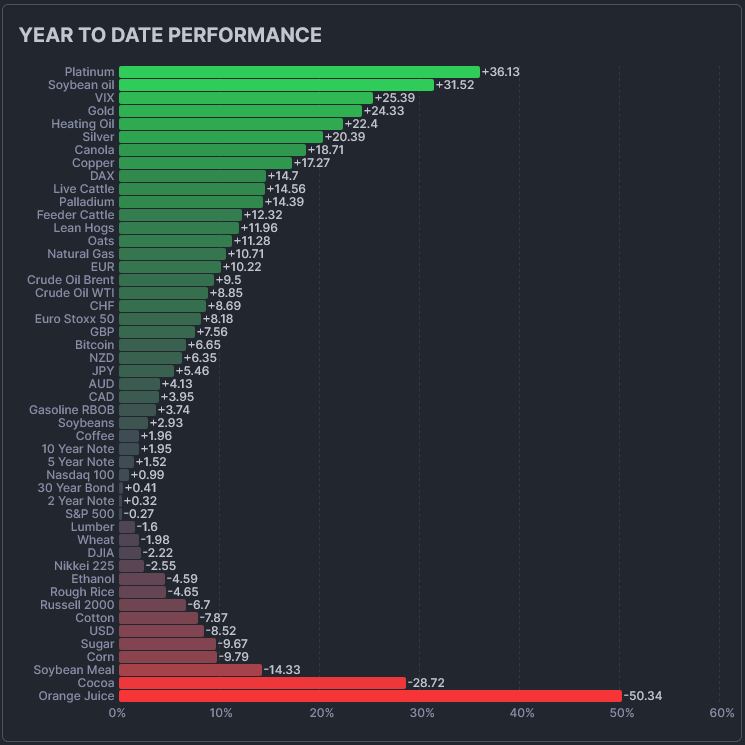
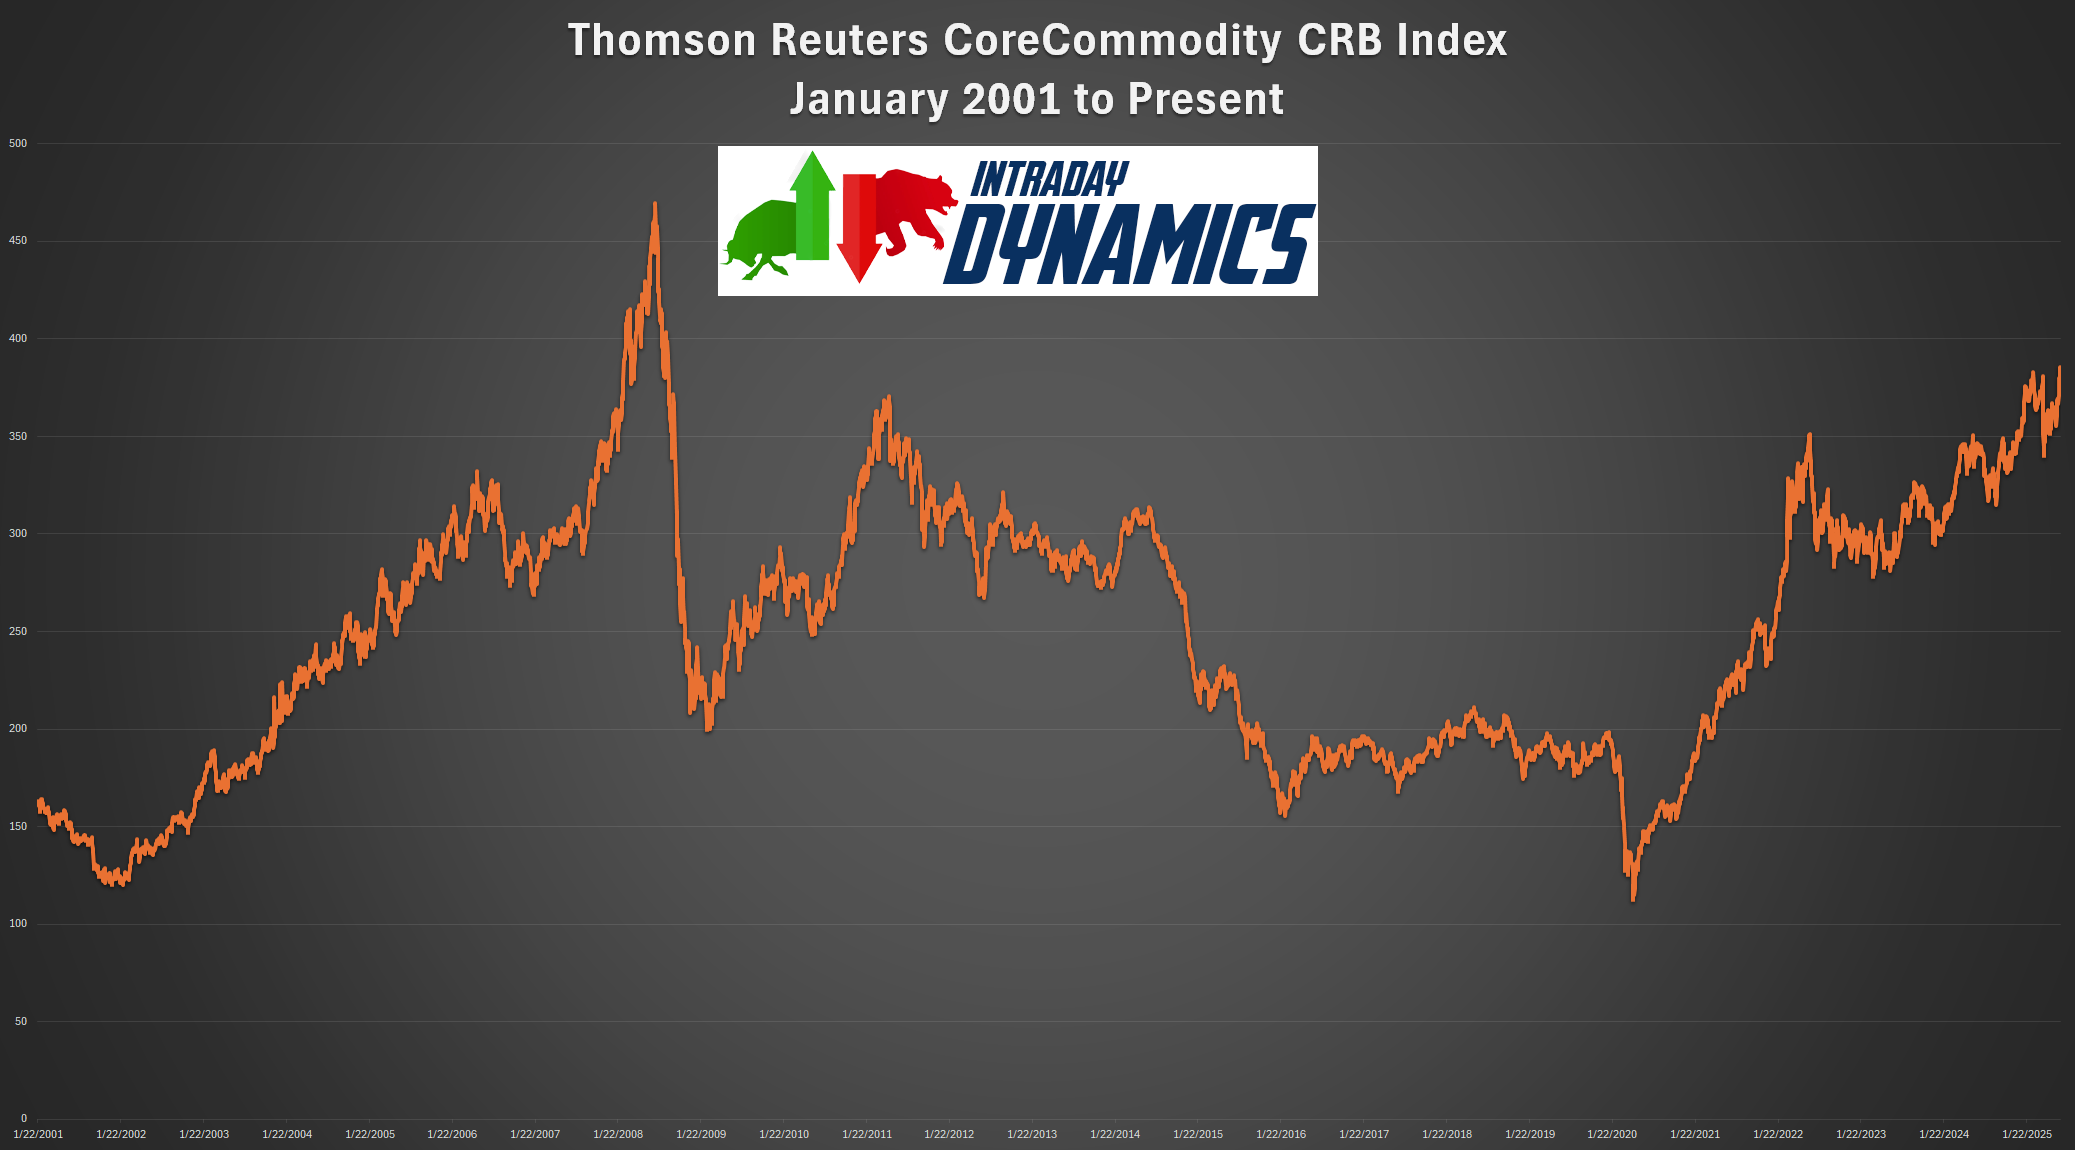 The CRB Index jumped sharply, up +3.91%. Crude oil closed higher in a wide weekly range setting the highest weekly close since 13 January 2025. Gold closed lower as prices drifted off the recent record high weekly close. The CoT for the S&P 500 saw non-commercials liquidating, with commercials and dealers padding. The CFTC S&P 500 Non-Commercial Net Positions did not release data Friday…next update is 23 June 2025.
Timing Points
Critical cycle timing runs through Tuesday’s trade again now. This kicks off a period of heightened cycle activity that runs into Fall of this year and continued into Q1/Q2 of 2026. For an update on the longer-term timing outlook, please see the latest update. Monday is Flash PMI (est: 53.0) and Existing Home Sales (est: 3.95M). Tuesday is Consumer Confidence for June (est: 99.1) and Powell testifies in the House. Wednesday is New Home Sales (est: 689K). Thursday is Balance of Trade and Wholesale Inventories along with Durable Goods. Friday is PCI (est: 0.1%/YOY 2.6%)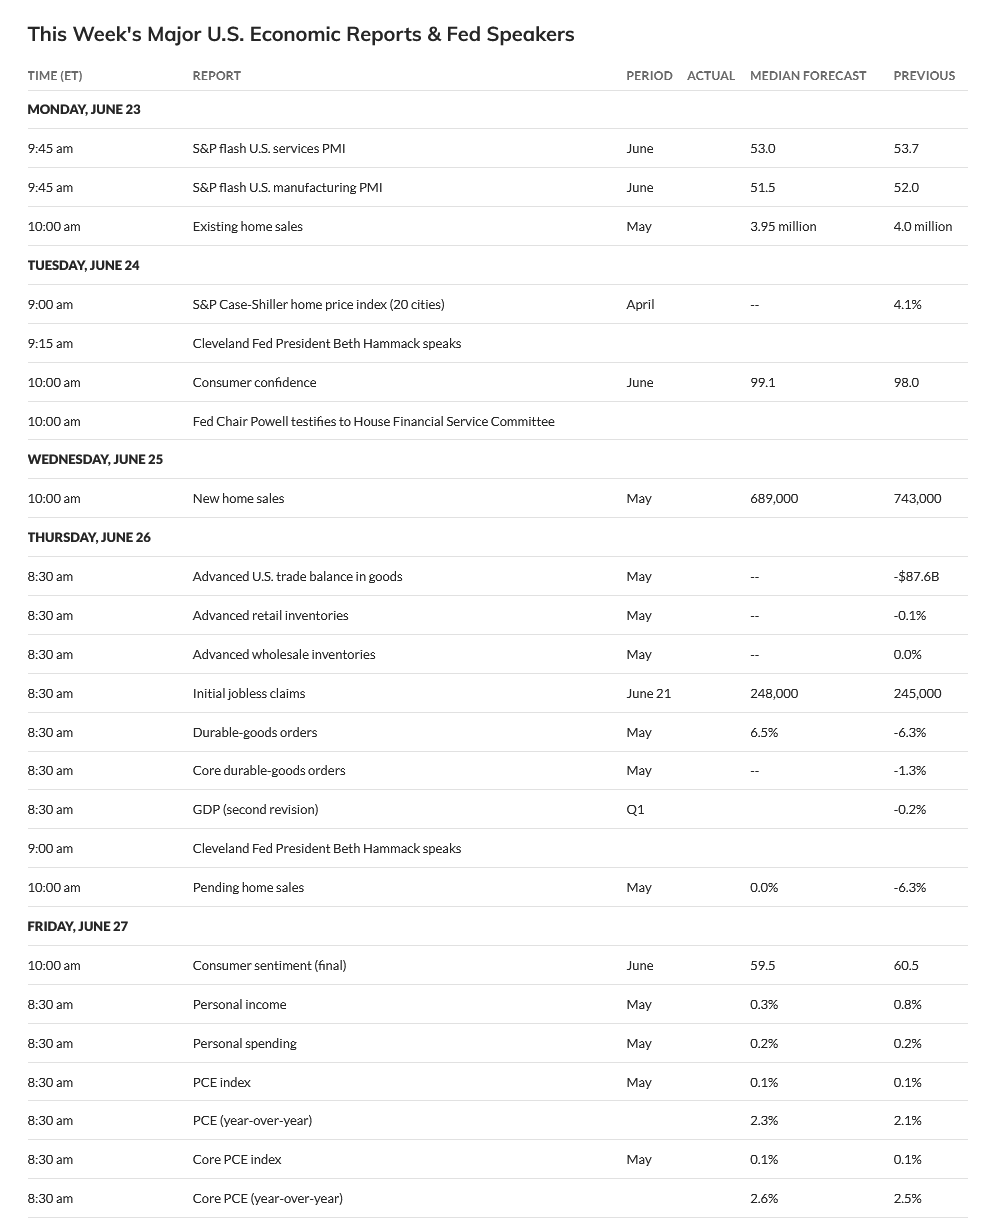
- 06/20-24 *** X
- 07/03 *** X
- 07/10 **
- 07/17 **
- 07/23-24 *** X
- 08/01 *** X
- 08/05 *** X kicks off critical week through
- 08/08 *** X through
- 08/11 *** X critical week
Dow Jones Industrial Average
Dow Jones Industrial Average Weekly H-L-C
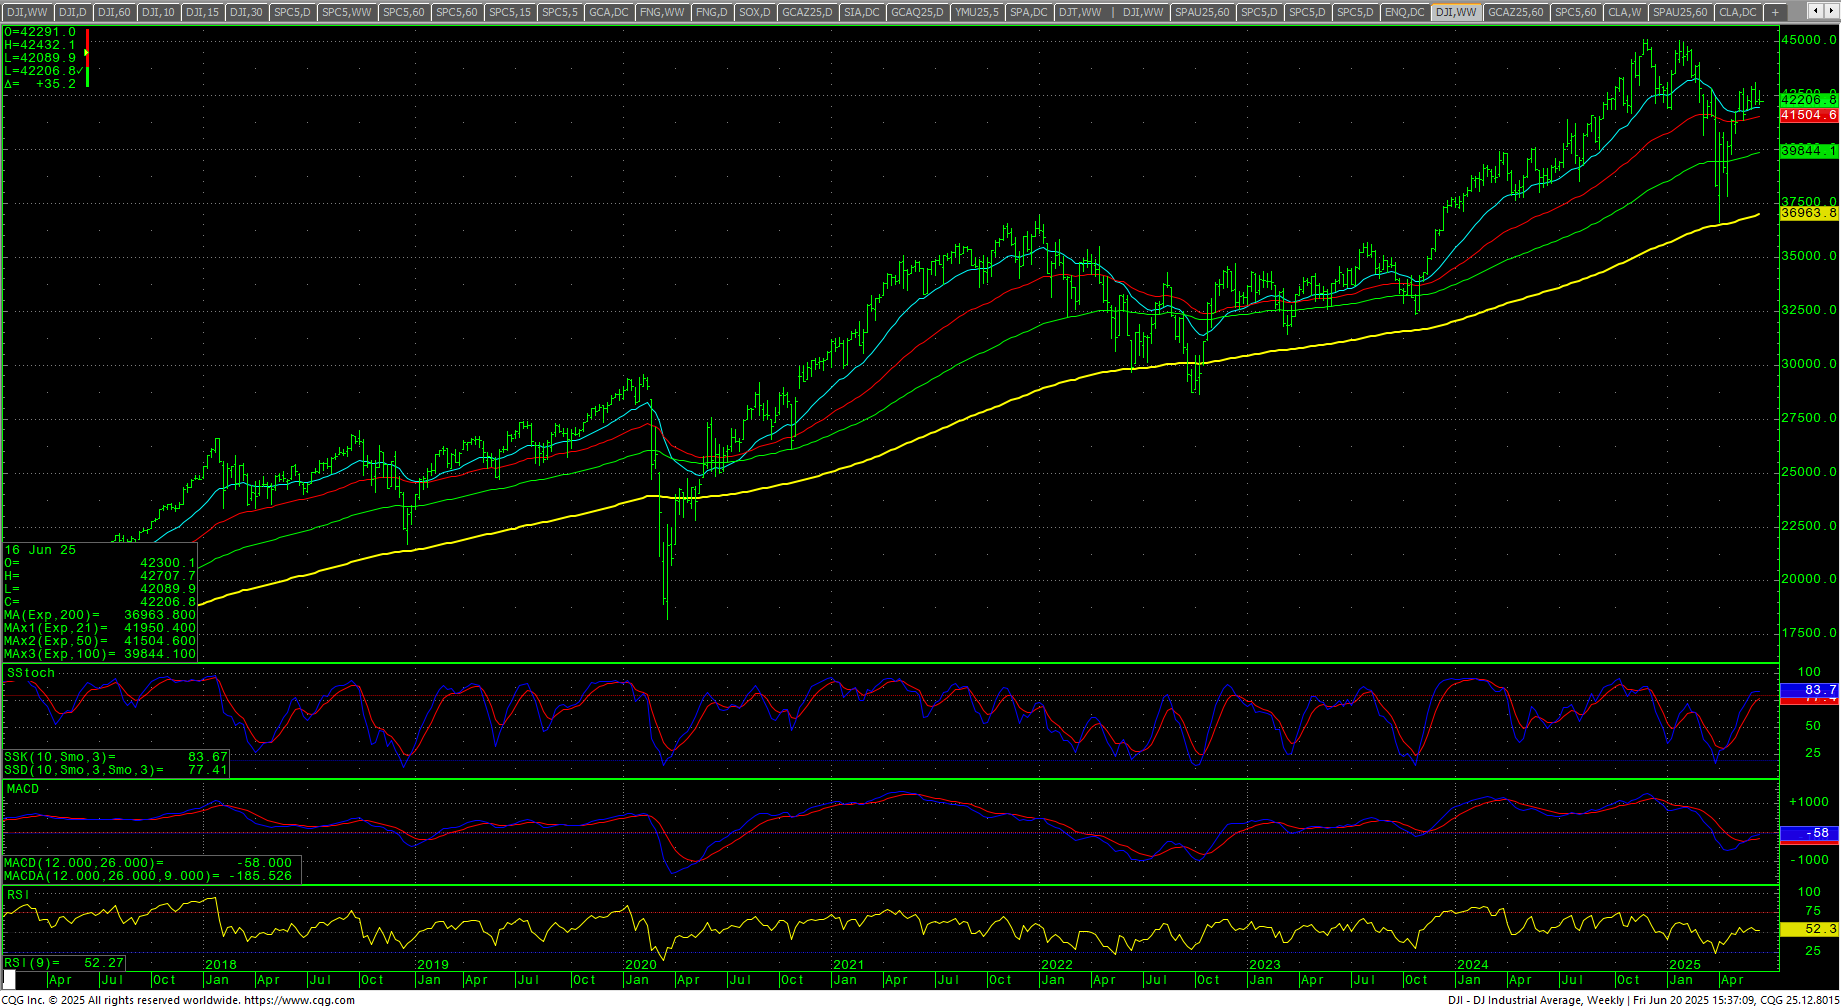 The Dow closed the week flat +0.02% on the bottom of a tight inside weekly range. The market is in a minor reaction to the ‘final’ “Death Zone” from record highs. That zone remains at 42943 through 43061 (intraday high on 11 June 2025 was 43115.6). The 50-day and 200-day MAs remain in a Golden Cross. The weekly stochastics are still in an uptrend but reaching overbought numbers. The daily stochastics have hooked lower from a bearish divergence. The MACD is also reacting to a bearish divergence. The RSI has relieved its overbought reading and bearish divergence. The 200-day MA starts the week at 41767.00 and is trending higher.
Dow Jones Industrial Average Hourly H-L-C
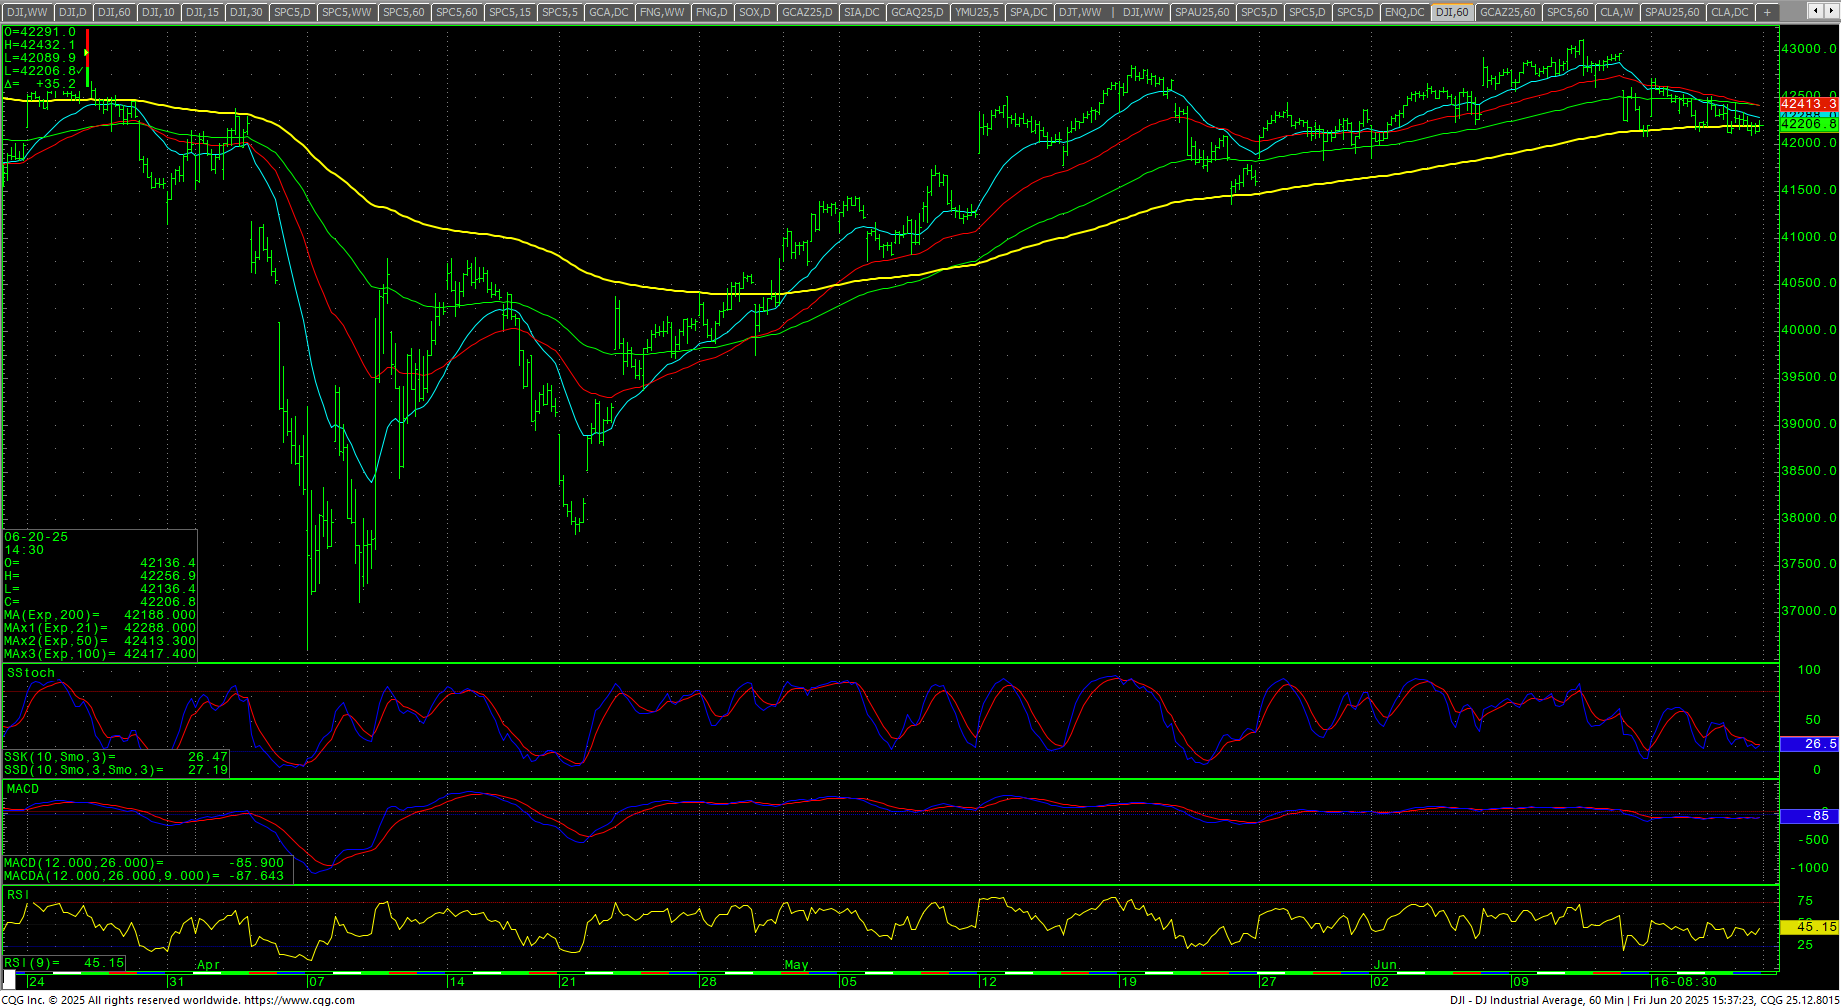 The hourly is slightly oversold on Friday’s close. Support remains near-term pivotal at 42025/42020. Closes under 42020 set up 41580 through 41427. A breakdown under the 41427 area will set up 41105 with counts to critical short-term support at 40631/40628. Closes under 40628 are near-term bearish for test of 39096/39864. Closes under 39864 offer full counts to 38237/38146. Closes below 38146 should minimally test 37828 and would open counts to retest the 36611 low with support at 37103.
Dow Jones Industrial Average Daily Candles
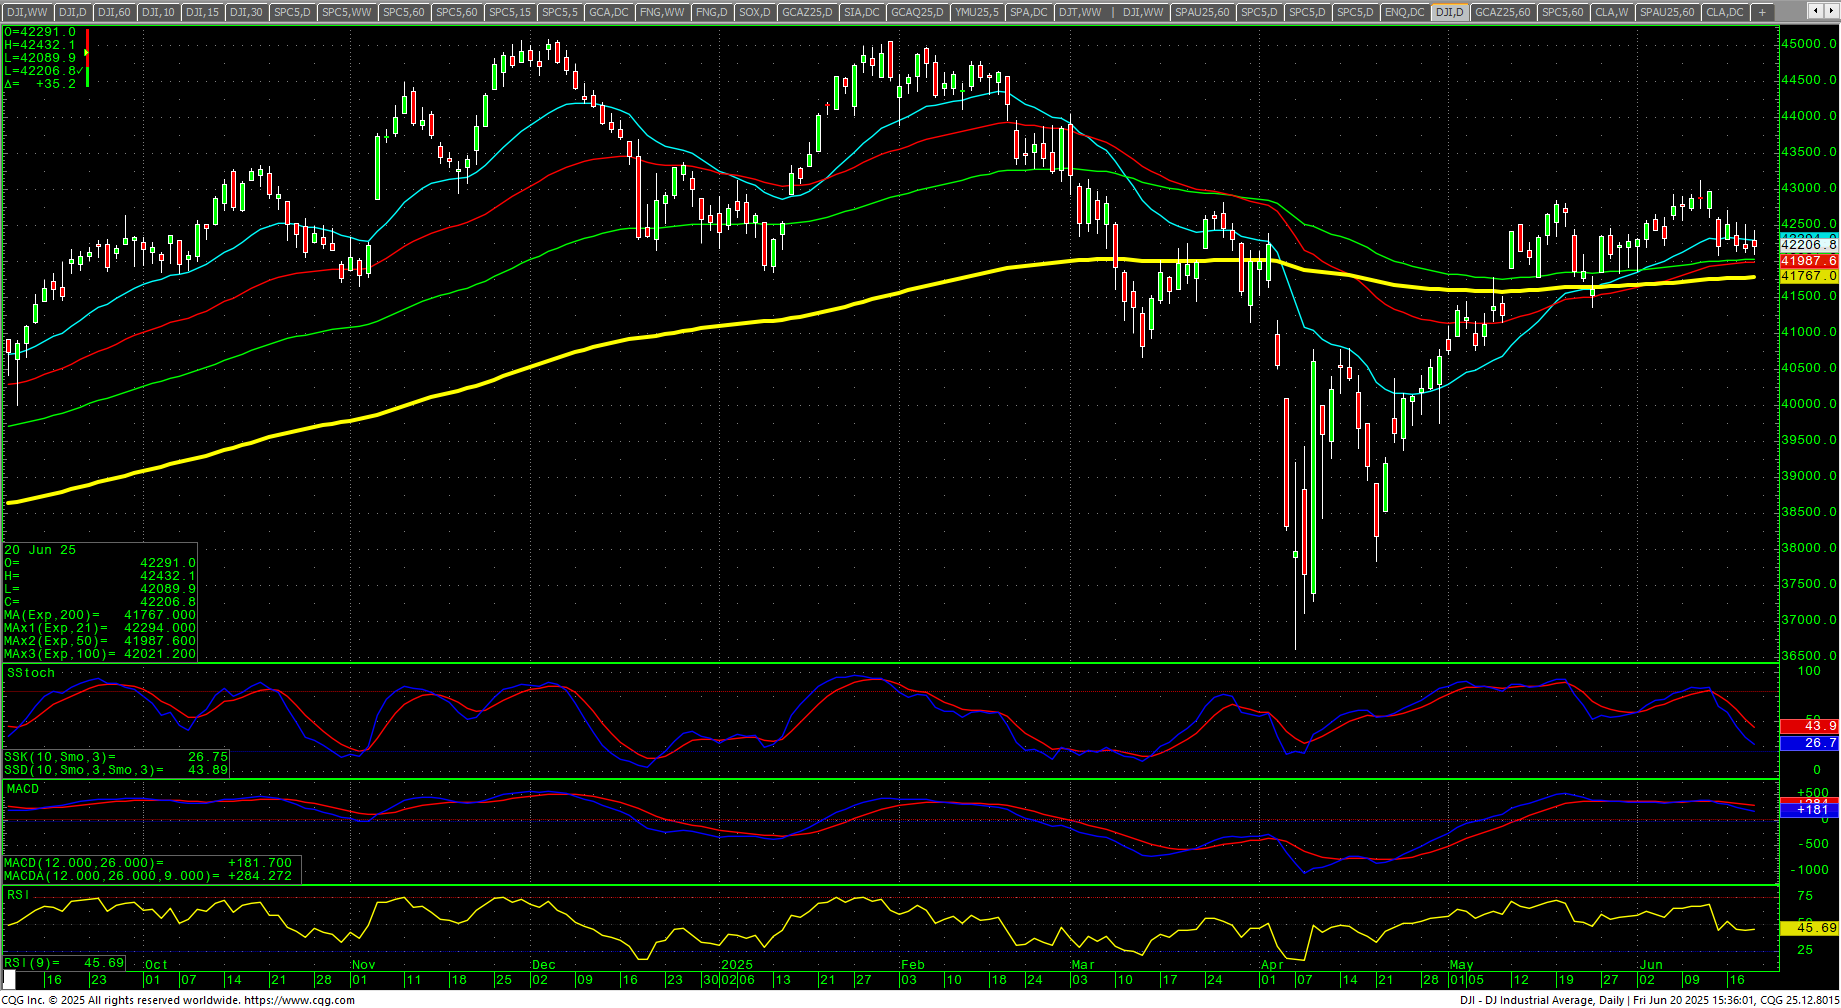 Resistance is 42325, 42477, 42598 and pivotal at 42720/42725. A drive above 42725 can test 42856/42871 and suggest a test of critical resistance at the Death Zone level at 42943 through 43061/43115 area. Daily closes above 43115 should minimally test 44034 and will open potential for a test of the all-time highs at 45050/45054/45074. Closes over 45074 opens counts toward 45244 and 45426 (Fibonacci target). Rallies with closes over 45426 will reopen longer-term monthly targets in the 47400 level with targets of 46568 and 46954.
| Resistance | Support |
|
|
S&P 500 Cash Index: SPX
S&P 500 Index Weekly H-L-C
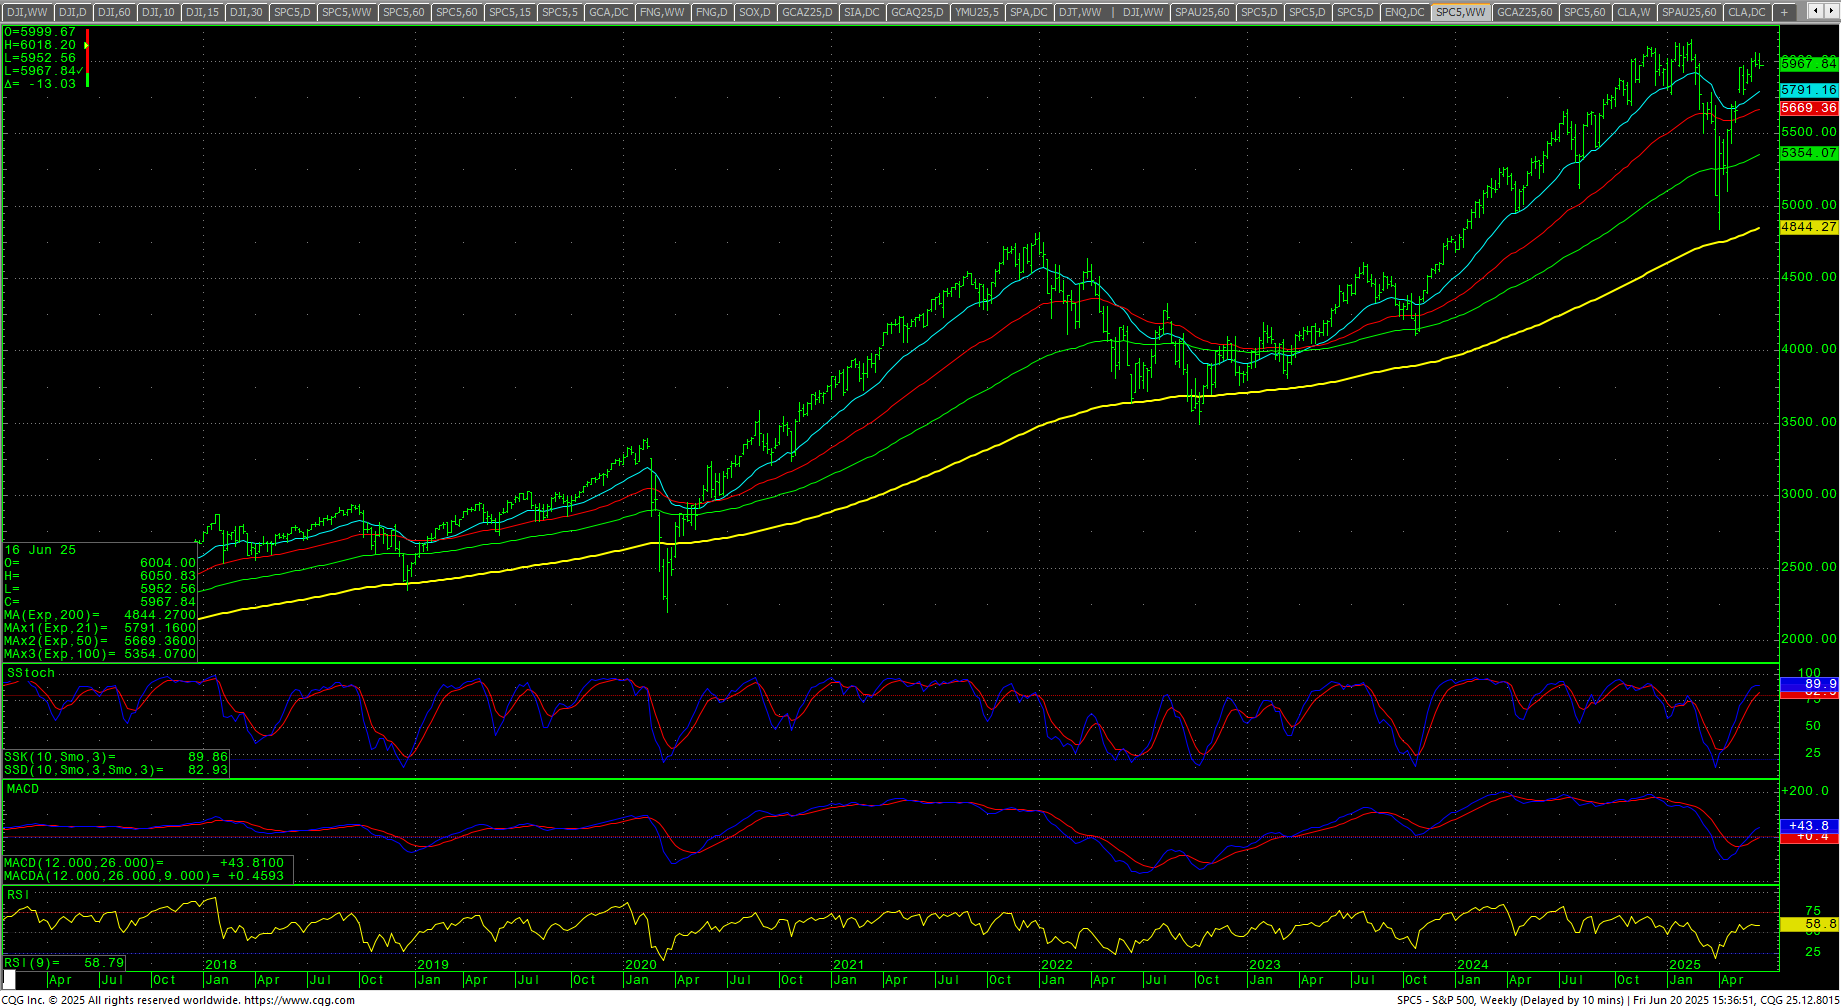 The S&P closed fractionally lower, on the bottom of the weekly range. The action leaves most of the short-term numbers the same and the first two days of the week continue critical cycle timing. The daily is reacting to an overbought bearish divergence. The RSI and the MACD are reacting to bearish divergences. The weekly is still in an uptrend and reaching overbought conditions. The hourly is oversold on Friday’s close. The 200-day MA is 5714.47 and is trending higher as it sets a new record high.
SPY Daily Candles
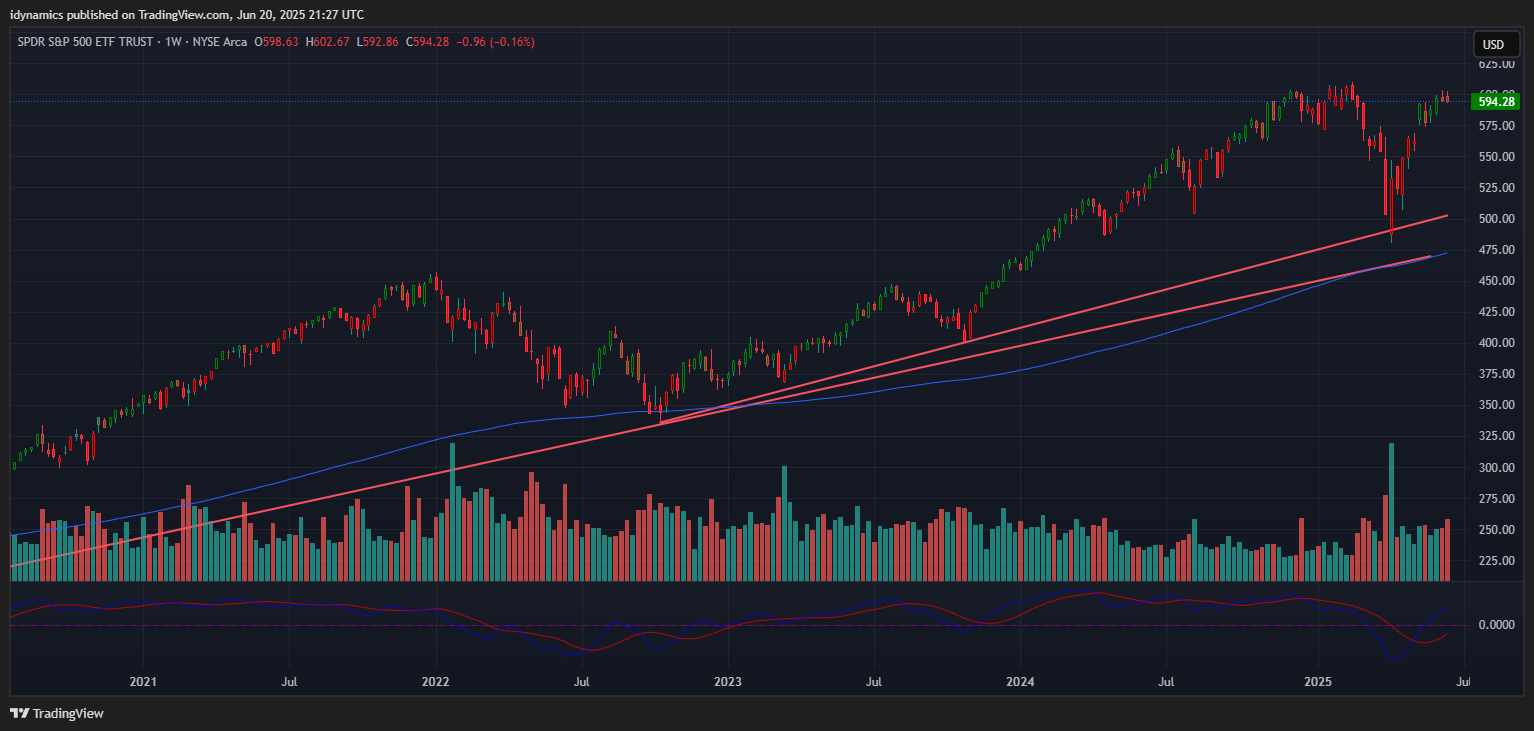 Prices closed under support of 5976. Further declines can retest 5951/5947 with pivotal near-term support at 5926/5924. A breakdown under 5924 sets up a move to 5947. Closes under 5947 will open counts to 5913 with pivotal short-term support at 5878/5875. Trading under 5875 opens counts to 5767 with trading support at 5840. Closes under 5767 count to 5448/5447 with counts to critical support 5302/5298. A breakdown under 5298 sets up 5141/5123 with potential to open intermediate-term counts for a retest of the 4835 swing lows with support still at 4884/4880. Closes under 4880 are bearish and open counts to 4614 through 4586.
S&P 500 Index Hourly H-L-C
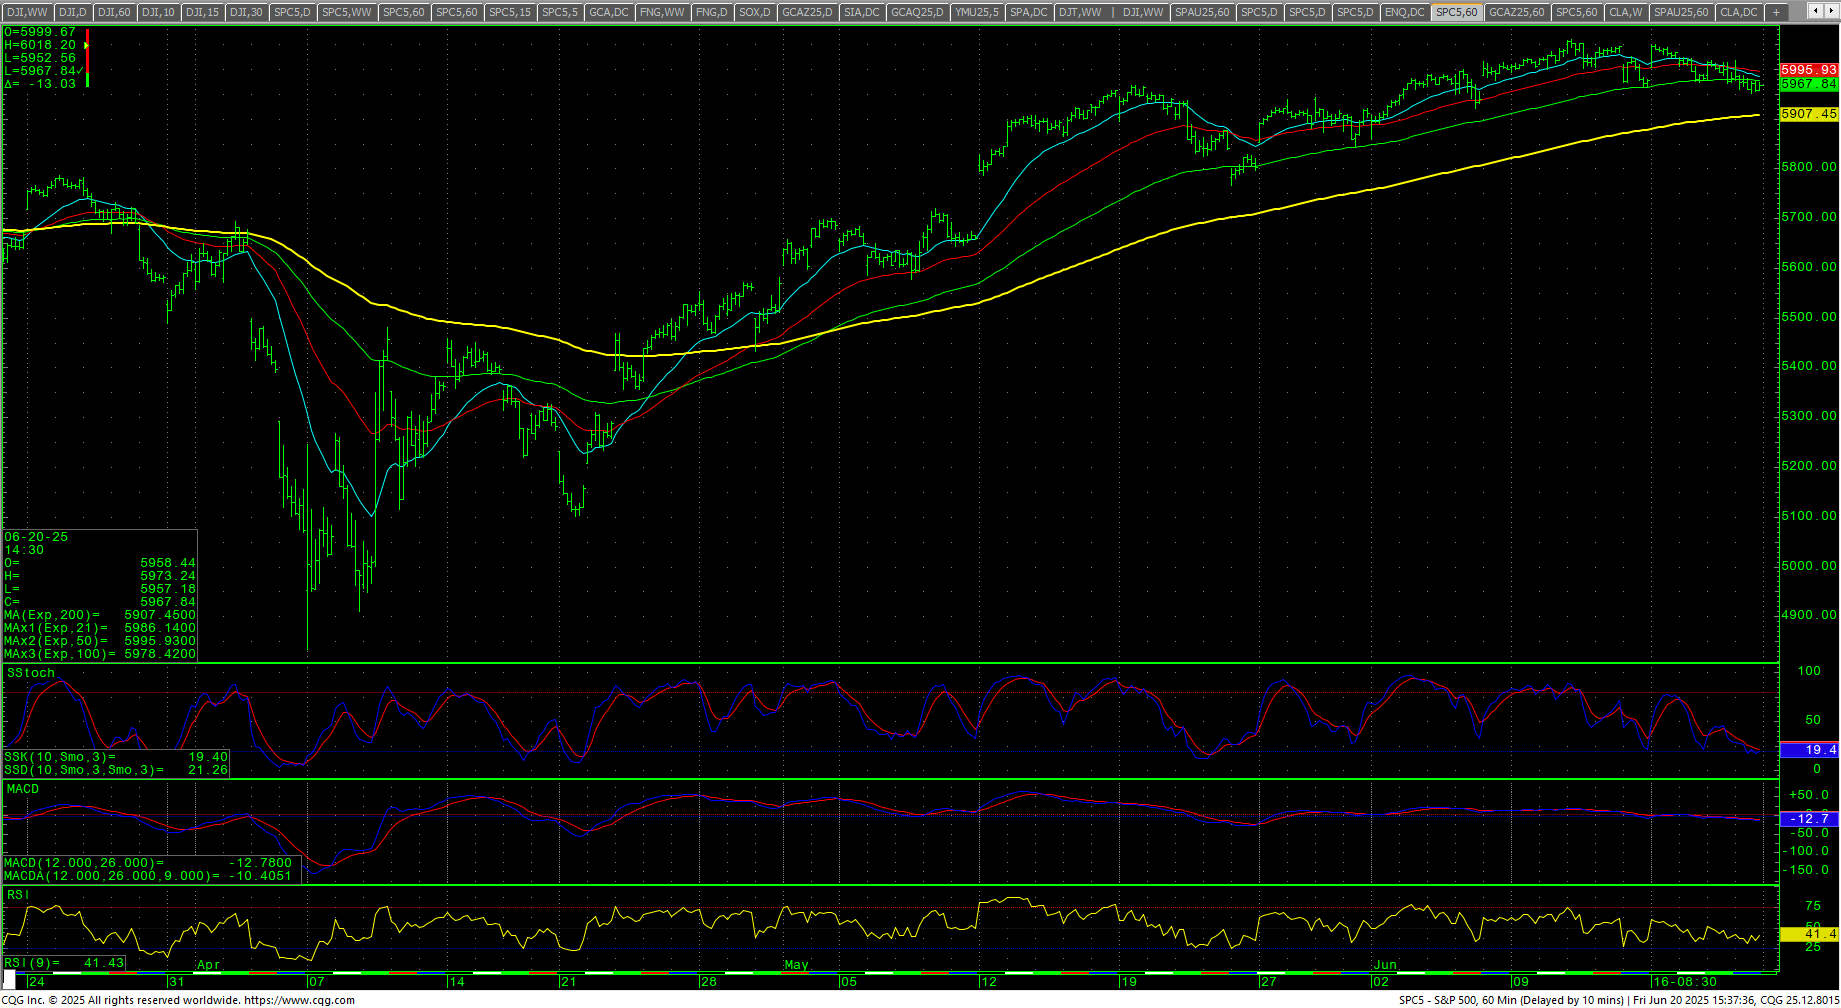 Resistance is 5993/5994, 6006 and 6018/6020. A drive over 6020 can retest 6059/6061 with counts to 6112/6114 and full counts into critical resistance at the intraday high of 6147.43. Rallies through 6148 should test 6160 with a shot at a target of 6180.35/6181. Closes over 6181 open counts to 6224 and 6296. Above 6296 can carry to 6368 with counts into the 6440 area. Closes over 6440 will open counts to 6584. A breakout over 6584 sets up 6638 and 6692.
| Resistance | Support |
|
|
Charts courtesy of CQG, Inc., CNN, Koyfin, Trading View and AAII