
TECHNICAL ANALYSIS (by Intraday Dynamics)
Major Indices Week of July 19, 2024
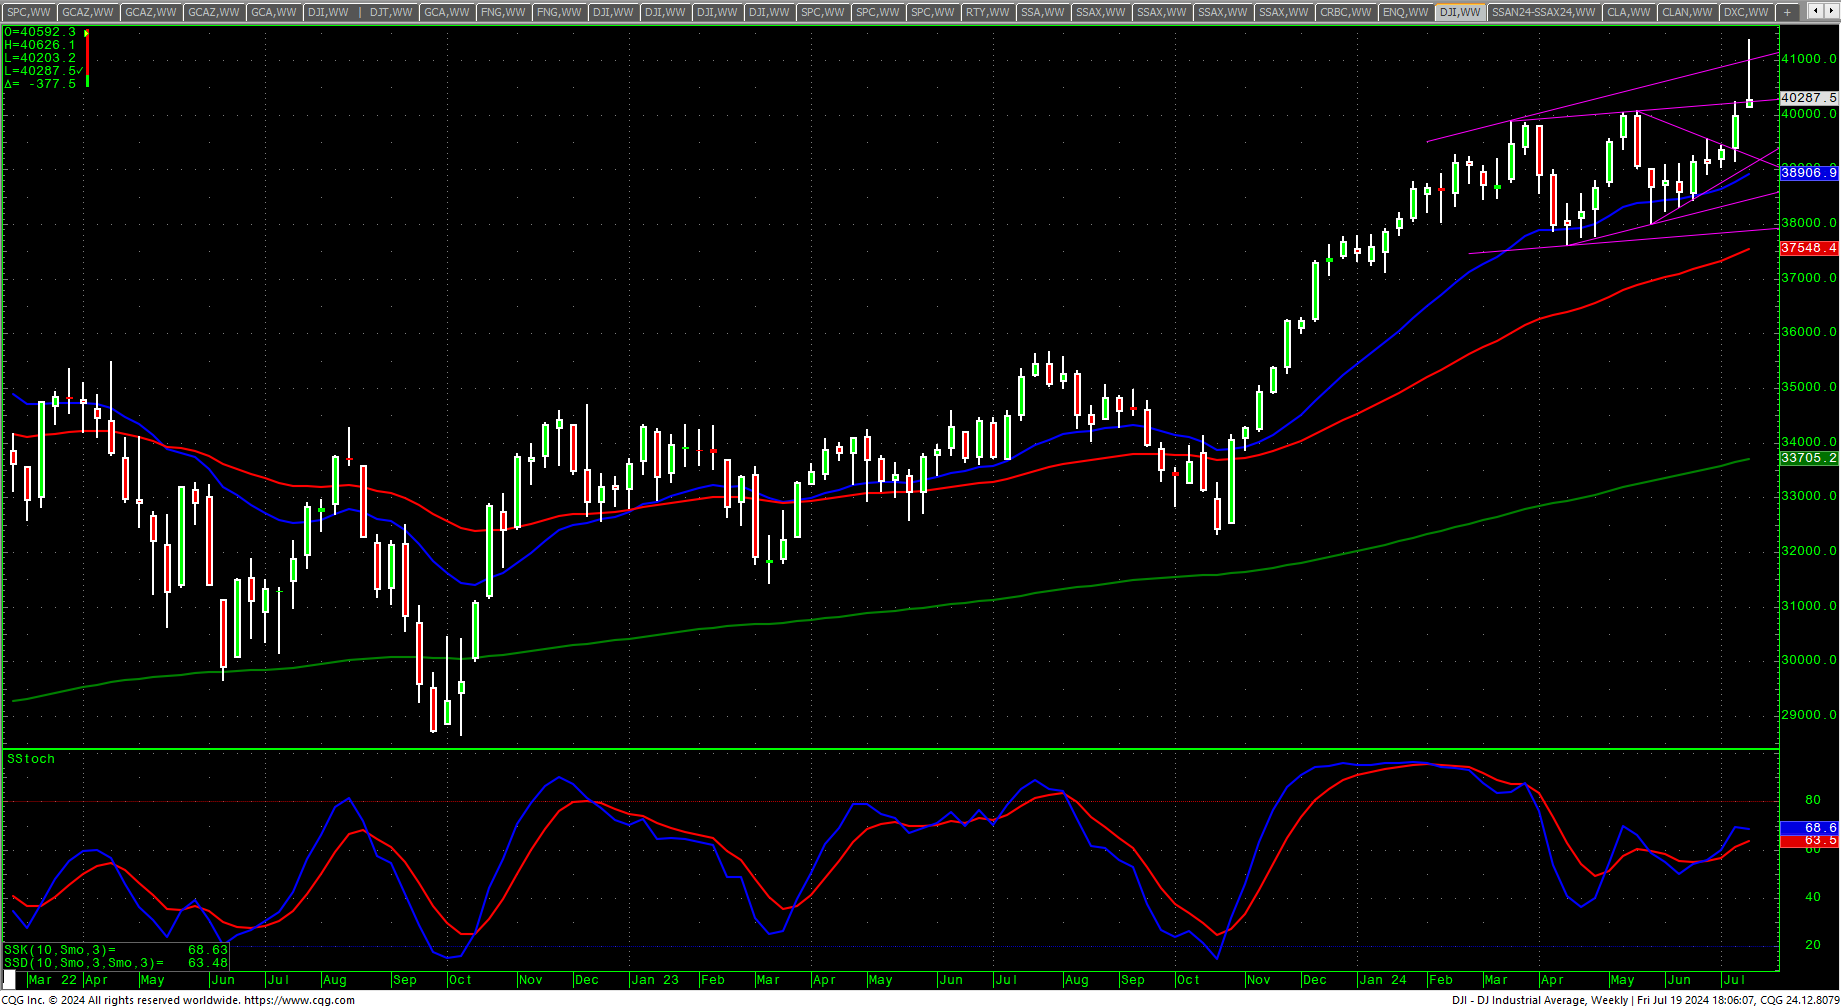
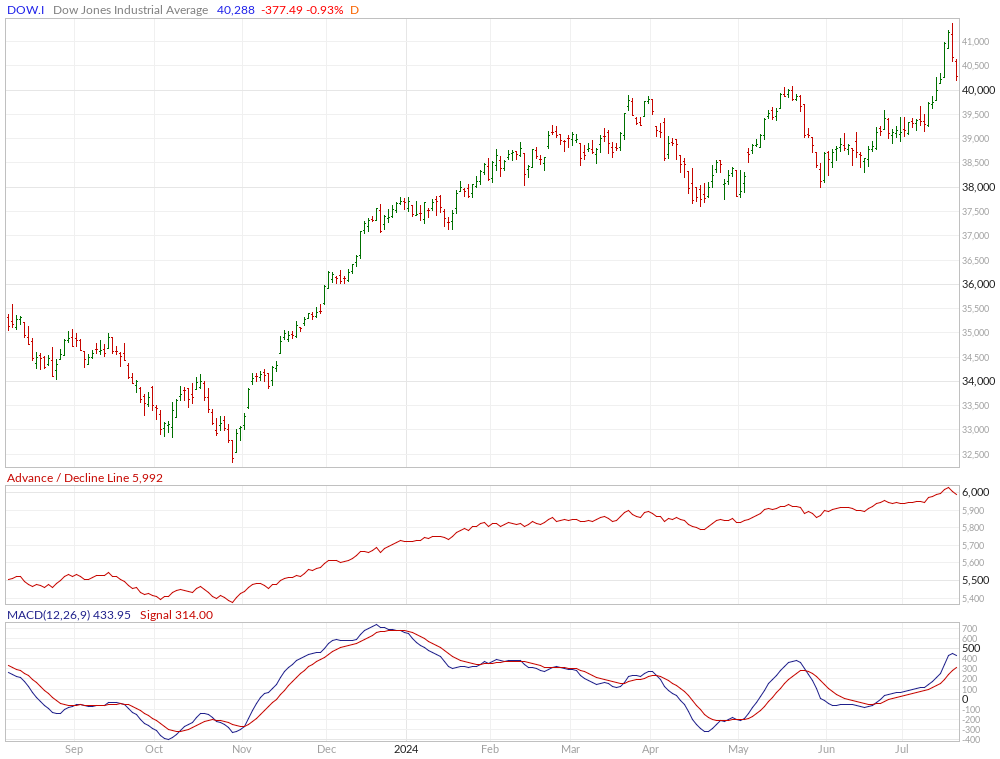
Dow Jones Industrial Average Weekly Candles
Can we start talking about blowoffs yet? Is this the 8th inning, the 9th, or is the fat lady about to sing?
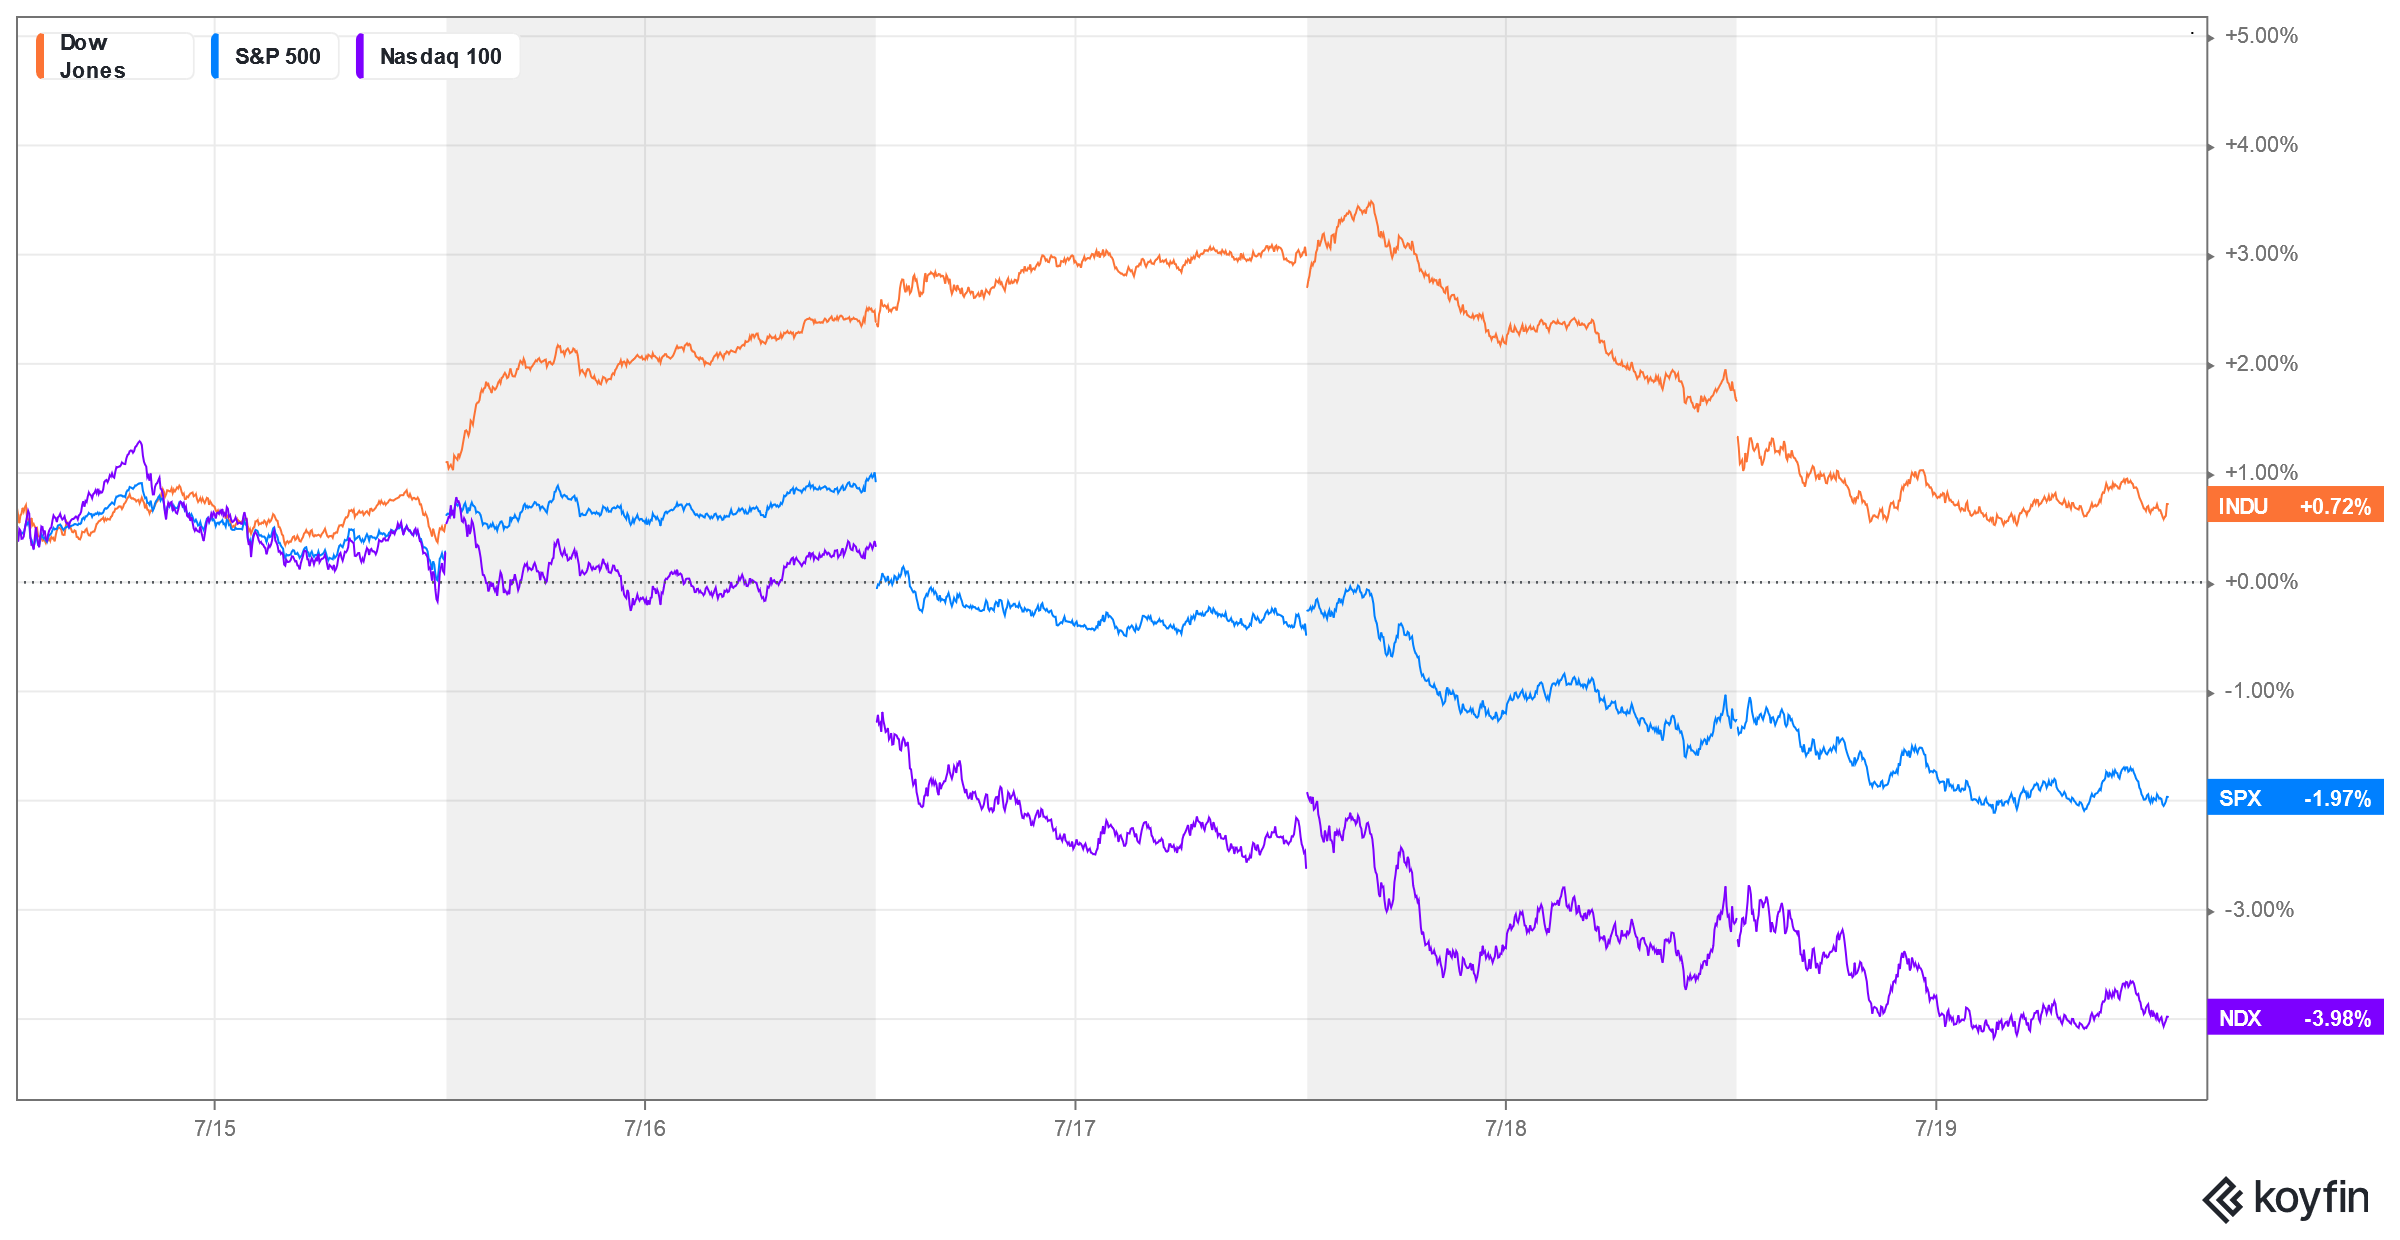
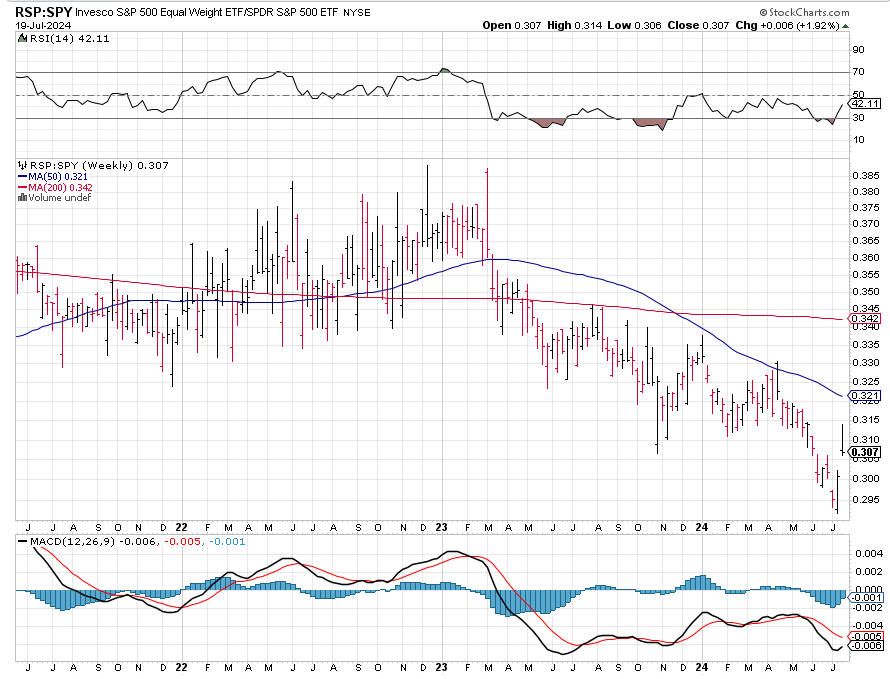
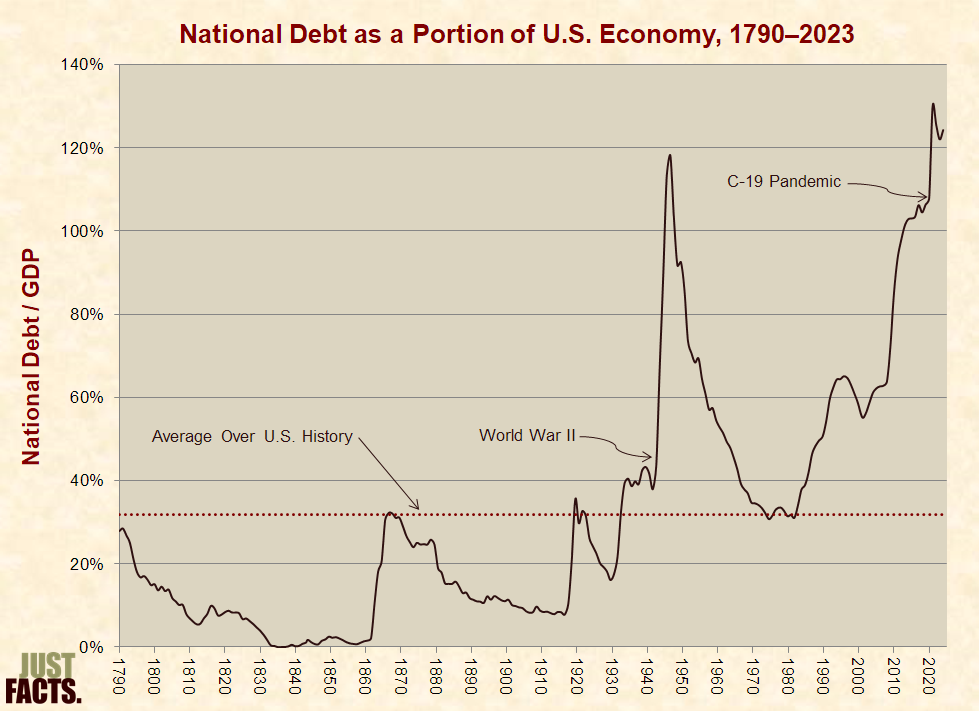
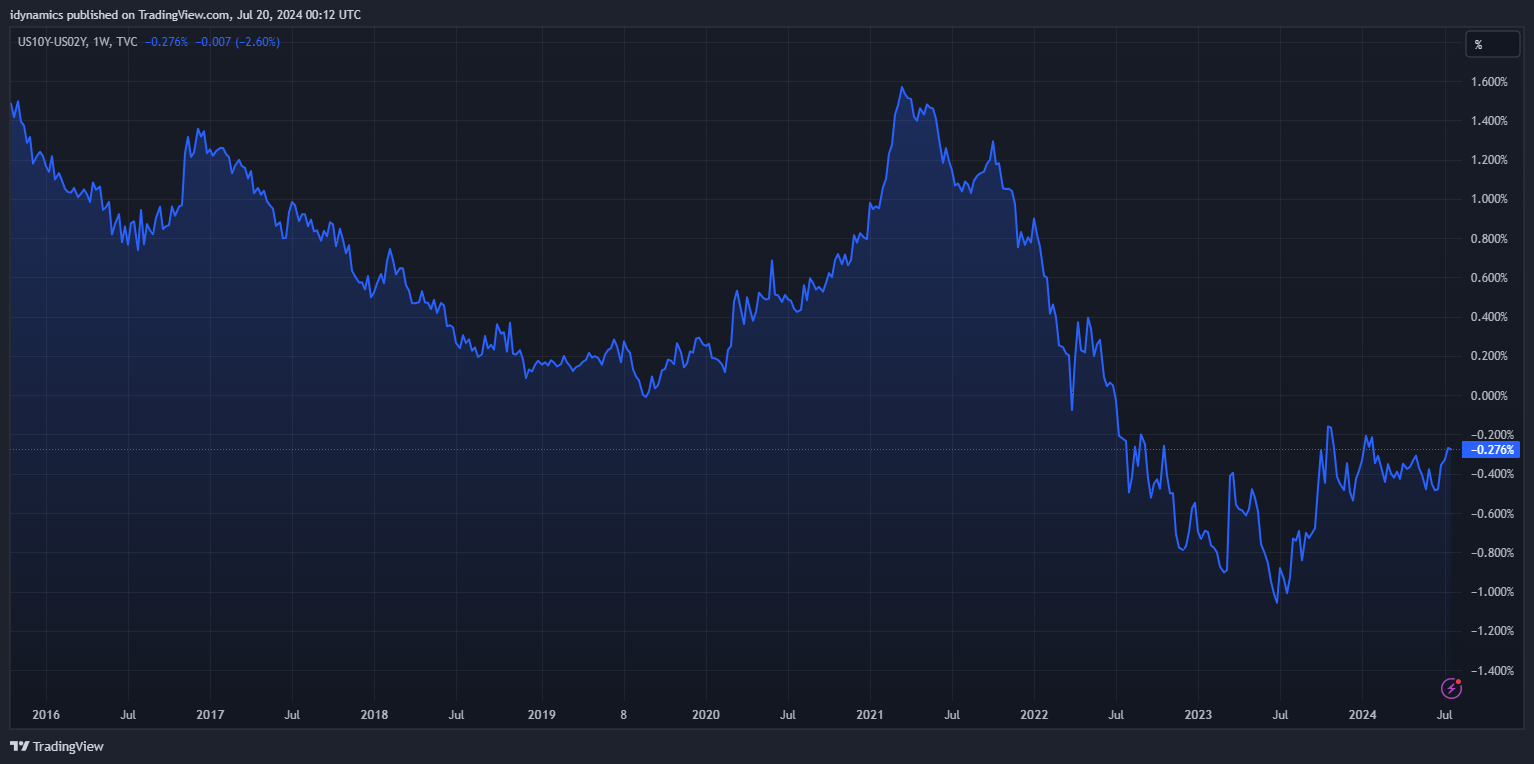
Stocks saw a manic week of trade, taking Mr. Toad’s Wild Ride, with the Dow racing to record highs early, only to have all major indices plunge late in the week. The S&P had its worst week in months as the cash index staged a massive outside week down. Tech stocks got crushed, and Friday’s ‘Largest IT Outage in History” only added fuel to the current bearish fire for the recent high-flying market leaders. Technically, the action in the S&P and the Nasdaq/FANG are wake up calls for the trends as charts are posting lower highs and lower lows in the short term. Other than that, nothing has really changed. That said, the recent post by TopDown Charts regarding the VIX Seasonality is starting to look a bit more ominous. And, as we pointed out in the update on 5 July 2024: “That said, there are any number of cautionary flags that one can look at as troublesome. In no particular order, the market is extremely thin, with breadth negative and only a scant number of stocks actually participating in the rally; the RSP:SPY continues to trend toward some extreme lows; there is a seasonal trend in the VIX that tends to predict increased volatility in the second half of the year; there is tremendous anxiety surrounding the US election this fall; the cost to service the US debt has now reached levels exceeding what the spending is on the military annually and remains at historically high levels relative to GDP; the inverted yield curve has reached the longest inversion on record.”
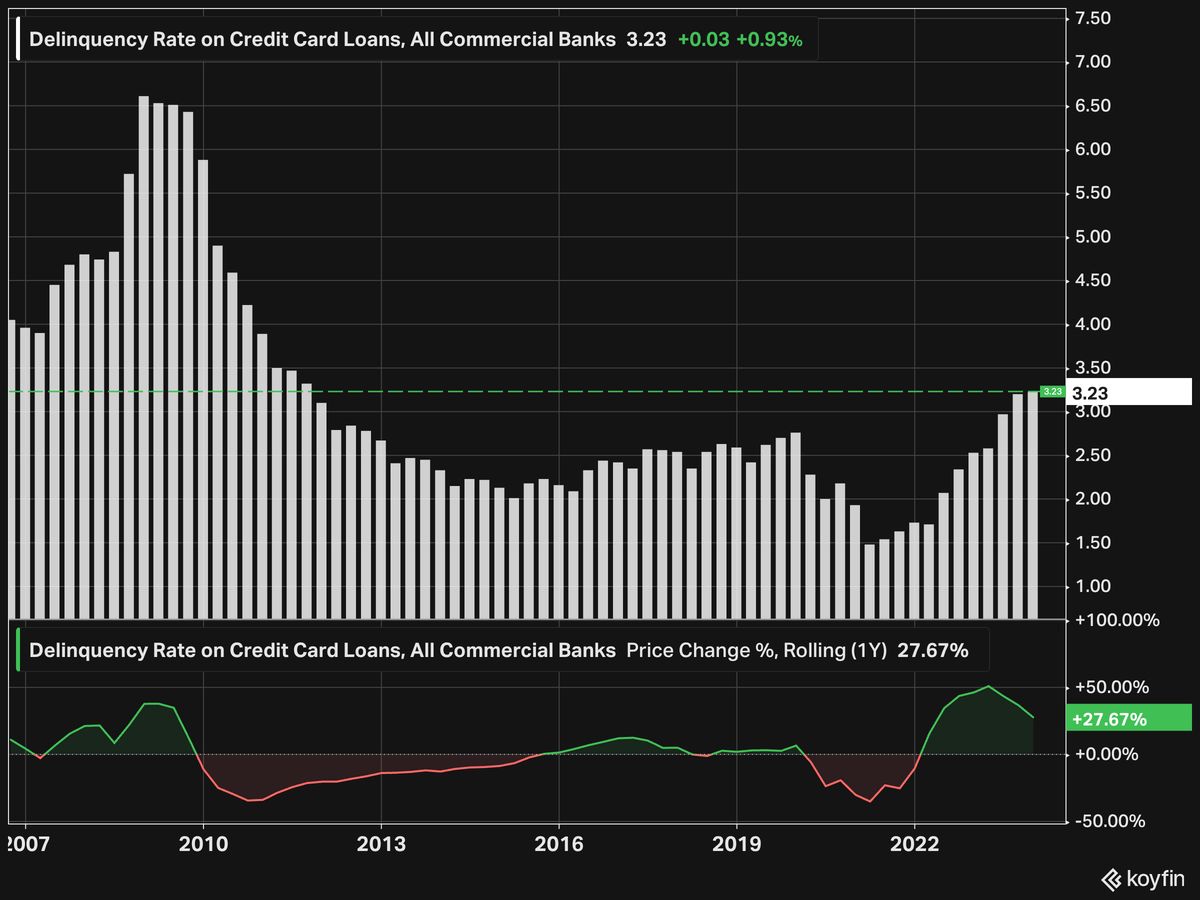
Now, we can add that consumer debt has topped $1 trillion and the average interest rate to carry that debt is upwards of 23%! Another data set that stands out right now is that credit card delinquencies are at the highest levels since 2011. Also, the recent ‘rotation’ into the secondary stocks has alleviated the deep discount in the RSP:SPY chart and has resulted in breadth lifting sharply from its recent anemic readings. And you could say that the 2024 US election has moved from anxious to outright Kafkaesque. As one might expect, last week’s wild ride has left sentiment indicators all over the map…still.
VIX Seasonality
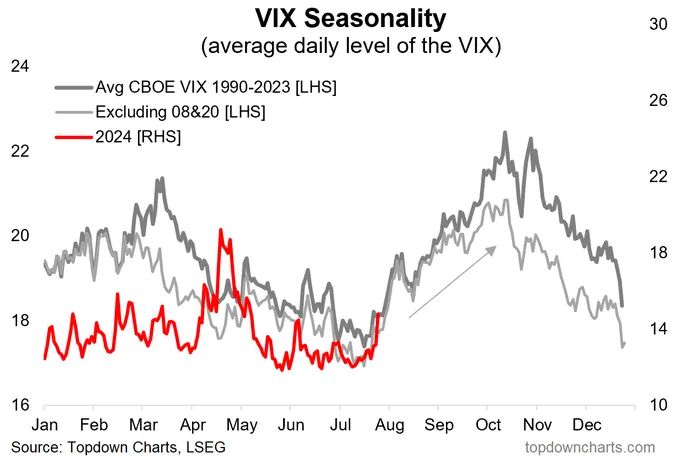 (chart from TopDown Charts)
The Dow exploded higher to start the week, setting a record intraday high of 41376 before staging a huge outside day down (aka; a bearish engulfing pattern on the candlesticks). The weekly is close is a record high for the Dow, and technically, a case can be built for the market to be returning to the previous breakout area of 40000 for a test of that level. The stochastics on the daily are overbought and the weekly, while having a weak close, still supports the upmove on the oscillators. And, volume has still not reached manic, blowoff proportions.
VIX Weekly H-L-C
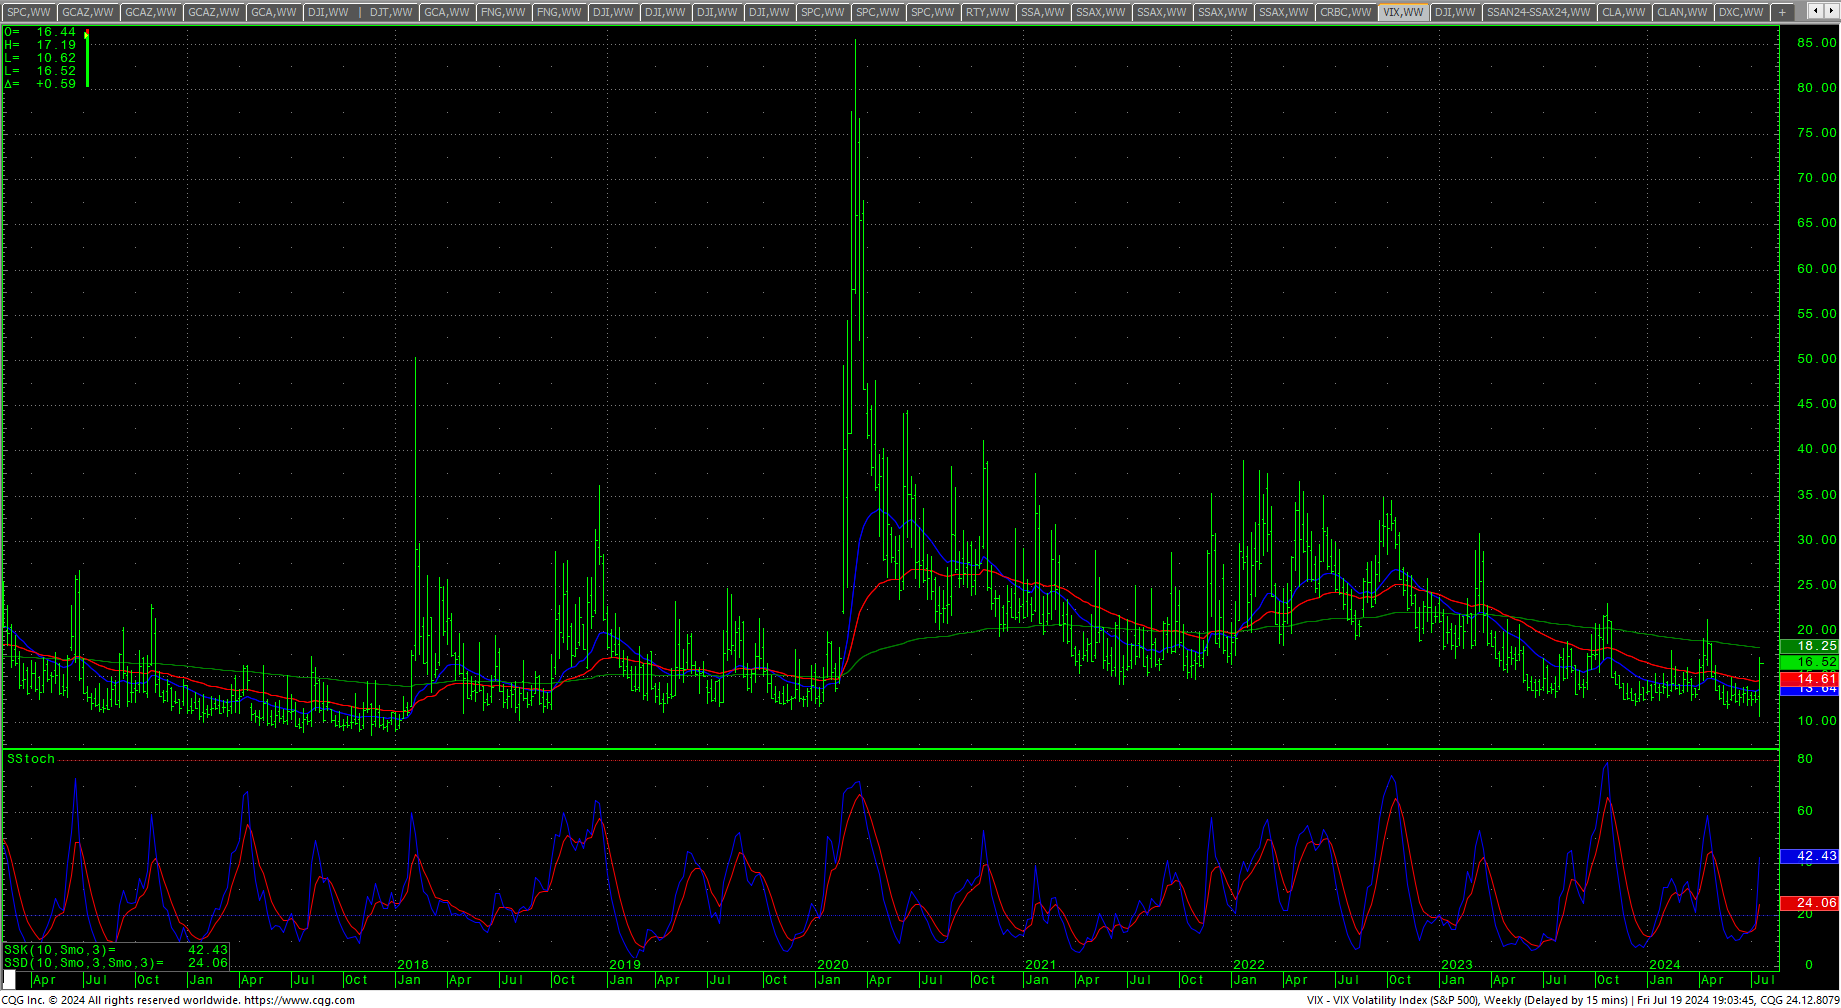
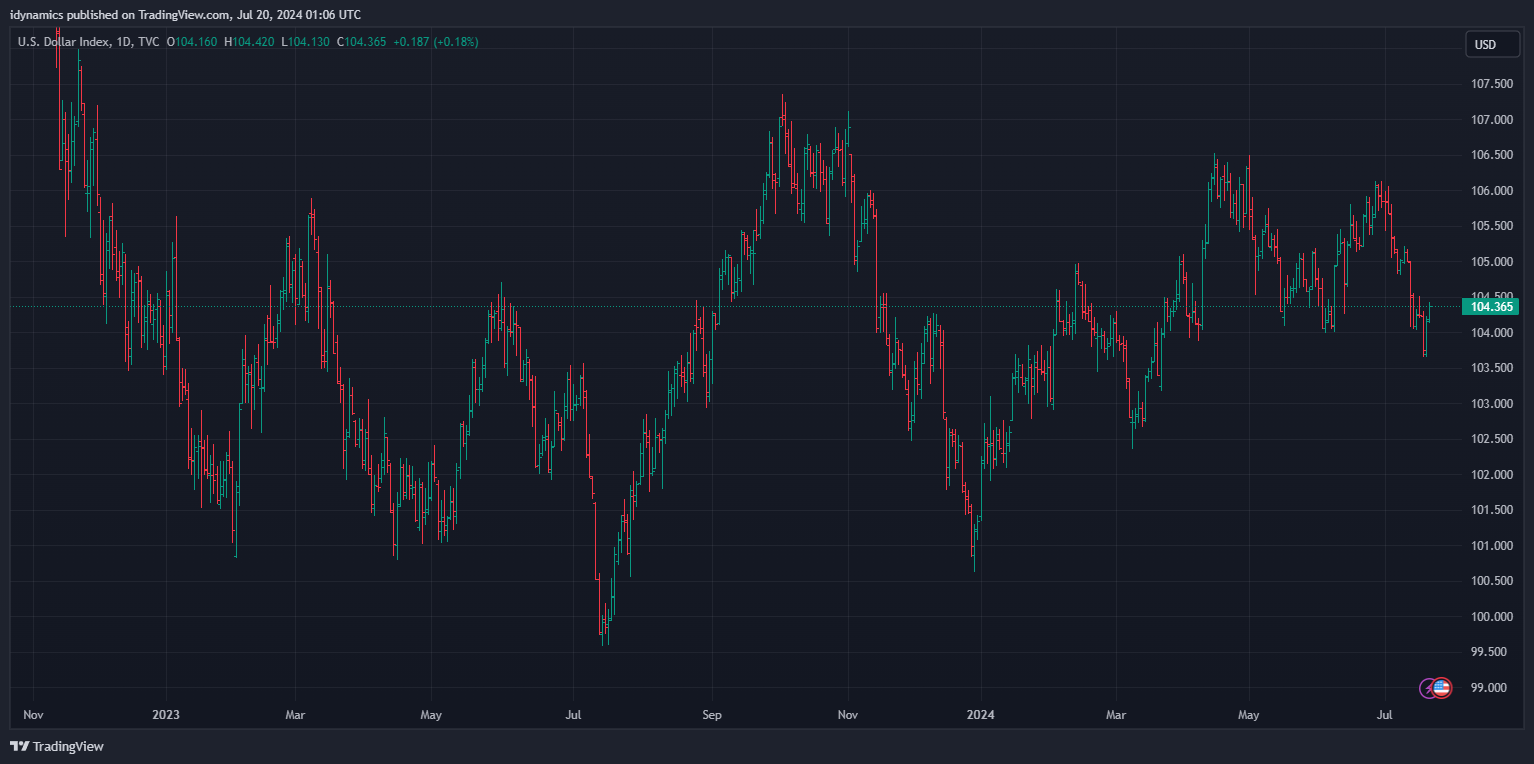
The VIX soared over +28% on the week, closing in the upper end of the week’s range. (Note that there is a bad print on the VIX charts from midday Friday). The Dollar traded under support at 10400 and recovered late to stage a bullish reversal on the week.
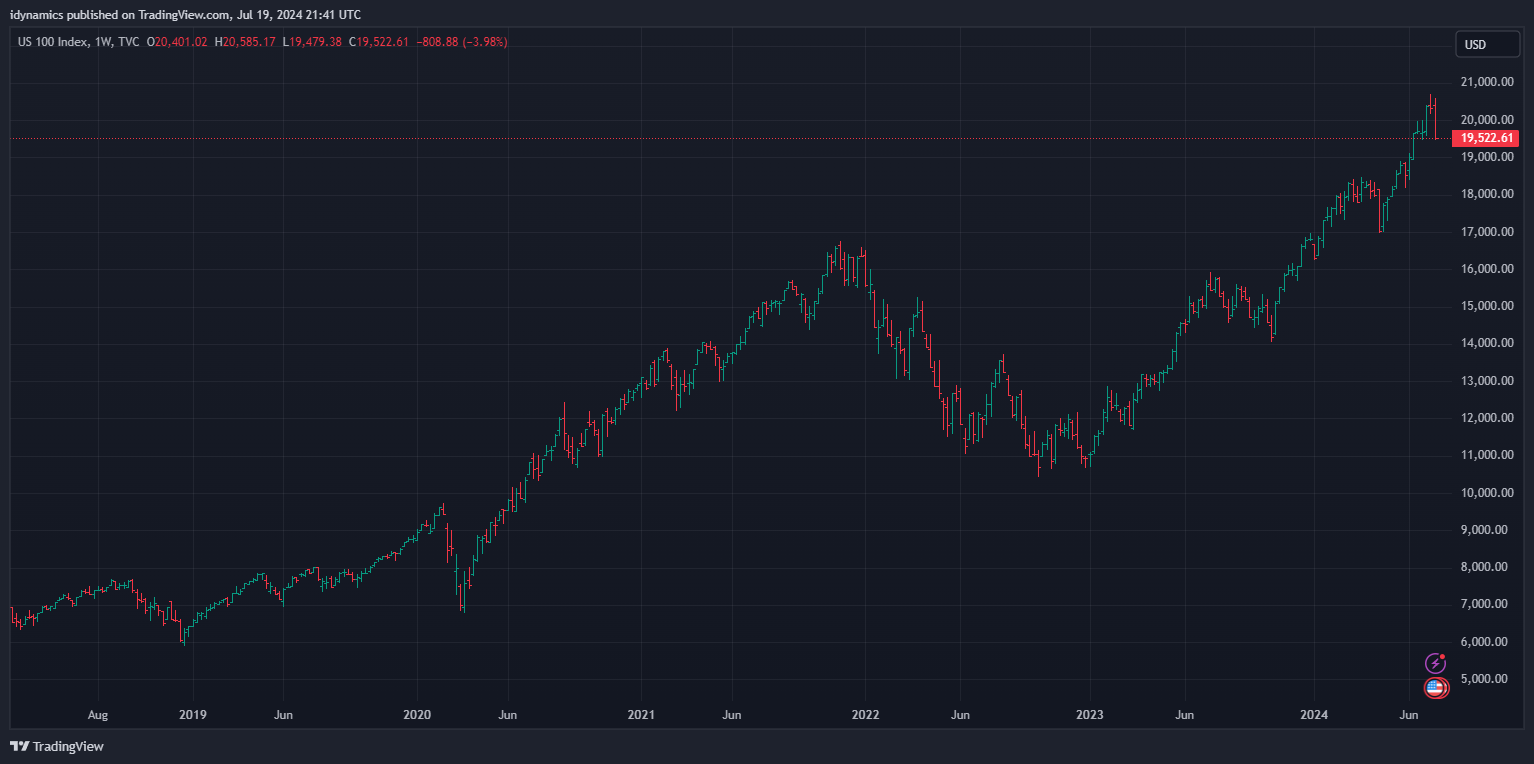
 Nasdaq 100 Weekly H-L-C
 52-Week A/D Line

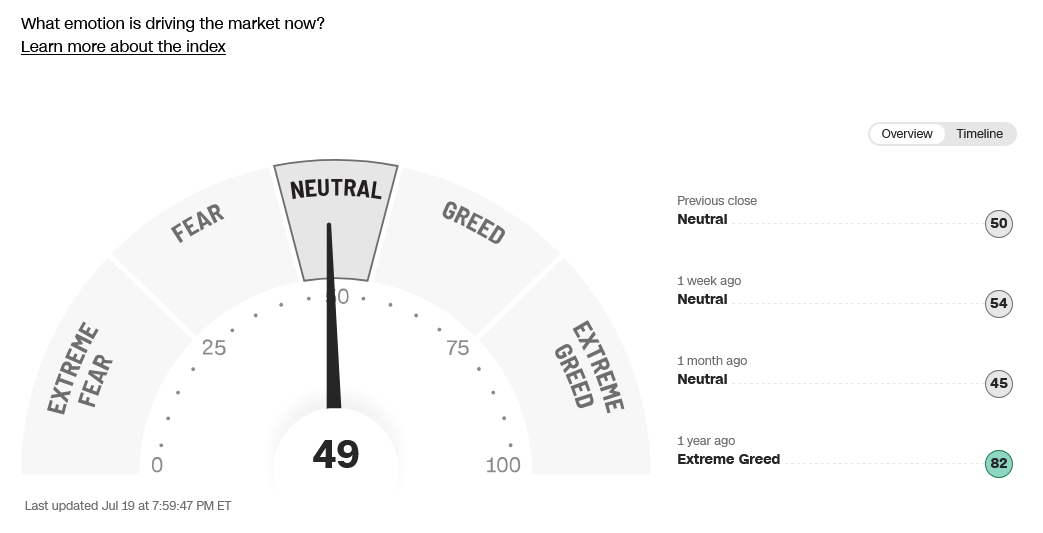
CNN Fear & Greed Index
 AAII Investor Sentiment Survey
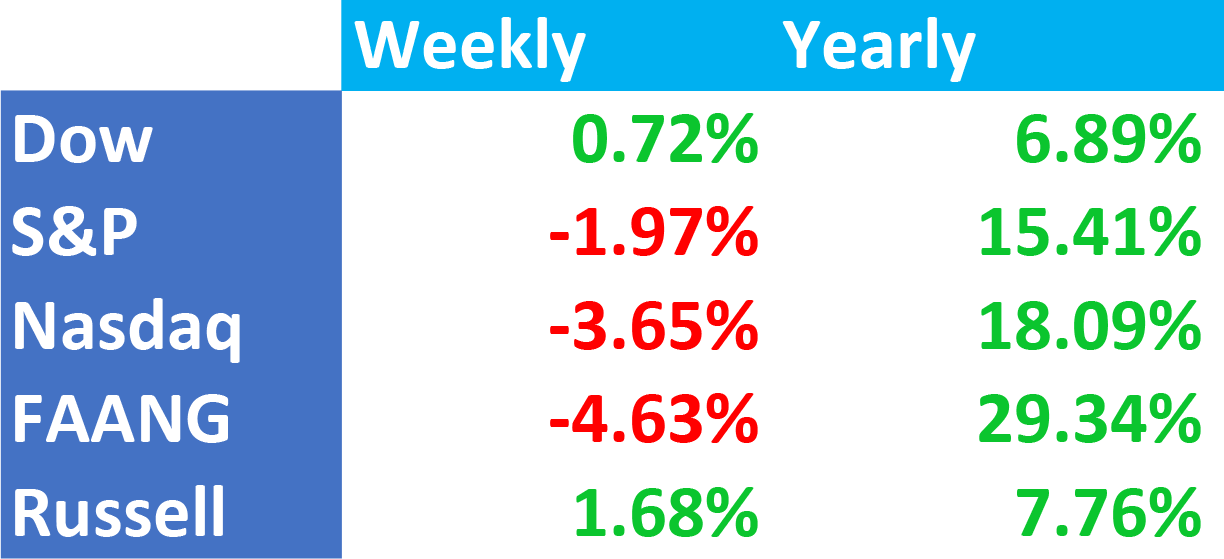
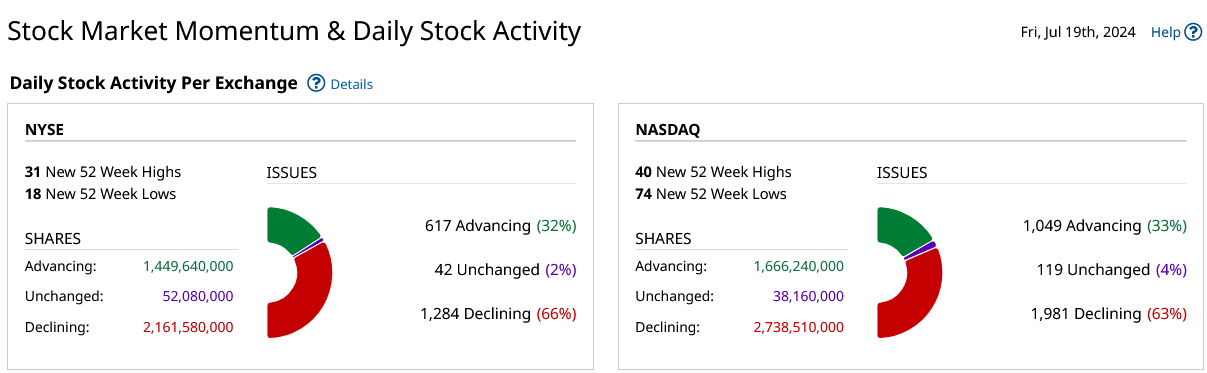
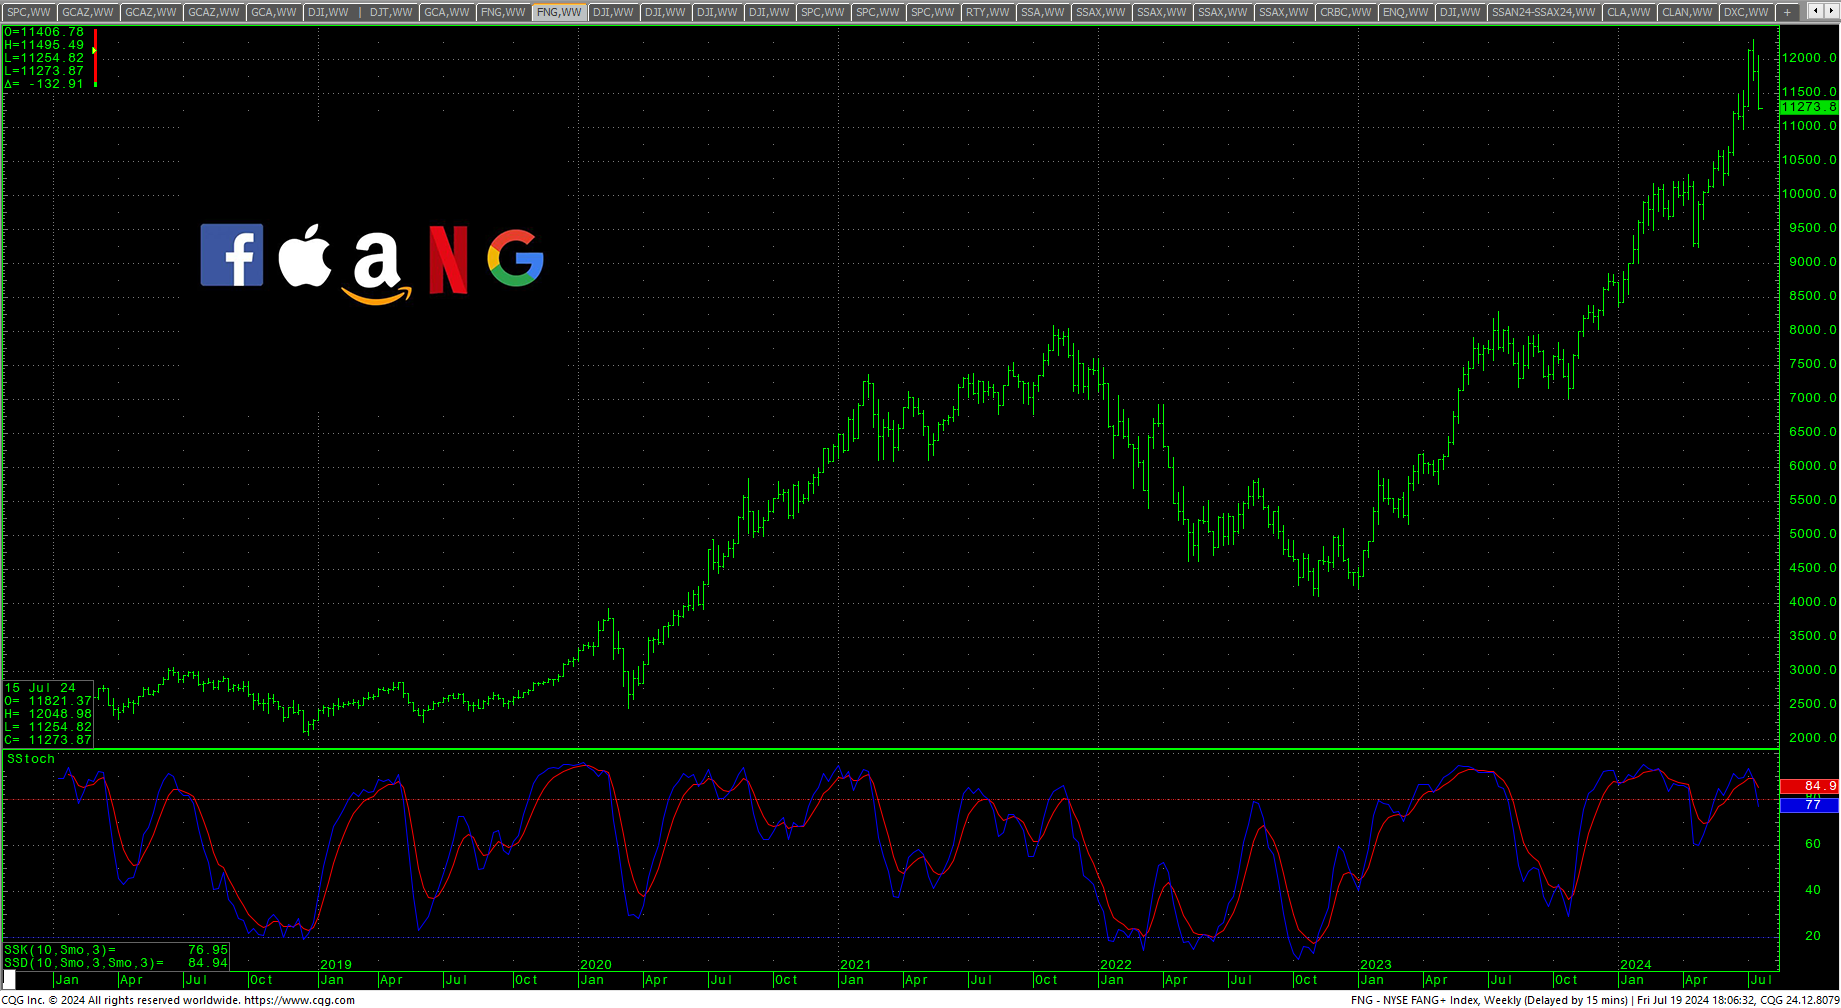
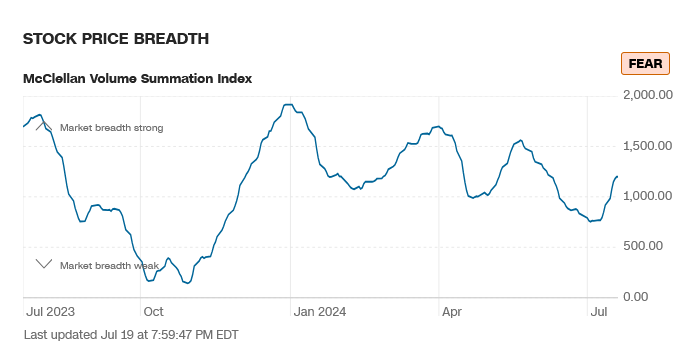
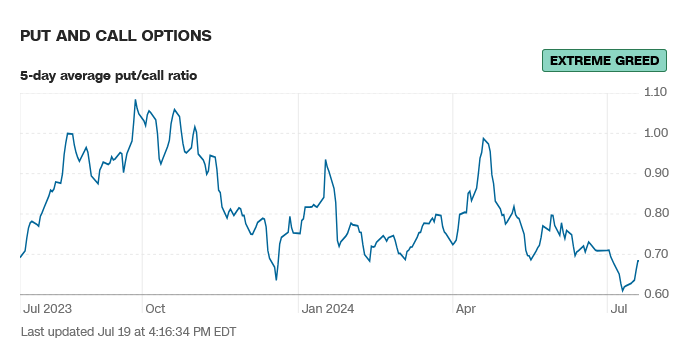
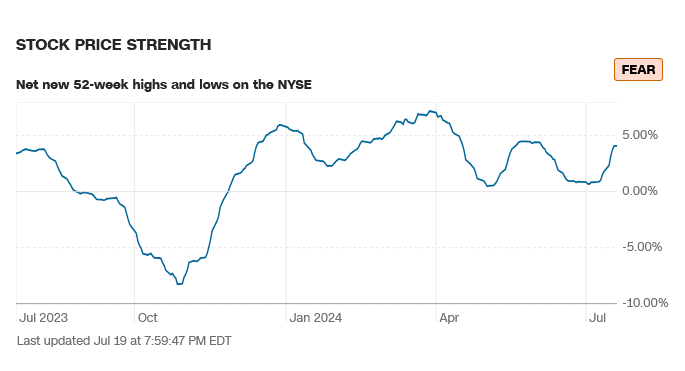
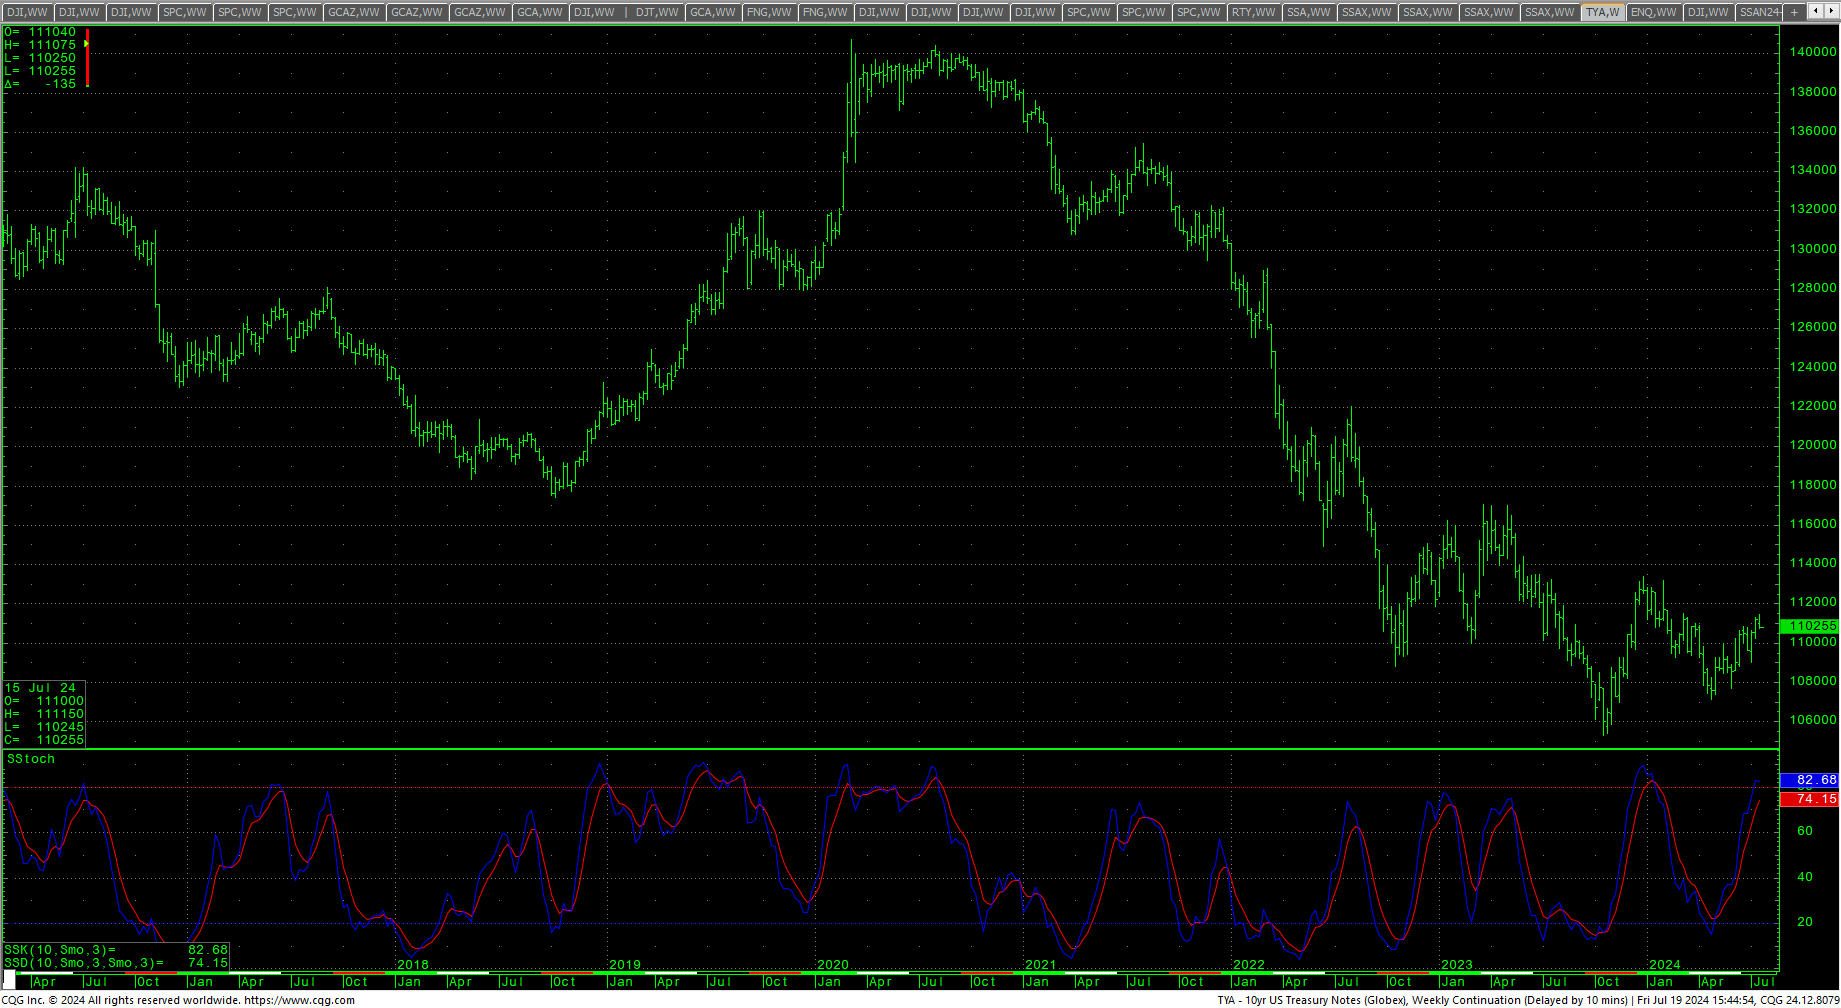
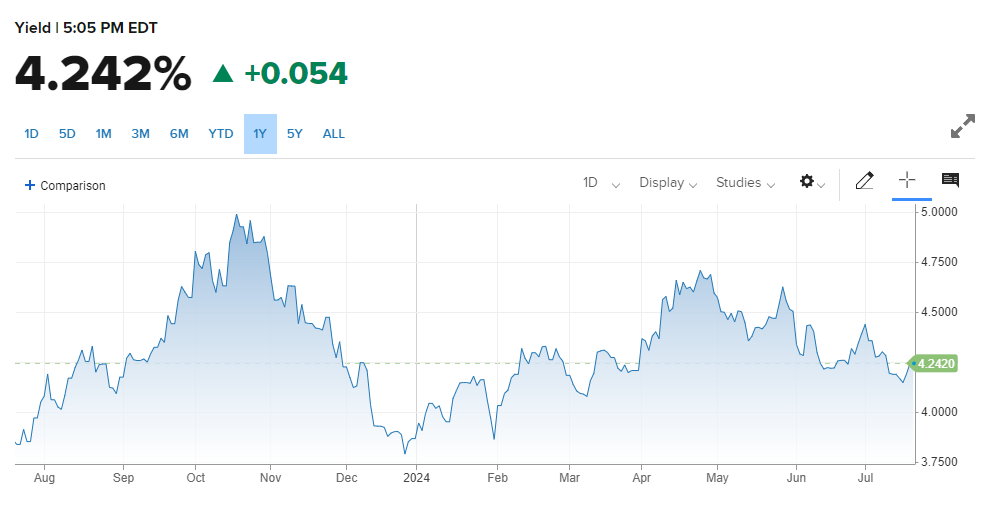
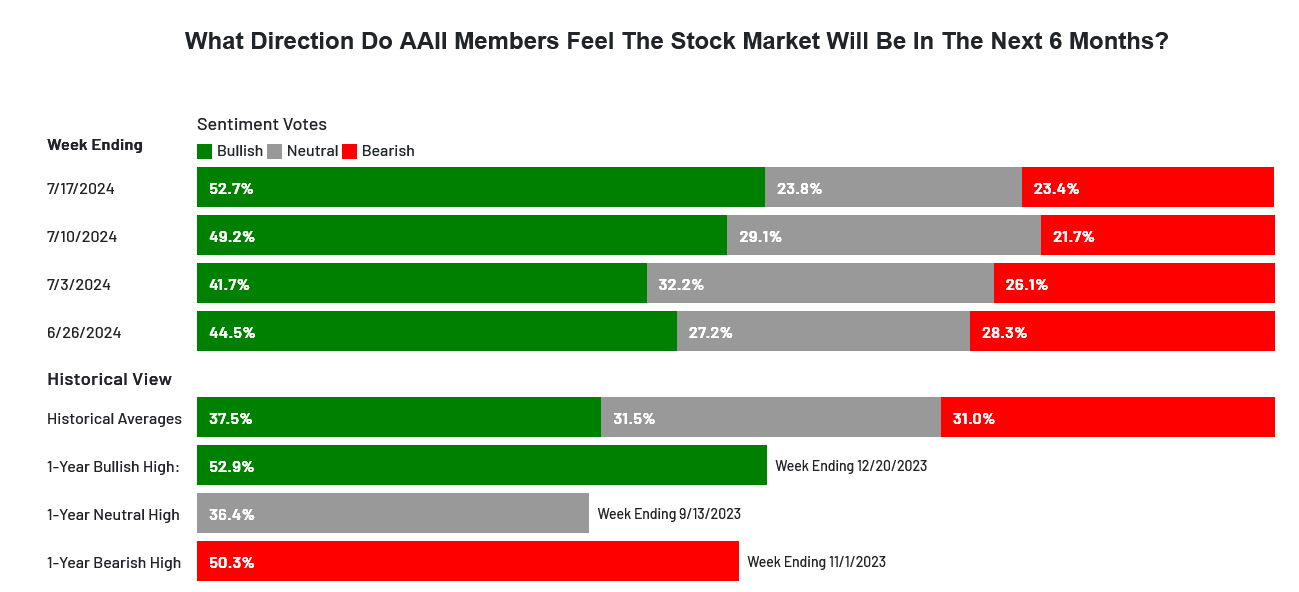 Sentiment, as indicated above, remains schizophrenic. CNN Fear and Greed moved back to neutral. Breadth continued to improve sharply but still reads fear. Latest AAII Sentiment Survey: Neutral Sentiment Decreases. The Dow A/D line ticked up to 5992 with the new highs, and the MACD remains in an uptrend. The VIX, soared higher and closed at the highest level since 22 April 2024. The Put/Call is at 0.68 and is showing extreme greed. The 52-week, A/D moved up strongly +4.09 and indicates fear. The Dow closed the week up +0.72% but on the bottom of the week’s range. The S&P was down -1.97%, closing on the bottom of a wide outside week down after trading to a record high at 5669.67. The Nasdaq Composite was down sharply, -3.65% and the Nasdaq 100 was down -3.98%. The FANG declined sharply, settling down -4.63% on the bottom of the range as the high-flying index is now off -7.98% from its record highs. The Russell closed higher but on the bottom of the range, closing up +1.68%. The 10-year notes traded to the highest level since 4 March 2024 but sold off to close on the bottom of a bearish reversal week. For support and resistance on the SEP TYU24, see the latest Special Report. The yield on the 10YR moved higher to 4.242%.
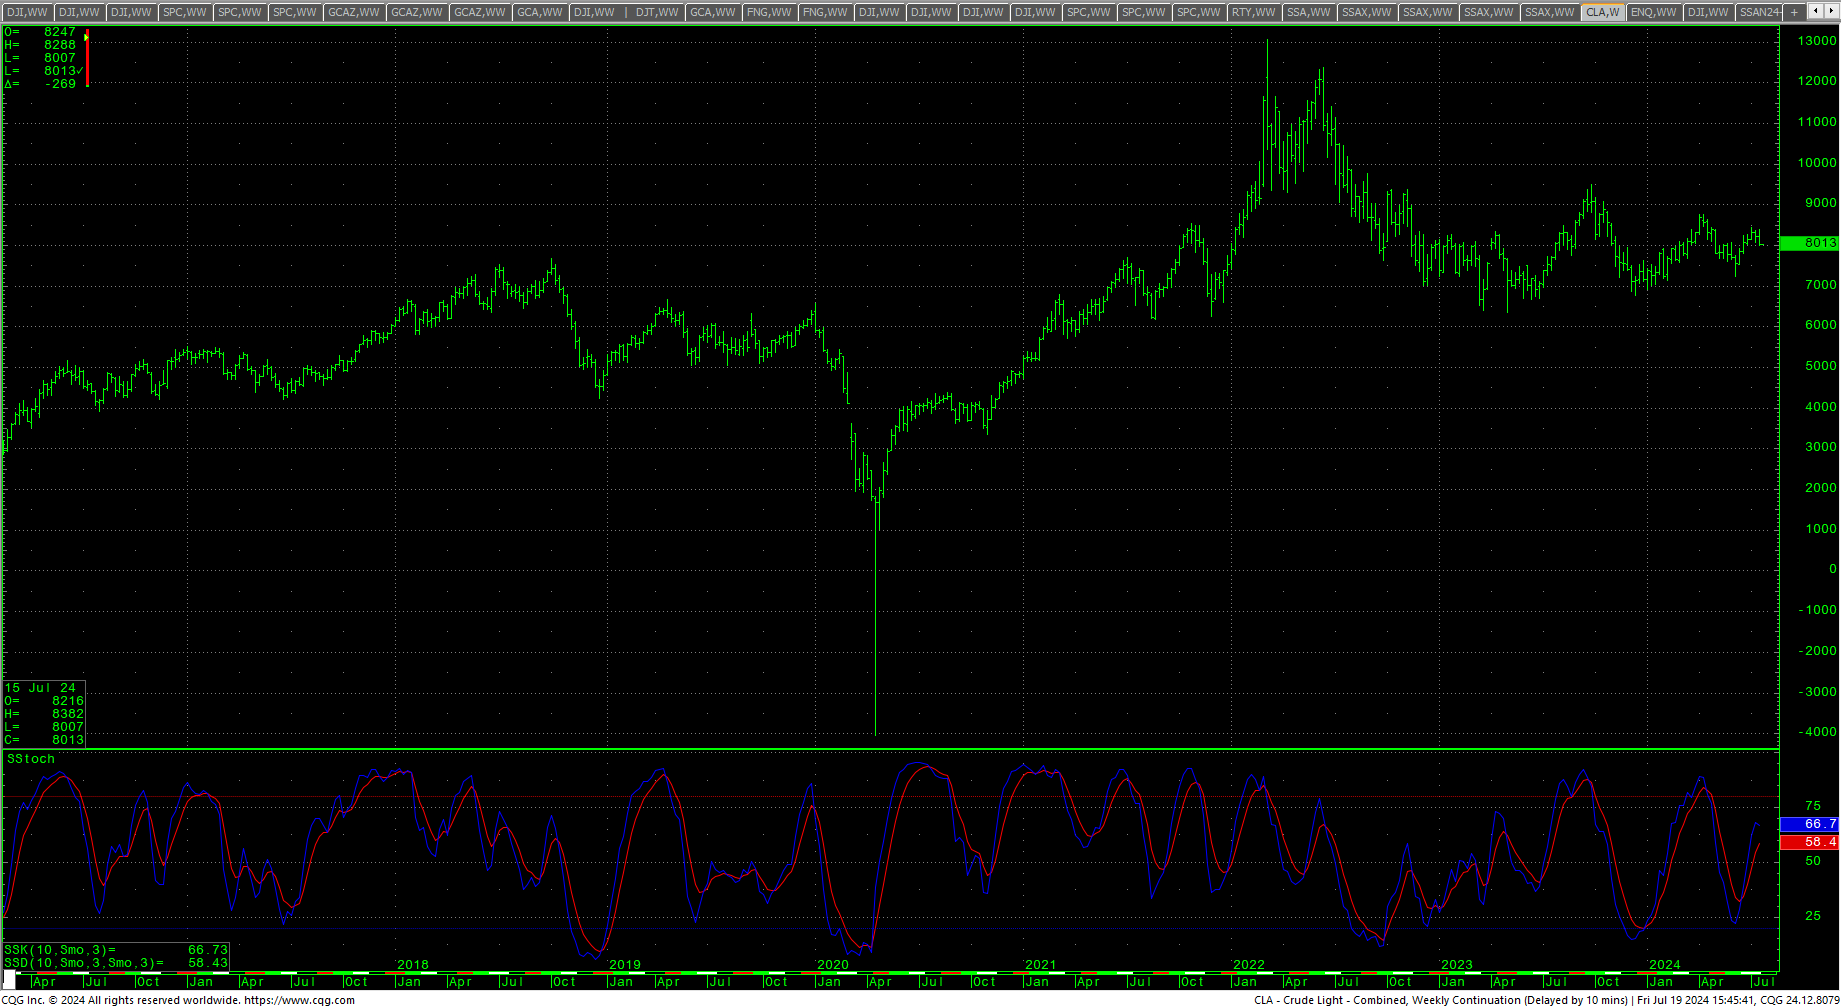
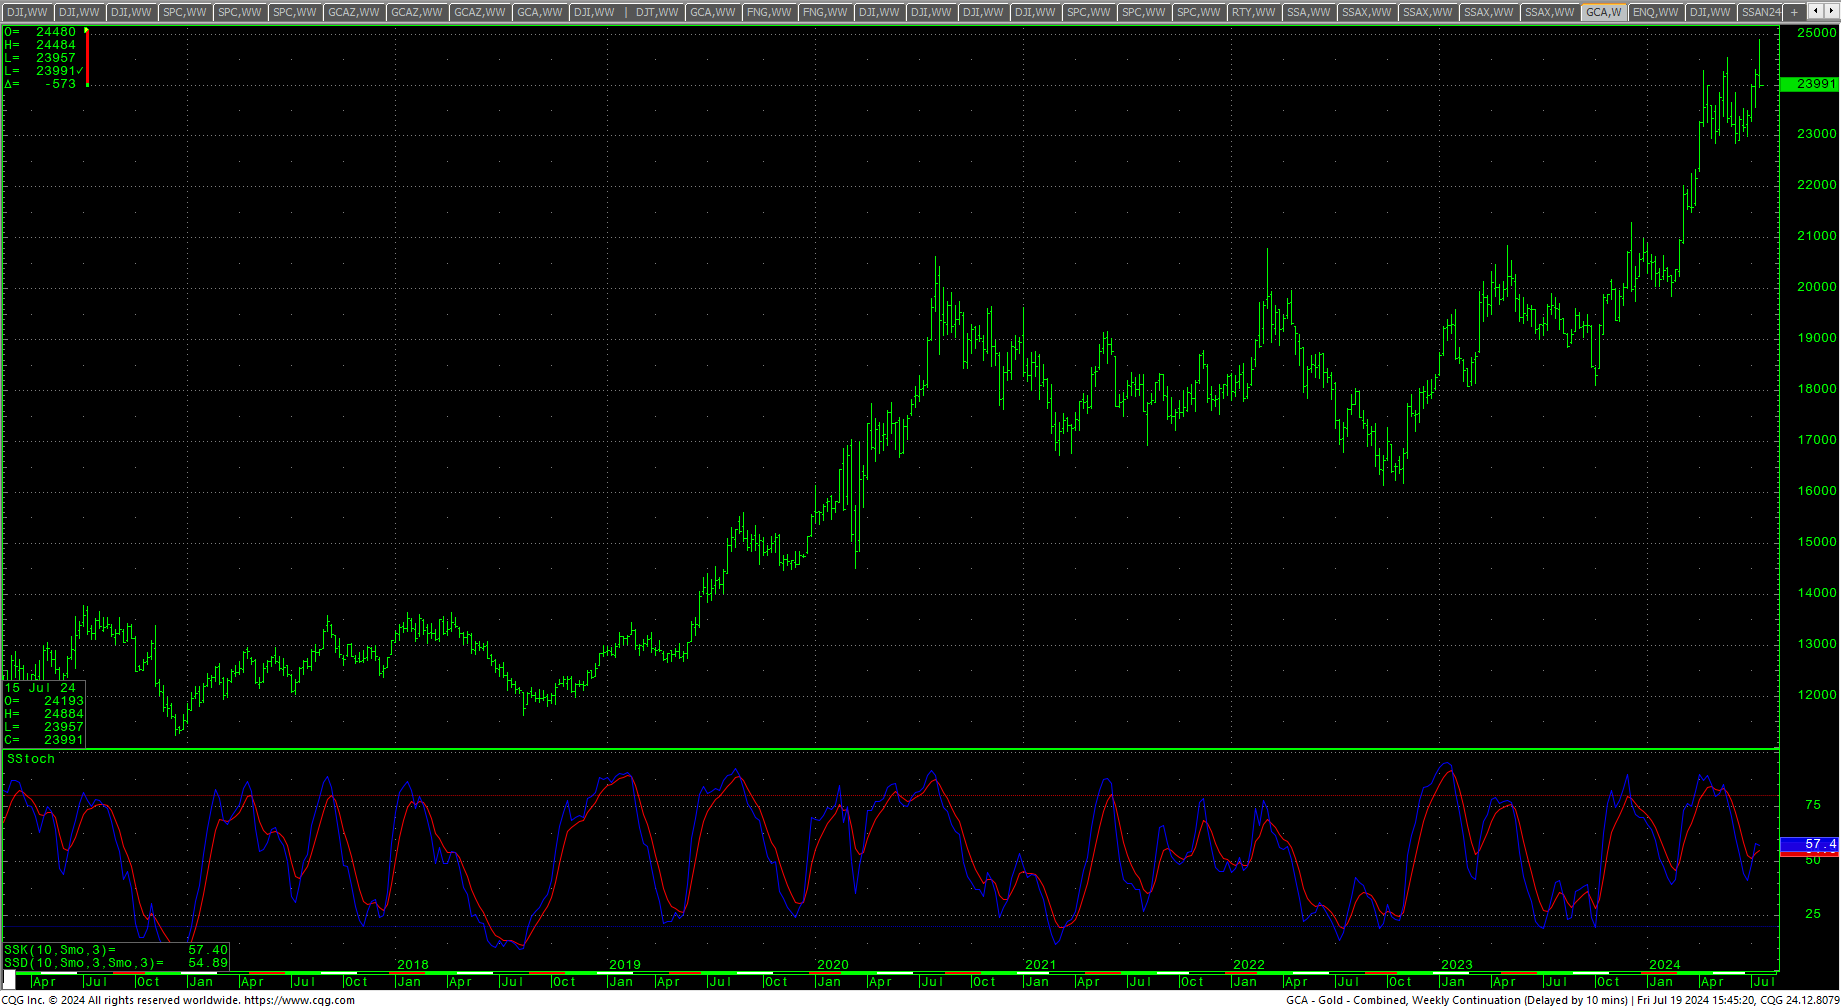
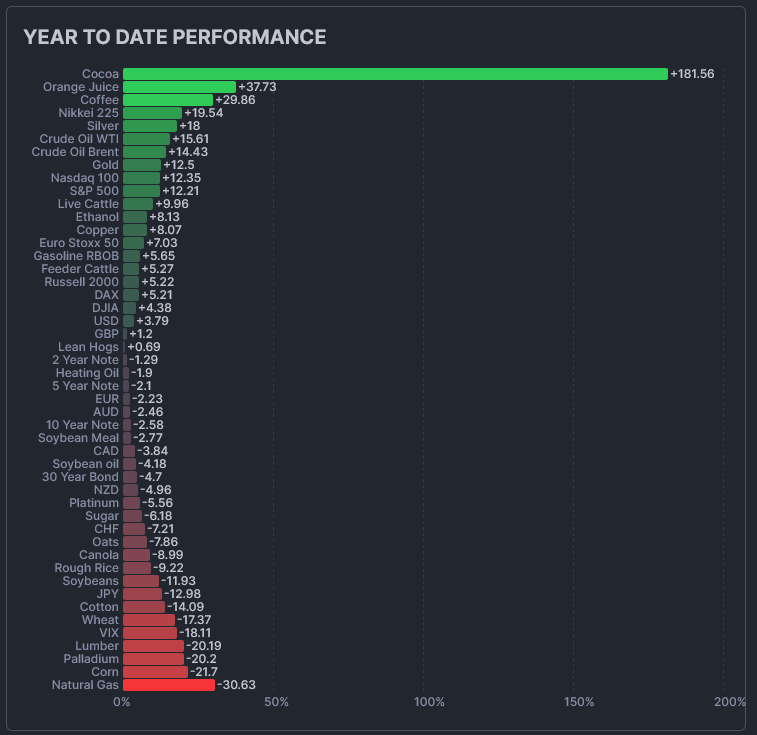 The CRB Index closed the week down -1.58%, as the grain and metals markets sold off. Crude oil closed lower, on the bottom of the week’s range as prices hold just above $80 per barrel. Gold traded a record high during the week but plunged on Friday to close lower, on the bottom of a large bearish reversal week down. The CoT for the S&P 500 shows virtually no change on the week. The CFTC S&P 500 Non-Commercial Net Positions has seen short-covering. The non-commercials position remains with a six-day window.
Timing Points
This Monday the 22nd and marks strong timing.
On Tuesday we get Existing Home Sales data, median forecast 3.95 million. New Home Sales are on Wednesday, median forecast 644K. On Thursday is Q2 GDP numbers, median forecast 1.9% versus 1.4% in Q1. Personal Income and PCE are released on Friday, estimates respectively 0.4% and 0.1% with YOY forecast of 2.5%.
- 07/22 ***
- 08/02 **
- 08/07 **
Dow Jones Industrial Average Hourly HLC
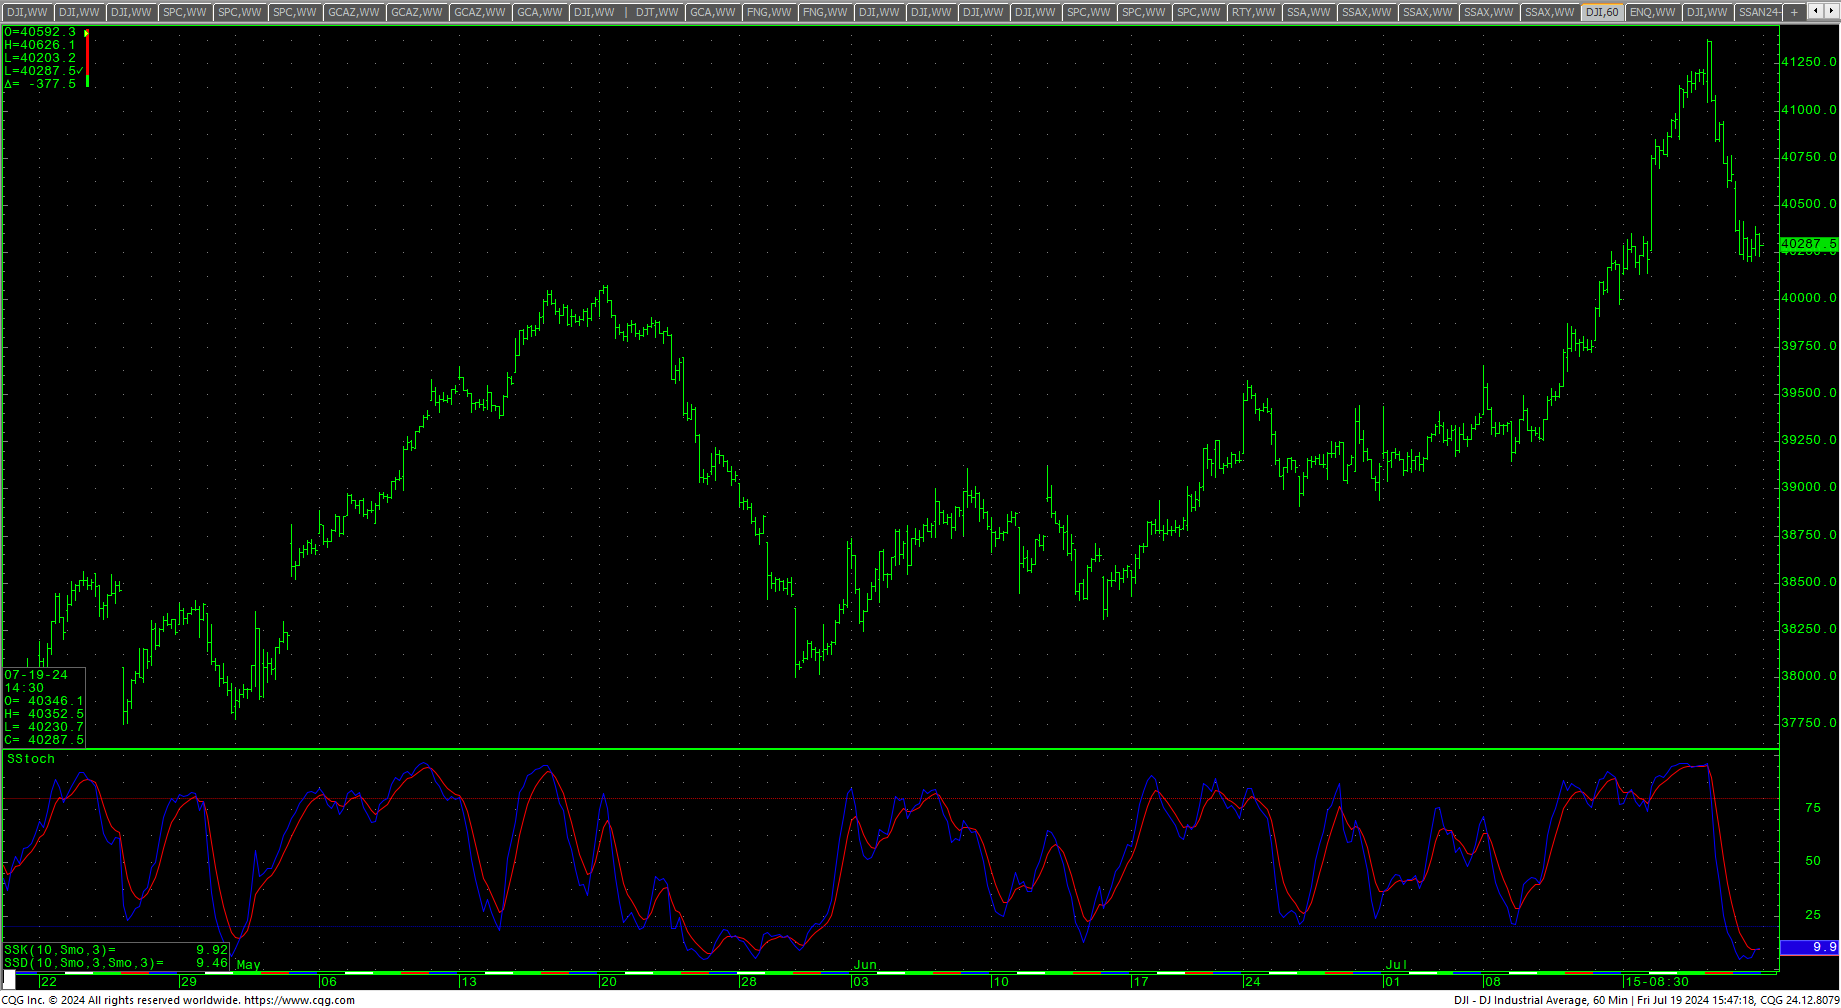 The Dow ended the week up +0.72% on the bottom of the week’s range after setting a record high. The daily is turning down from overbought conditions. The hourly is deeply oversold on Friday’s close. The 21-day MA remains above the 50-day MA. The 200-day MA starts the week at 37845.
Dow Jones Industrial Average Weekly H-L-C
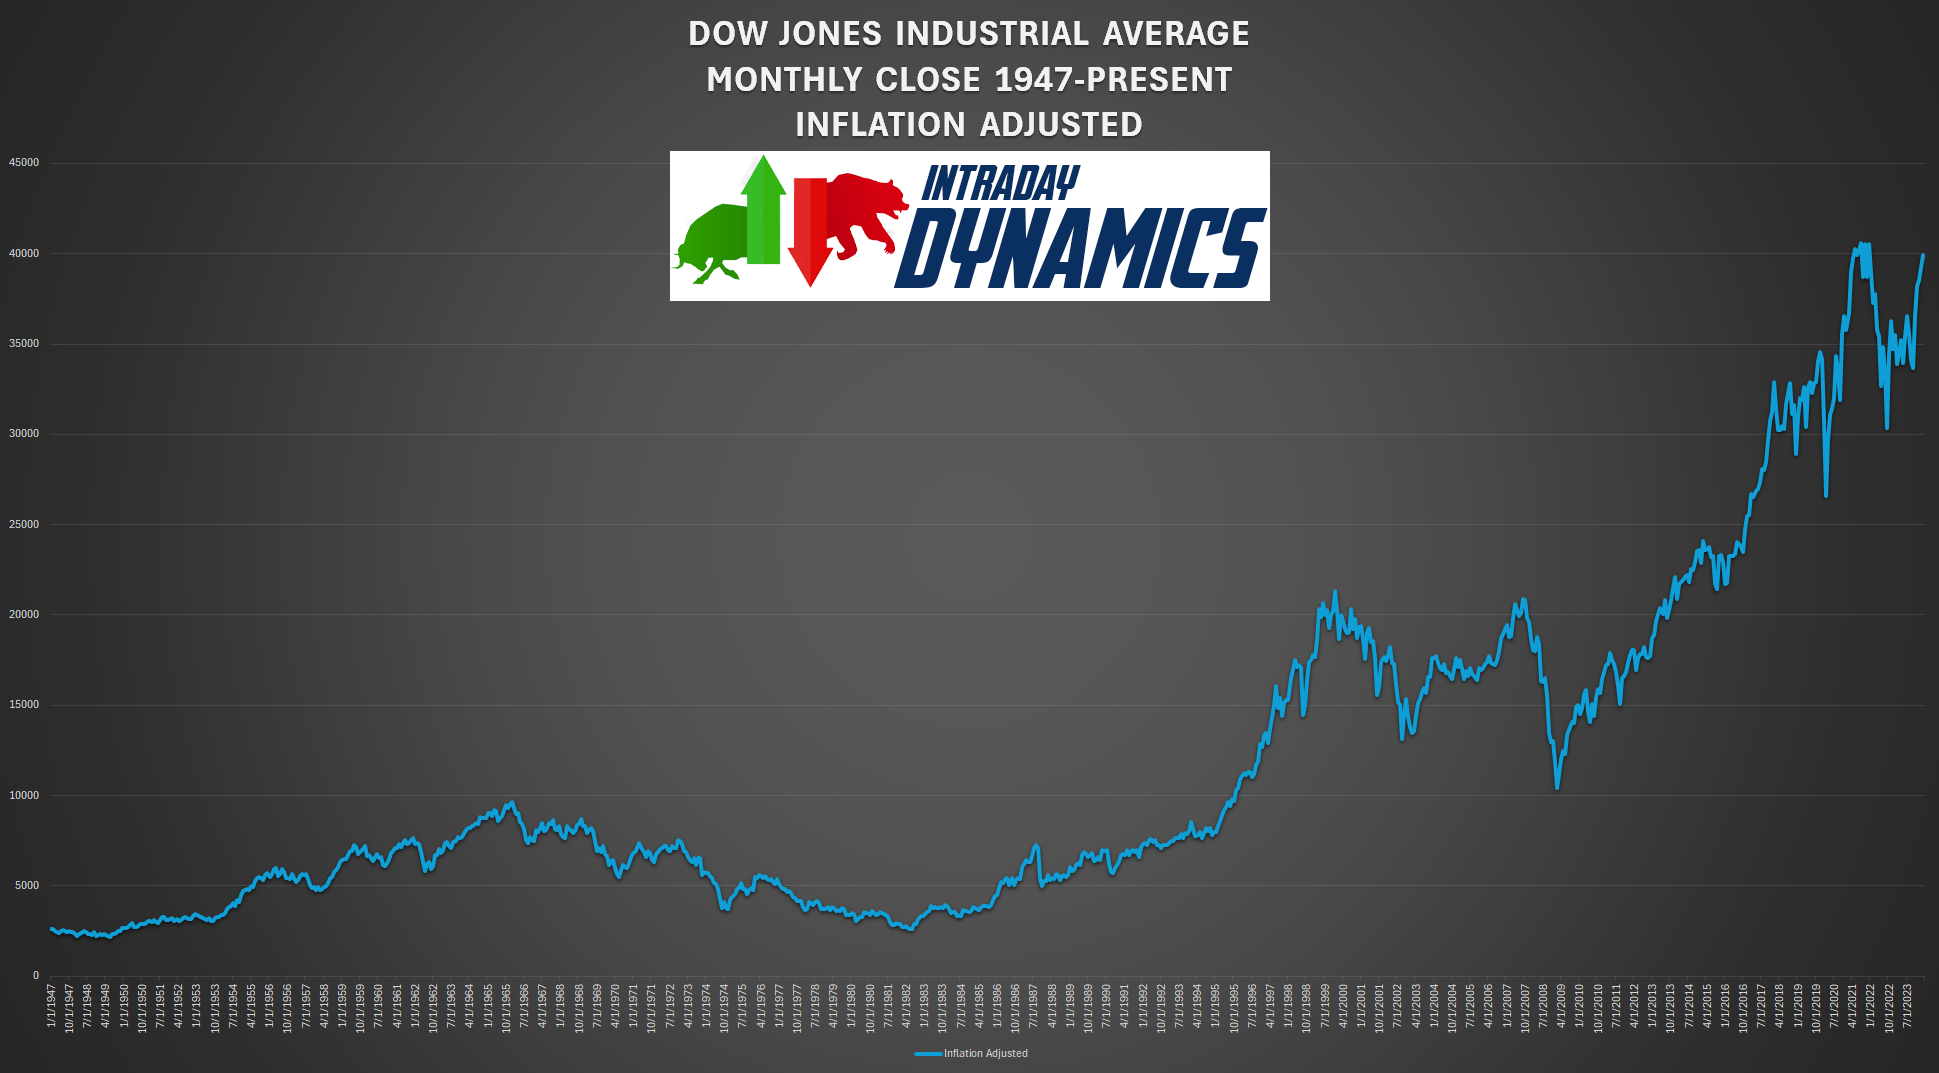
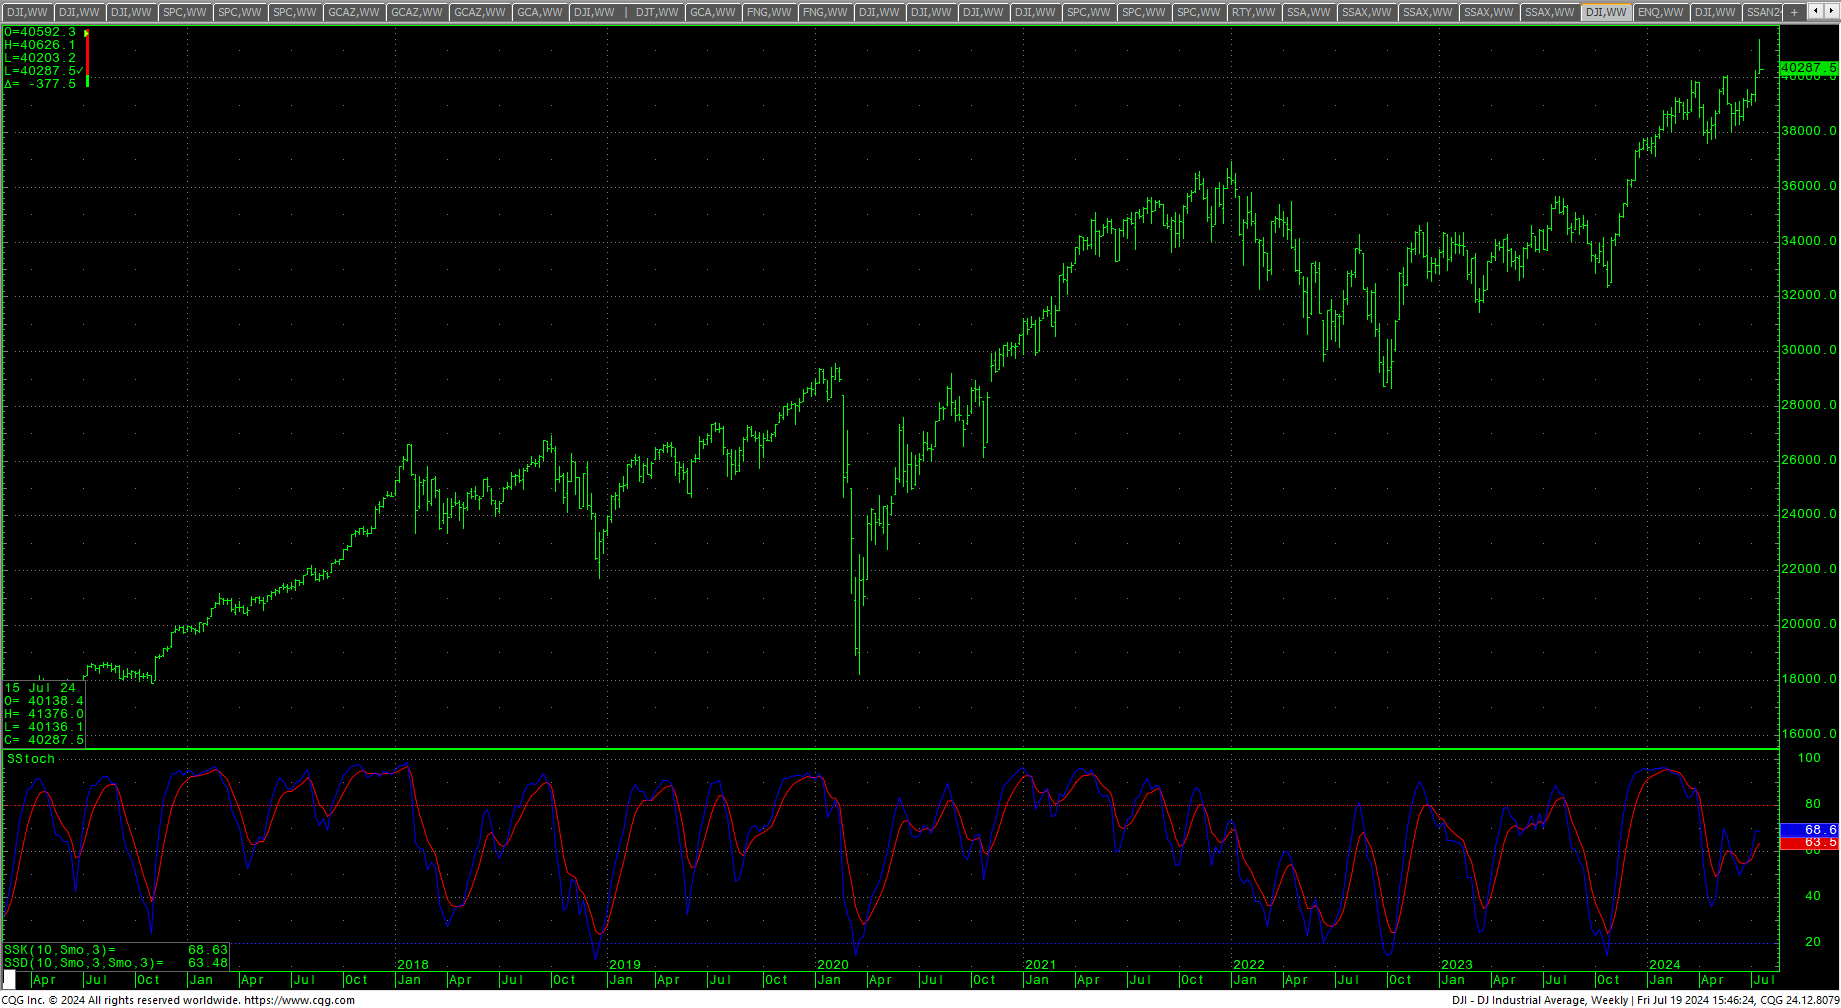 Resistance is 40480, 40652, 40790 and near-term pivotal at 40928/40932. A drive above 40932 should test 41083 with counts back toward the trading highs and key resistance of 41376/41379. The 2021 inflation-adjusted highs are 46568 and 46954. Closes in the Dow above 41376 open long-term counts to the 42147 area. A breakout over 42147 opens counts to longer-term potential to monthly targets in the 45244 area. Above 45244 gives monthly counts to 47400 with the IA highs at 46568 and 46954. Here is a list of all the current inflation-adjust tops on the Dow monthly chart 41020, 41100, 41300, 41330, 41410, 41810, 42630, 42670, 43170, 43470, 43630, 43690, 44210, 45160, 45930, 46050, 46150, 46270, 46560/46568, 46954, 46650, 46950.
Dow Industrials Monthly Close Inflation Adjusted
 Support is 40086, 39688, and short-term pivotal at 39290/39285. A drop under 39285 can test 38844 with full potential toward 38305 through 38000. Closes under 38000 open full potential back to critical support of 37611. A breakdown with closes under 37611 will open counts to critical support of 37122. Closes under 37122 give long-term counts toward 36518.
| Resistance | Support |
|
|
S&P 500 Cash Index
S&P 500 Index Hourly HLC
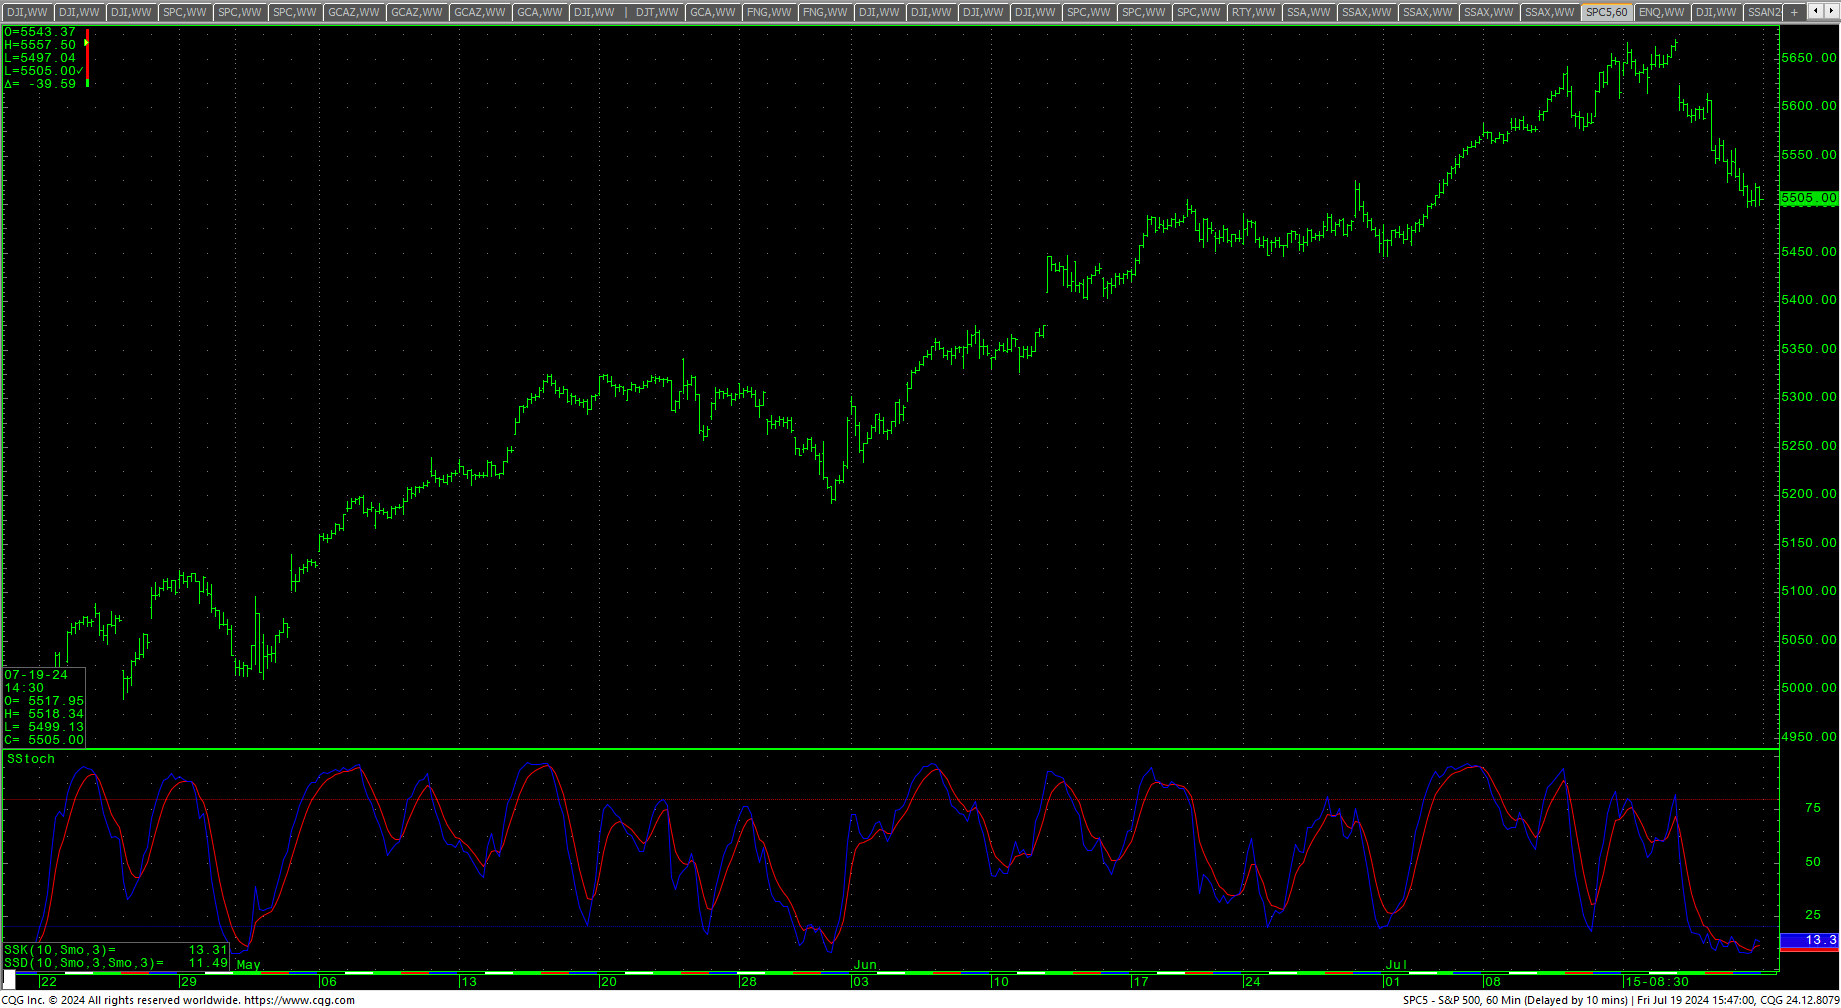 The S&P traded a wide outside week down (bearish engulfing pattern on the candles) after trading a record intraday high of 5669.67. The market ended the week deeply oversold on the hourly chart, with the daily rolling over from overbought conditions and the weekly hooking lower from overbought conditions and a bearish candle. This was the worst week for the S&P since April of this year. Resistance for the cash S&P is 5538, 5563, 5583 and near-term pivotal at 5603/5606. Closes over 5606 should retest 5626/5628 with potential back to the trading high at 5669/5670. Closes over 5670 reopen counts to the upper objective at 5720. Closes over 5720 offer counts to 5864 with long-term upside targets at 6000/6008. Above 6008 counts to 6080 with potential to targets of 6115 and ultimately 6152.
S&P 500 Index Weekly HLC
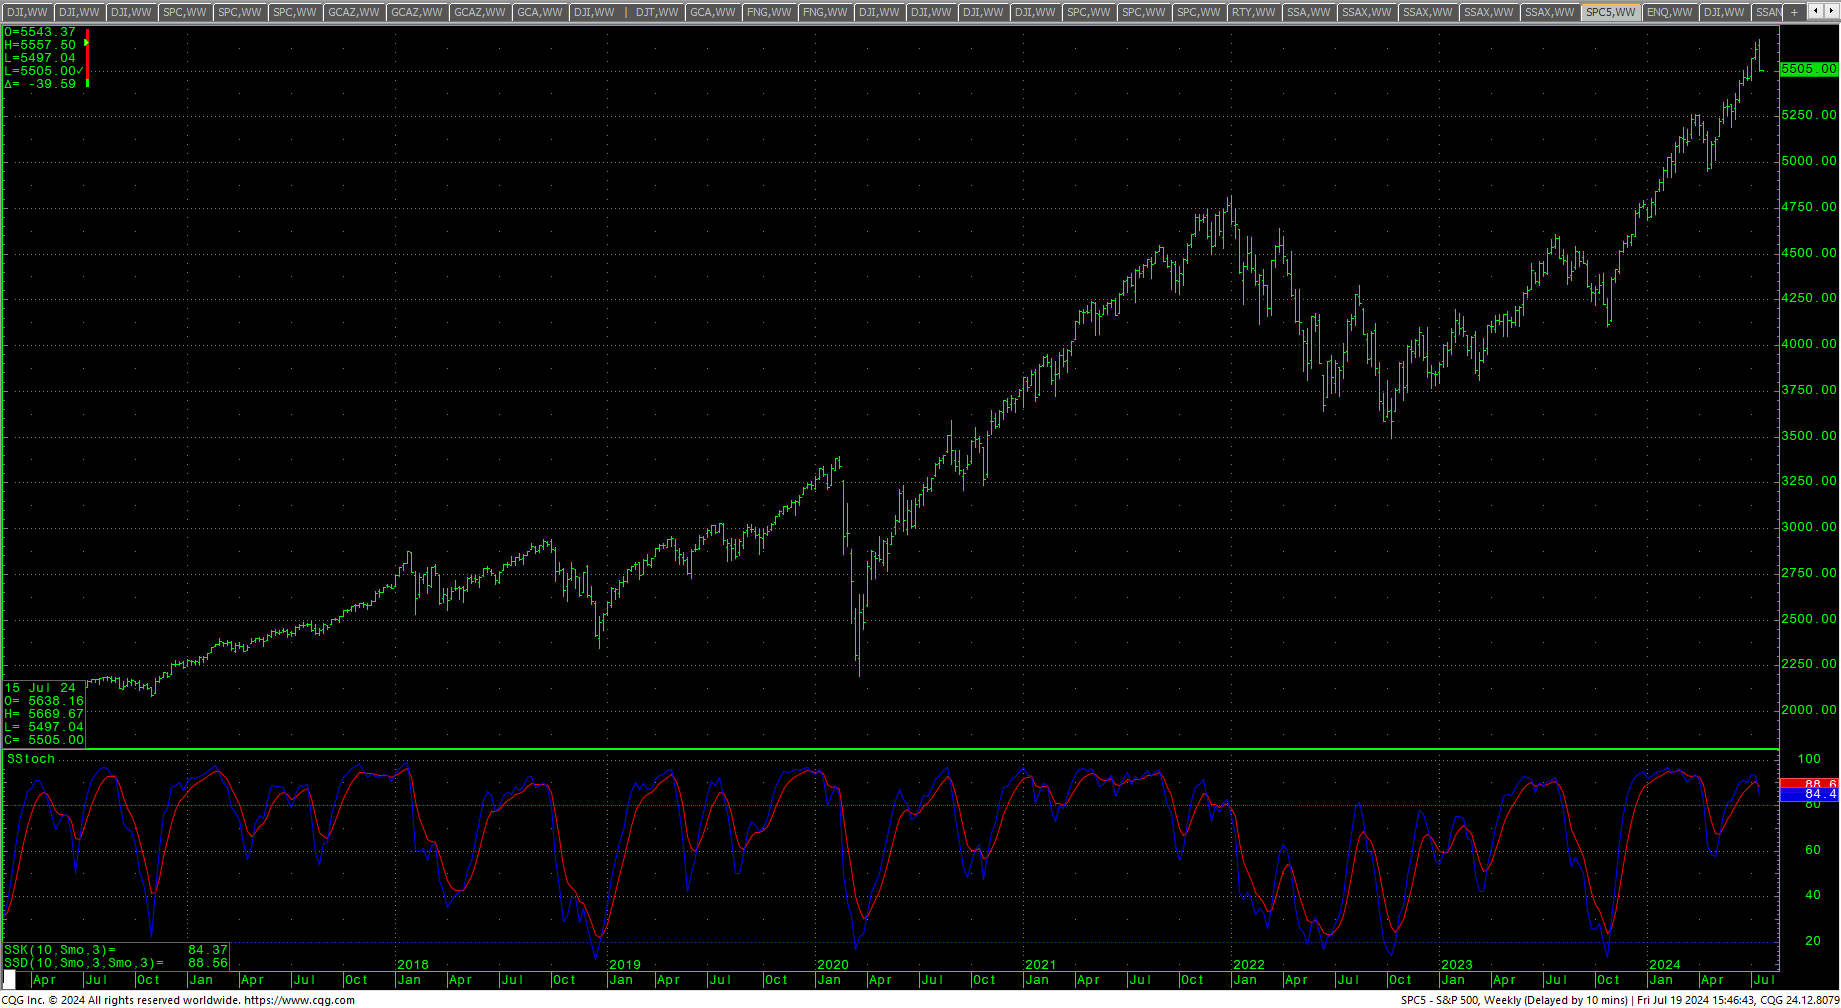 Prices ended right at a pivotal near-term support level of 5500/5497. A continued breakdown under this support should carry to 5460 with full potential toward the 5396 level. Daily closes under 5396 will open counts to 5311 with full potential to critical near-term support of 5227/5223. Daily closes under 5223 can test 5155 with counts to 5132/5122. Closes under 5122 open full counts back towards the 4955/4953 area. Closes under 4953 open counts to 4836 and possibly key support at 4714/4700. Under 4700 should test 4579. Closes under 4579 give counts to 4322/4315.
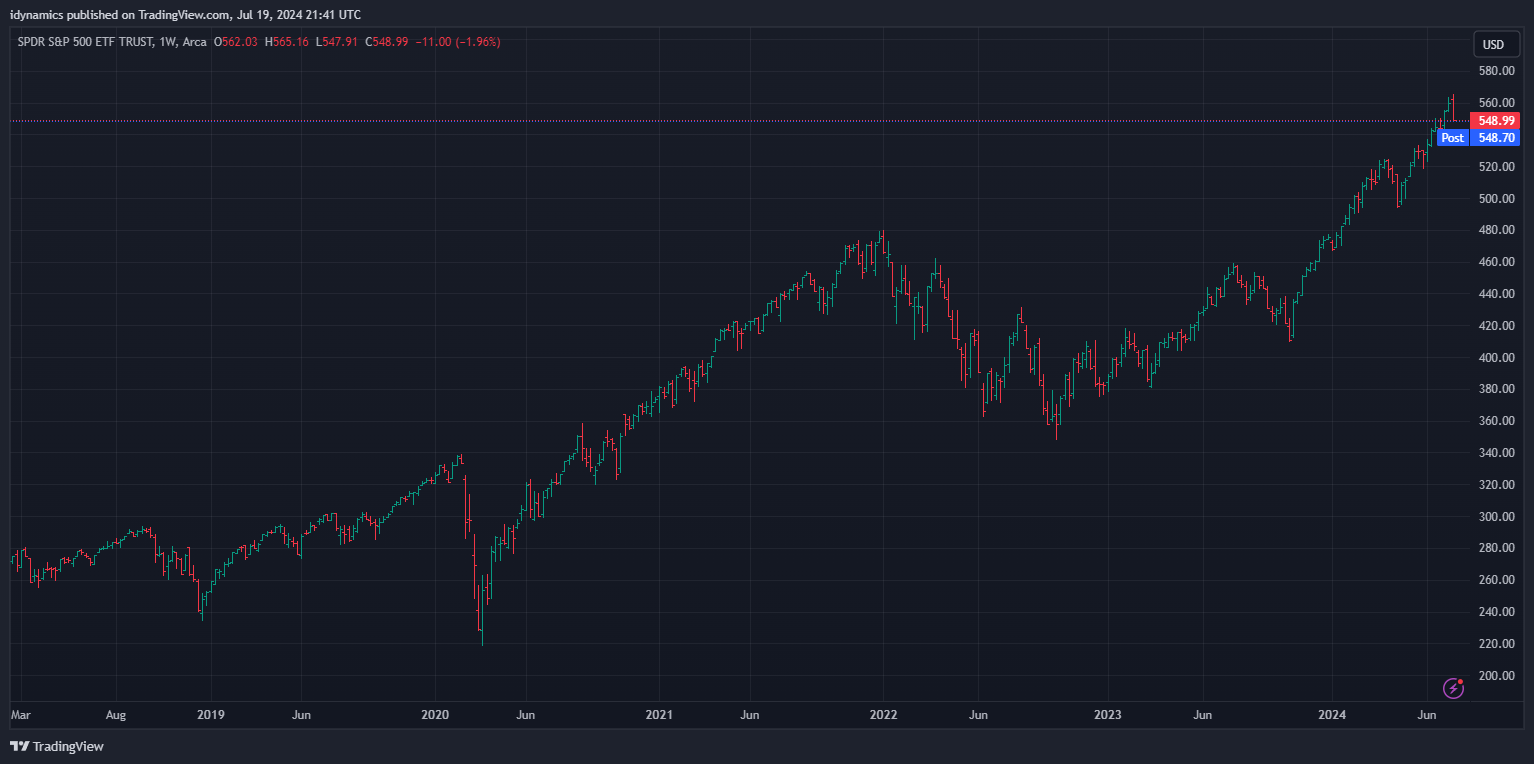
SPY Weekly
| Resistance | Support |
|
|
Charts courtesy of CQG, Inc., CNN, Koyfin, Trading View and AAII