TECHNICAL ANALYSIS (by Intraday Dynamics)
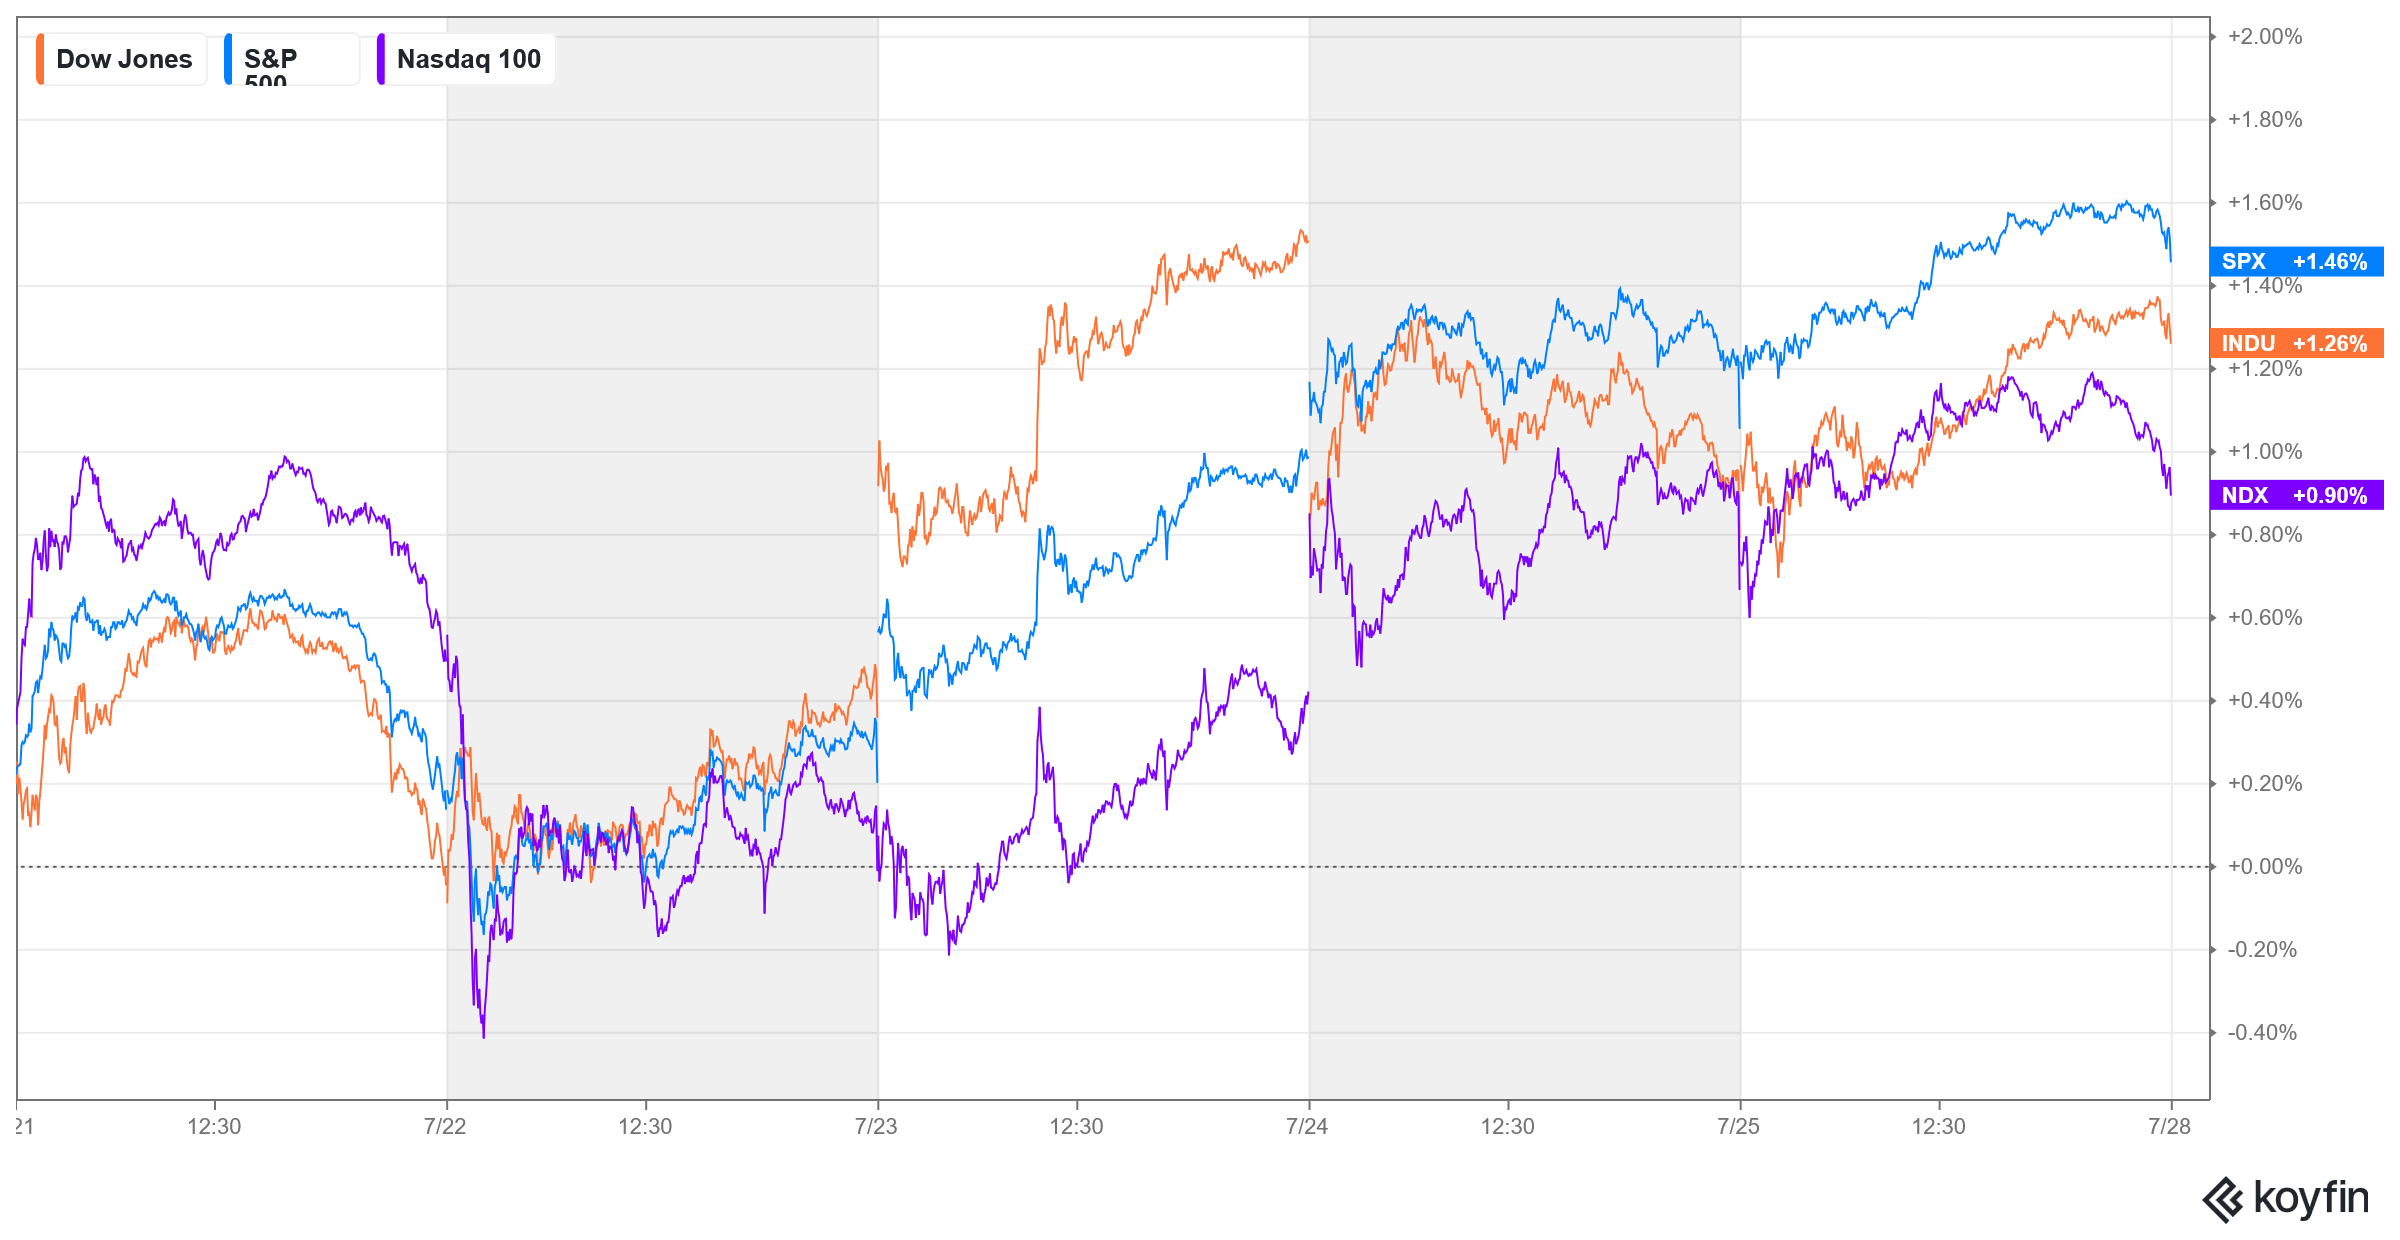
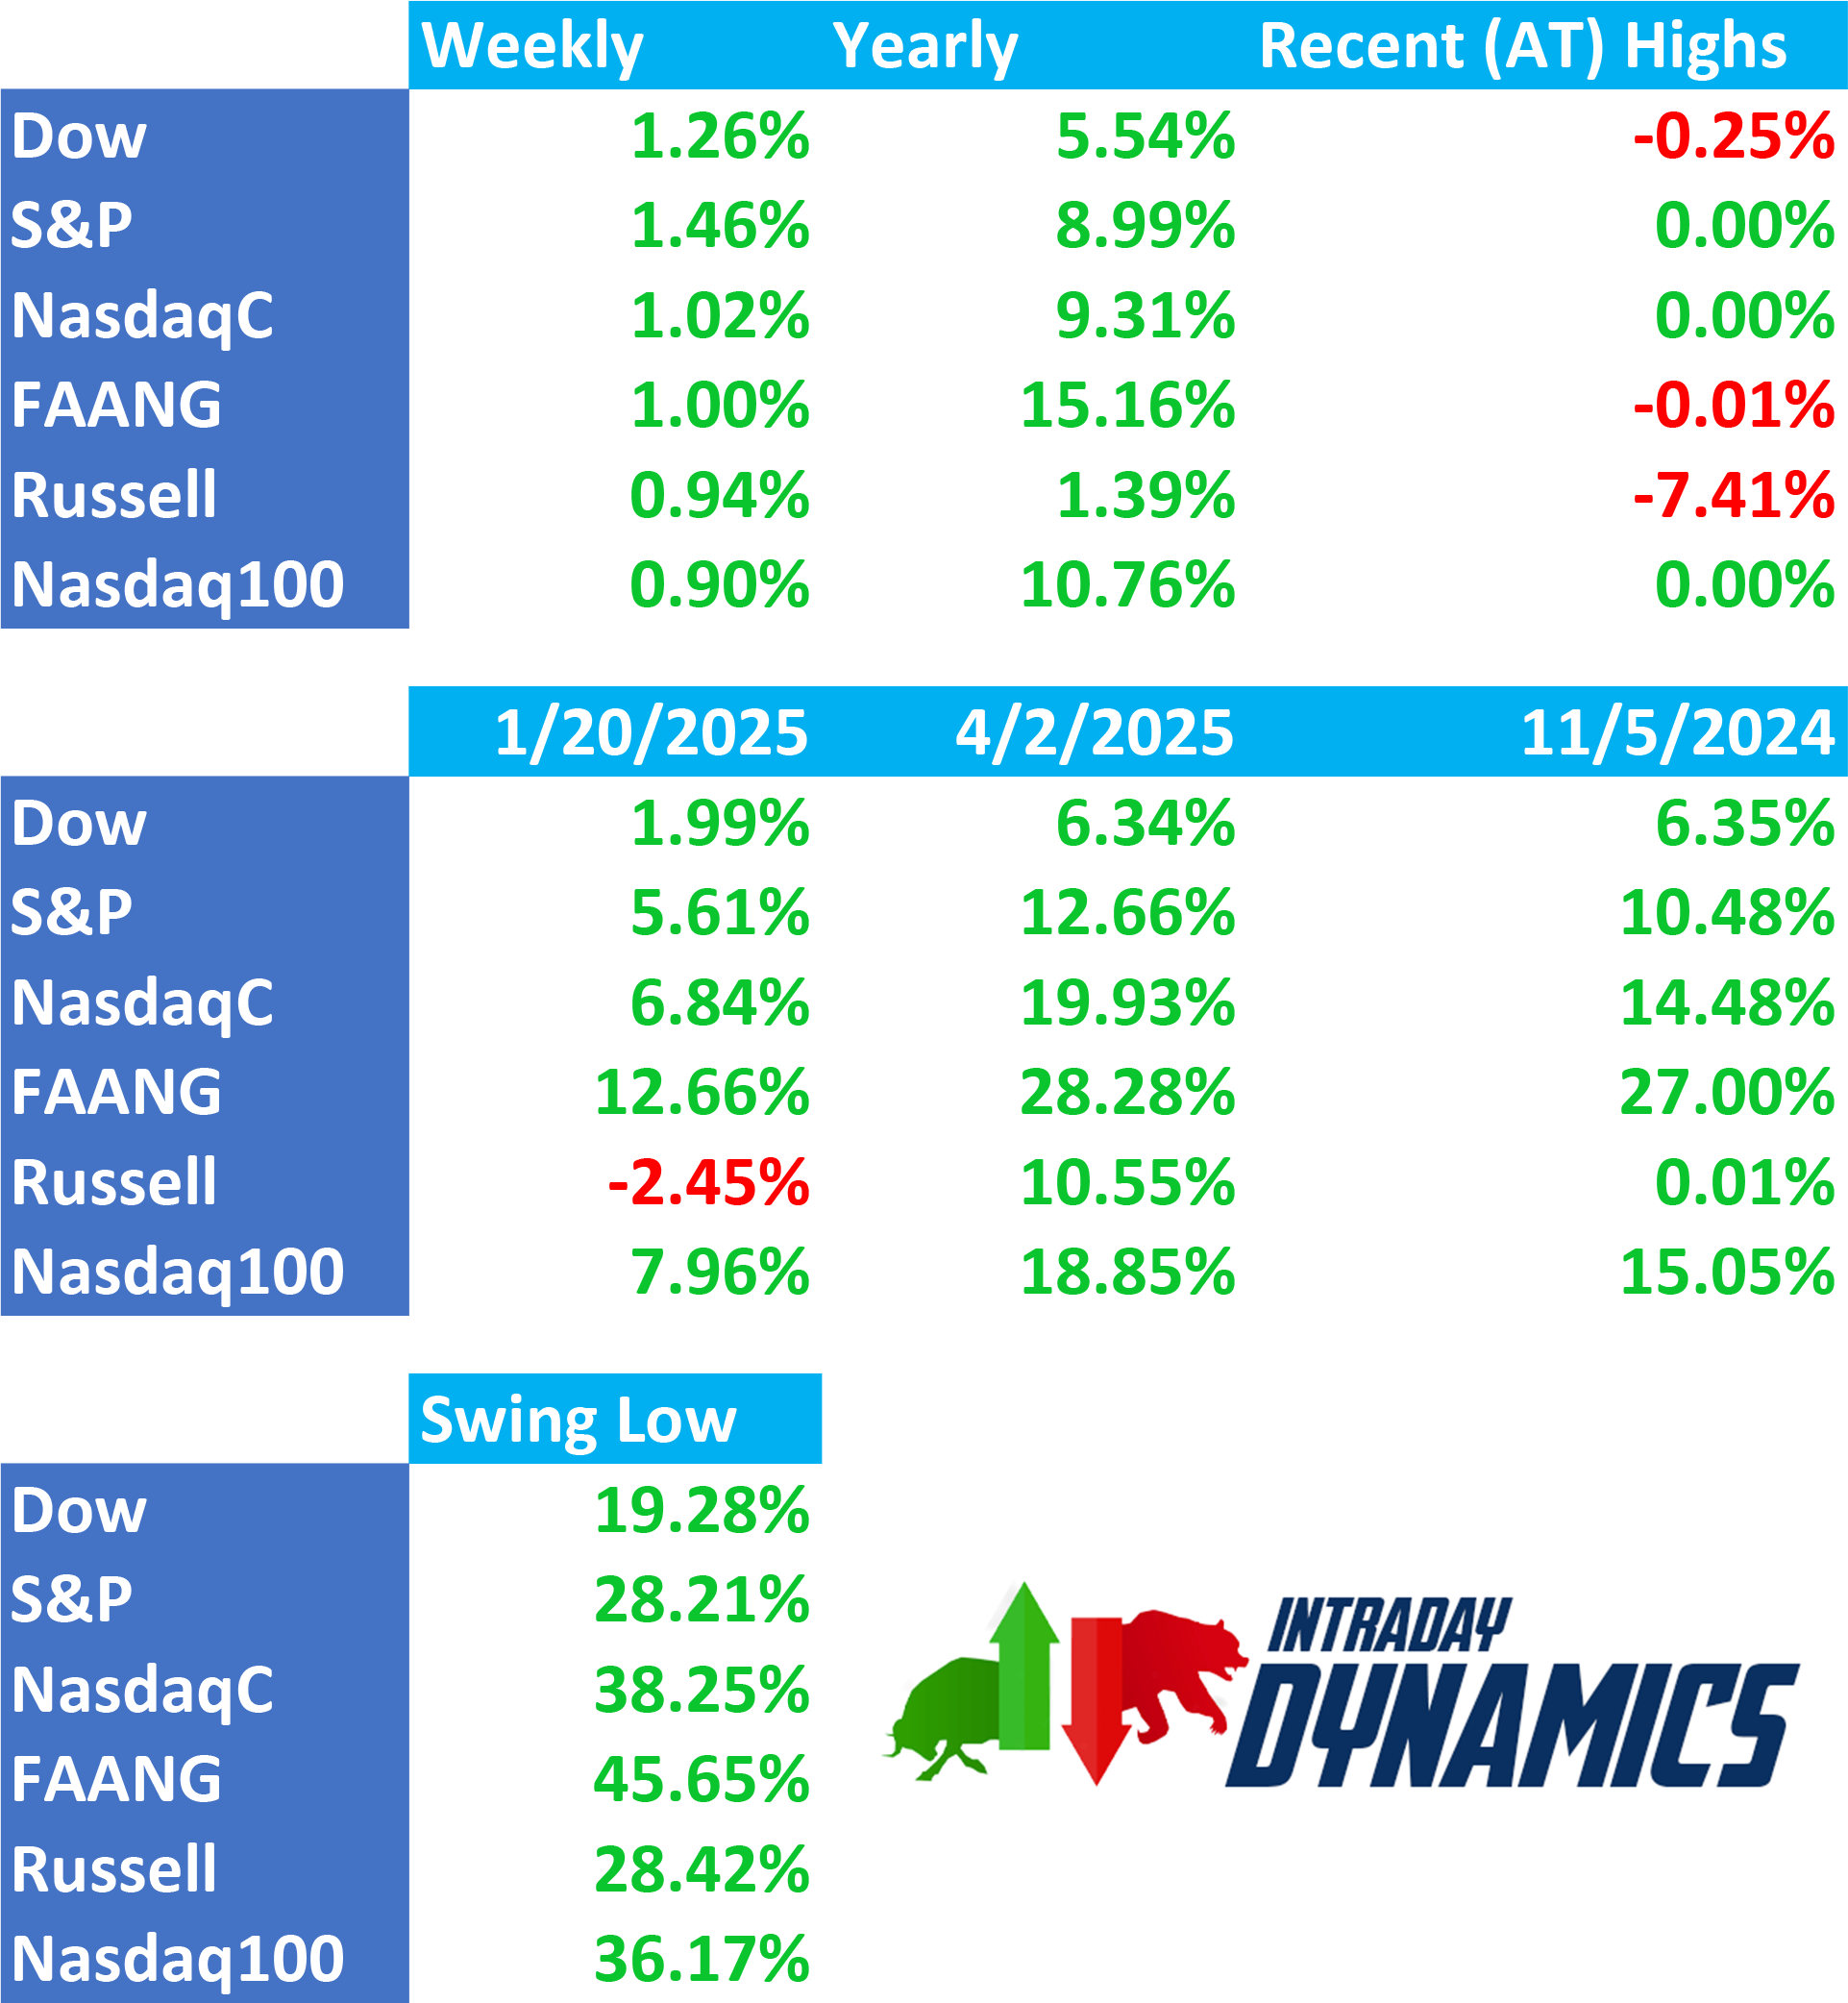
Major Indices Week of July 25, 2025
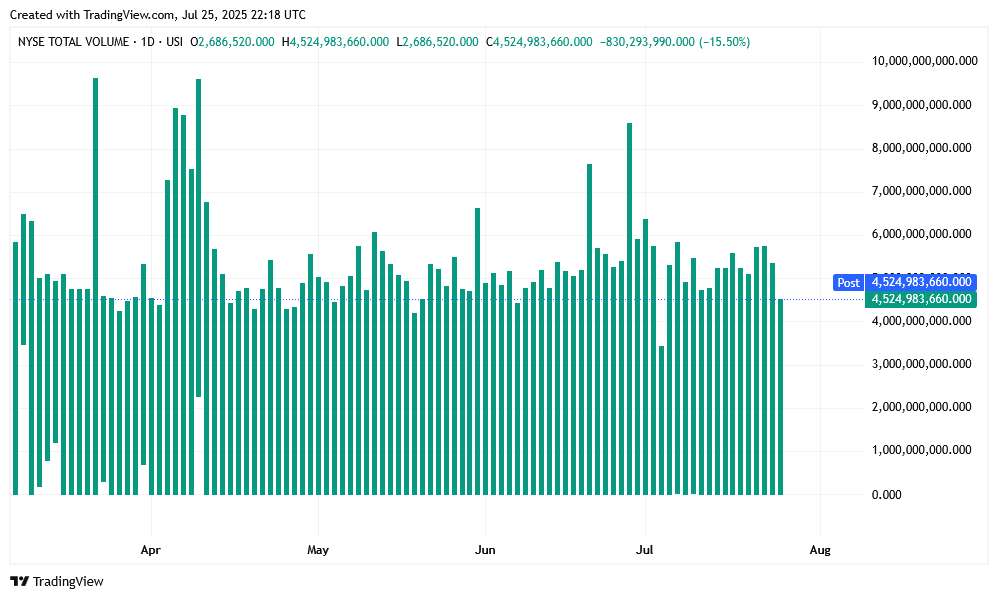
 NYSE Volume

 VIX Weekly Close
As goes tech, so goes the market. Stocks moved into record highs for most of the major indices (including Equal Weight) as the bull run continues just ahead of extremely critical cycle timing about to hit in August. I will issue a special Timing Update this weekend.
From the recent posts:
The reality is that we are now entering a 6-9 month window of extremely volatile longer-term cycles. August is when things really heat up with the cycles. The Dog Days of summer are directly ahead. Strap in, stuff is about to get weird.
SPX Weekly Candles
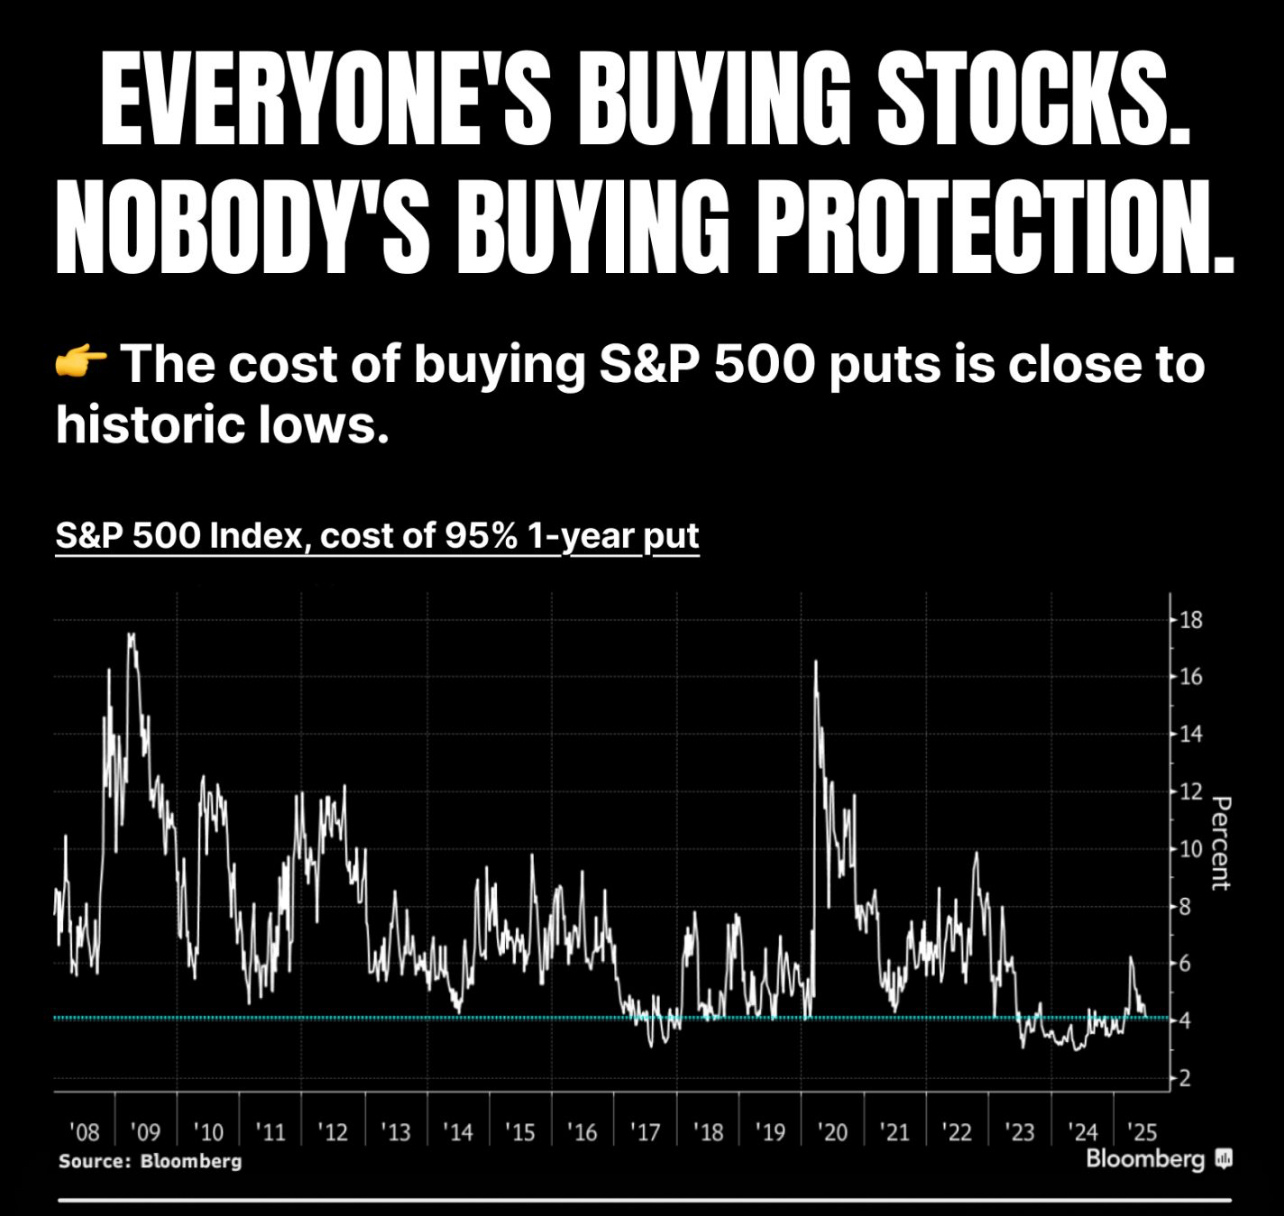
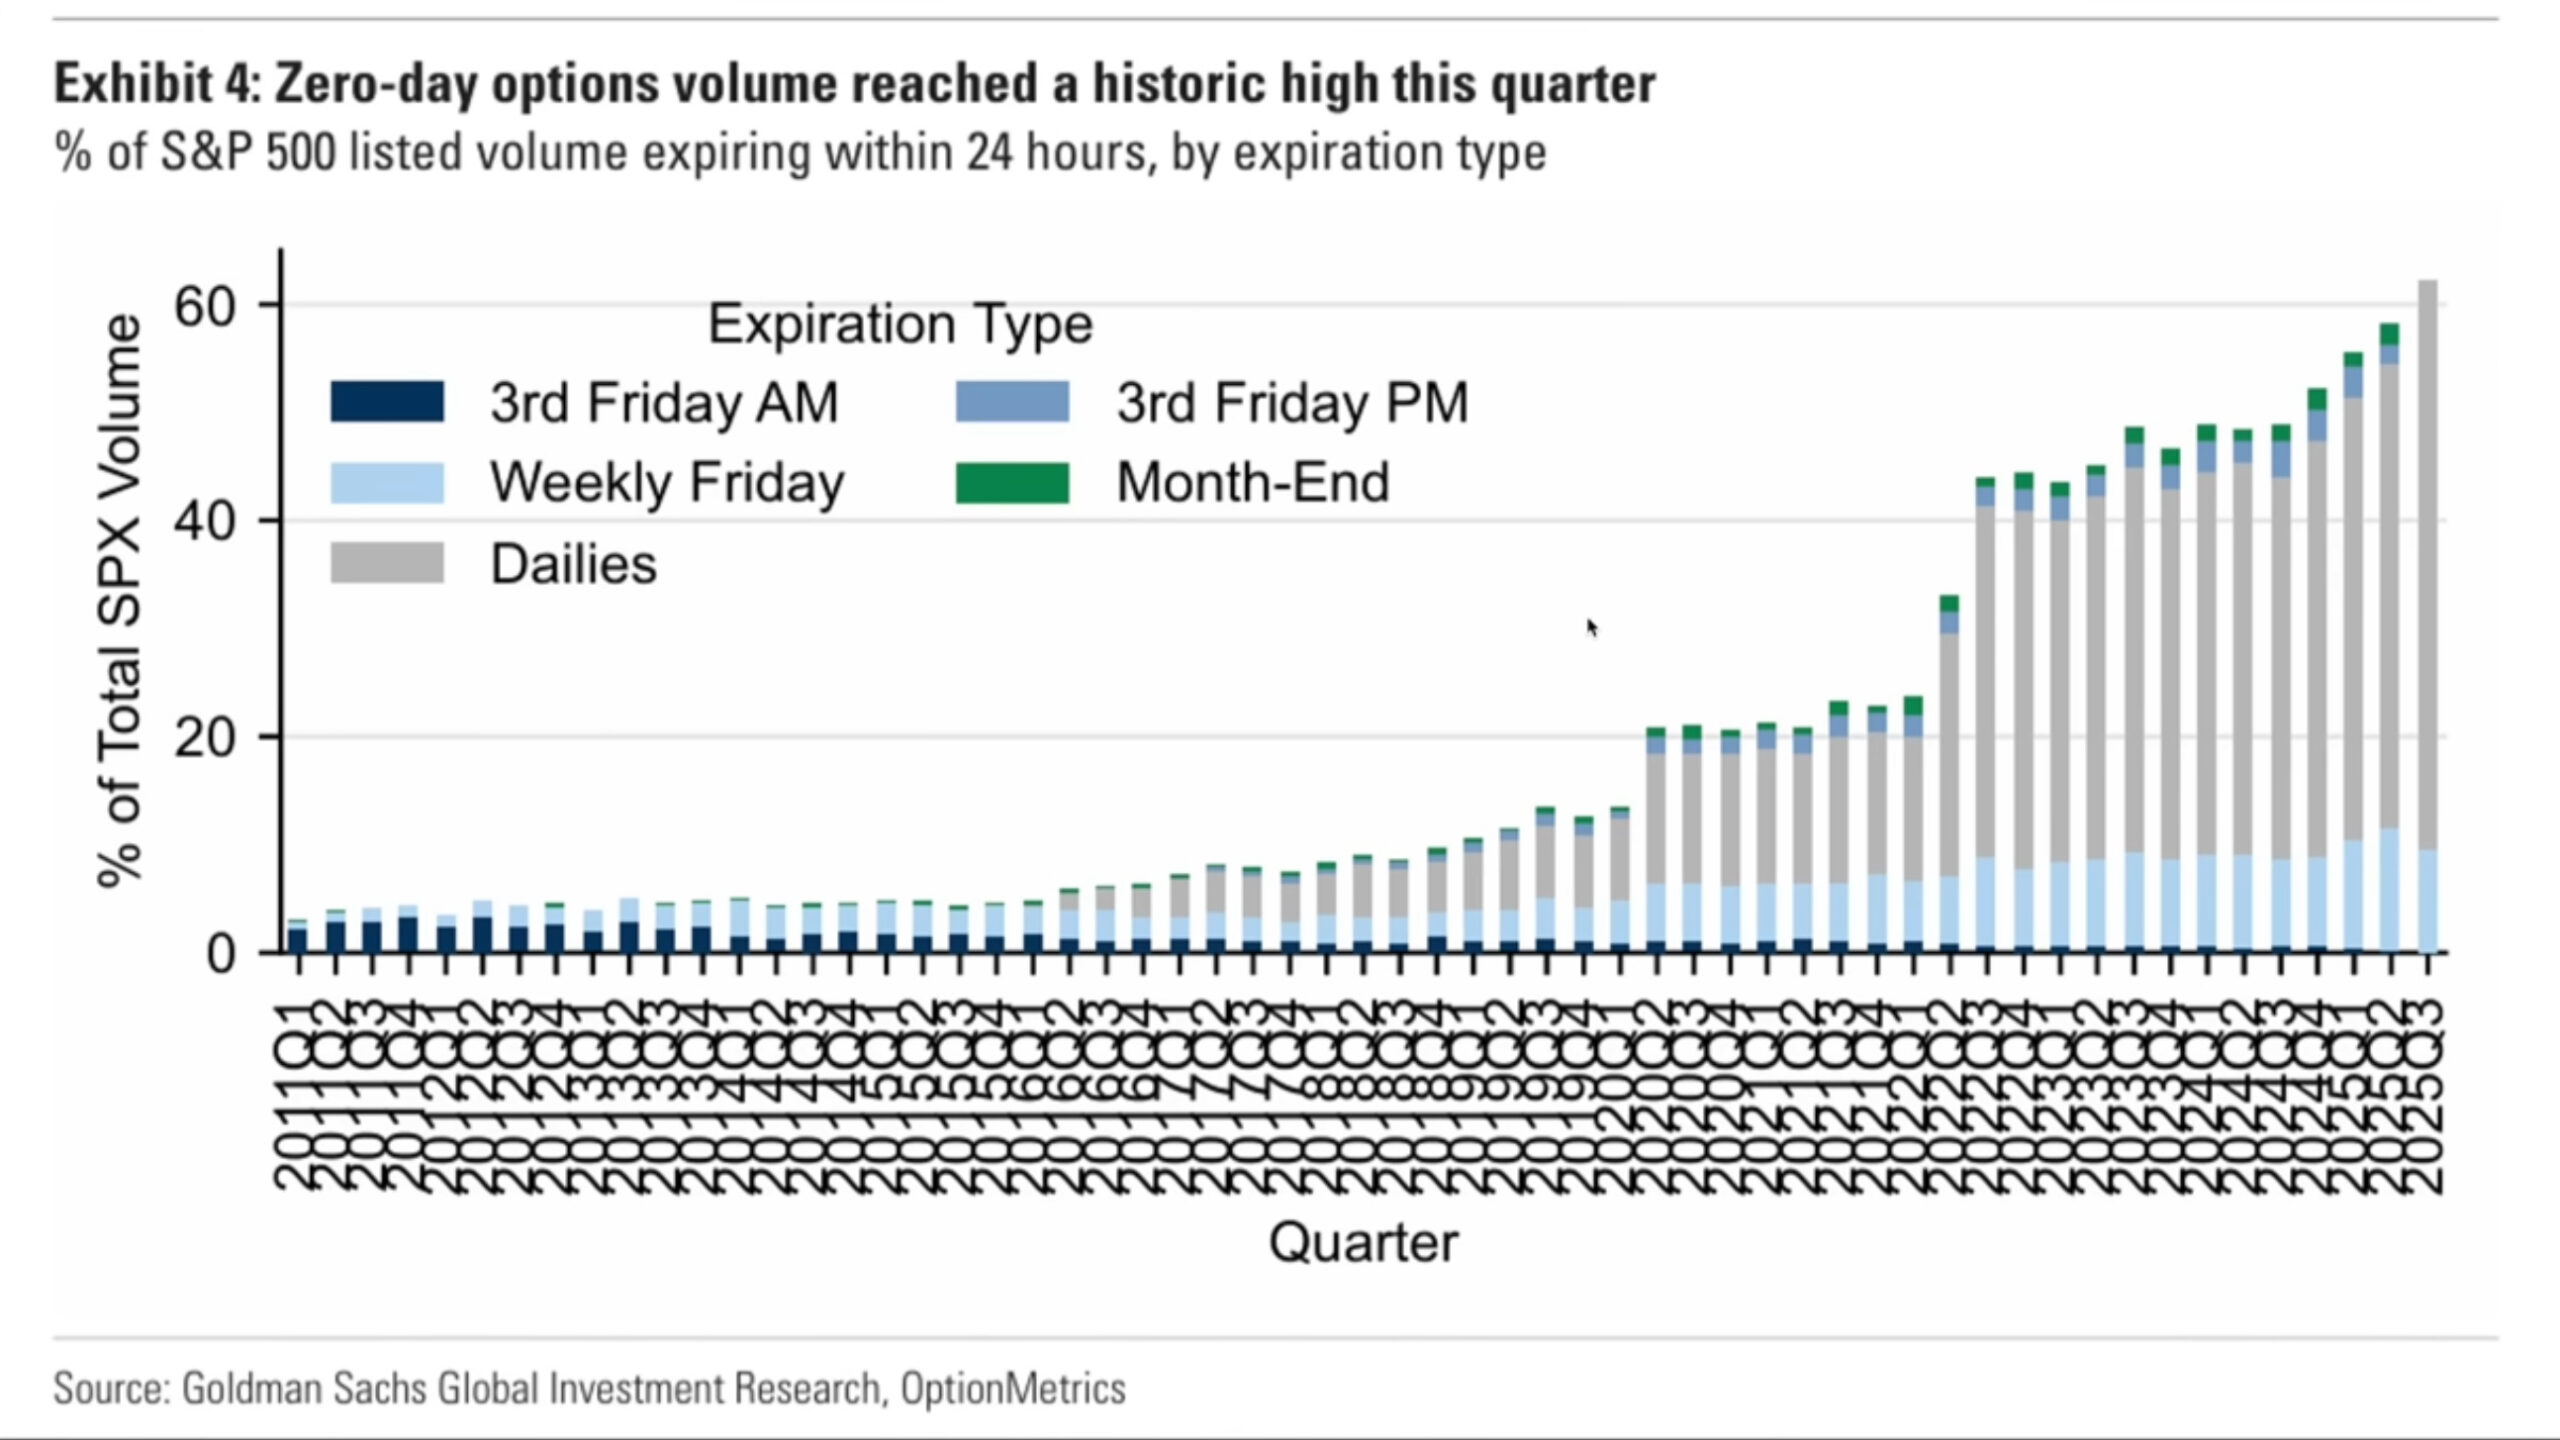
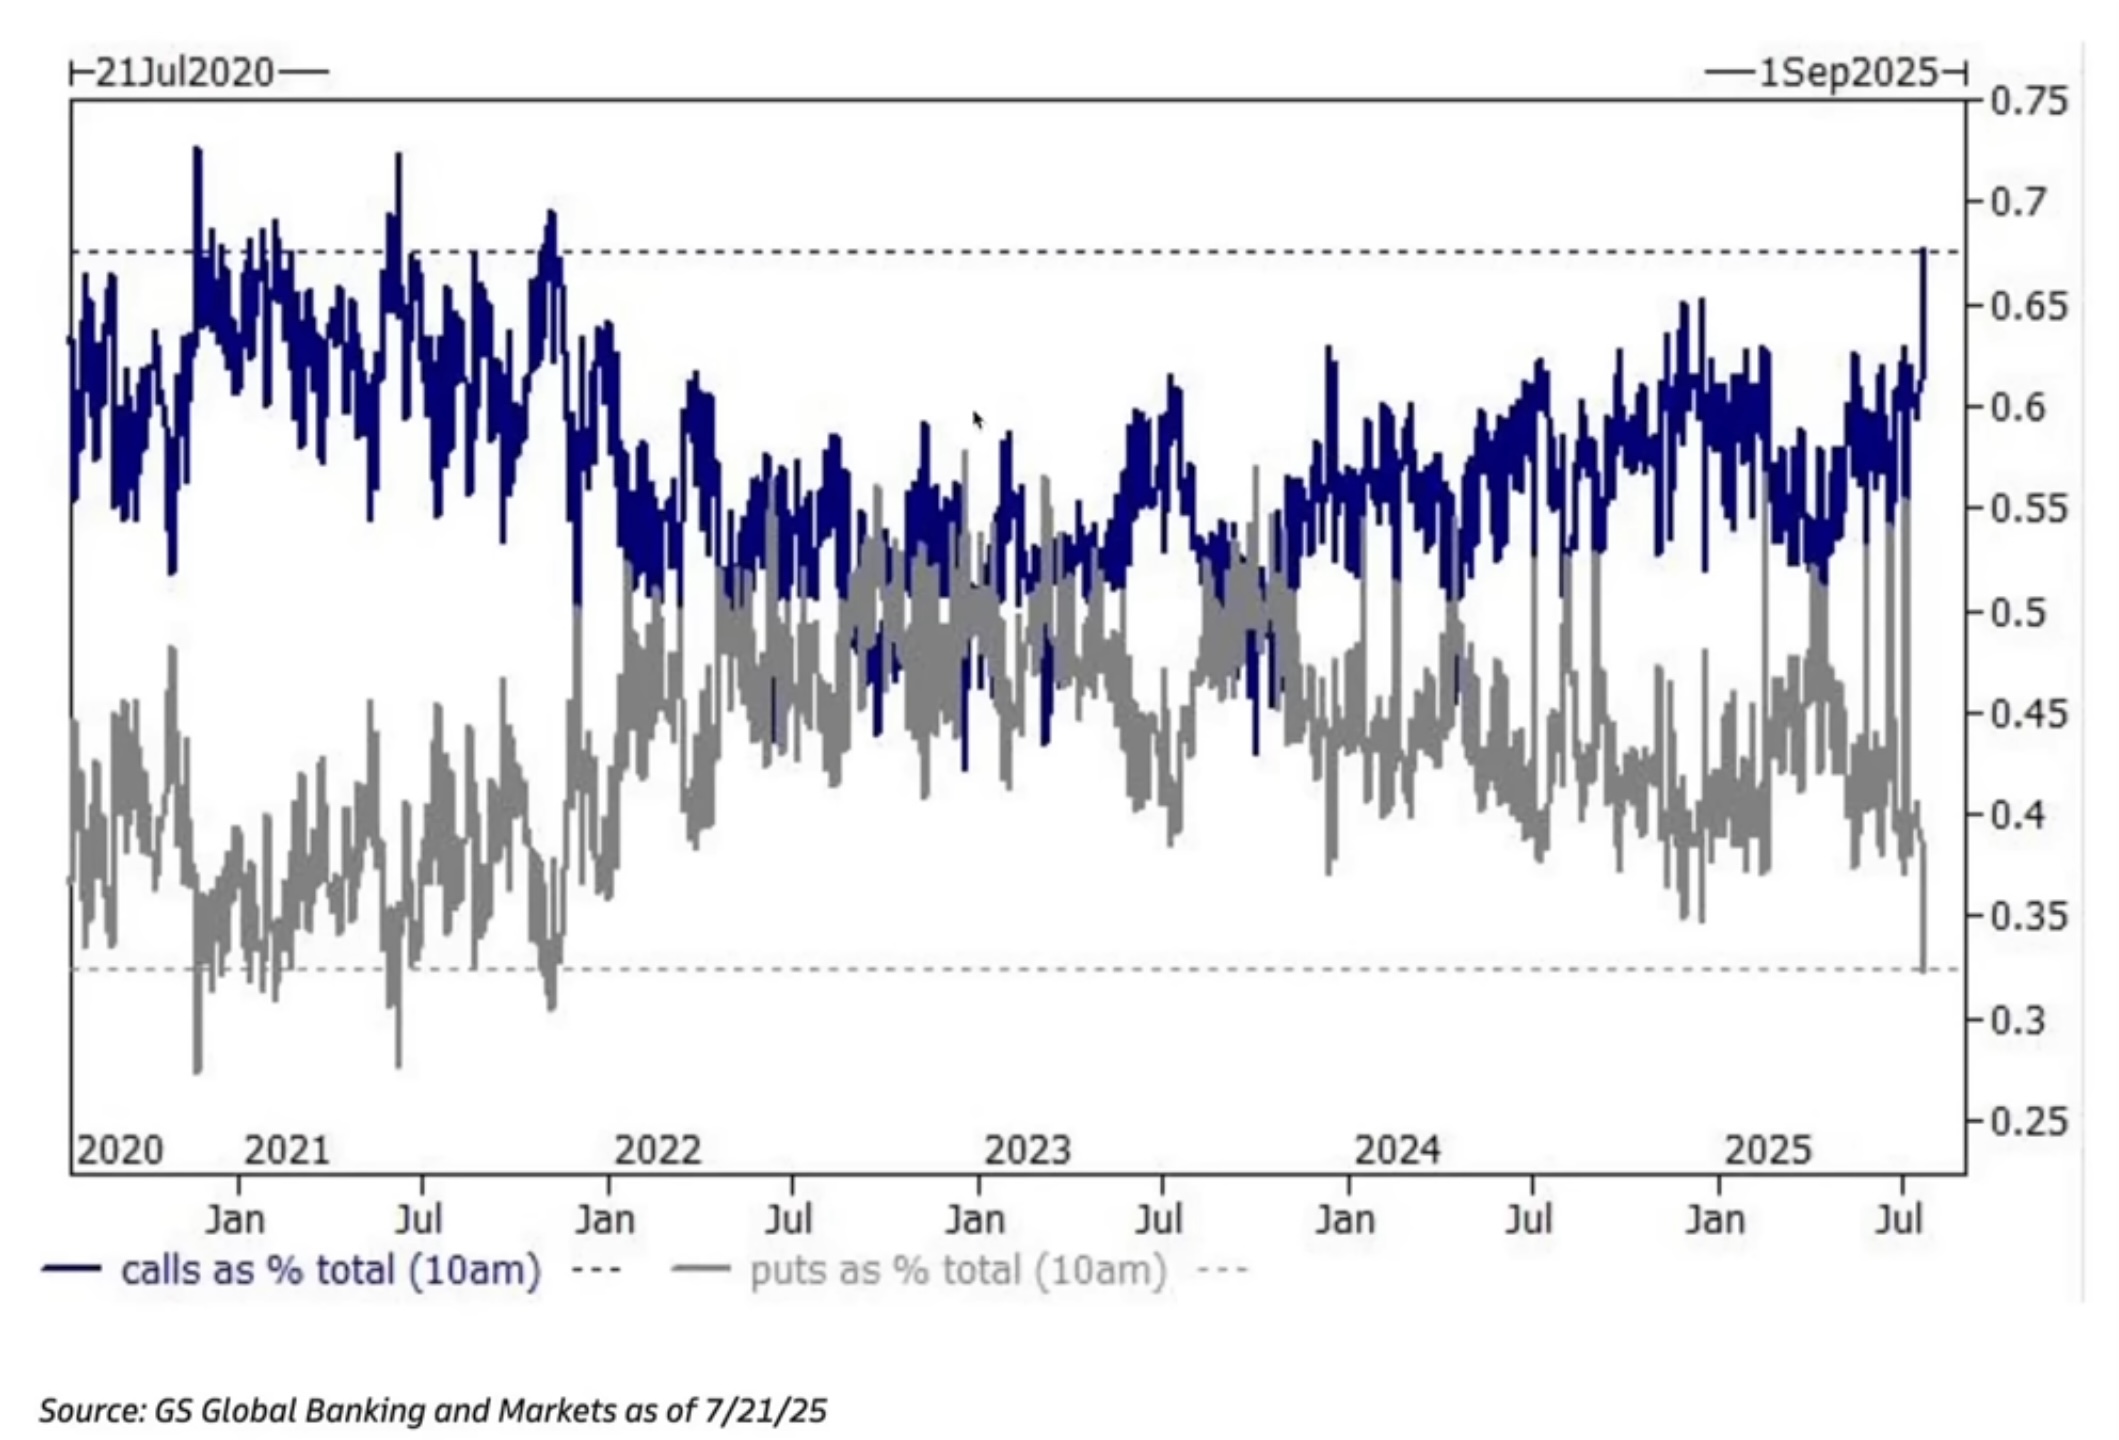
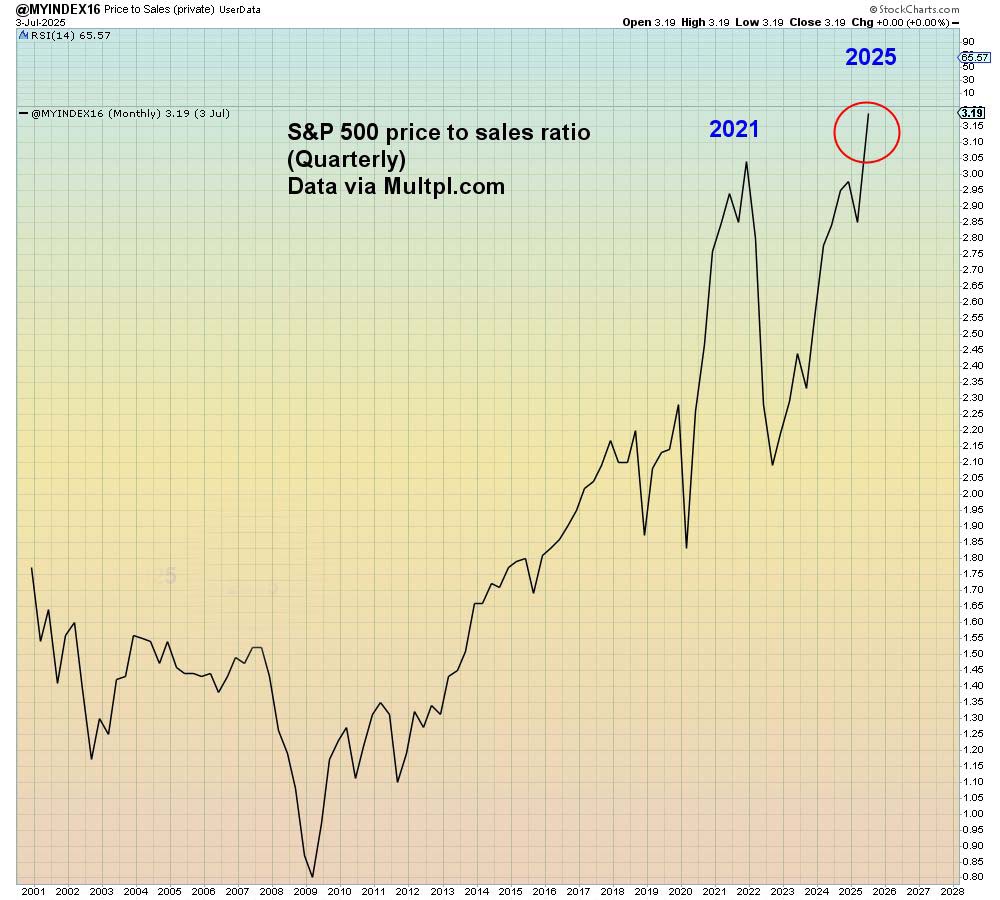
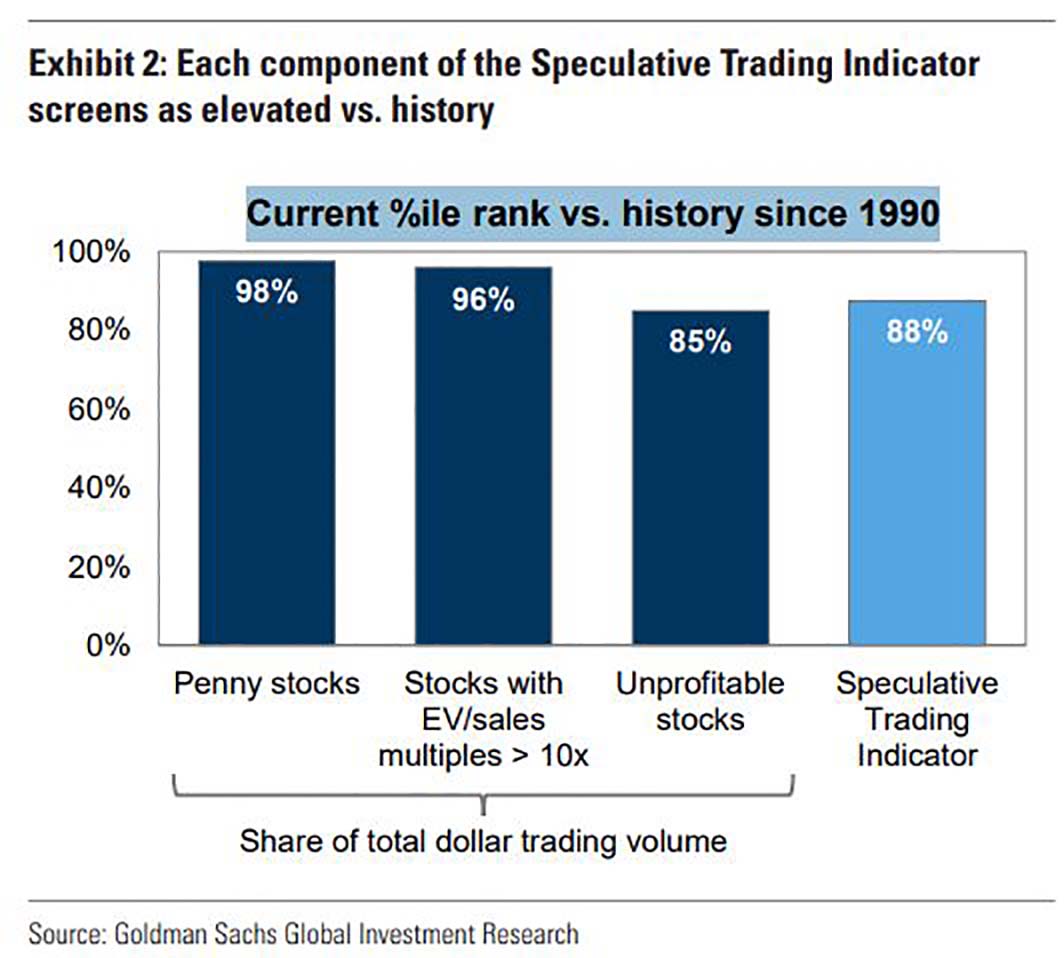
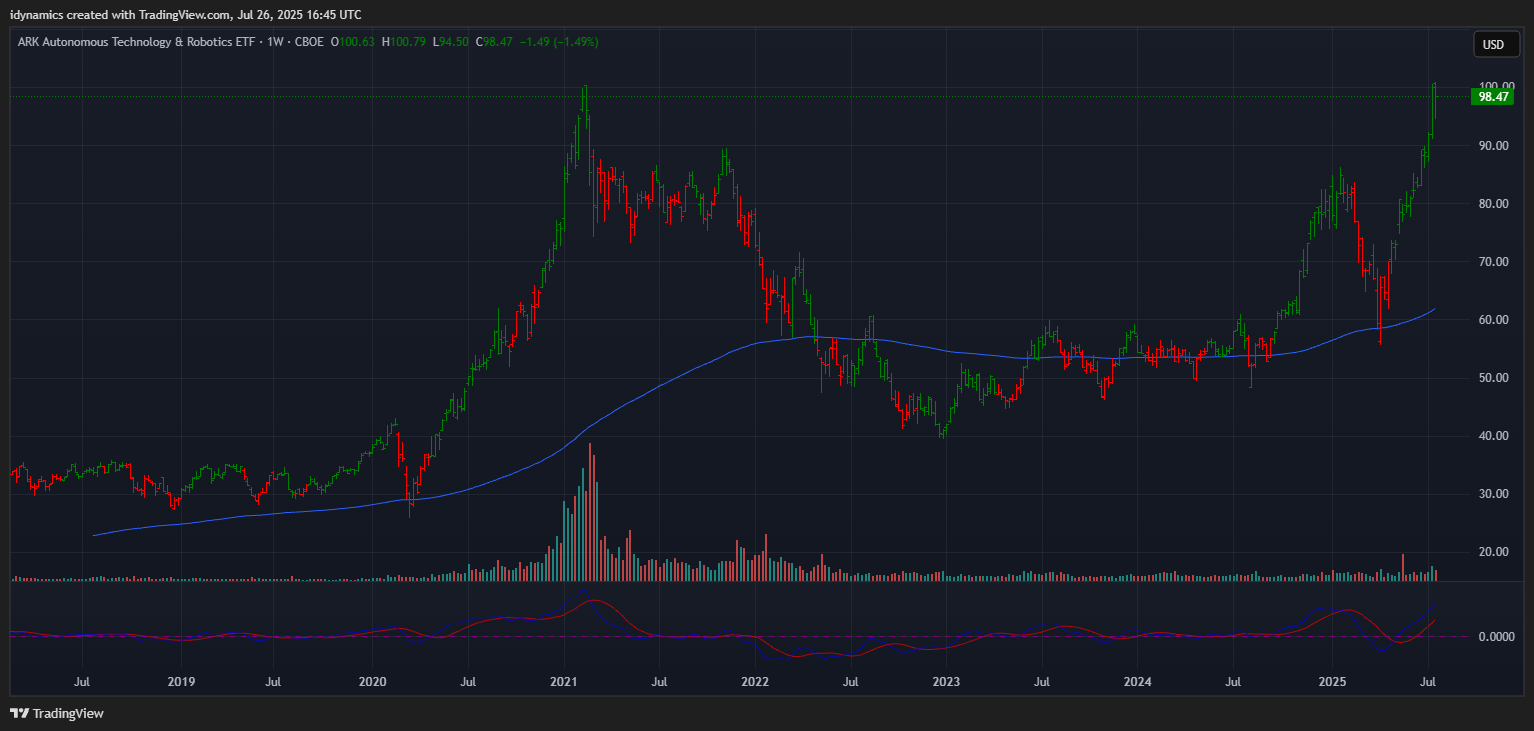
 Both the SPX and the NDX inched above the magic overhead trendlines with Friday’s trade. Speculation is rampant and meme stocks are trading at 2021 levels. Moves in ETFs like ARKQ are signs that extremely weak hands are calling the shots. Call walls are in positive gamma and puts have not been this cheap since 2021 and nearing 2008 levels. Sentiment is frothy with the VIX testing 2025 lows. Divergences are showing up everywhere. Zero-day Options now account for the bulk of options trade. Las Vegas has moved to Wall Street.
That said, the reality is that foreign capital is still flowing into U.S. markets and the market has punished the short sellers.
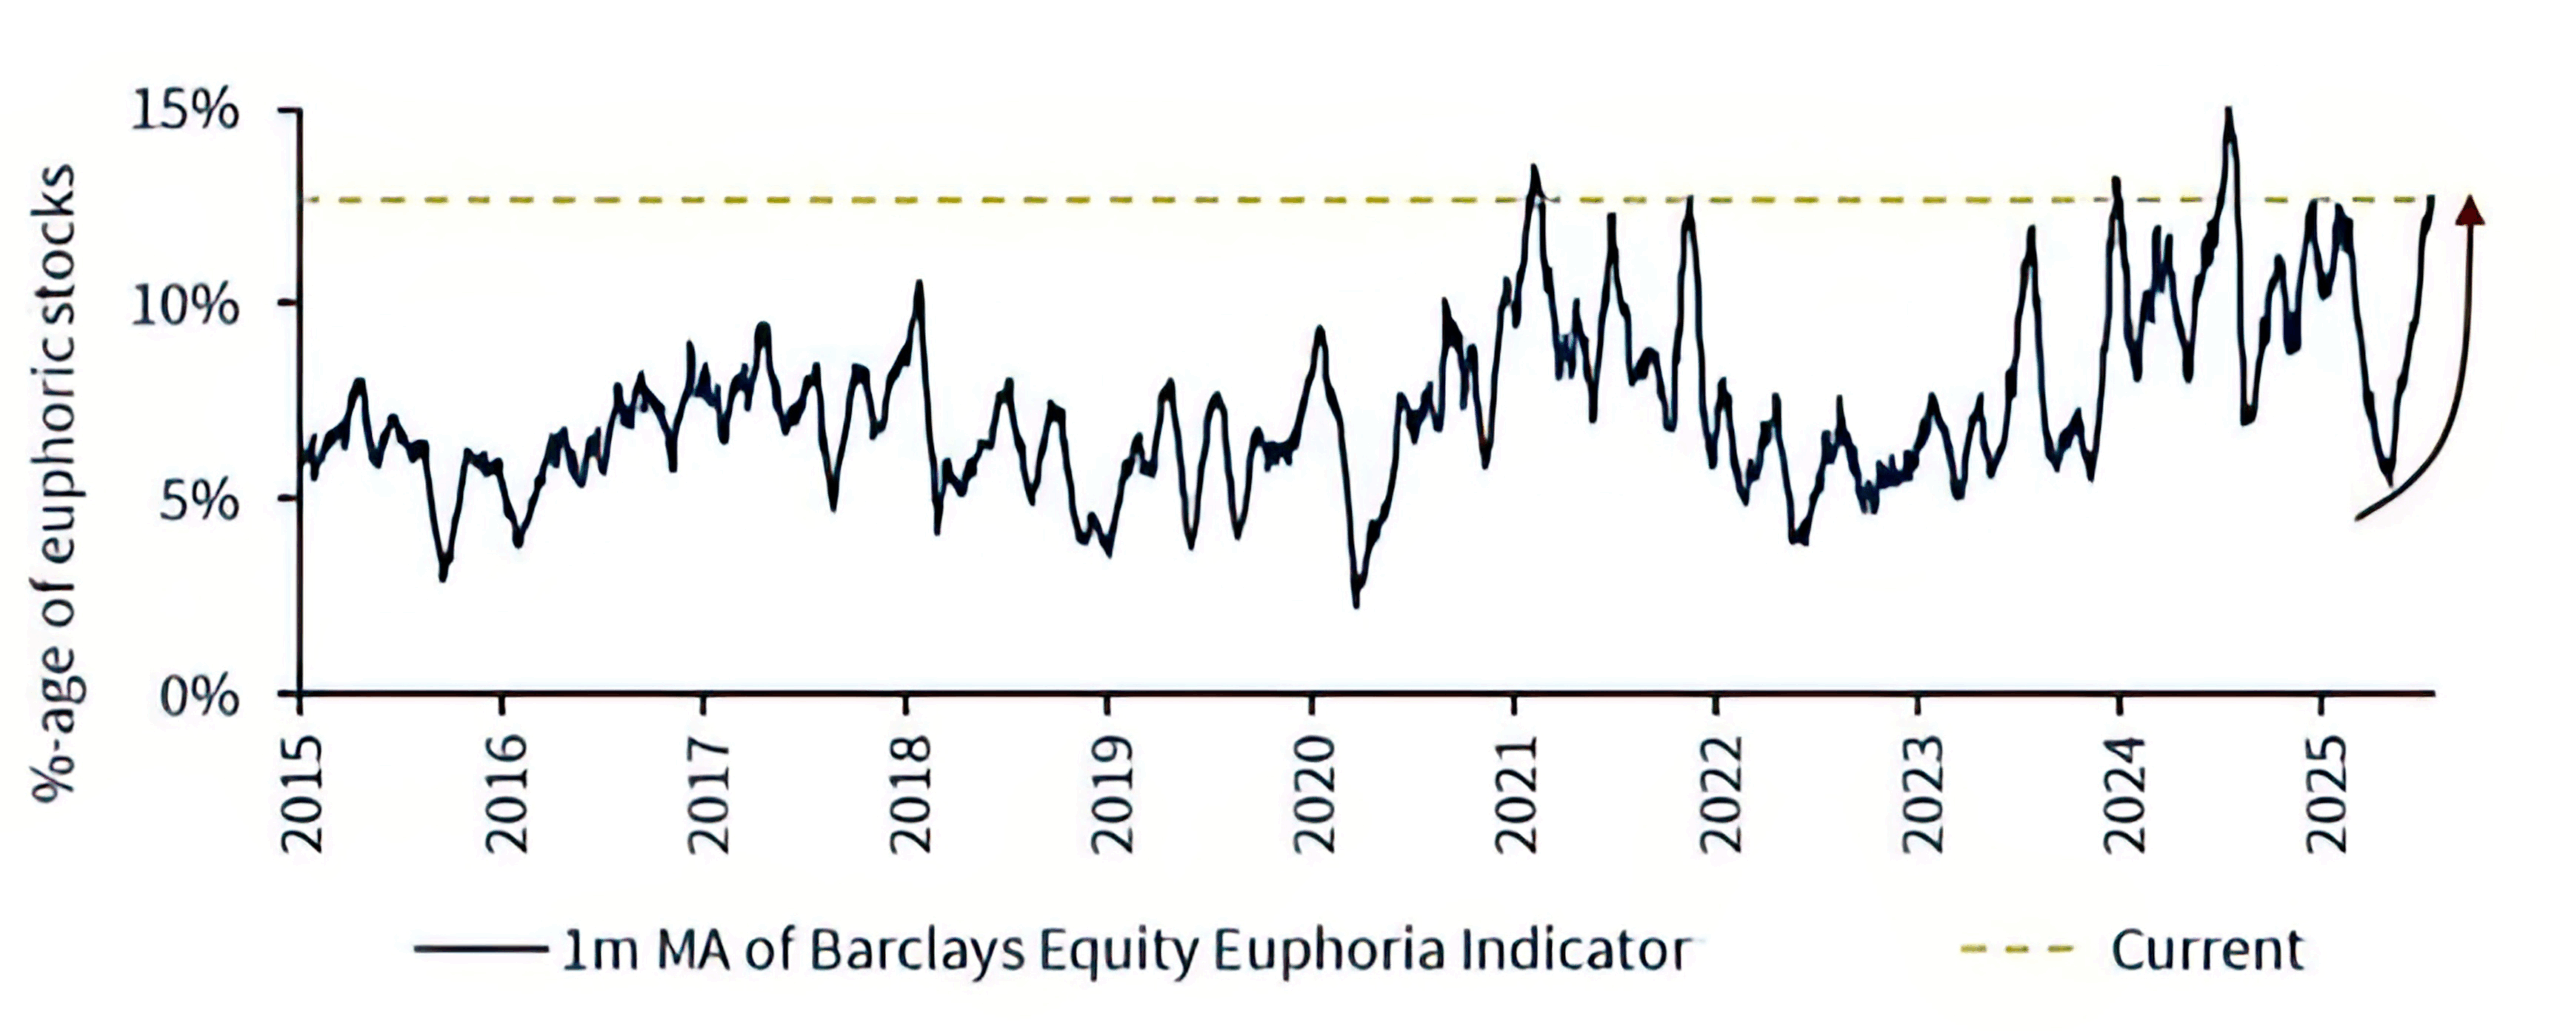
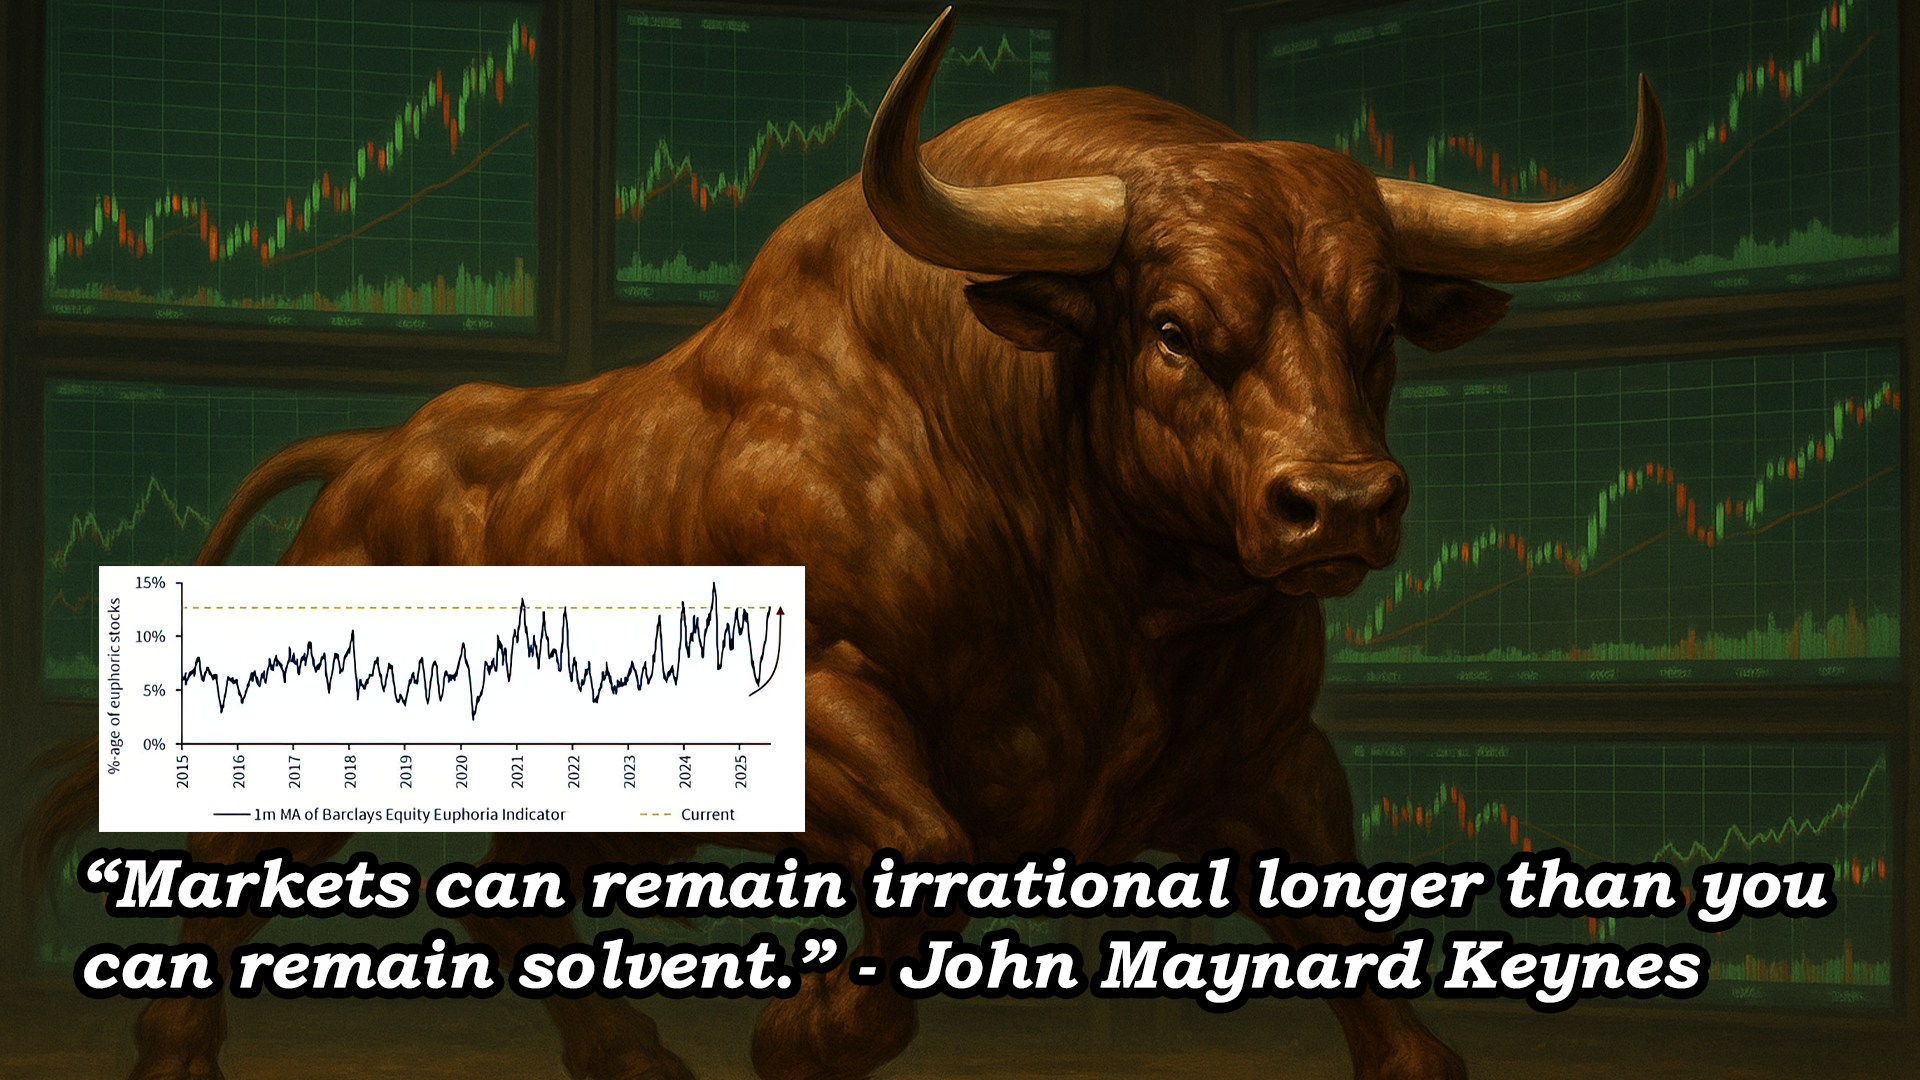
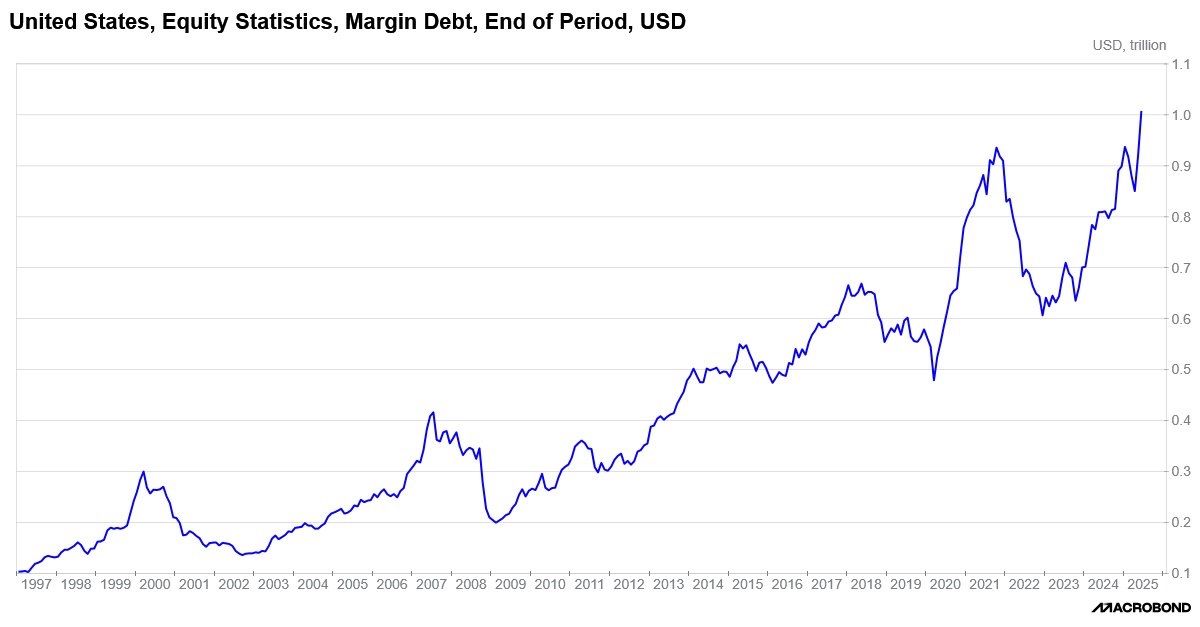
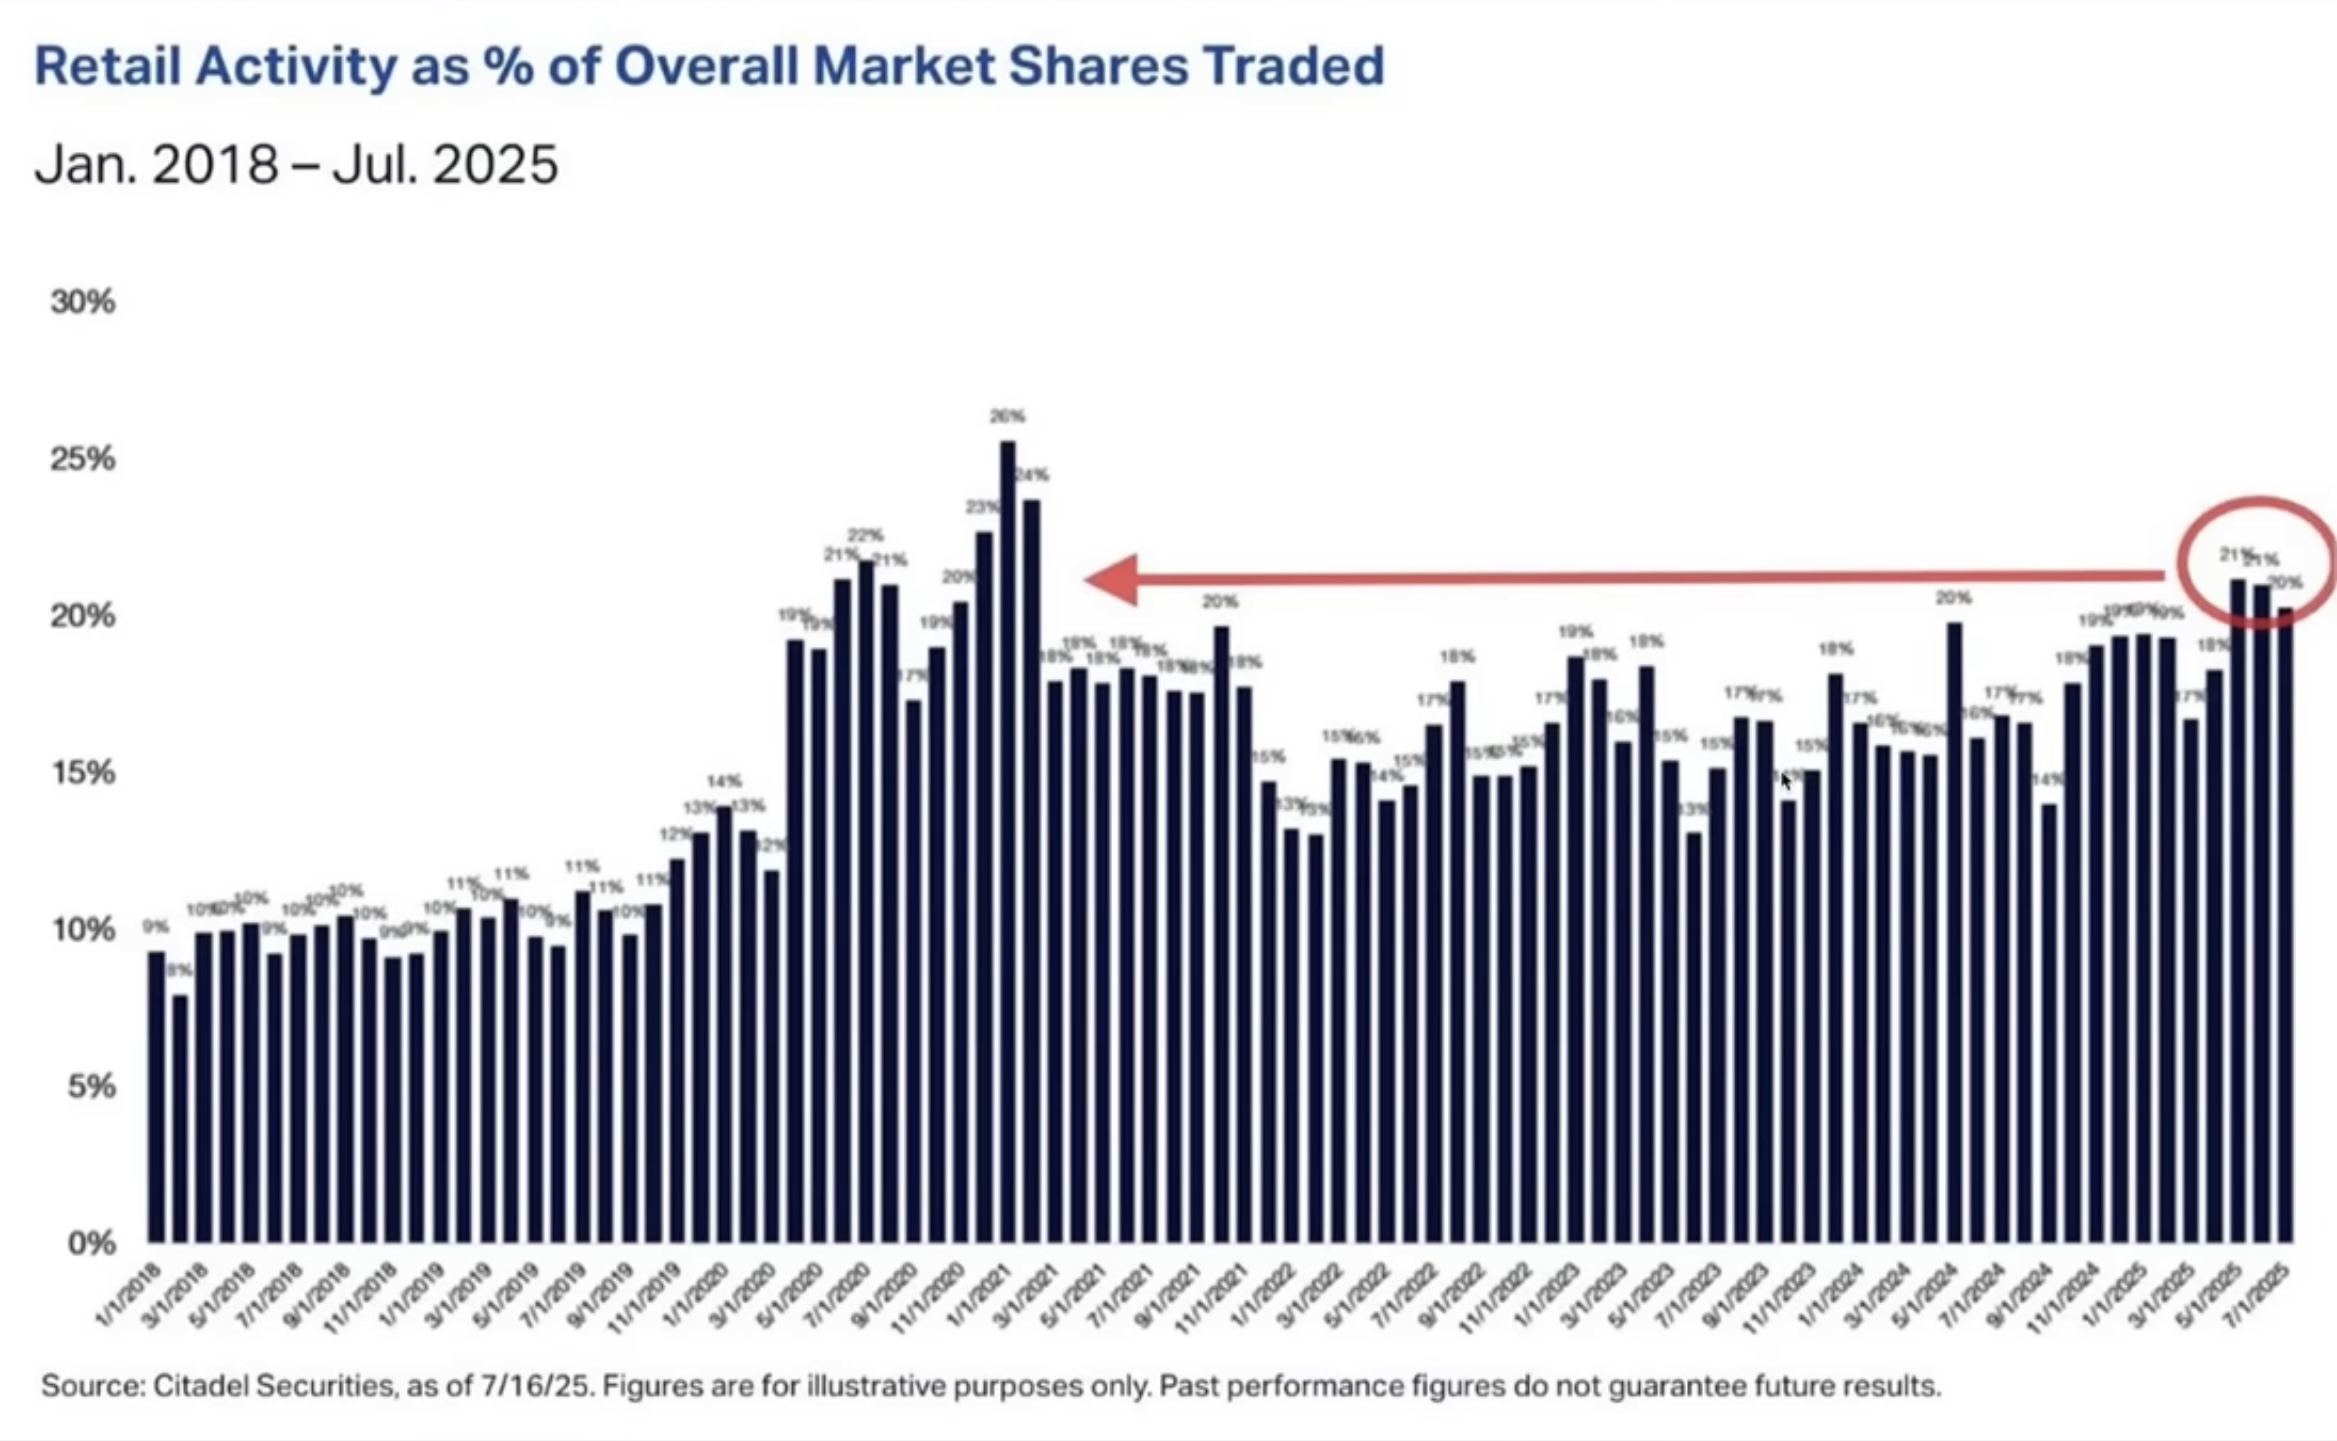
 Retail (small traders) are running the trade and margin debt has hit a record high above $1T. “Margin debt now equals 1.9% of the entire US stock market. That’s the highest ratio since 2007.” Everybody is hopping on the train. There is only one direction the market can take. Right? With all that cabbage you’re making off WallStreetBets on Reddit you can now help the U.S. Government pay down the national debt using Venmo! Barclay’s Equity Euphoria Indicator has reached a record high. In highly typical mania fashion, CNBC’s Jim Cramer (AKA Reverse Cramer) announced the “New FANG” called “PARC” this past week. He picked the mostly highly traded retail meme stocks for his new index…a classic sign of overblown sentiment.
“Analysts at Deutsche Bank in a note on Thursday questioned whether a rise in borrowing to fund stock purchases was a sign of the “hottest euphoria” since 1999 and 2007.”

The reality is the first two weeks of August kick off a massive storm of cycles that run well into late fall and then into Q1/Q2 of 2026. The critical cycle timing in August (and September) is a hurricane of activity that should see increased volume and volatility.
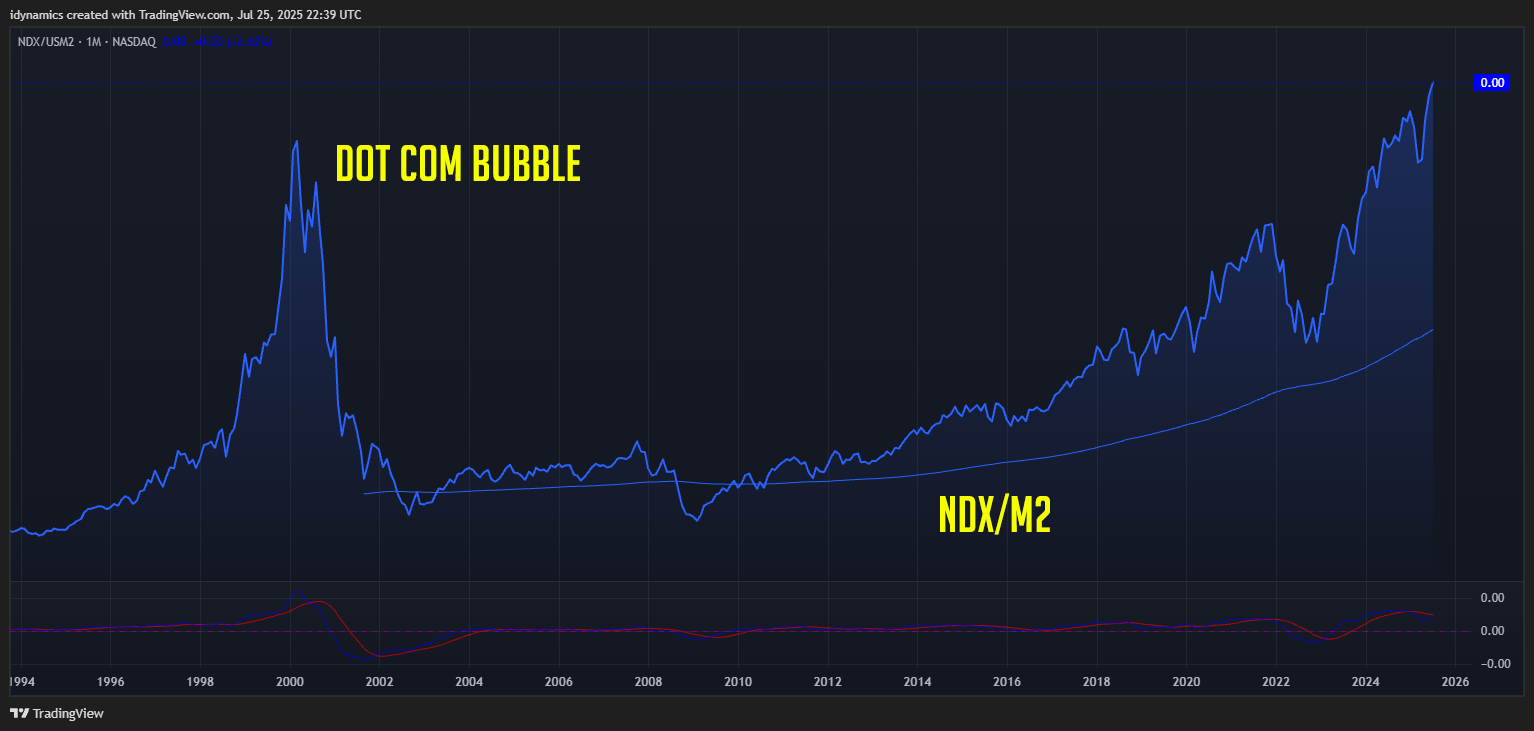
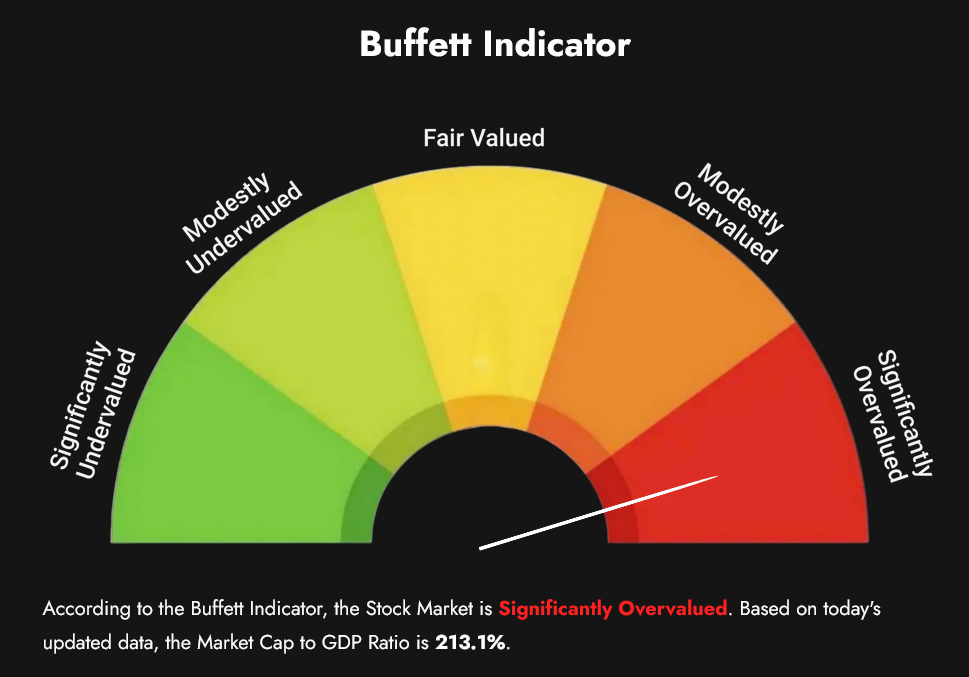 The Buffet Indicator has touched an all-time record high, hitting +213.1%.
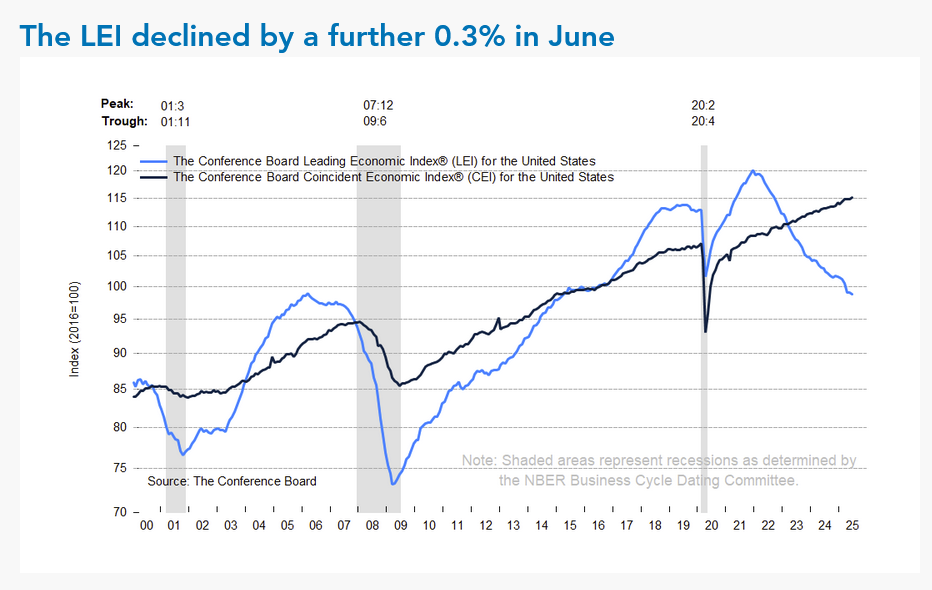
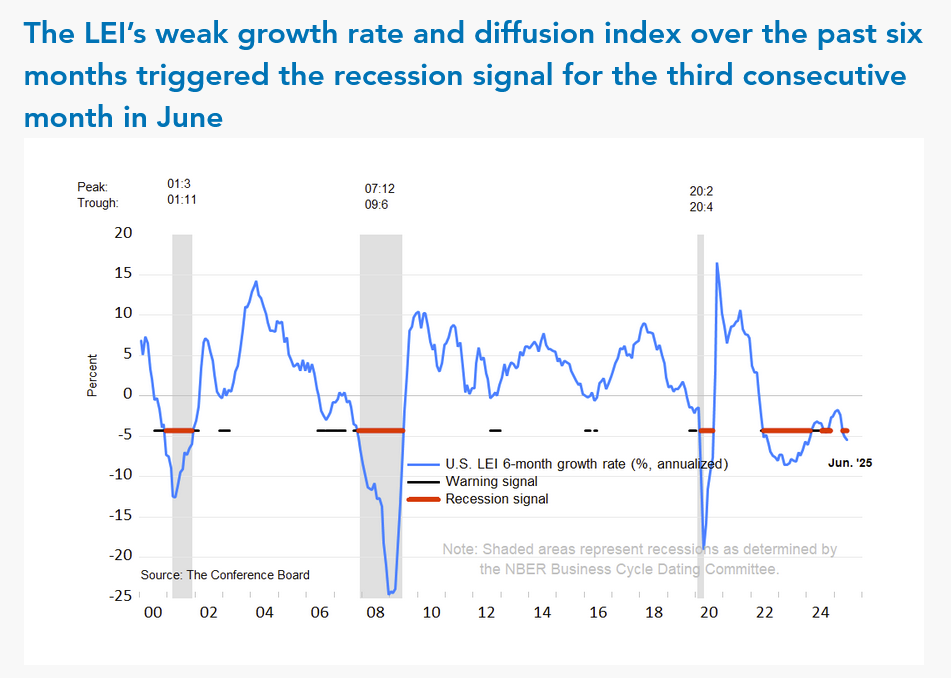
Leading Economic Indicators are telling a story that diverge from “market psychology.”

 Dow Jones Industrial Average Weekly Candles
 I will post a Cycle Timing Update this weekend with updated dates. We are now in a massive longer-term window where the confluence of long-term cycles begins to collide. This risk for an exogenous event is heightened in this time frame. August is a month where there is strong potential for an exogenous event to occur.
S&P 500 Stocks Above the 200-day MA
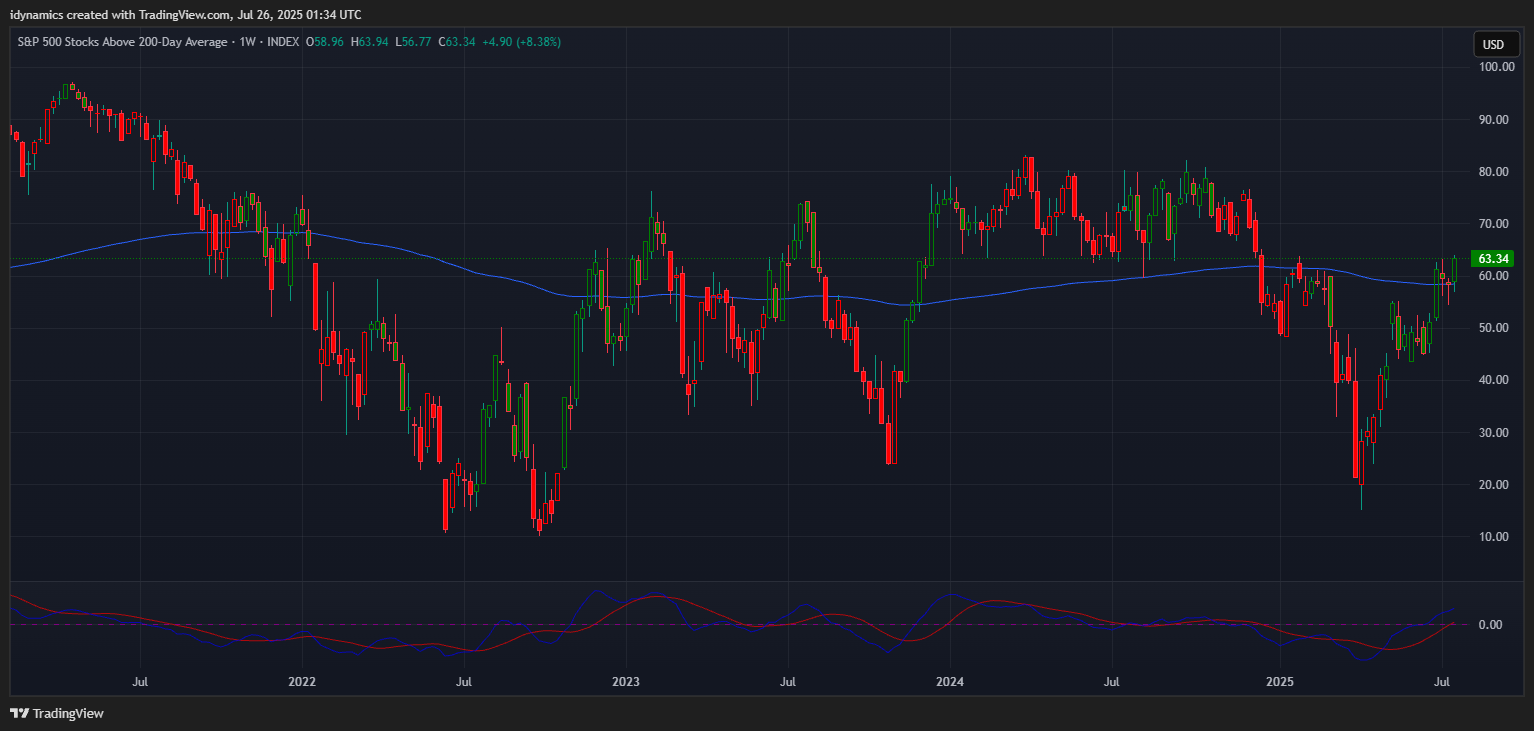 Breadth improved last week as the number of SPX stocks above their 200-day MA is testing the 2025 highs. The percentage of SPX stocks above their 200-day MA ended Friday at 63.34%. It hit a high of 63.61% on 27 January 2025 and 72.92% in September 2024 and 82.70% in March of 2024.
MAGS (Magnificent 7) Weekly Candles
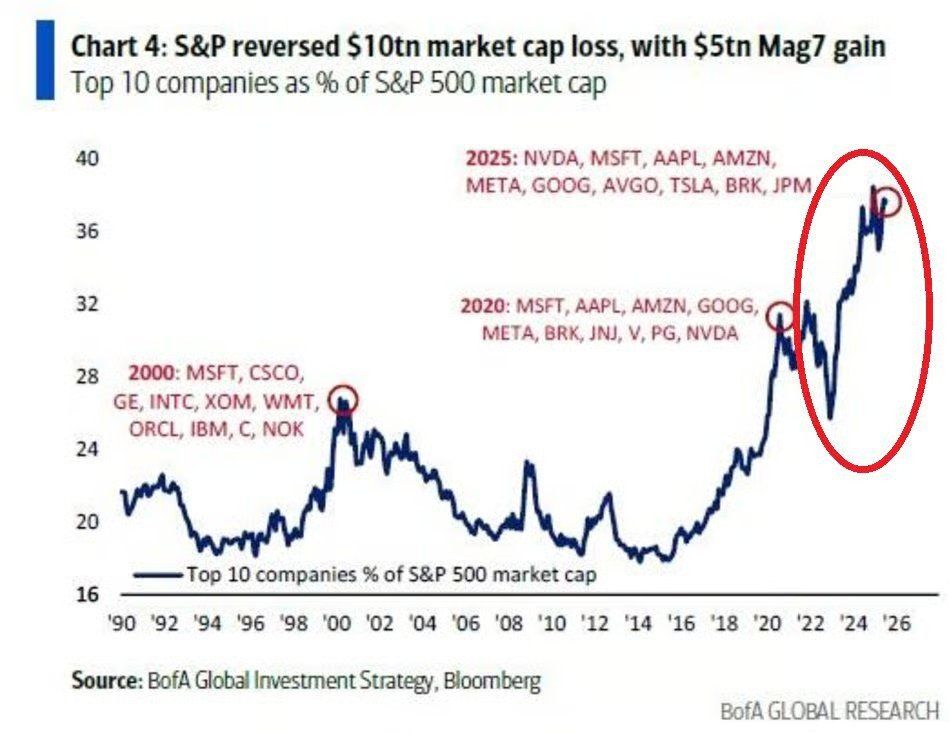
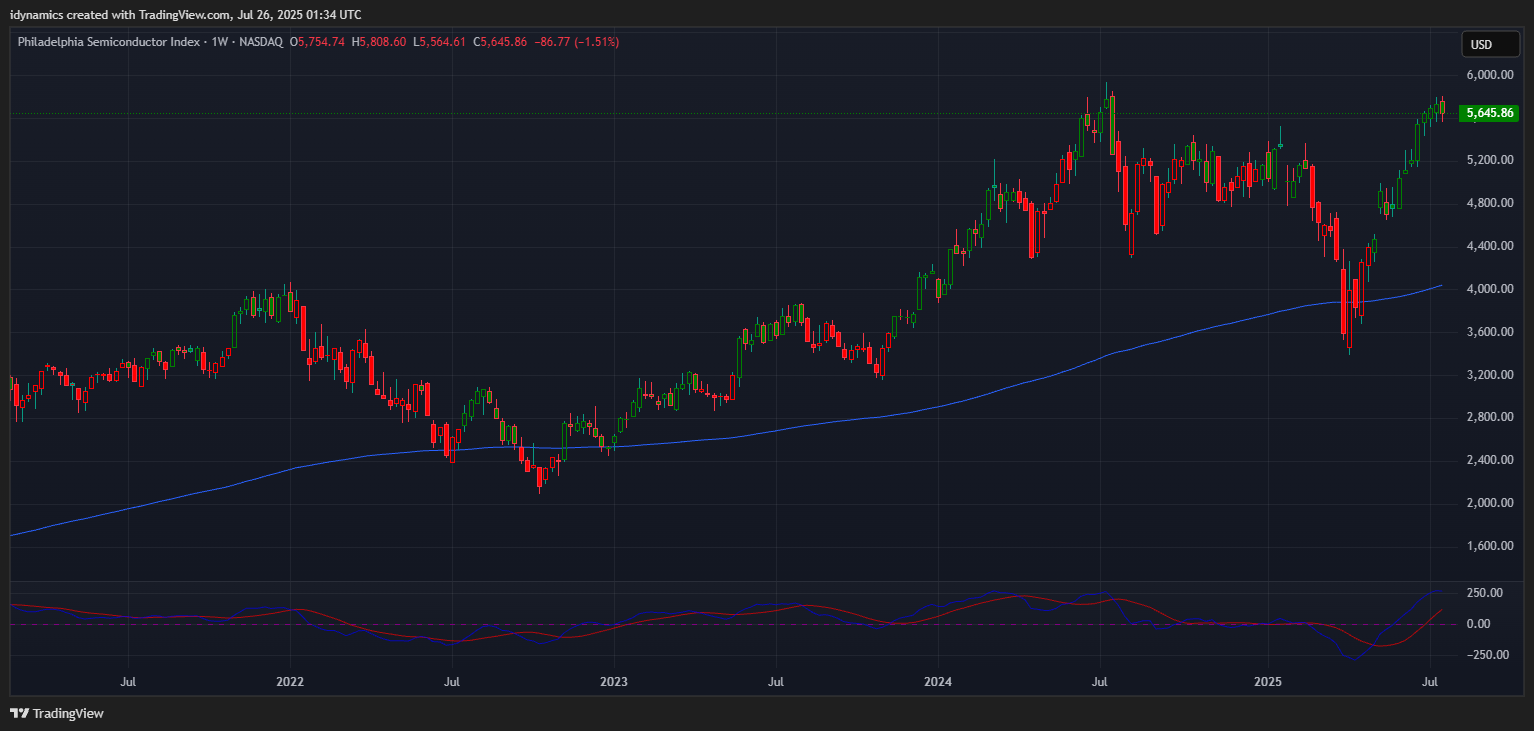
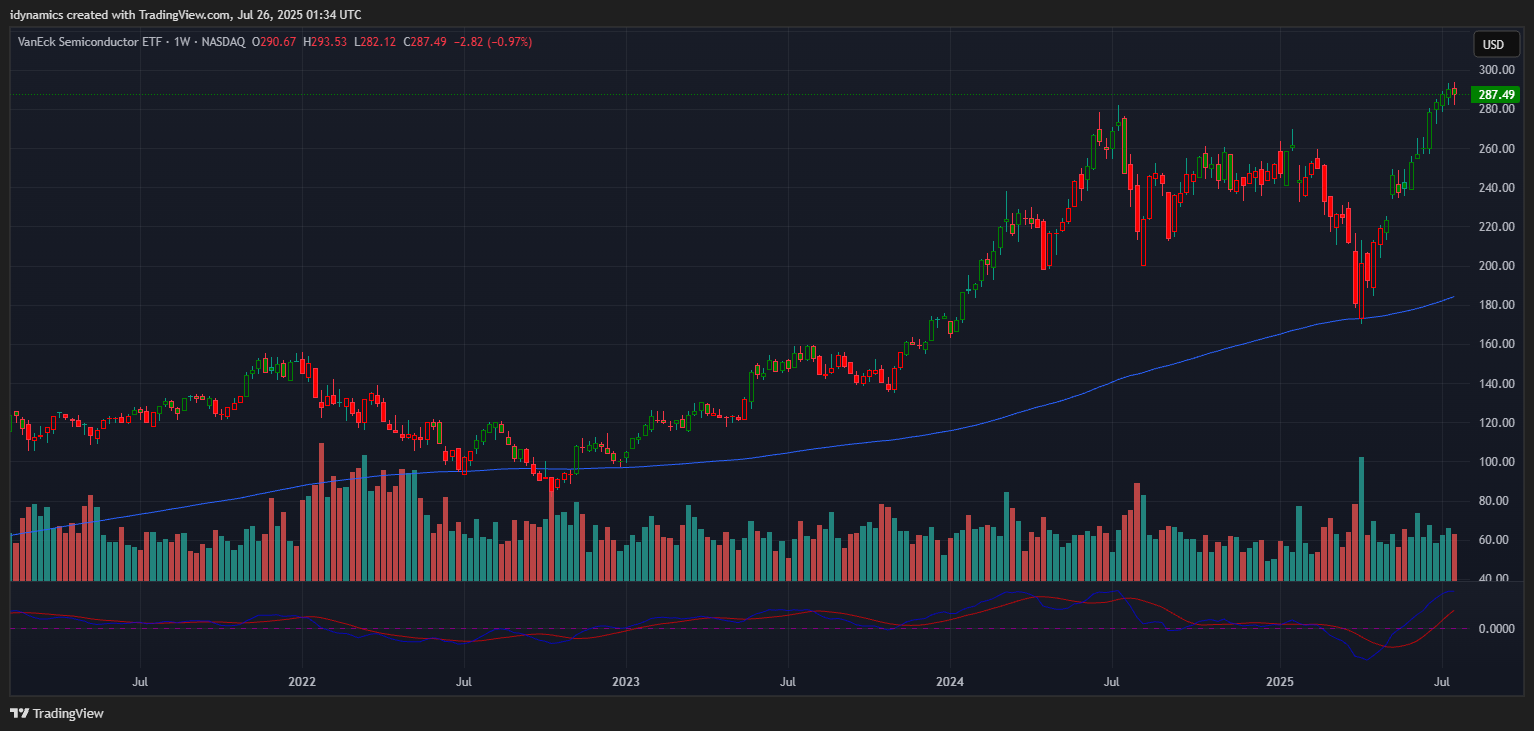
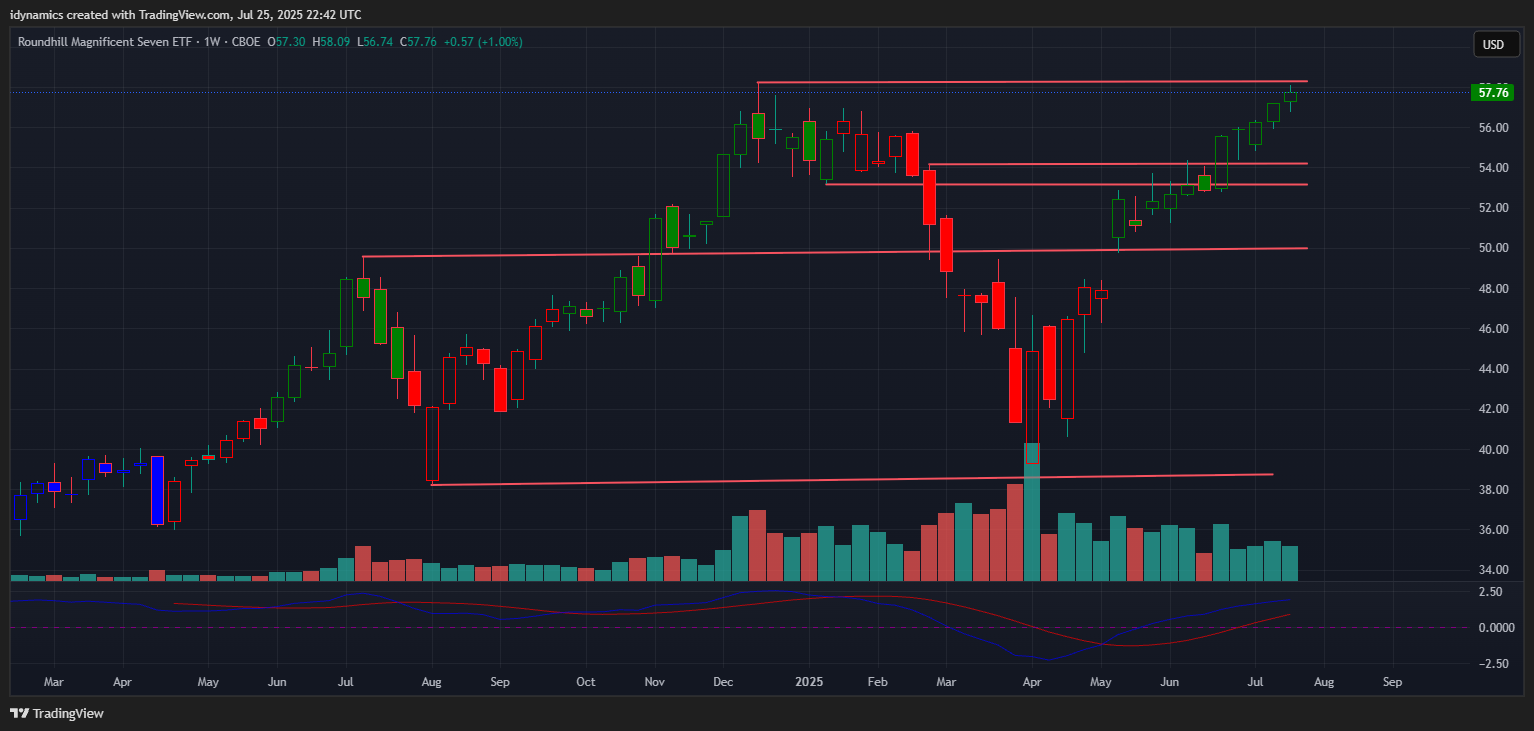 The MAGS rallied to a test of the ATH and had a bullish candle and a new high close for the move. Resistance remains critical at the ATH of 58.34. Closes over the 58 level suggest a push above 60. The market should see support against the 54.16/53.14. MAGS closed the week up +1.00% on the top of the week’s range. Both the SOX and SMH saw slight pullbacks last week. It is important to note that the retail traders that are fully margined are almost exclusively in the MAGS and tech stocks right now. The top 10 stocks in the SPX comprise nearly 40% of the entire market.
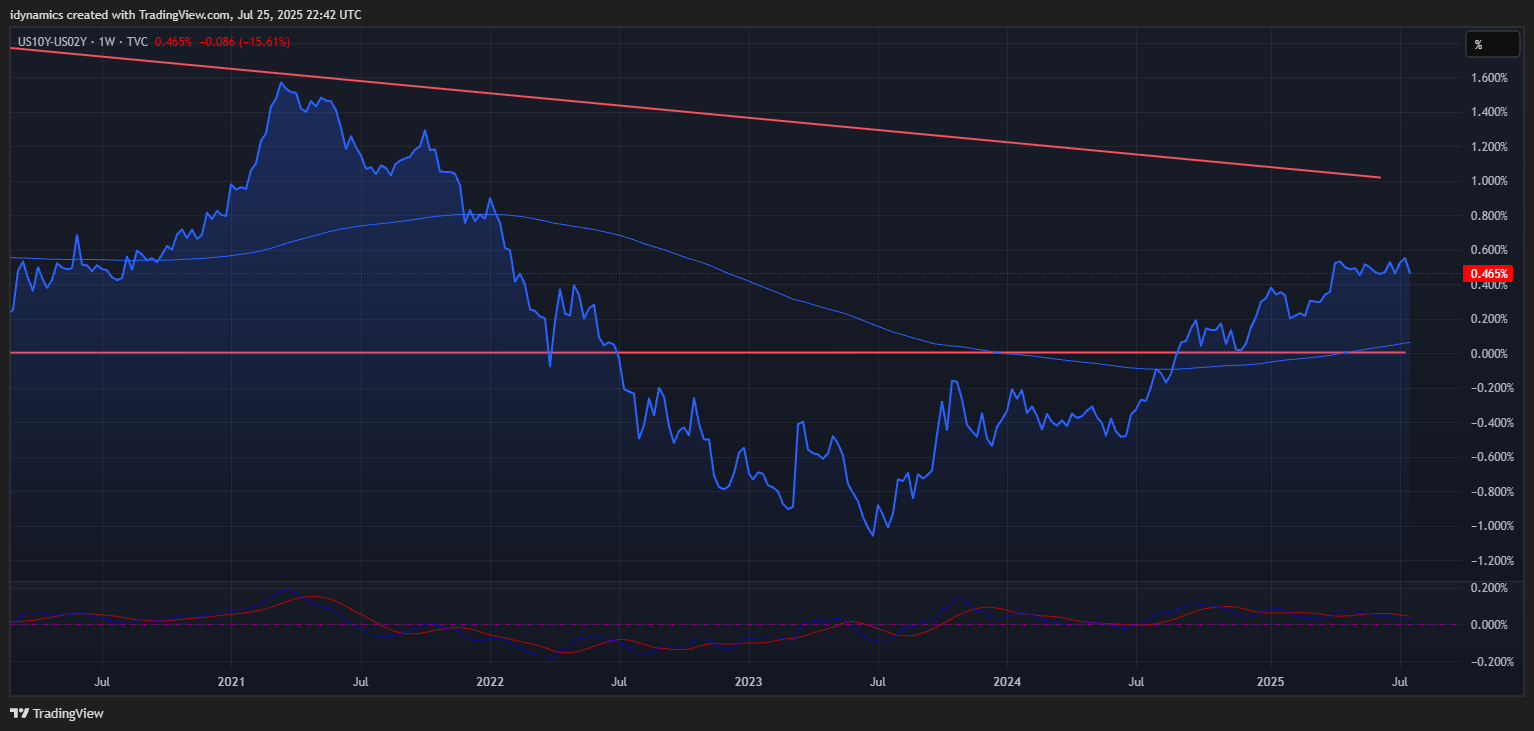
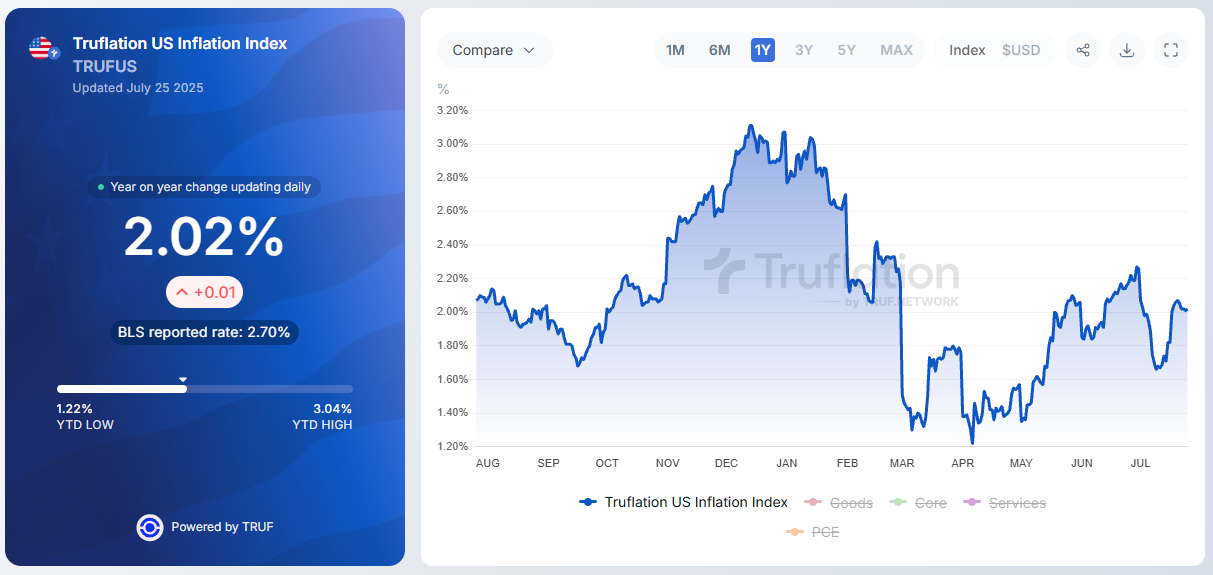
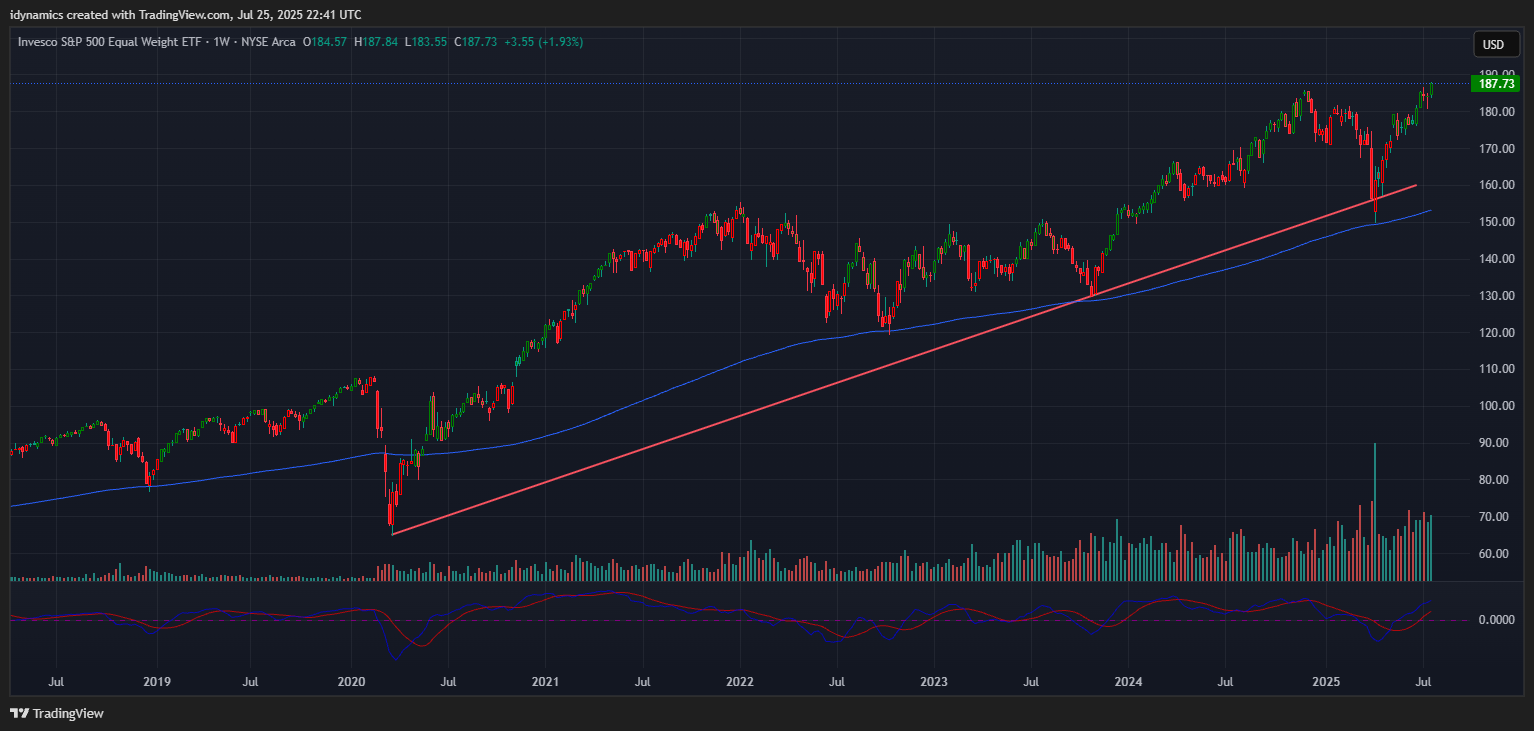
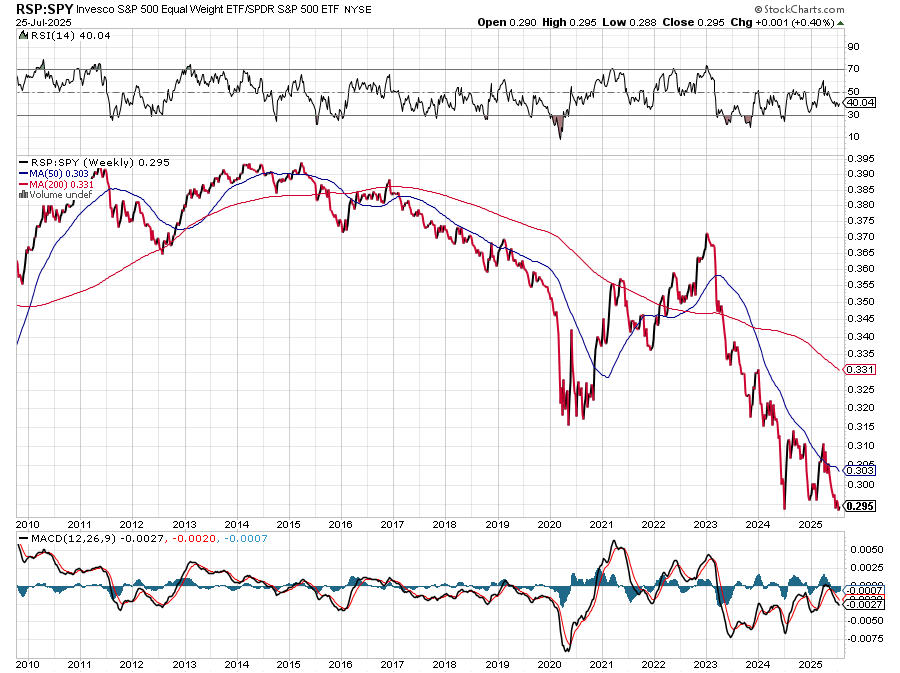
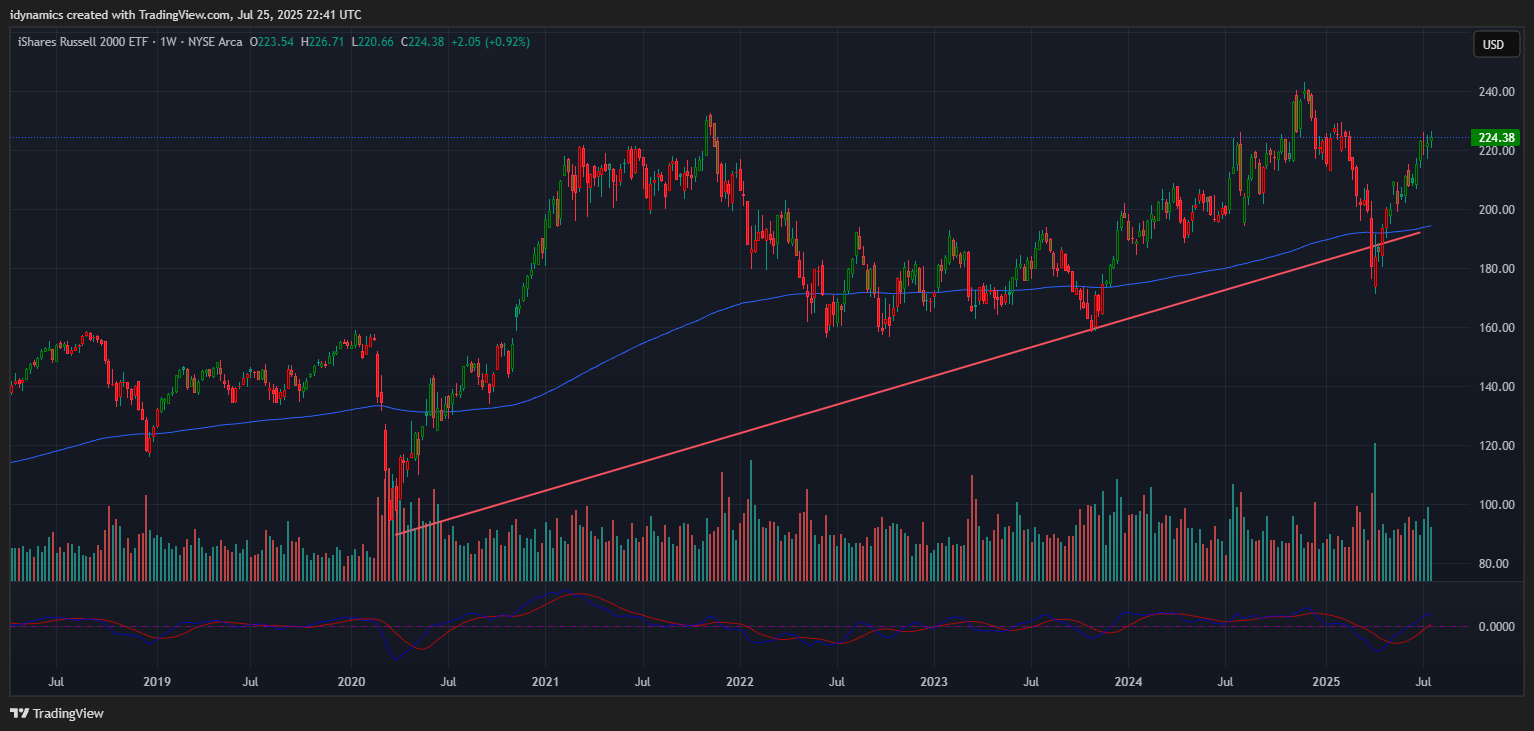
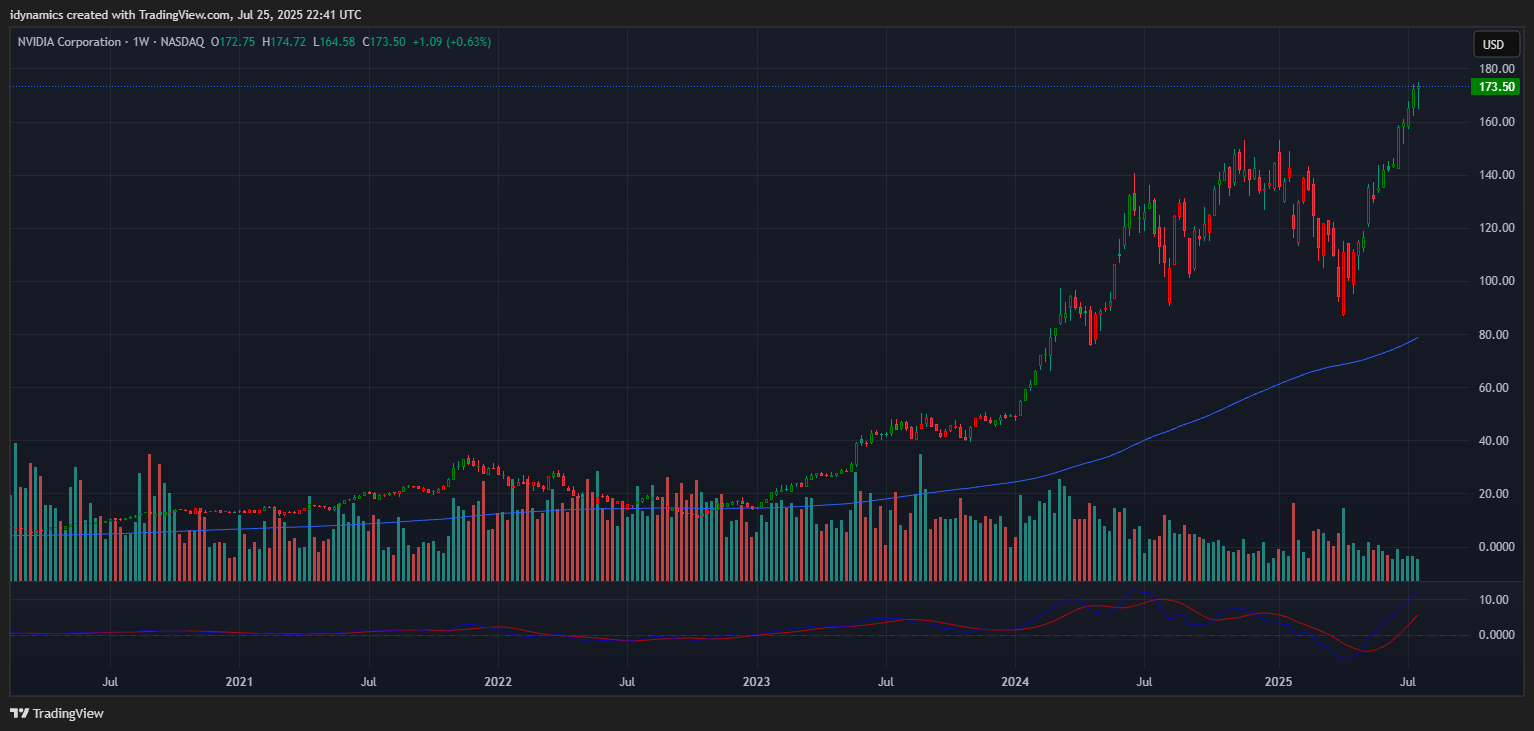
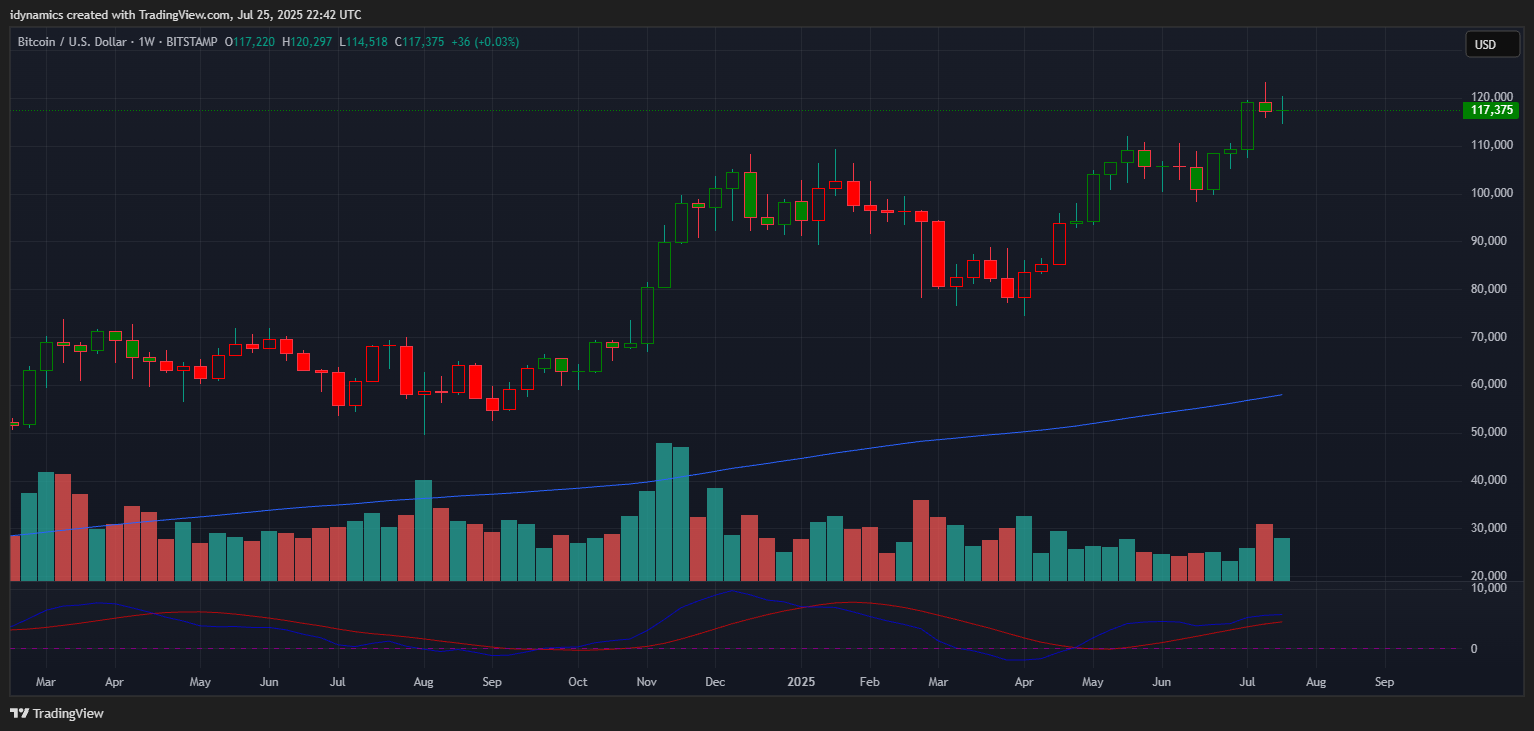
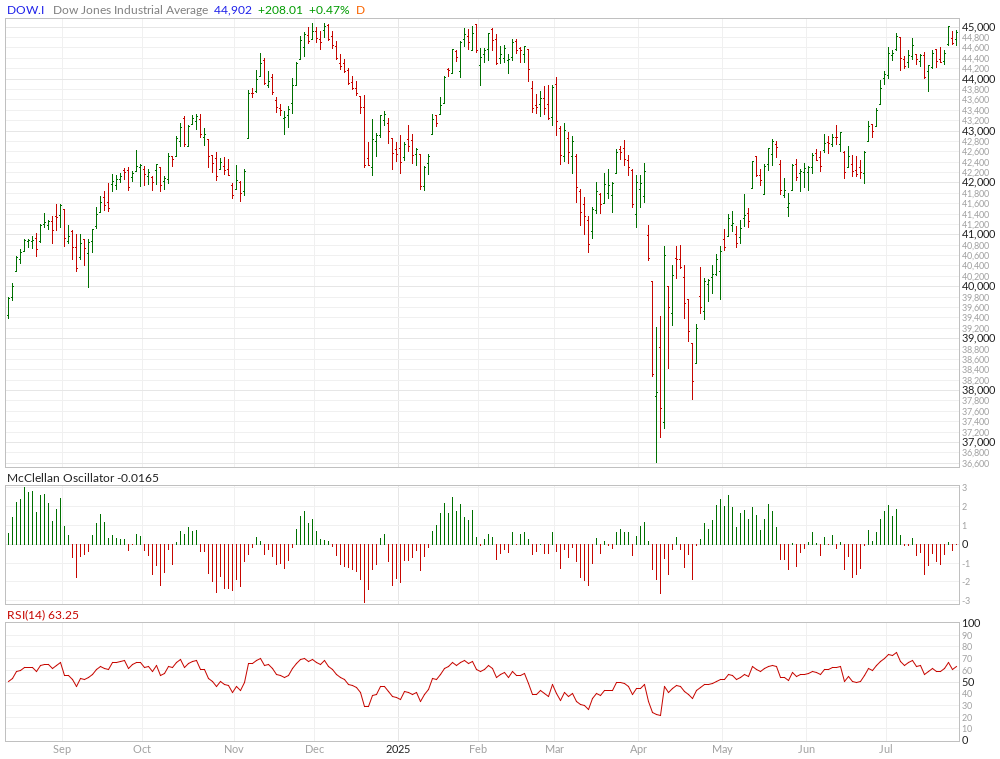
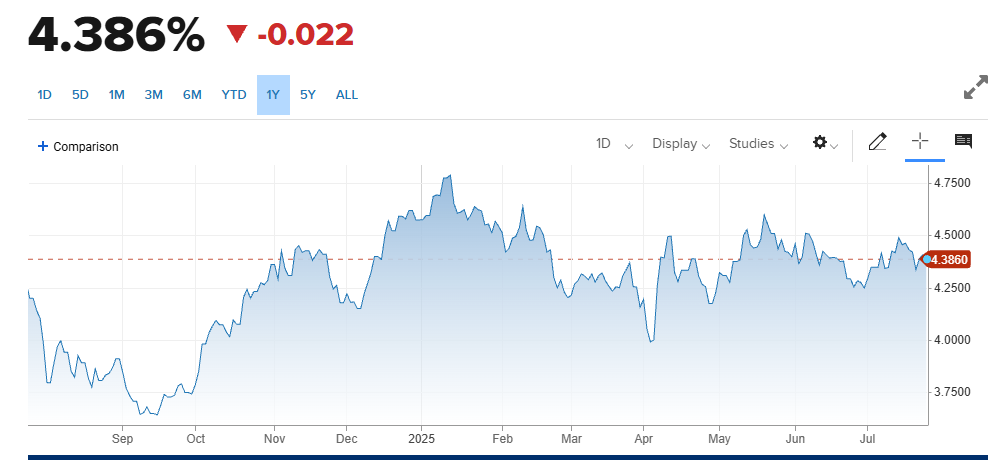
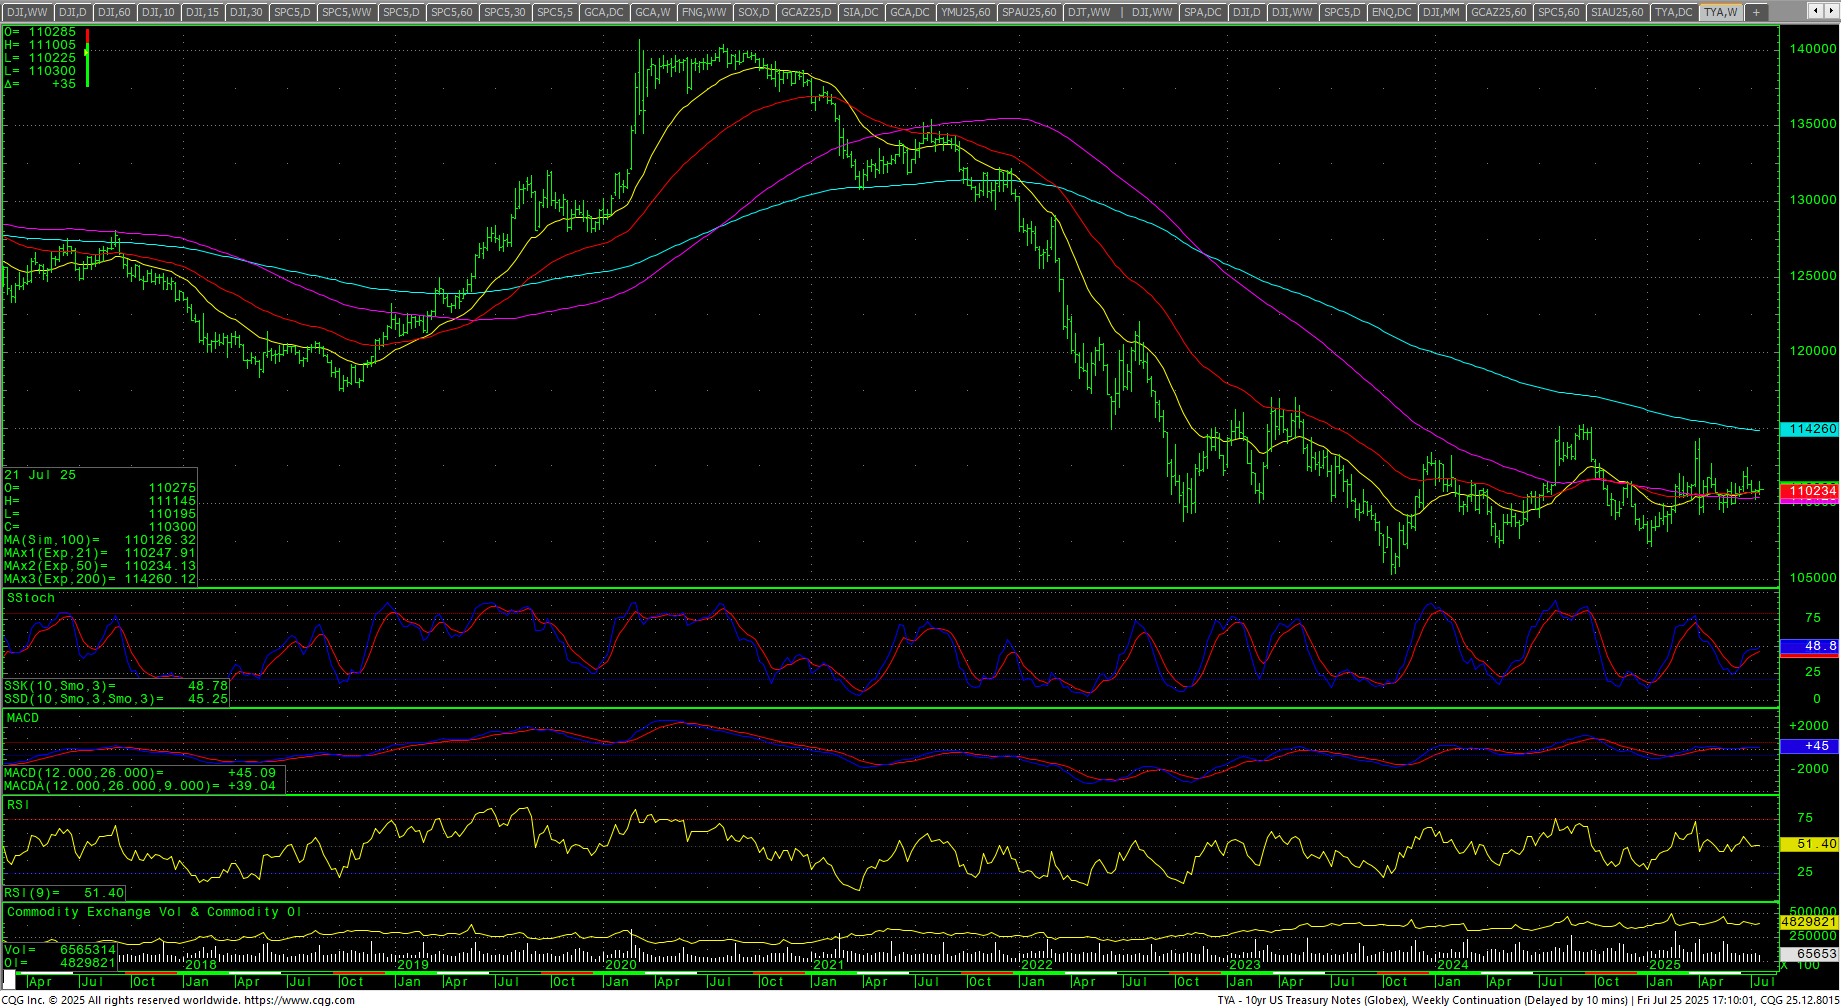
 The RSP:SPY closed flat last week even with the RSP hitting ATHs. The spread chart remains extremely weak. The weekly is trending lower in an oversold position and the MACD is turning back down. The IWM traded a new recovery high and closed toward the upper 50% of the week’s range, settling up +0.92%. The RSP was up +1.93% in the upper end of the range at a new ATH. NVDA was up +0.63% to another ATH as prices are moving toward the next massive call walls in the 175/180 level in positive gamma. Volume is declining with the chart extremely overbought. Bitcoin closed unchanged as it does a small pullback from the record highs above 123K closing down -0.03% in the bottom half of the week’s range. McClellan Oscillators are following the short-term trends in the Dow. The Yield Curve narrowed slightly last week, closing at +0.465%. The 10YR yield was slightly lower, closing at 4.386%. Truflation was flat at 2.02%.
10YR-2YR Yield Curve Daily

 VIX Weekly H-L-C
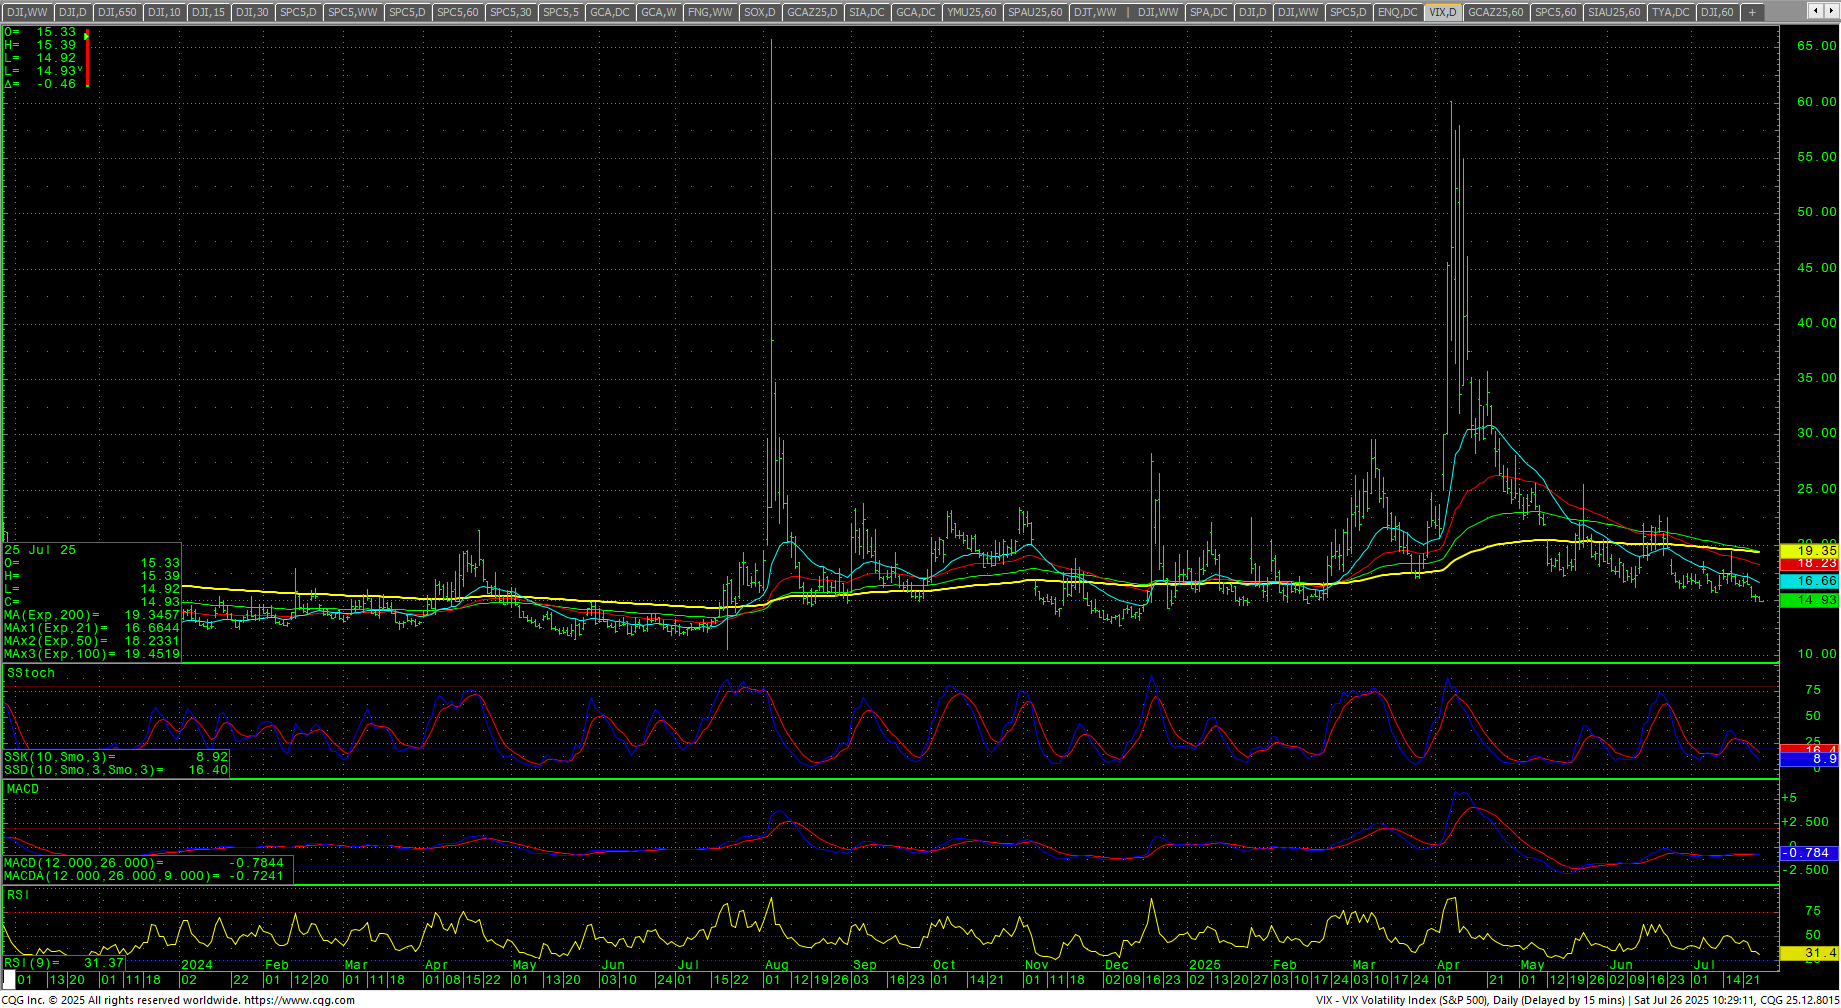
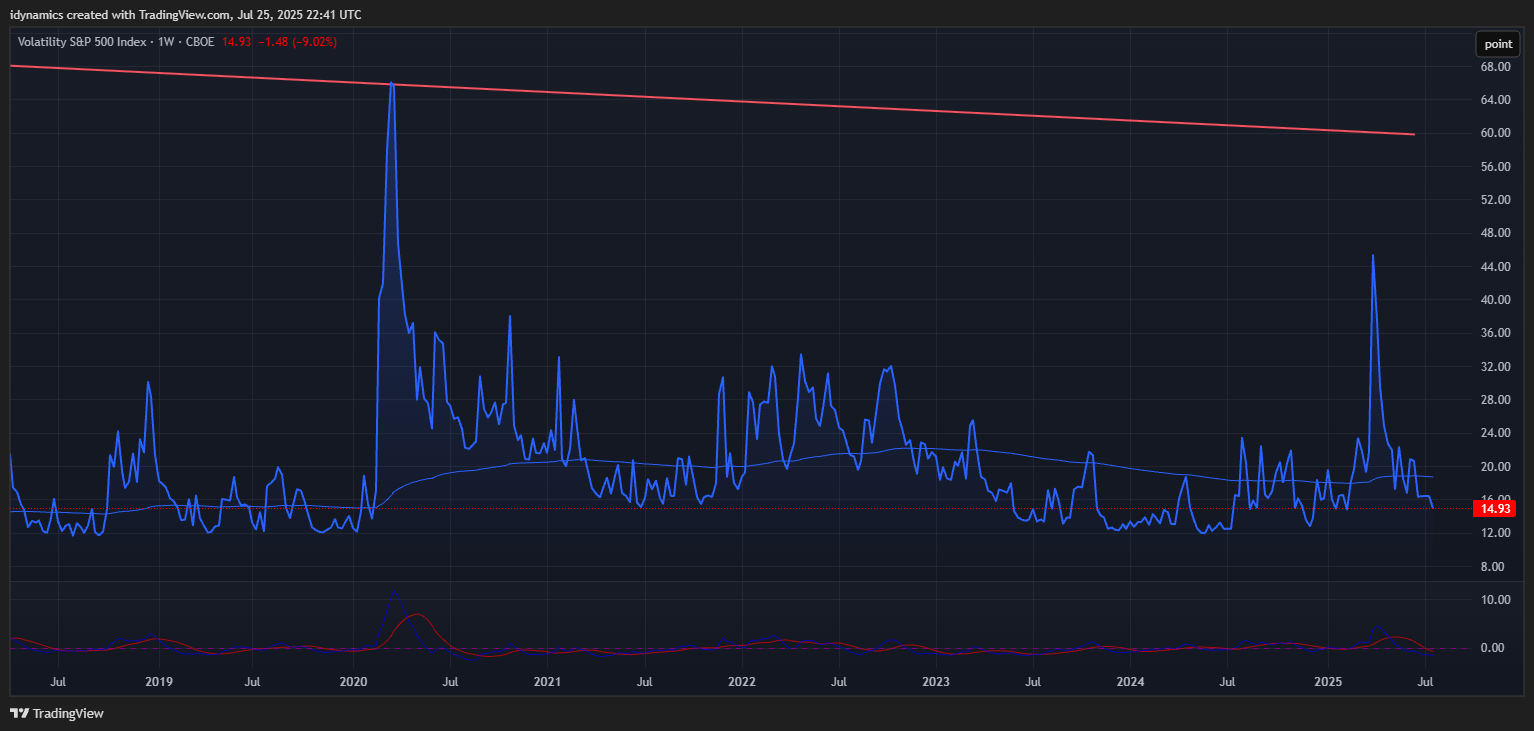
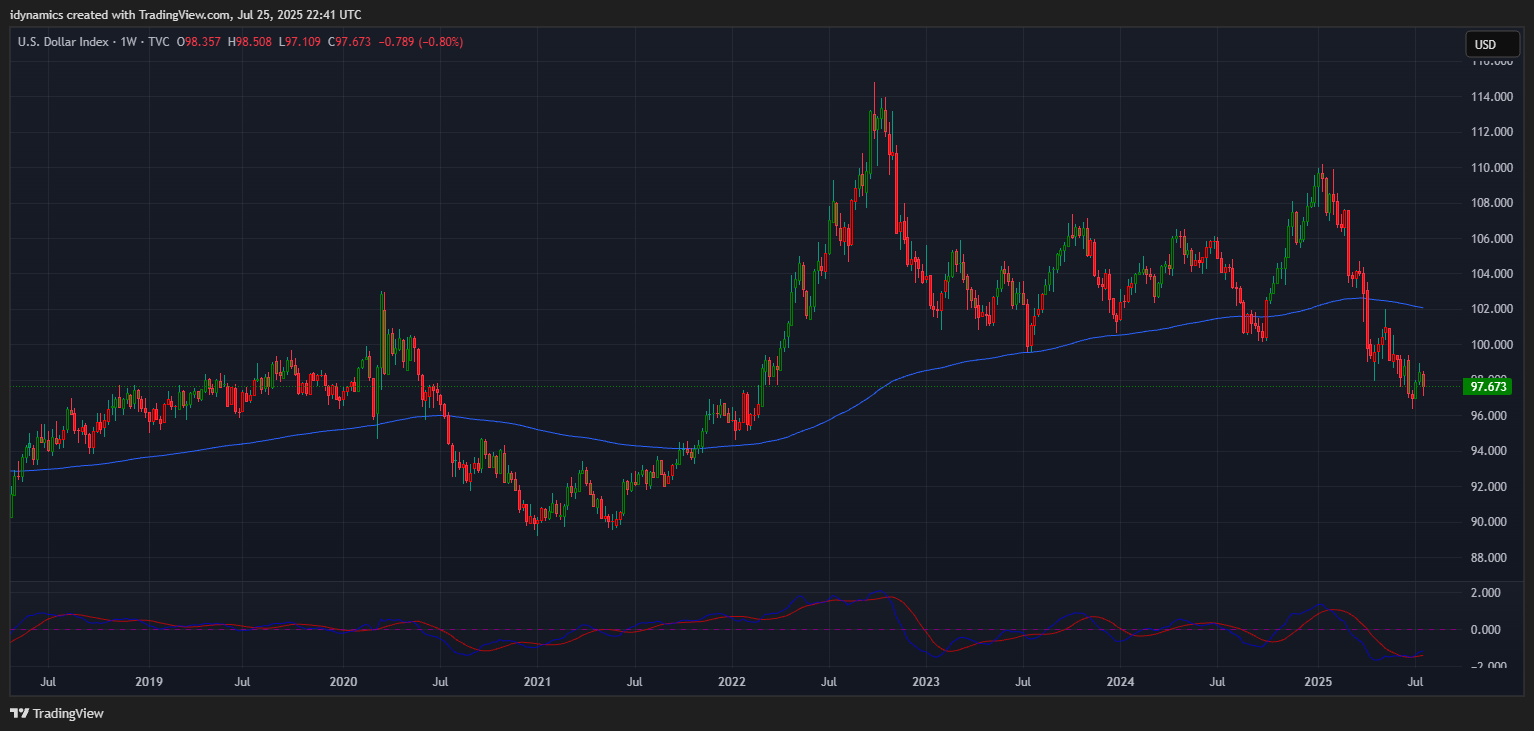
The VIX plunged -9.02%, closing on the bottom of the range at the lowest weekly close since 10 February 2025. The US Dollar sold off and closed down -0.80% in the lower half of the weekly range.
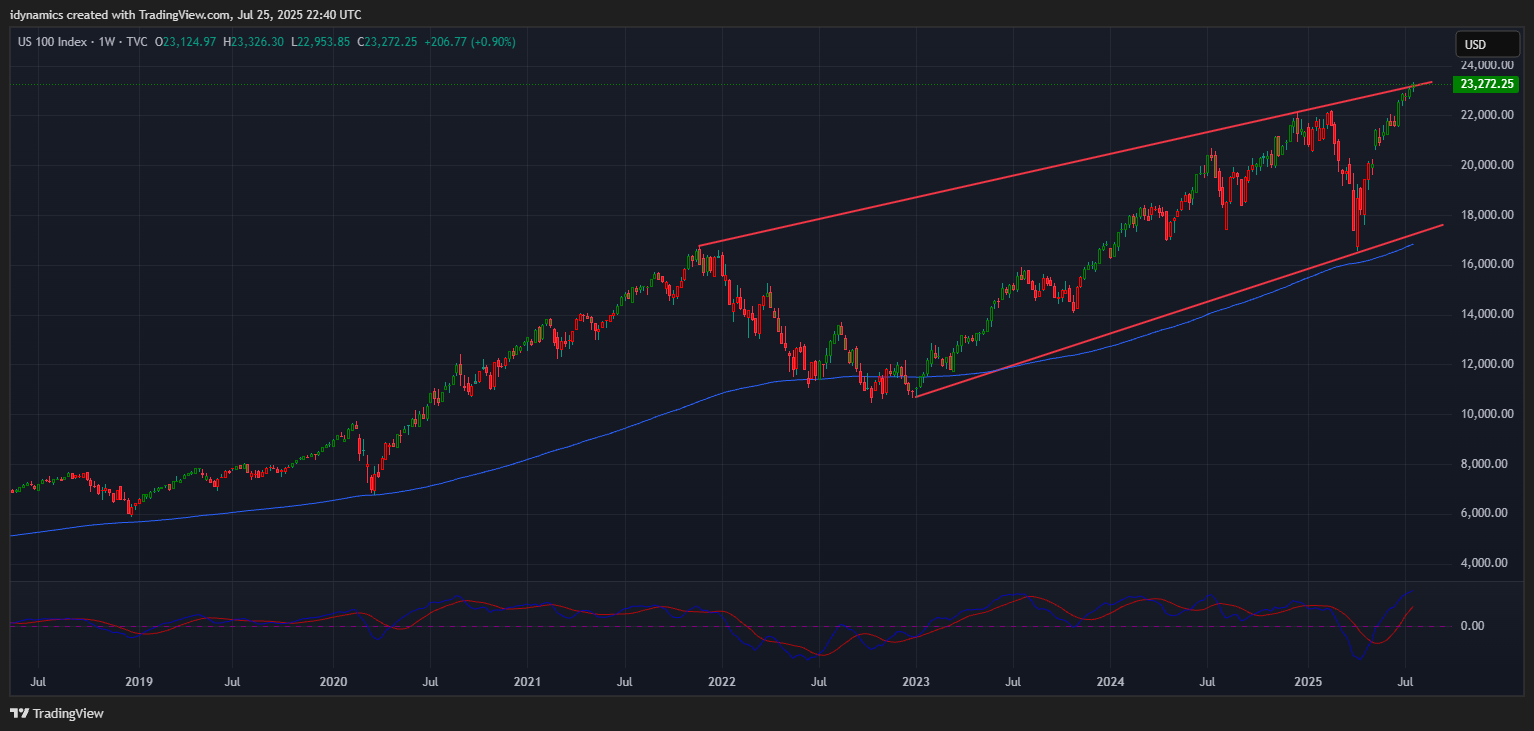
 Nasdaq 100 Weekly Candles
Daily Breadth 
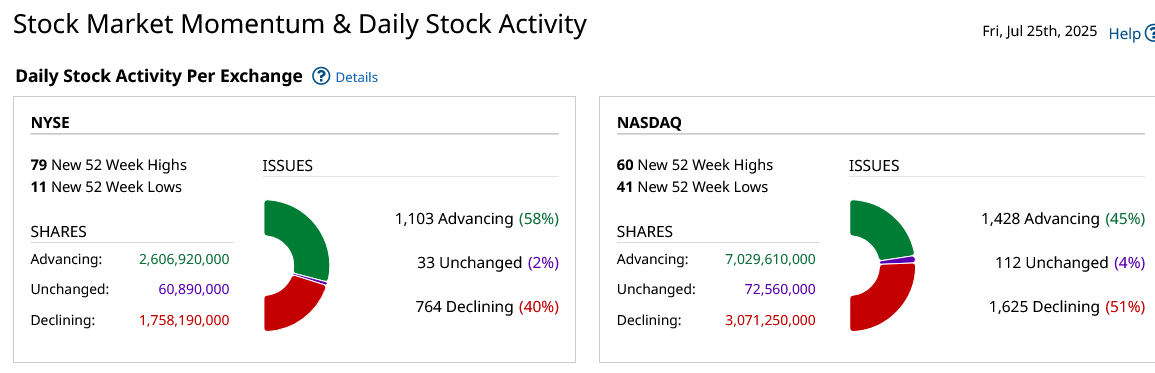
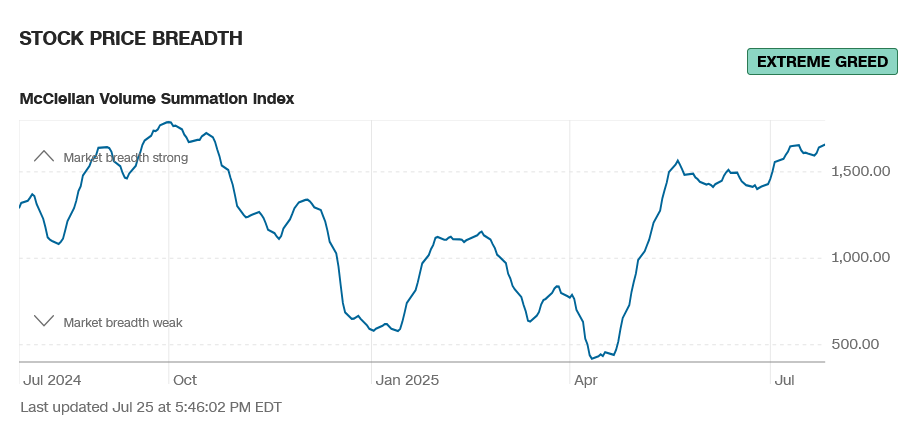
Breadth was mixed Friday but strong for the week as it sits near one-year highs on the weekly. Sentiment remains in extreme greed.
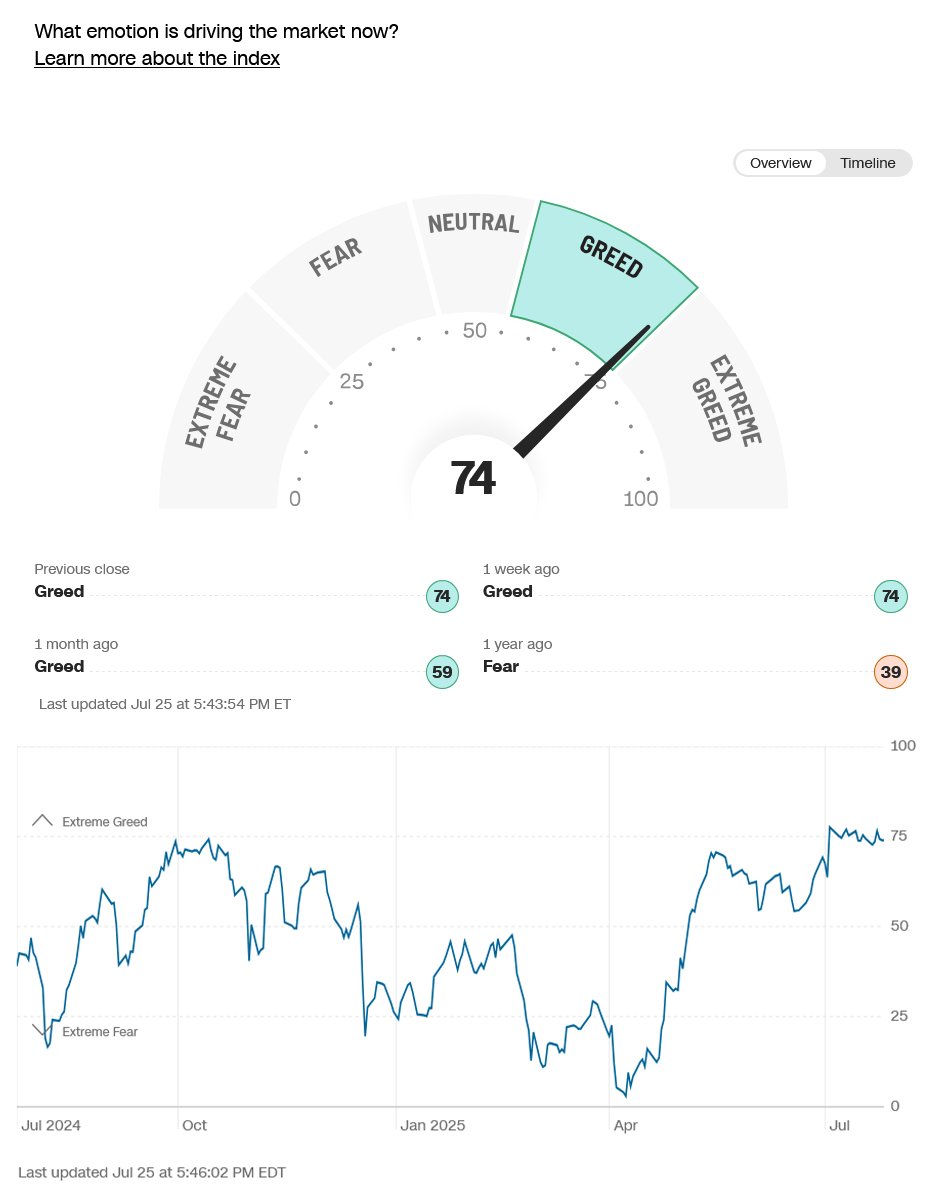
CNN Fear & Greed Index
 AAII Investor Sentiment Survey
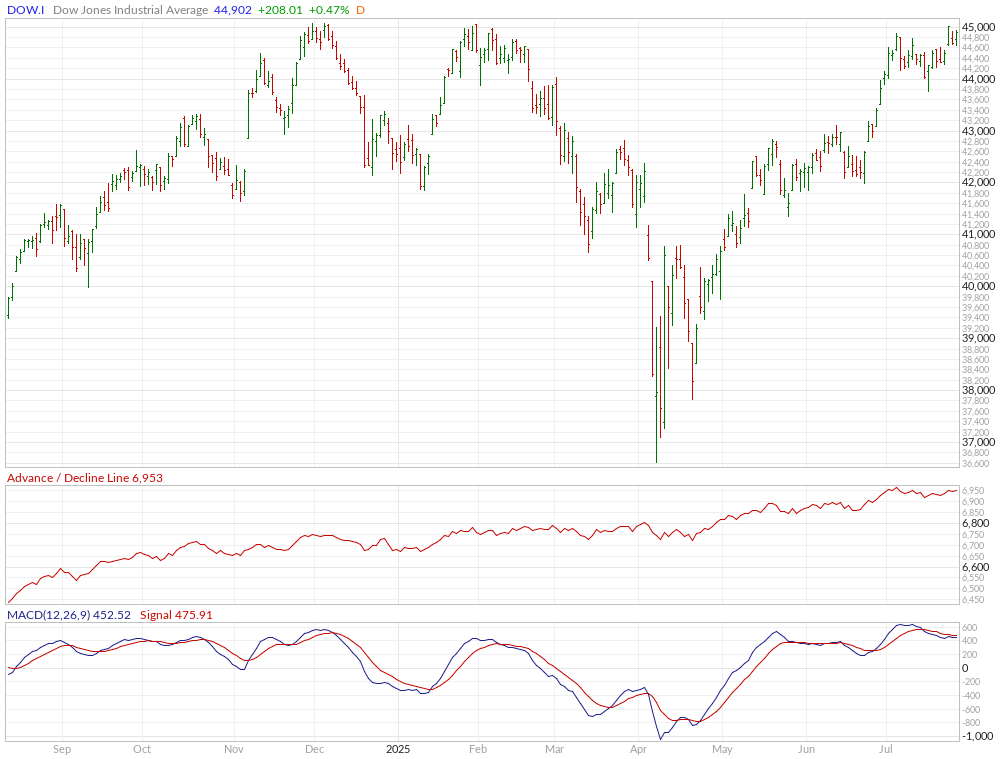
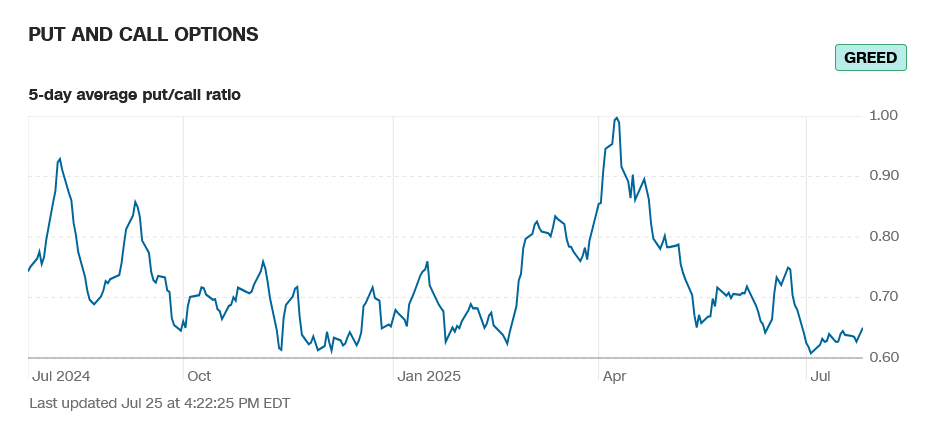
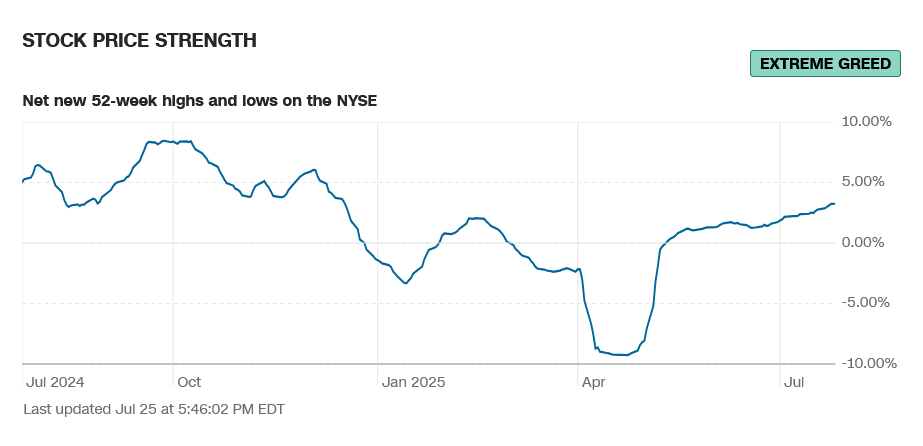
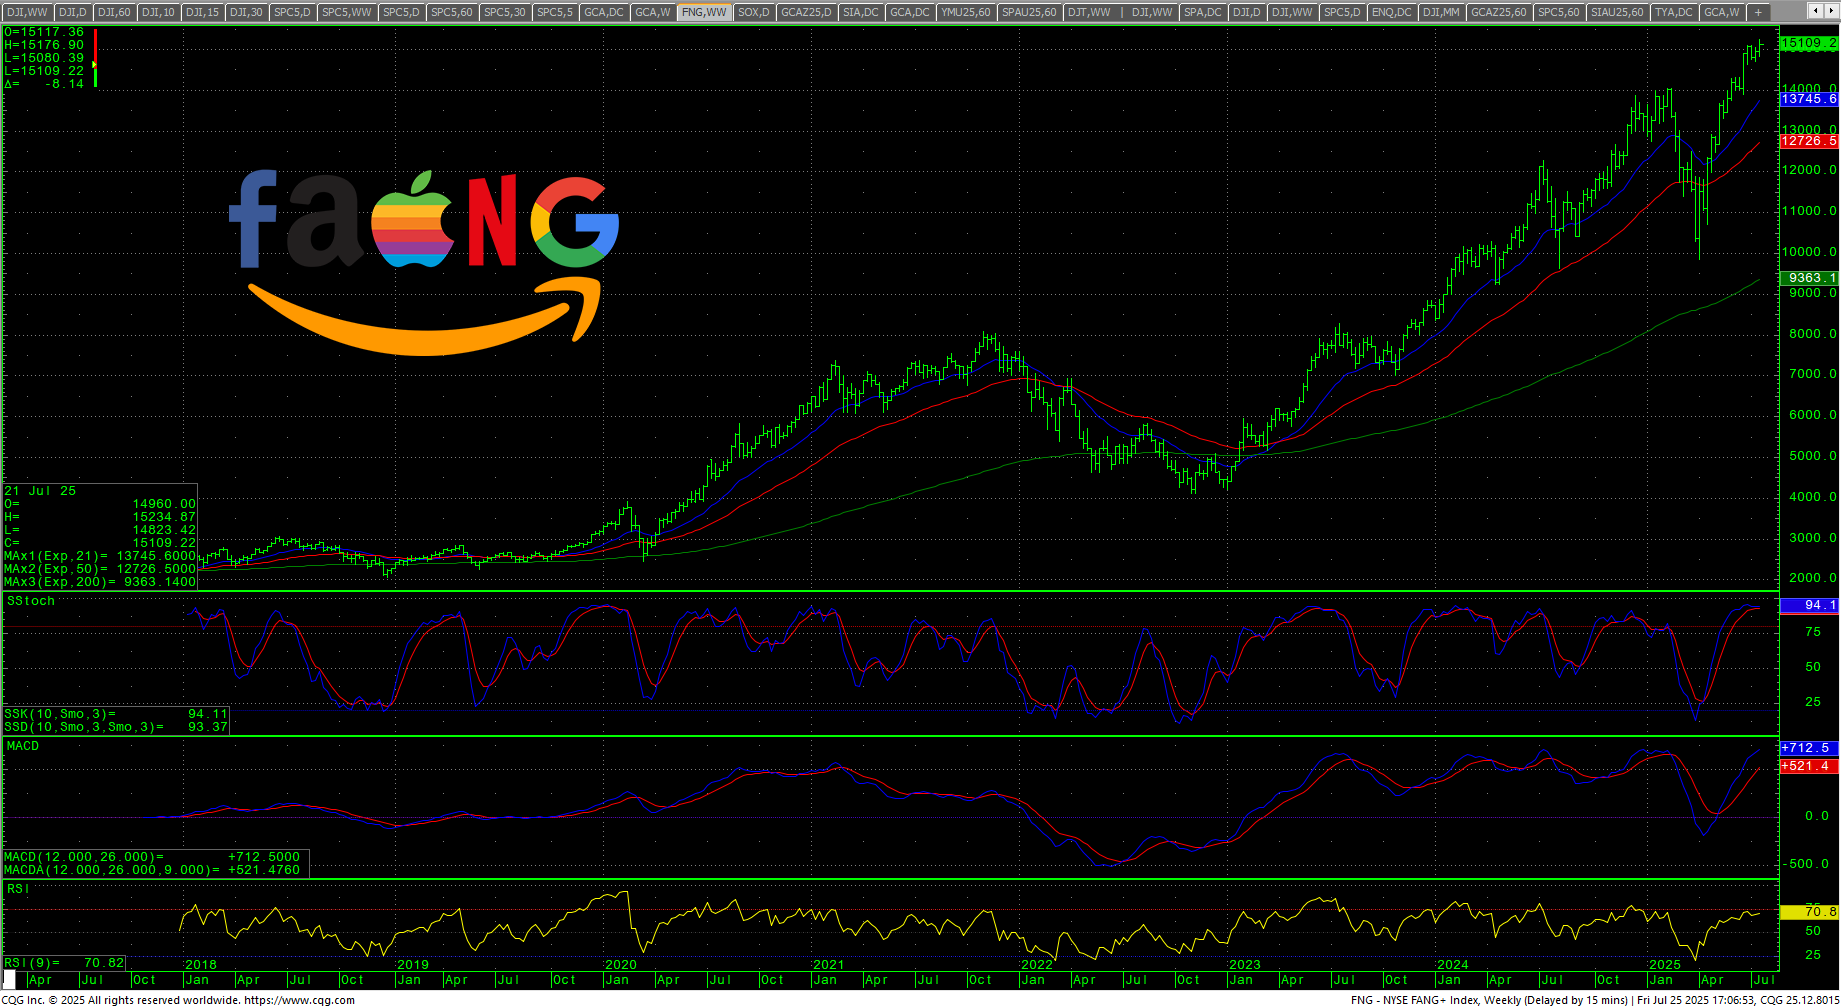
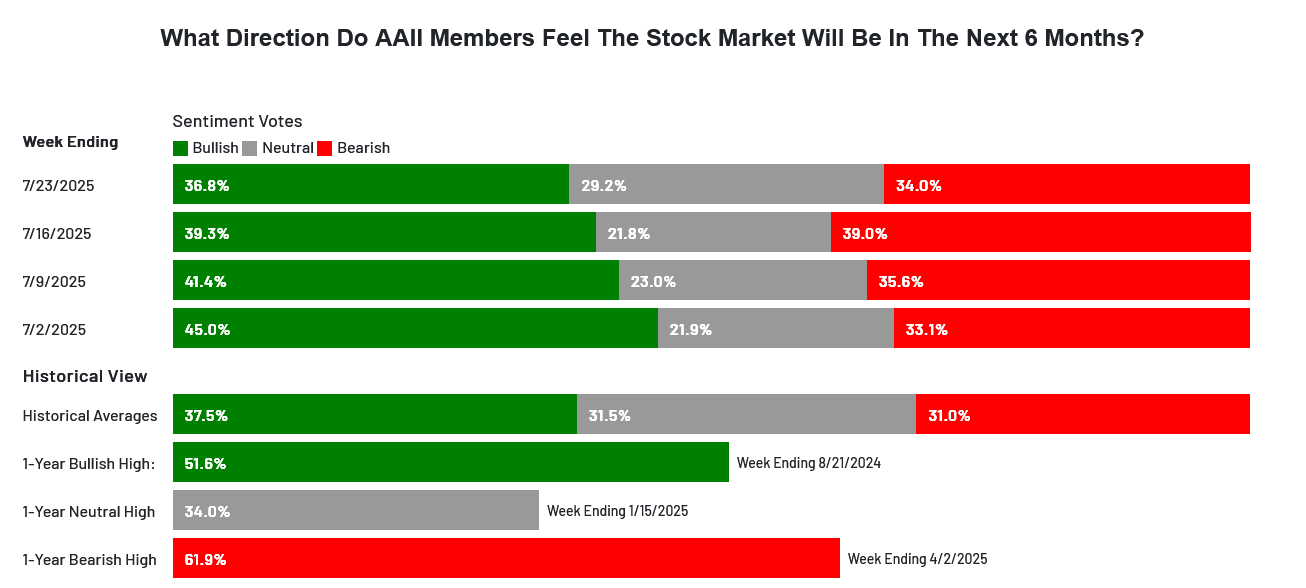 Sentiment is mostly in greed and extreme greed. The CNN Fear and Greed Index ended at 74 and reads greed and is at the highest reading in over a year. Breadth improved on the week as it tests the highest levels since Fall of 2024 and continues to read extreme greed. Latest AAII Sentiment Survey: Neutral Sentiment Returns as the bulls remain close to historical averages. The Dow A/D is testing the ATH at 6953. The VIX plunged and closed on the lows down -9.02% in the bottom end of the range as it holds near the February 2025 lows. The Put/Call closed at 0.65 and reads greed. The 52-week, A/D rose to +3.24% and reads extreme greed. The Dow closed the week up +1.26%, closing on the upper end of the range. The S&P settled up +1.46% ending on top of the range at a new weekly ATH. The Nasdaq Composite was up +1.02% and the Nasdaq 100 was up +0.90%. The NYSE FANG closed up +1.00% on the week but lower Friday and a new ATH. The Russell was up +0.94% in the top of the week’s range. The 10-year notes closed flat in the lower end of the weekly range. The yield on the 10YR declined to 4.386%.
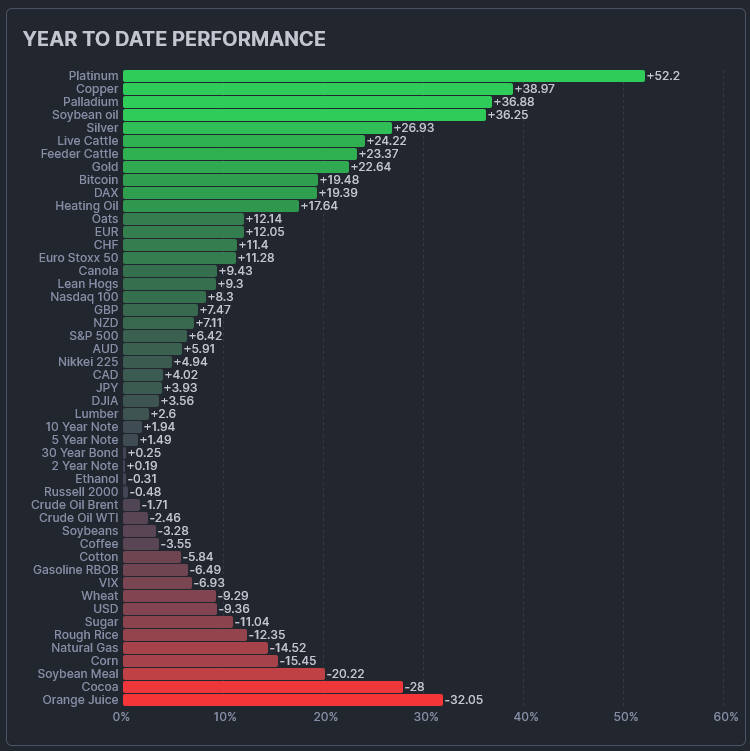
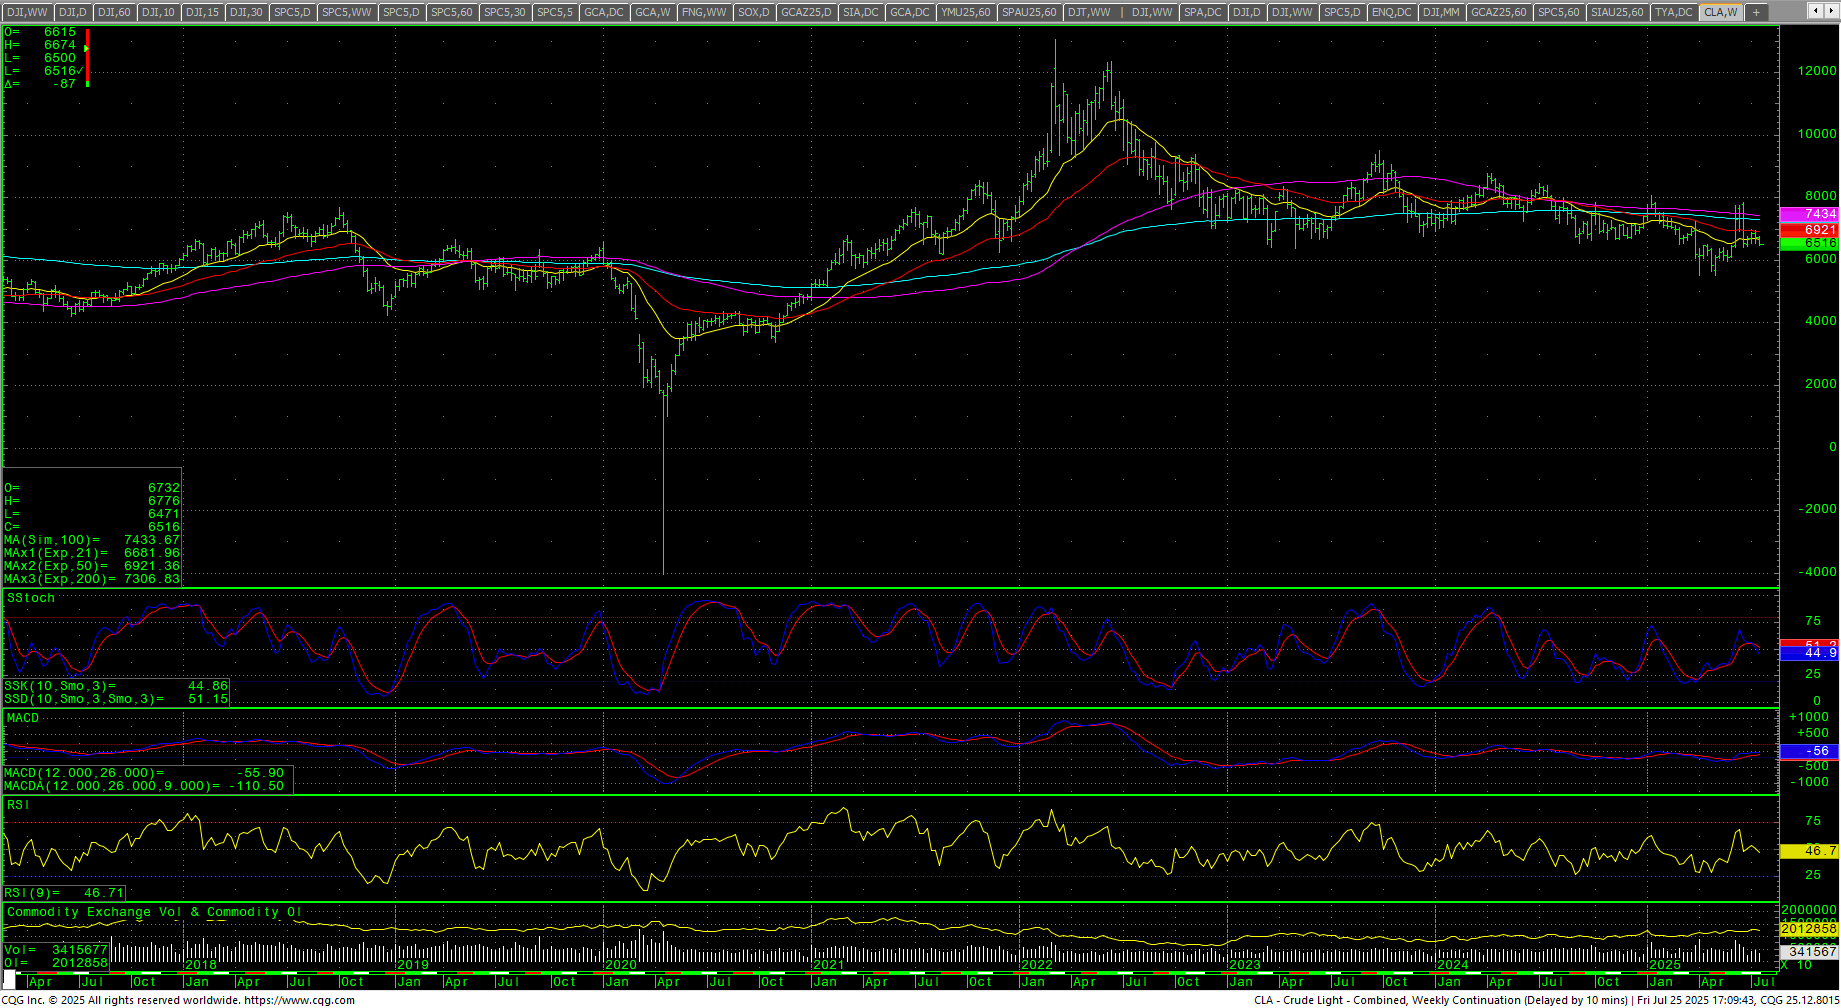
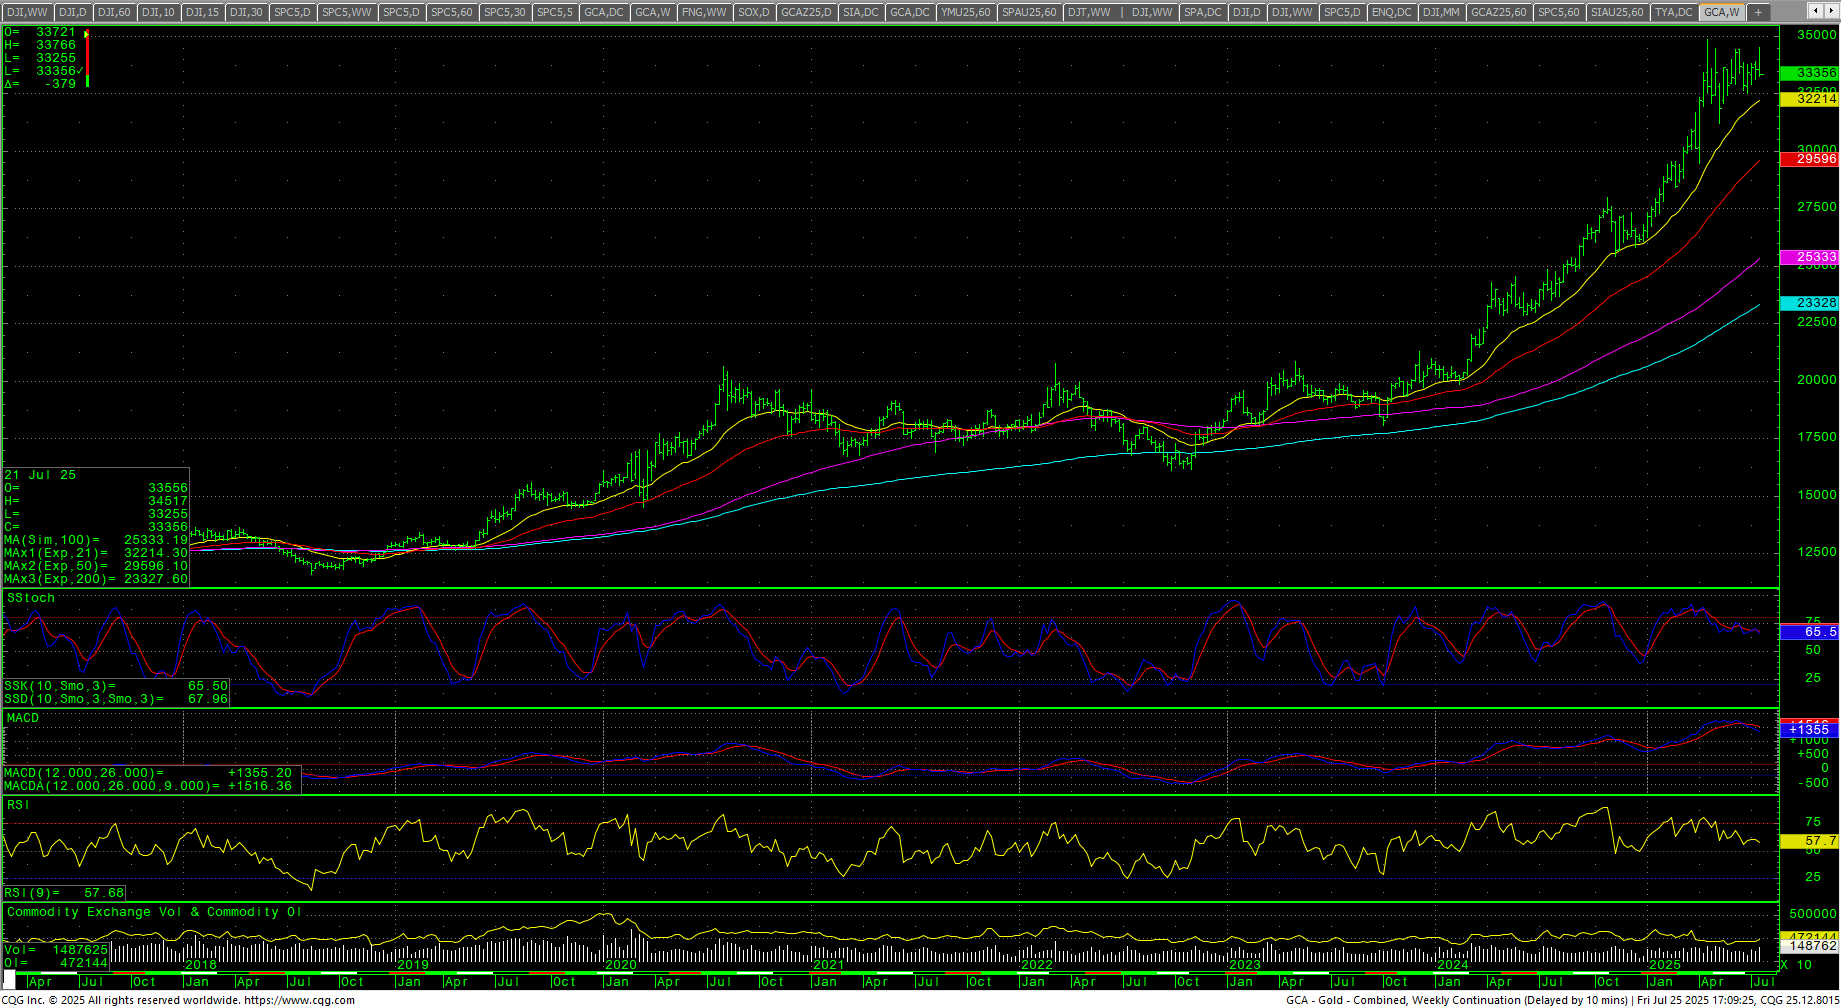
The CRB Index was up +0.50%. Crude oil closed the week lower, on the bottom of the range. Gold traded a six week high and then plunged to close on the bttom of the weekly range. The CoT for the S&P 500 saw dealers continuing to add while asset managers remain flat. Non-commercials liquidated and commercials saw slight increases. The CFTC S&P 500 Non-Commercial Net Positions ended at -168.48K which might be a sign of renewed selling in the futures. The shorts are losing.
Timing Points
Strong timing falls on 1st. Tuesday we get Balance of Trade and Consumer Confidence. Wednesday is ADP Employment preview (est +82K) and Pending Home Sales (est: +0.5%) along with Q2 GDP (est: +2.4%). Thursday is PCE (est: +0.2%, Spending +0.4%, YOY: 2.5%). Friday is the July Non-Farm Payrolls (est: +102K) along with ISM Manufacturing and Construction Spending. 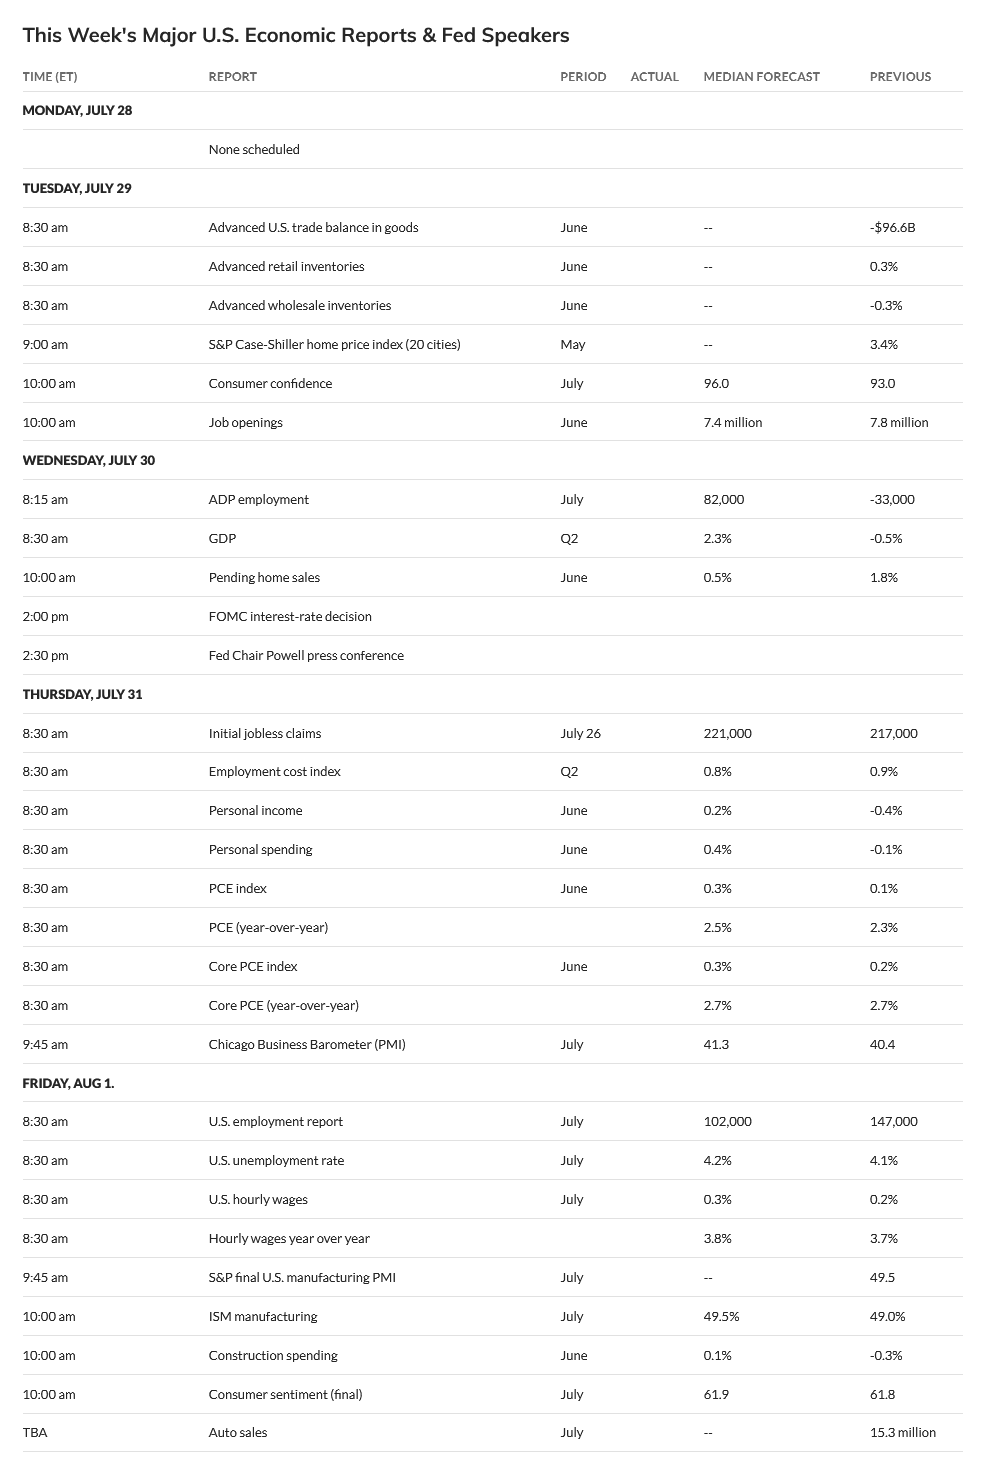
- 08/01 *** X
- 08/05 *** X kicks off critical week through
- 08/08 *** X through
- 08/11 *** X critical week
- 08/18 **
- 08/25-26 *** X
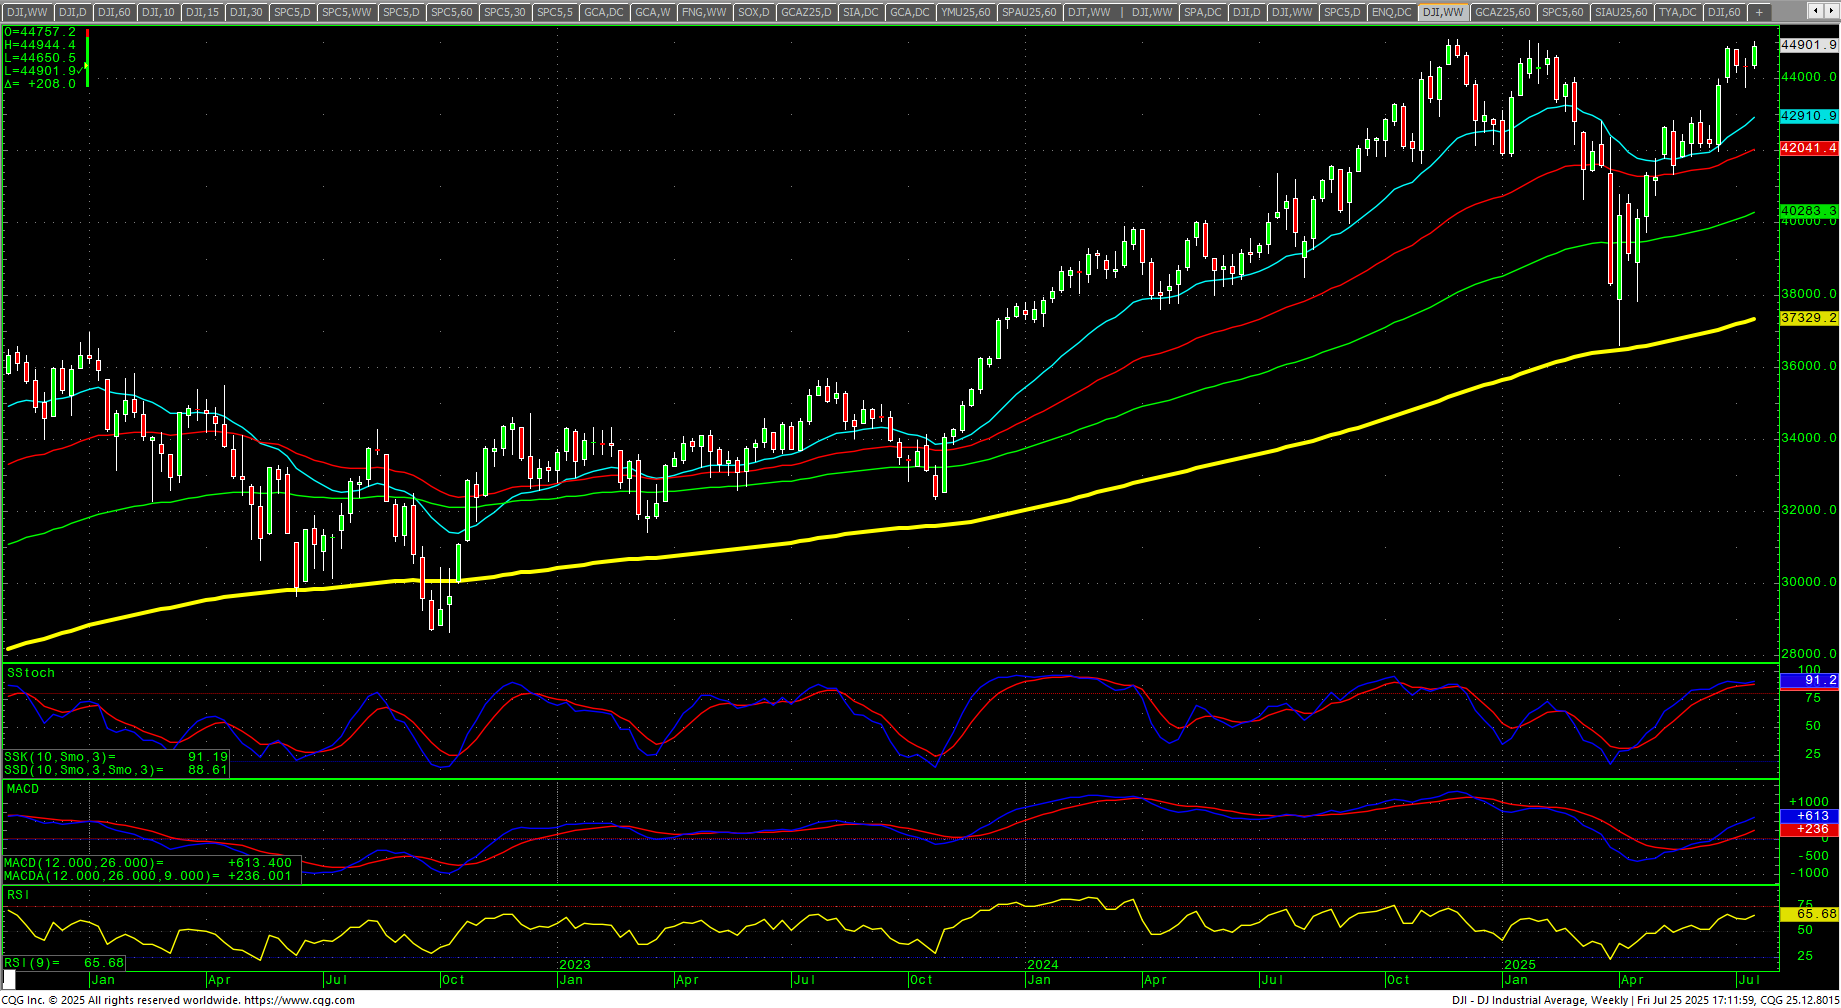
Dow Jones Industrial Average
Dow Jones Industrial Average Weekly H-L-C
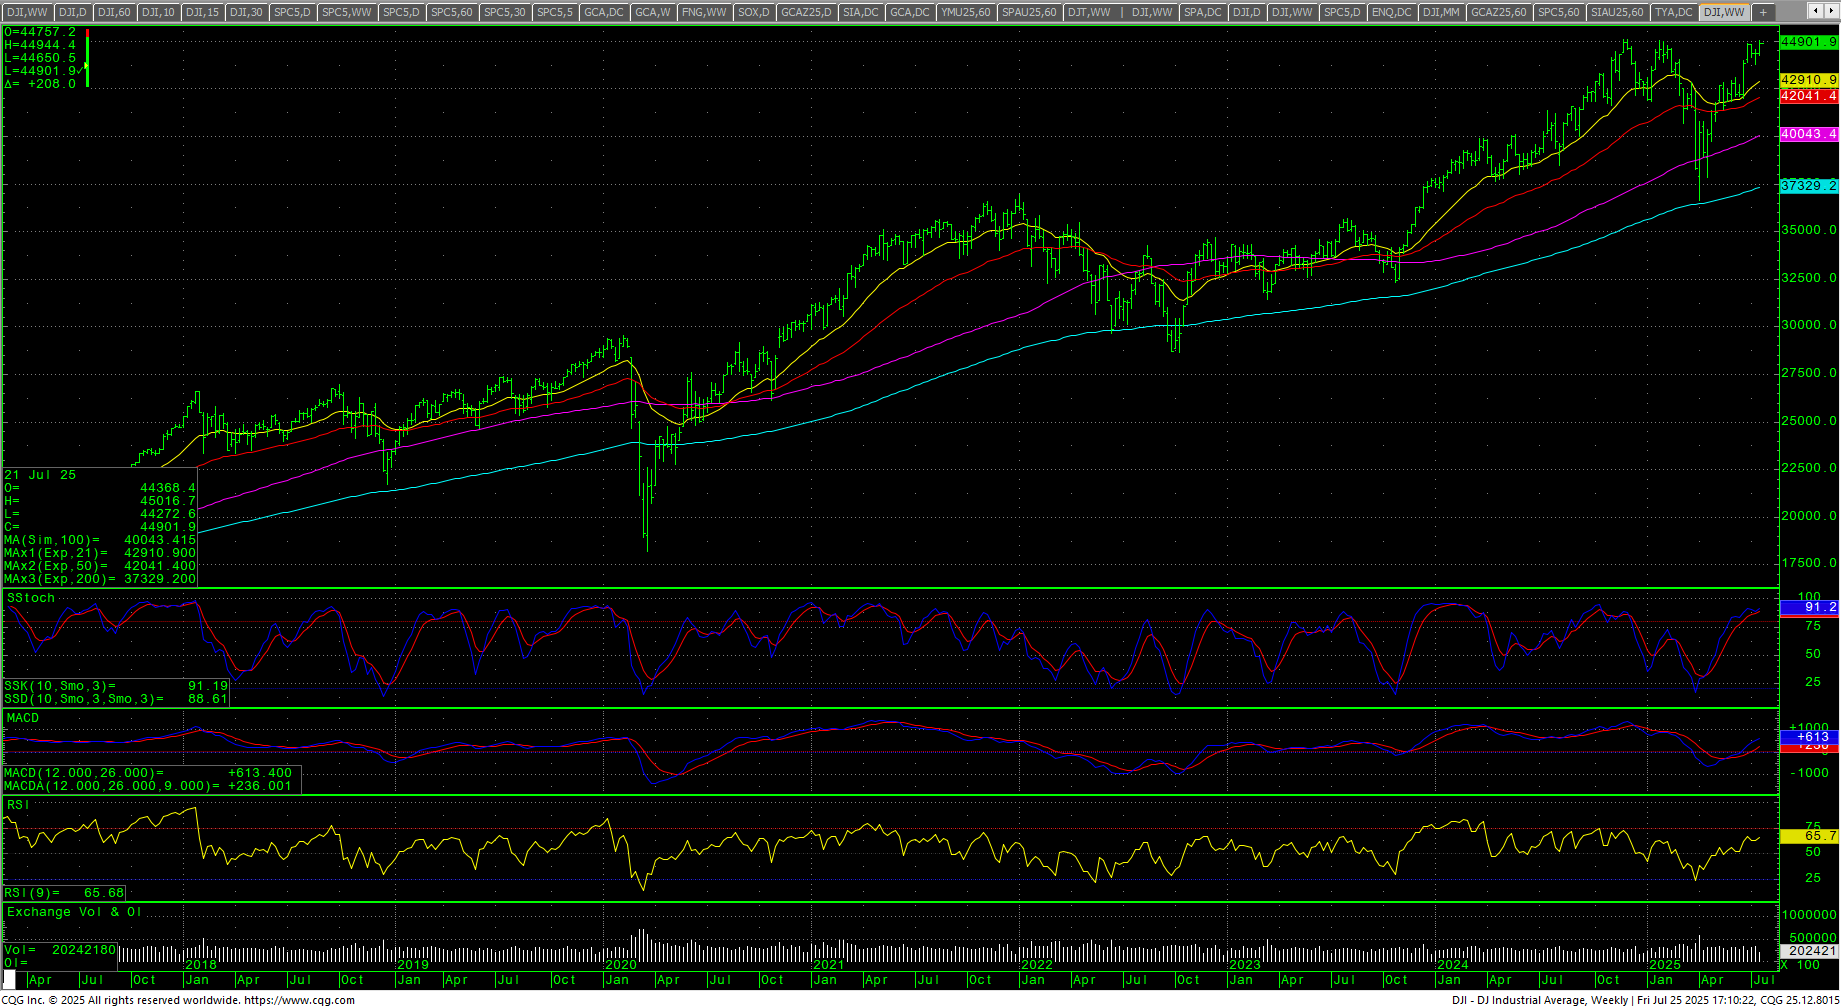 The Dow closed the week up +1.26% on the top of the range, just ticks off an ATH weekly close. Wednesday’s daily close was $4 off the 4 December 2024 record high. There are multiple divergences on the daily chart. The weekly stochastics are still in an uptrend but have reached overbought numbers. The weekly candle is bullish. The MACD is diverging. The RSI is 63.7. The 200-day MA starts the week at 42293.30 and is into record highs. The number stay basically the same for the DJIA.
Dow Jones Industrial Average Hourly H-L-C
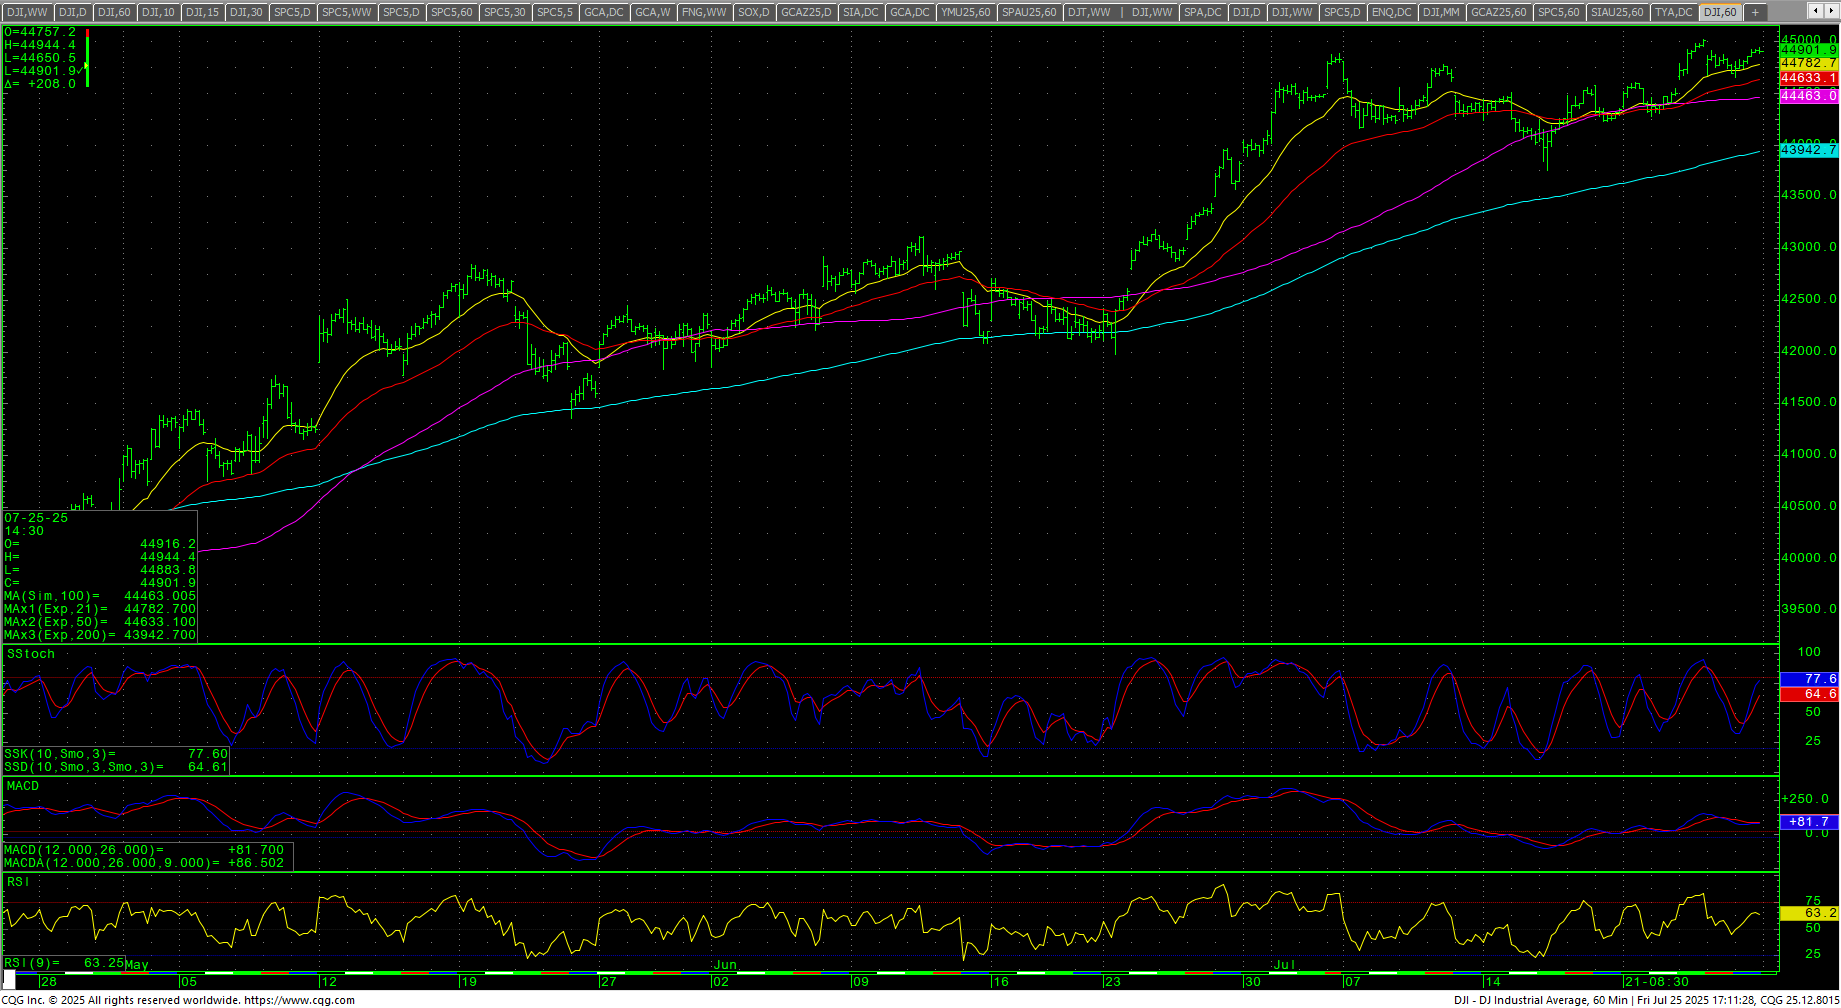 The hourly is neutral on Friday’s close. Resistance is 44925/44930. A further drive above 44930 sets up 45014/45016 with a shot at the all-time highs at 45050/45054/45074. Closes over 45074 opens counts toward 45244 and 45426/45450 (Fibonacci target) and resistance at 45306 and 45378. Rallies with closes over 45450 will reopen longer-term monthly targets in the 47400 level with targets of 46568 and 46954.
Dow Jones Industrial Average Daily Candles
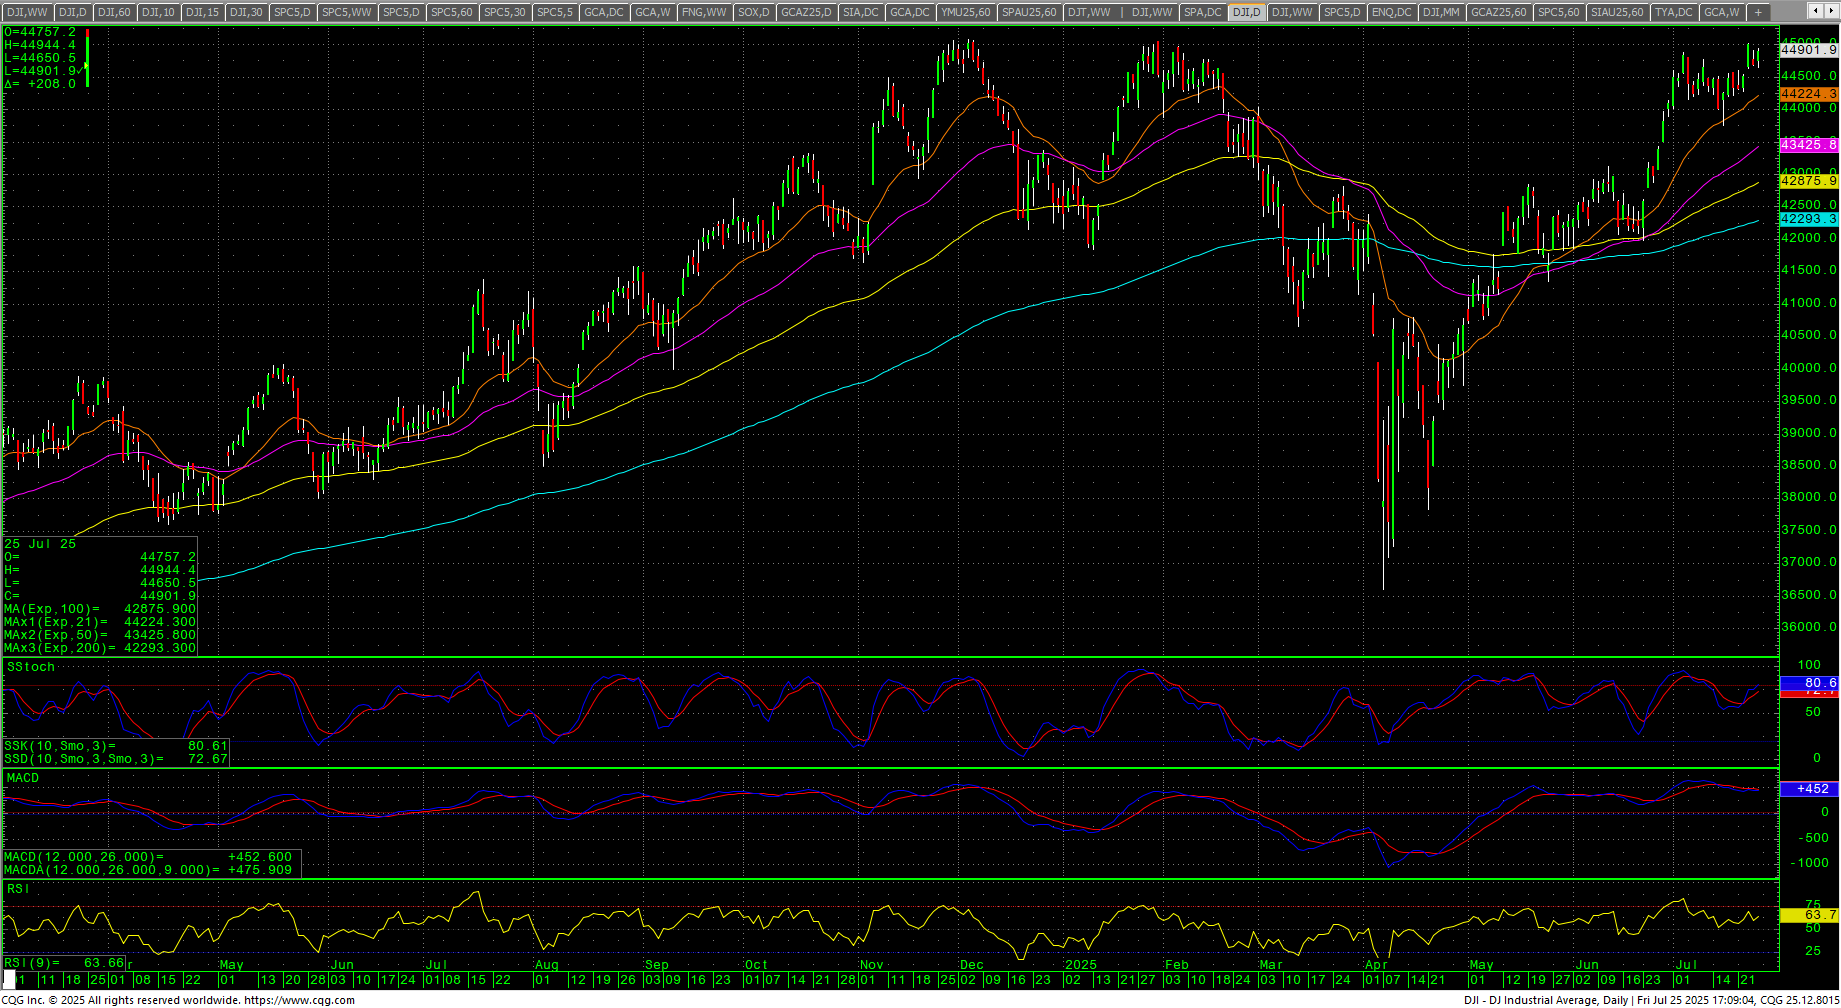 Support is 44719 and 44536. A breakdown under 44542/44536 should test 44387 with pivotal support at 44239/44235. A breakdown under 44235 should test 44055 and 43857 with counts to near-term pivotal support at 43773/43759. Closes under 43759 should test 43498 with counts to critical near-term support at 43140/43135. Closes under 43135 should minimally test 42740. A breakdown under the 42740 area will set up 41805. Under 41805 sets up 41486 with counts to support of 40814.
| Resistance | Support |
|
|
S&P 500 Cash Index: SPX
S&P 500 Index Weekly H-L-C
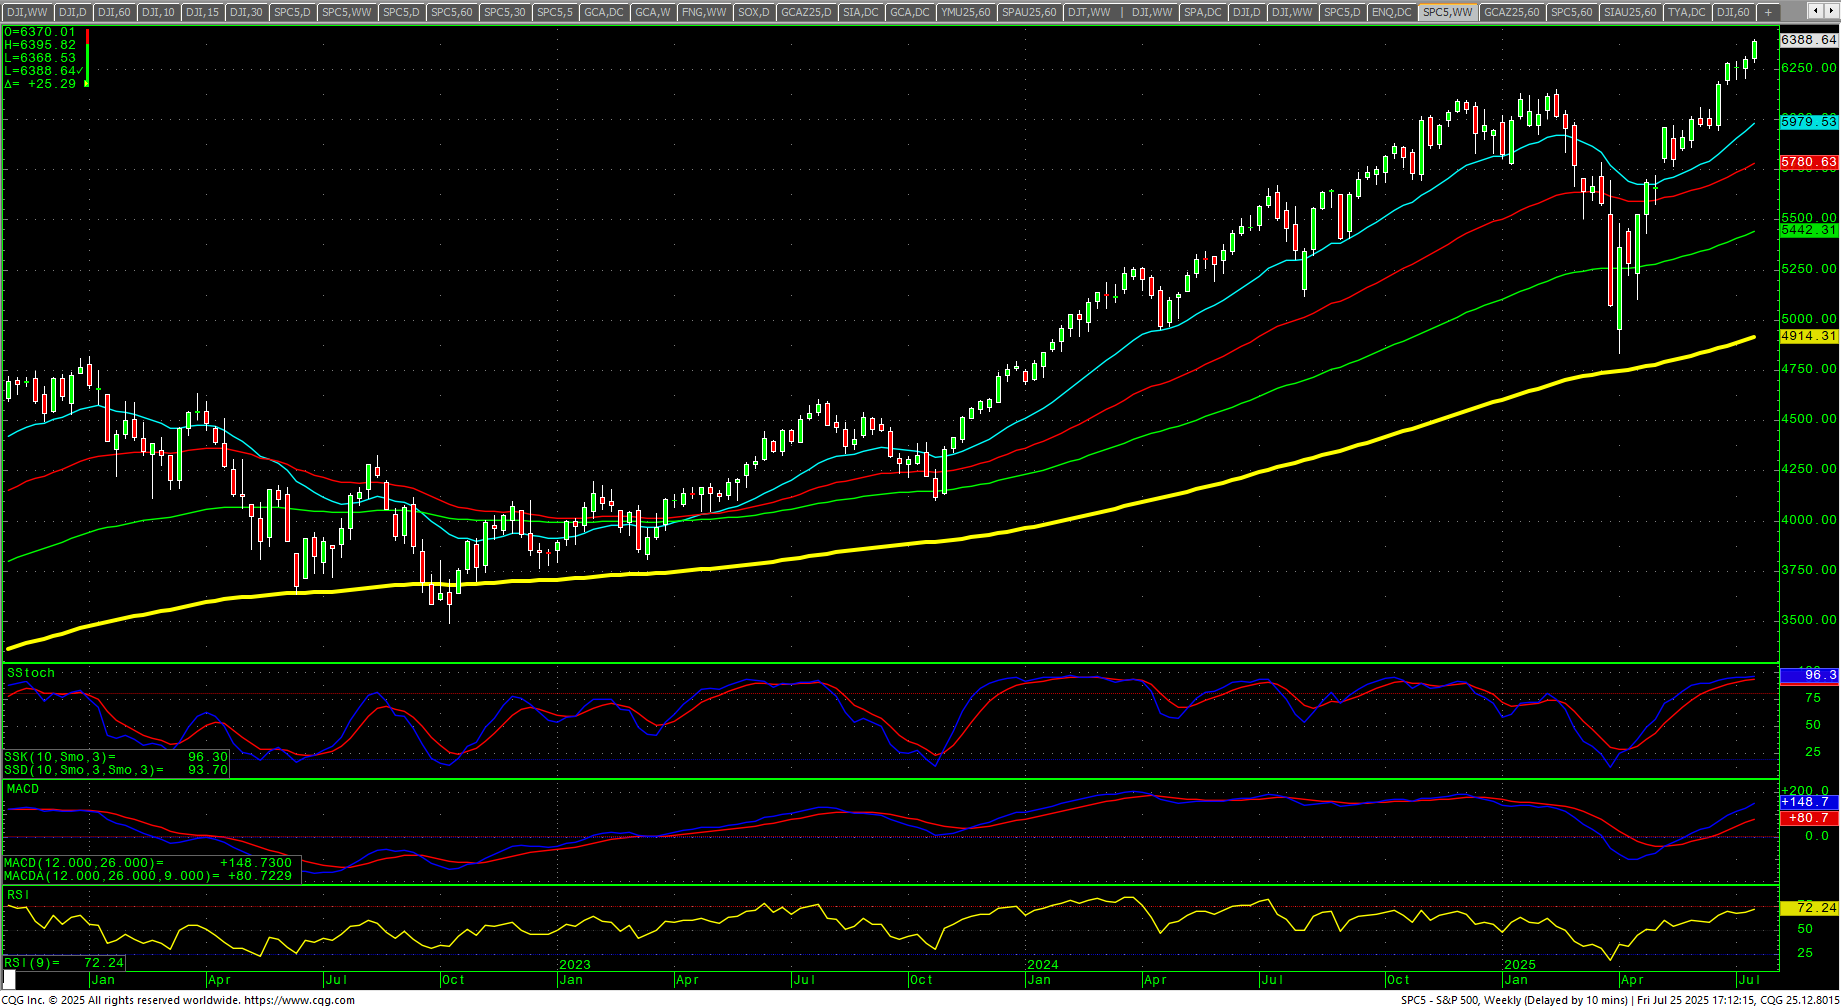
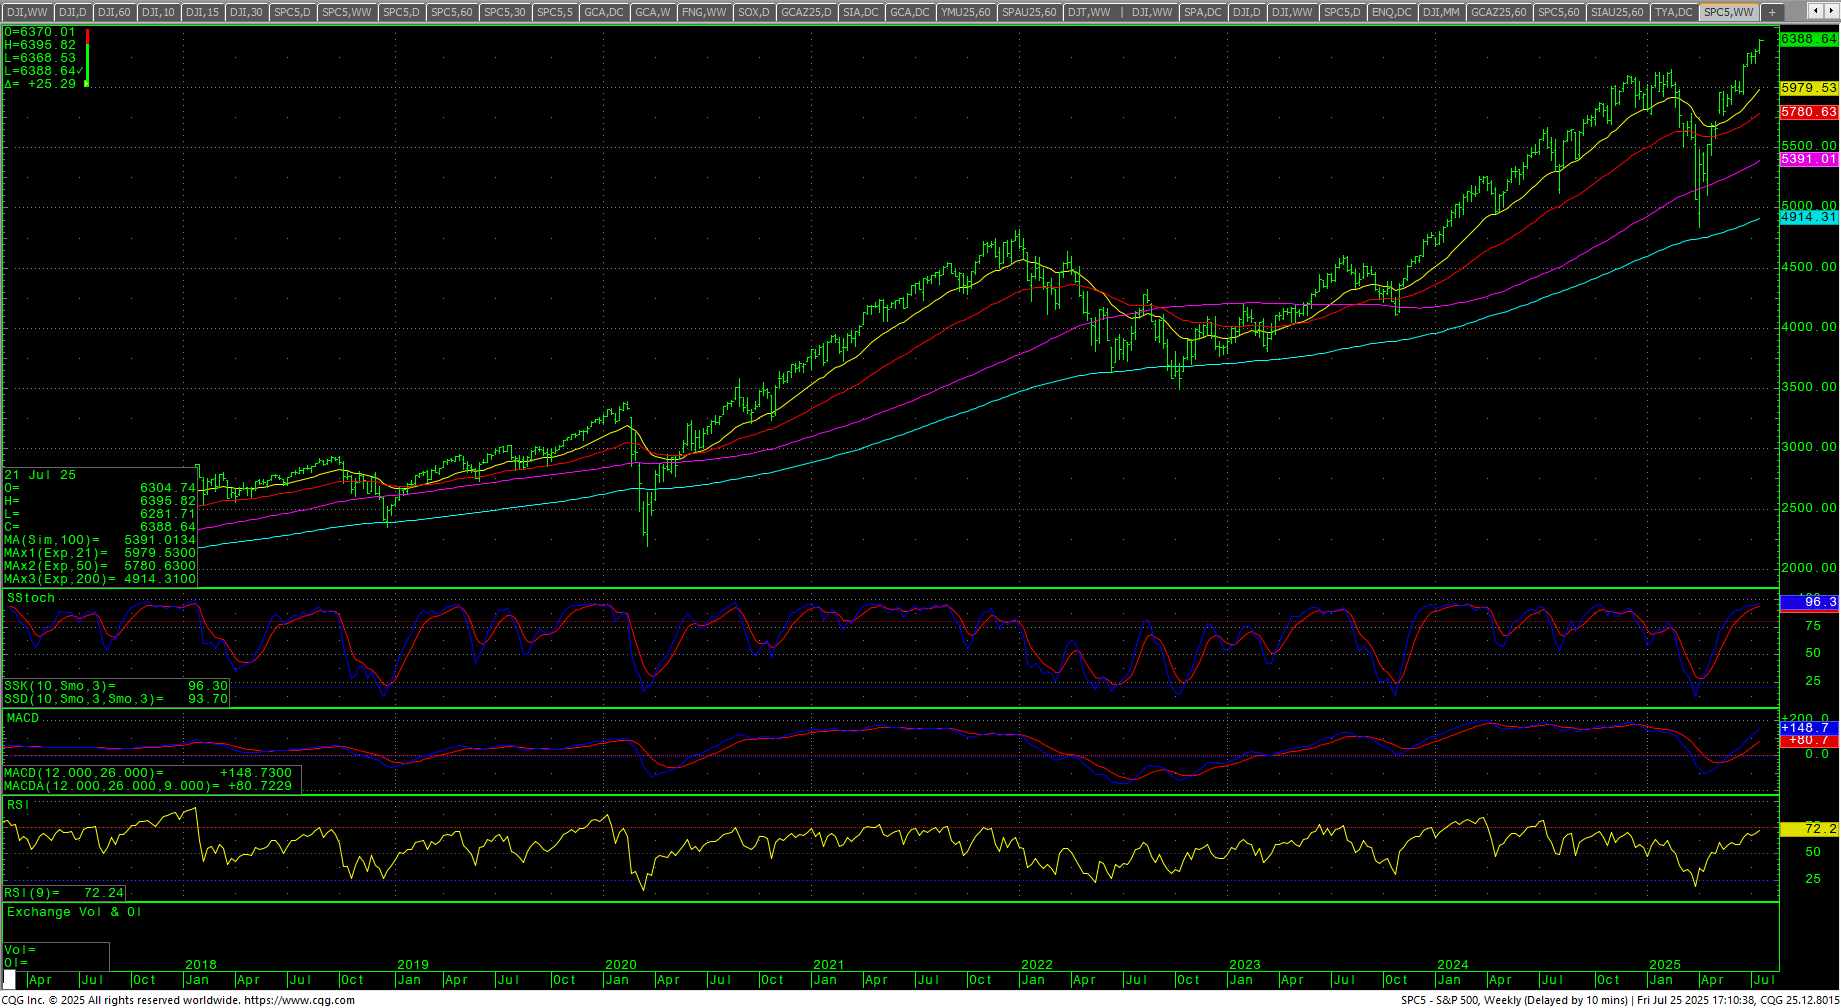 The S&P keeps on trucking, as the lure of the 6400 call-wall kept positive gamma short-term traders piling into the index and ETFs. As outlined above, sentiment and speculative fever have hit extreme levels. The daily chart is up with multiple divergences and is severely overbought. The weekly is extremely overbought but still in an uptrend. The index is at ATHs. The hourly is overbought on Friday’s close. The 200-day MA is 5828.03 and is trending higher as it sets a record high. All moving averages are also at record highs. The SPY took out the massive trendline overhead on Friday and closed above this level.
SPY Daily Candles
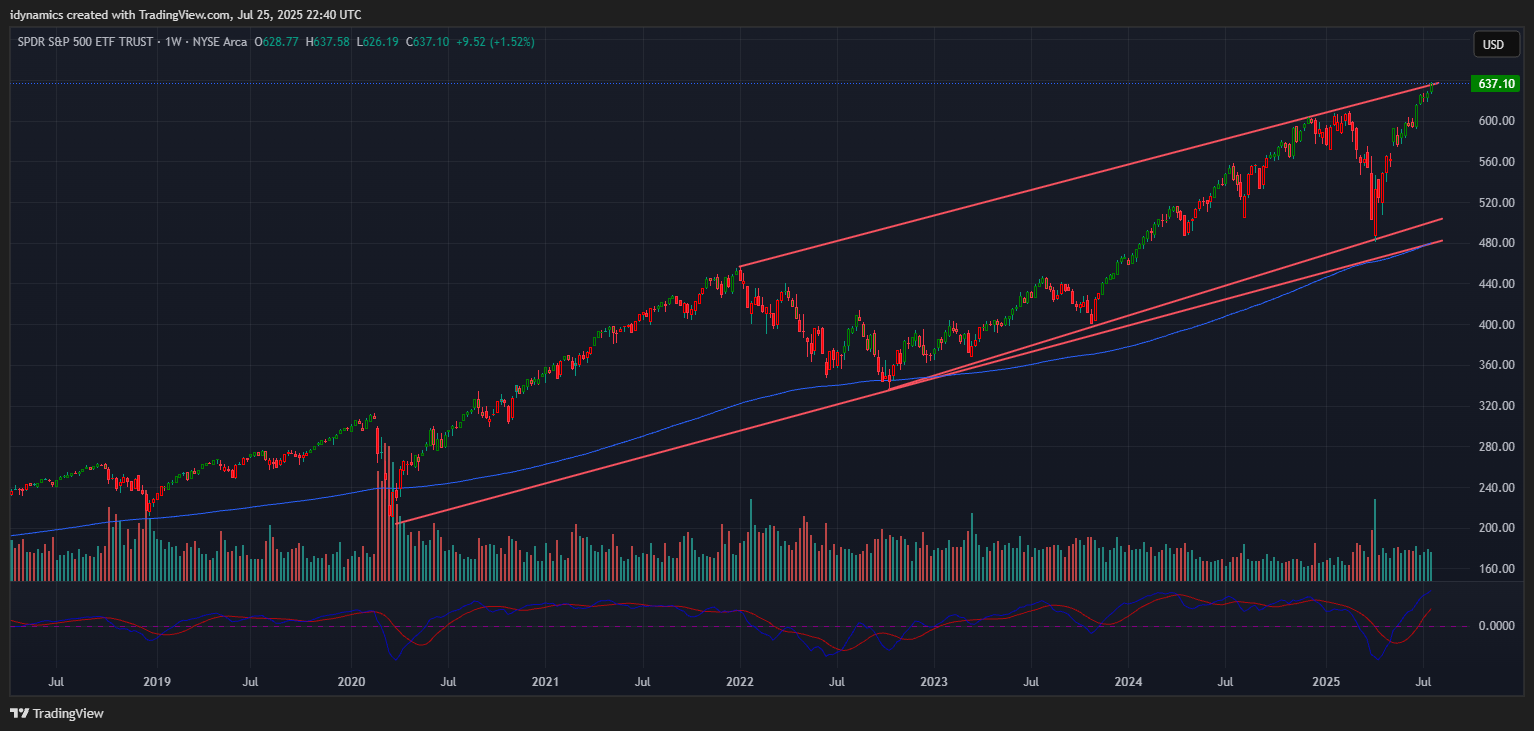 Prices closed just above a key level at 6386 and is on track to test a critical level in the 6440 area. Closes over 6440 will open counts to 6584 and resistance at 6494. A breakout over 6584 sets up 6638 and 6692. A breakout with closes over 6692 sets up 6764 and 6800. Closes over 6800 can carry to 6872 and 6908. Closes over 6908 have counts to 6944 and 6980.
S&P 500 Index Hourly H-L-C
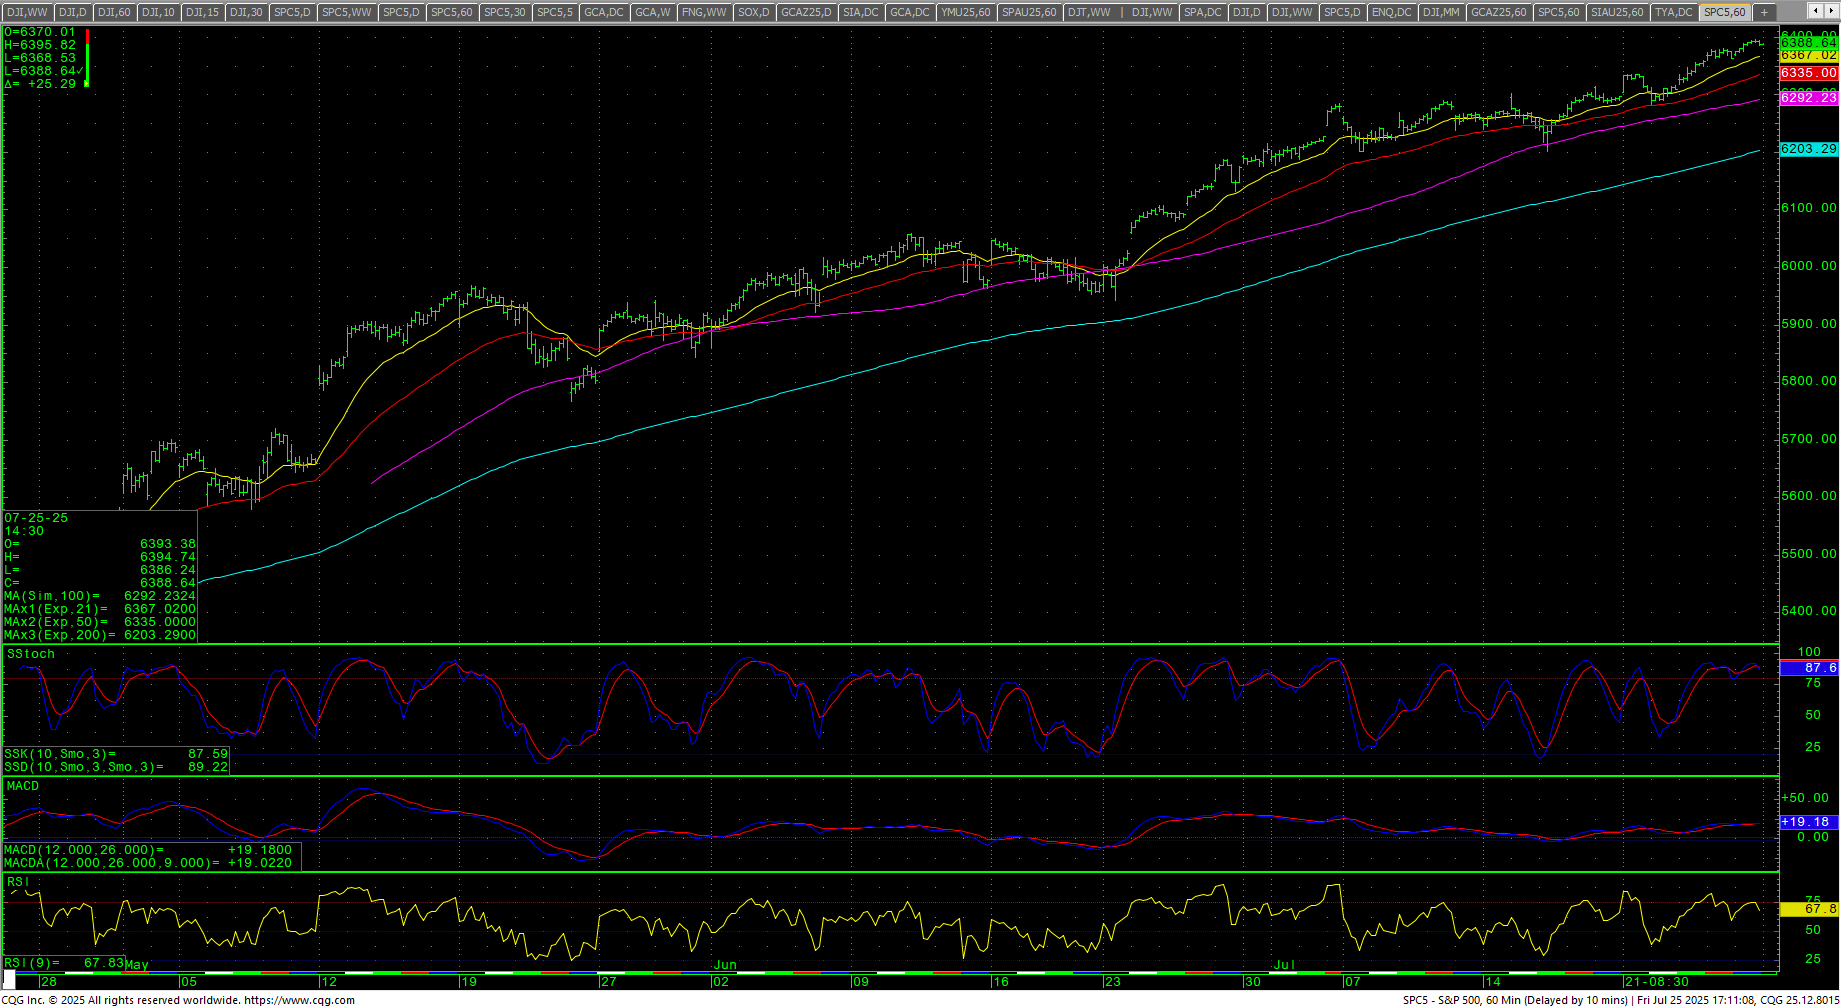 Support short-term is 6368 and 6352/6349. A move under 6349 should test 6338 and 6325/6323. Under 6323 should test 6298 with potential to 6276/6274. Closes under 6274 are bearish to 6247 with potential to test the hourly double bottom at 6201/6200 with full potential to 6156/6155. Closes under 6155 set up. A breakdown under 6080 sets up critical near-term support at 6007/6005. Daily closes under 6005 are bearish to 5924/5915. Closes under 5915 open counts to 5710.
| Resistance | Support |
|
|
Charts courtesy of CQG, Inc., CNN, Koyfin, Trading View and AAII