
TECHNICAL ANALYSIS (by Intraday Dynamics)
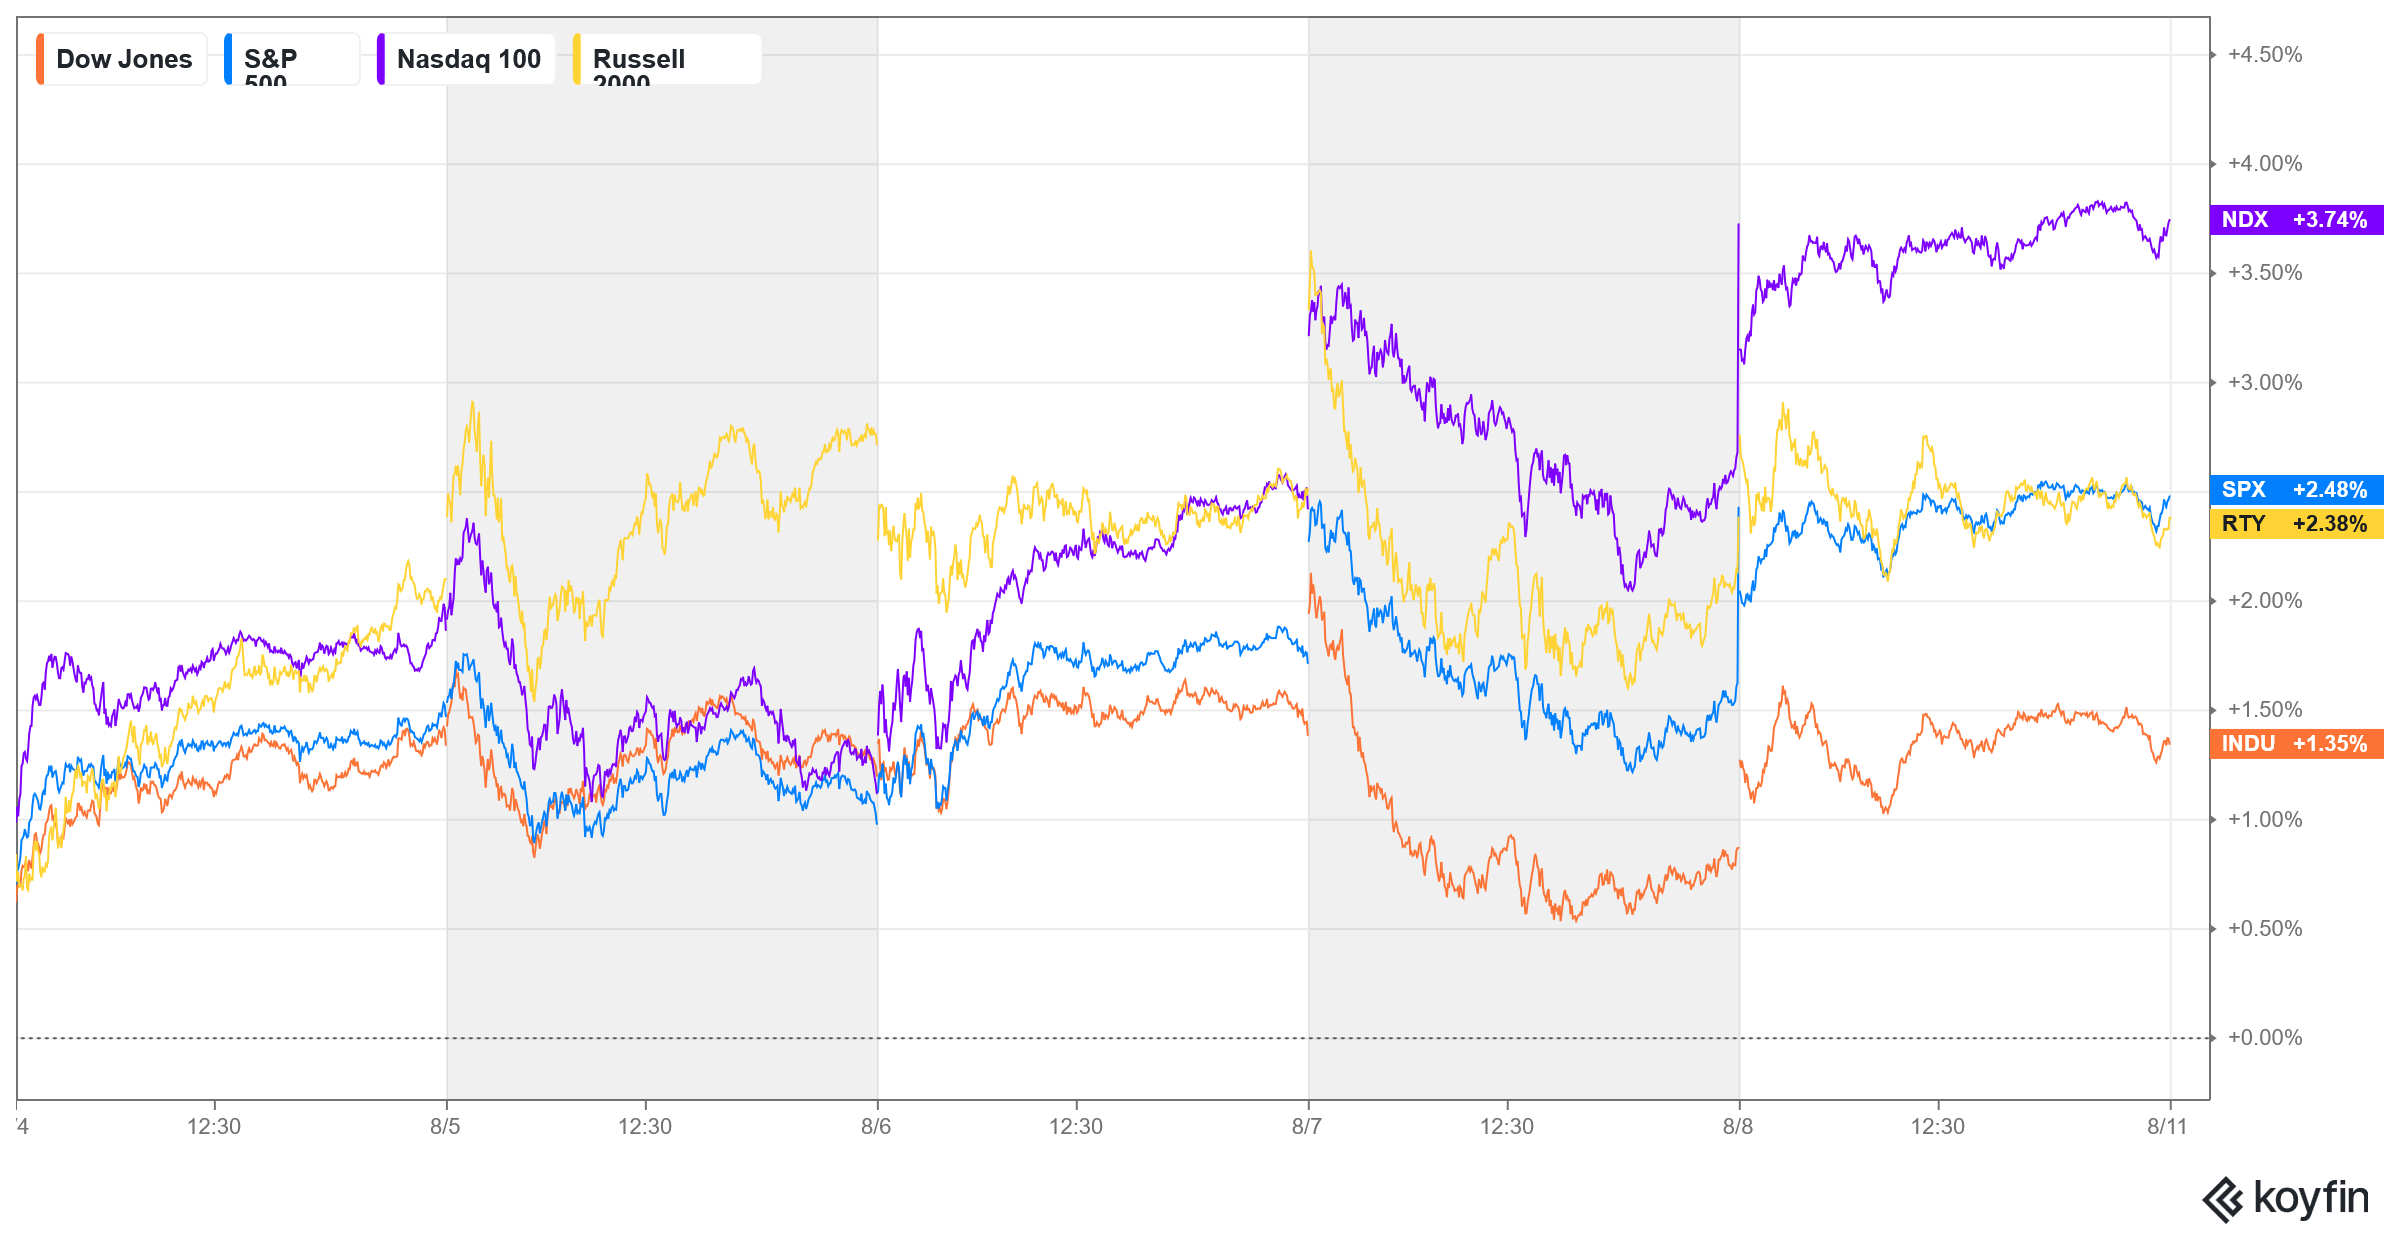
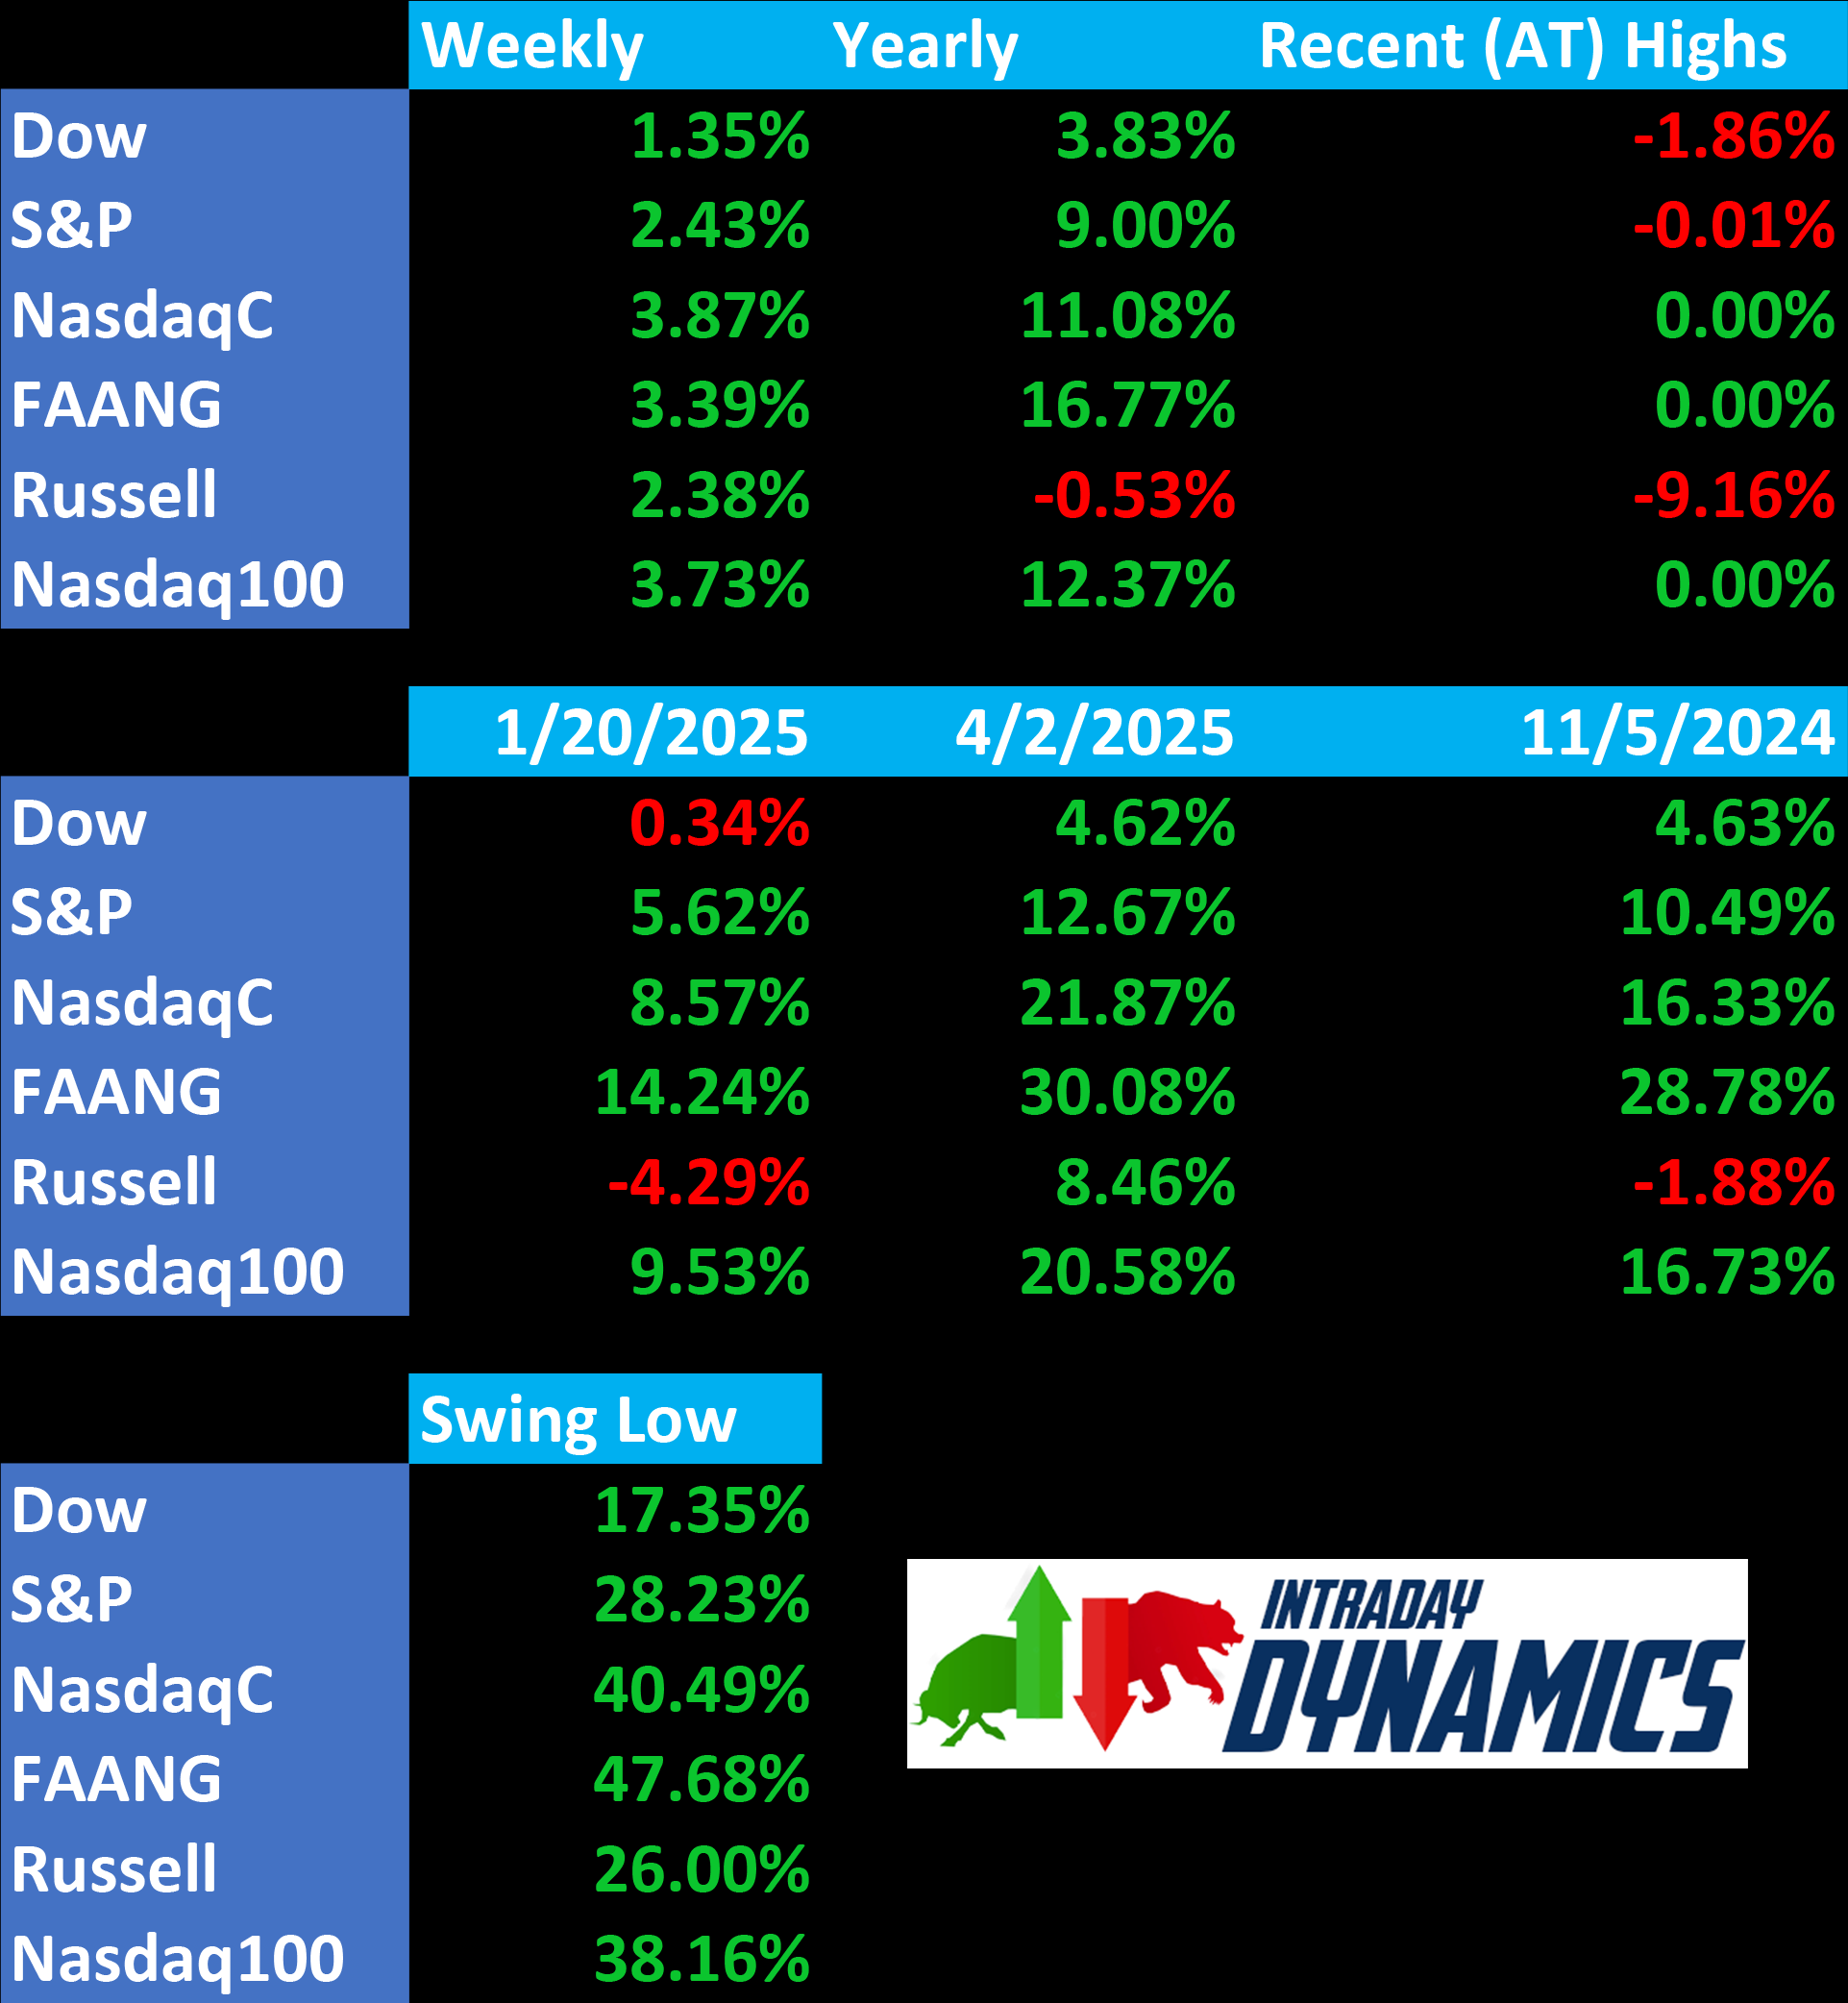
Major Indices Week of August 8, 2025
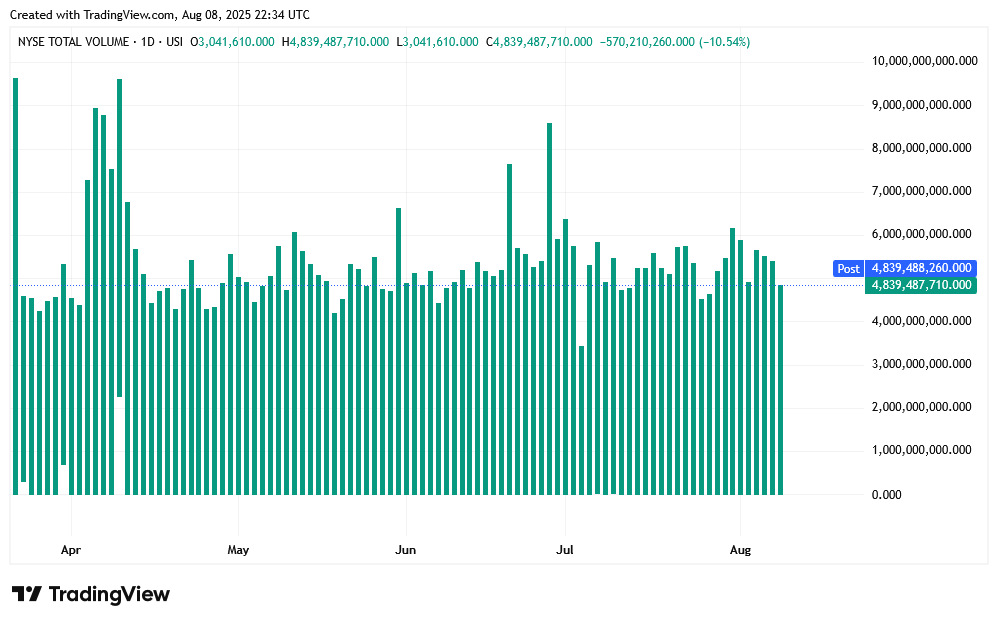
 NYSE Volume
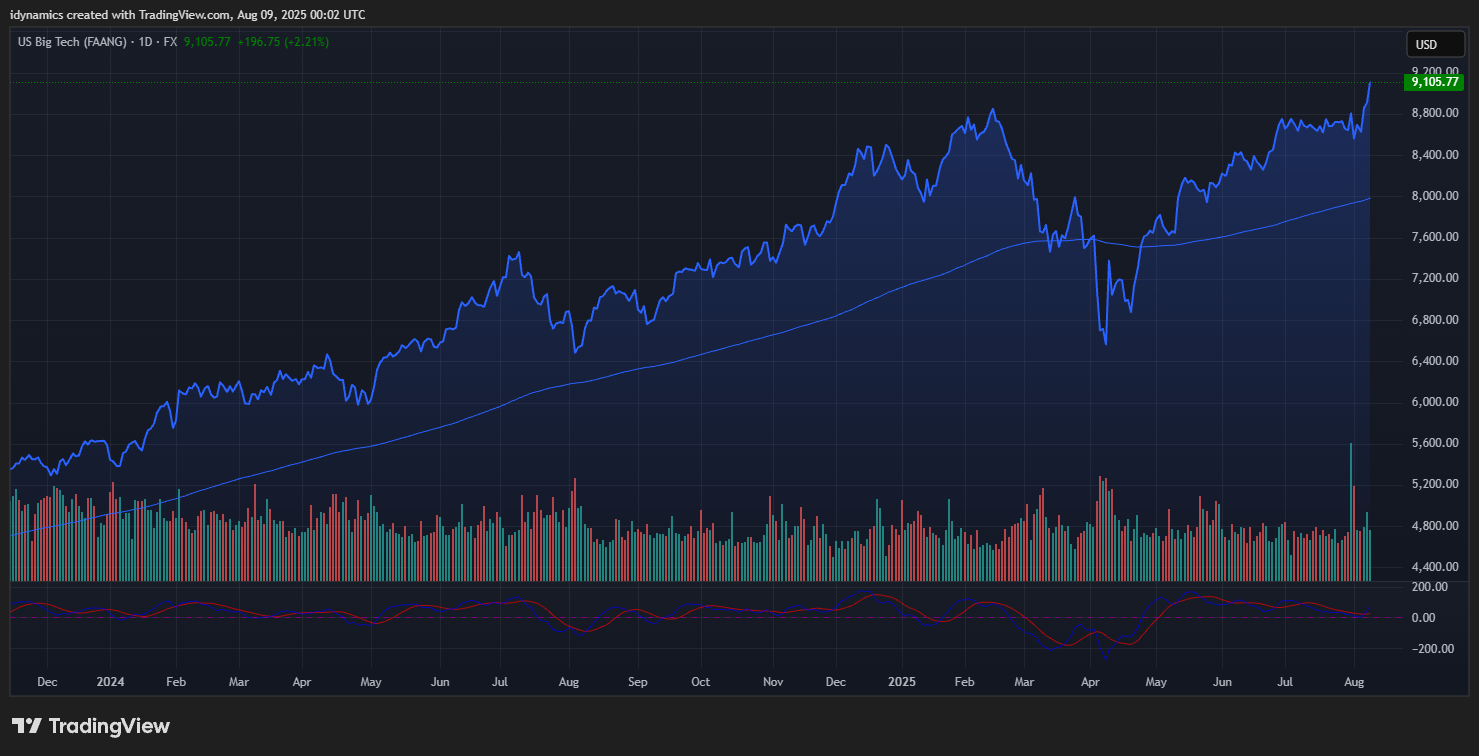
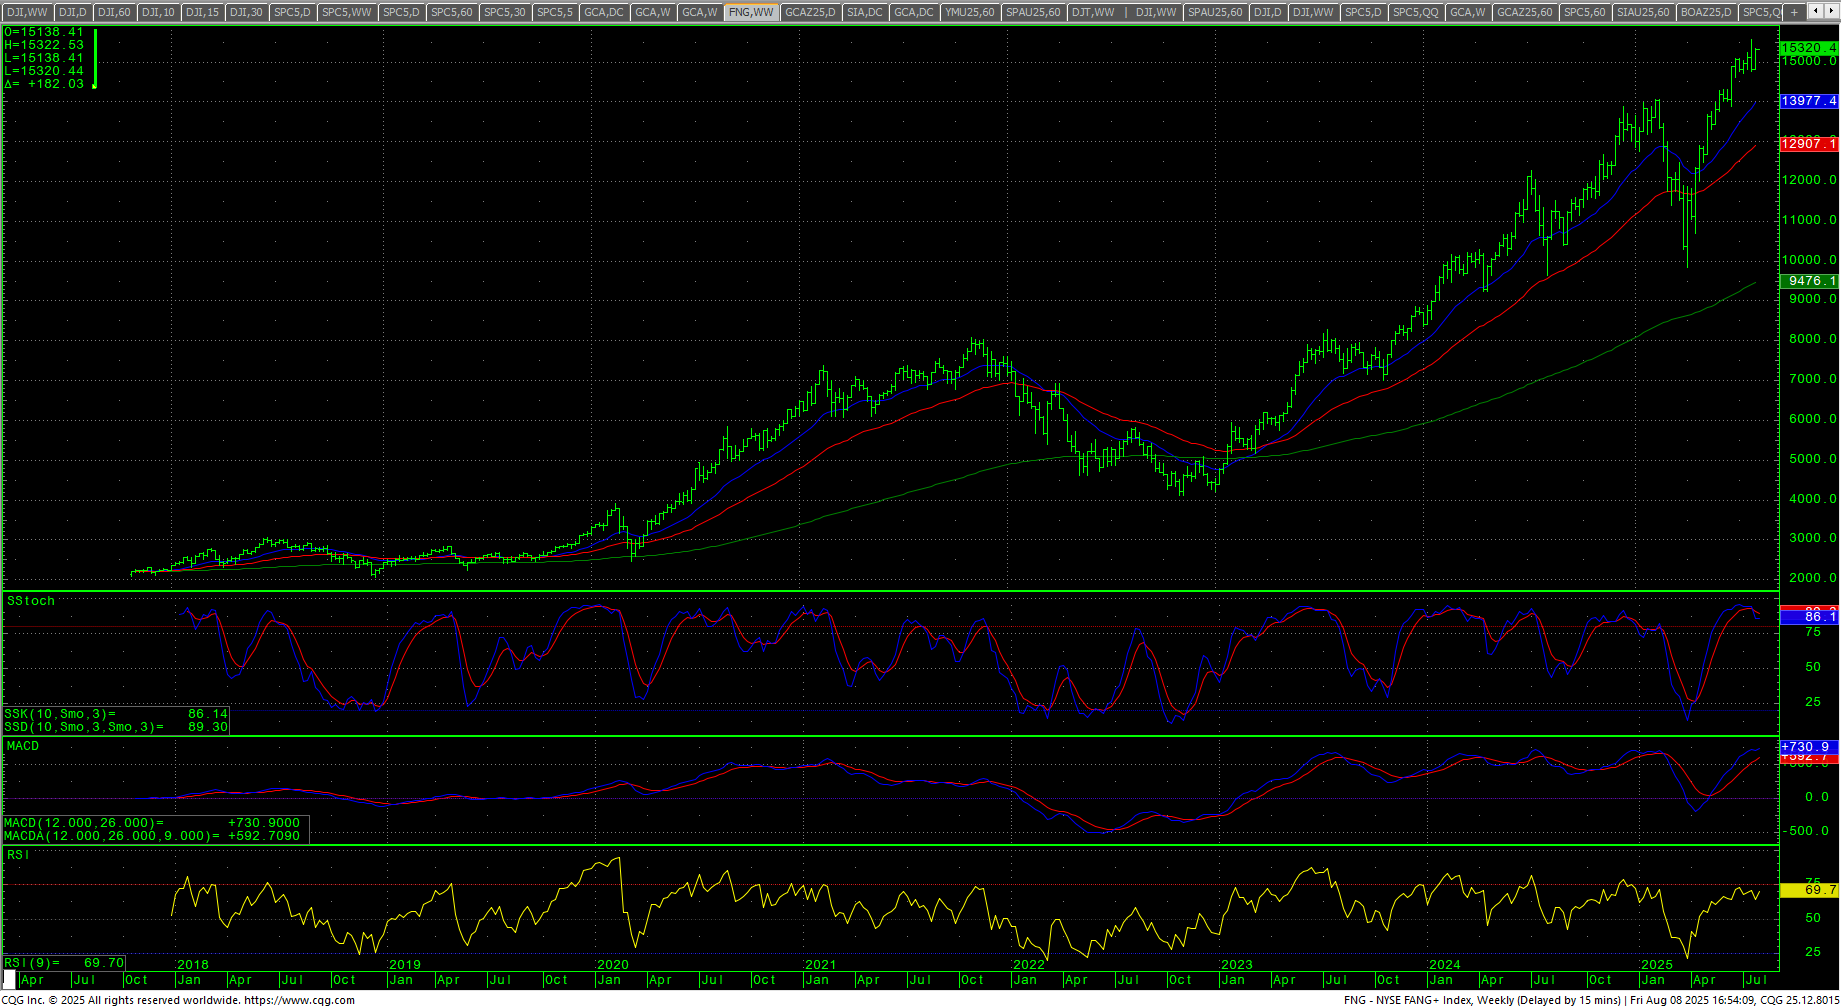
U.S. Big Tech FAANG
As goes tech, so goes the market. Stocks rebounded from the previous week’s reversals and many indexes moved to new ATHs including the SPX. Tech continues to lead the way as volume is declining while sentiment moved back towards greed and complacency sets in with the VIX plunging on the week. This is a seasonal period for volatility. This week is an extremely critical cycle week for the markets.
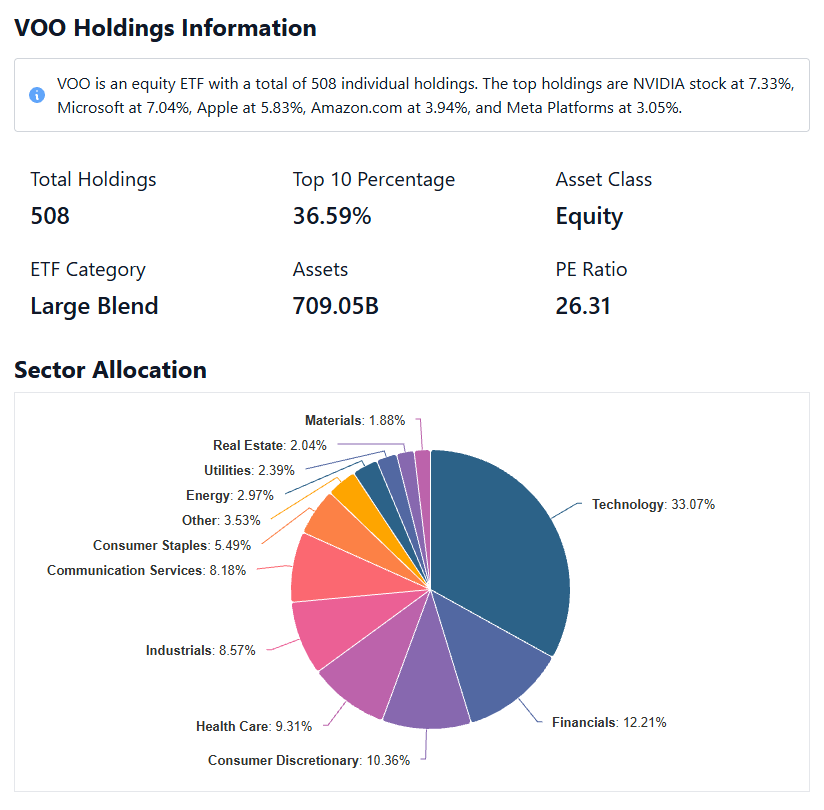
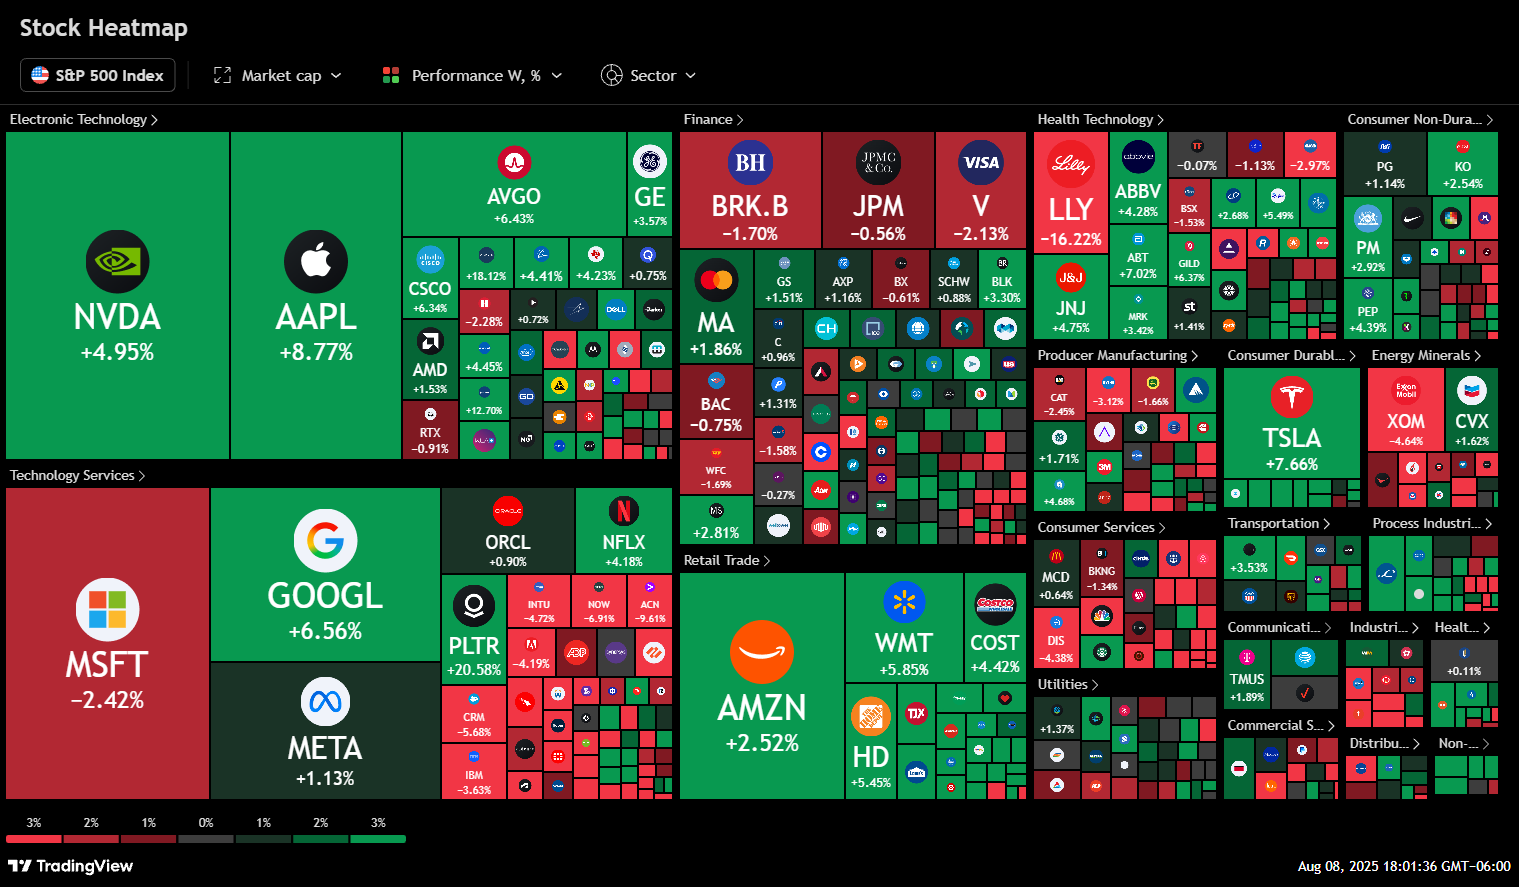 The reality is that Microsoft and Nvidia combined now account for about 15%+ of the entire VOO. Tech is leading the way and is being driven by retail traders. Meme stocks continue to soar which indicates that the froth has not reached super bubbly yet. As long as the tech sector continues to dominate, there is no reason to worry.
Yes, tariffs are in effect now and breadth is questionable with only a handful of super large companies comprising the bullishness of the market. The broad market continues to outperform the secondaries and economic data looks sketchy. Right now, there is no fat lady singing.
Remember in the last Cycle Timing Update, I pointed out that the parallel to 1987 is very real…and, in that year, prices moved higher into late August and then started a correction. If we are truly rhyming, this may be the case for 2025.
The reality is that we are now entering a 6-9 month window of extremely volatile longer-term cycles. August is when things really heat up with the cycles. The Dog Days of summer are directly ahead. August is a month where there is strong potential for an exogenous event to occur.
SPX Daily Candles
 Calls are all over the place right now, but the market still seems to be in strong hands. One item of note, with the VIX crashing last week, there are several funds loading up on the VIX in anticipation of the increased seasonal volatility.
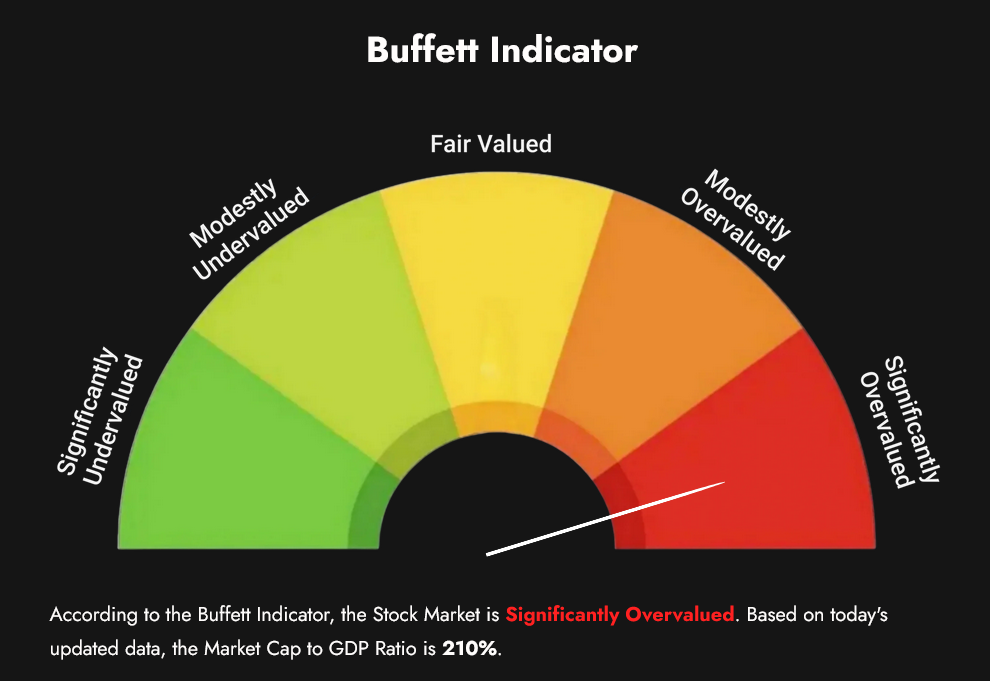 The Buffet Indicator moved back up to +210.0%, just under the record high set two weeks ago.
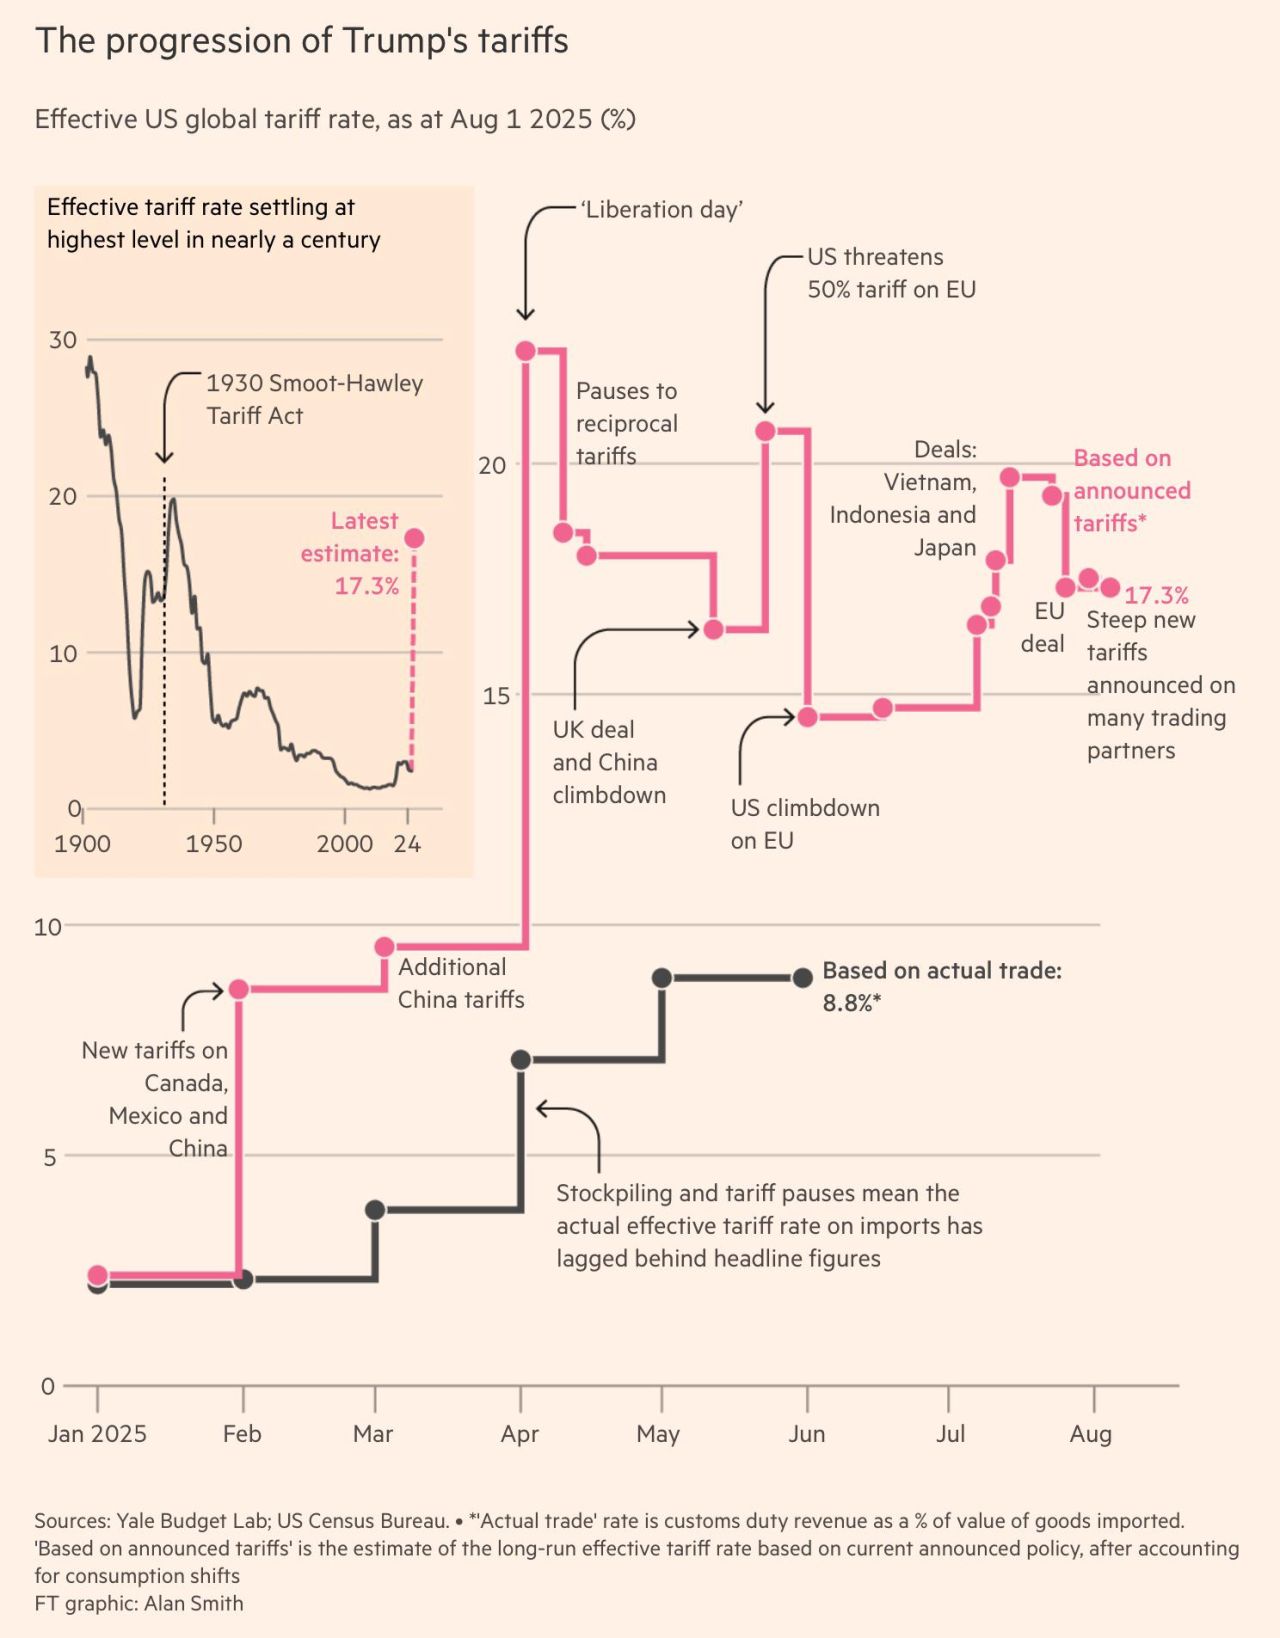 Tariff Man has been all over the map. There are 48 changes in the tariff winds since the beginning of the year. Forty Eight!
S&P 500 Stocks Above the 200-day MA
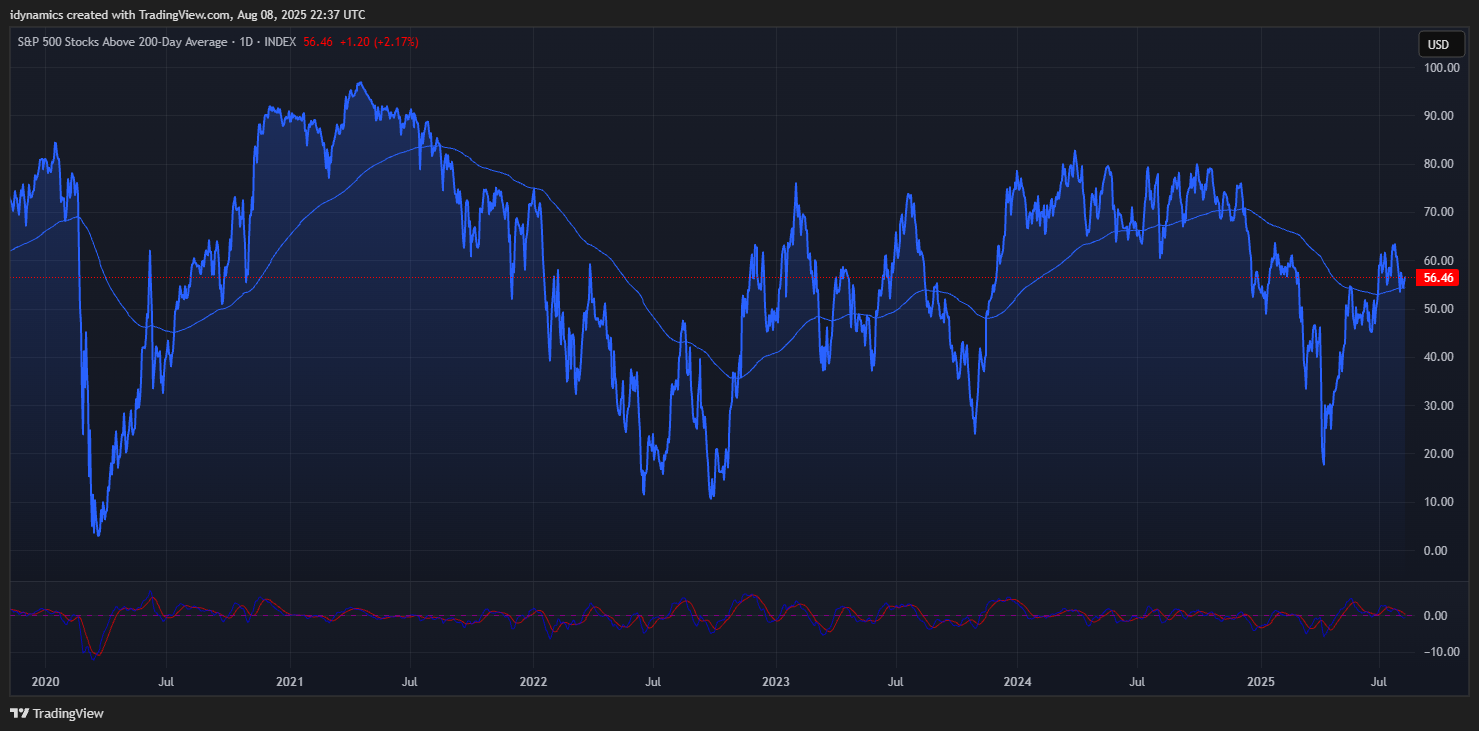 Breadth was overall flat on the week, ending at 56.46% of SPX stocks above their 200-day MA. The swing high is 63.94%. The high on 27 January 2025 was 63.61% and 72.92% in September 2024 and 82.70% in March of 2024. Divergence remains the name of the game. Given that only 10 stocks now make up 40% of the SPX, this is not unexpected.
MAGS (Magnificent 7) Weekly Candles
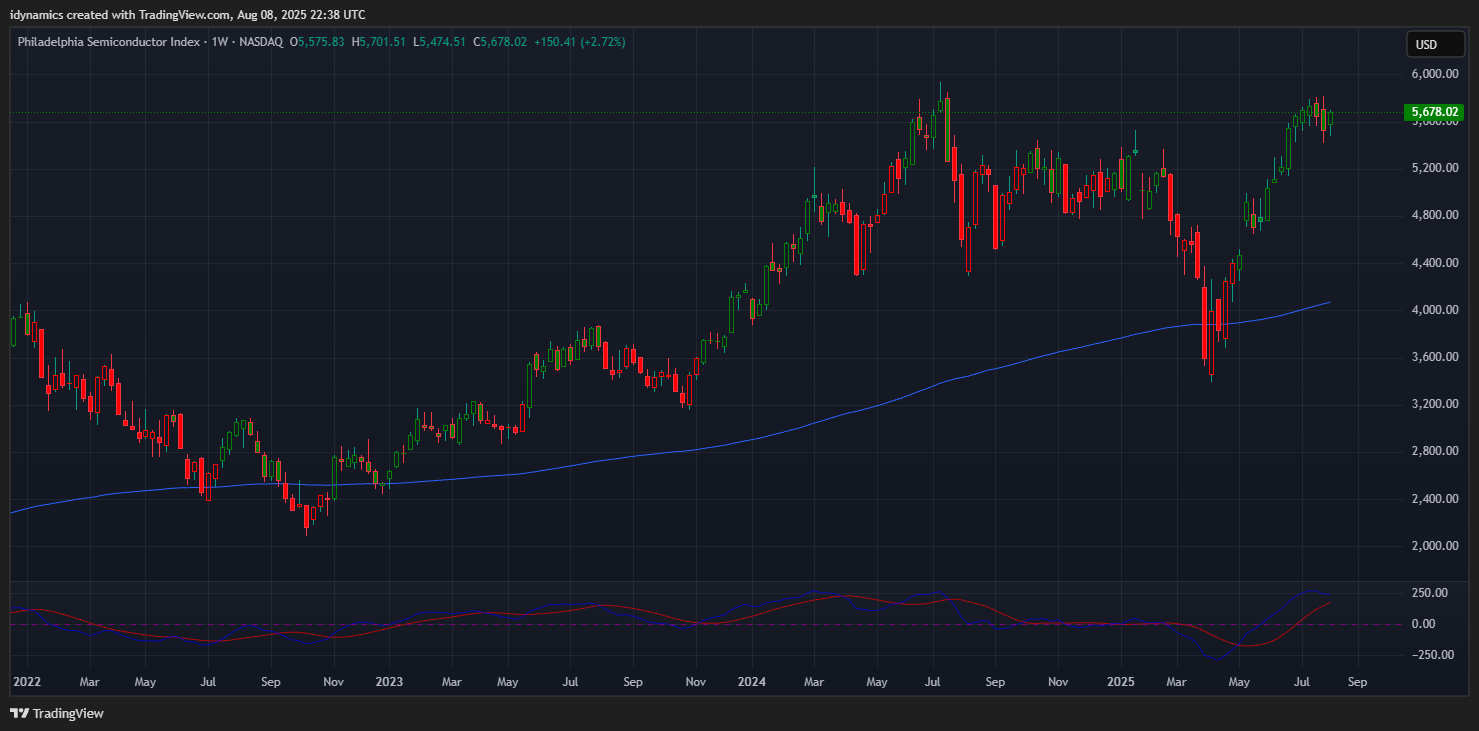
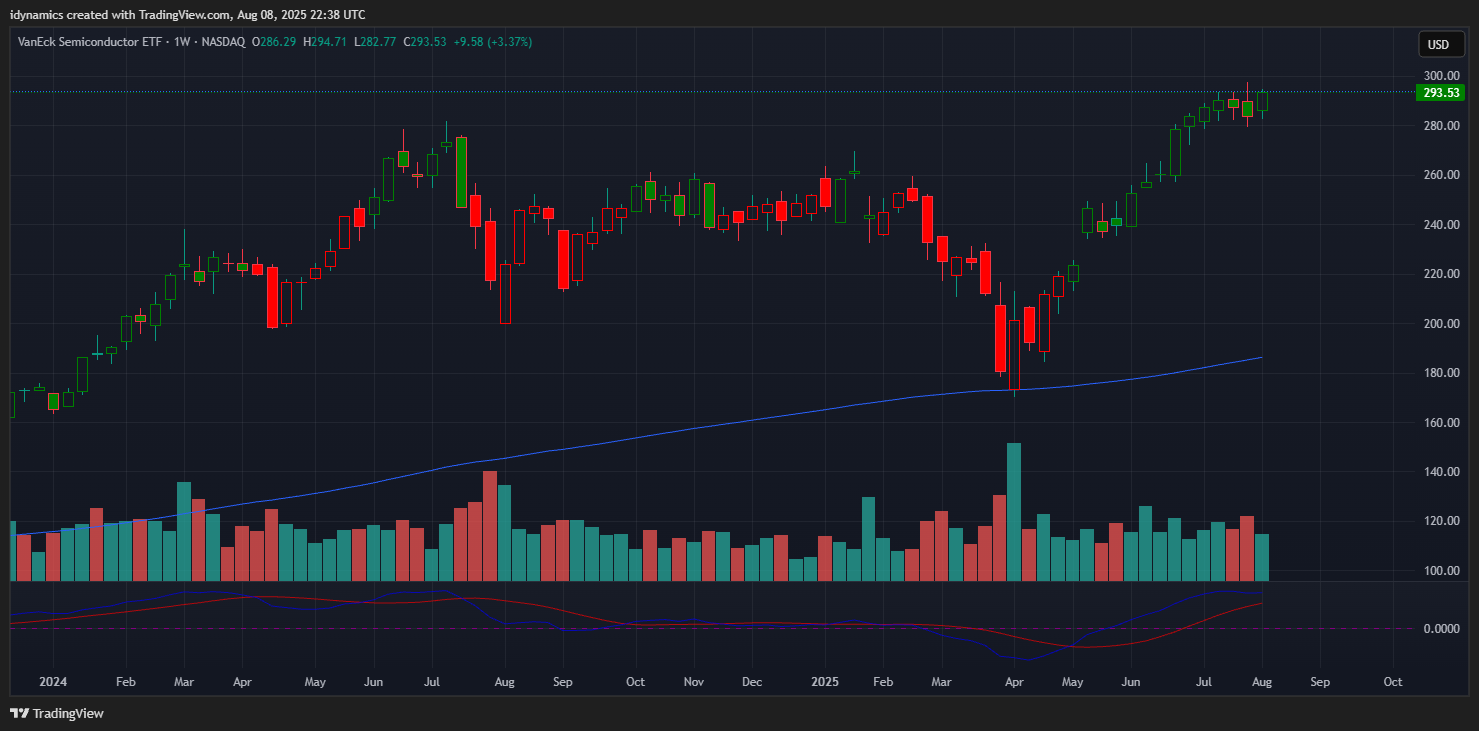
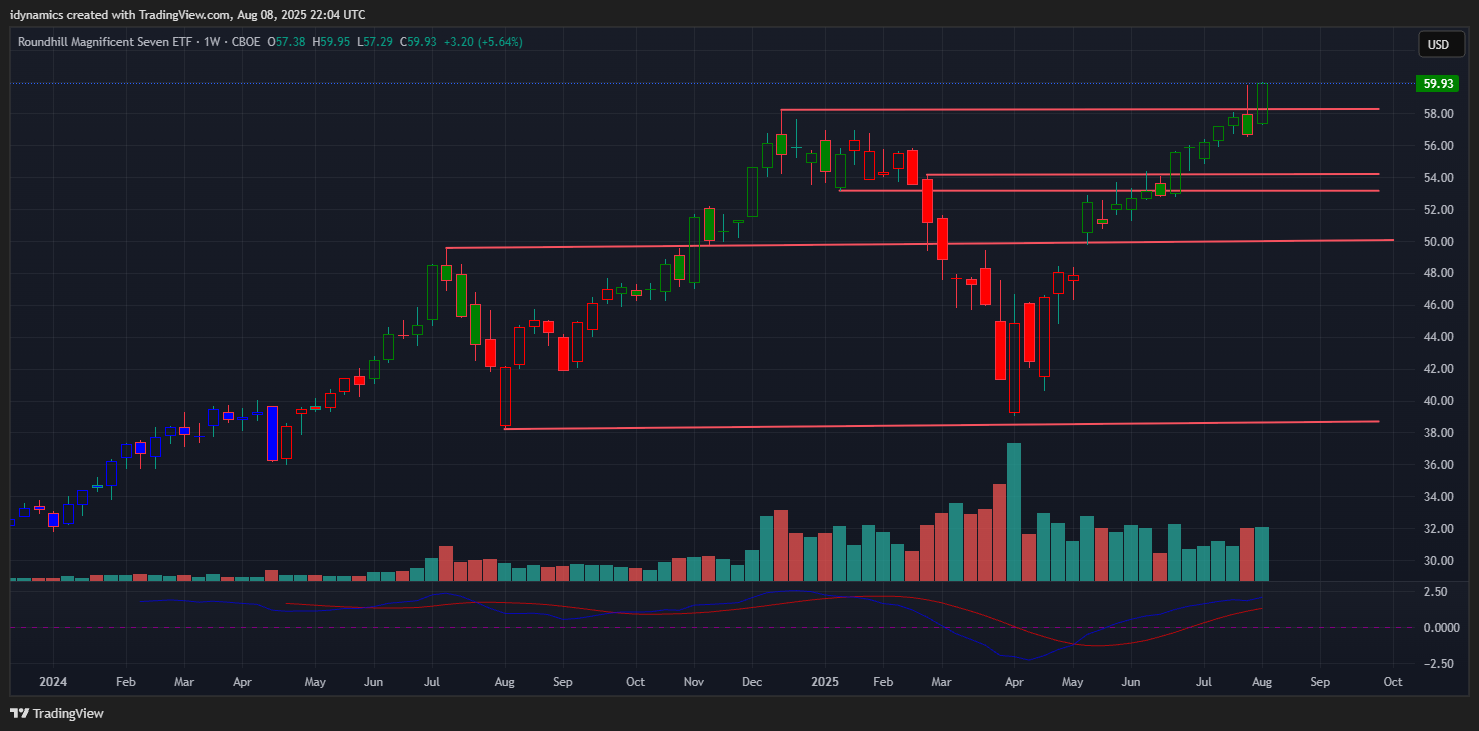 The MAGS set record highs on Friday right at the next resistance of 60. Further drives over 60 open counts to 64.50. The market should still see support against the 54.16/53.14. MAGS closed the week up +5.64% on the top of the week’s range in a bullish candle. Both the SOX and SMH traded inside weeks and closed on their highs.
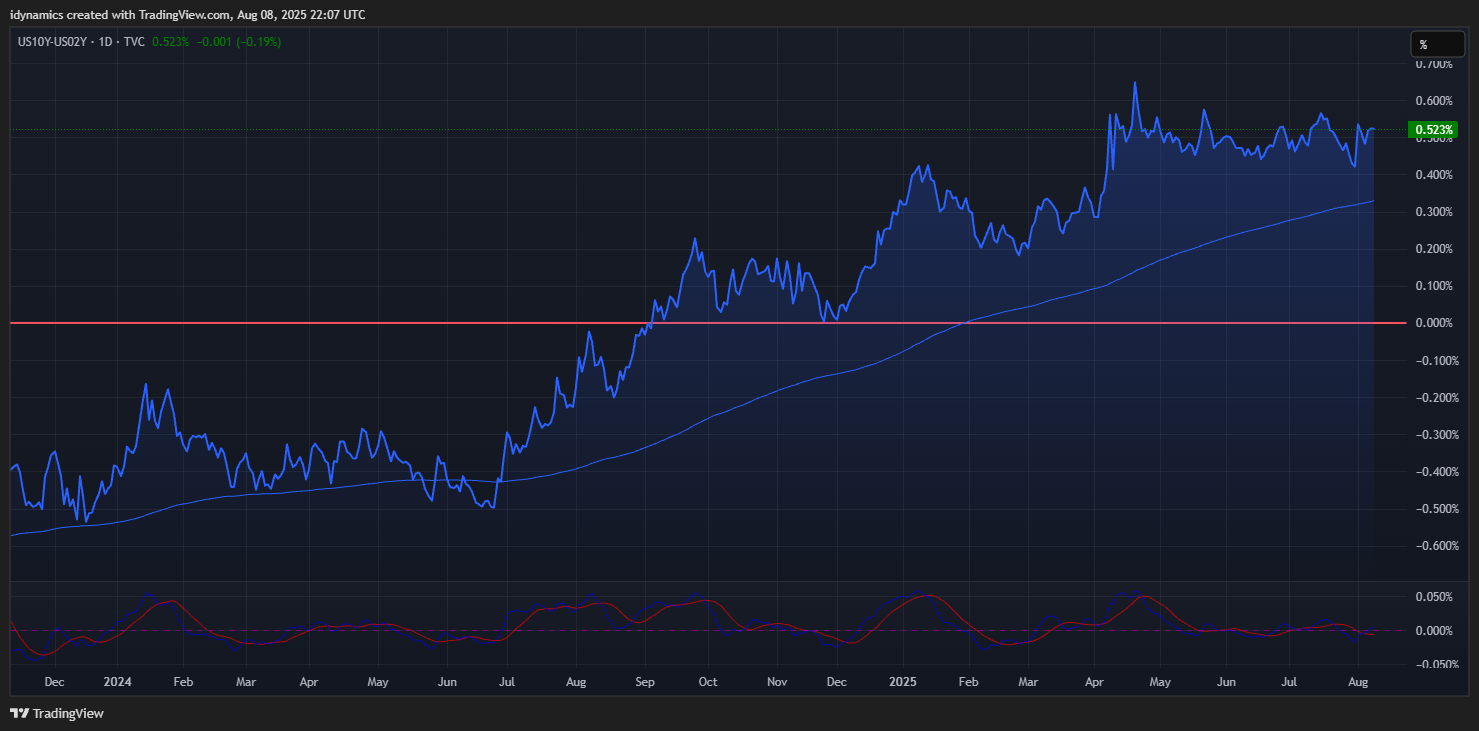
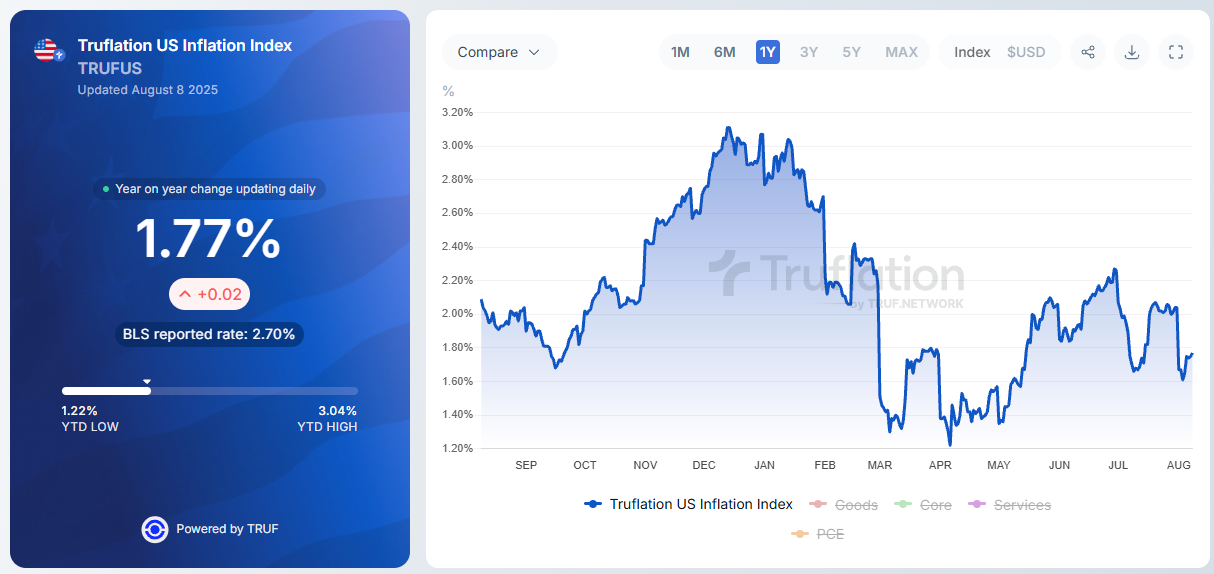
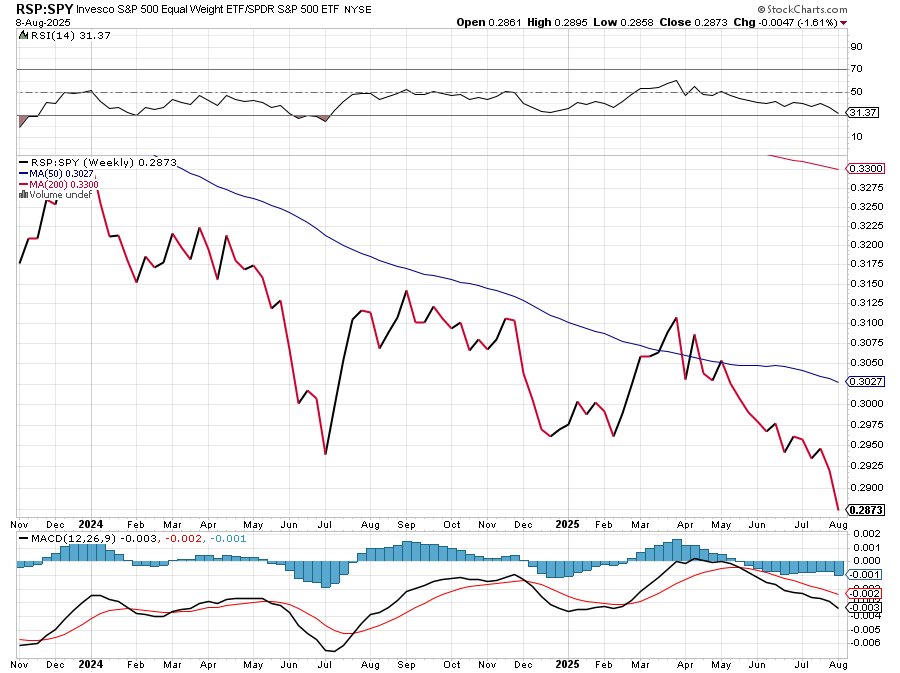
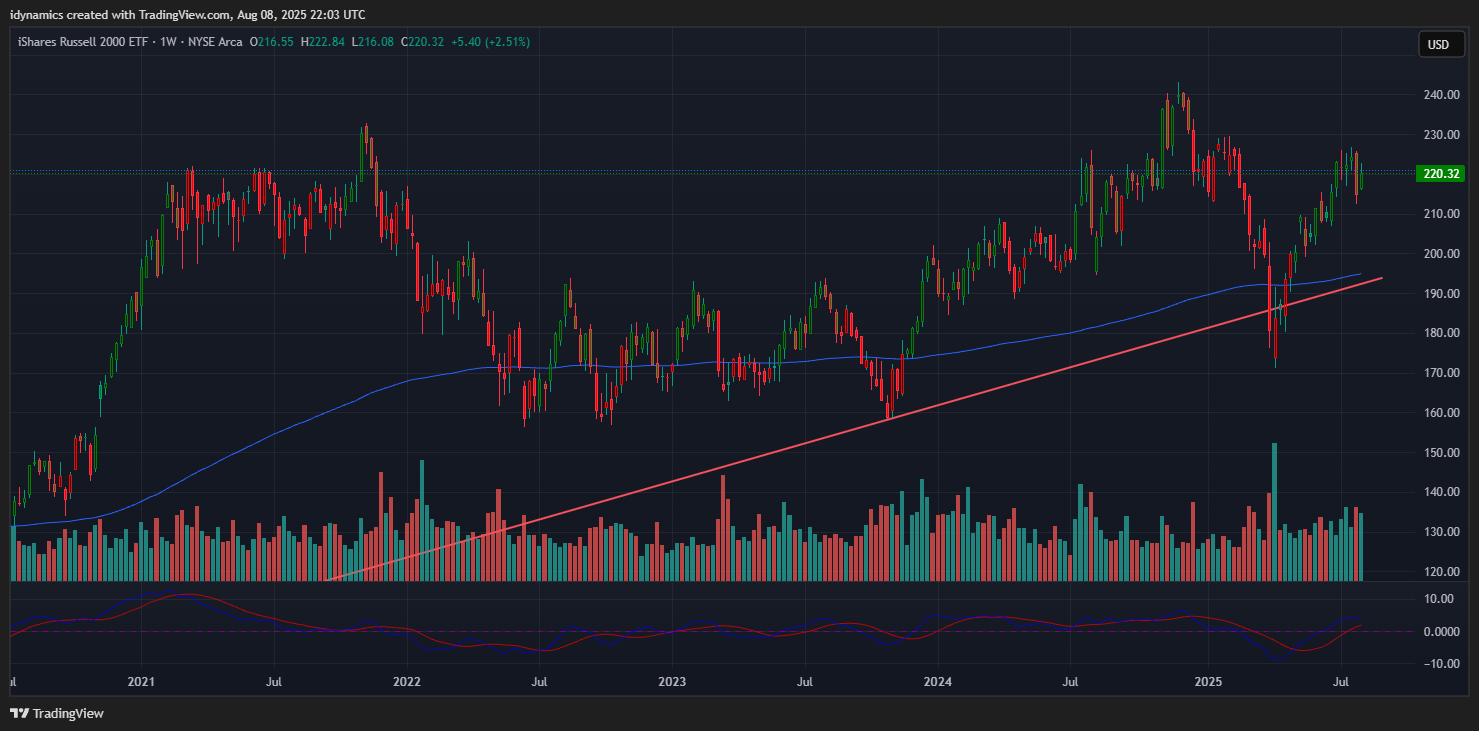
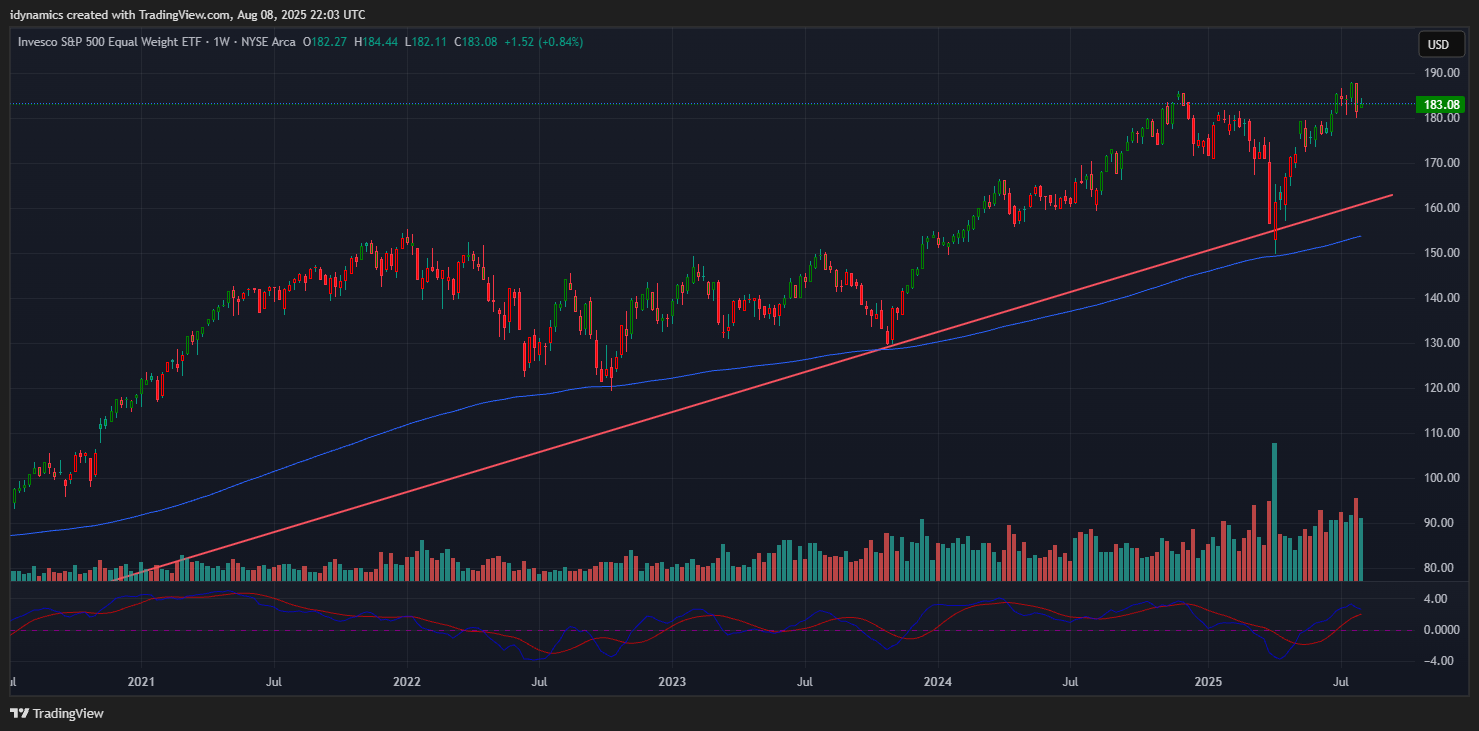
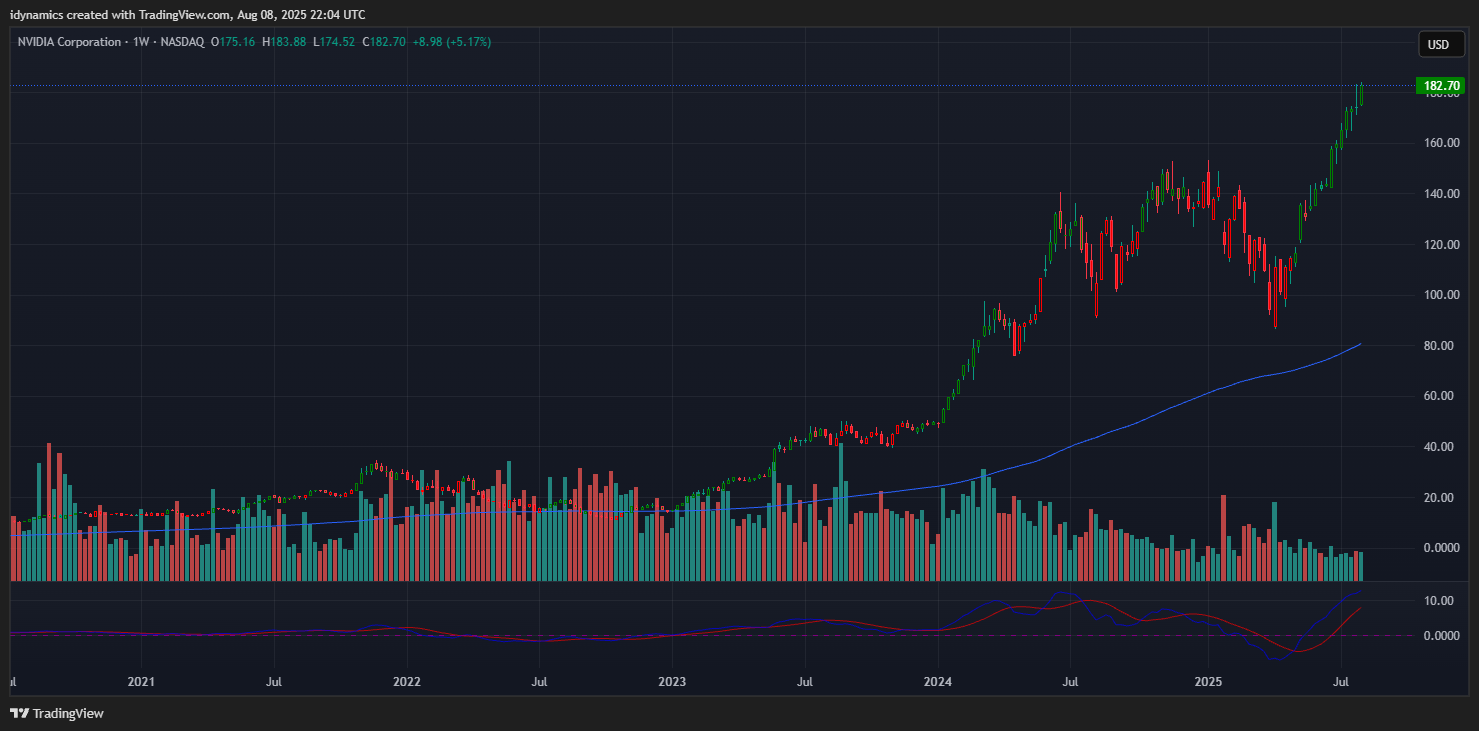
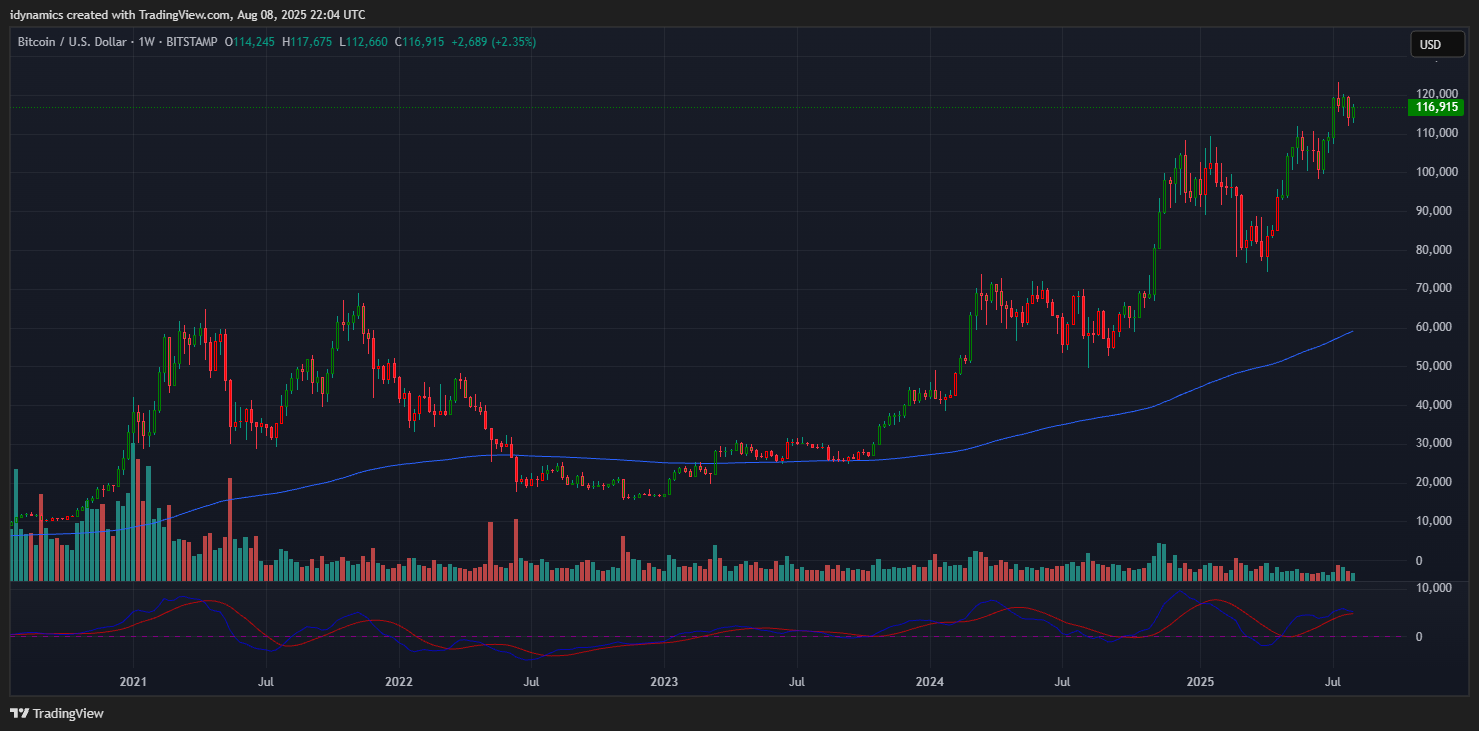
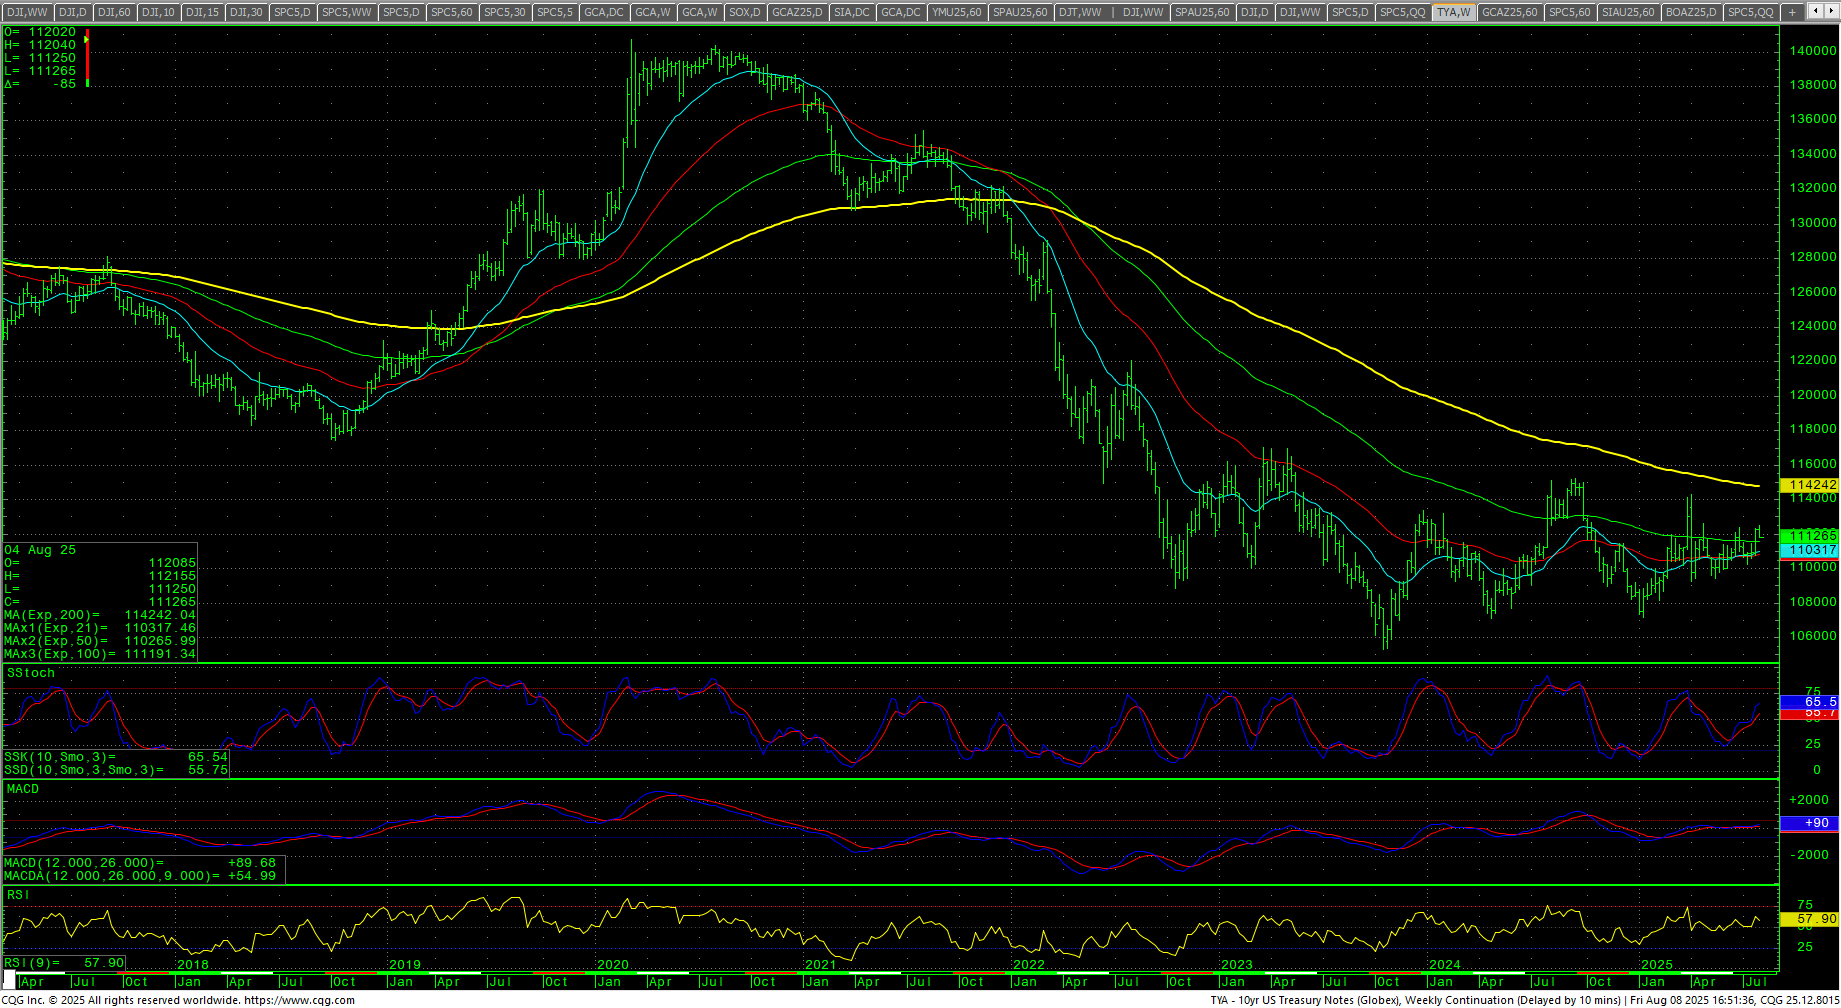
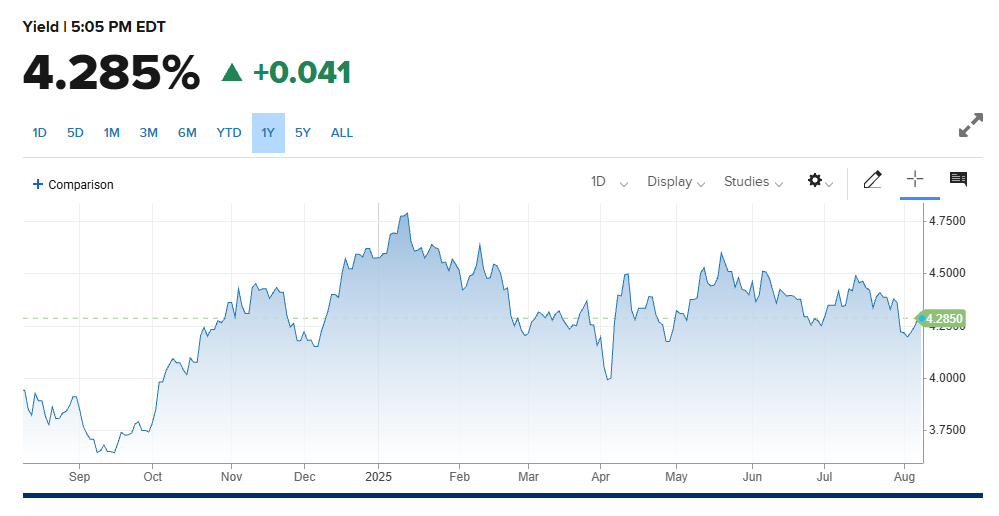
The RSP:SPY moved to another new low last week. The spread chart remains extremely weak. The weekly is trending lower in an oversold position and the MACD is turning back down. The IWM was up strongly, closing up +5.40% on the top of the range. The RSP was weaker, closing up +0.84% in the lower half of a tight inside week’s range. NVDA closed up +5.17% at new ATHs above the psychological level of 180 and also set new intraday highs at 183.88. Bitcoin closed up +2.09% on top of an inside week’s range. Support remains at 110/108. McClellan Oscillators are showing weakness in the Dow. The Yield Curve was flat on the week, closing at +0.523%. The 10YR yield rose, closing at 4.285%. Truflation increased to 1.77%.
10YR-2YR Yield Curve Daily

 VIX Weekly Candles
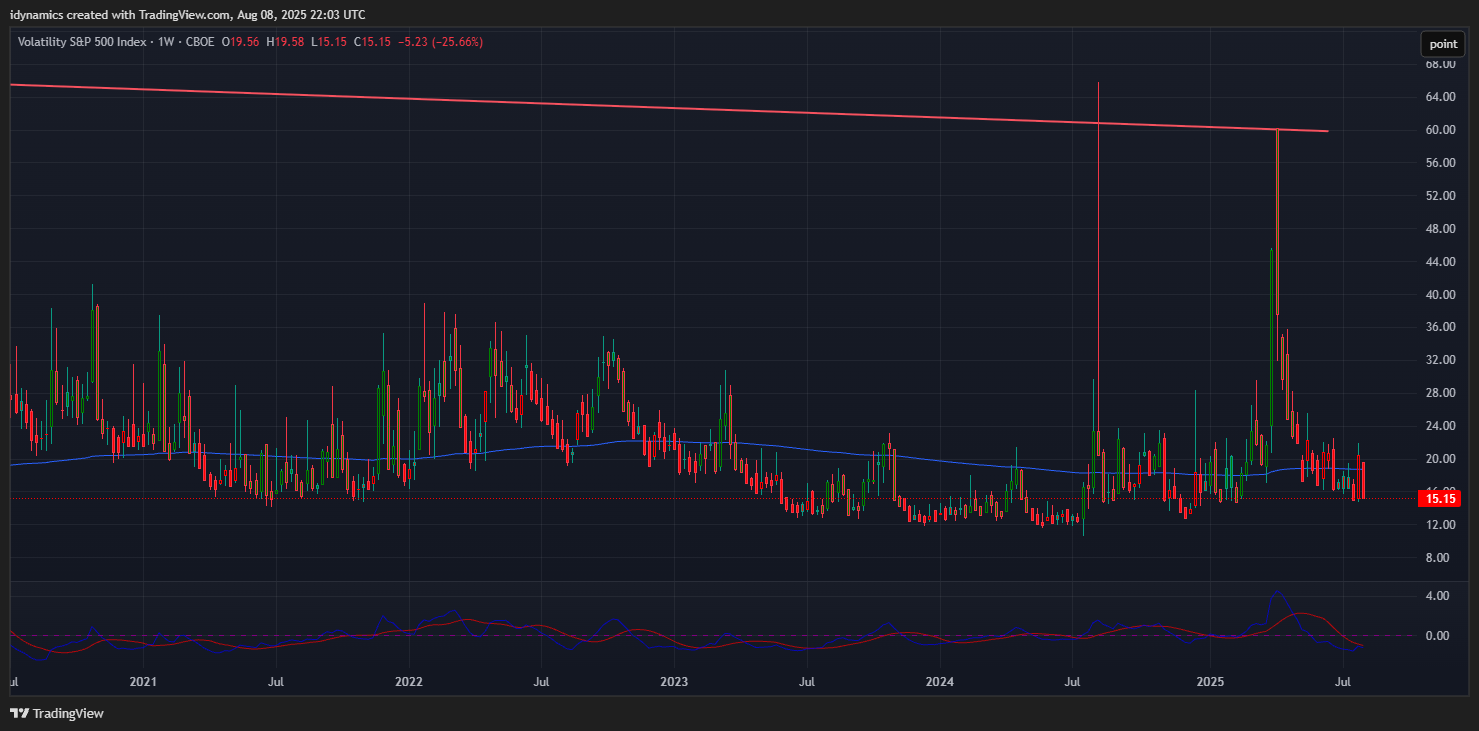
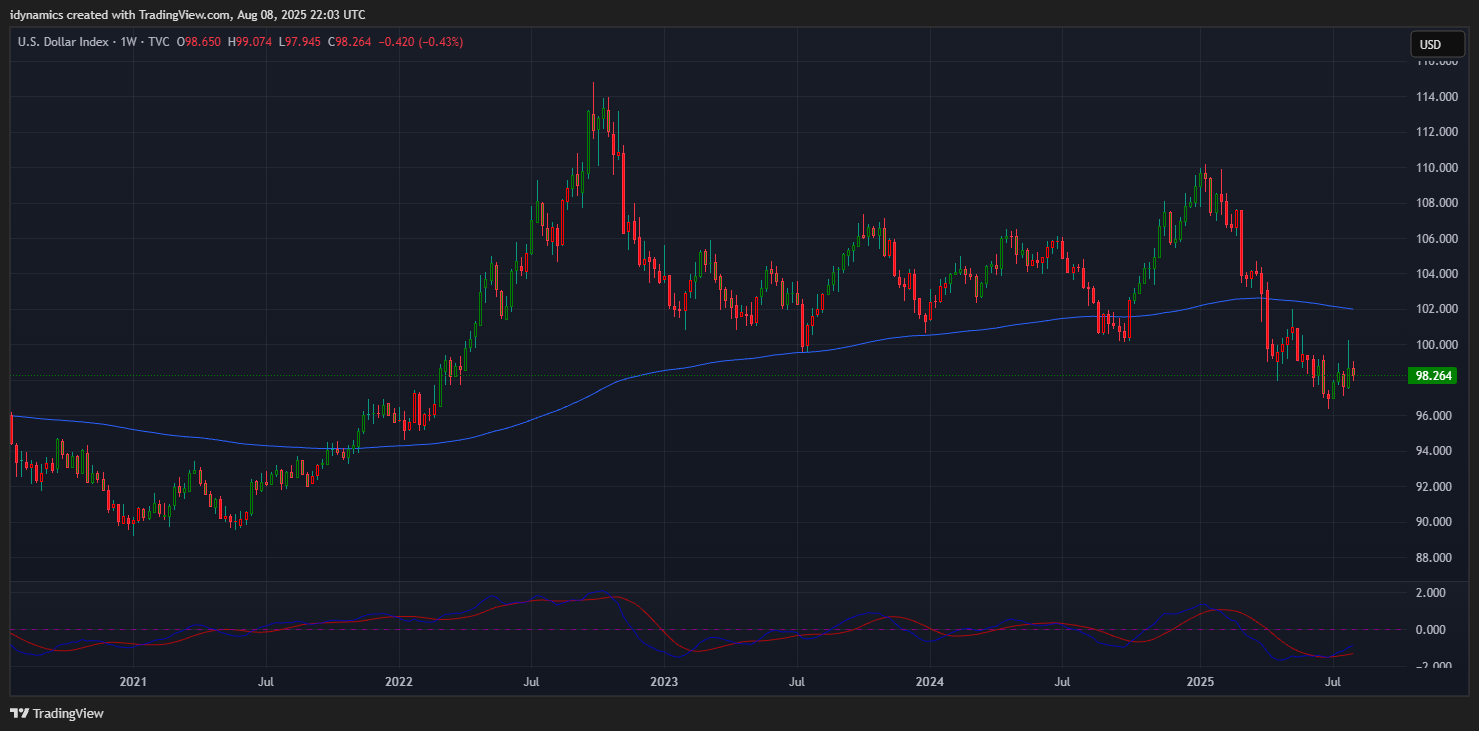
The VIX plunged back under the 20 level, down -25.66% closing in the bottom of the range. The US Dollar ended the week down -0.43% toward the middle of a tight inside week’s range.
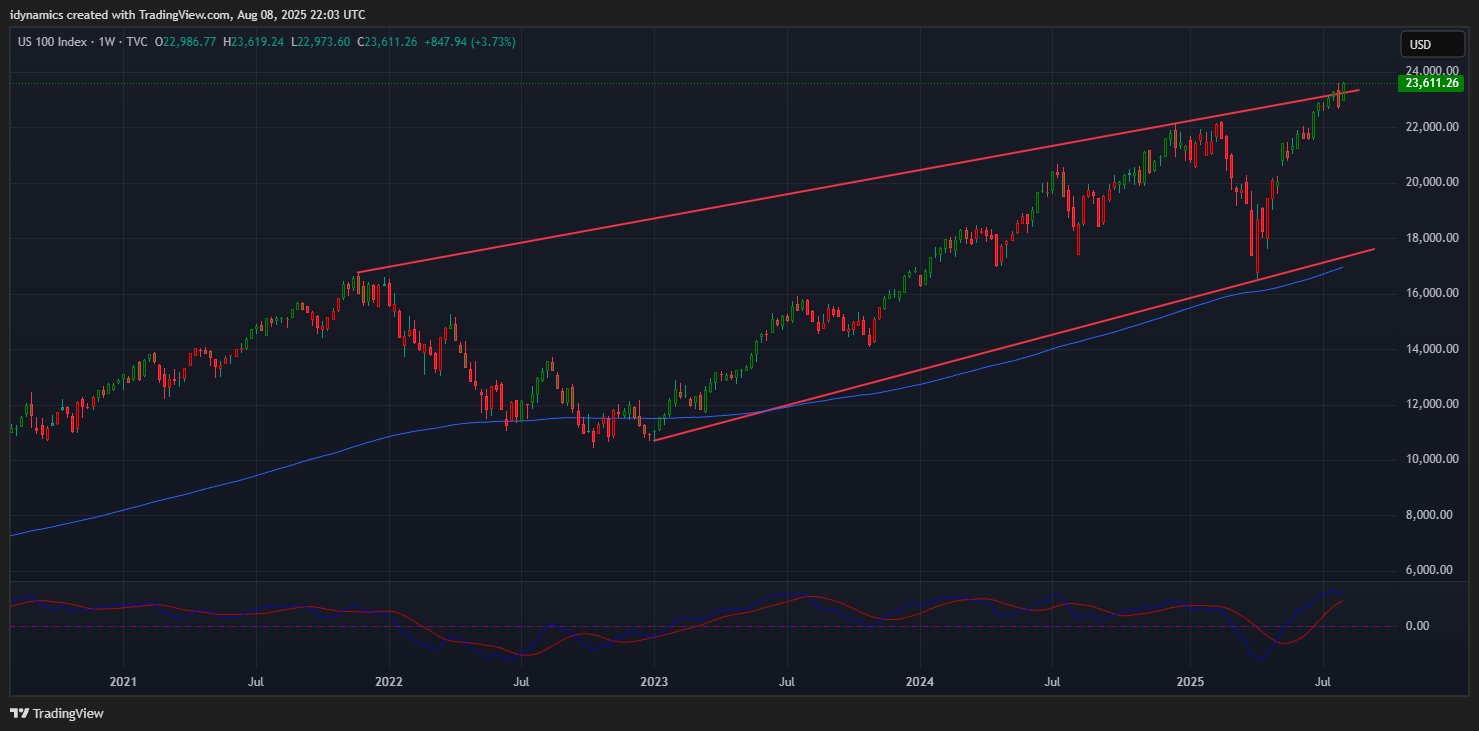
 Nasdaq 100 Weekly Candles
Daily Breadth 
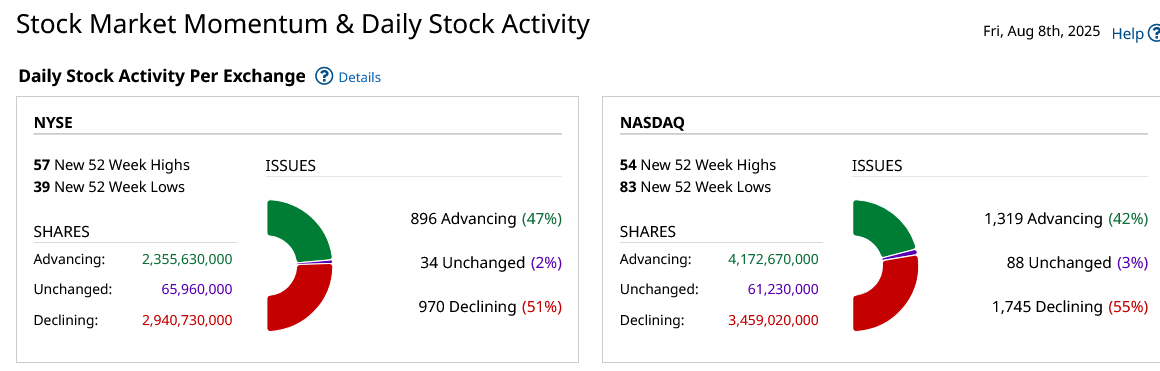
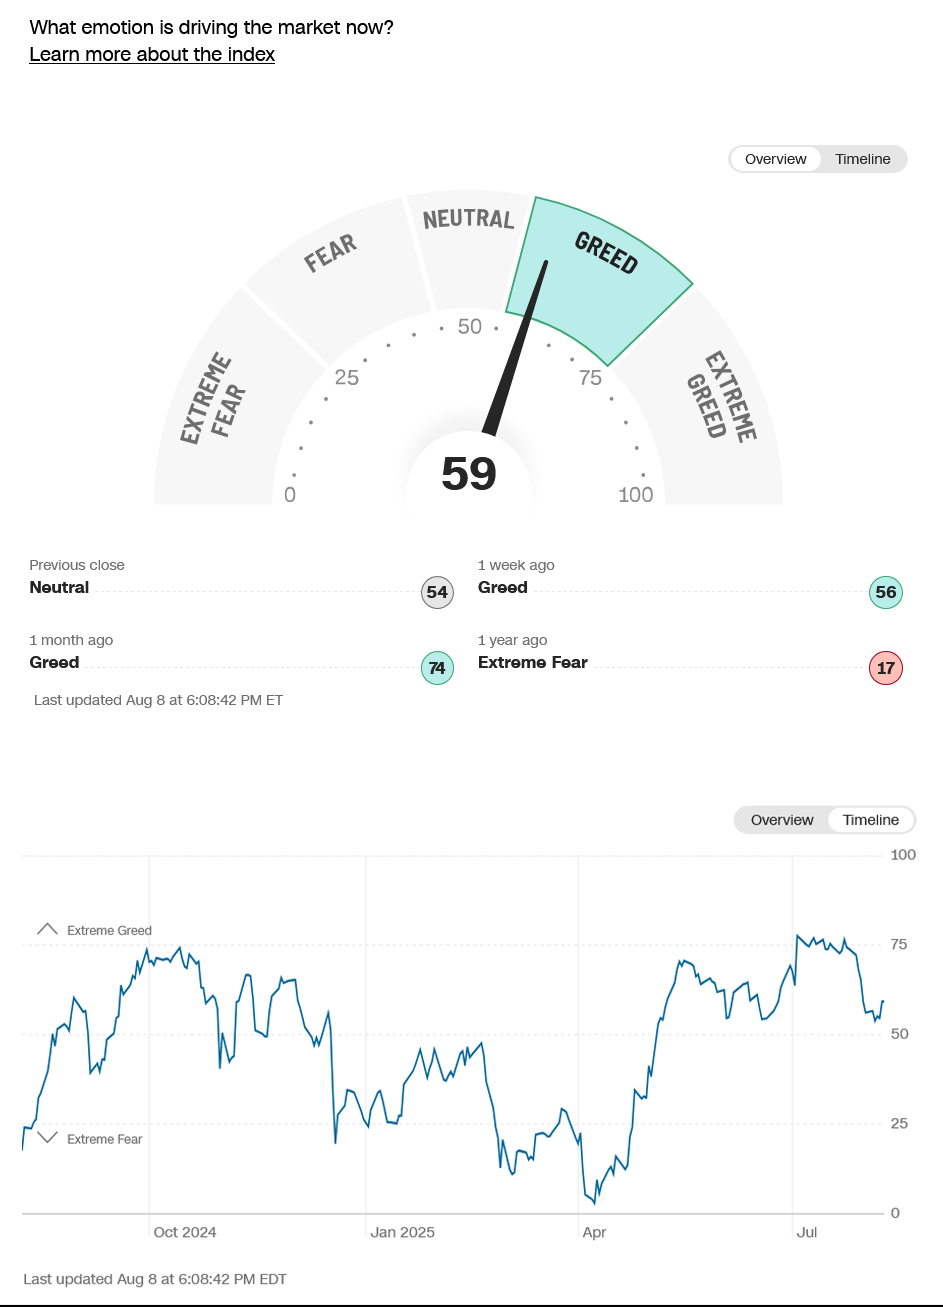
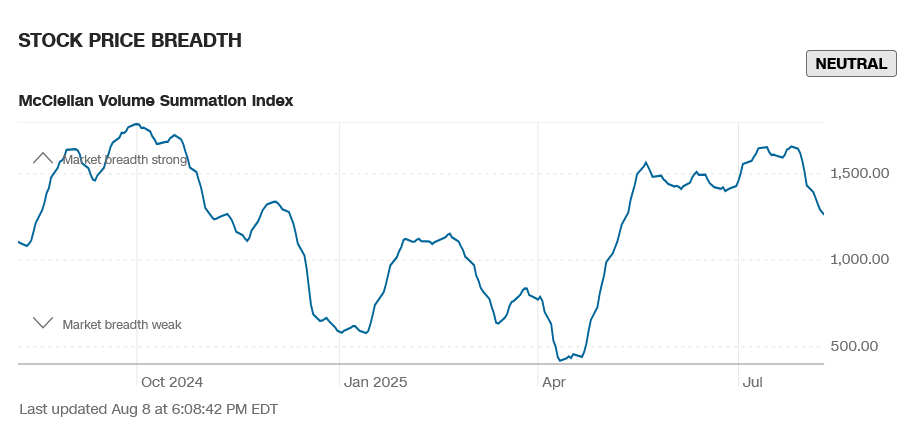
Breadth was mixed in Friday’s trade and was flat for the week. Sentiment still reads greed.
CNN Fear & Greed Index
 AAII Investor Sentiment Survey
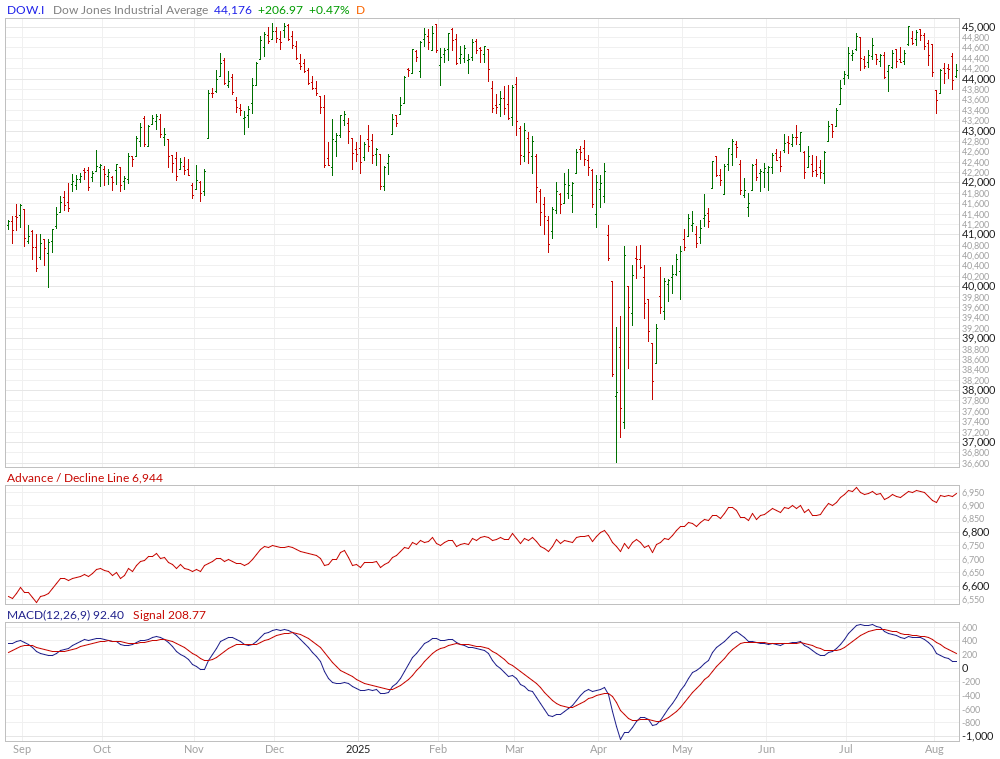
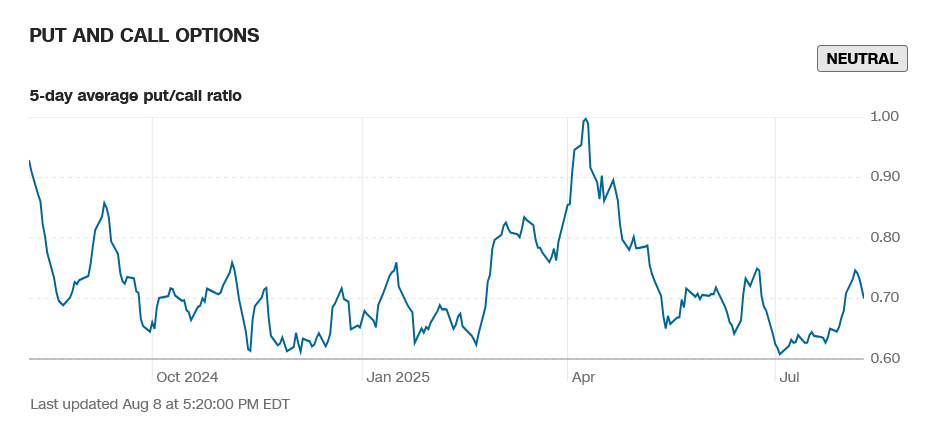
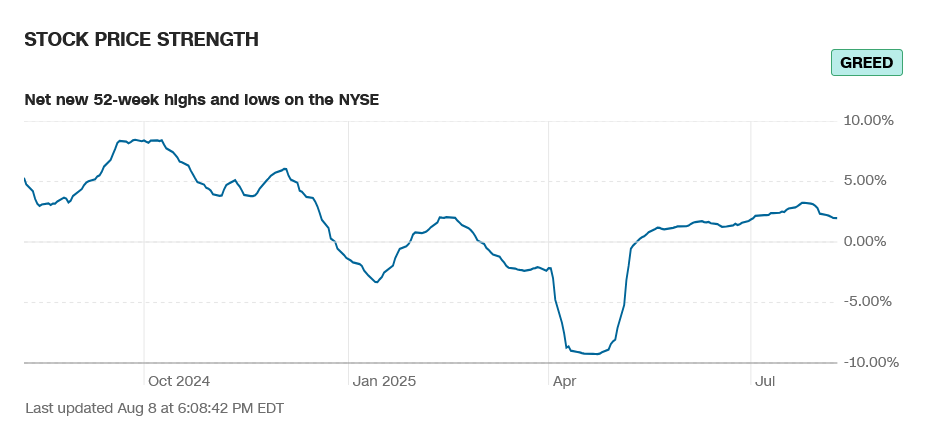
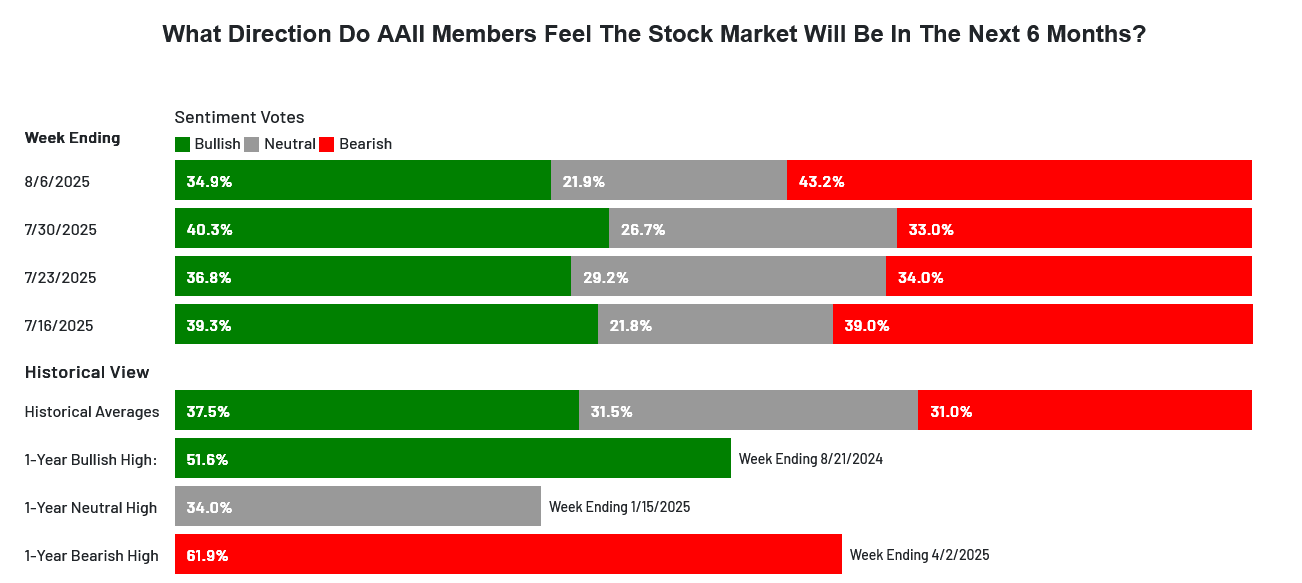 Sentiment bounced with the rallies in tech. The CNN Fear and Greed Index moved to 59 and reads greed. Breadth was flat on the week and reads greed. Latest AAII Sentiment Survey: Pessimism Spikes. The Dow A/D pared from the ATH closing at 6944. The VIX plunged back under the 20 level, down -25.66% closing in the bottom of the range. The Put/Call closed at 0.70 and reads neutral. The 52-week, A/D declined to +1.98% and reads greed. The Dow closed the week up +1.35%, closing on the top of an inside week’s the range. The S&P settled up +2.43% gaining back all of the previous week’s losses ending on top of an inside week at a record high close. The Nasdaq Composite was up +3.87% and the Nasdaq 100 was up +3.37%. The NYSE FANG set an ATH closing up +3.87% on the top of a record setting range. The Russell was up +2.38% on the bottom of a tight inside week’s range. The 10-year notes reversed lower and closed on the bottom of the range. The yield on the 10YR moved up to 4.285%.
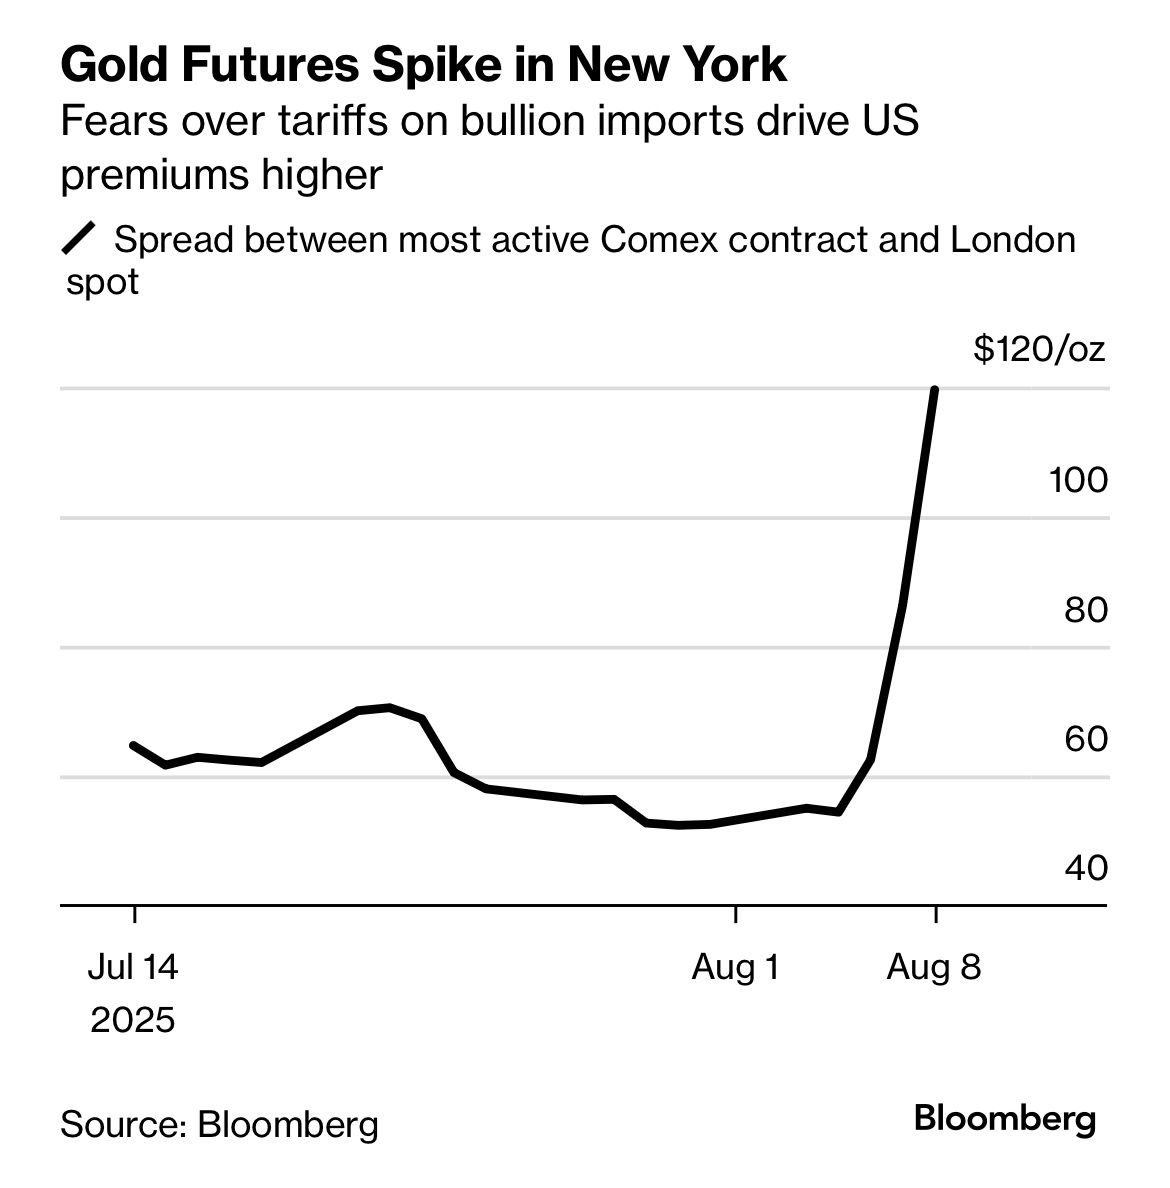
The U.S. has unexpectedly imposed tariffs on imports of one-kilogram and 100-ounce gold bars, disrupting the global bullion market and key trade flows, especially from Switzerland 🇨🇭. The U.S. Customs and Border Protection (CBP) clarified that these bars are classified under a tariffed customs code (7108.13.5500), rather than the previously assumed non-tariffed category (7108.12.10). This move contradicts the industry’s long-standing belief that investment-grade gold bars were exempt from tariffs.
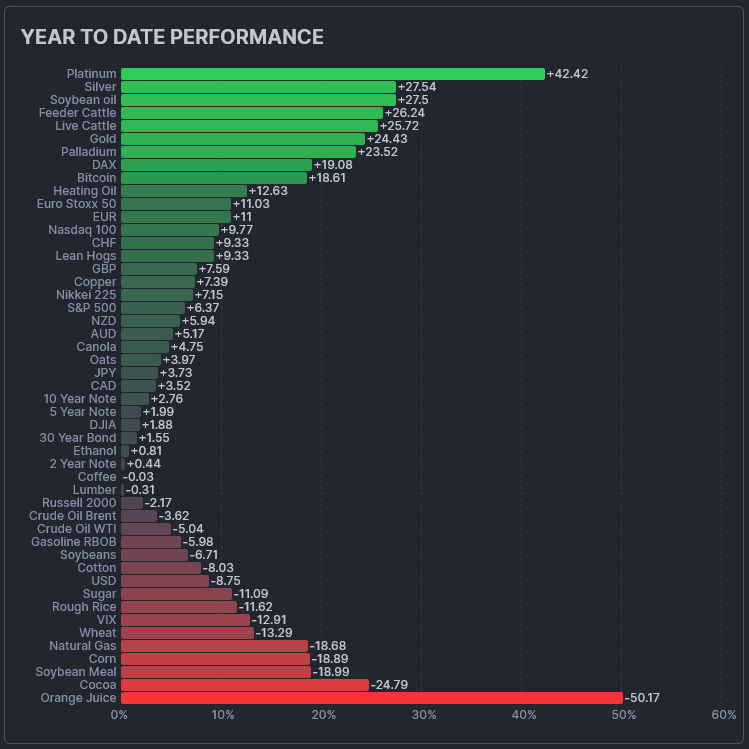
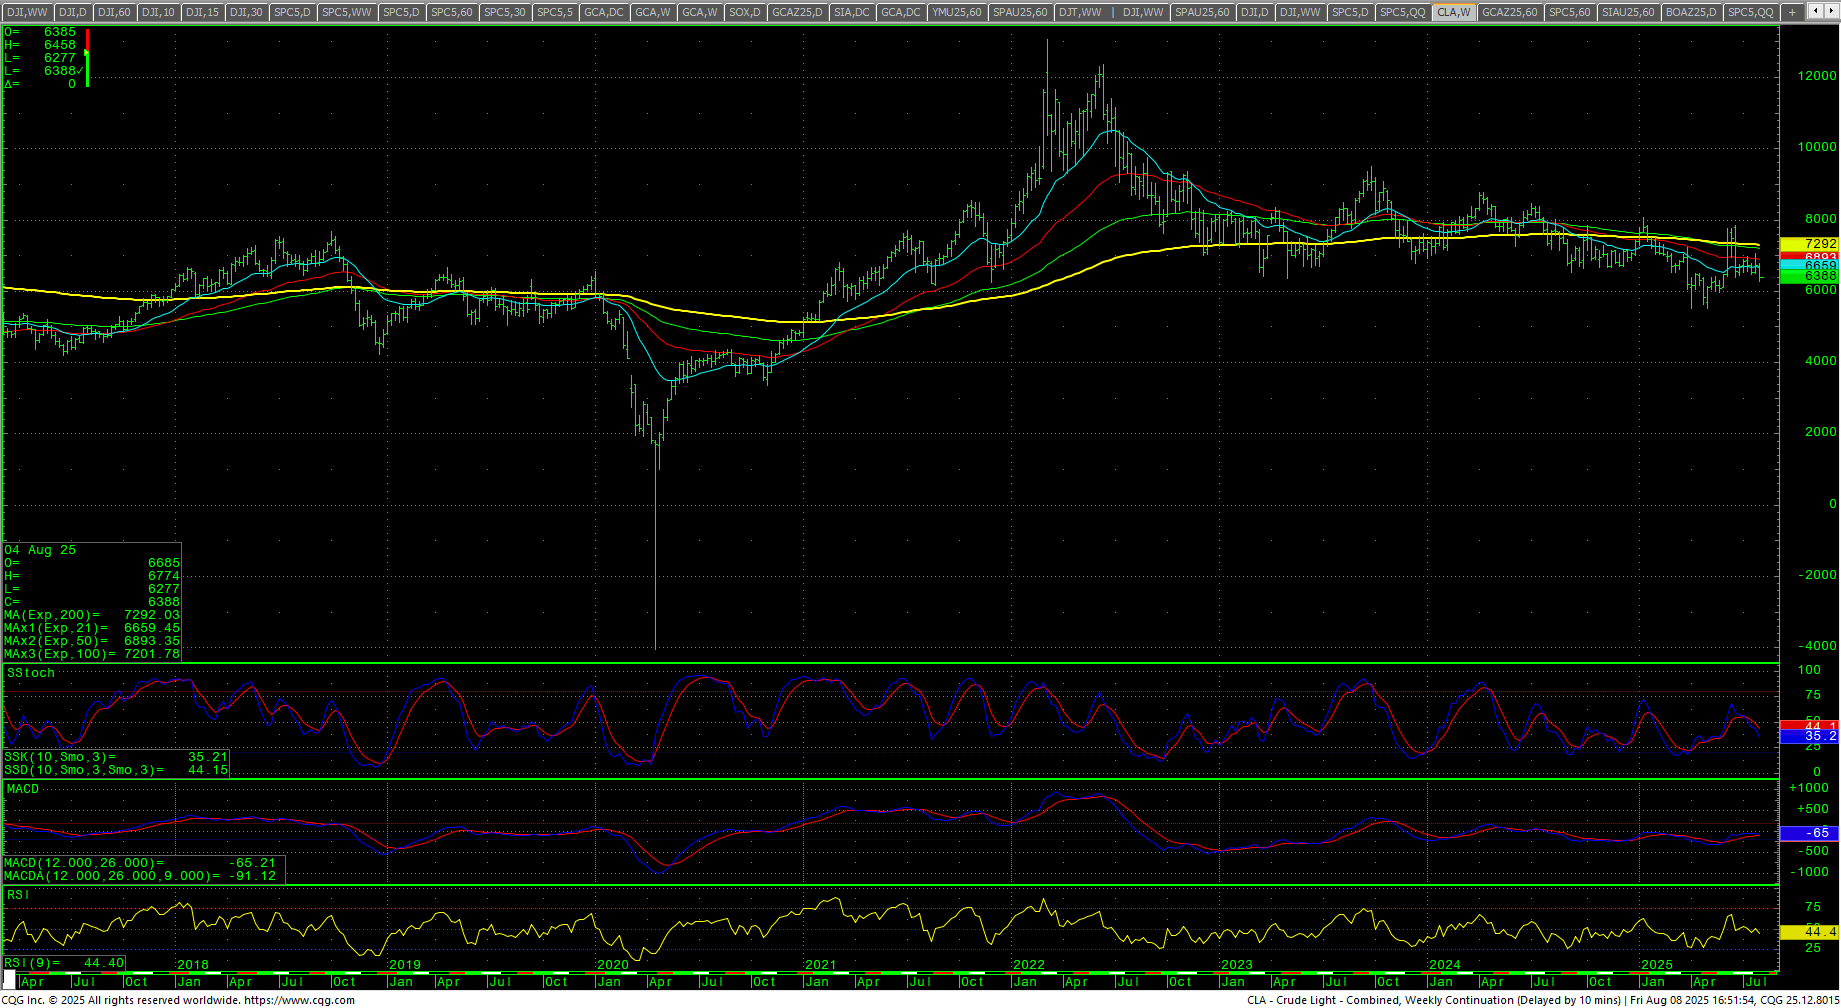
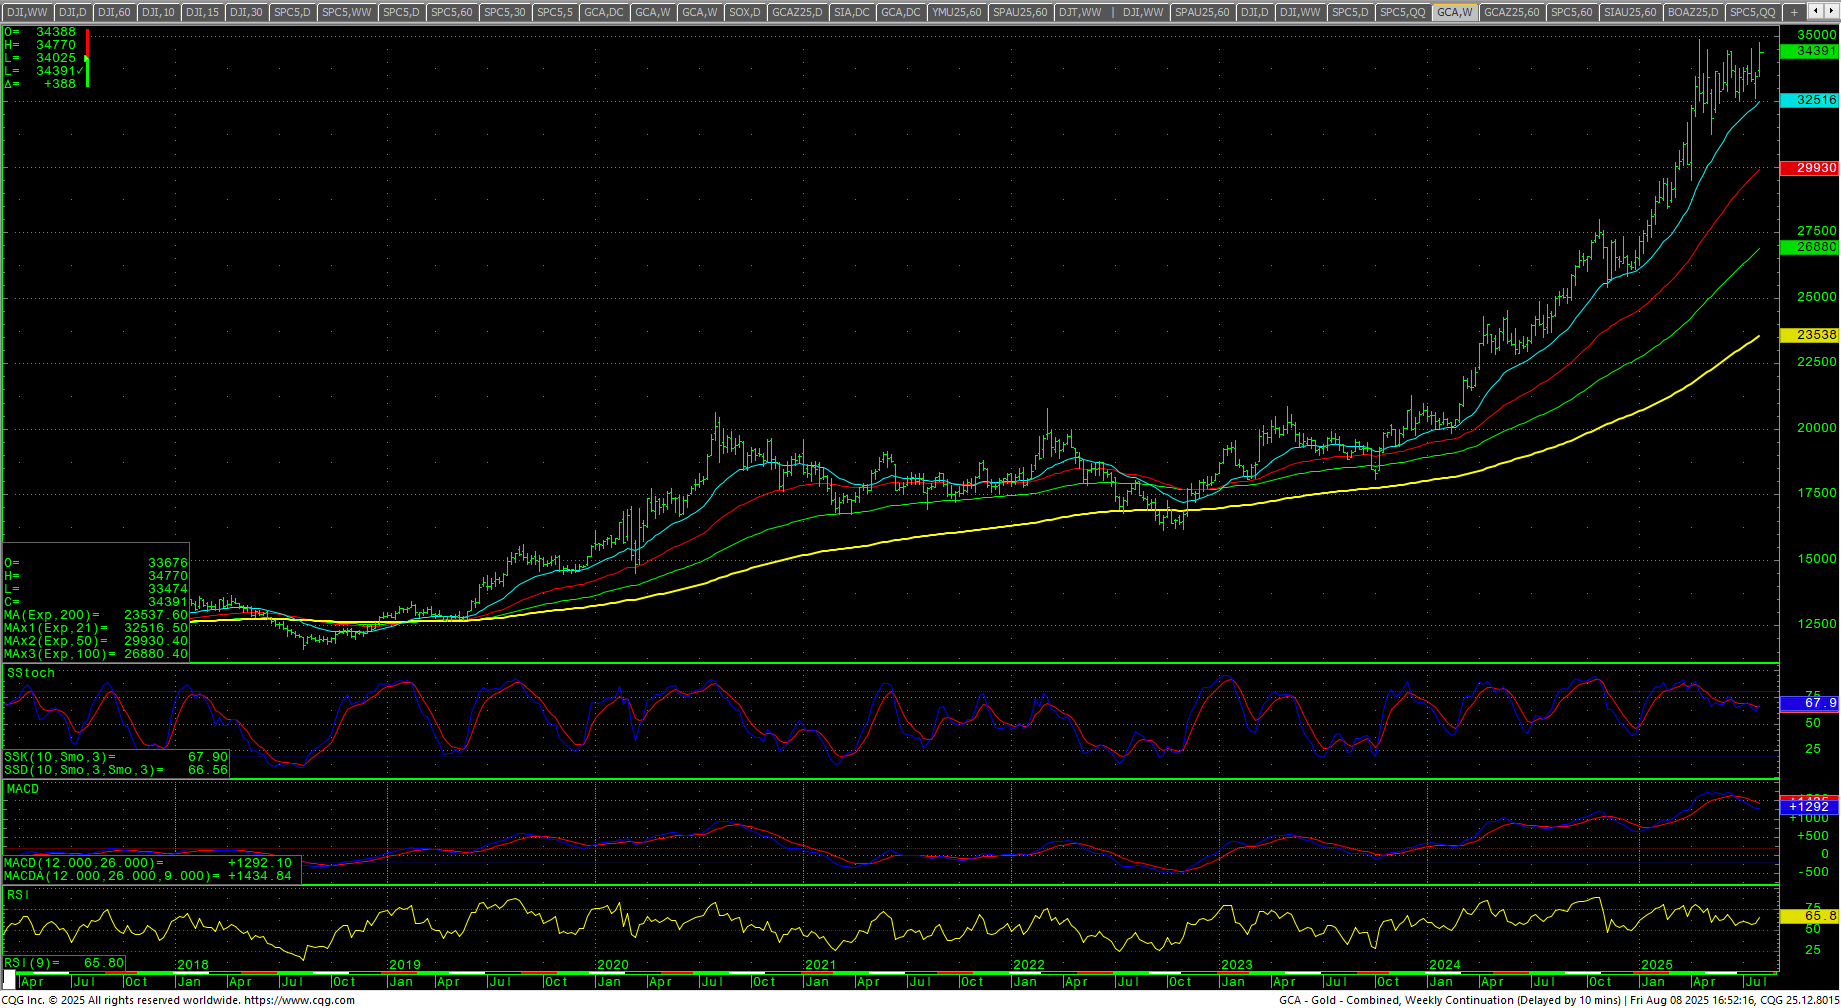
The CRB Index was down -1.89%. Crude oil dropped to two month lows and closed on the bottom of the range. Gold rallied and set a record high close on the weekly after testing the record intraday highs. The CoT for the S&P 500 saw flt movement across all investors. Non-commercials are flat and commercials are flat. The CFTC S&P 500 Non-Commercial Net Positions ended at -139.6K.
Timing Points
This week is a critical week with potential for increased volatility and/or wide ranges. Tuesday is CPI data, (est: 0.2%, YOY: 2.8%, Core: 0.3%). Thursday is PPI data, (est: 0.2%, Core: 0.3%). 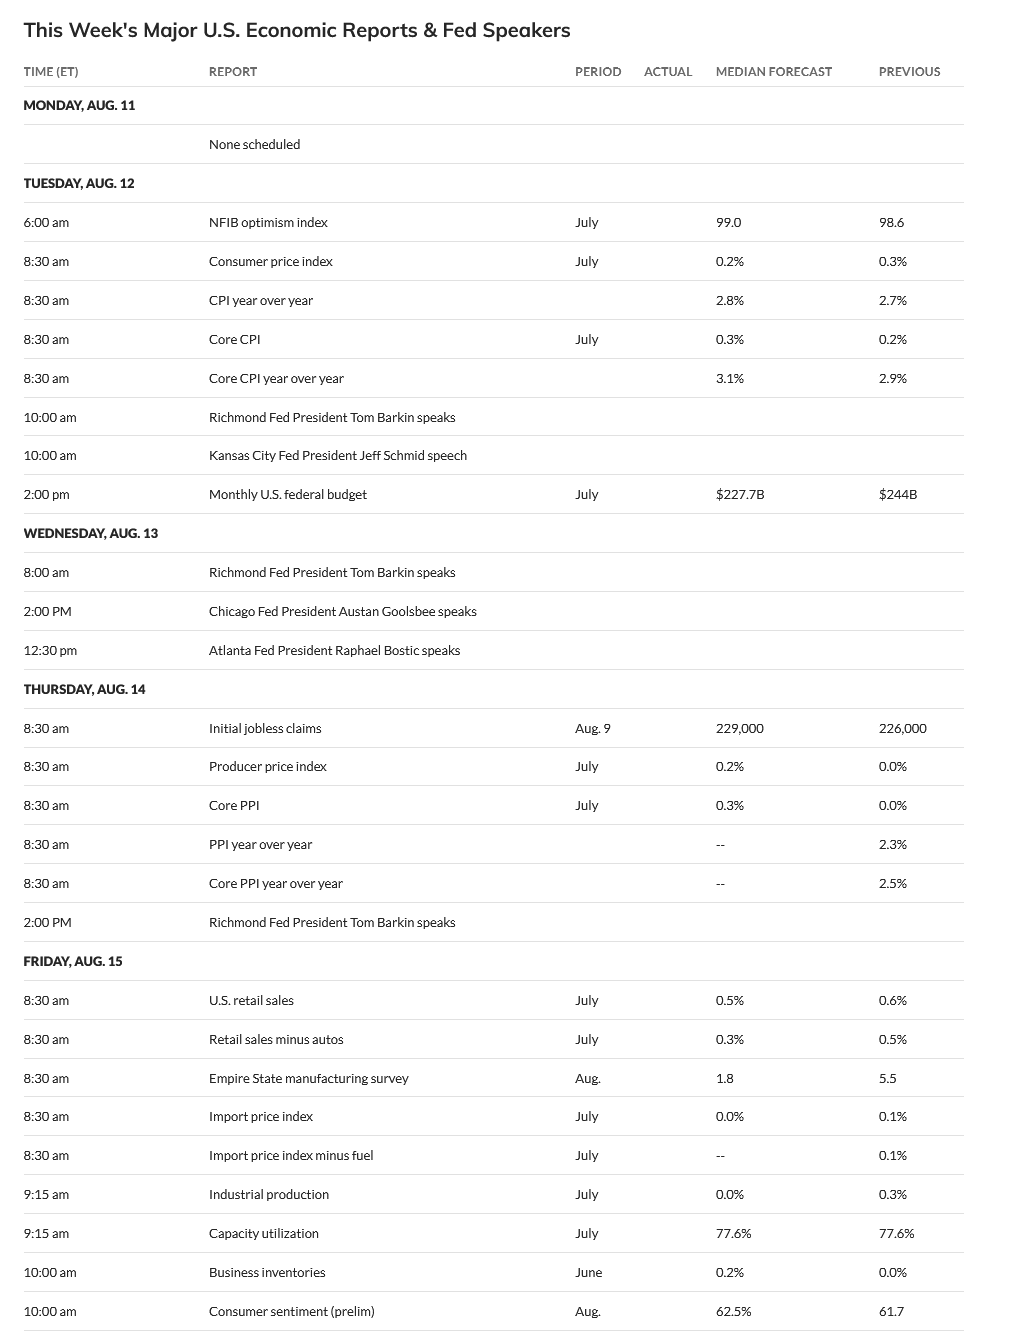
- 08/11 *** X critical week
- 08/18 **
- 08/25-26 *** X
- 09/05 **
- 09/12 *** X critical weekend through
- 09/16-17 *** X critical week to the 19th
- 09/23 ***
- 10/01 ** key to bonds/dollar
Dow Jones Industrial Average
Dow Jones Industrial Average Weekly H-L-C
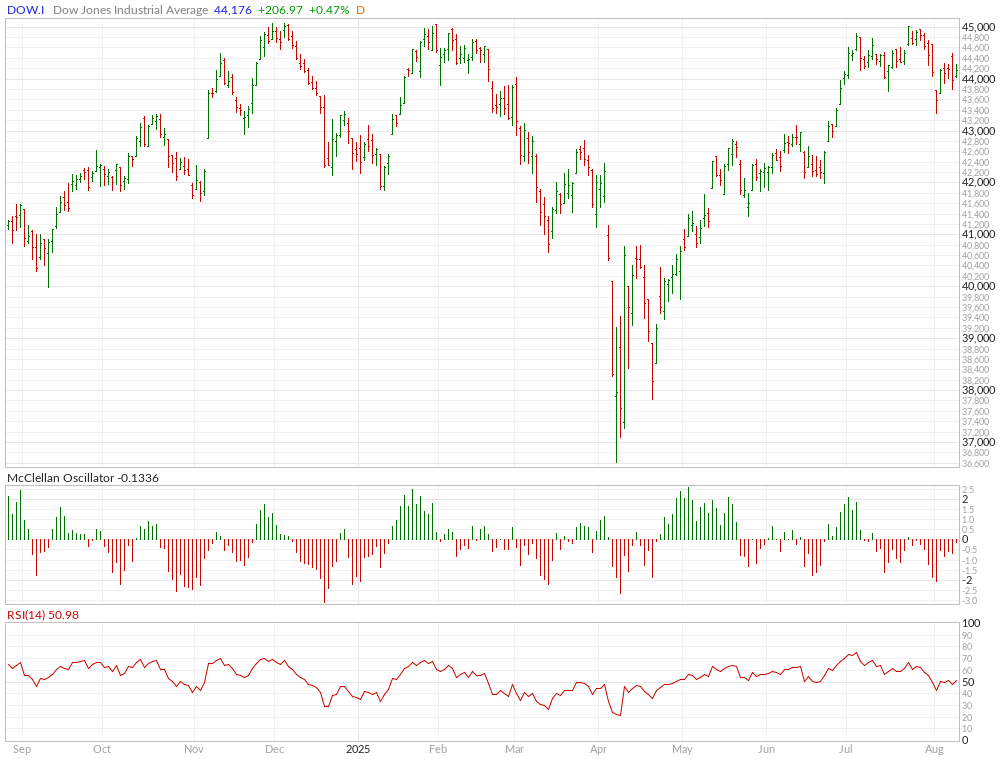
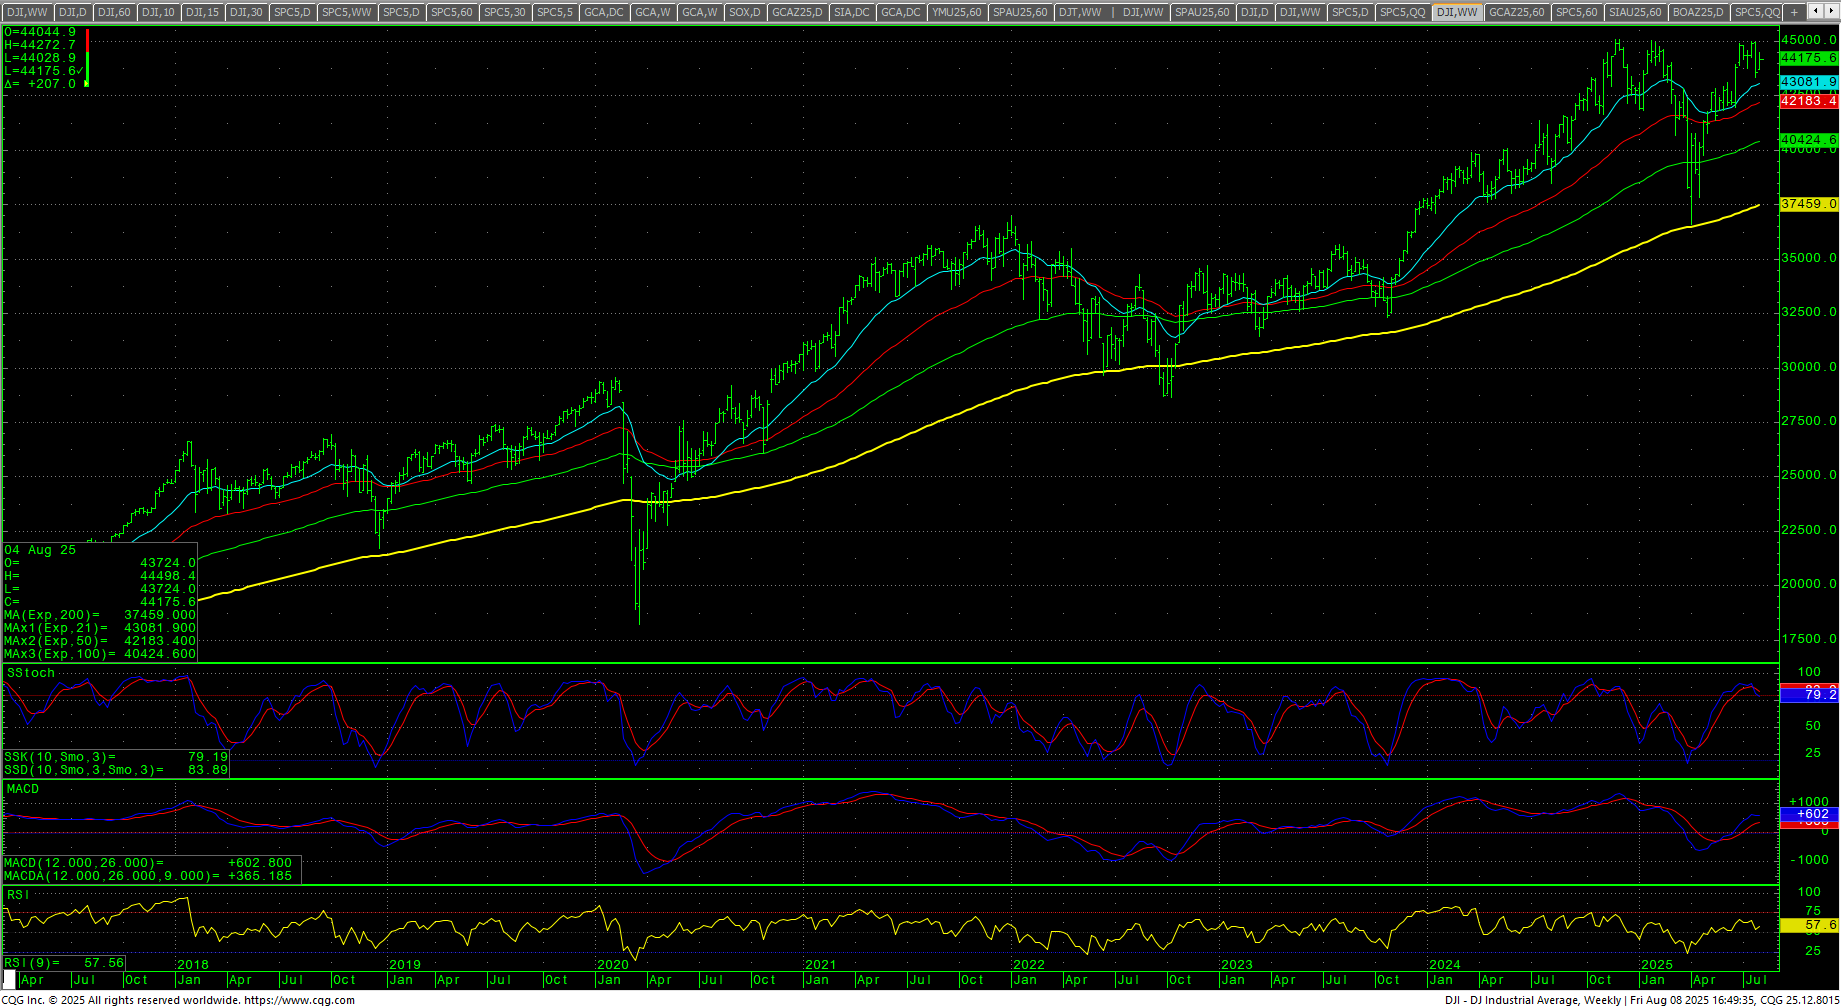 The Dow closed the week up +1.35% on the top end of an inside week’s range. The daily stochastics are neutral in a flagging pattern. The weekly stochastics are still in an initial downturn from extreme overbought numbers. The MACD is down from a key bearish divergence. The daily RSI is 48.7. The 200-day MA starts the week at 42476.80 and is still at record highs.
Dow Jones Industrial Average Hourly H-L-C
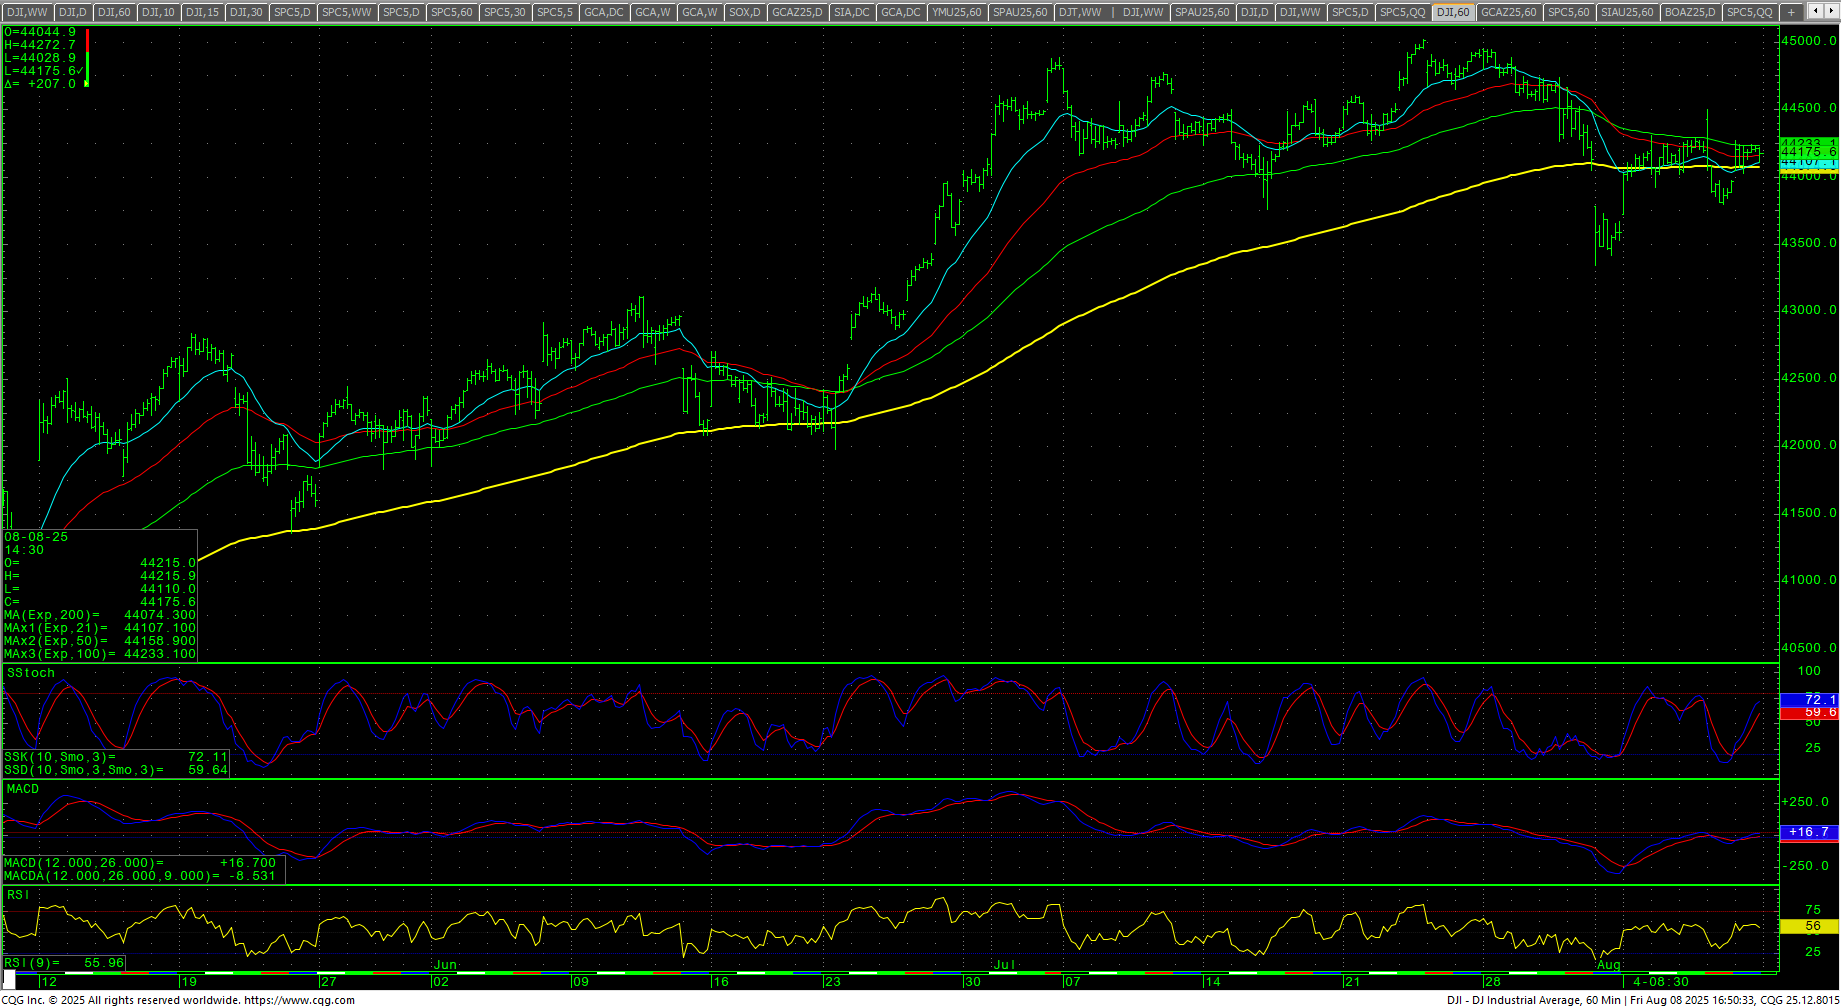 The hourly is neutral on Friday’s close. Support is 43900 and 43857. Under 43857 should test 43498 with counts to pivotal support at 43140/43135. Closes under 43135 should minimally test 43030/43025 with counts to 42740. A breakdown under the 42740 area will set up 41805. Under 41805 sets up 41486 with counts to support to 40814. Under 40814 opens counts to critical support of 39822/39818.
Dow Jones Industrial Average Weekly Candles
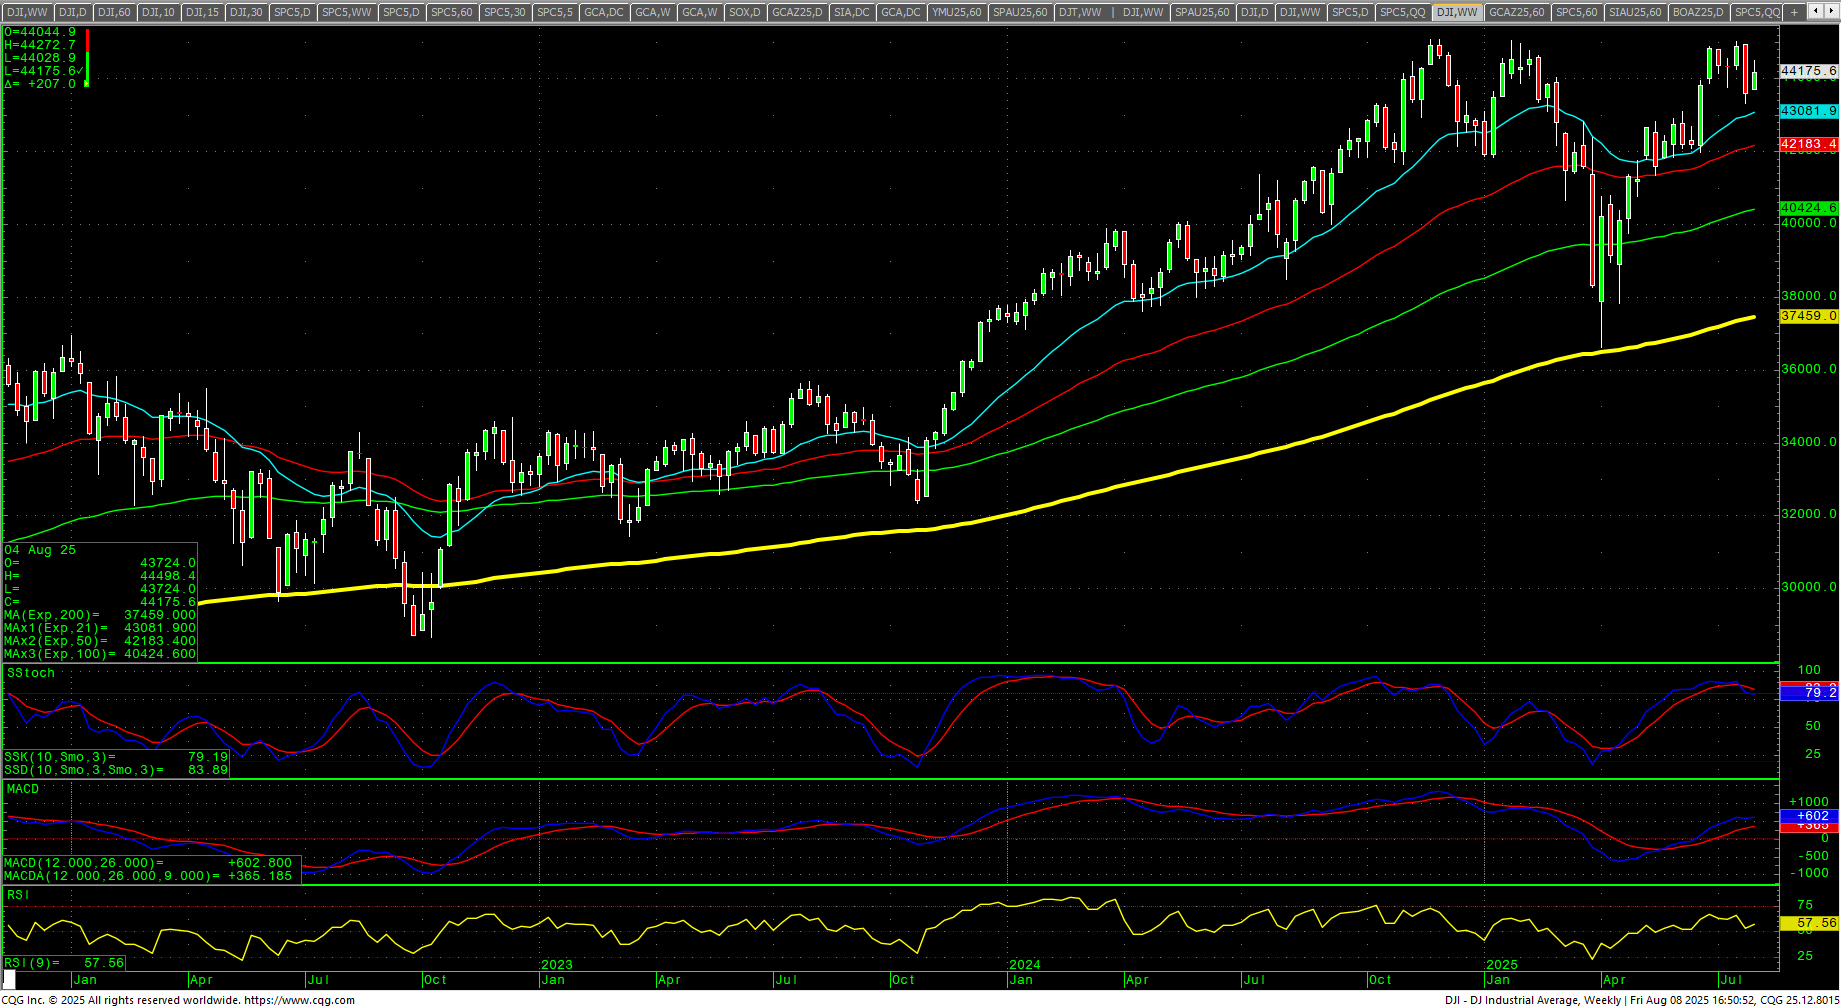 Resistance pivotal near-term at 44376/44380. A further drive above 44380 should test 44498 and 44597/44621 with potential toward 45000/45016. Closes over 45016 set up the all-time highs at 45050/45054/45074. Closes over 45074 opens counts toward 45244 and 45426/45450 (Fibonacci target) and resistance at 45306 and 45378. Rallies with closes over 45450 will reopen longer-term monthly targets in the 47400 level with targets of 46568 and 46954.
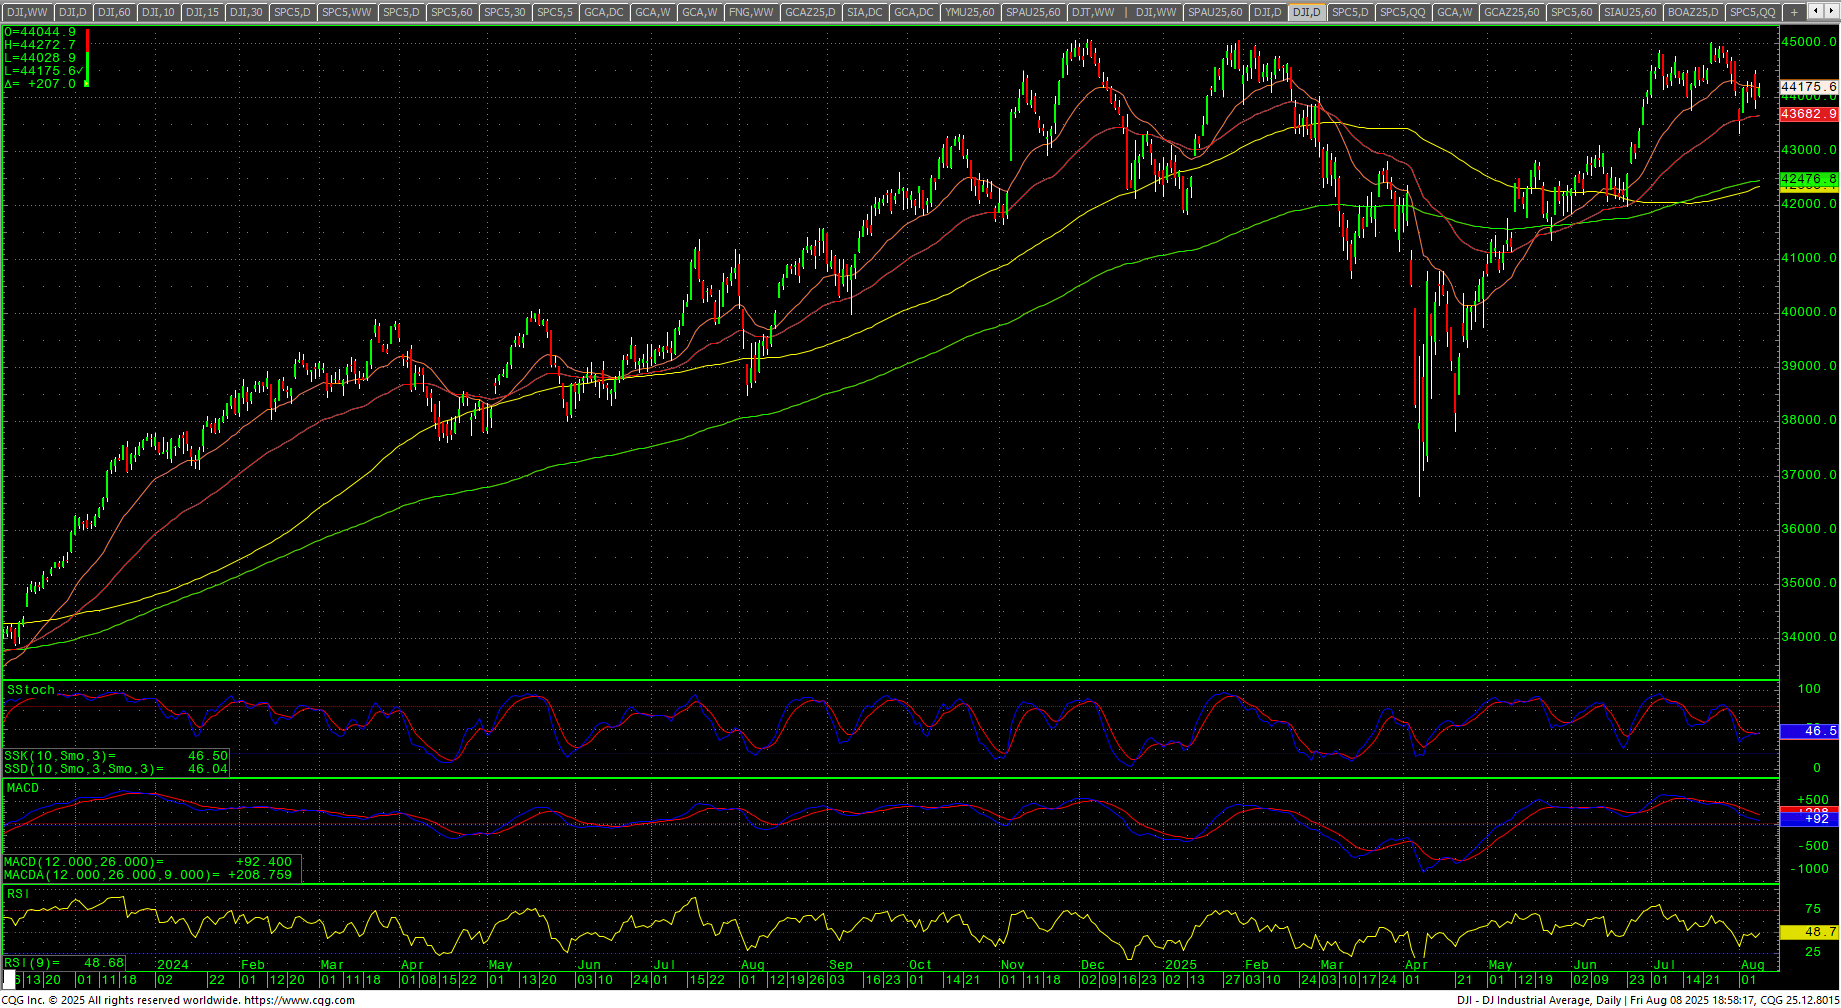
Dow Jones Industrial Average Daily Candles
| Resistance | Support |
|
|
S&P 500 Cash Index: SPX
S&P 500 Index Weekly H-L-C
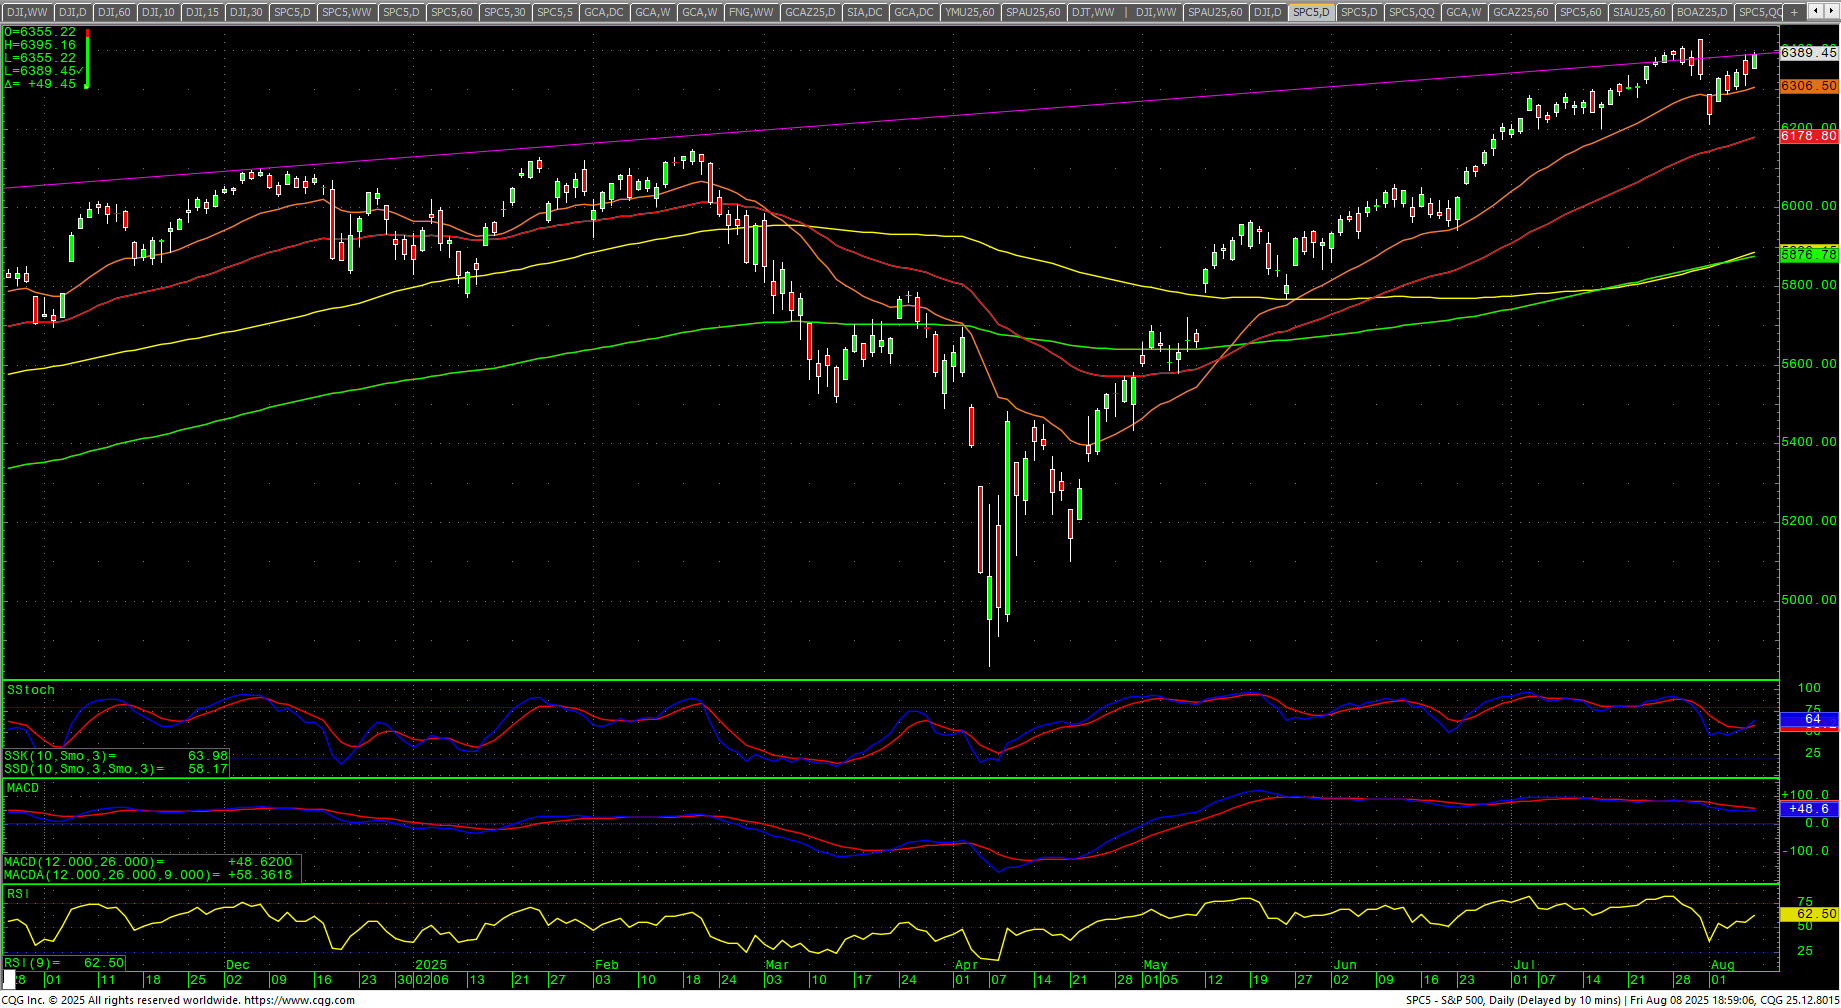
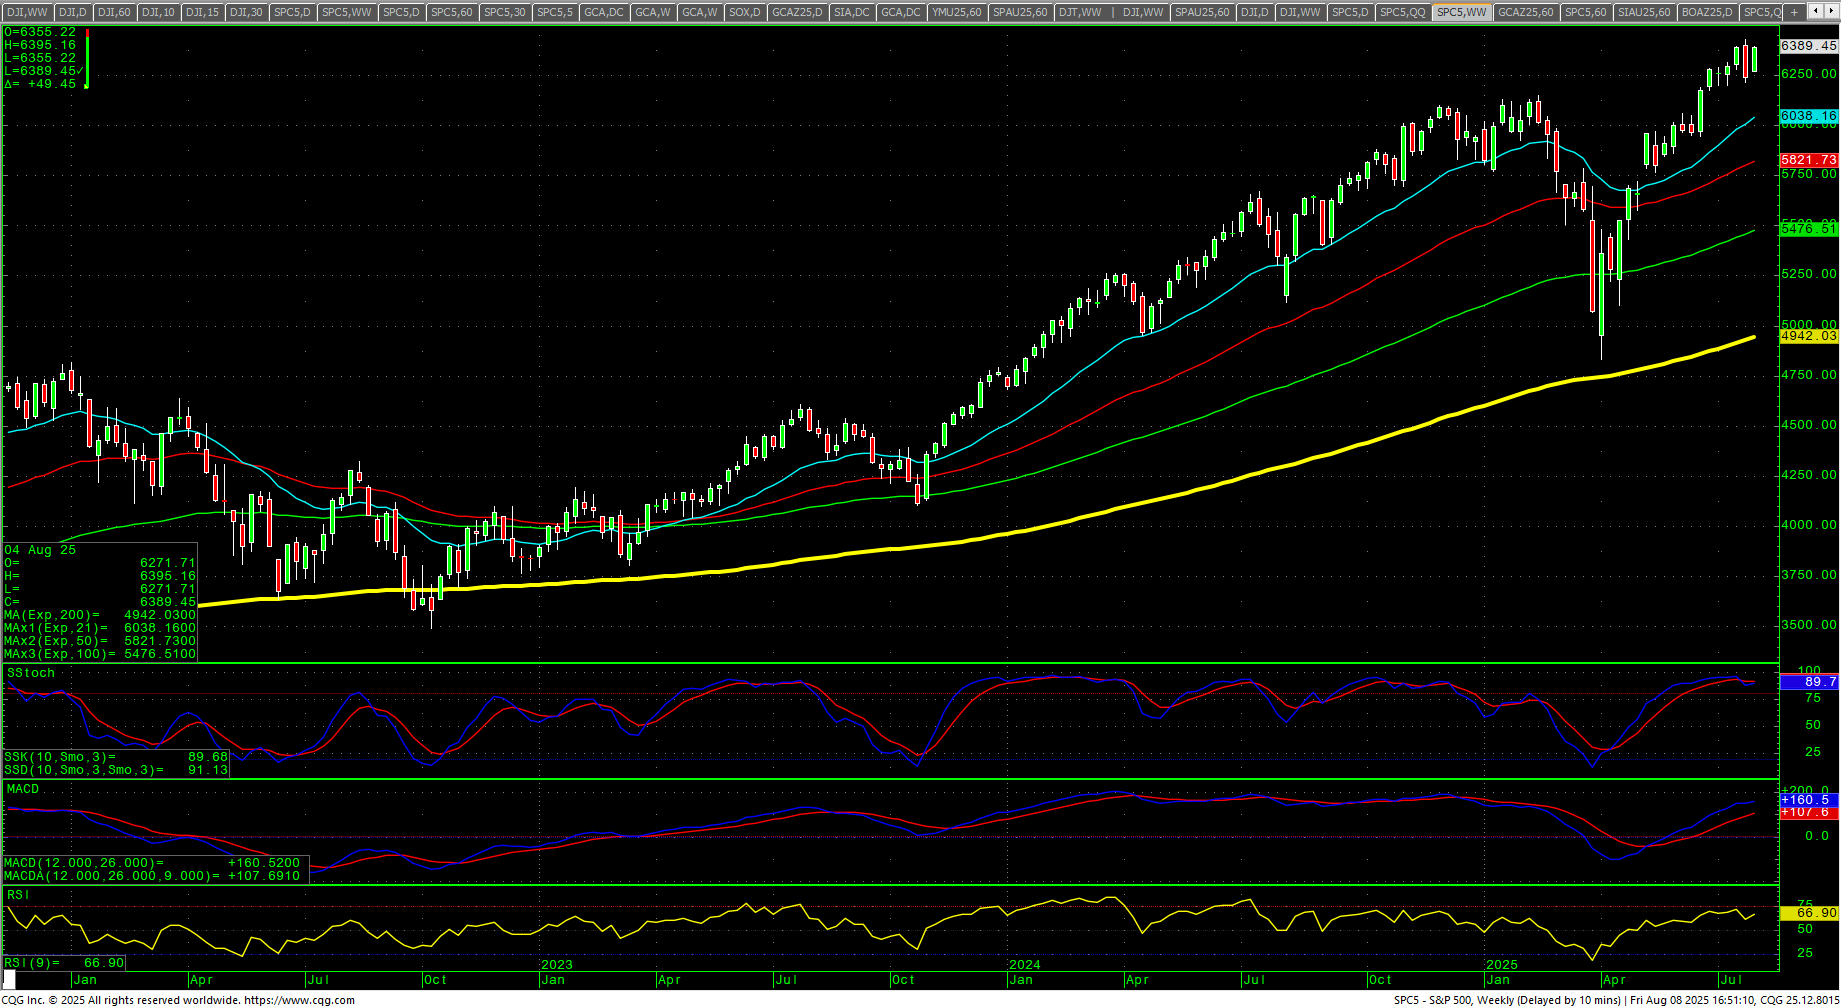
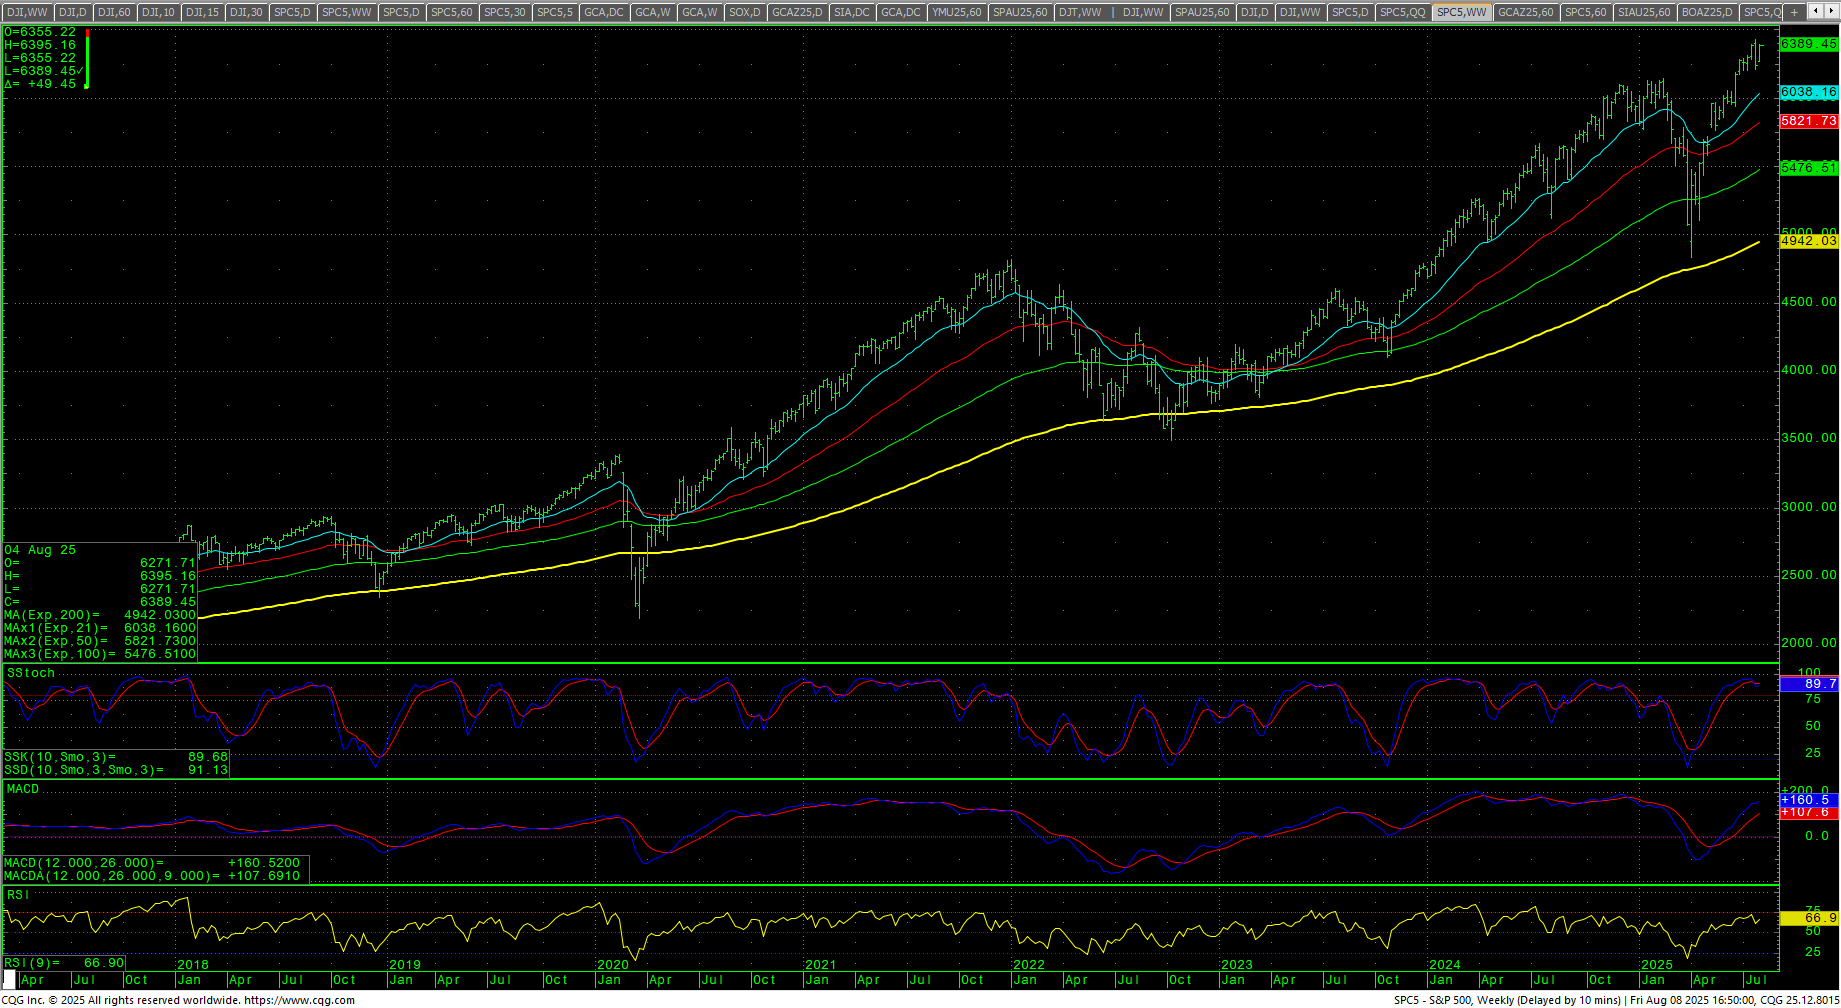 The S&P recovered the previous week’s losses and closed at a new ATH on the top end of an inside week’s range. The daily is trying to hook higher from the downturn of the bearish divergence. The weekly stochastics are still lower. The daily RSI recovered sharply to 62.50. The hourly is overbought on Friday’s close. The 200-day MA is 5876.78 and is trending higher as it sets a record high. All moving averages are at record highs. The SPY closed at an ATH.
SPY Weekly Candles
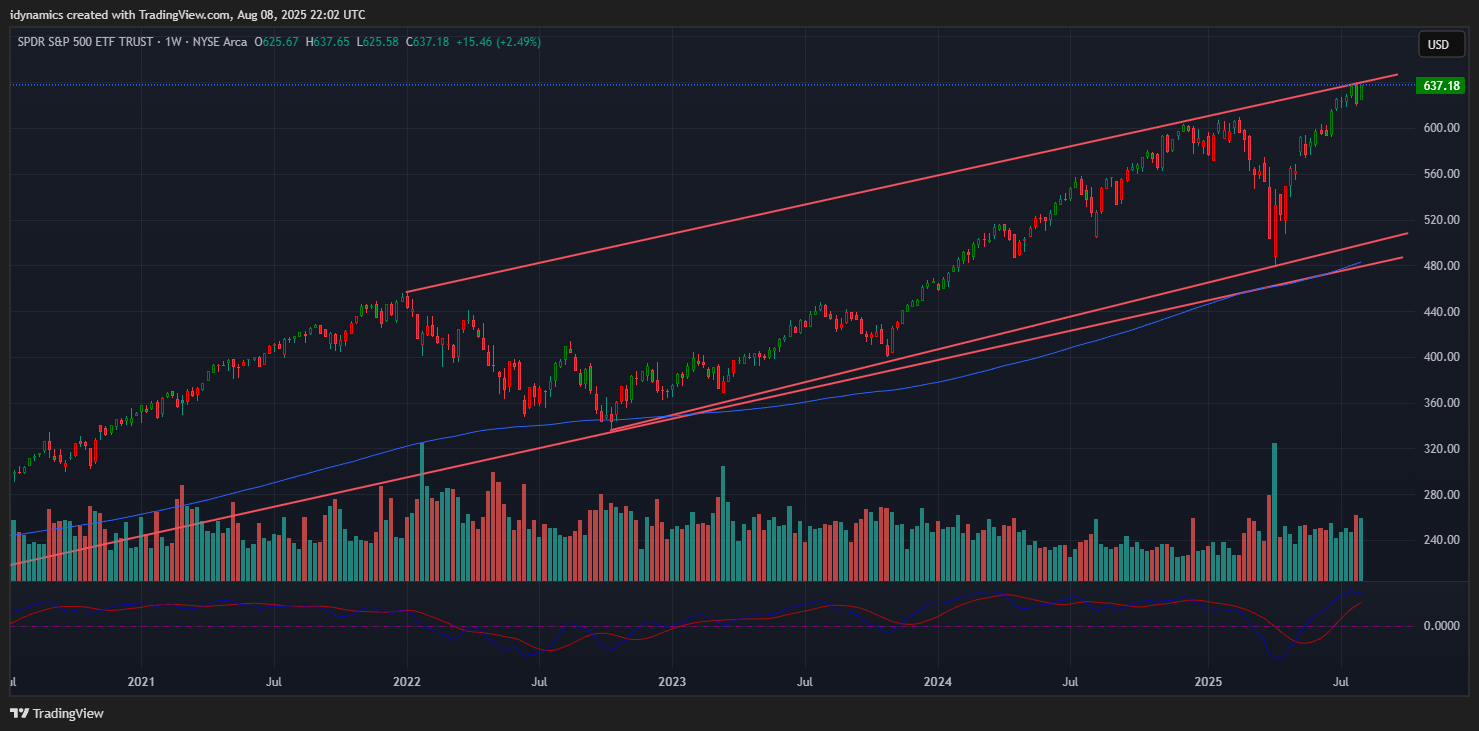 Resistance is 6294, 6403/6404 and 6319/6320. A drive over 6320 has potential to 6345/6348. Closes over 6348 should minimally test 6373/6376 with counts back to 6427 to 6440. Closes over 6440 will open counts to 6584 and resistance at 6494. A breakout over 6584 sets up 6638 and 6692. A breakout with closes over 6692 sets up 6764 and 6800. Closes over 6800 can carry to 6872 and 6908. Closes over 6908 have counts to 6944 and 6980.
S&P 500 Index Hourly H-L-C
 Support is 6352 and 6325. Under 6325 sets up 6303 with counts to 6282/6280. A breakdown under 6280 should minimally test 6258/6255 with counts to the hourly double bottom at 6201/6194 and 6156/6155. Closes under 6155 set up 6122 and 6050/6047. A breakdown under 6047 sets up critical near-term support at 5818/5817. Daily closes under 5817 are bearish to 5631 and 5443/5440. Closes under 5440 open counts to 4995 with support at 5305.
| Resistance | Support |
|
|
Charts courtesy of CQG, Inc., CNN, Koyfin, Trading View and AAII