
TECHNICAL ANALYSIS (by Intraday Dynamics)
Major Indices Week of August 15, 2025
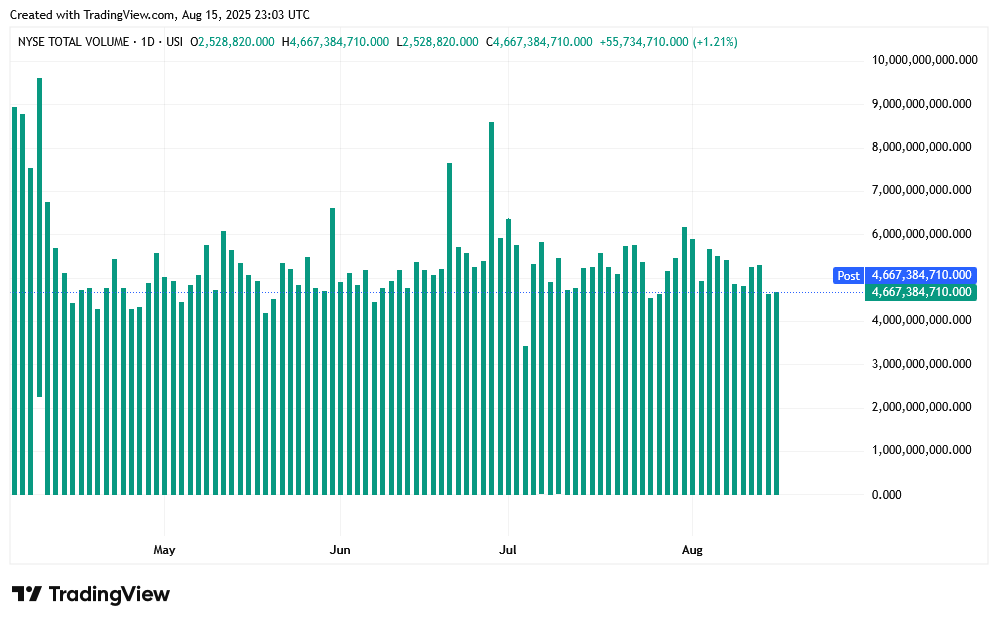
 NYSE Volume
 MAGS+ORCL+PLTR+AVGO Daily Candles
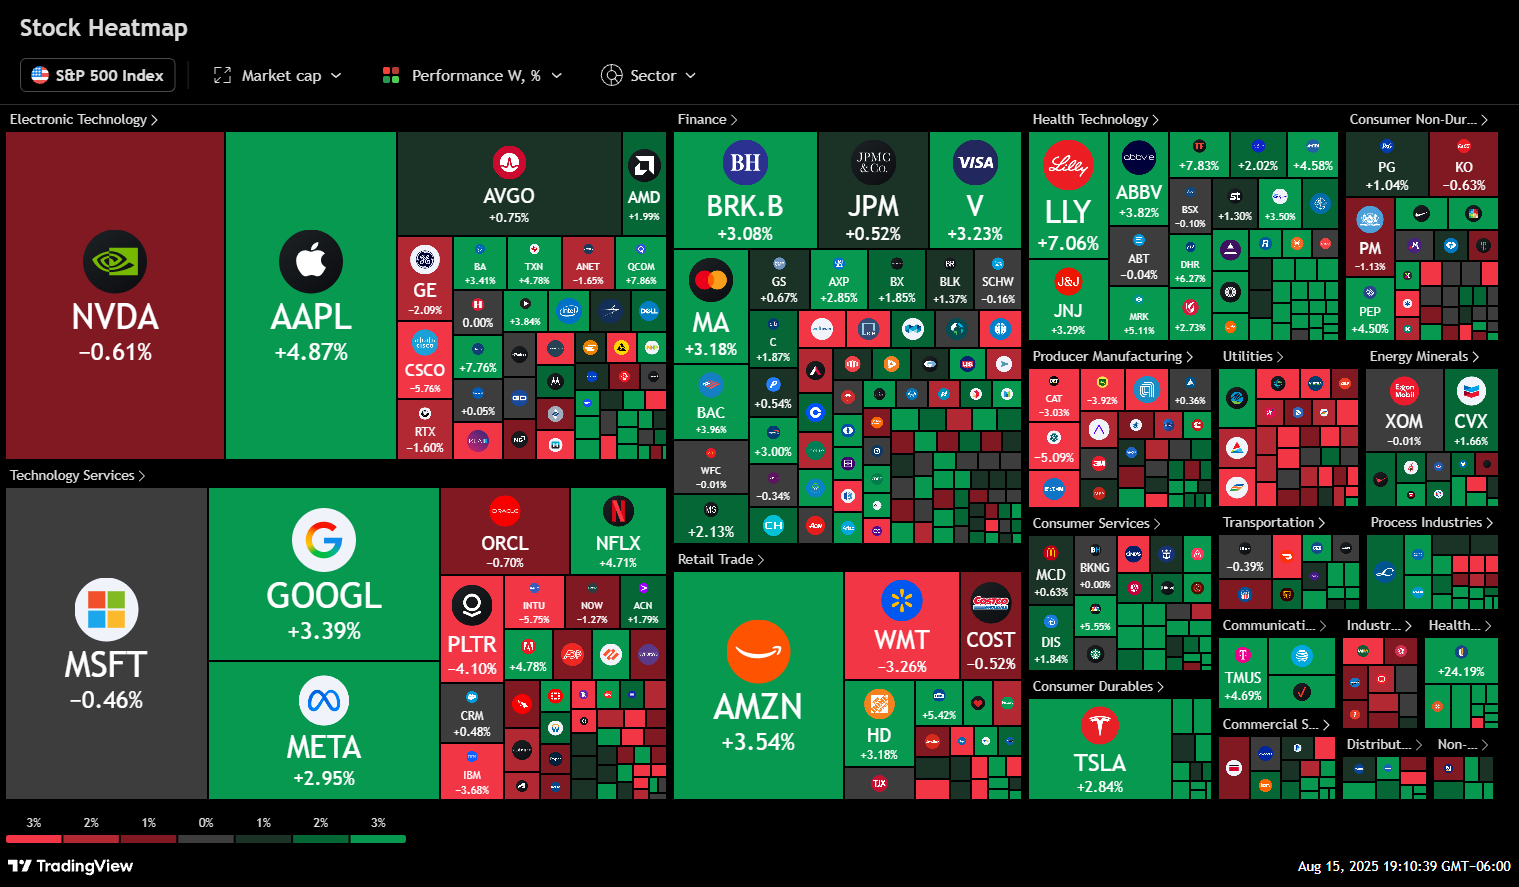
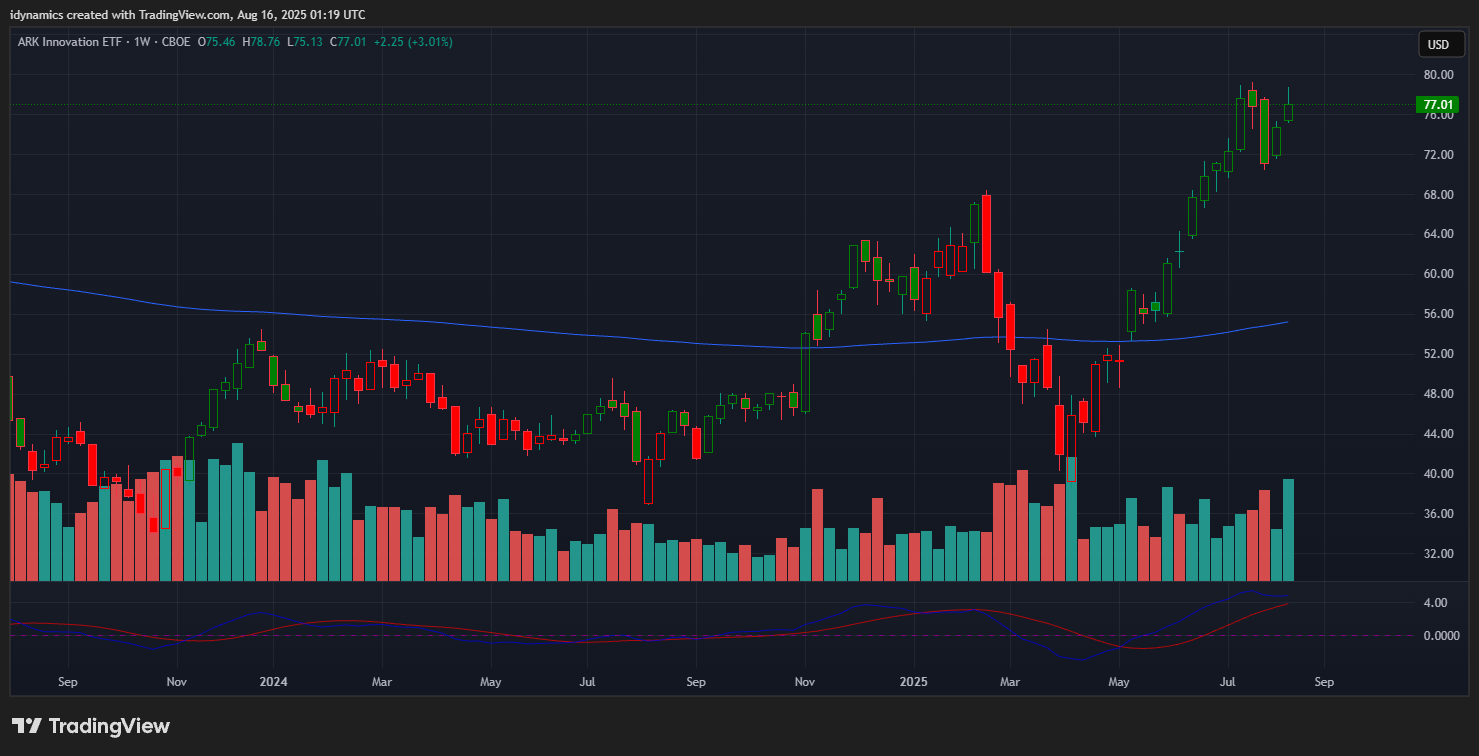
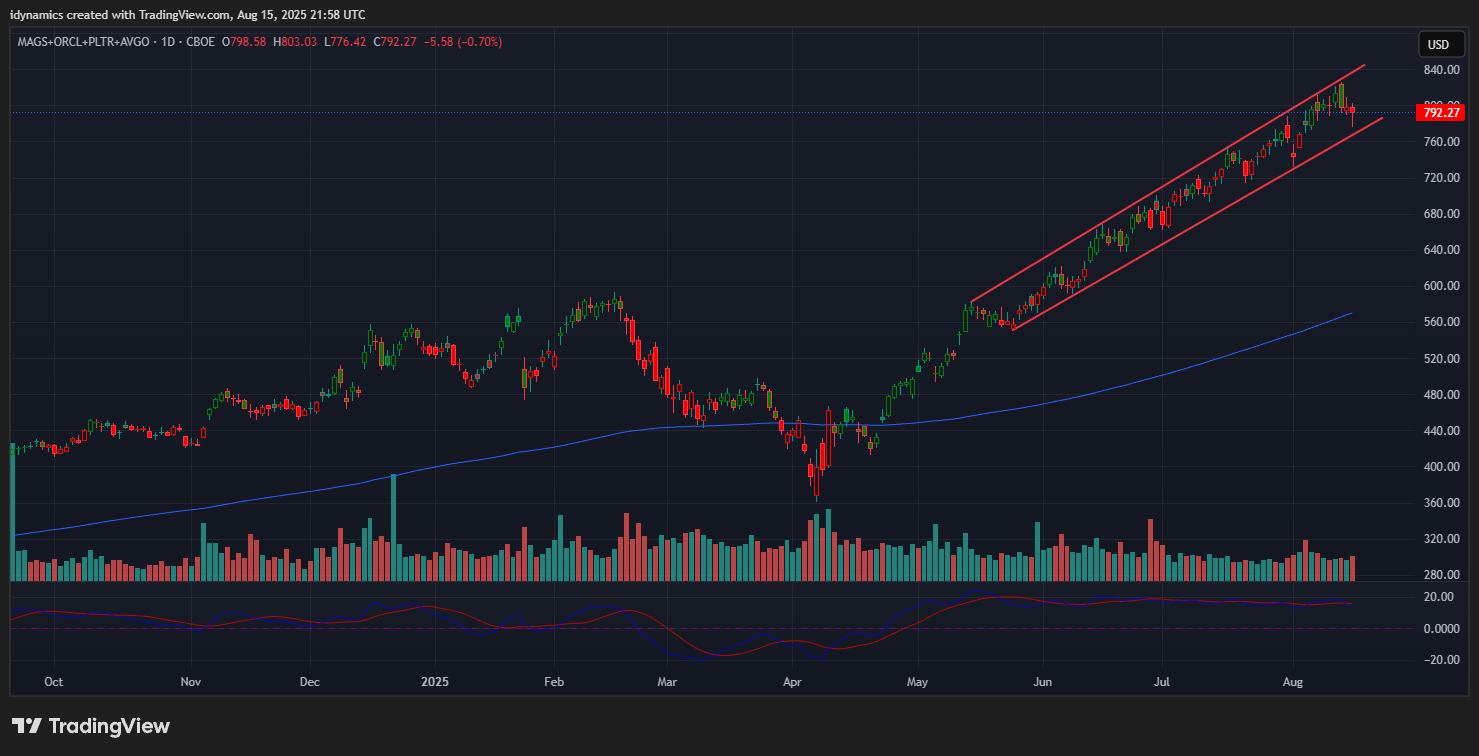 As goes tech, so goes the market. Stocks moved into record high territory across the board in a week filled with a huge amount of economic data while yields on the 10YR rose. Tech showed a slight crack into the end of the week as the Dow traded a new intraday high and set a new weekly high close…but ended just under the record high set in December of 2024. As the chart above shows, the combined chart of MAGS+ORCL+PLTR+AVGO has been in a steep uptrend and has risen 200% from the April lows. This chart mimics ARKK, meaning small hands continue to load up on stocks.
Nasdaq/M2 Money Supply Monthly
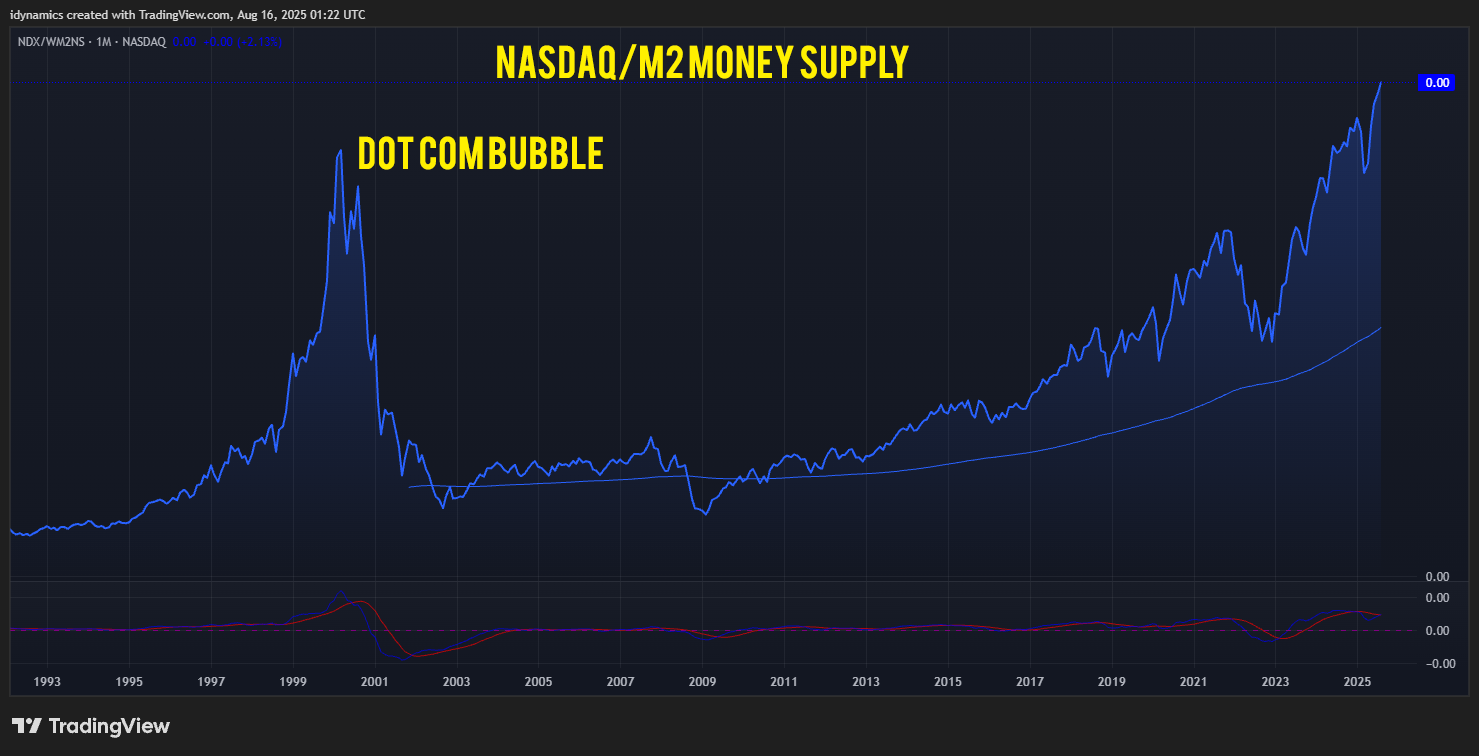 Last week marked extremely critical cycle timing and the action away from this trade is key to short-term trends.
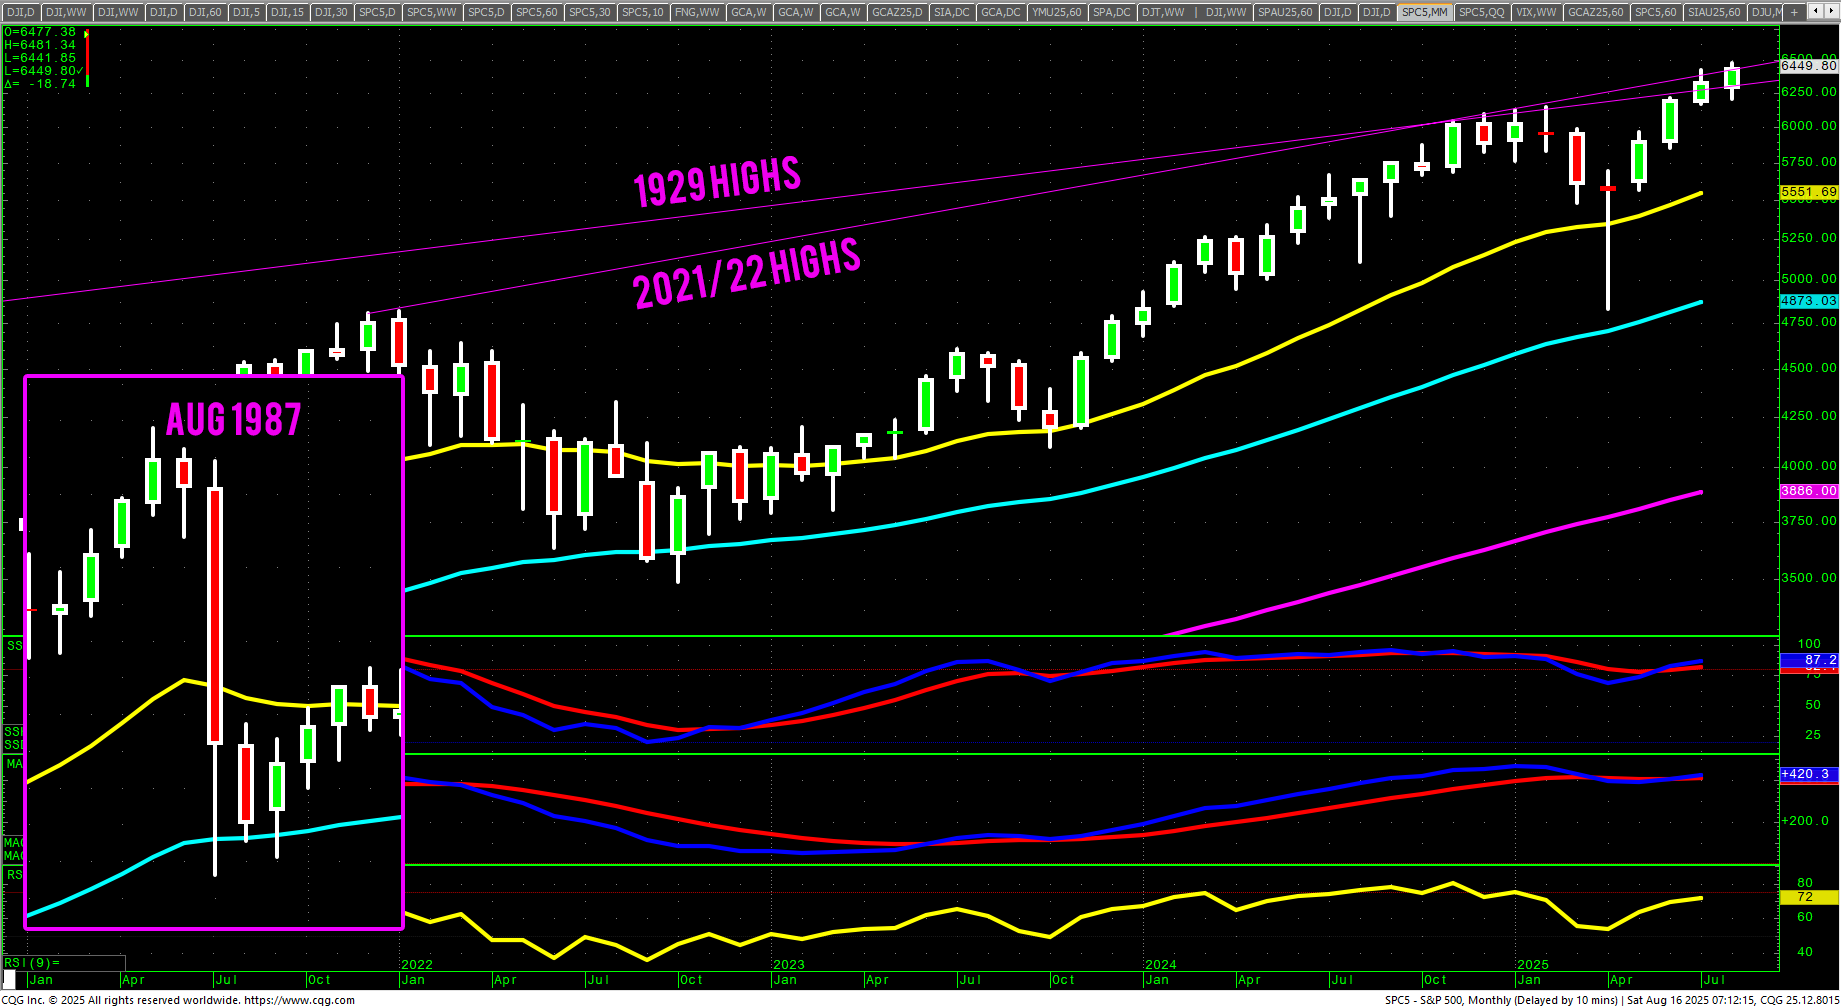
 The rally last week saw a massive flip in funds as the SPX gained positive gamma above 6400. Small traders (retail) and meme stocks continue to dominate trade. “Remember in the last Cycle Timing Update, I pointed out that the parallel to 1987 is very real…and, in that year, prices moved higher into late August and then started a correction. If we are truly rhyming, this may be the case for 2025.”
The reality is that we are now in a 6-9 month window of extremely volatile longer-term cycles. August is when things really heat up with the cycles. The Dog Days of summer are directly ahead. August is a month where there is strong potential for an exogenous event to occur.
SPX Monthly Candles
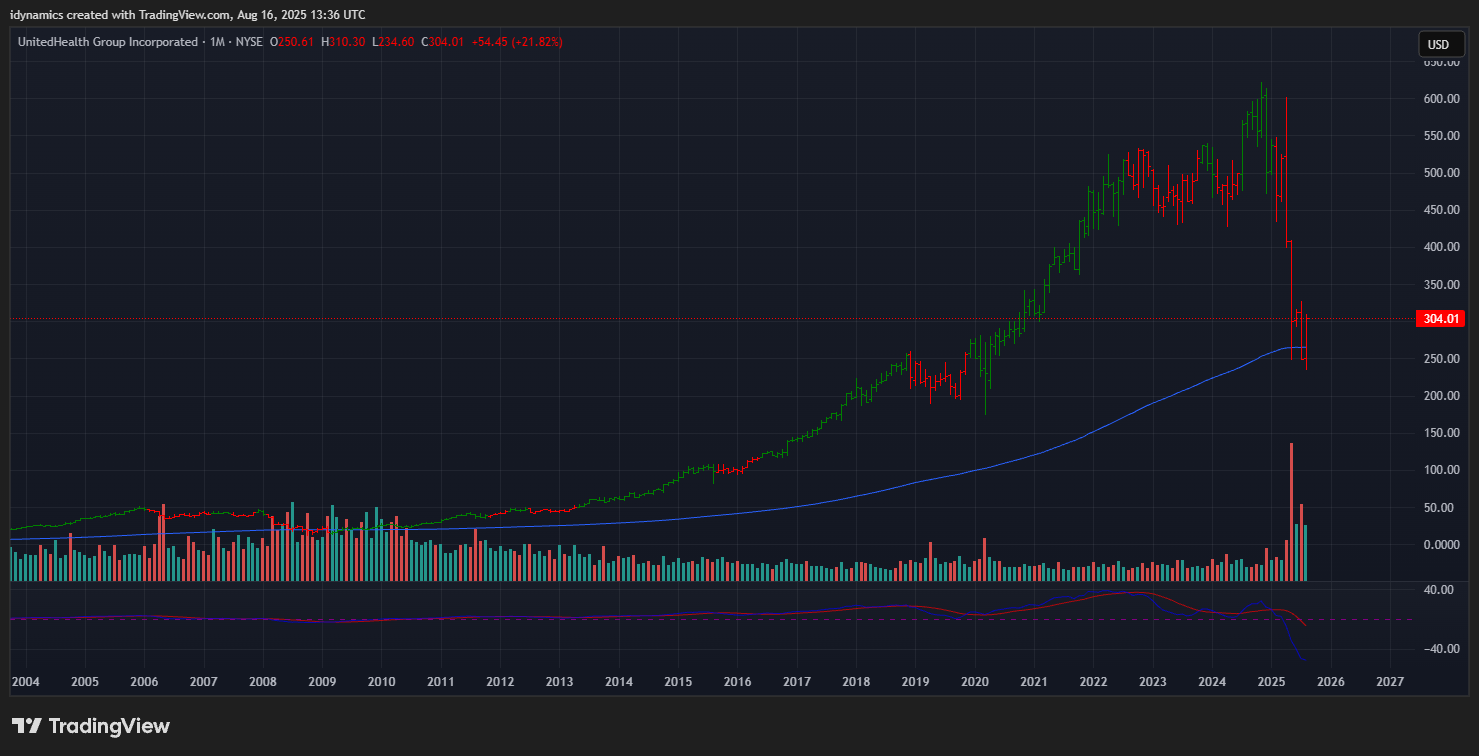
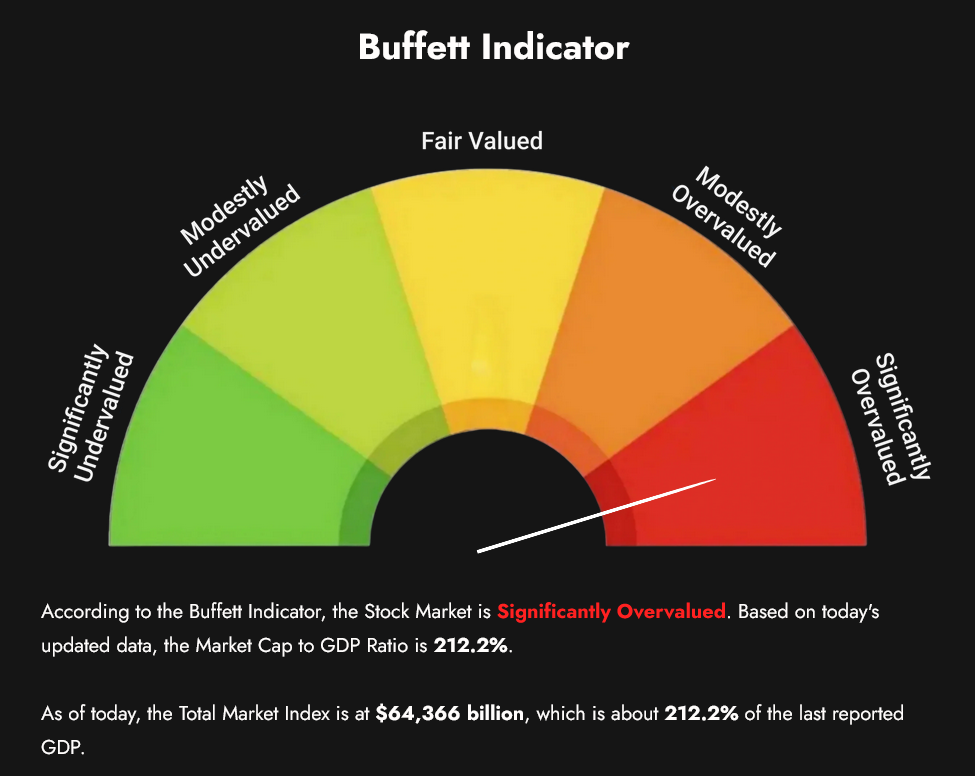 Sentiment moved into Extreme Greed again in a number of places, although breadth is still struggling. The Buffet Indicator moved to an ATH at +212.2%. Why is Berkshire sitting on $350 Billion in cash while retail traders pile in? (Note: It was announced the past week that Berkshire made a large investment in United Health).
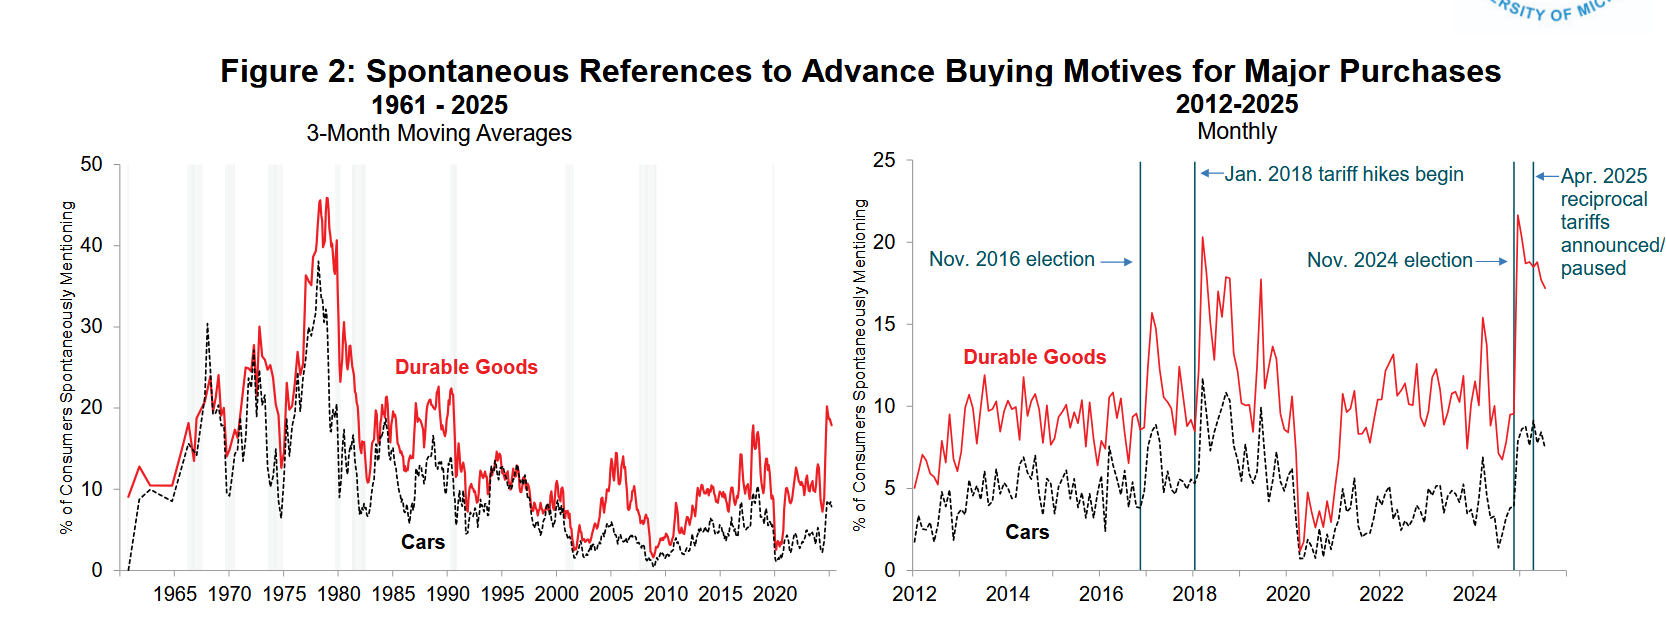
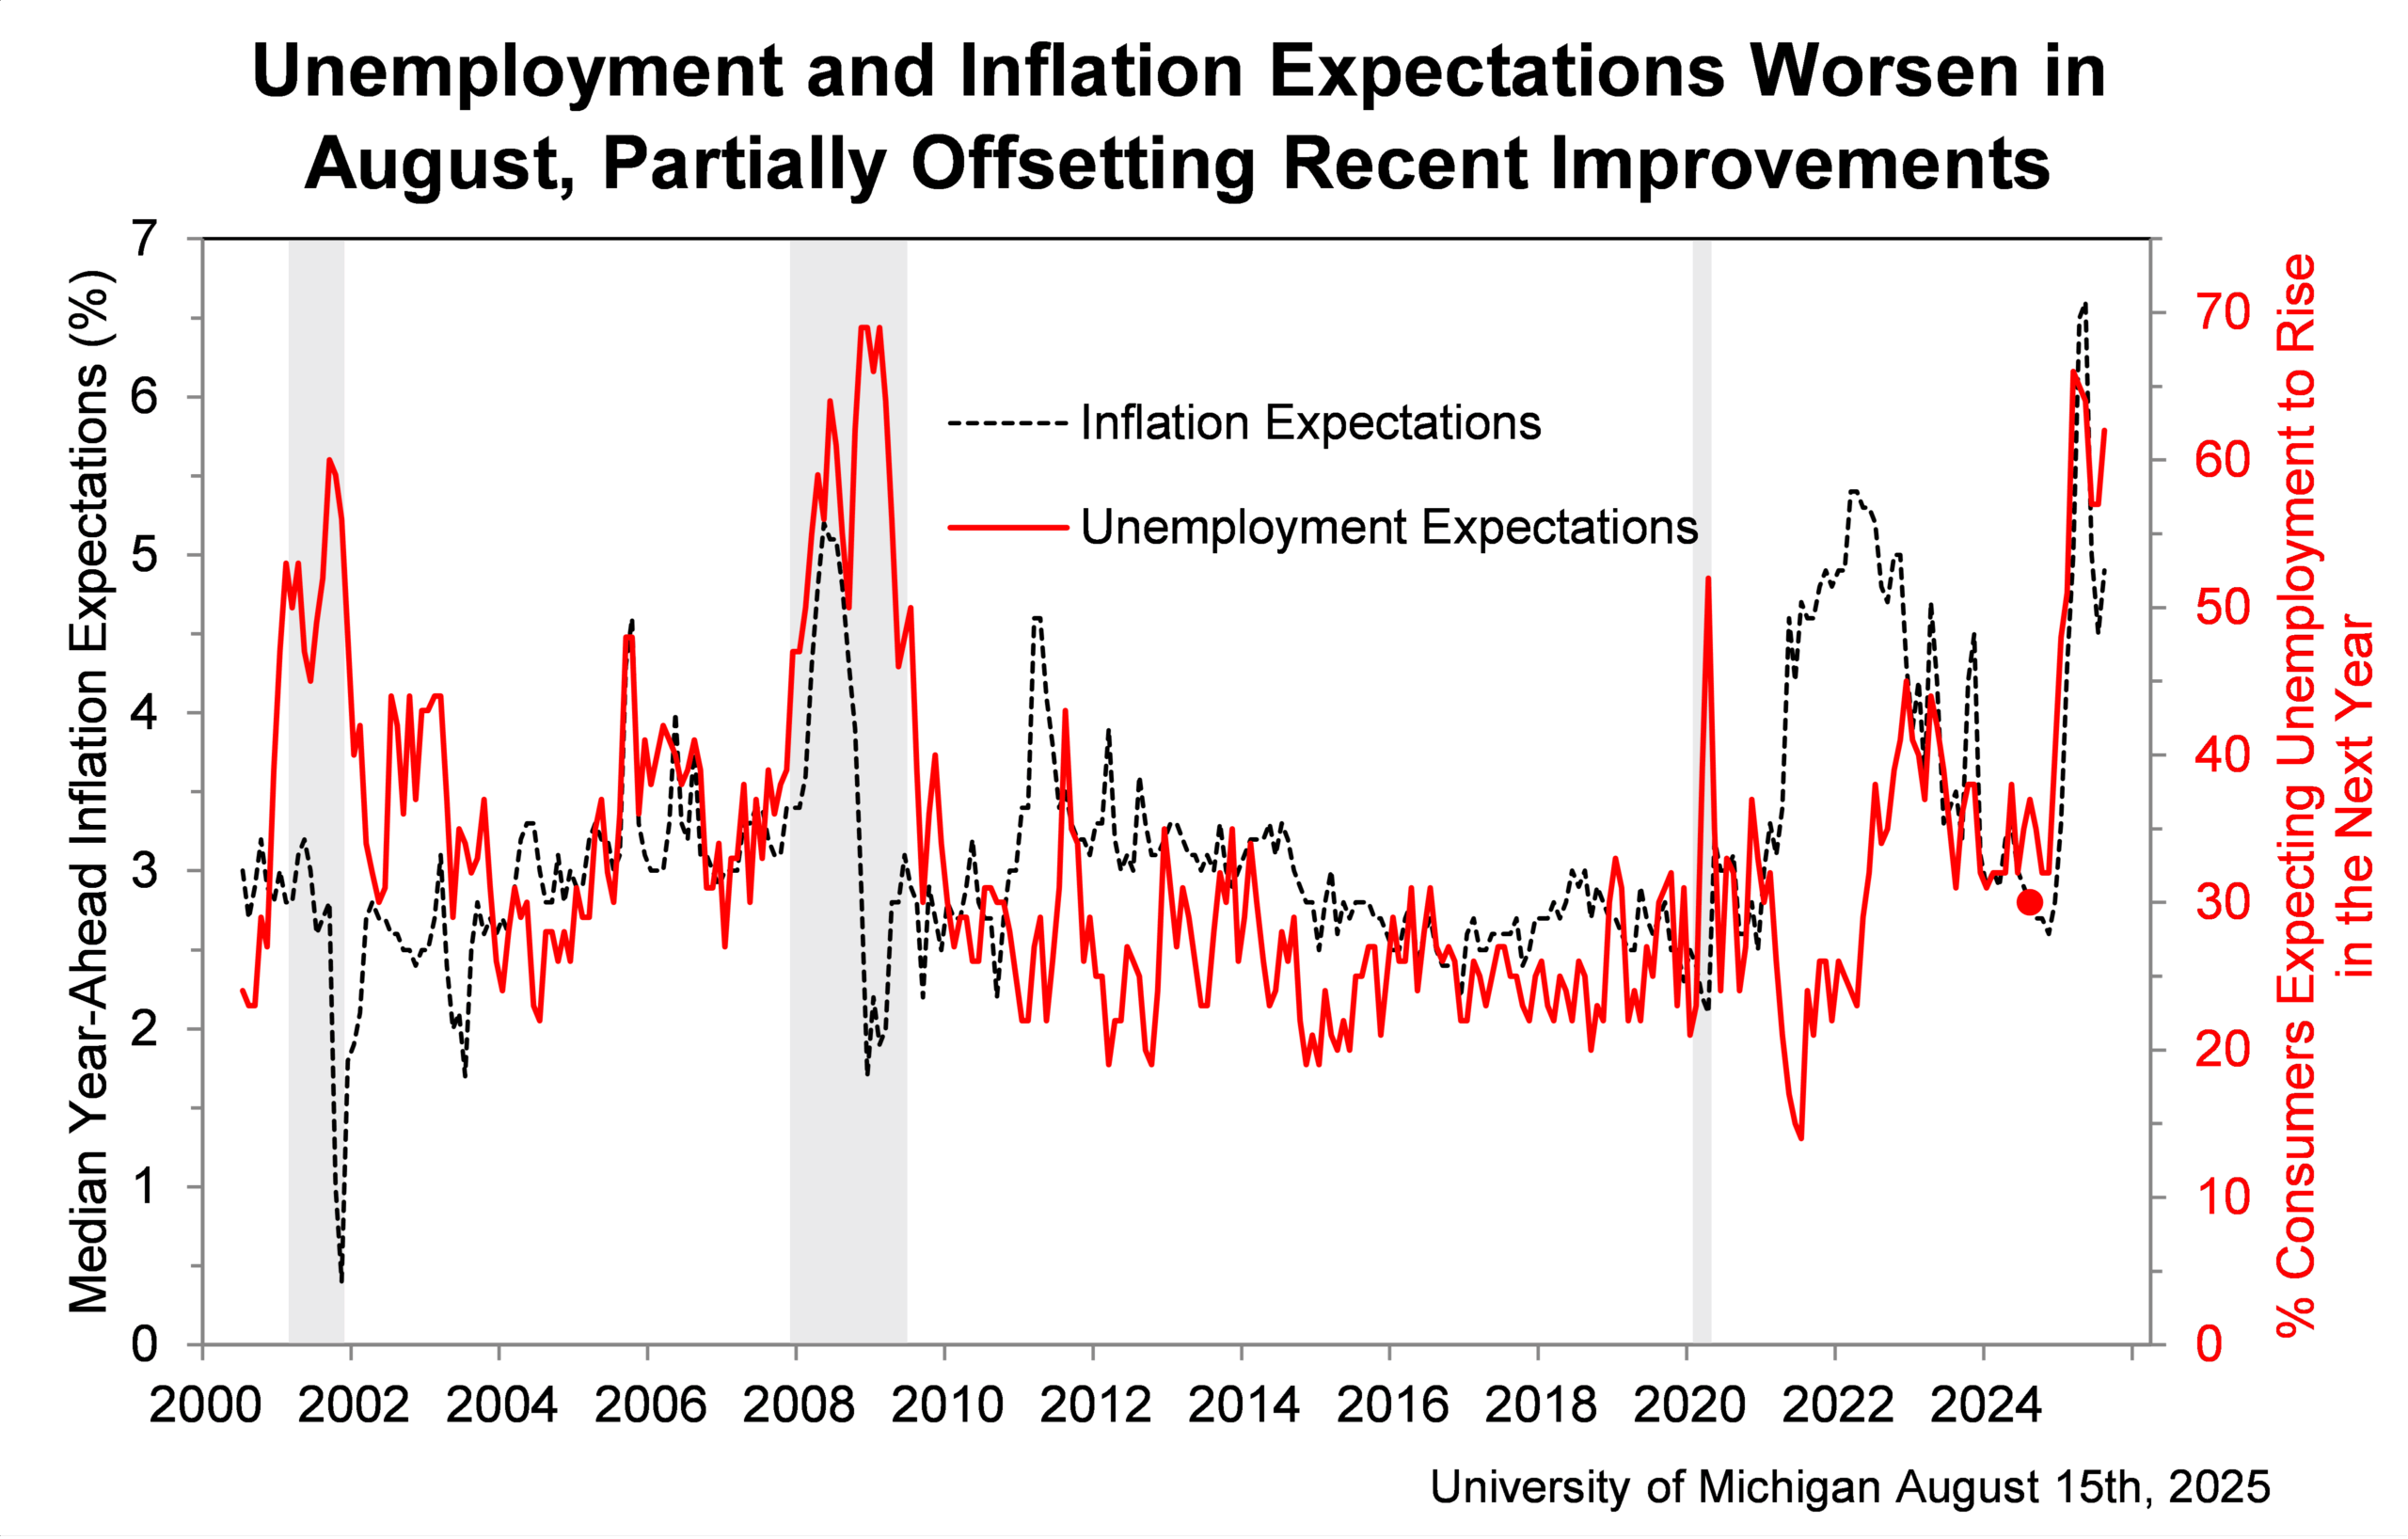 The University of Michigan’s preliminary Consumer Confidence dropped back toward a two-decade low, and inflation and jobs expectation deteriorated sharply.
*There are no technical signals that are obvious for the market, but we sold two September E-mini Dow (YMU) futures on Friday based solely on the cycle timing. Entry points were 45340 and 45119 for an average of 45229.5. Stop right now is 45290. Order to buy one contract is 44650.
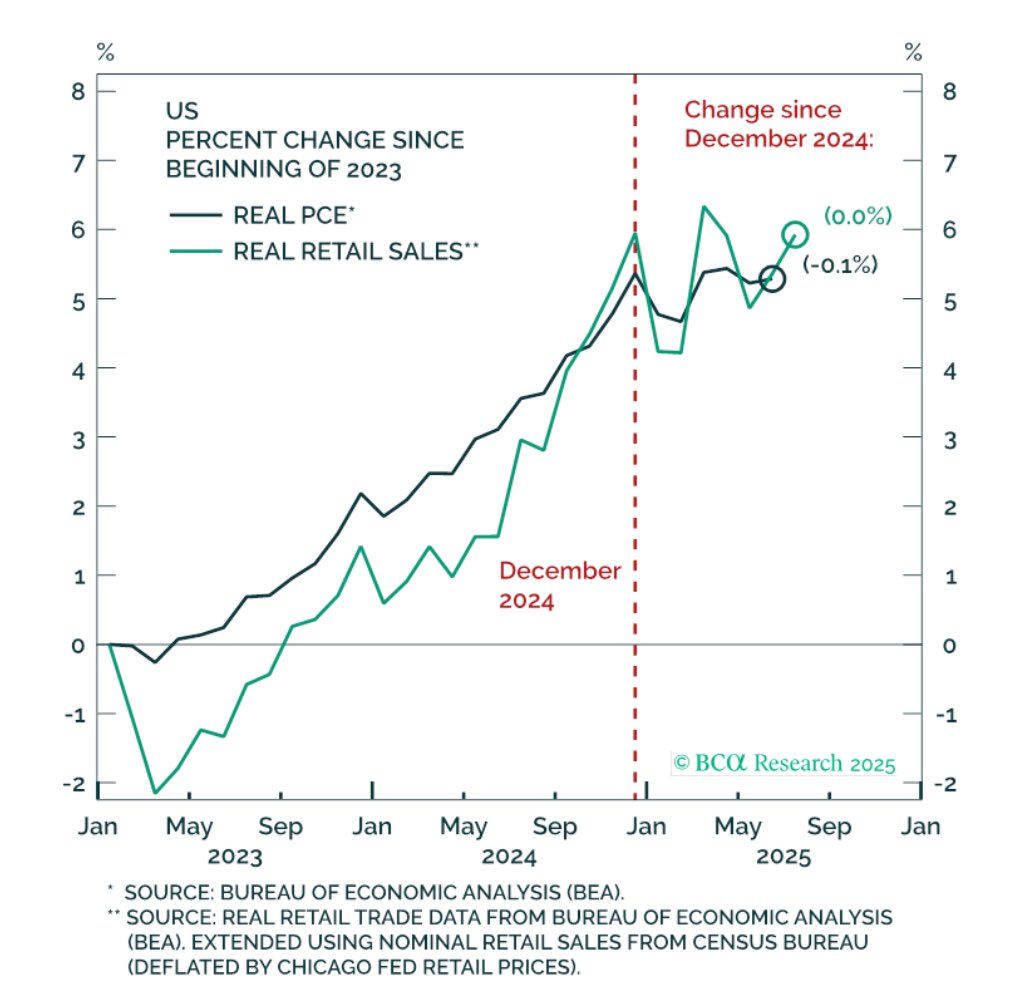 Friday’s Retail Sales data and the June revisions still leave the 2025 number flat at 0.0% and Real PCE is -0.1% for the year.
S&P 500 Stocks Above the 200-day MA
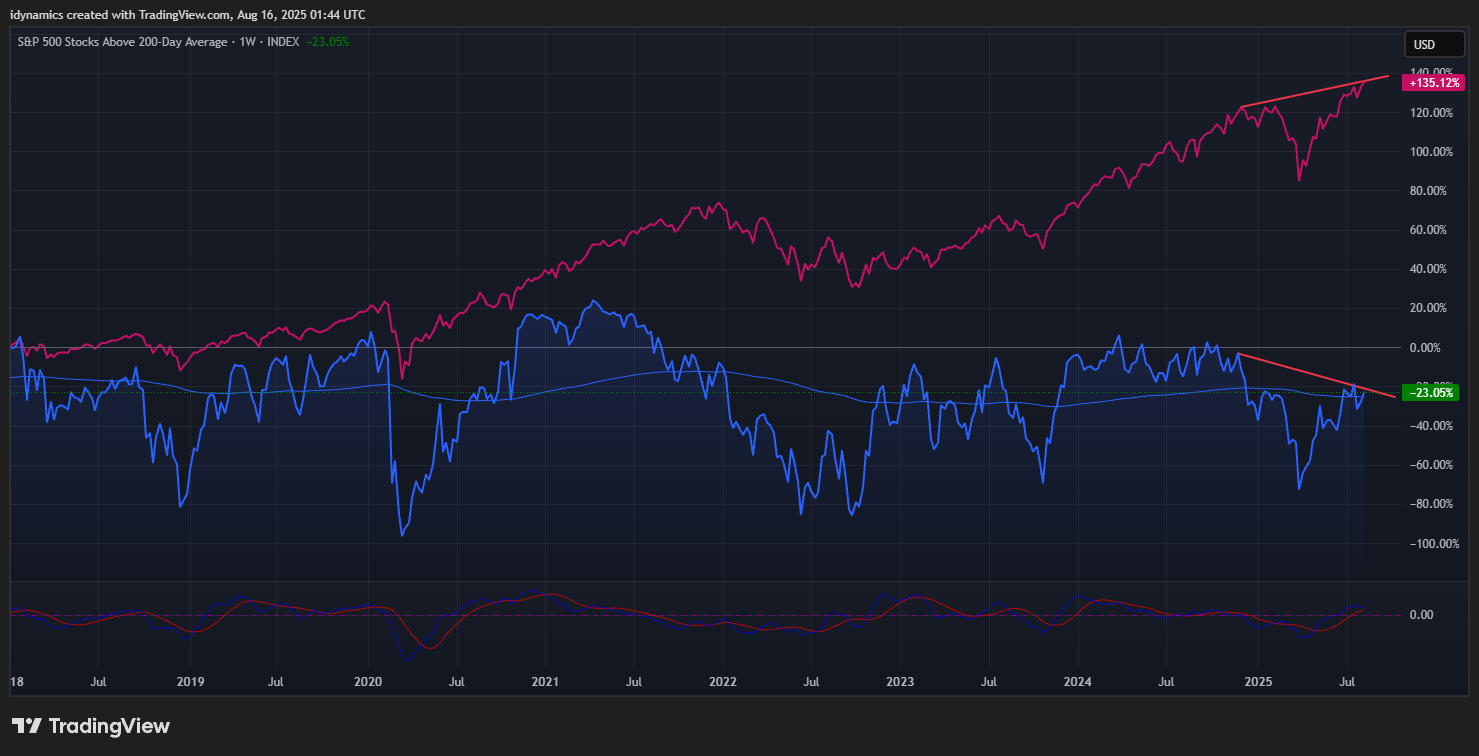 Breadth notched slightly higher on the week, with the percentage of stocks above their 200-day MA moved to 60.03%. The swing high is 63.94%. The high on 27 January 2025 was 63.61% and 72.92% in September 2024 and 82.70% in March of 2024. Divergence remains the name of the game. Given that only 10 stocks now make up 40% of the SPX, this is not unexpected. 10 stocks have accounted for 80% of the gains in the SPX since ‘Liberation Day.’
MAGS (Magnificent 7) Weekly Candles
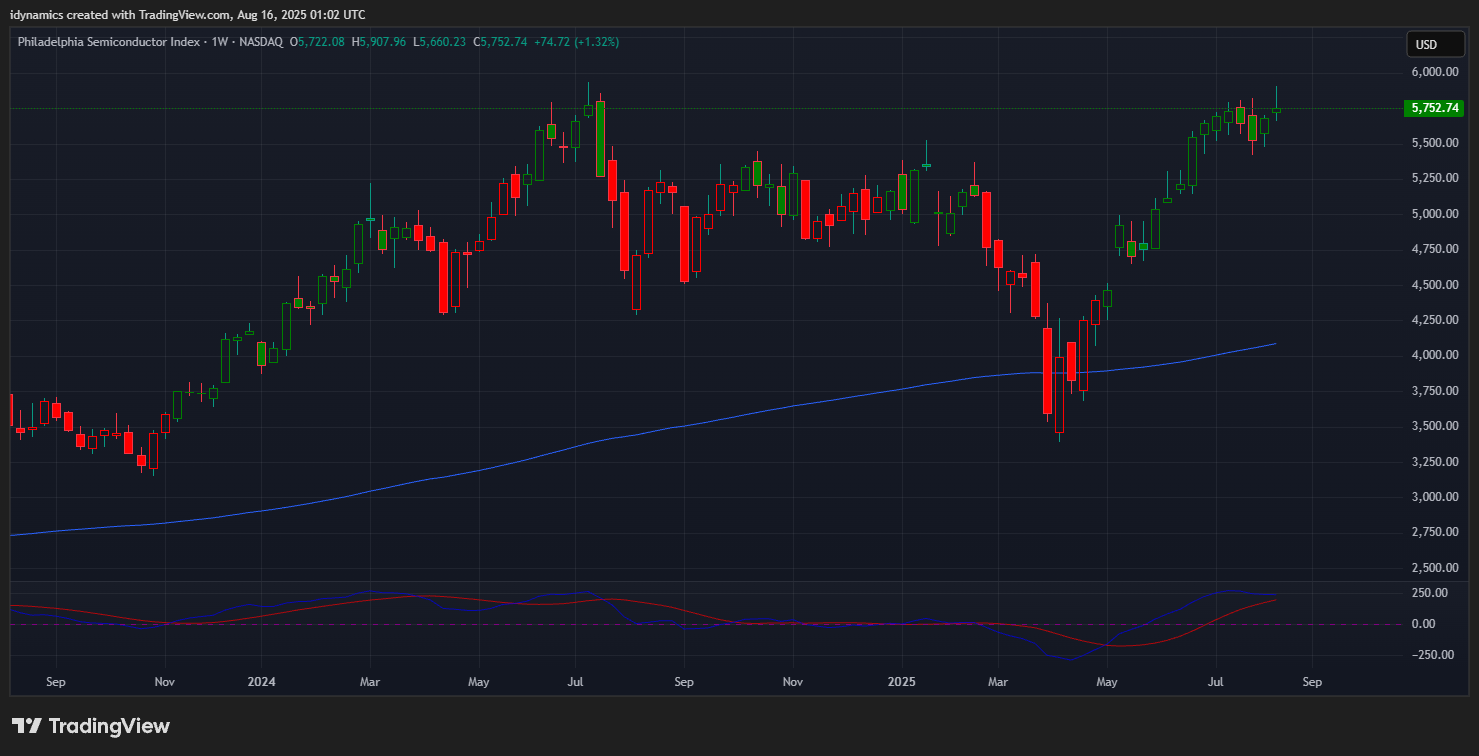
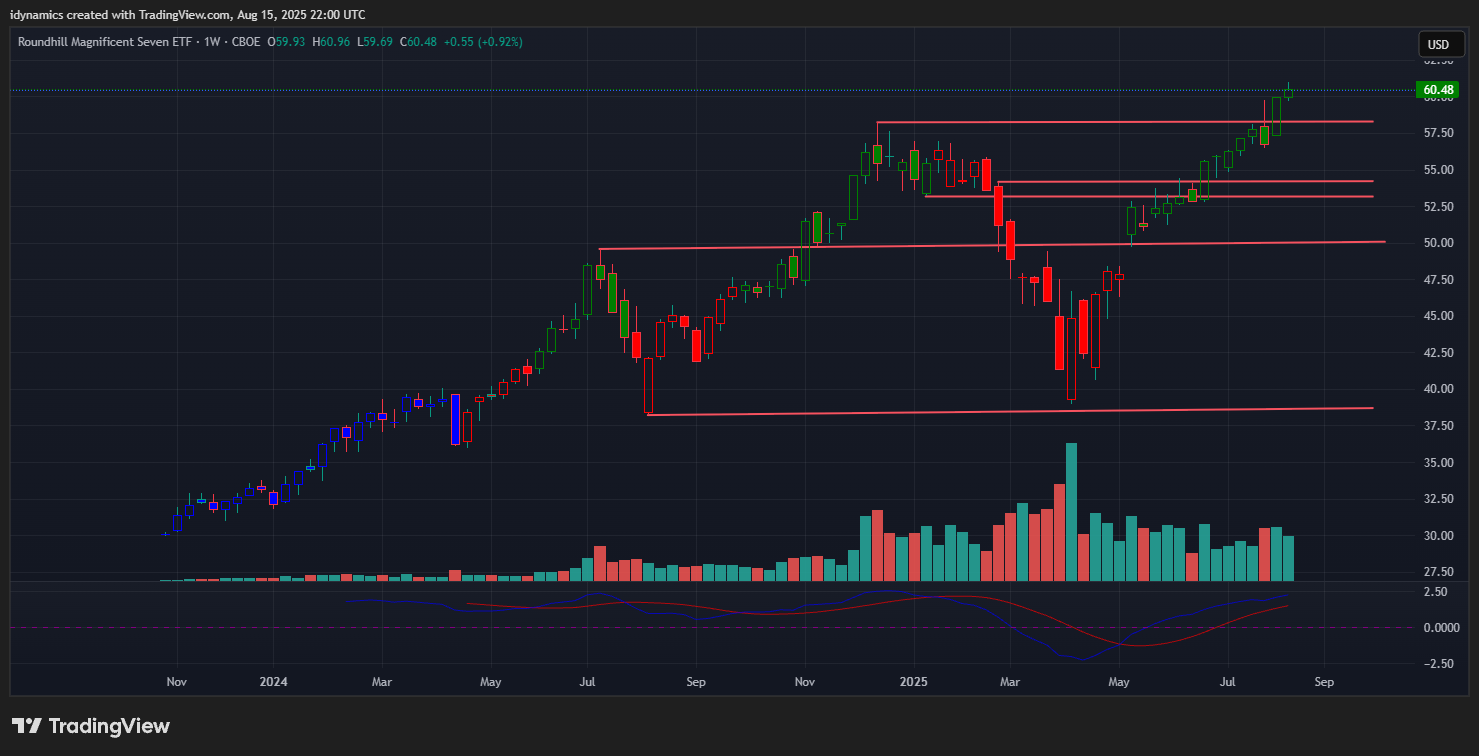 The MAGS set record highs during the week and settled flat on Friday. Prices cleared resistance of 60. There is an upside target of 63.04 and resistance at 64.50. The market should still see support against the 54.16/53.14 level. MAGS closed the week up +0.92% in the upper end of the week’s range. Both the SOX and SMH closed toward the lower end of their ranges after the SMH hit a record and the SOX tested its ATH.
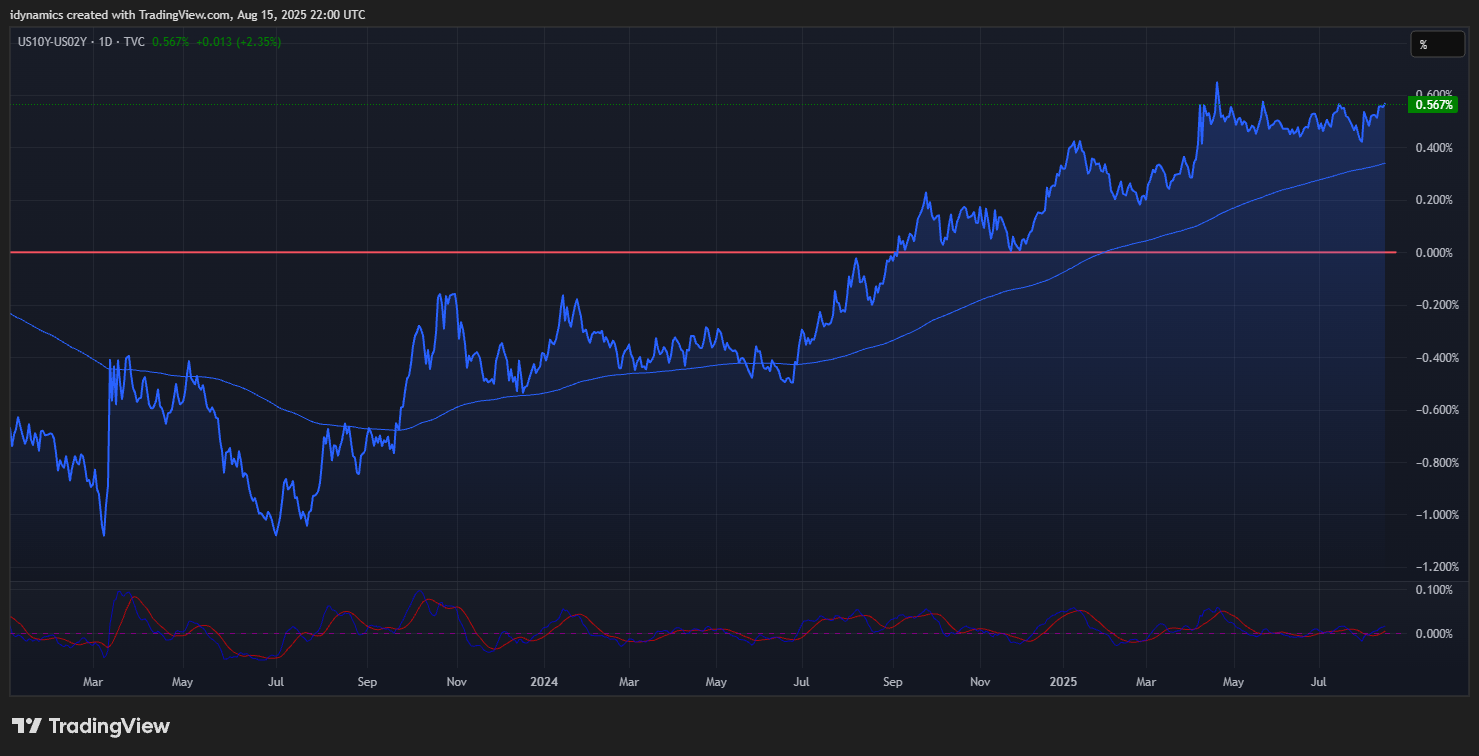
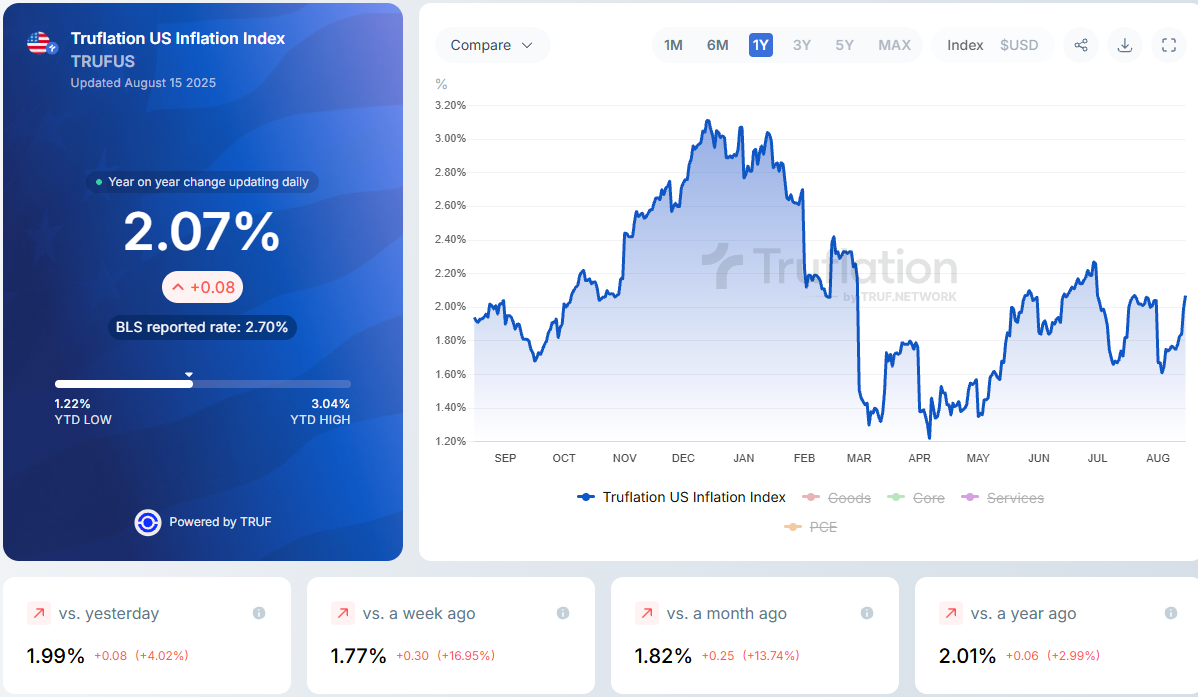
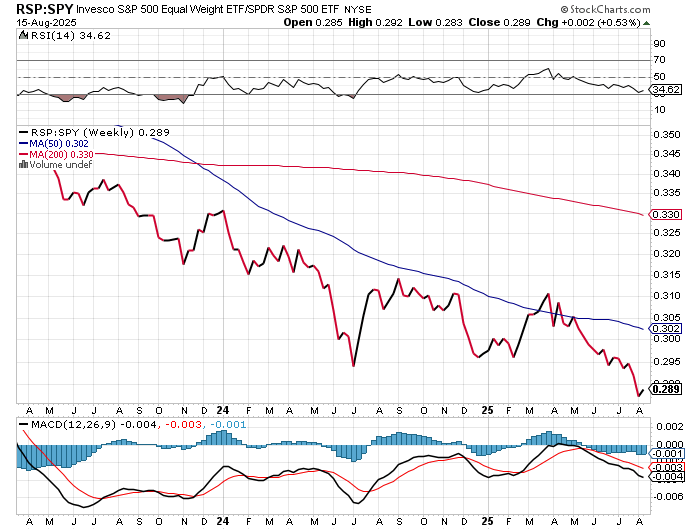
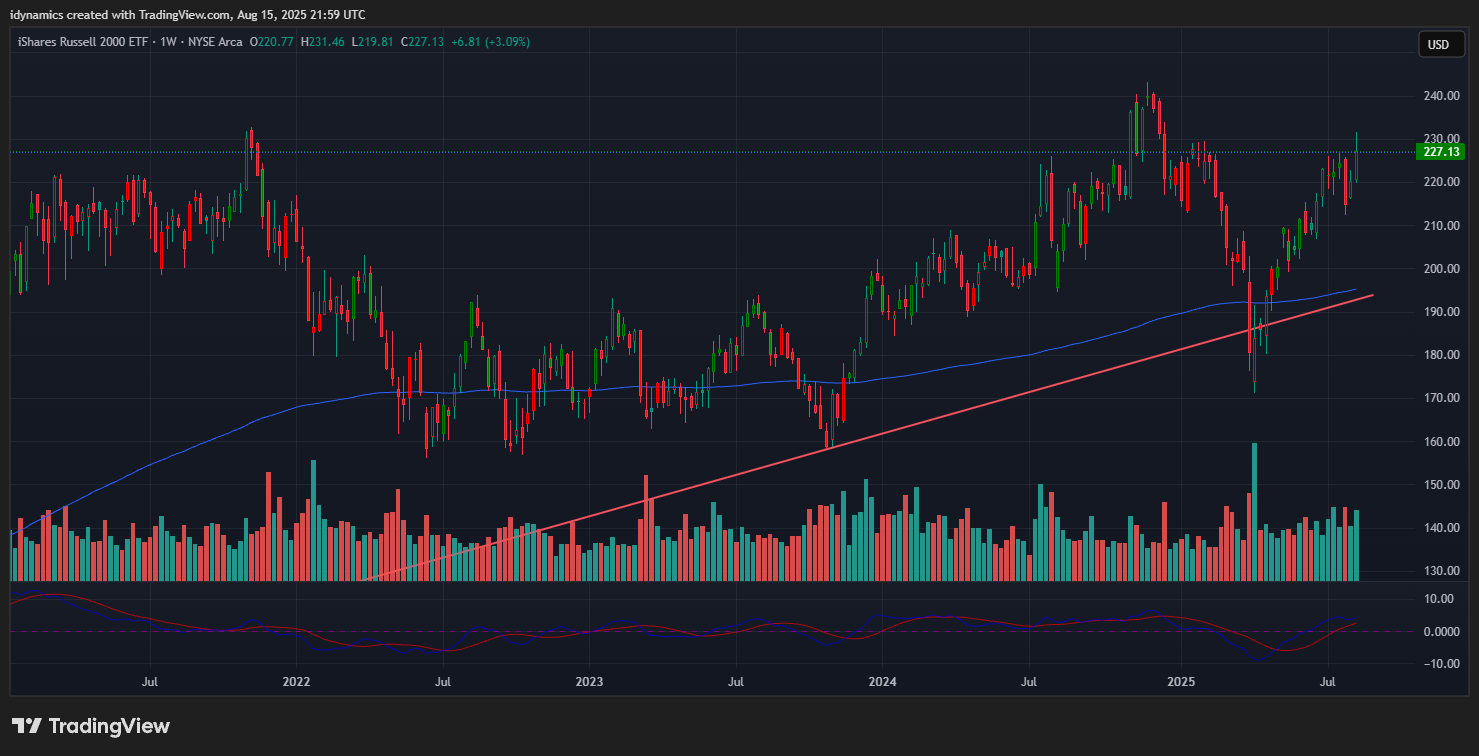
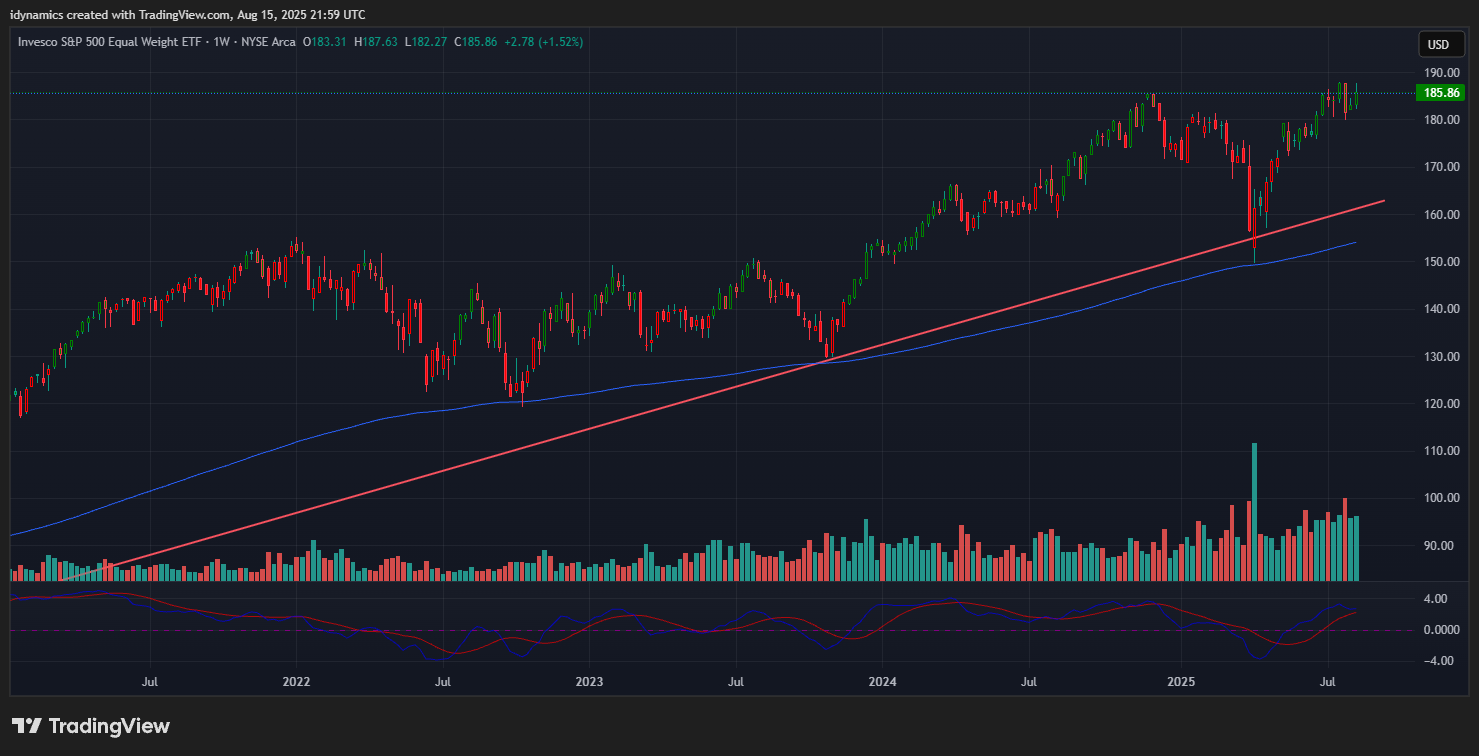
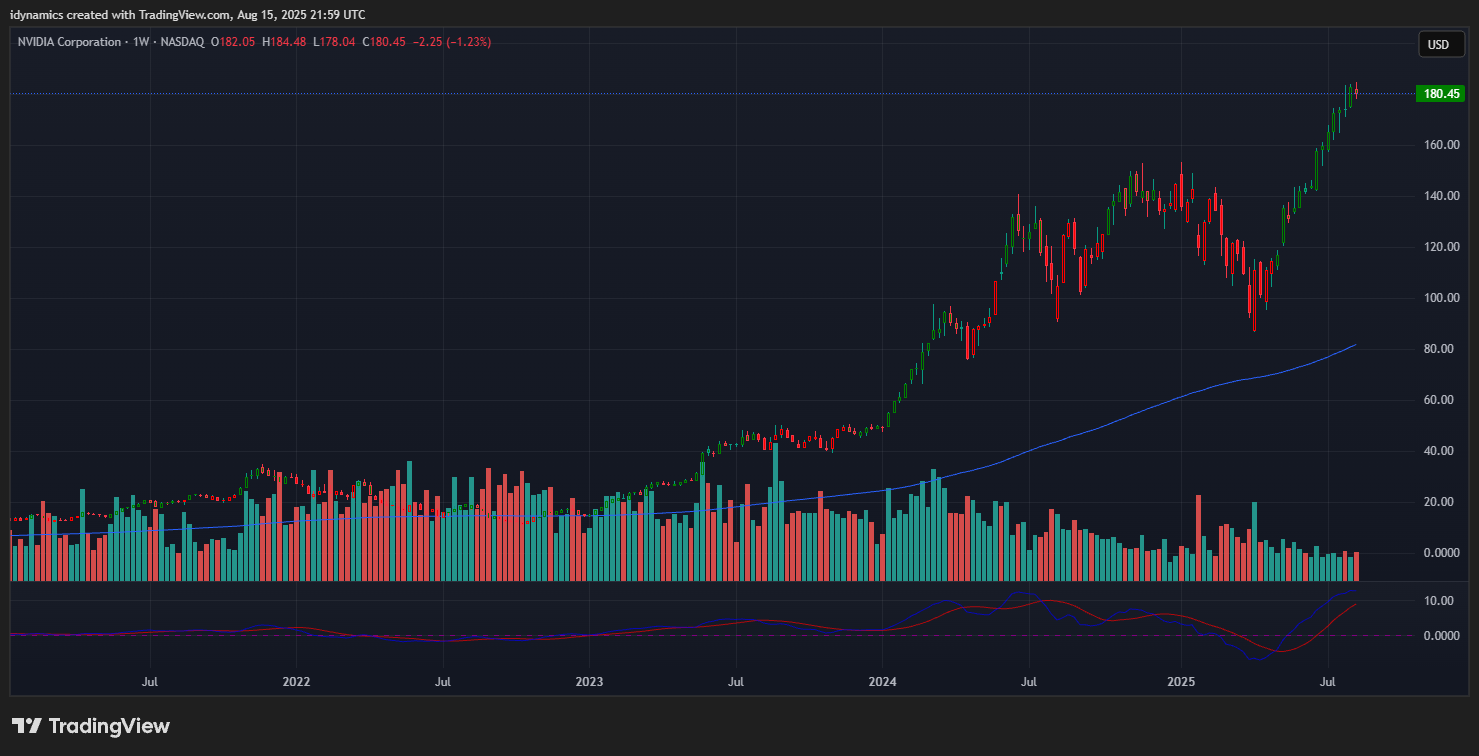
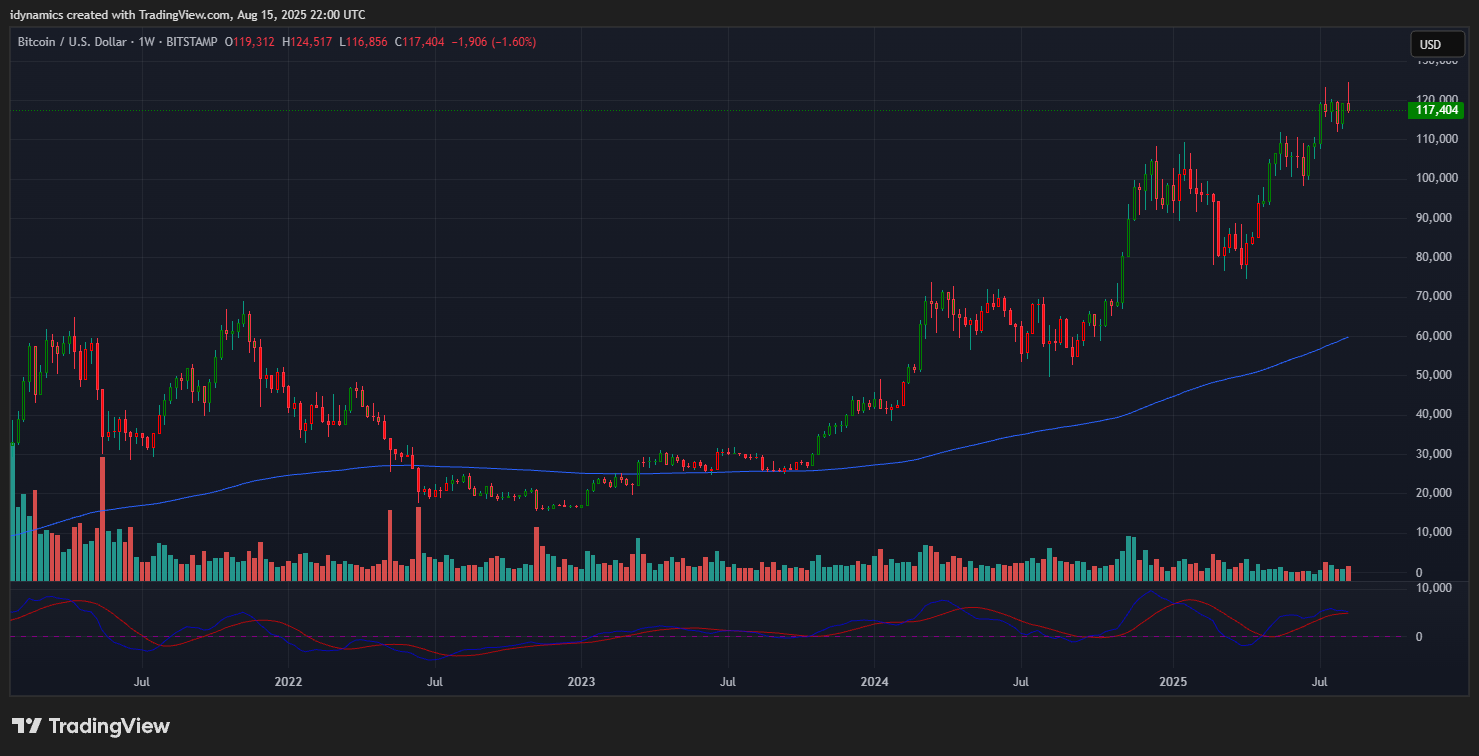
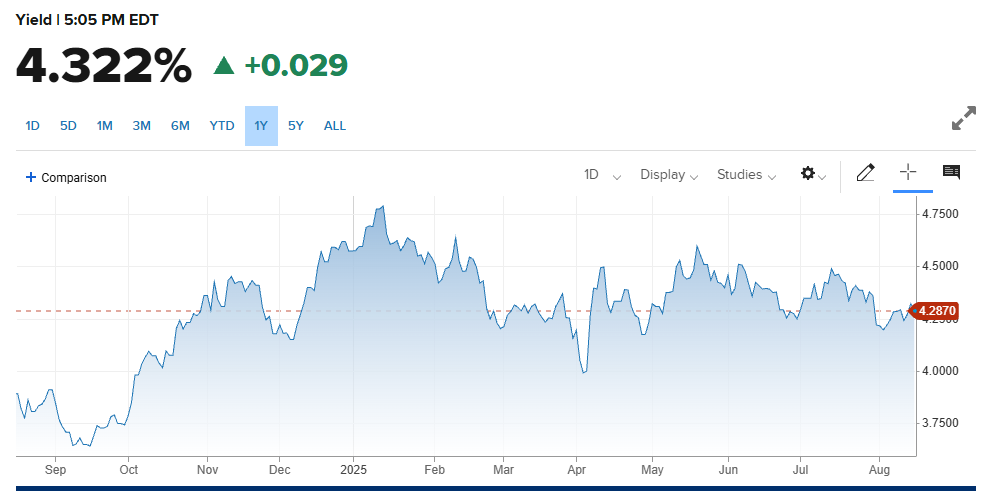
The RSP:SPY managed a blip higher after a test of the 2012 lows. The spread chart remains extremely weak. The weekly is trending lower in an oversold position and the MACD is turning back down. The IWM was up strongly, closing up +6.81% on the top end of the range. The RSP traded close to an ATH and settled at the second highest close ever, closing up +1.52% in the upper half of a the week’s range. NVDA reversed lower and closed on the lows, down -1.23% after setting new ATHs near the next call wall at 185. Bitcoin traded a new ATH and the reversed to close down -1.18% on the bottom of the reversal range. Support remains at 110/108. McClellan Oscillators are showing strength in the Dow. The Yield Curve expanded on the week, closing at +0.567%. The 10YR yield rose, closing at 4.322%. Truflation jumped to 2.07%. Corporate bond spreads are at a 27-year low.
10YR-2YR Yield Curve Daily

 VIX Weekly H-L-C
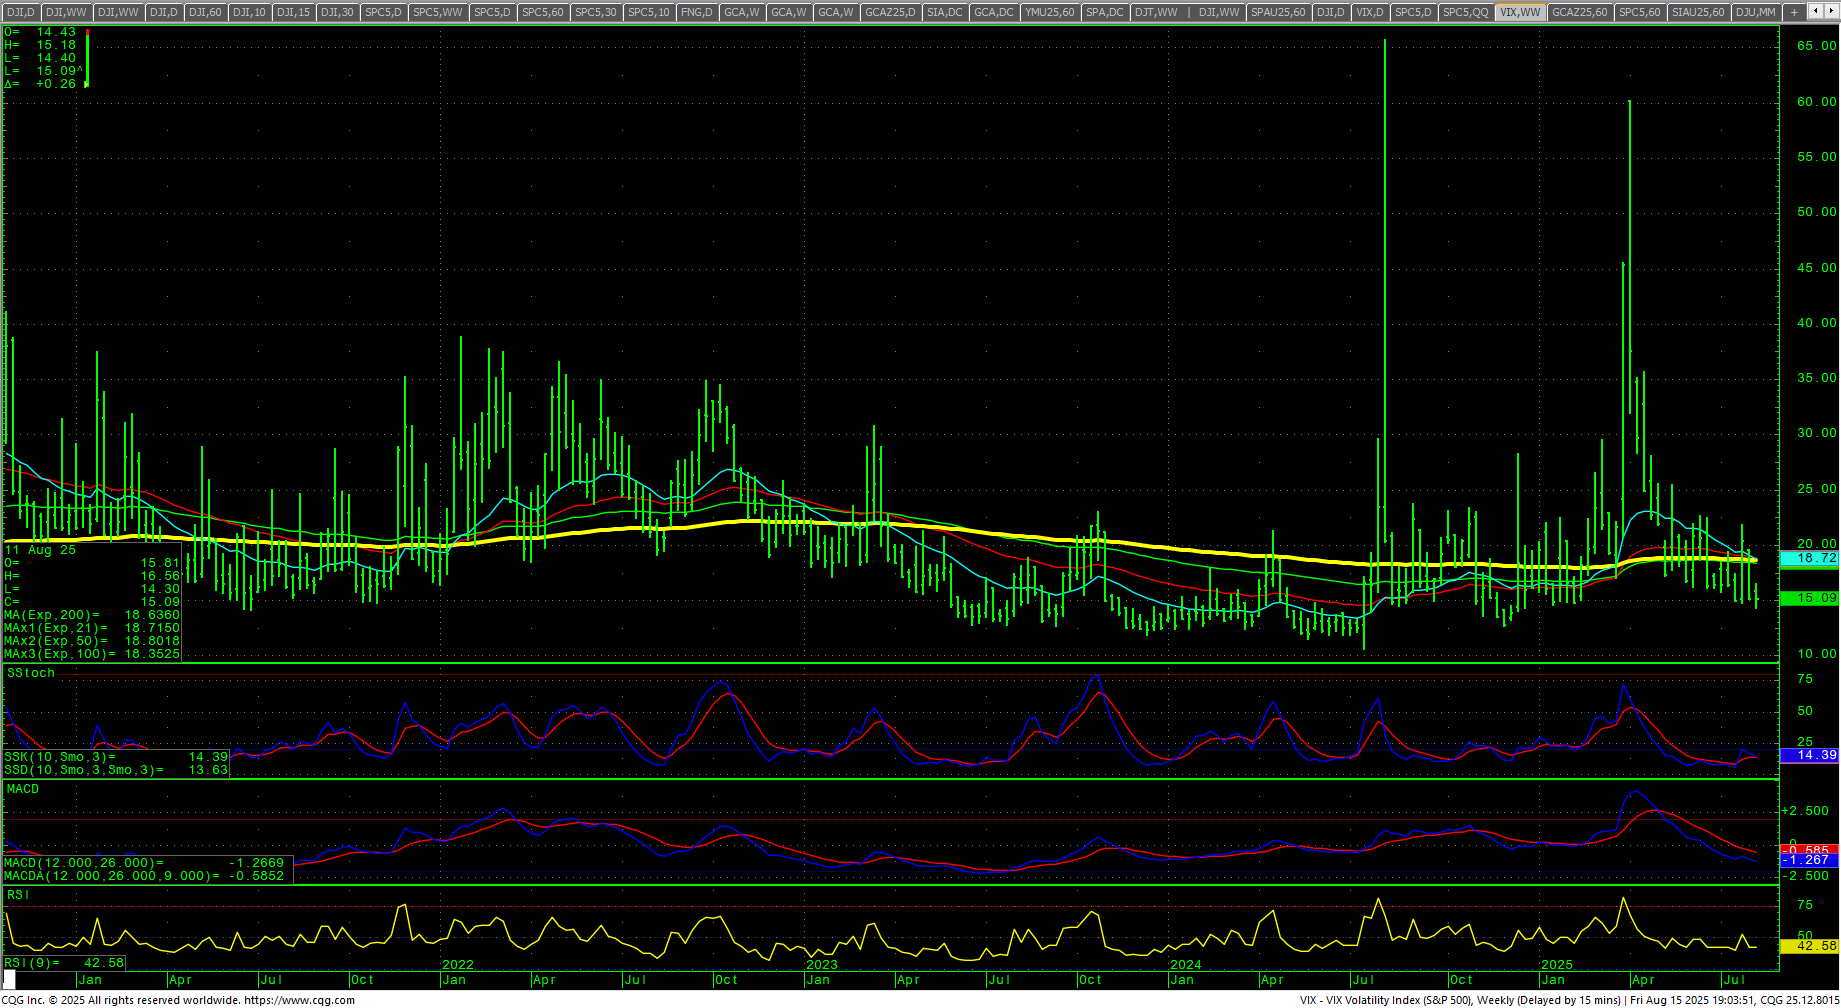
The VIX traded a new 2025 low and settled down -0.40% closing near the bottom of the range. The US Dollar traded an outside week down and closed the week down -0.43% on the bottom of the week’s range.
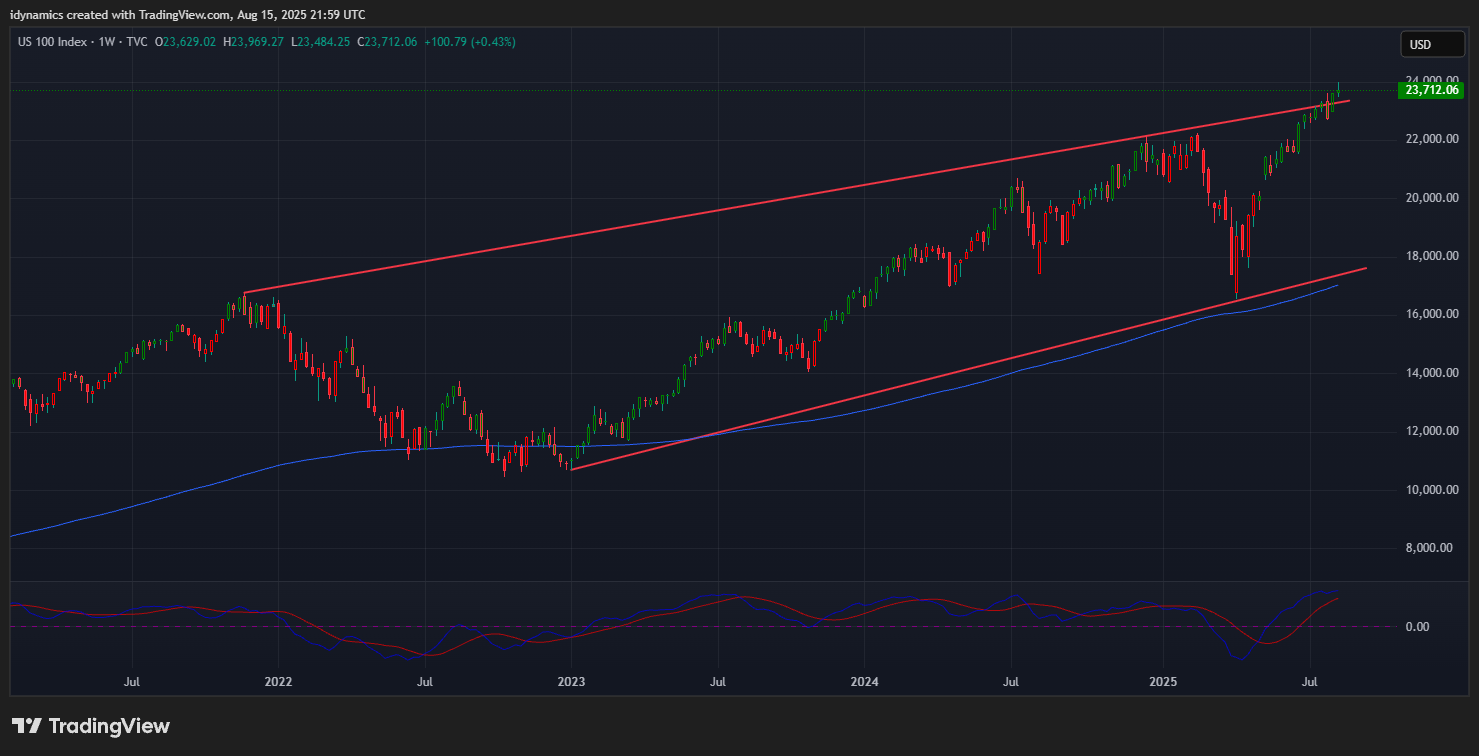
 Nasdaq 100 Weekly Candles
Daily Breadth 
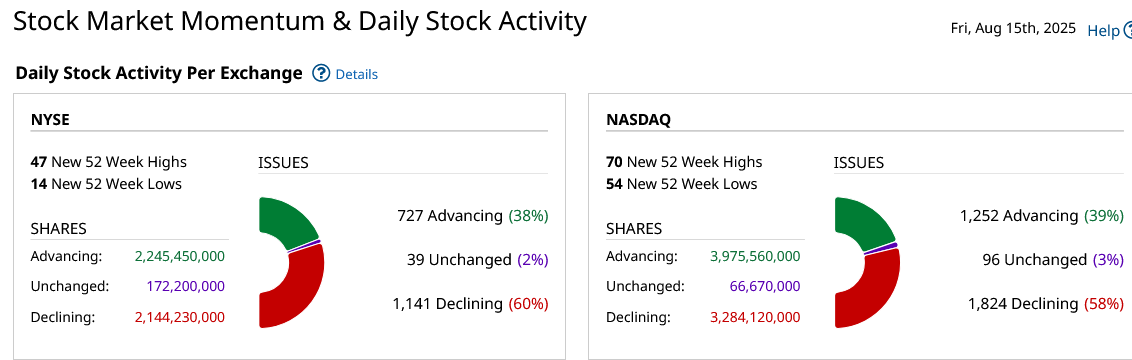
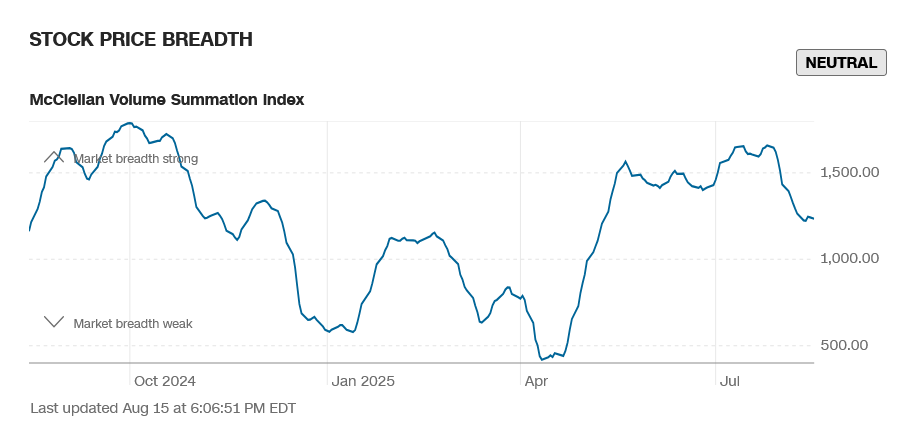
Breadth was weaker in Friday’s trade and was flat for the week. Sentiment reads neutral.
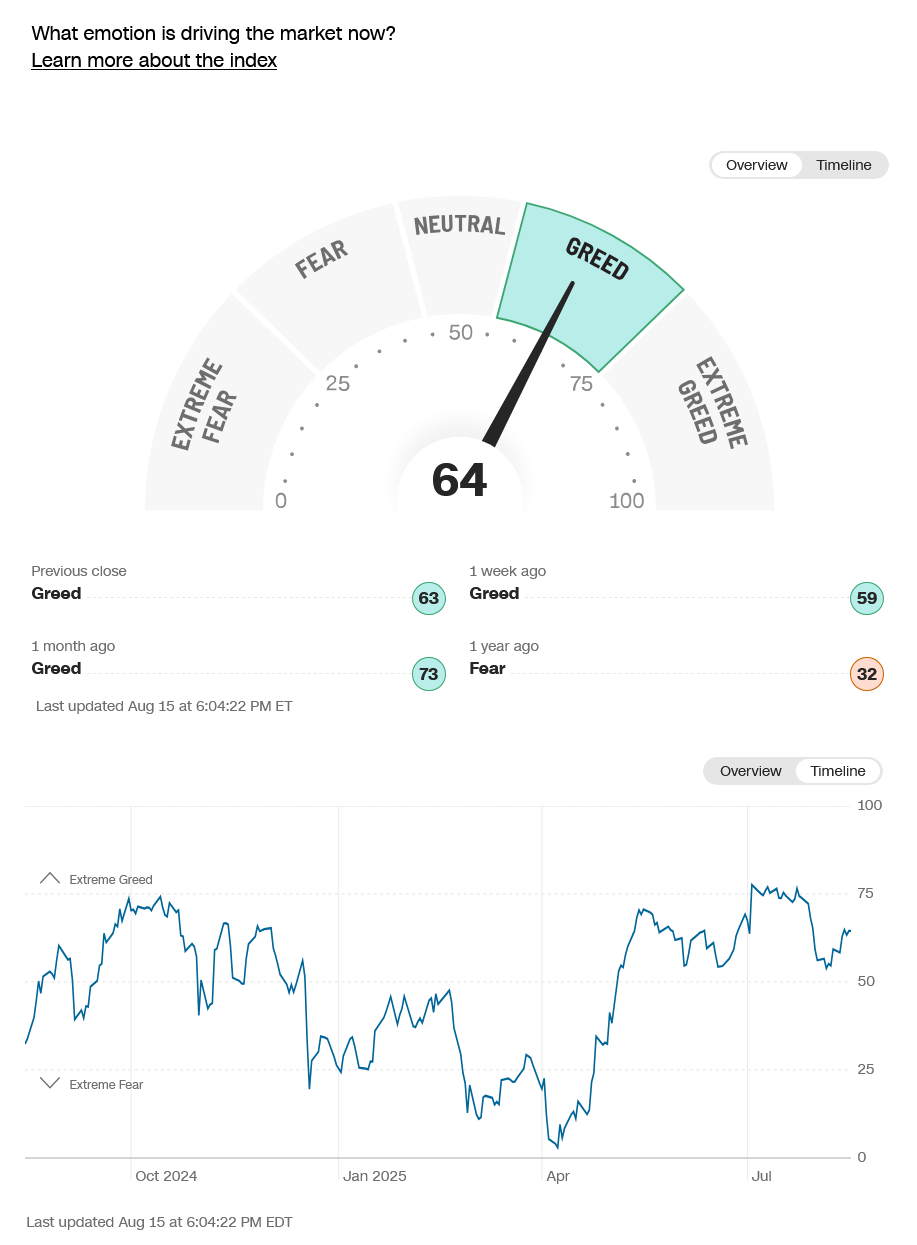
CNN Fear & Greed Index
 AAII Investor Sentiment Survey
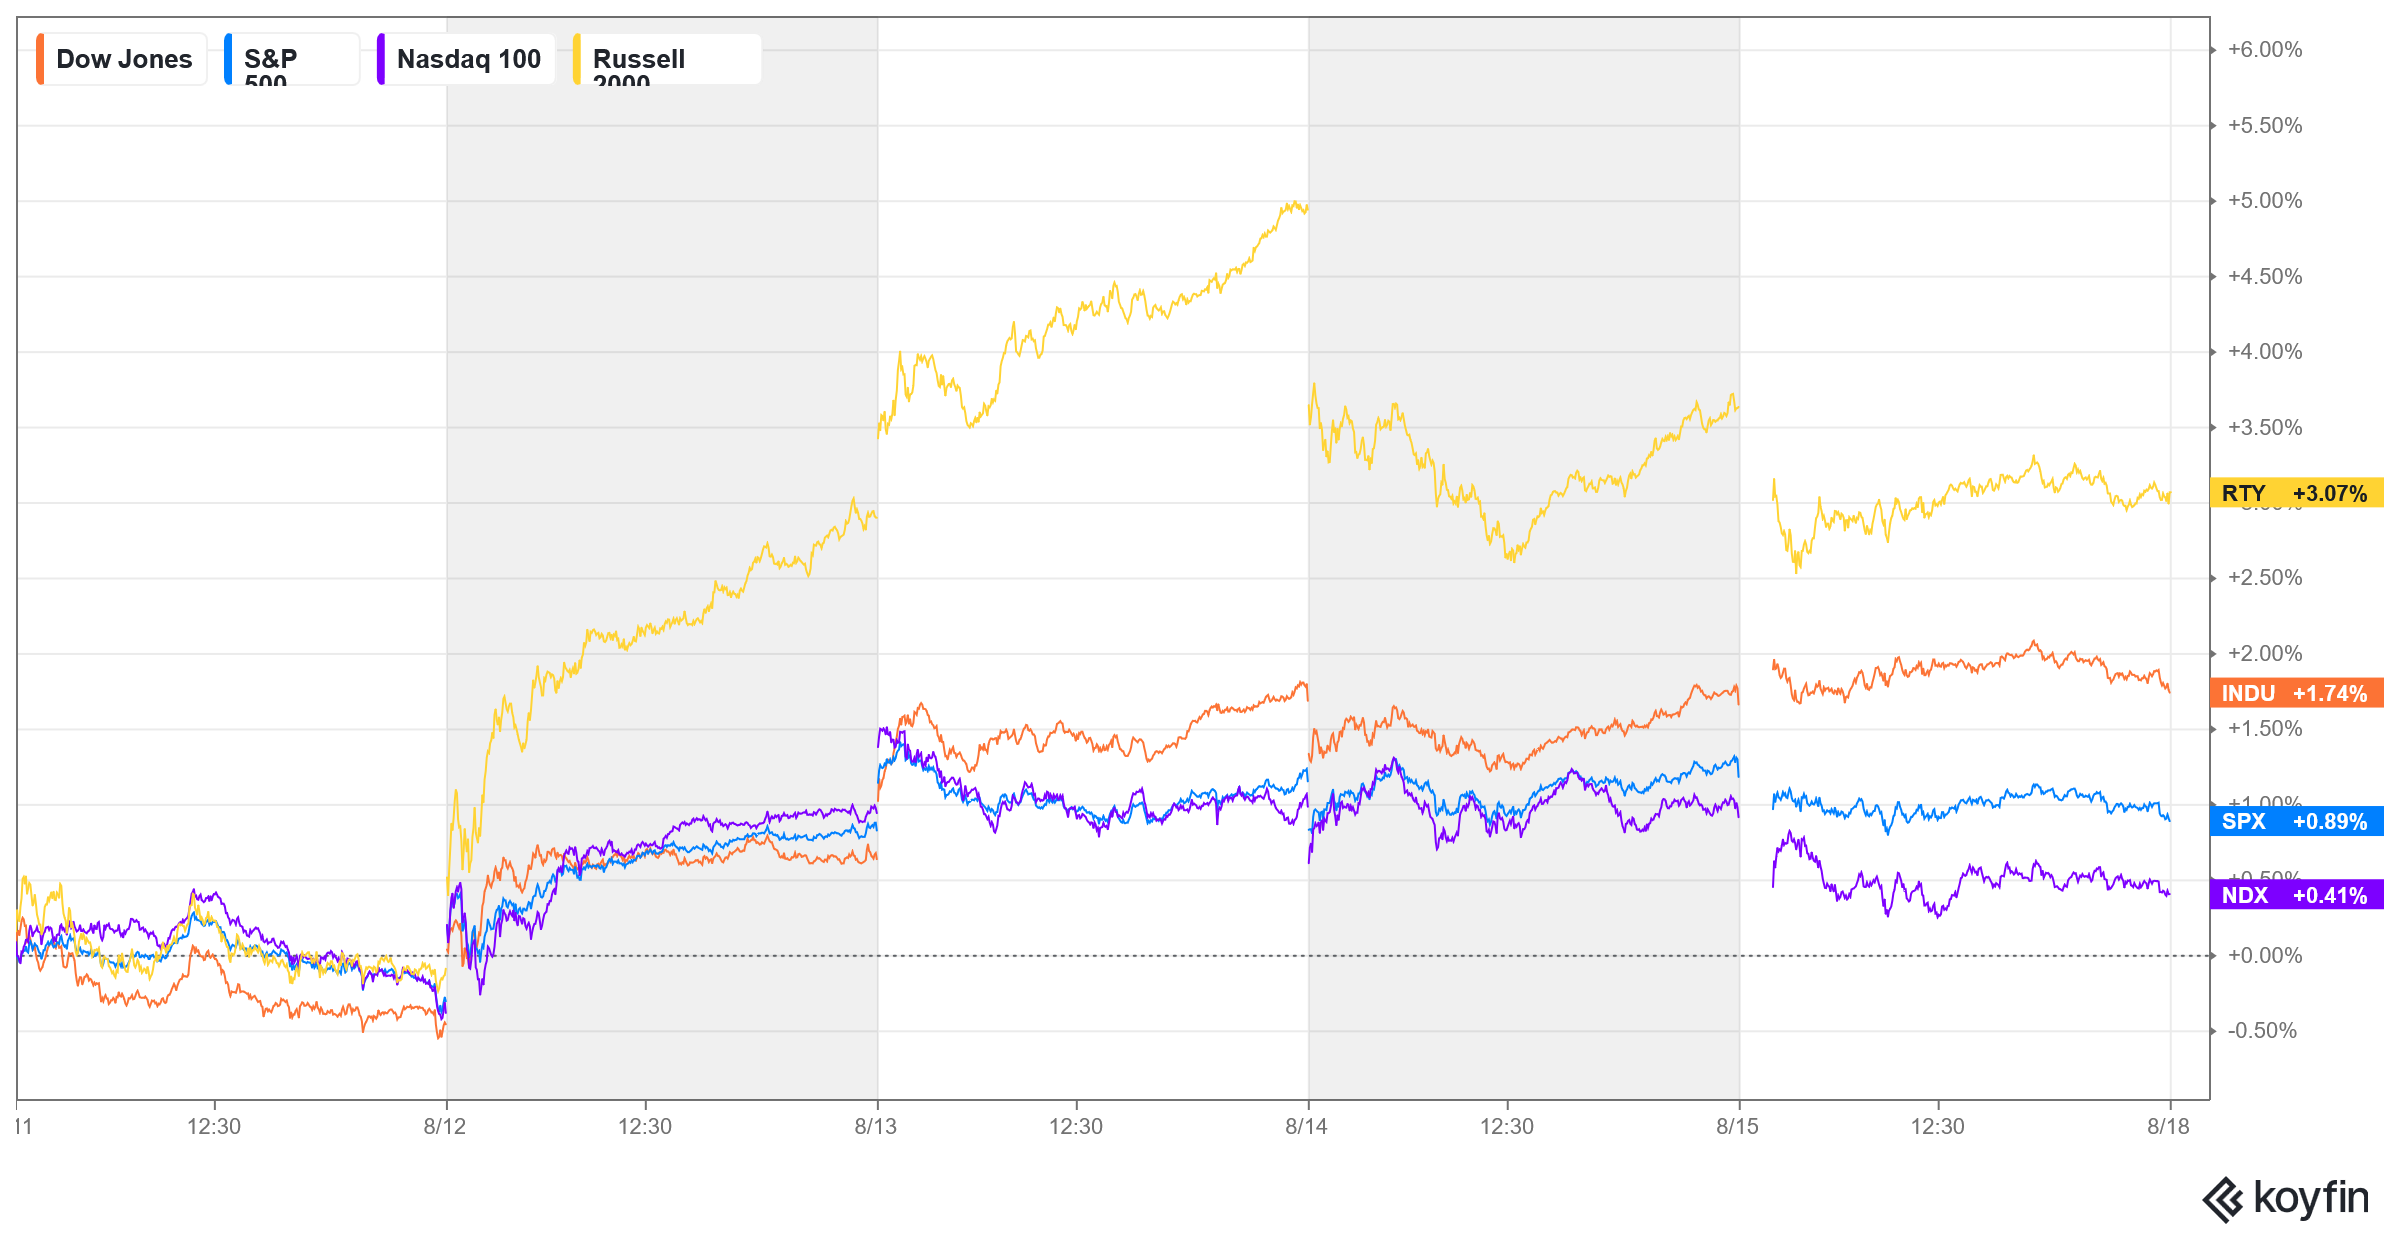
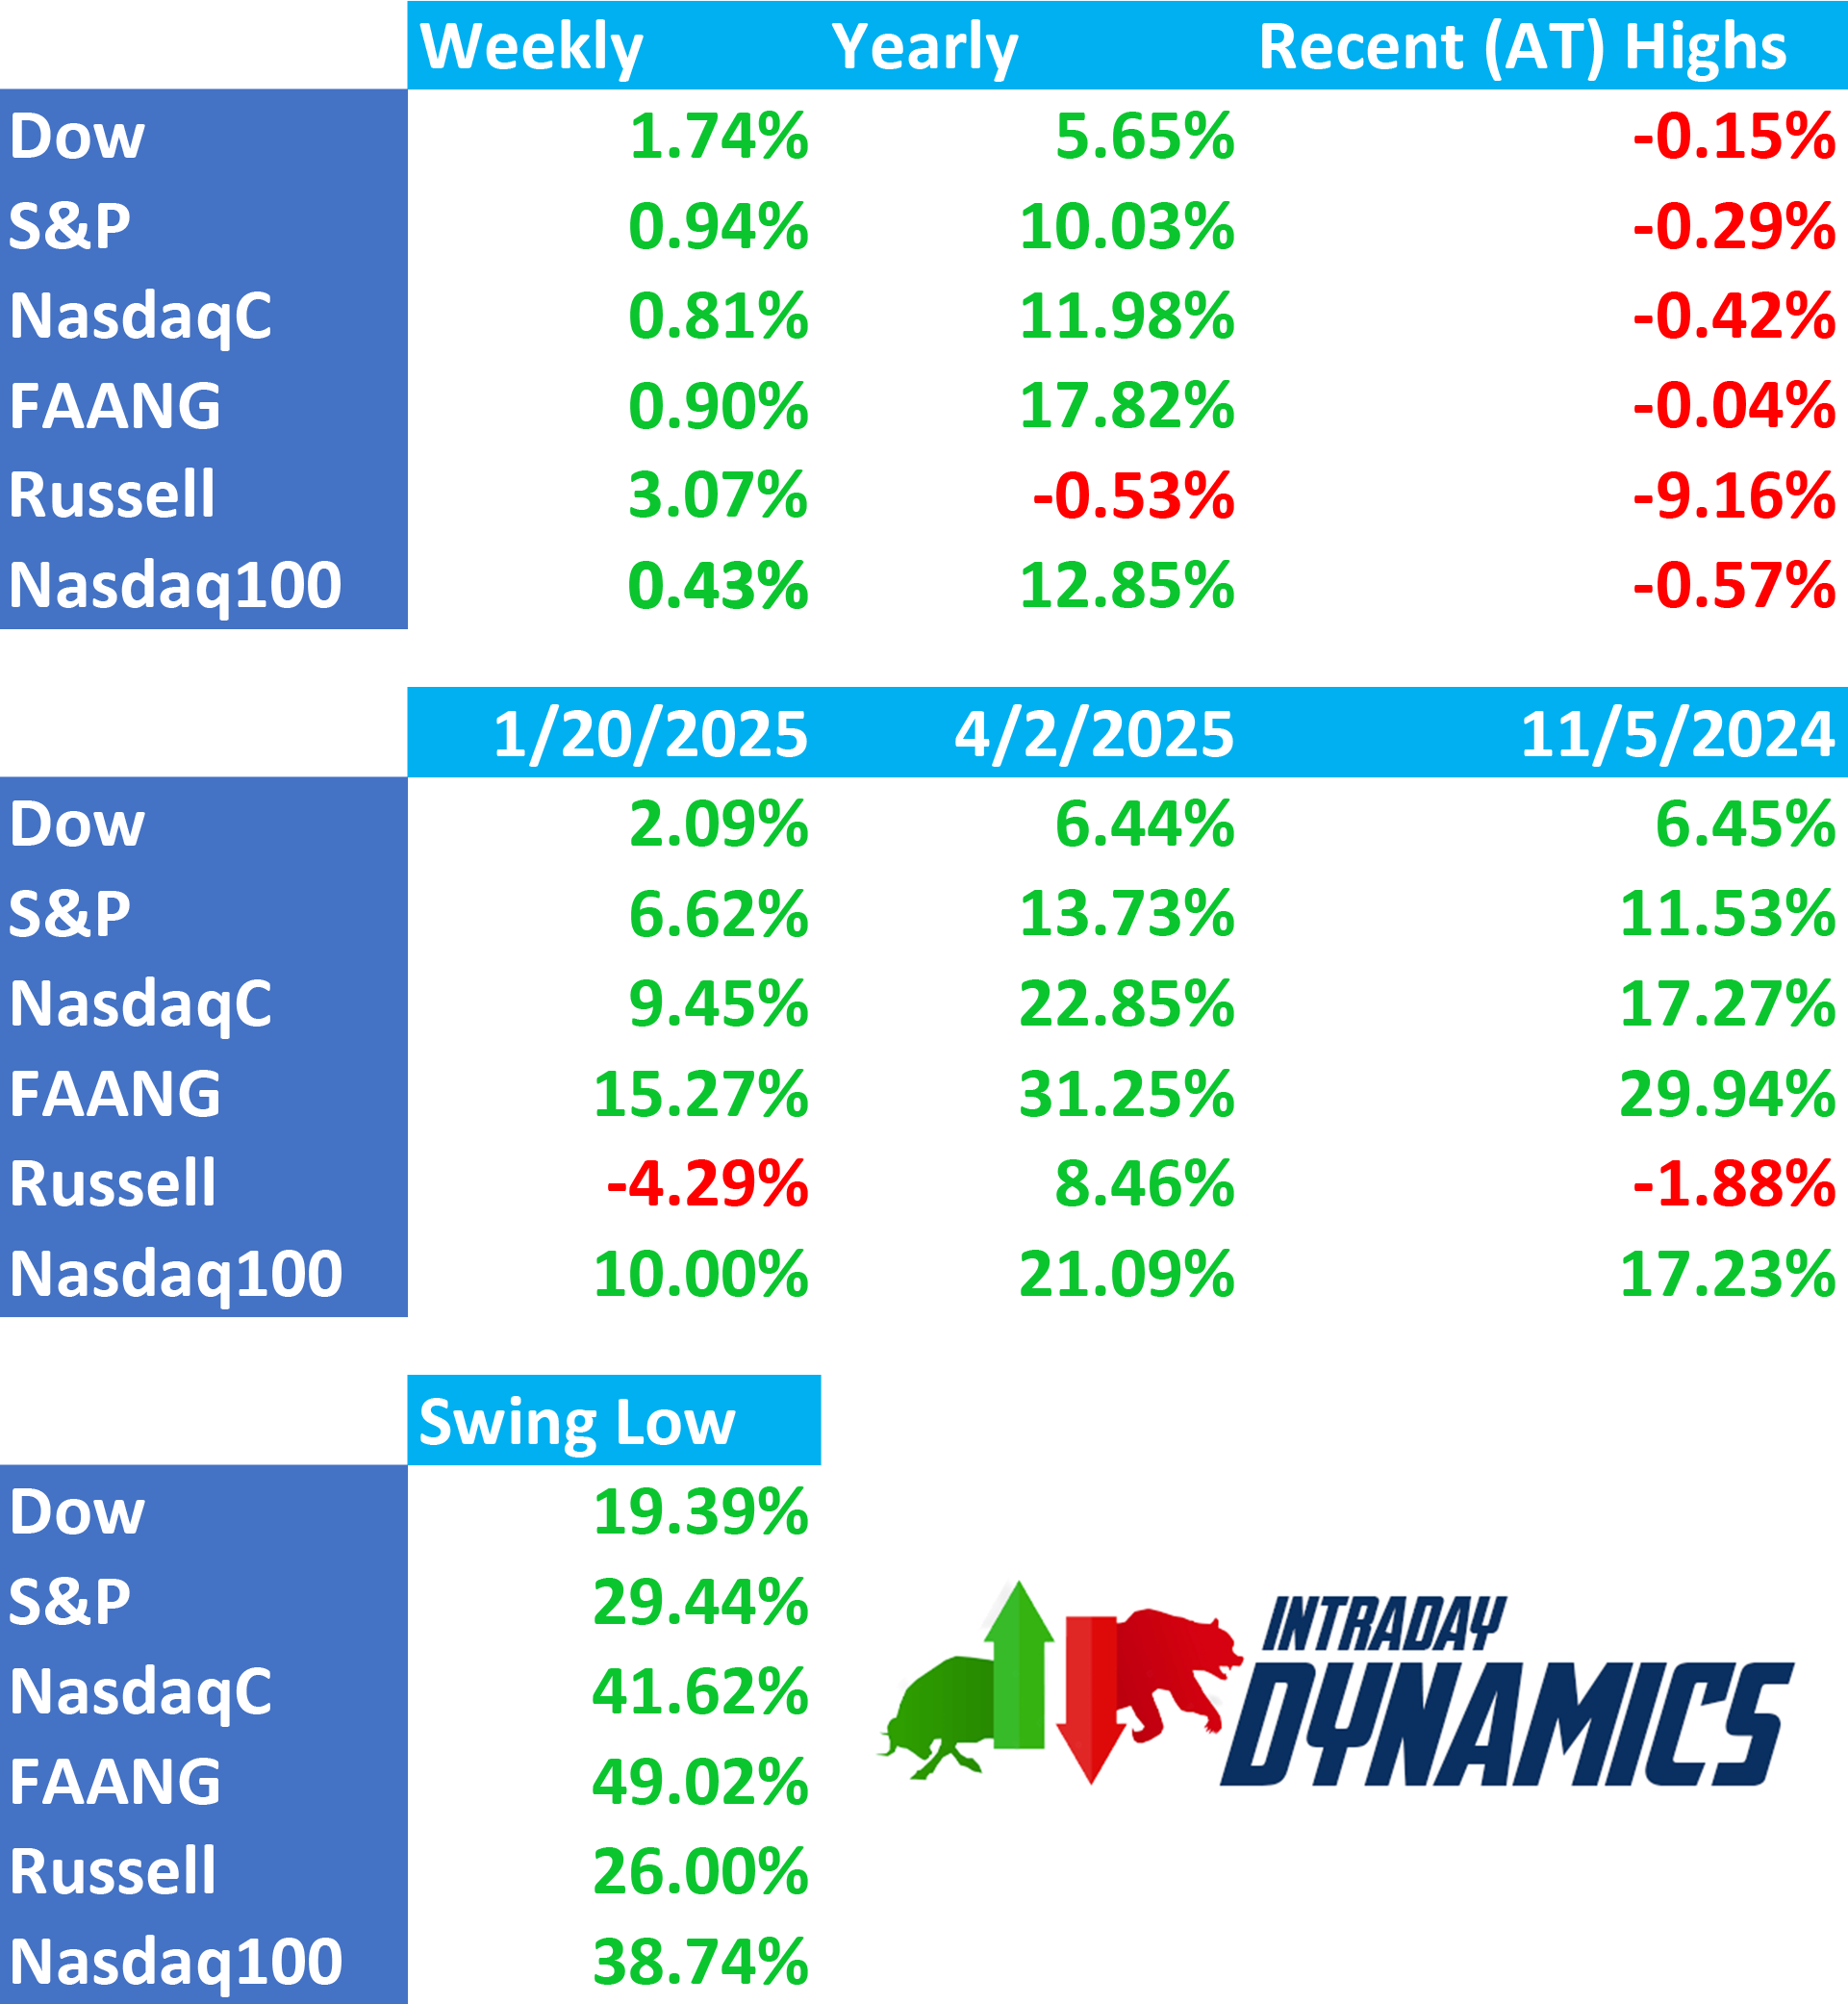
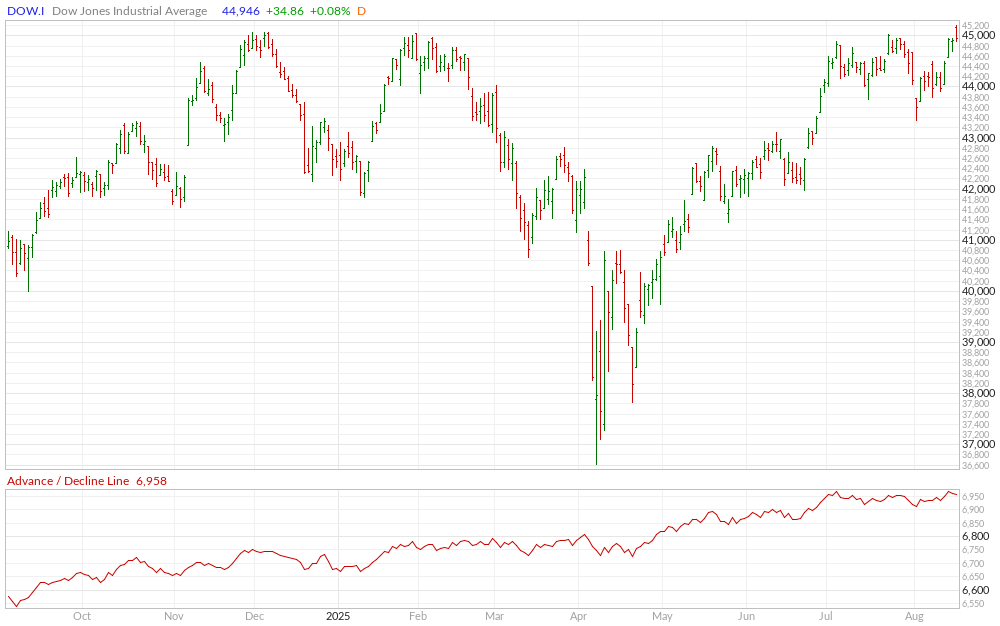
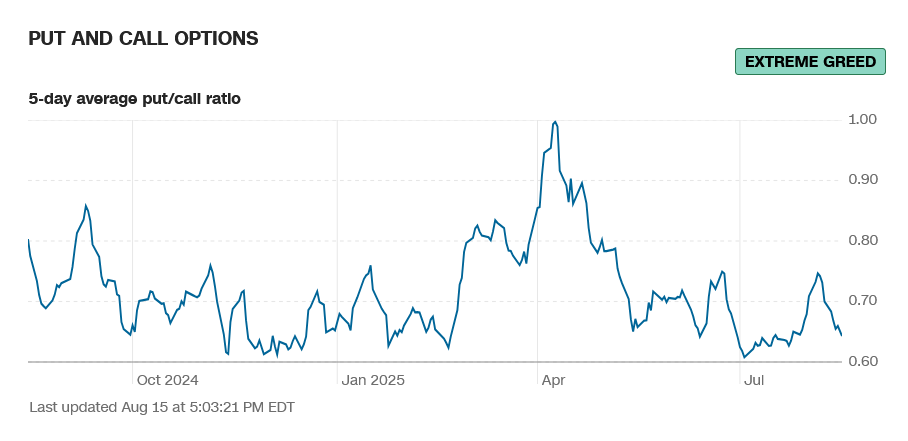
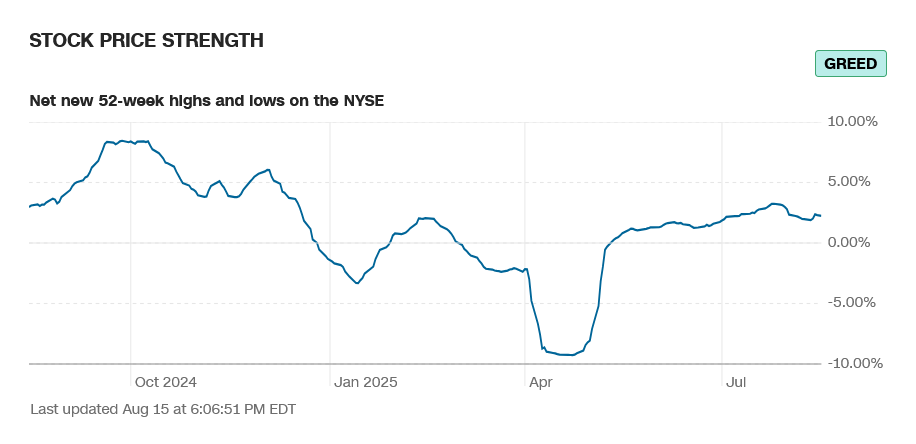
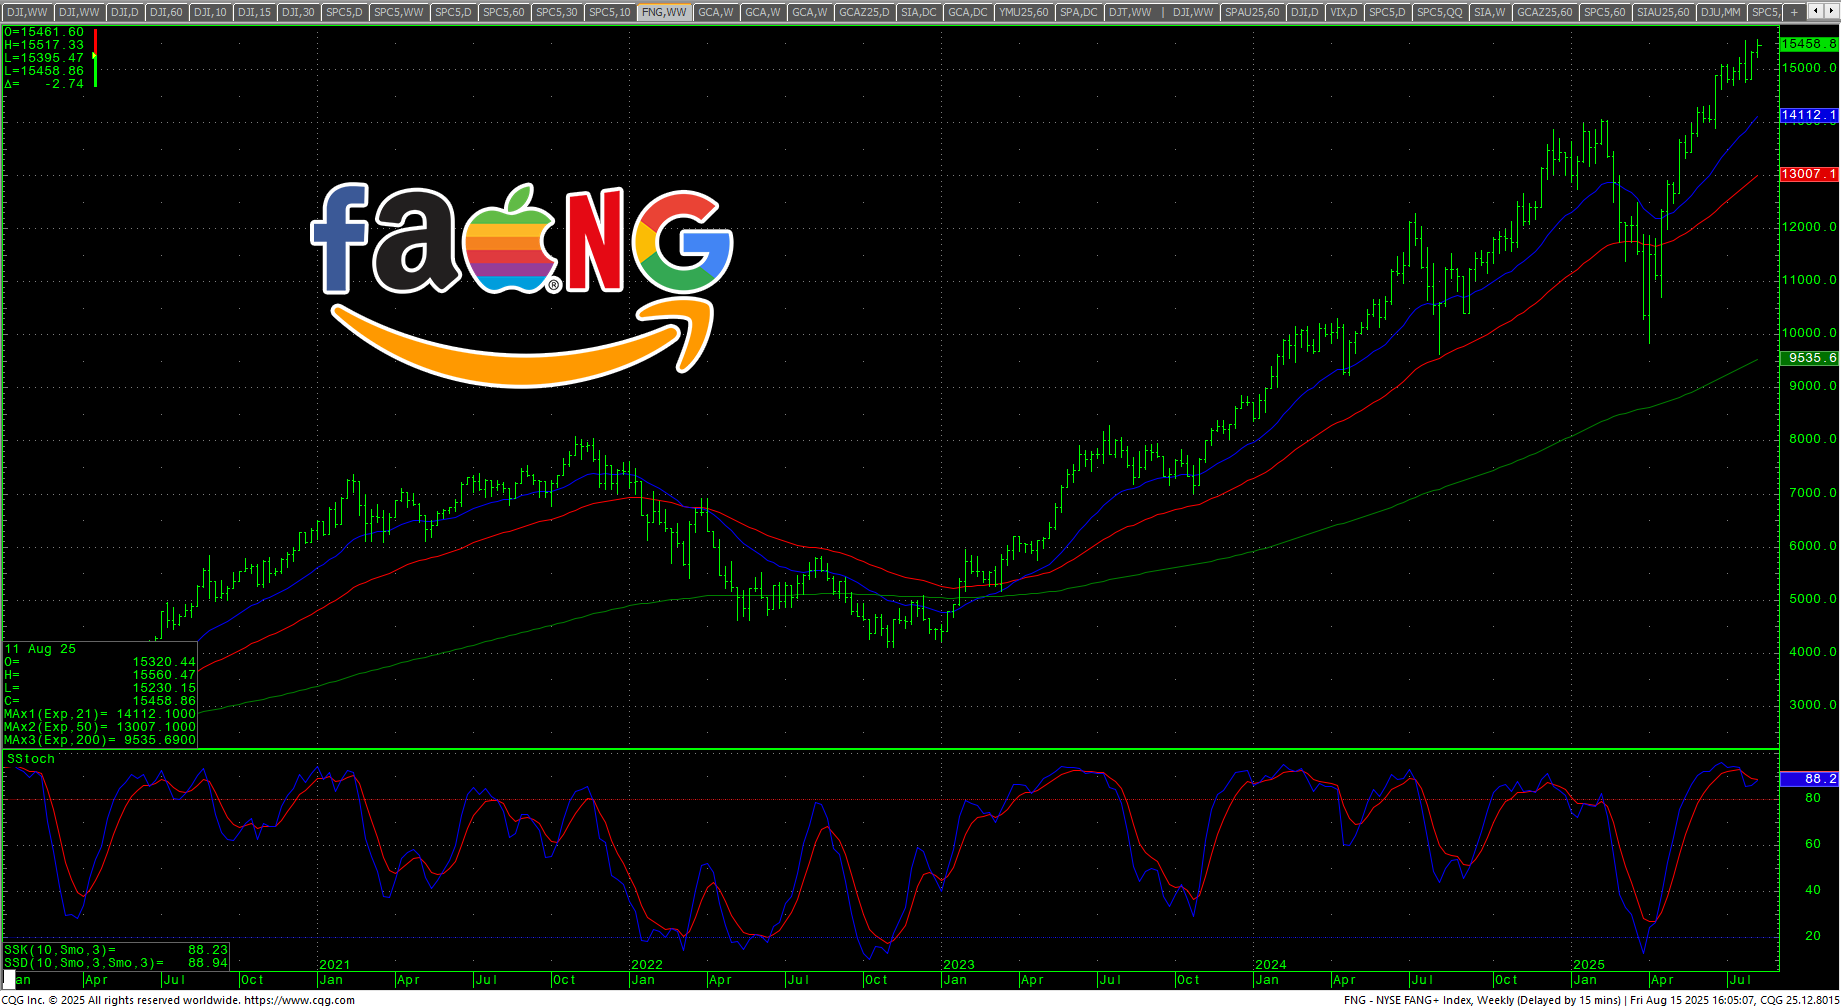
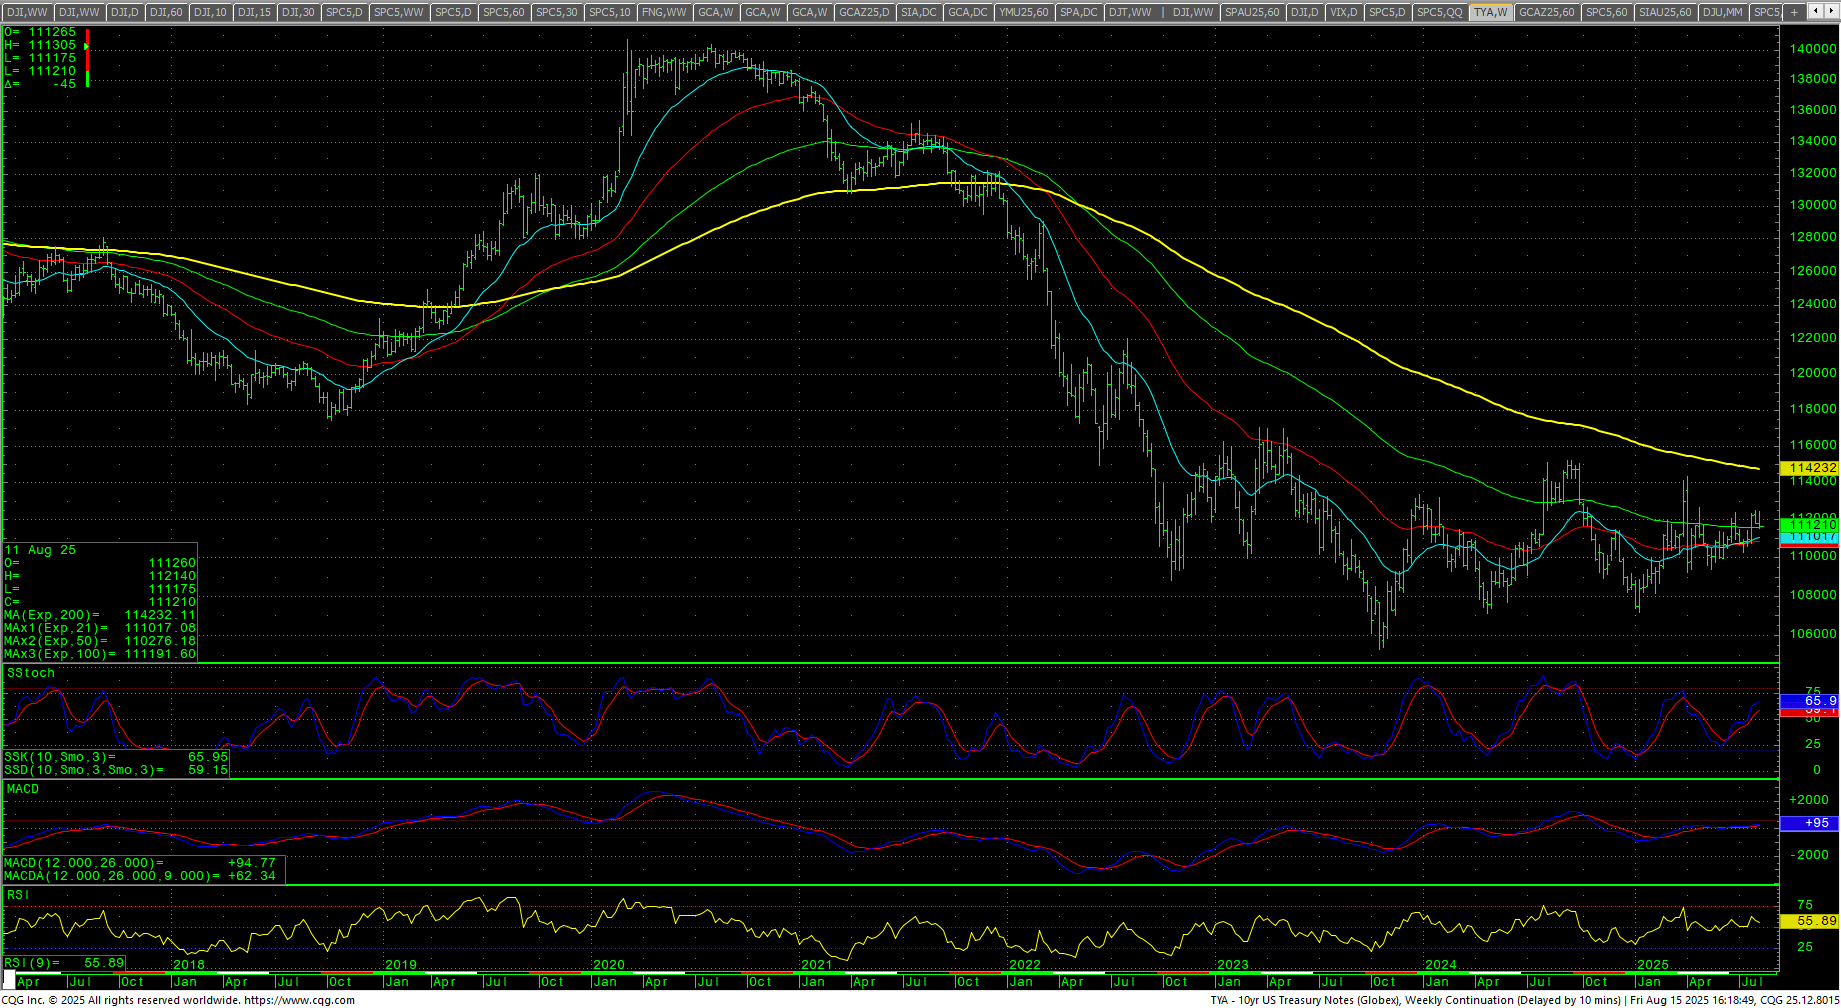
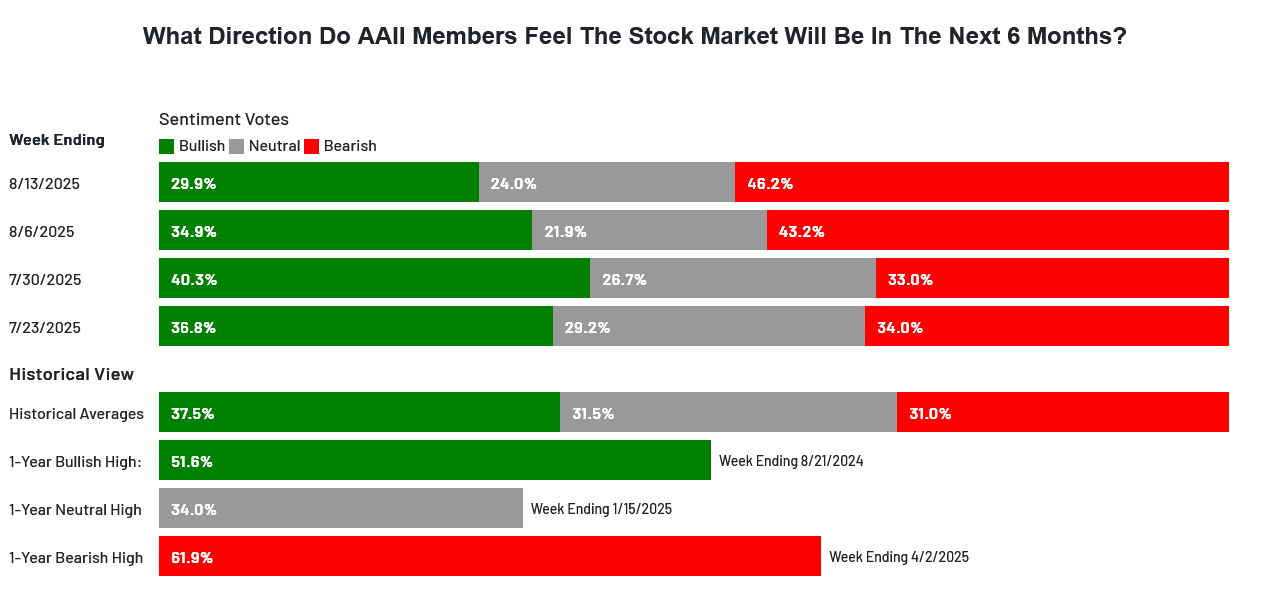 The CNN Fear and Greed Index moved to 64 and reads greed. Breadth was flat on the week and reads neutral. Latest AAII Sentiment Survey: Optimism Slides. The Dow A/D moved toward an ATH closing at 6958. The VIX traded a new 2025 low and settled down -0.40% closing near the bottom of the range. The Put/Call closed at 0.64 and reads extreme greed. The 52-week, A/D moved to +2.24% and reads greed. The Dow closed the week up +1.74%, closing on the top end of the week’s the range at an ATH weekly close. The S&P settled up +0.94% setting a record high close in the top of the range. The Nasdaq Composite was up +0.81% and the Nasdaq 100 was up +0.43%. The NYSE FANG set an ATH closing up +0.90% on the top of a record setting range. The Russell was up +3.07% on the bottom of a tight inside week’s range. The 10-year notes reversed lower and closed on the bottom of the range. The yield on the 10YR moved up to 4.322%.
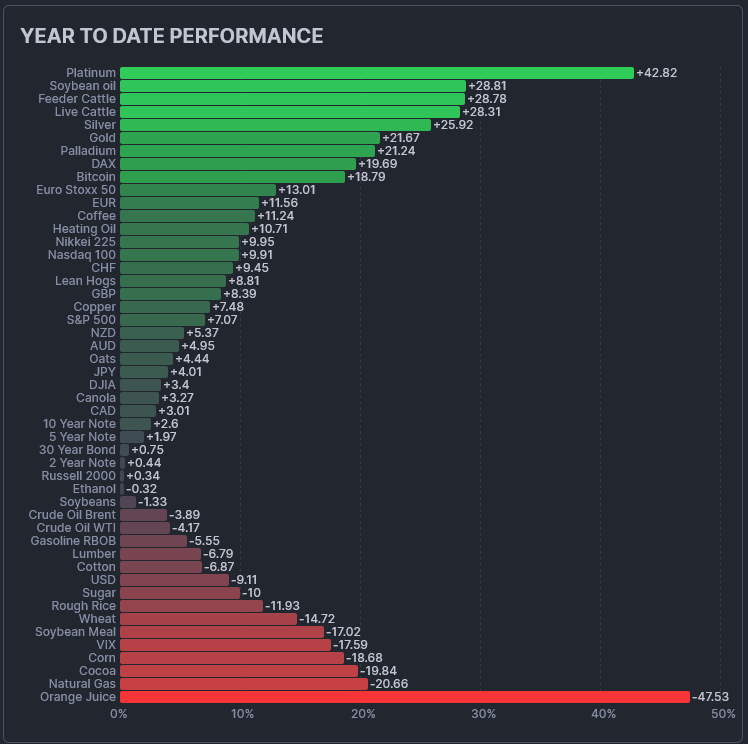
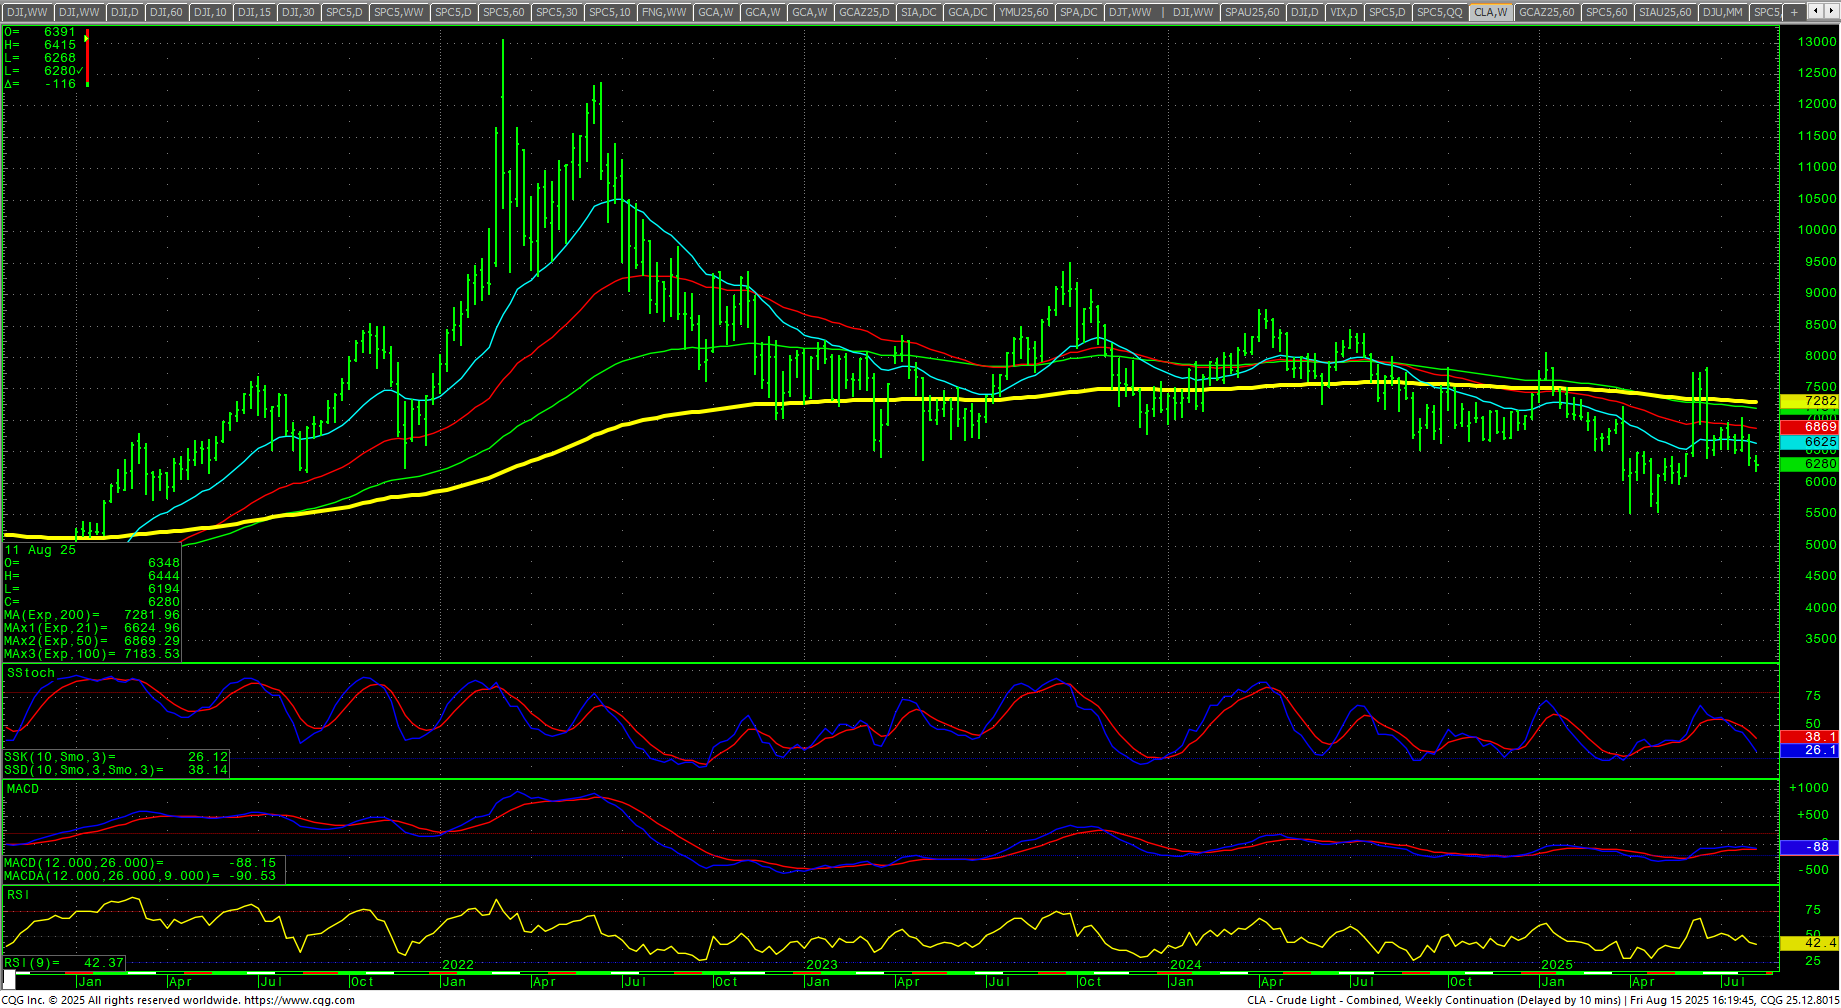
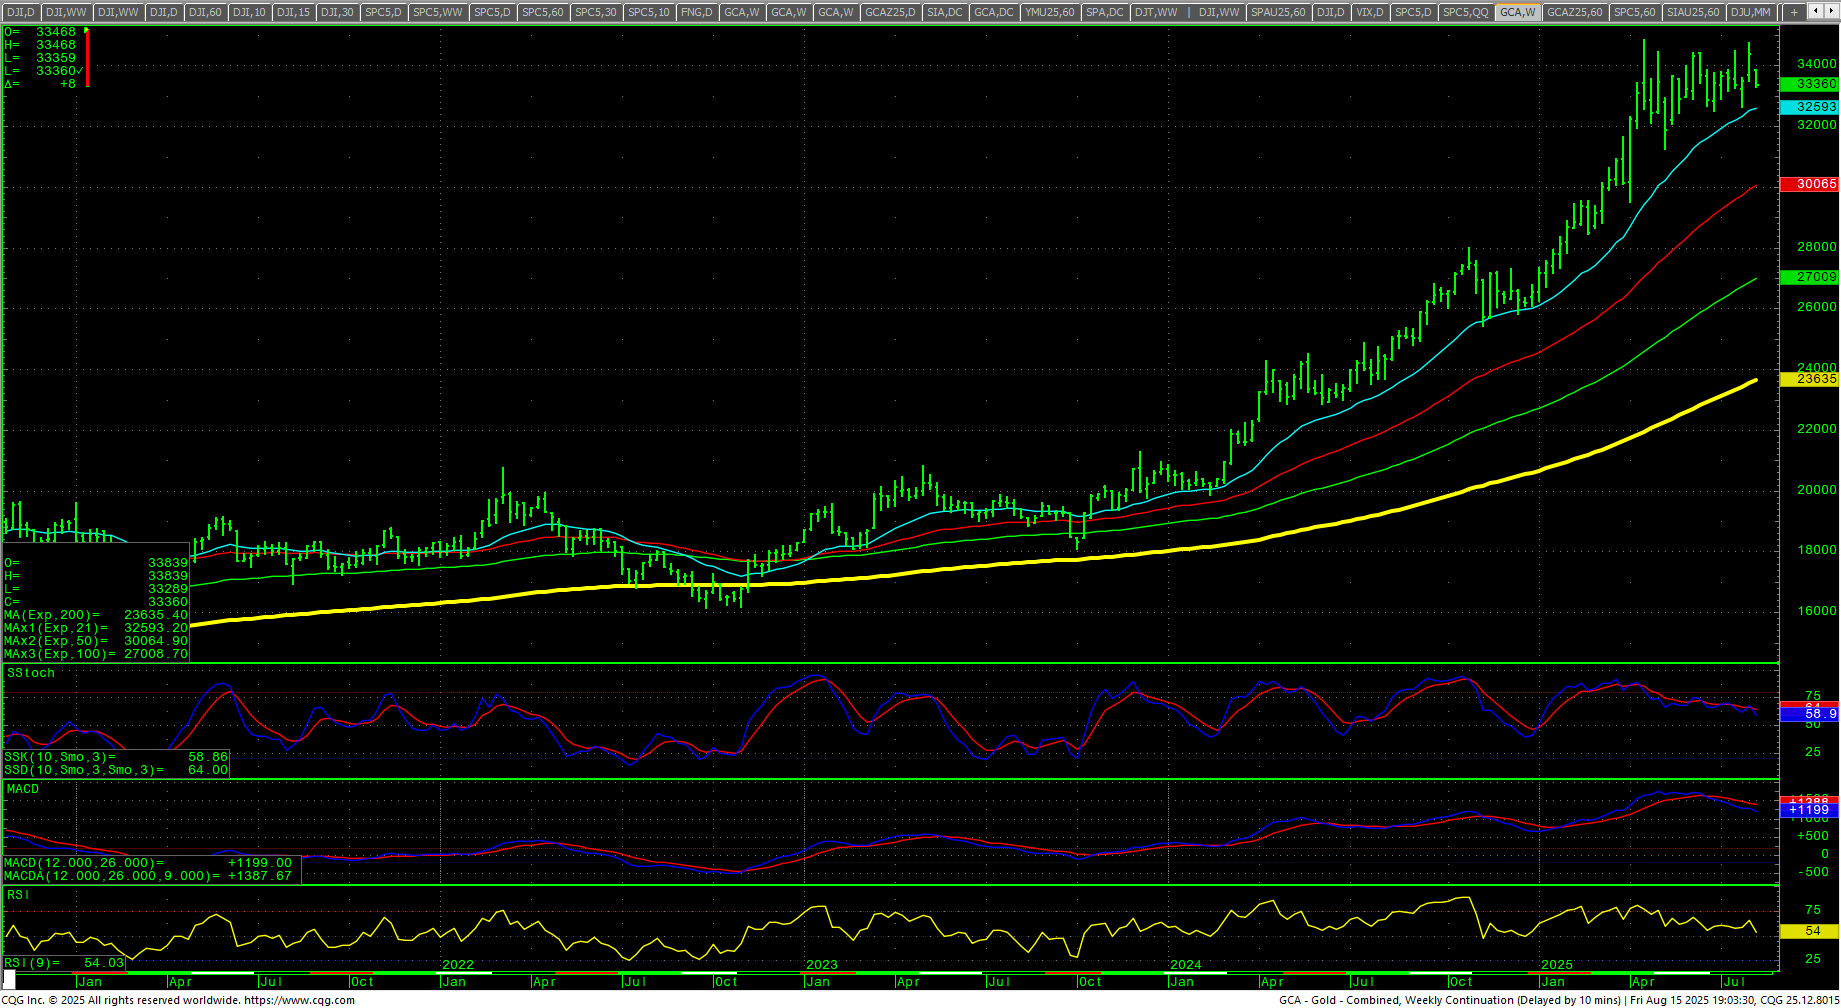
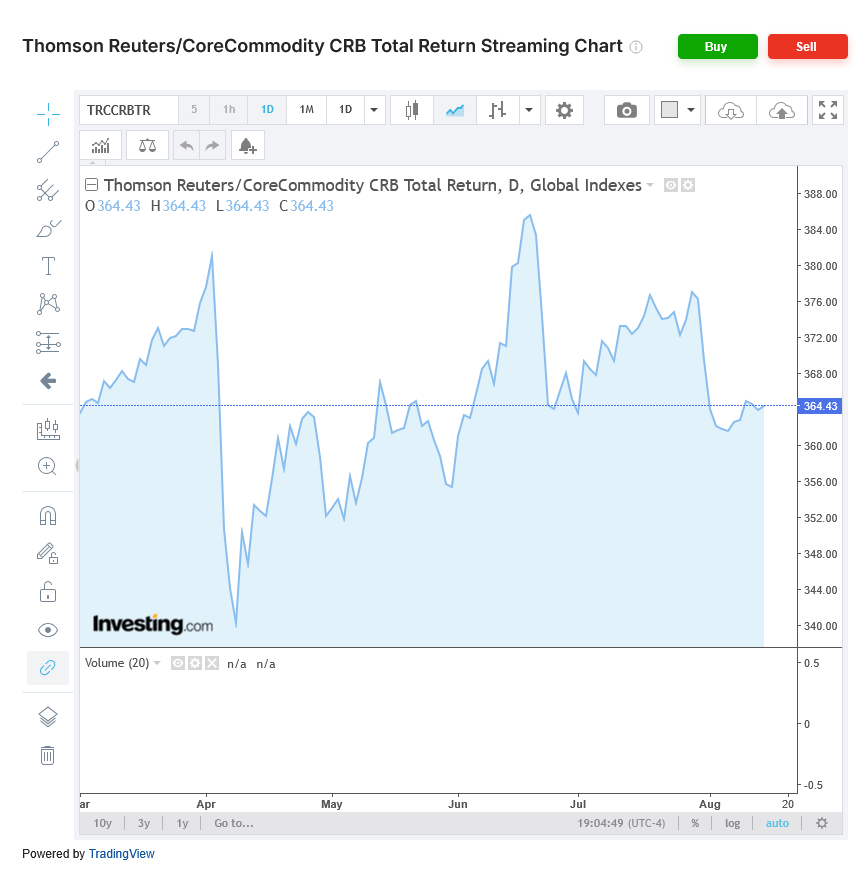 The CRB Index was down -1.89%. Crude oil dropped to two month lows and closed in the bottom of the range. Gold plunged sharply during the week and closed on the lows. The CoT for the S&P 500 saw non-commercials liquidating (short-covering) and commercials adding (fund buying, i.e.: FOMO). Non-commercials are flat and commercials are flat. The CFTC S&P 500 Non-Commercial Net Positions ended at -139.6K.
Timing Points
Today marks intermediate cycle timing. Next critical dates are the 25th/26th. Tuesday is Housing Starts and Building Permits. (est: 1.30M, 1.39M). Wednesday is the Philadelphia Fed Manufacturing Survey. (est: 5.0%) and Existing Home Sales (est: 4M) along with Leading Economic Indicators which are threatening a five month decline (est: -0.1%).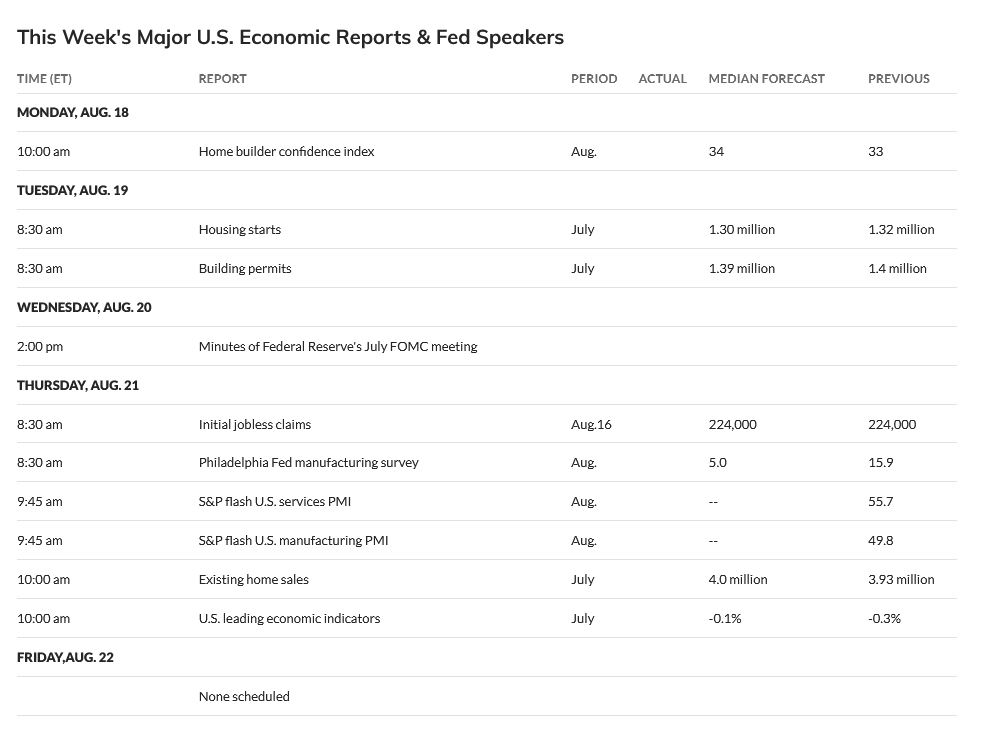
- 08/18 **
- 08/25-26 *** X
- 09/05 **
- 09/12 *** X critical weekend through
- 09/16-17 *** X critical week to the 19th
- 09/23 ***
- 10/01 ** key to bonds/dollar
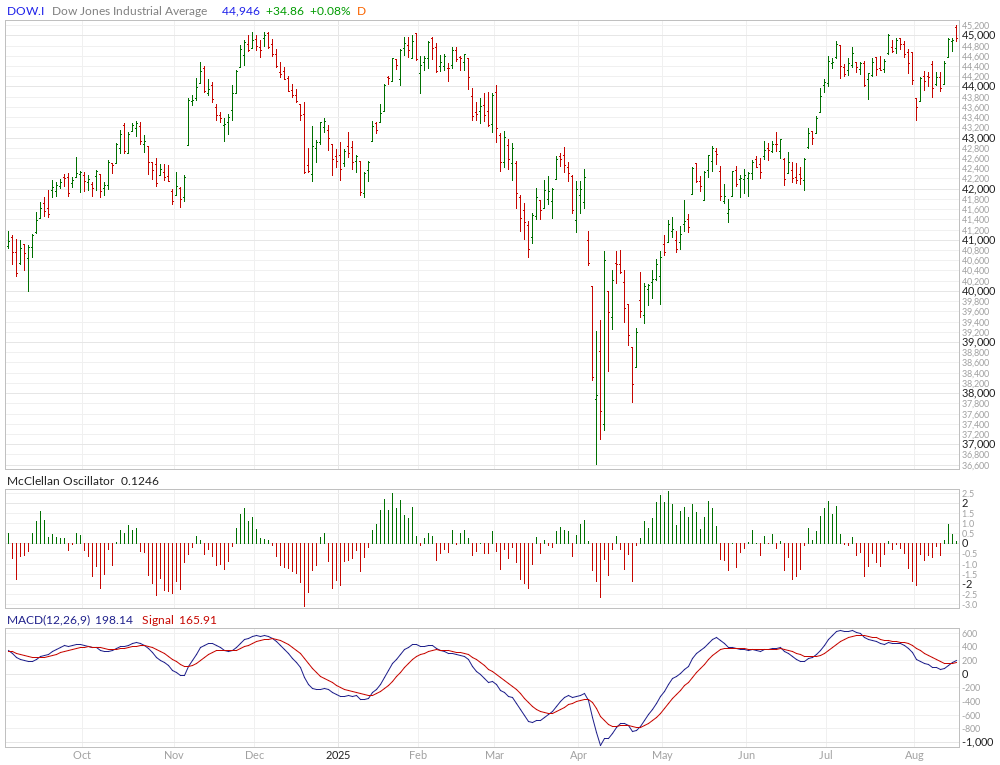
Dow Jones Industrial Average
Dow Jones Industrial Average Weekly H-L-C
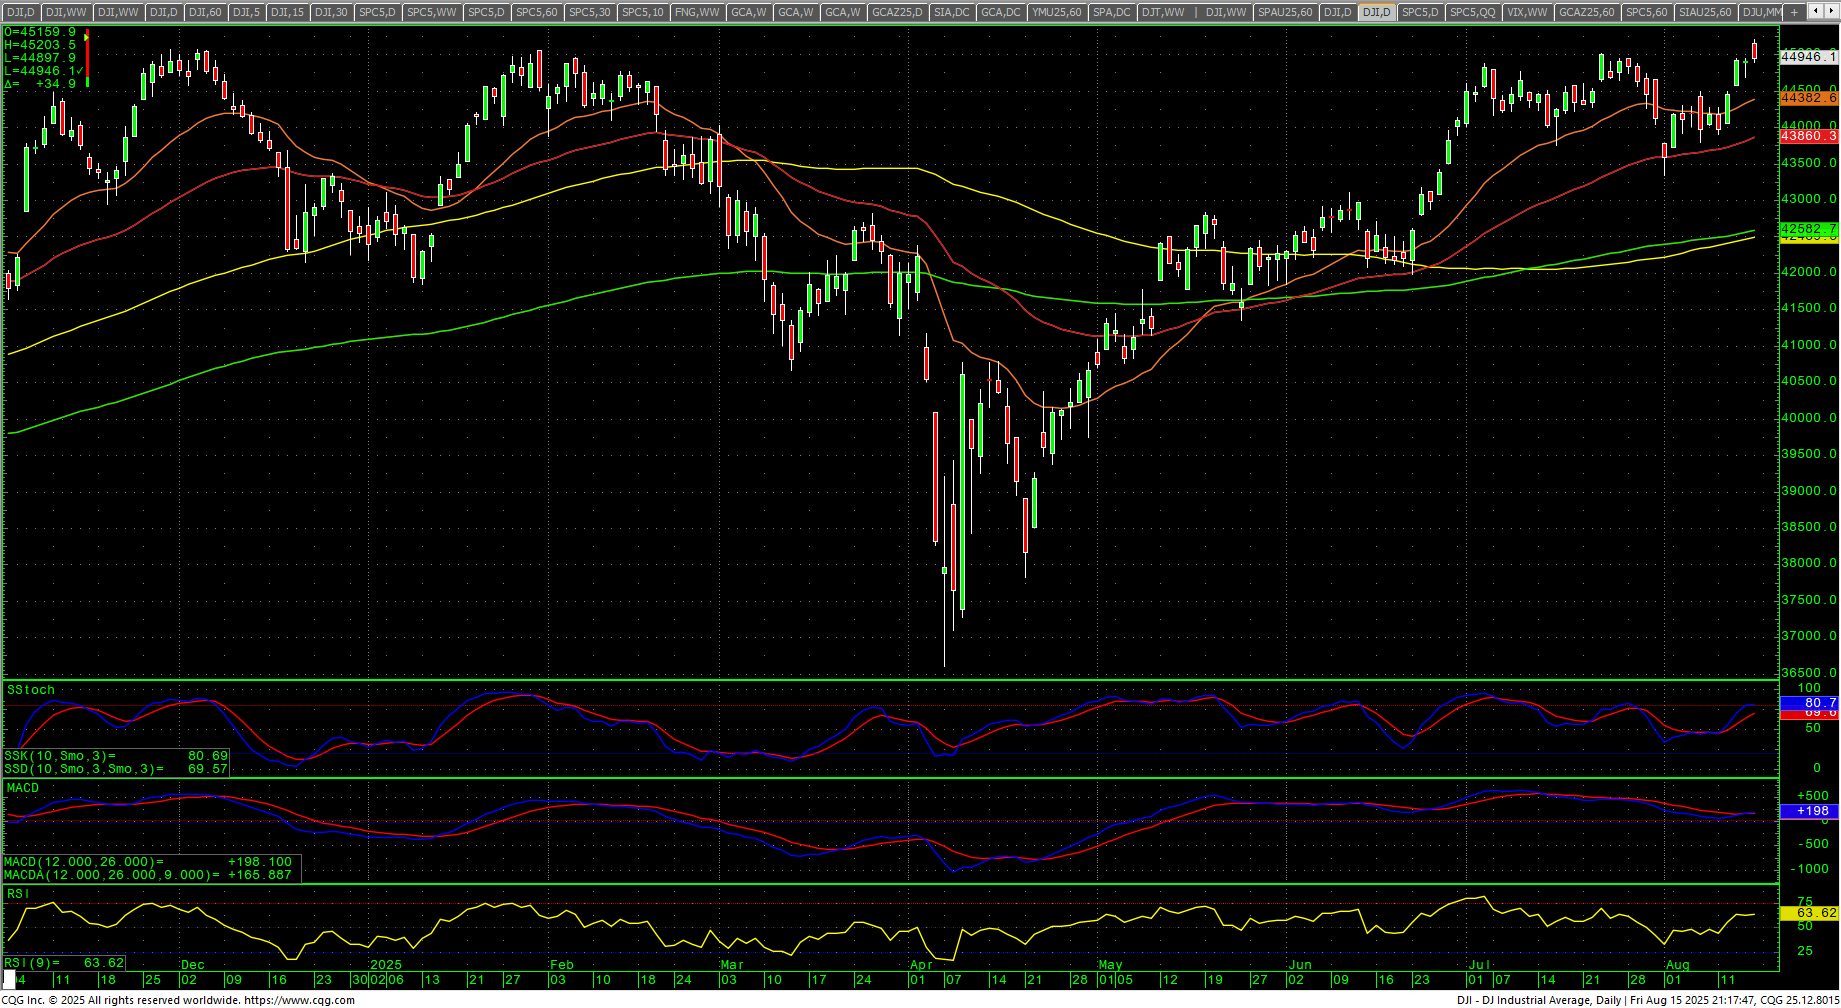
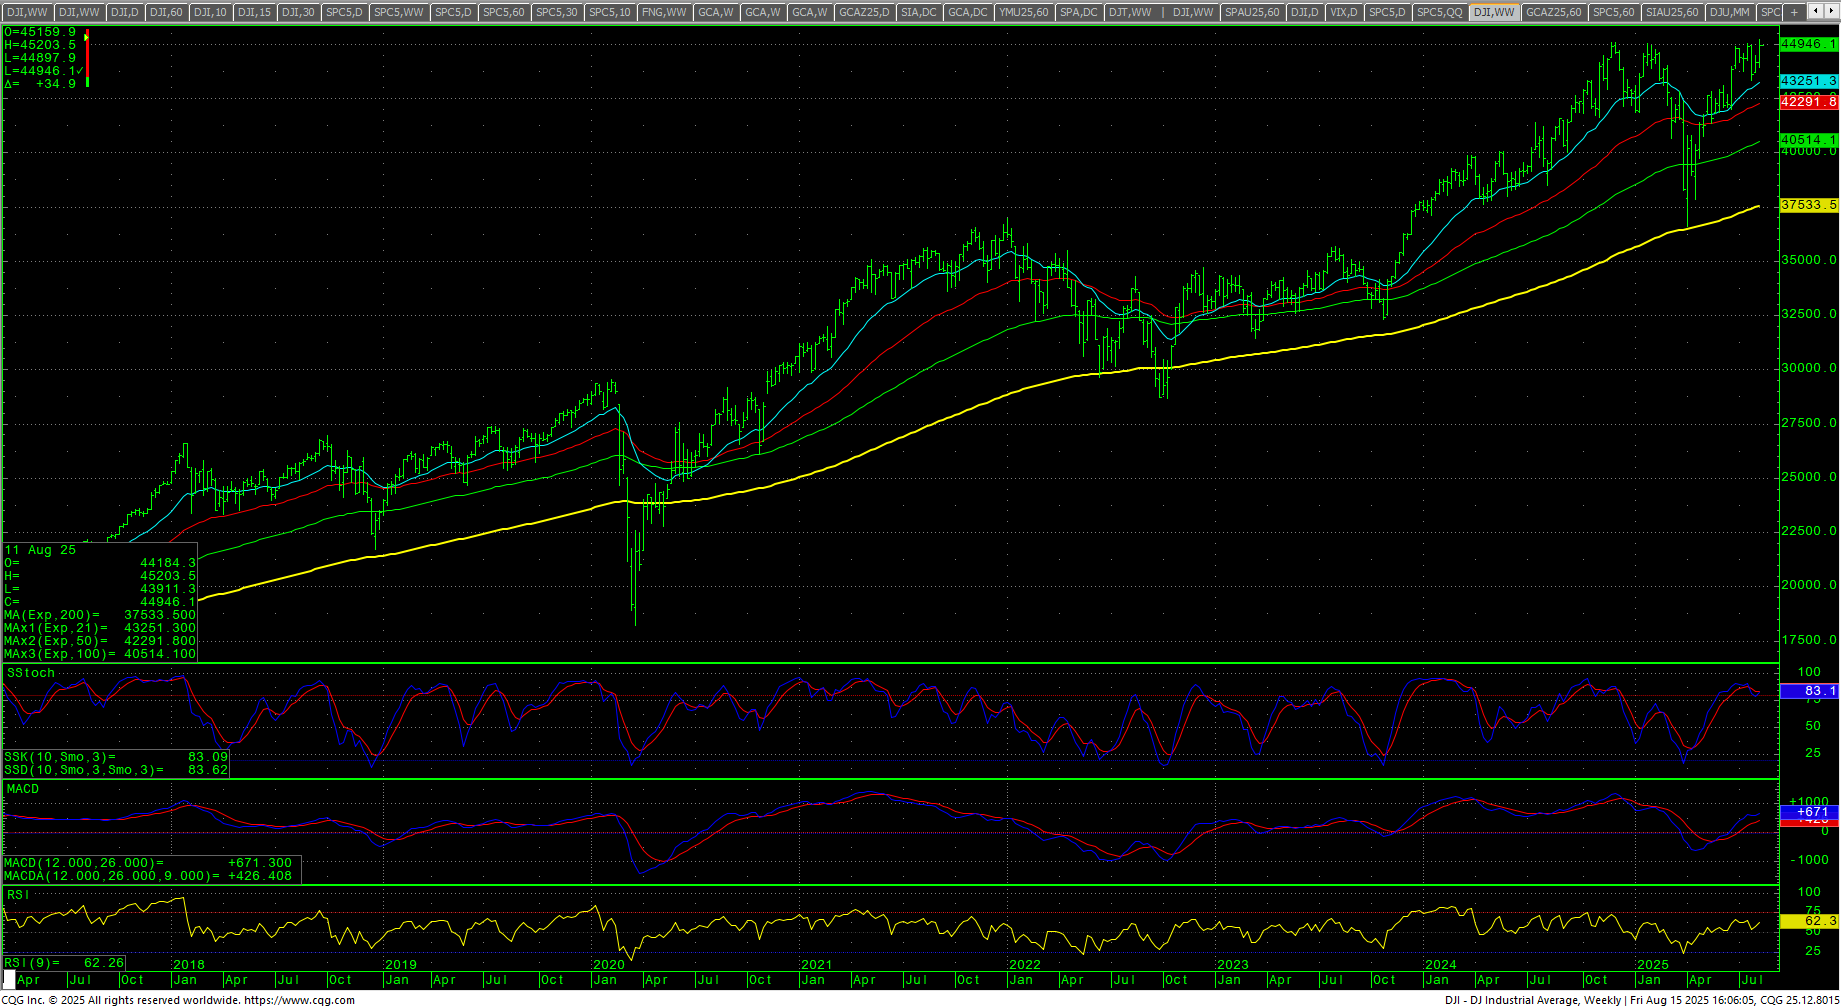 The Dow closed the week up +1.75% on the top end of an inside week’s range at a new ATH weekly close after setting a record intraday high at 45203.50. The daily stochastics have hooked higher. The weekly stochastics are also trying to hook higher. The MACD is down from a key bearish divergence. The daily RSI is 63.6. The 200-day MA starts the week at 42582.70 and is at record highs.
Dow Jones Industrial Average Hourly H-L-C
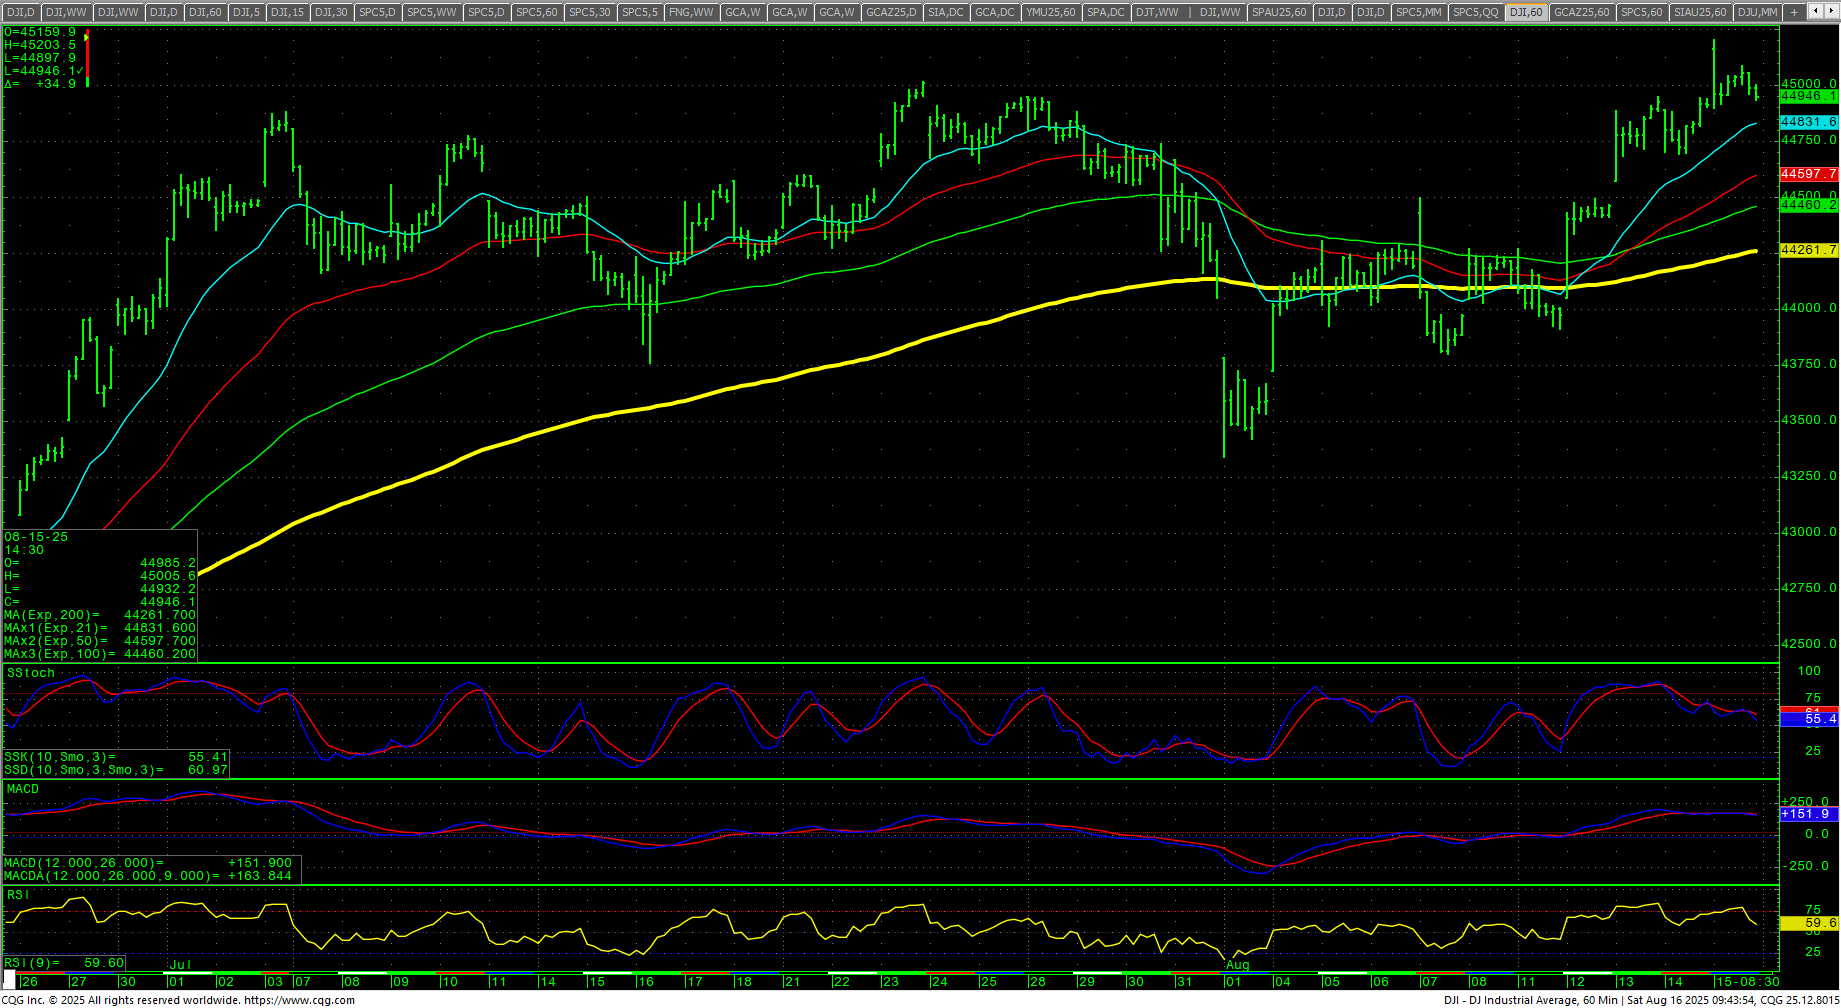 The hourly is neutral on Friday’s close. Resistance 45050 and near-term pivotal at 45086/45090. A drive above 45090 should test 45131 and sets up a retest of 45203.3 with resistance at 45244. Closes over 45244 count to 45426/45450 (Fibonacci target) with resistance at 45306 and 45378. Rallies with closes over 45450 will reopen longer-term monthly targets in the 47400 level with targets of 46568 and 46954.
Dow Jones Industrial Average Weekly Candles
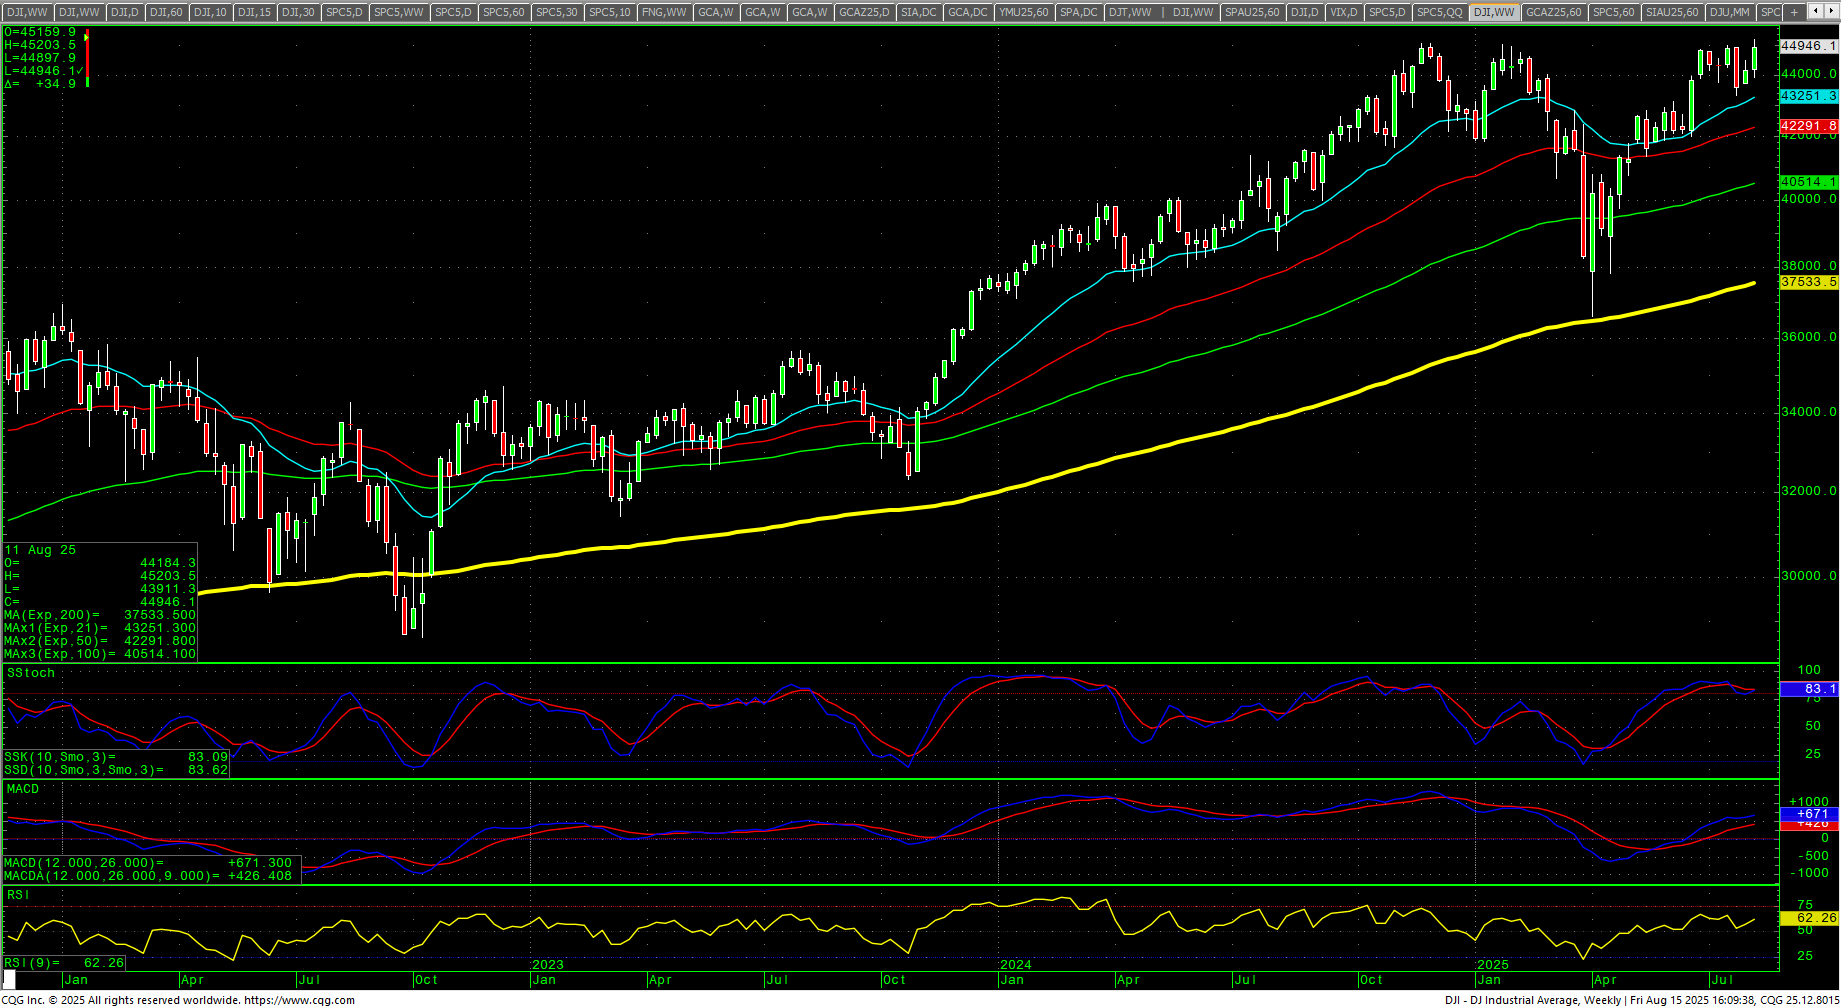 Support is 44763. A break under 44763 sets up 44627 with counts to 44490/44485. Under 44485 should test 44272 with counts to pivotal support at 44052/44048. Closes under 44048 should minimally test 43806/43780 with counts to 43340. A breakdown under the 43340 area will set up 43175. Under 43175 sets up support of 42000/41921.
Dow Jones Industrial Average Daily Candles
| Resistance | Support |
|
|
S&P 500 Cash Index: SPX
S&P 500 Index Daily Candles
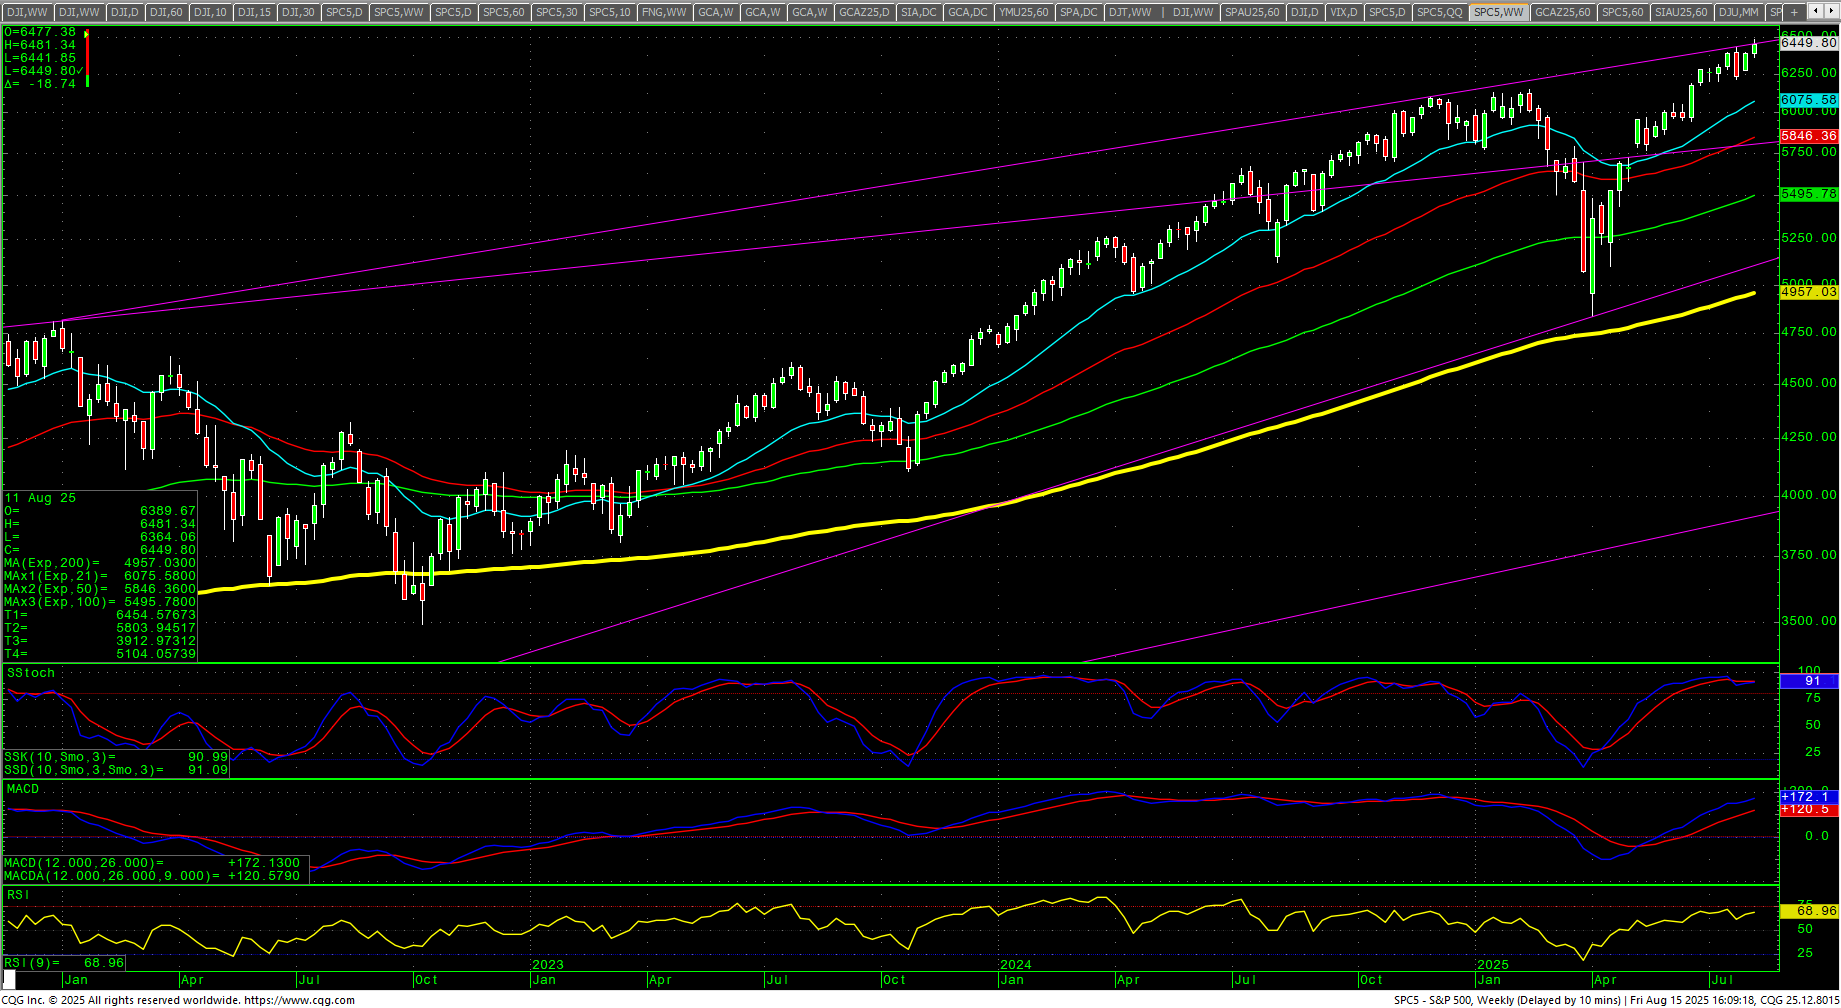
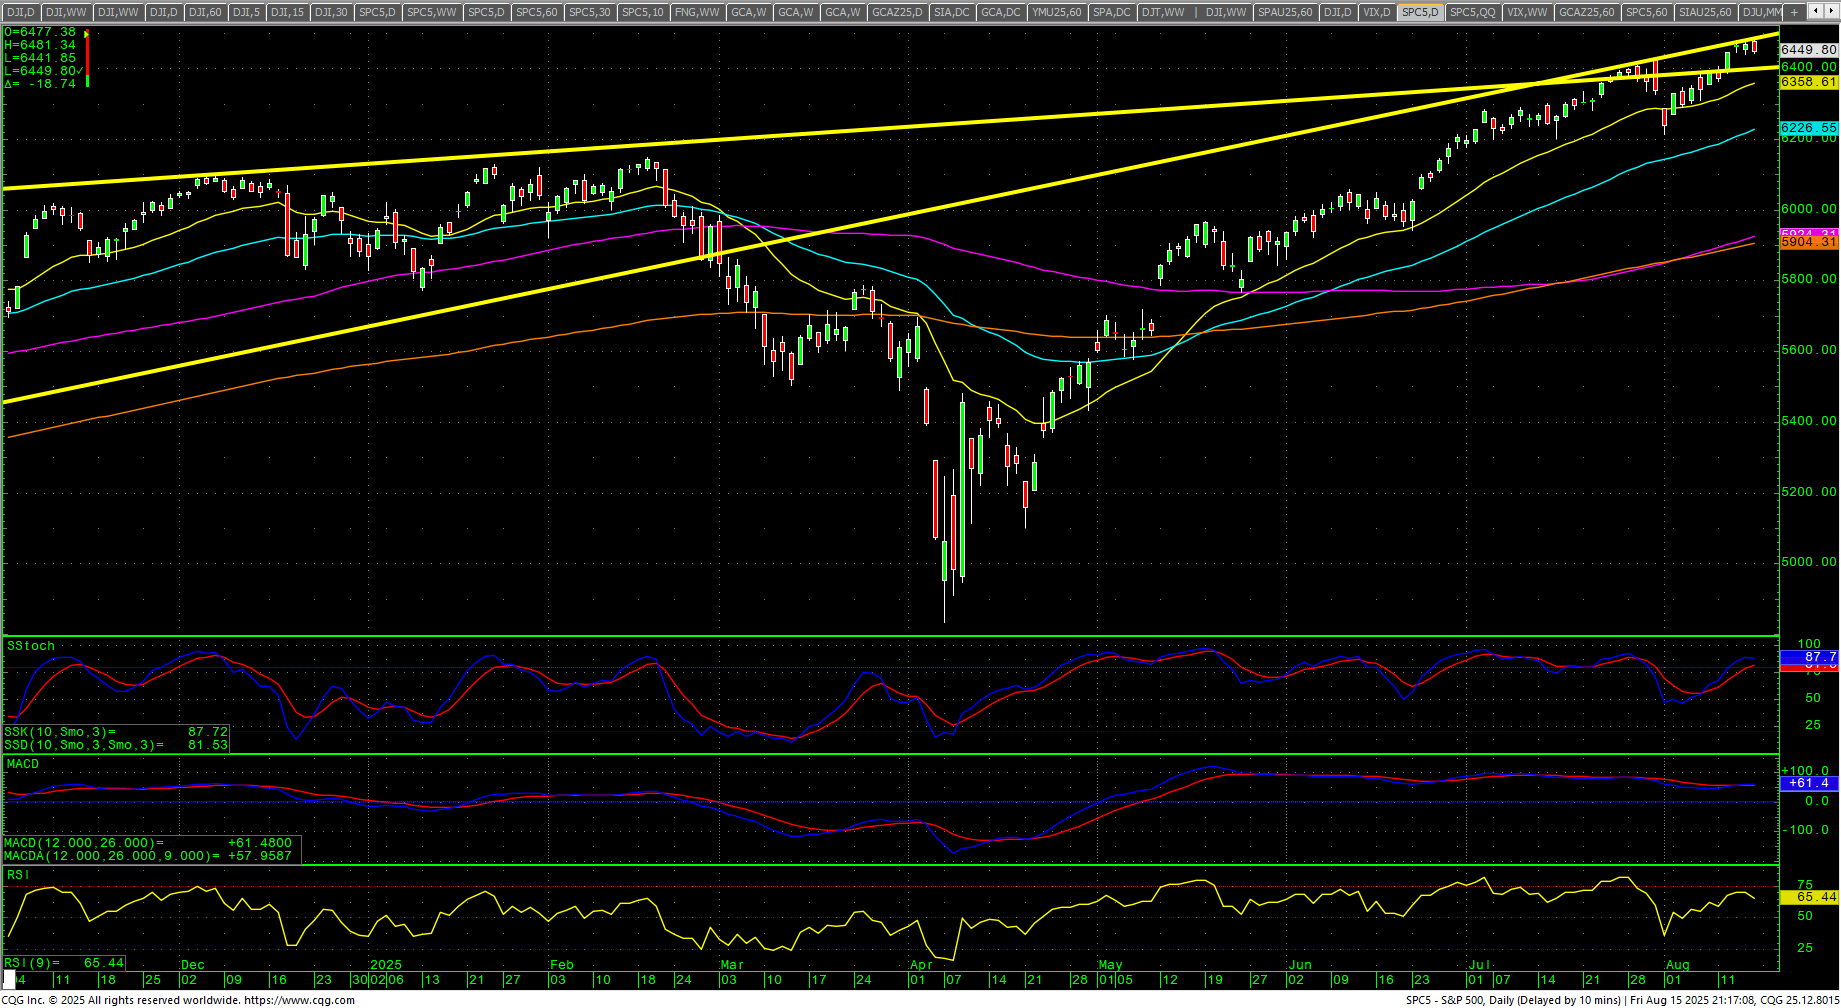 The S&P reversed lower in Friday’s trade after setting a record intraday high at 6481.34 in a critical cycle timing week. Prices are testing the monthly trendline from the 1929 stock market highs and the daily stochastics have hooked up with another preliminary bearish divergence. The weekly is attempting a hook high from overbought levels. The weekly close is a record. The daily RSI is 65.40 and in a bearish divergence. The hourly is neutral on Friday’s close. The 200-day MA is 5904.31 and is setting record highs. All moving averages are at record highs. The SPY closed at an ATH.
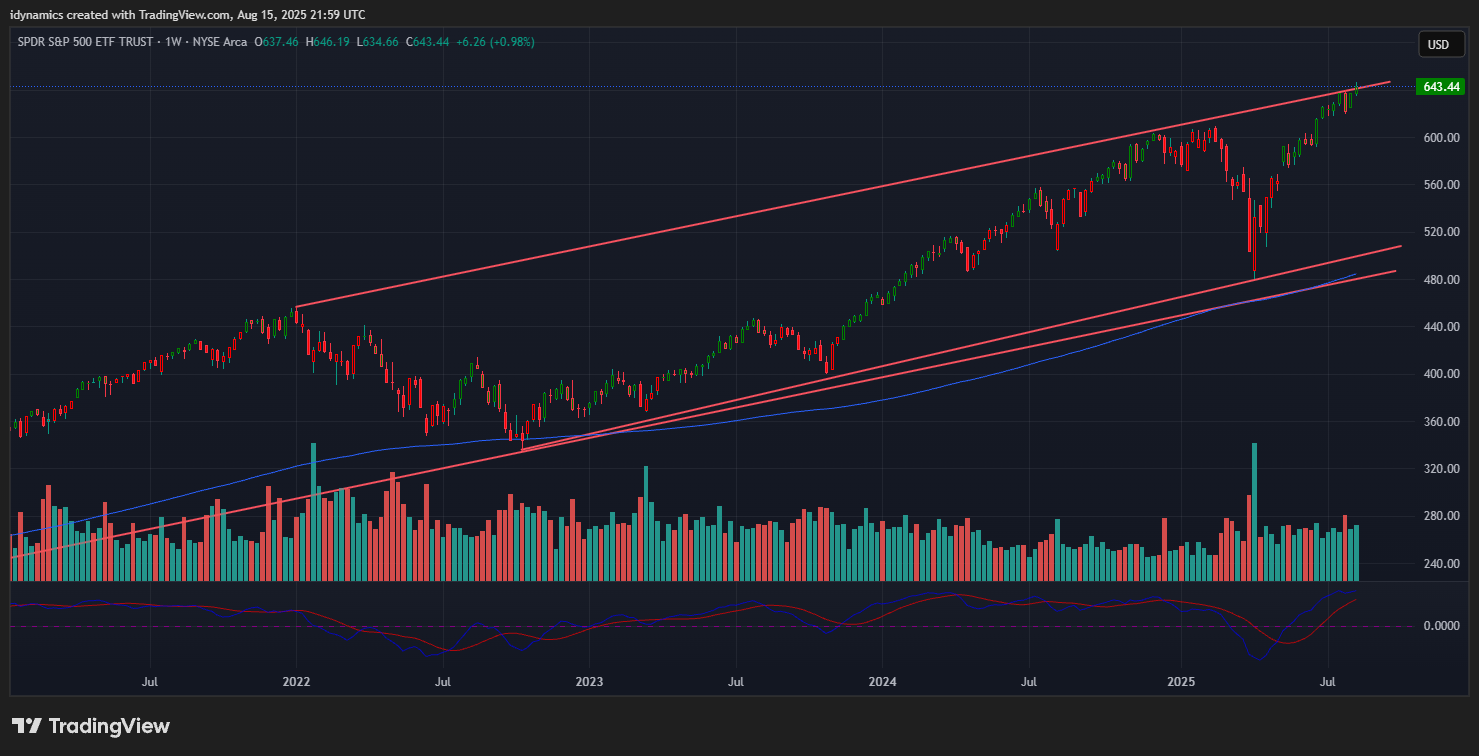
SPX/SPY Weekly Candles
 Resistance is 6466/6468 and the swing high at 6481/6482 with resistance at 6494. Closes over 6482 will open counts to 6584 and resistance at 6602. A breakout over 6602 sets up 6638 and 6692. A breakout with closes over 6692 counts to 6764 and 6800. Closes over 6800 can carry to 6872 and 6908. Closes over 6908 have counts to 6944 and 6980 through 7016.
S&P 500 Index Hourly H-L-C
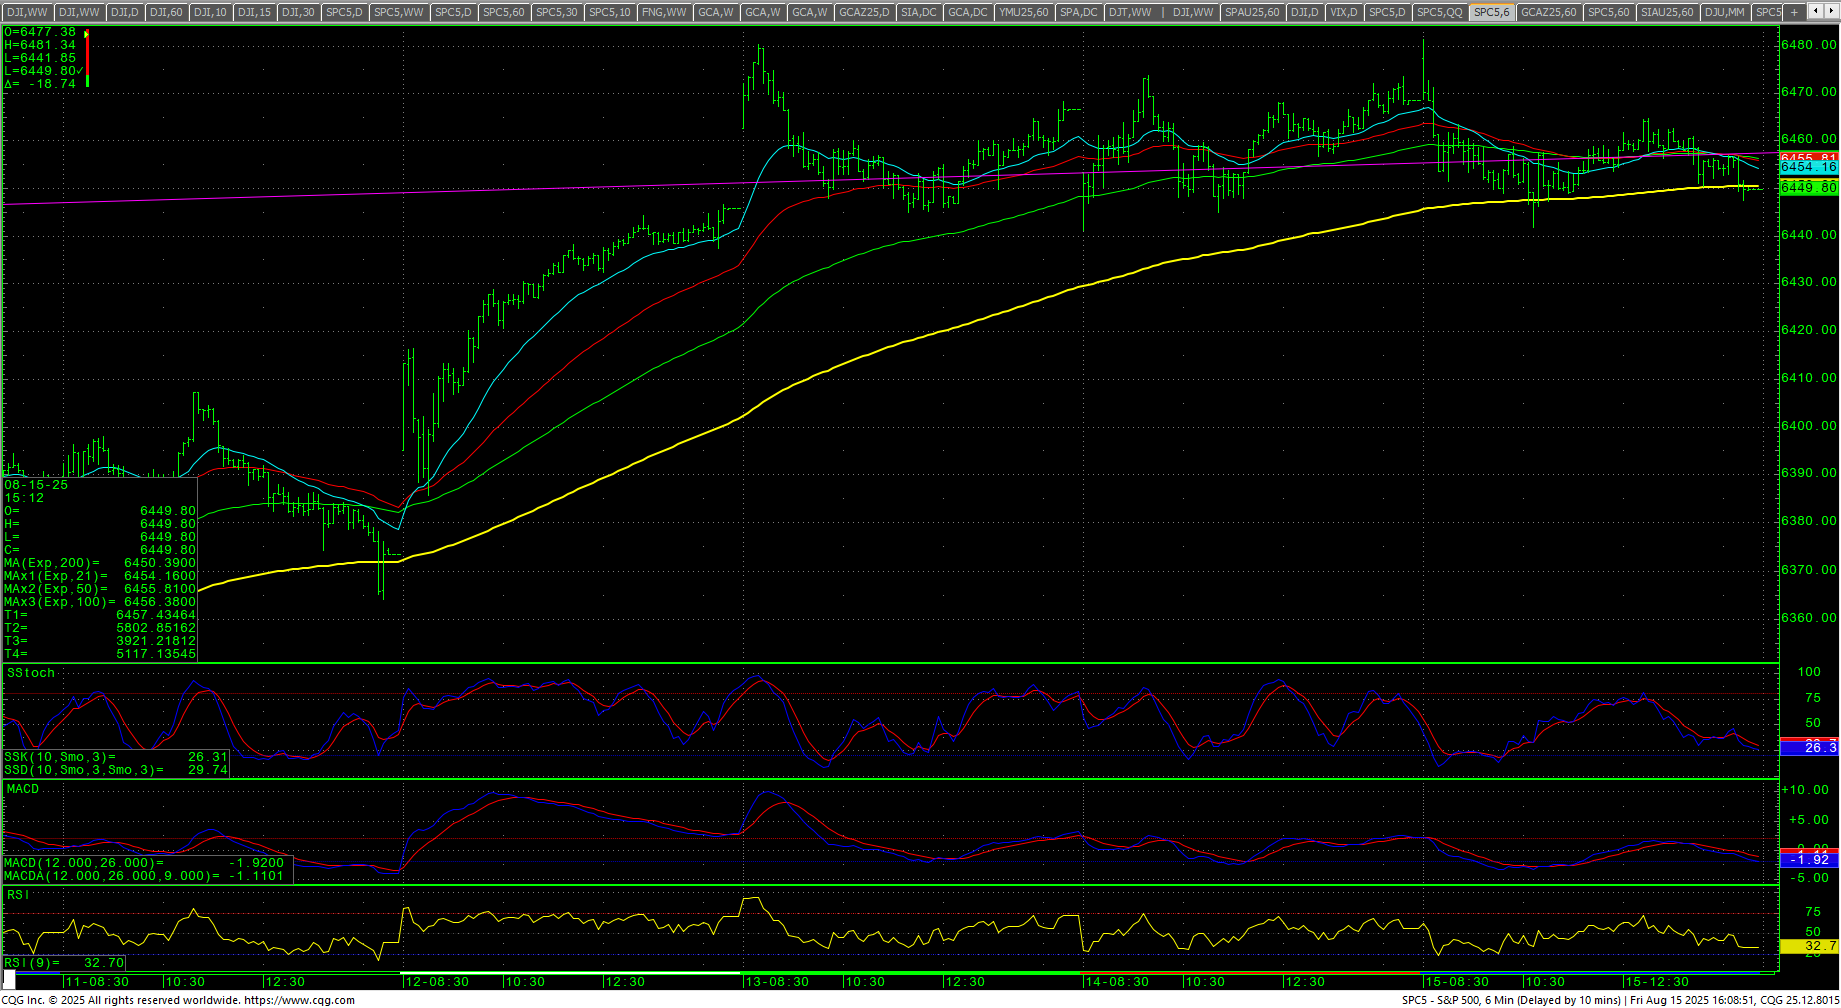 Support is 6417 and 6379/6378. Under 6378 sets up 6347 with counts to 6315/6312. A breakdown under 6312 should minimally test 6279/6276 with counts to the hourly double bottom at 6212/6201 with potential to 6092. Closes under 6092 setup potential to 5852 through 5788. A breakdown with closes under 5788 can carry to 5658 with full counts to critical near-term support at 5463/5460. Daily closes under 5460 are bearish to 5246/5223. Closes under 5223 open counts to 4995 with full potential to 4835.
| Resistance | Support |
|
|
Charts courtesy of CQG, Inc., CNN, Koyfin, Trading View and AAII