
TECHNICAL ANALYSIS (by Intraday Dynamics)
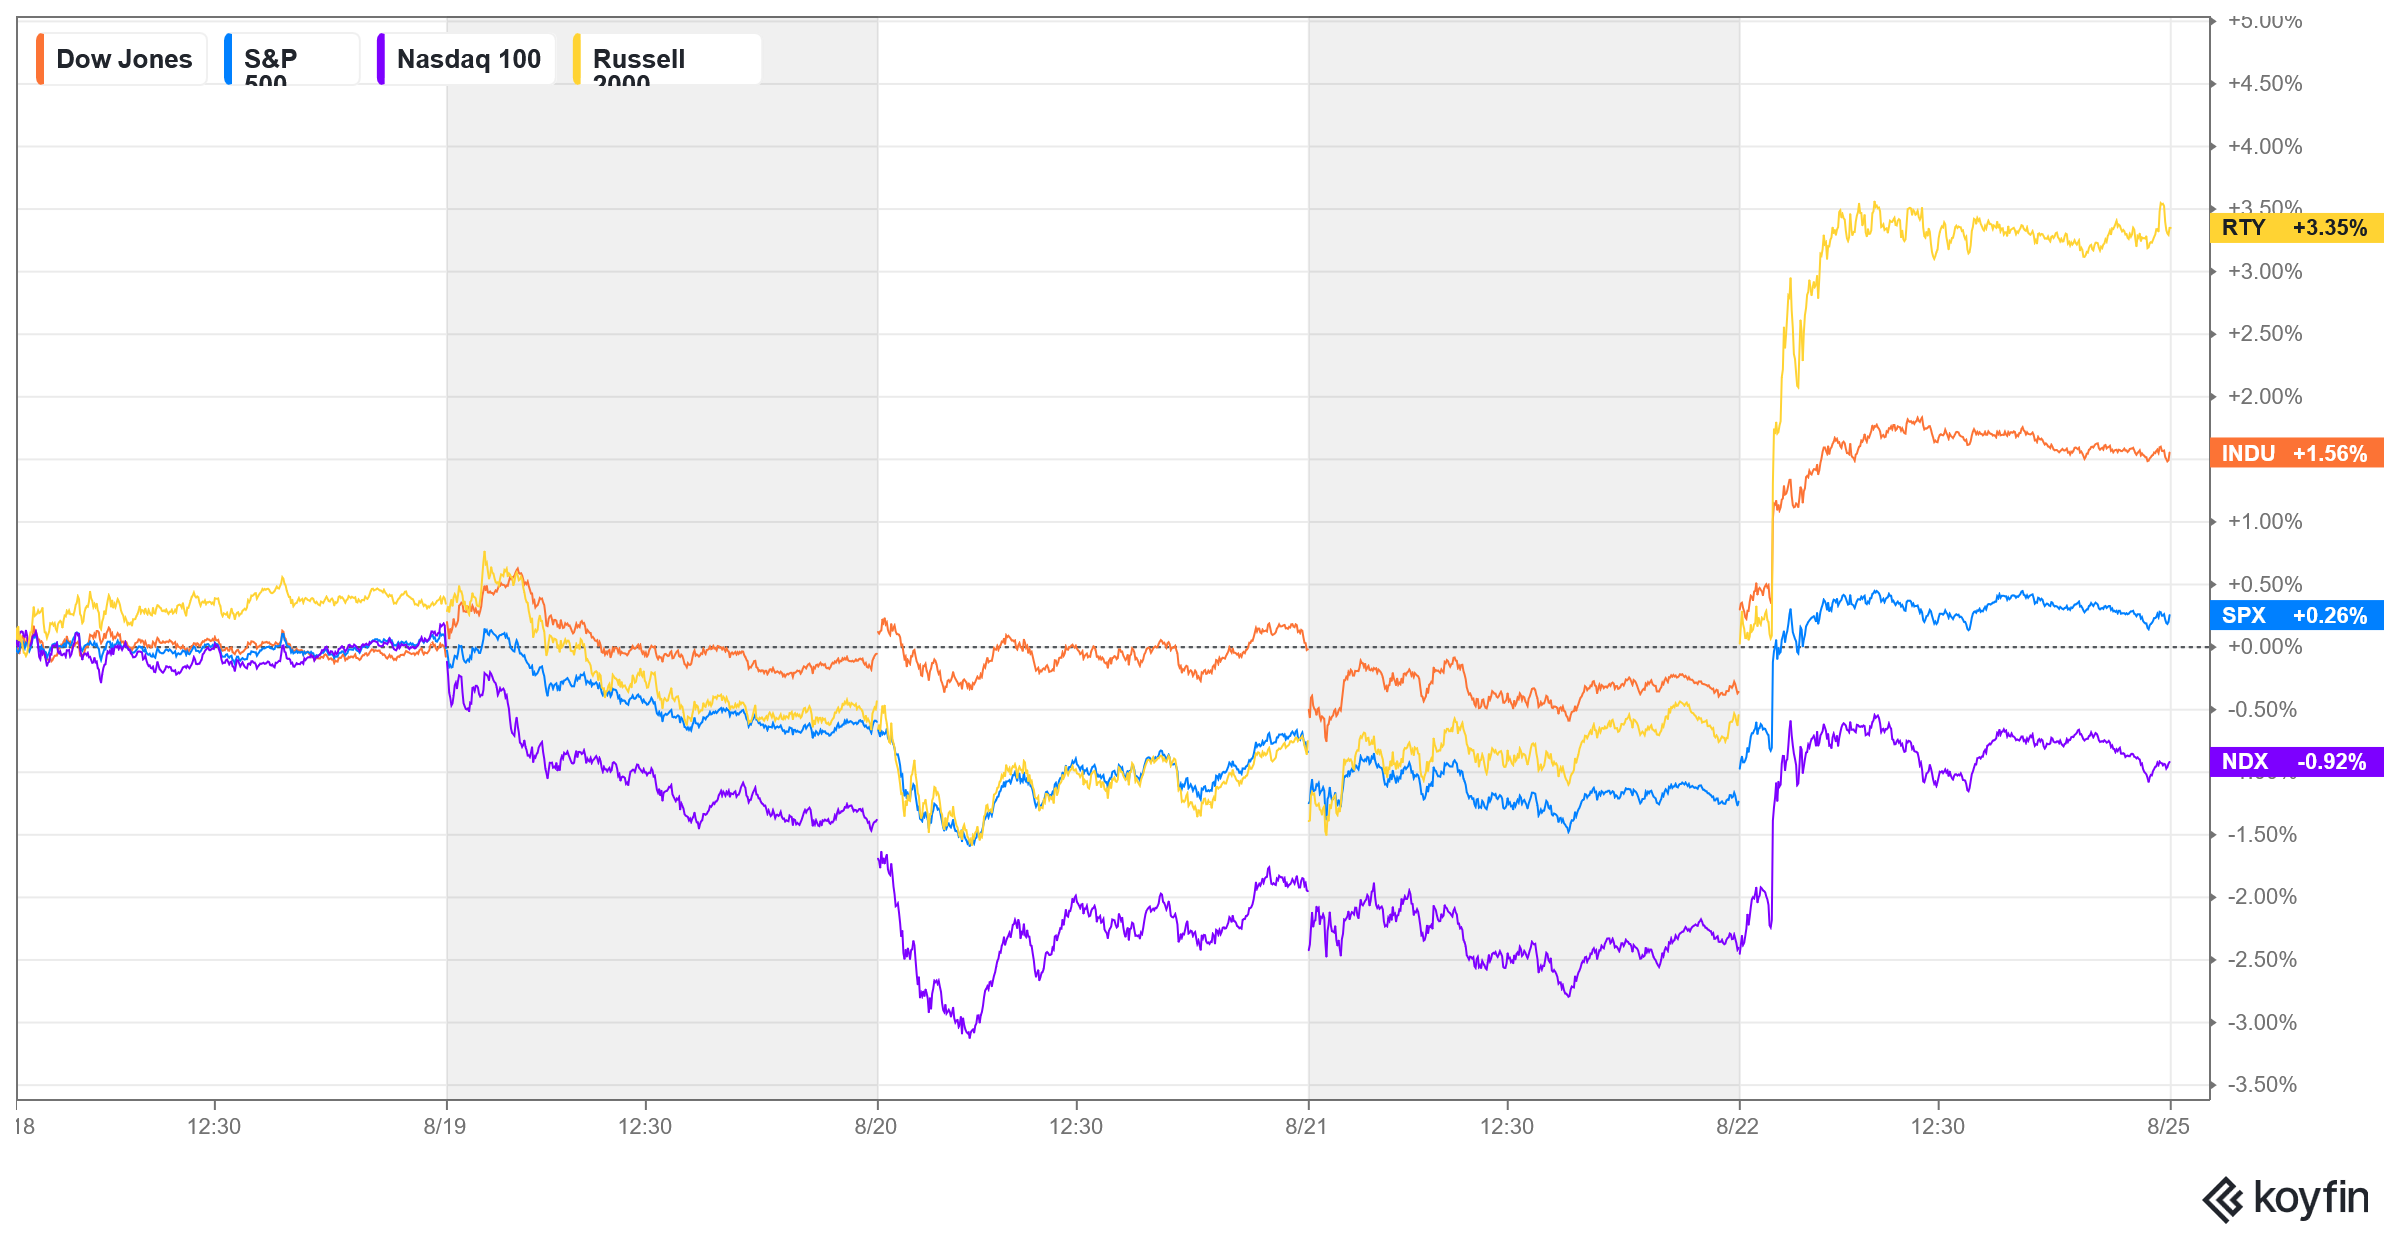
Major Indices Week of August 22, 2025
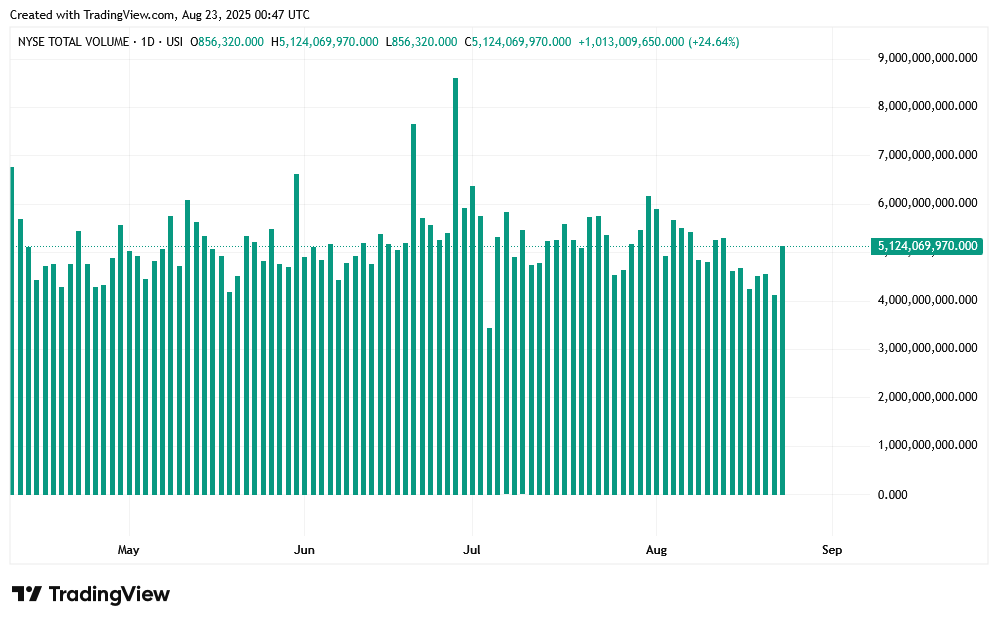
 NYSE Volume

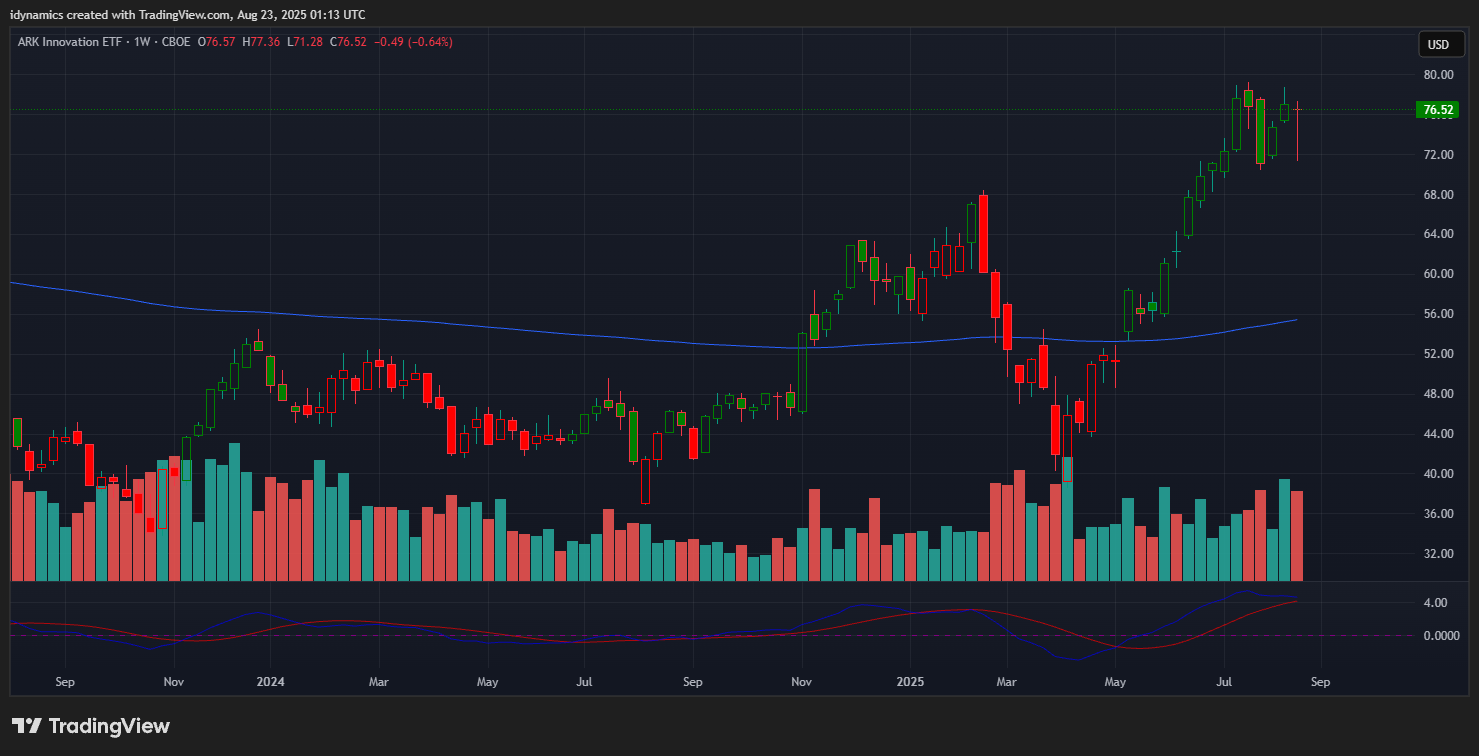
MAGS+ORCL+PLTR+AVGO Daily Candles
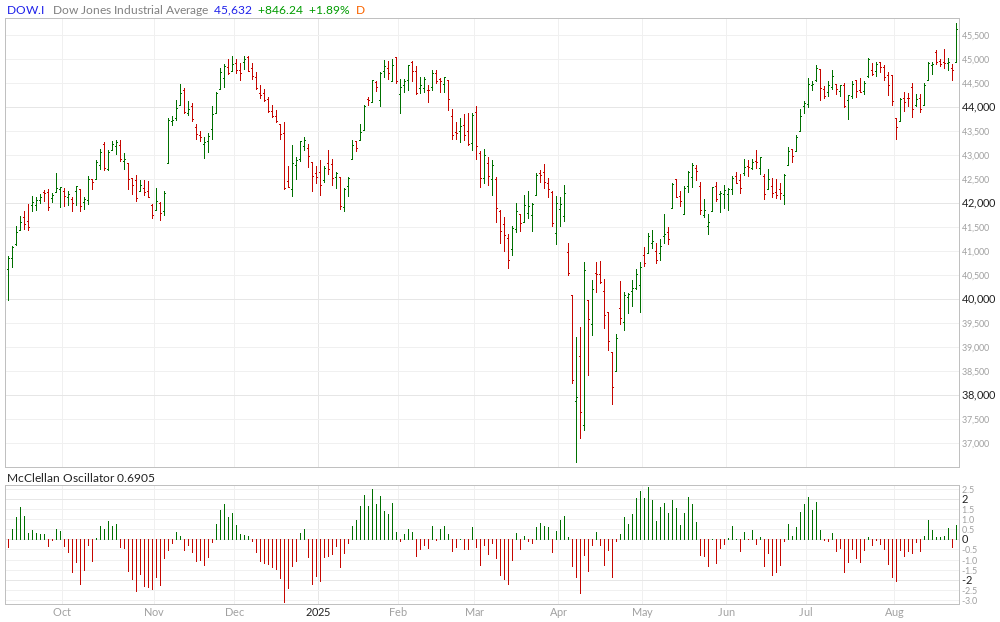
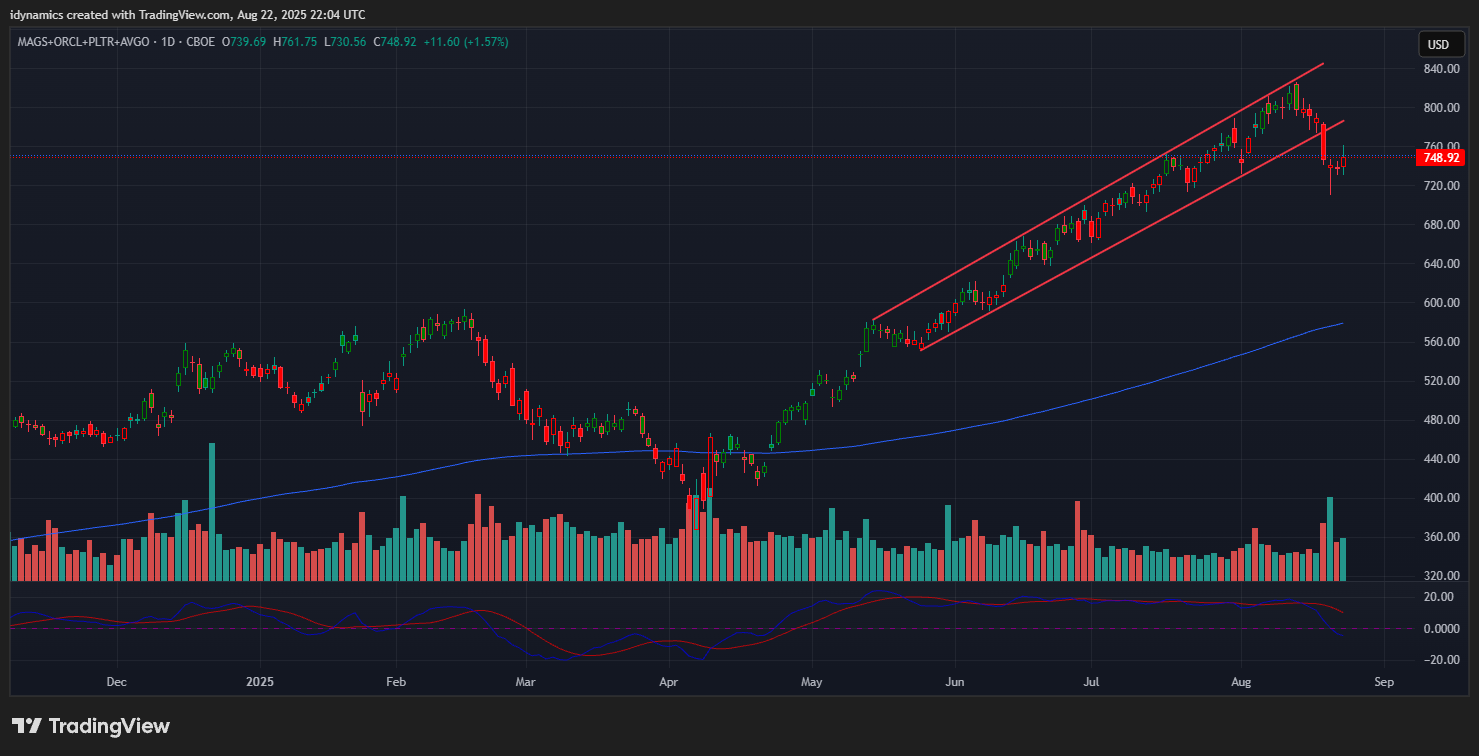 As goes tech, so goes the market. Stocks began the week on the defensive and then exploded to record highs on Friday with high volume as Wall Street bets on the Fed coming through with rate cuts. Bond yields declined sharply on Friday and It looks like everything is coming up roses. The combined chart of MAGS+ORCL+PLTR+AVGO along with ARKK and PLTR finally showed some cracks prior to the big breadth upmove on Friday. The Dow soared above the 45K level, almost 2%, to a new ATH and the S&P tested its intraday highs settled at records. Valuations are beyond frothy…but with “rotation” being the word of the day and the RSP rocketing higher, all is well in equity land. Retail traders continue to “buy the dip” and cannot get enough of the meme stocks. With the Dow breaking solidly into new highs, and if you buy into a potential inverted head and shoulders on the daily chart, you can build a case for a meteoric vertical that carries the Dow well above 50K with targets as high as 53537. That would be case #1. Case #2 is that we reach a Challenger-type event in the next two months.
Bankruptcies
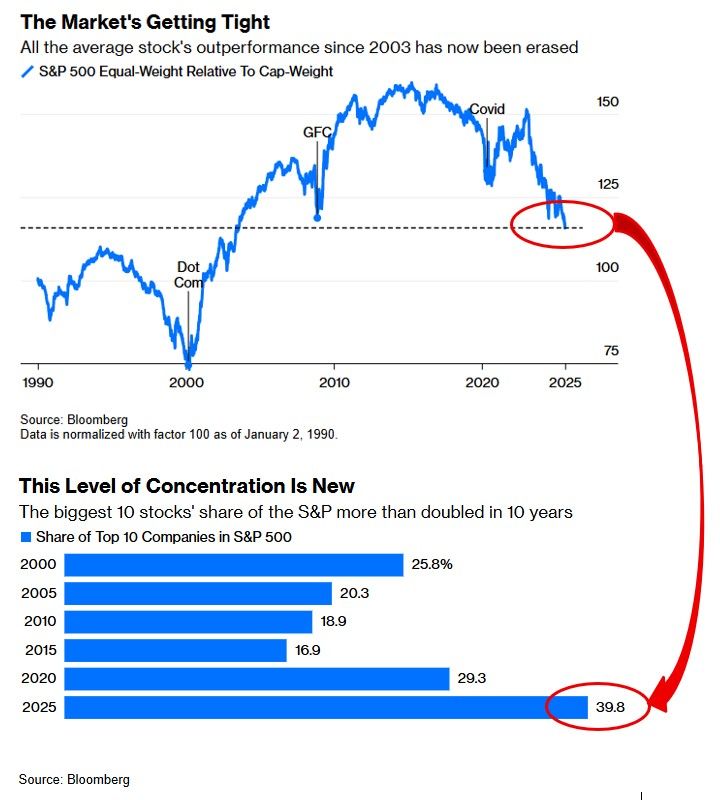
The VIX set new lows this week and complacency is extremely high. Calls outnumber puts by wide margins. Insurance bets are nonexistent. Inflation has been tamed and the concentration in the market has reached extremes with only 10 stocks making up 40% of the SPX. That said, breadth improved sharply in Friday’s trade and improved across the board, particularly in the secondaries. Bankruptcies in 2025 are eclipsing Covid levels. The underlying fundamentals are flashing red lights and yet the Generation X ‘traders’ raised on YouTube and Reddit continue to pile into the market. Not one of these Gen X-ers have ever lived through a bear market and all the know are flash crashes…with no idea of what a decade-long desert even looks like.
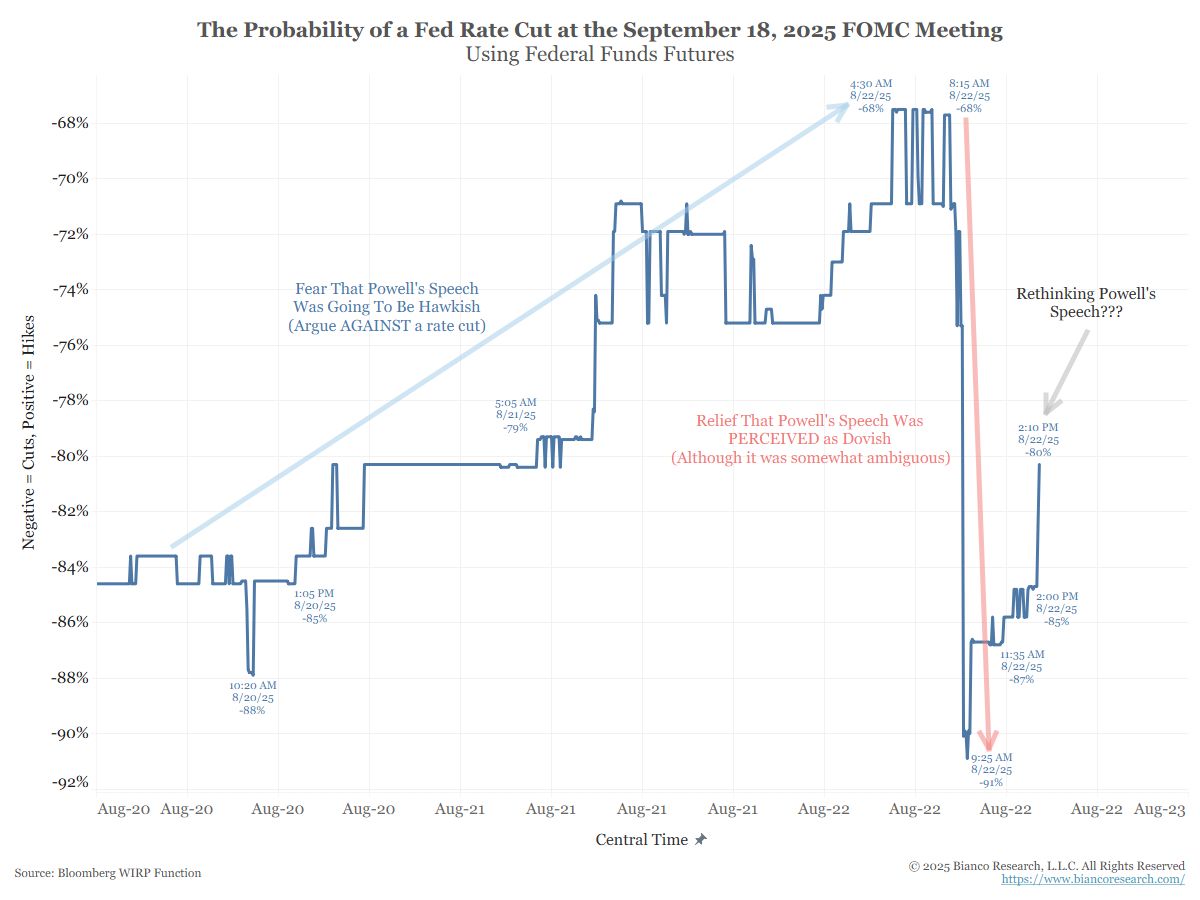 All eyes are on the Fed now after Powell’s talk at Jackson Hole. Is the Fed preparing to pour kerosene on the speculative fever gripping the markets?
“Remember in the last Cycle Timing Update, I pointed out that the parallel to 1987 is very real…and, in that year, prices moved higher into late August and then started a correction. If we are truly rhyming, this may be the case for 2025. (In 1987, the highs came on August 23rd). The reality is that we are now in a 6-9 month window of extremely volatile longer-term cycles. August is when things really heat up with the cycles. The Dog Days of summer are directly ahead. August is a month where there is strong potential for an exogenous event to occur.”
SPX Monthly Candles
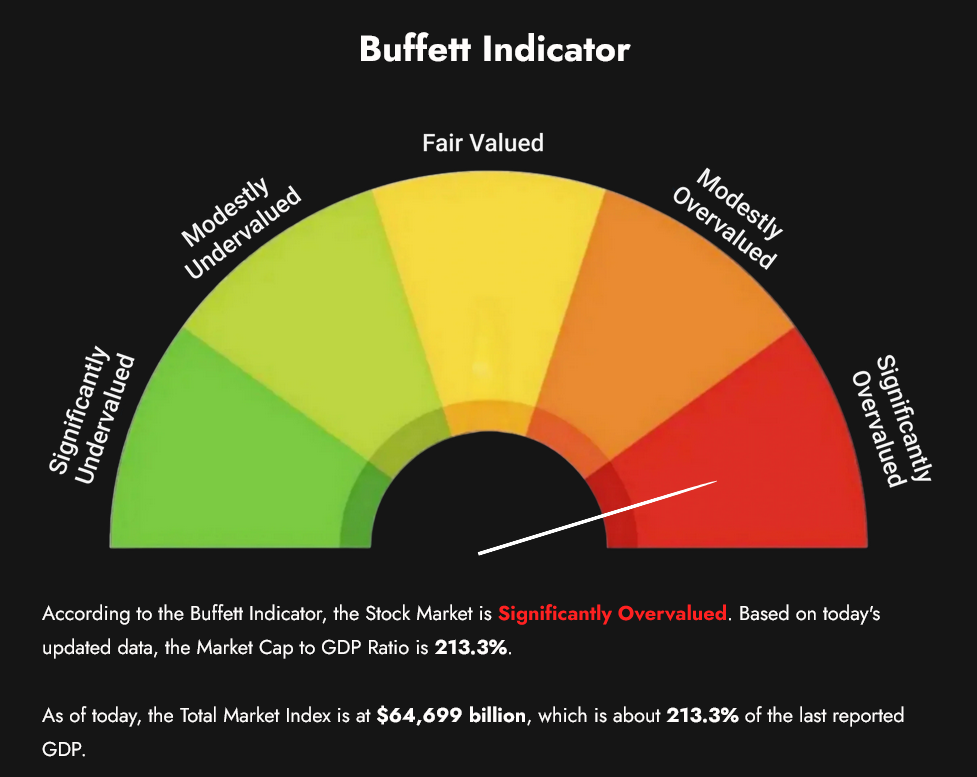
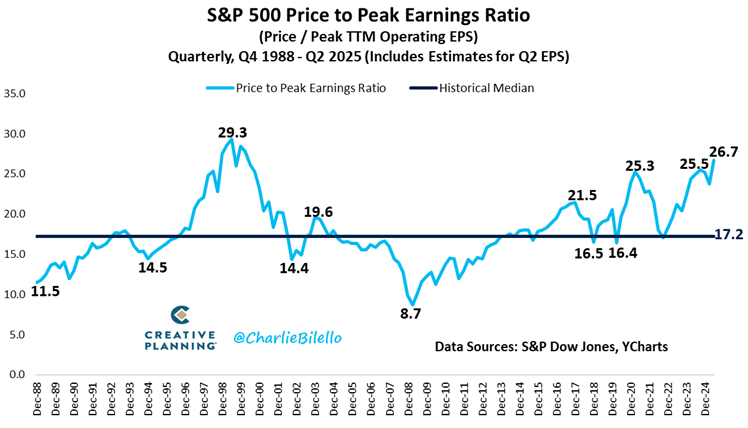
 Sentiment is not insane considering the upside momentum. The Buffet Indicator moved to an ATH at +213.3. Price to peak earnings are nearing Dot Com levels.
*Lowered the stop on the 2-lot short YMU to 45202 (+55 ticks). Shorted 1-lot at 45236 and covered at 45115 (+121 ticks). Looking to enter a trade on the SPU mini this week.
S&P 500 Stocks Above the 200-day MA
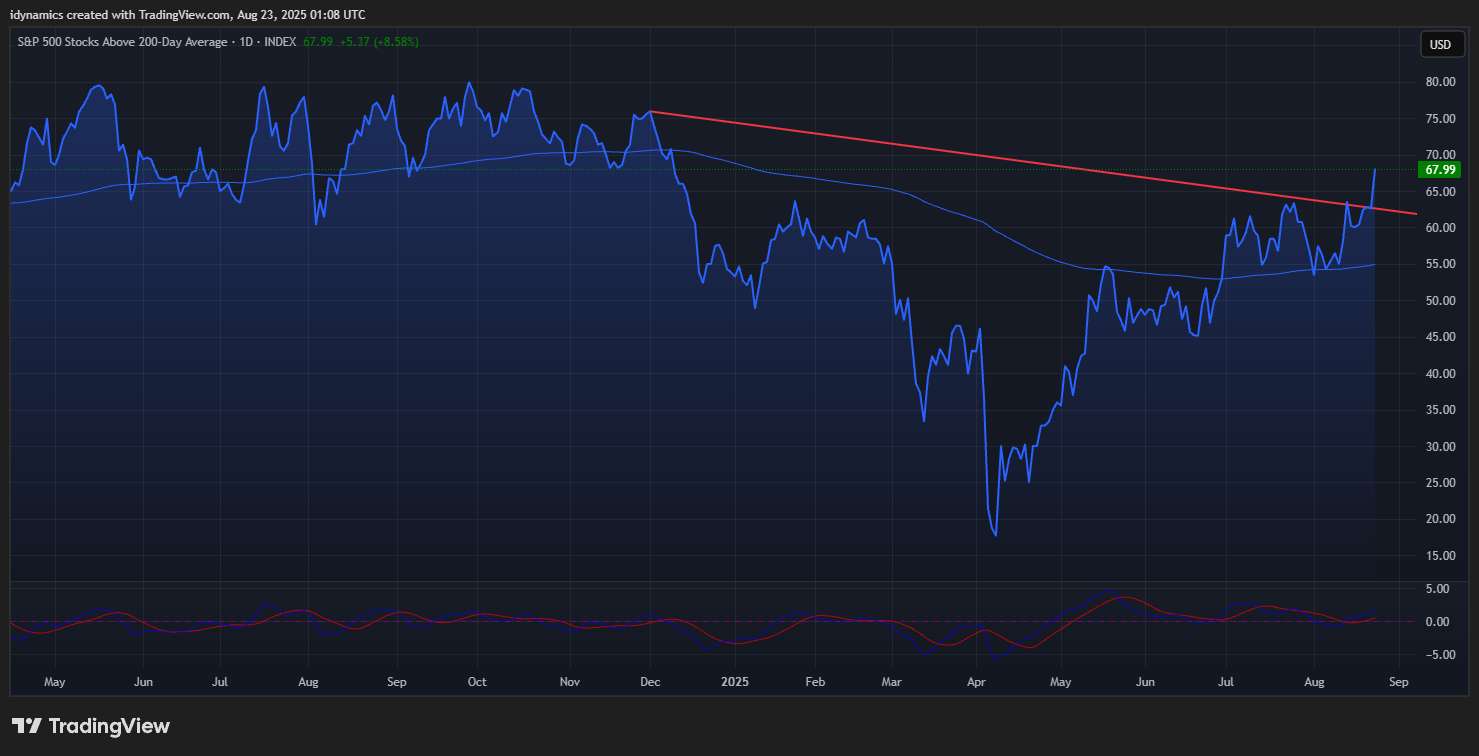 Breadth improved sharply for the SPX on the week, jumping to 67.99%. The high in September 2024 was 72.92% and 82.70% in March of 2024. Divergence is still the name of the game. Given that only 10 stocks now make up 40% of the SPX, this is not unexpected. 10 stocks have accounted for 80% of the gains in the SPX since ‘Liberation Day.’
MAGS (Magnificent 7) Weekly Candles
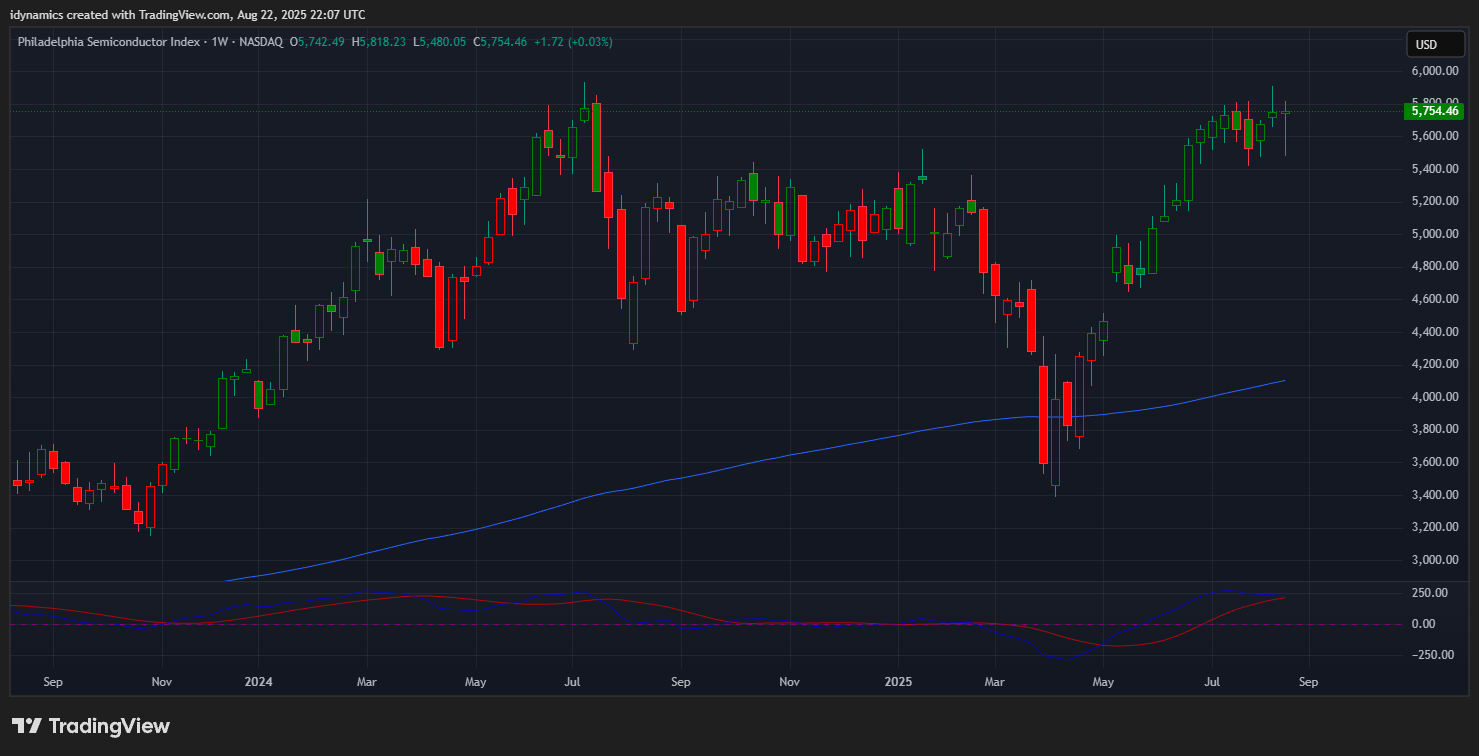
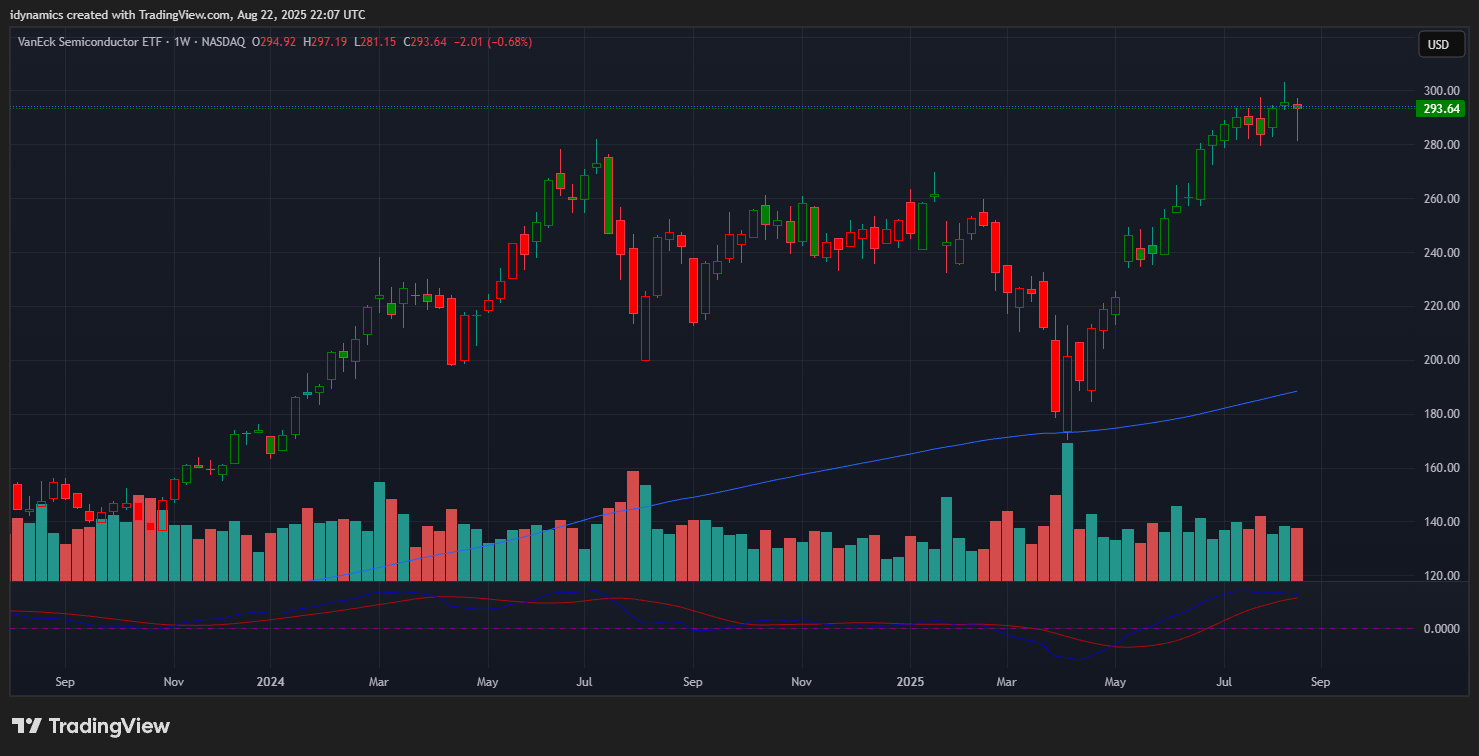
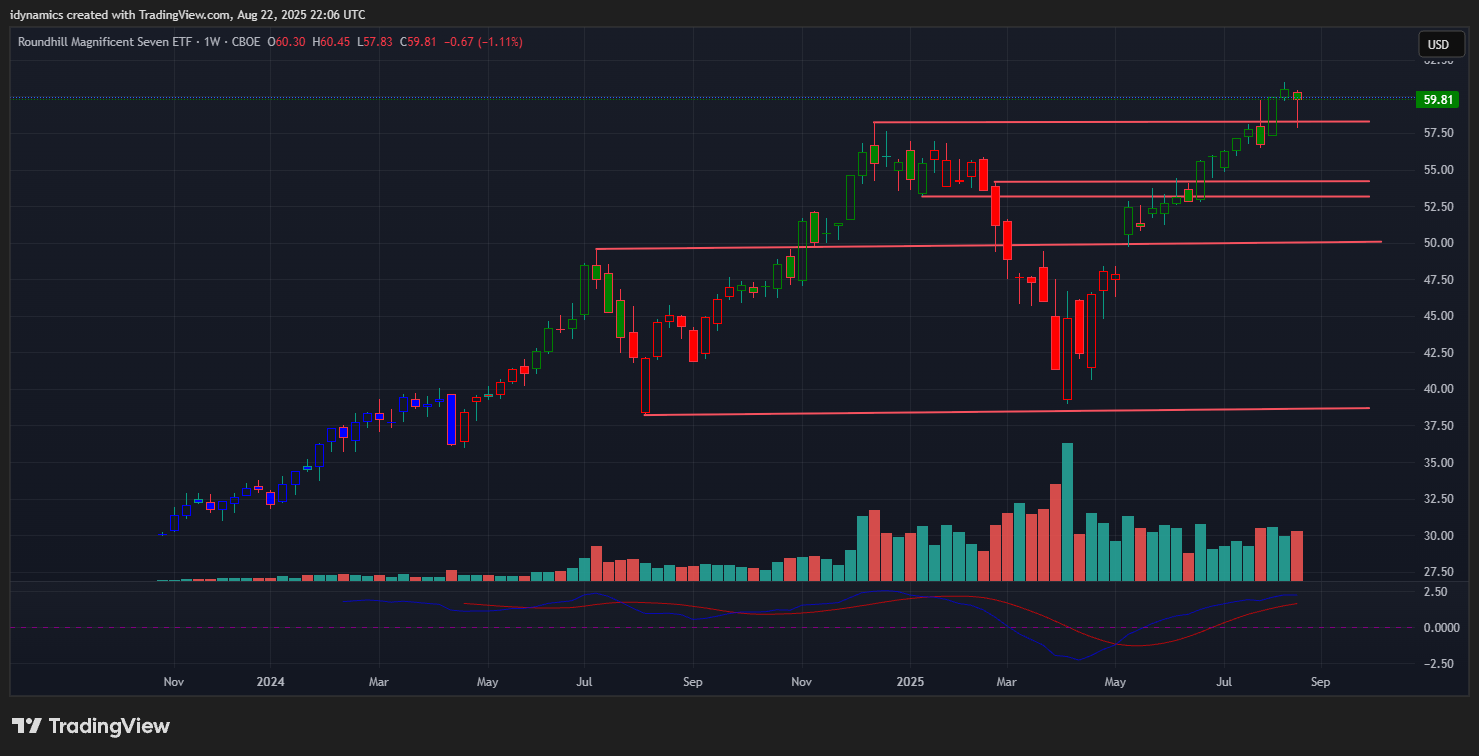 The MAGS traded lower throughout the week but recovered sharply on Friday and closed the week down -1.11% on the top of the weekly range. The market found support at the old highs of 58 and should still see support against the 54.16/53.14 level. There is an upside target of 63.04 and resistance at 64.50. Both the SOX and SMH closed flat but on top end of their ranges.
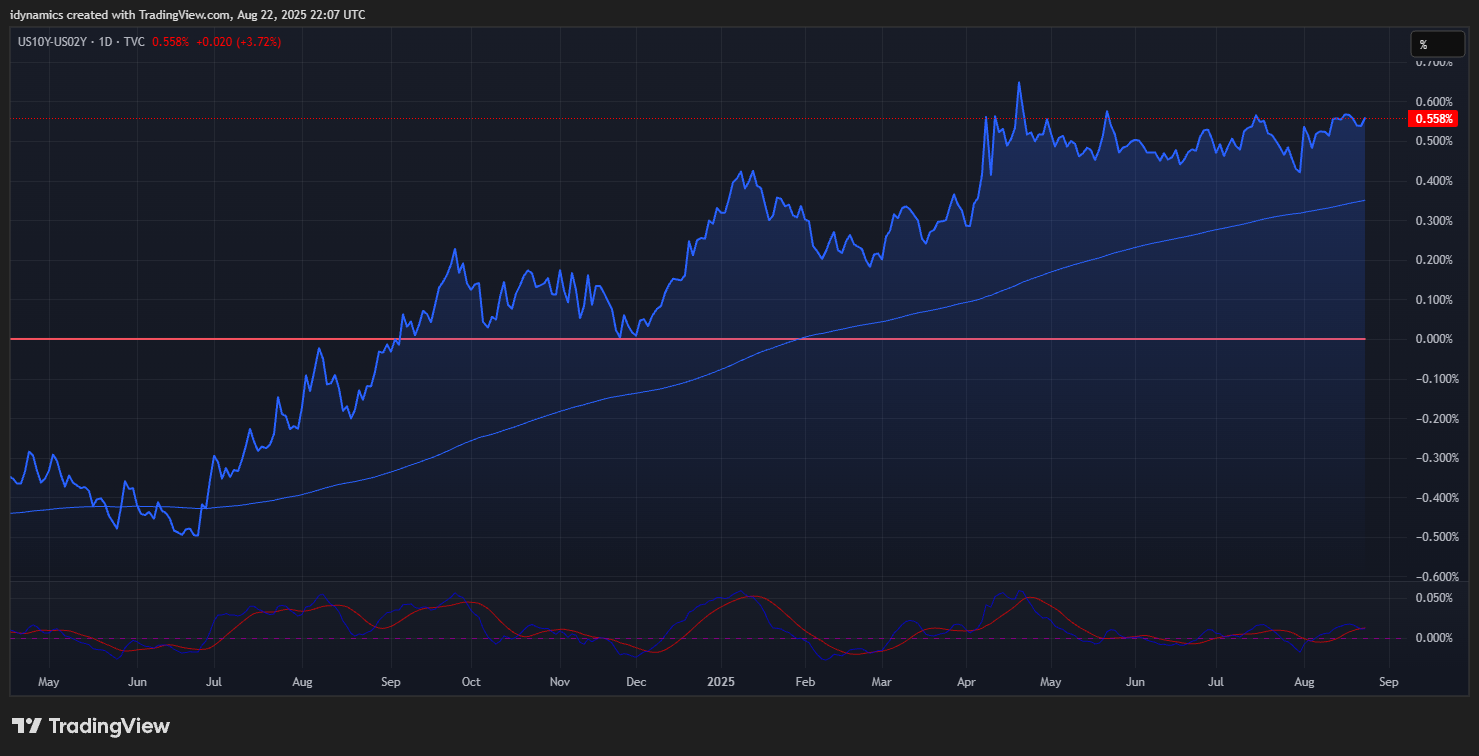
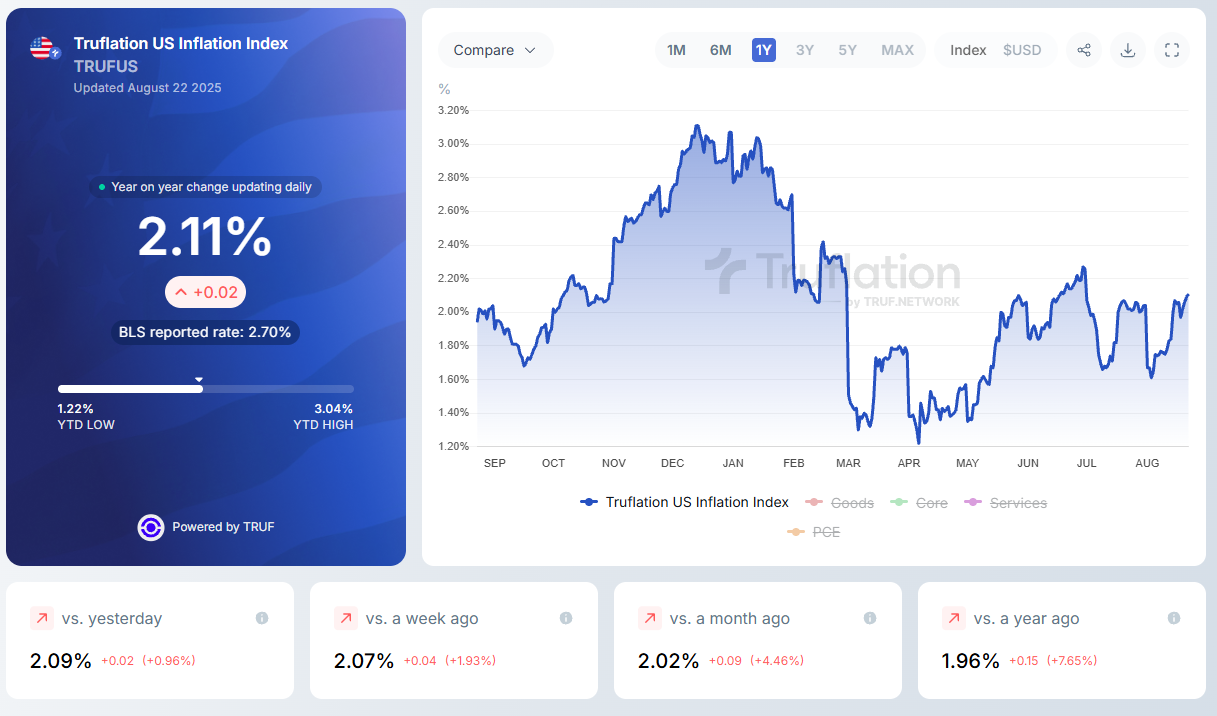
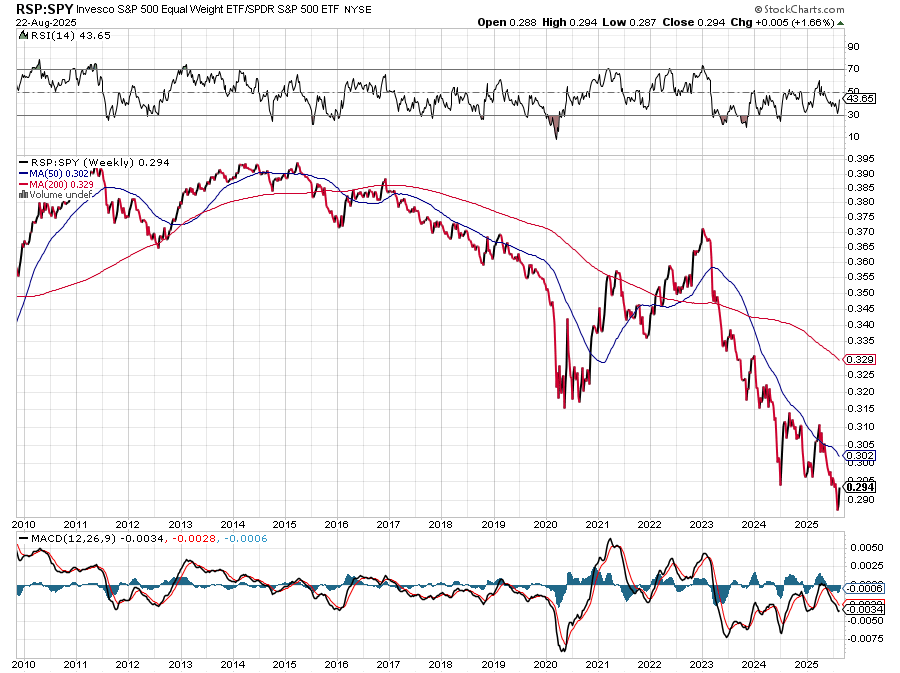
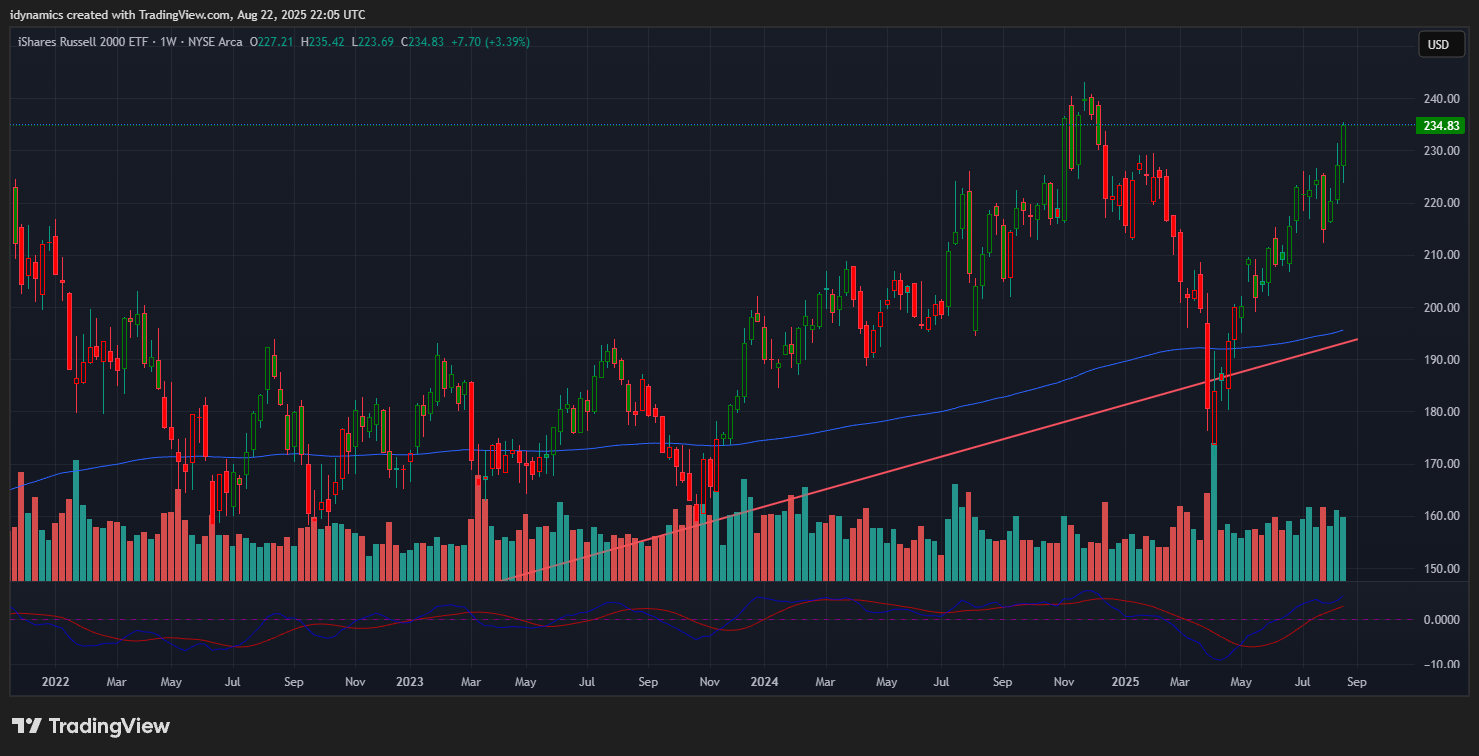
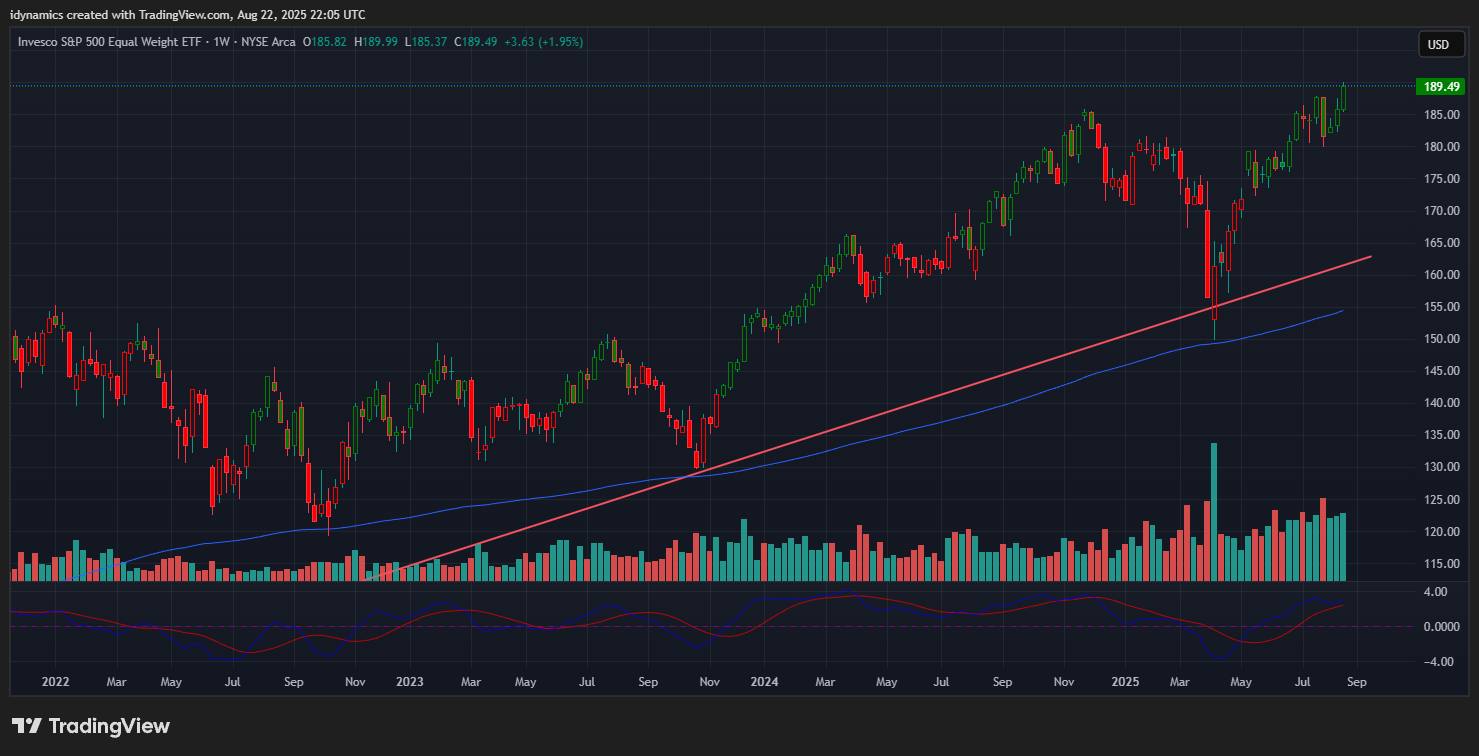
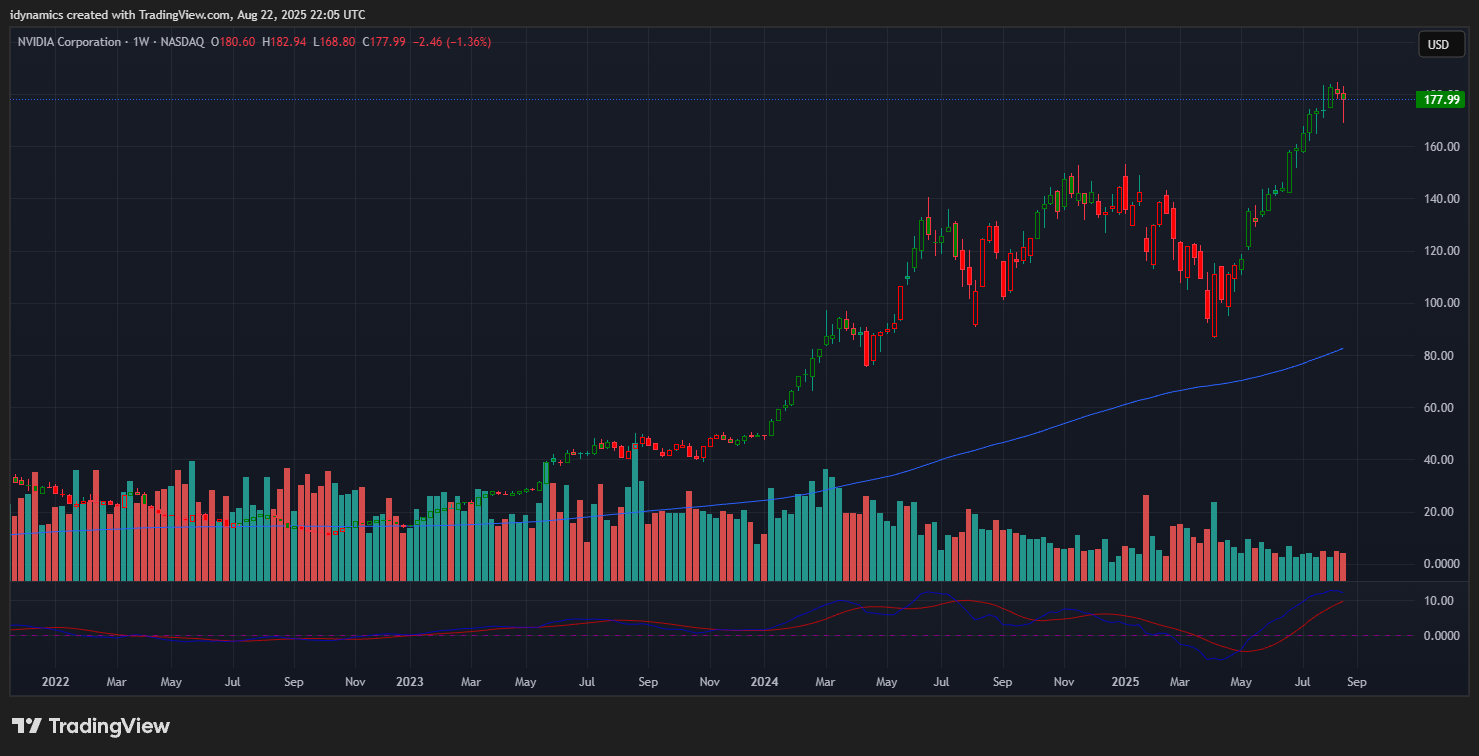
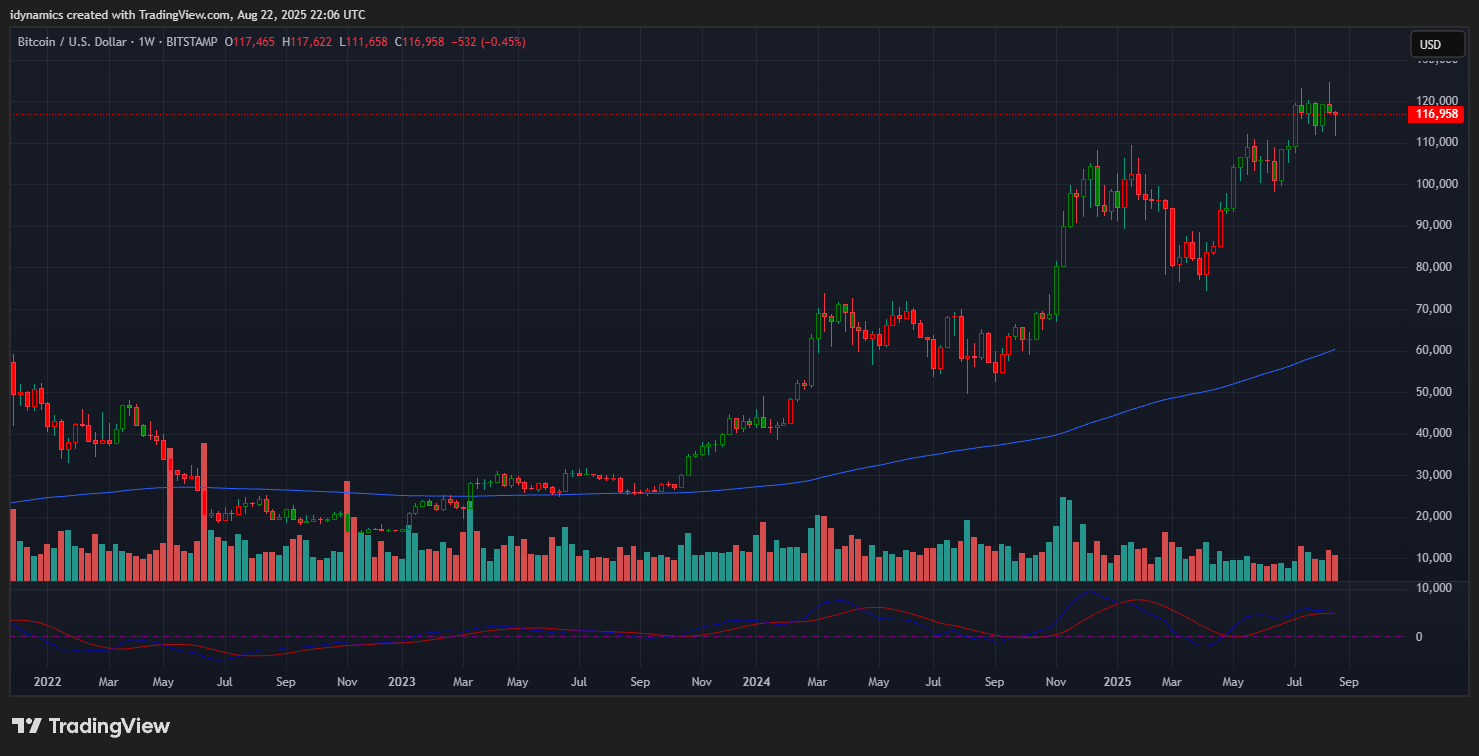
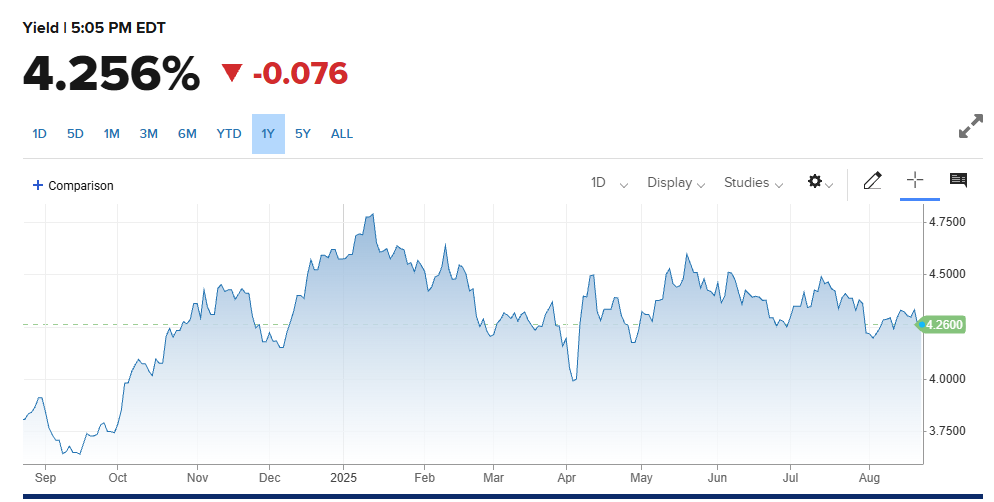
The RSP:SPY had a good week, testing a two month high as “rotation” set into the markets. Volume was decent. However, the spread chart remains extremely weak. The weekly is trending lower in an oversold position and the MACD is turning back down. Resistance is right here at .294. Remember tha HALF of the companies in the Russell make ZERO profits…none. The IWM was up strongly, closing up +7.70% on the top end of the range. The RSP rocketed higher and closed on the top of the range at record highs, up +1.95%. NVDA dropped sharply intraweek and settled down -2.46% near the middle of the range. Bitcoin dropped to a six week low but recovered late to close near the middle of the range -1.48. Support remains at 110/108. McClellan Oscillators are showing strength in the Dow with the record highs. The Yield Curve was flat on the week, closing at +0.558%. The 10YR yield declined, closing at 4.256%. Truflation jumped to 2.11%. Corporate bond spreads are at a 27-year low.
10YR-2YR Yield Curve Daily

 VIX Weekly Candles
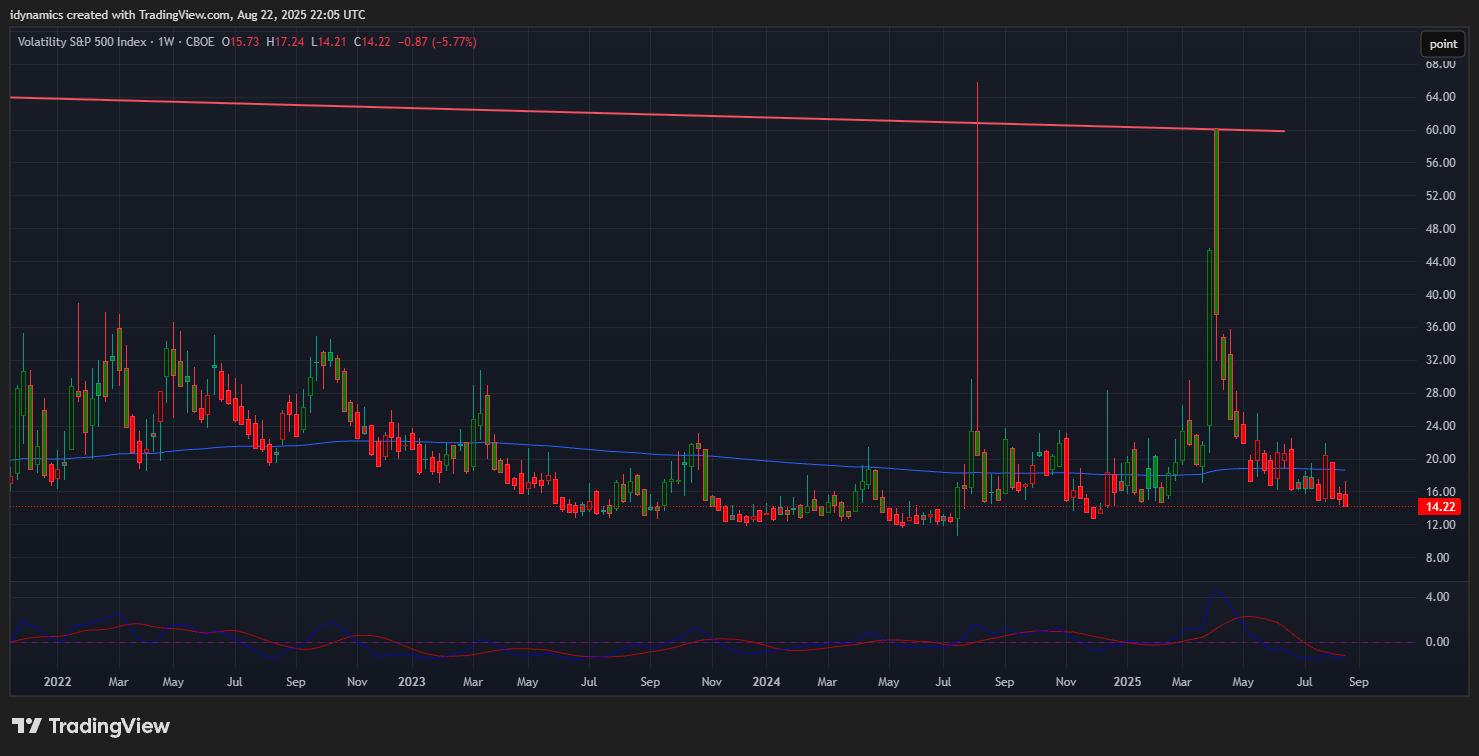
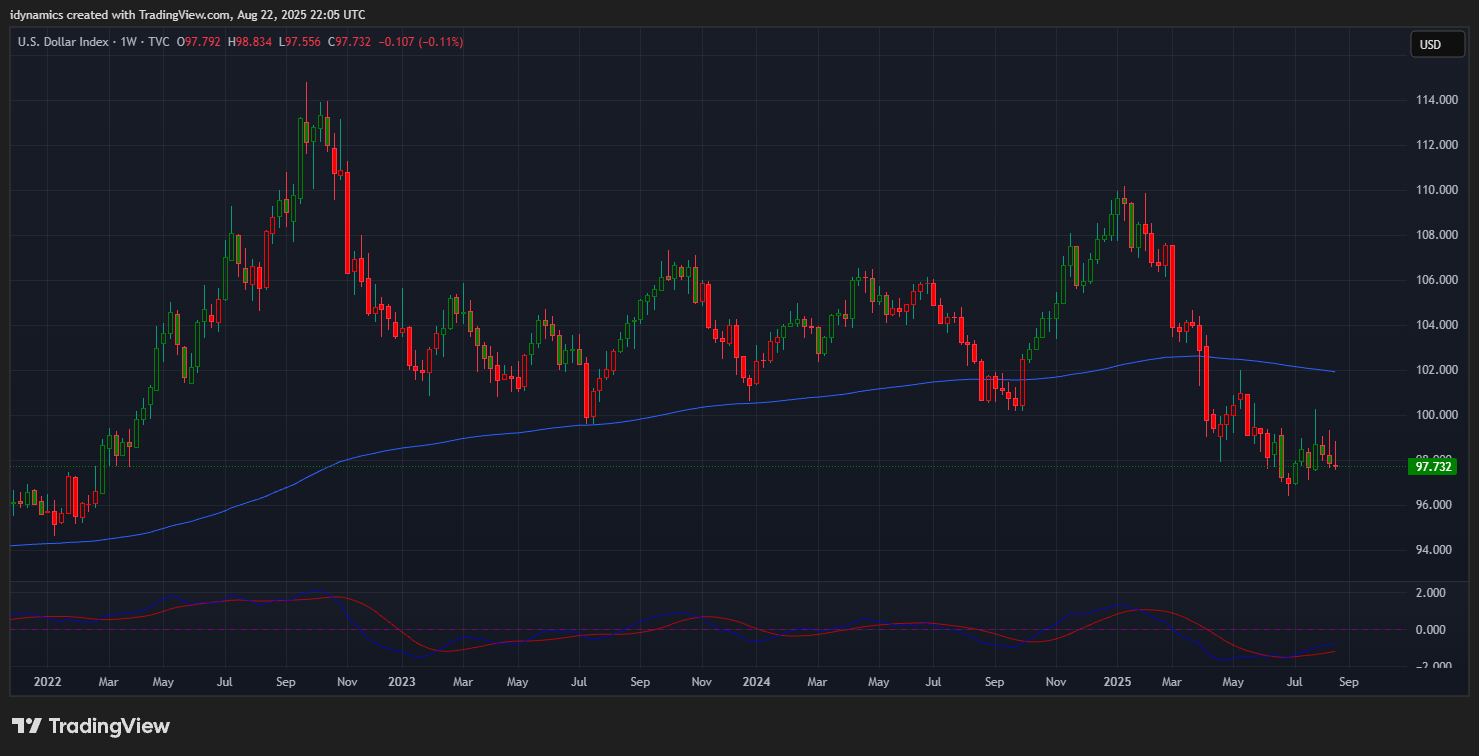
The VIX traded a new 2025 low and settled down -5.77% closing on the bottom of the range. The US Dollar closed lower after a failed midweek rally, closing the week down -0.11% on the bottom of the week’s range.
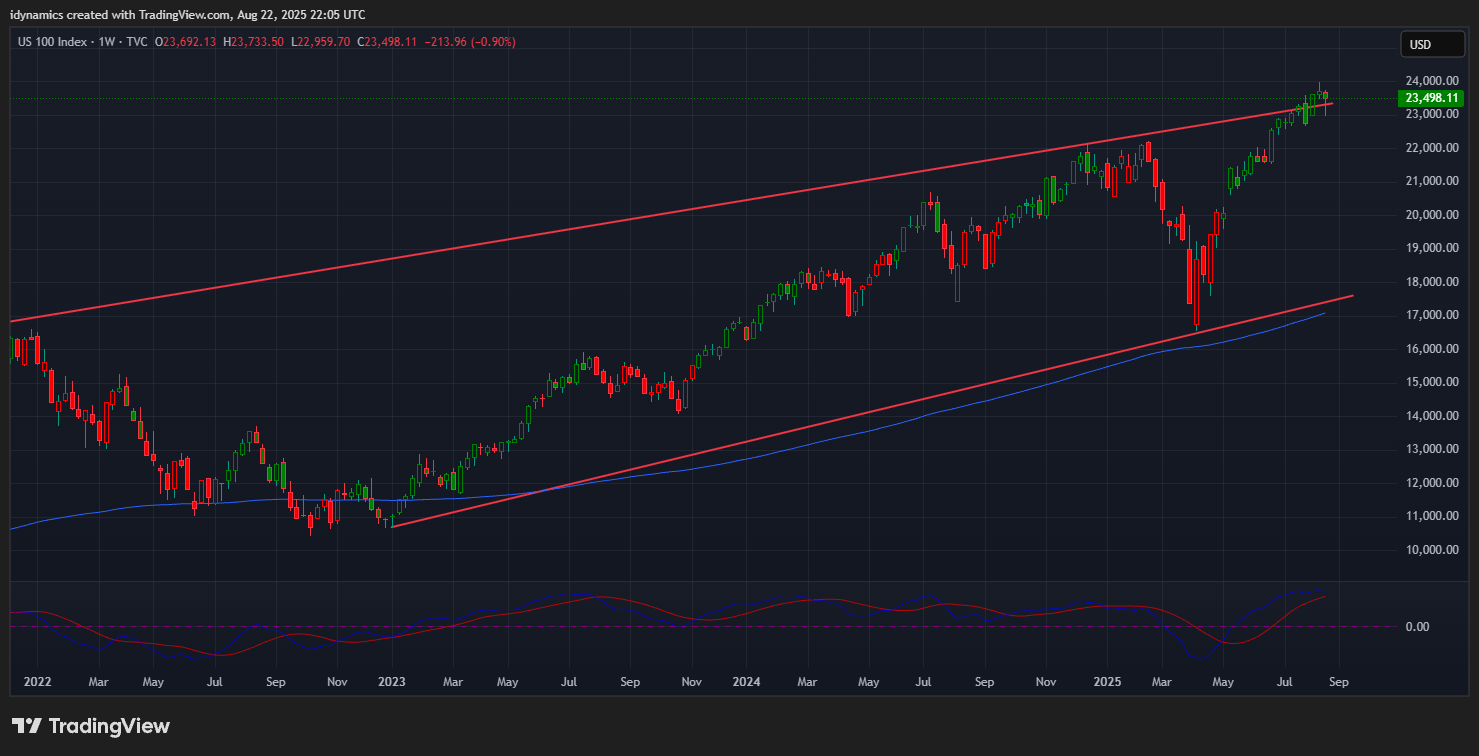
 Nasdaq 100 Weekly Candles
Daily Breadth 
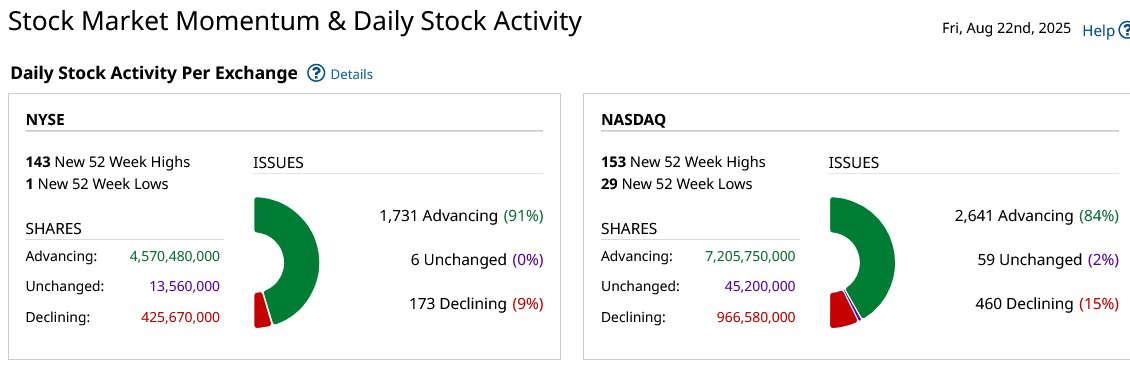
Breadth was sharply higher in Friday’s high volume rally and was flat for the week. Sentiment remains neutral.
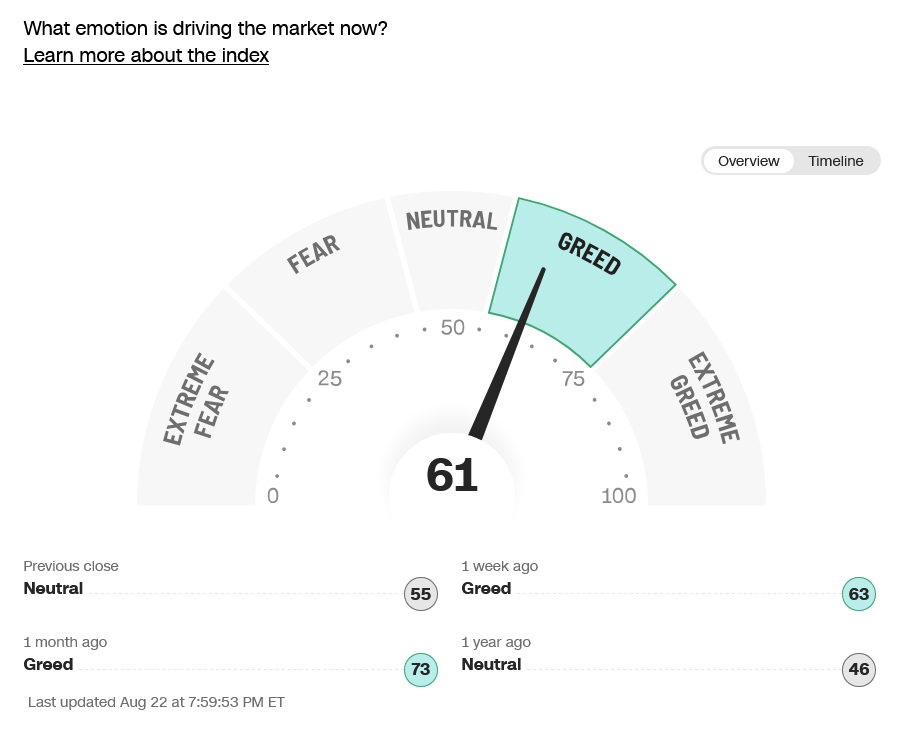
CNN Fear & Greed Index
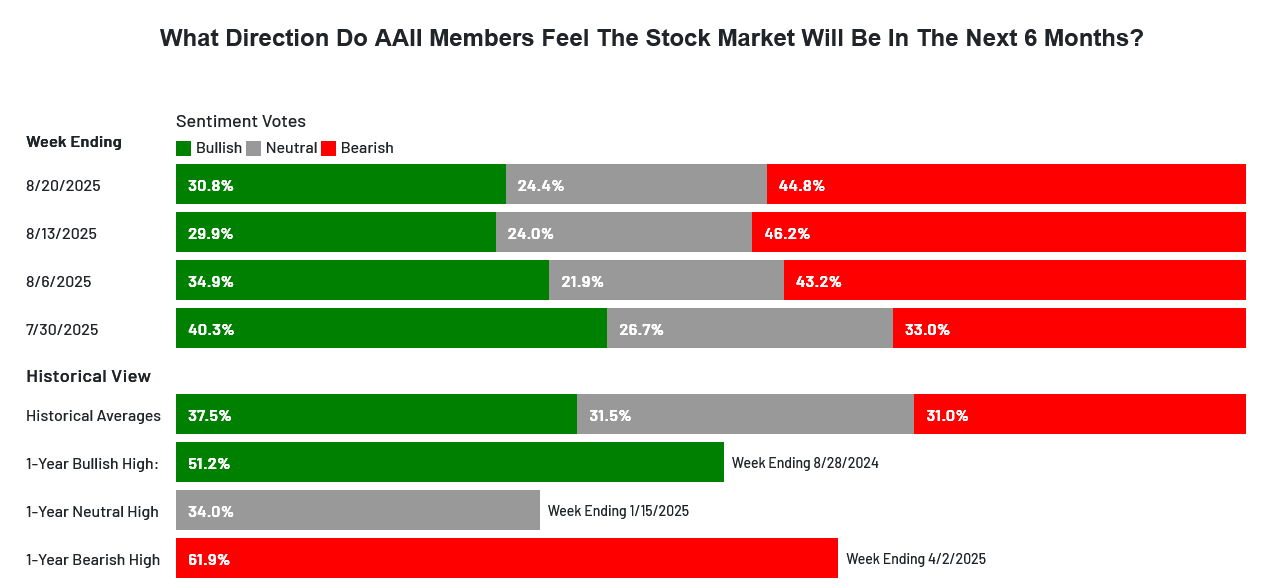
 AAII Investor Sentiment Survey
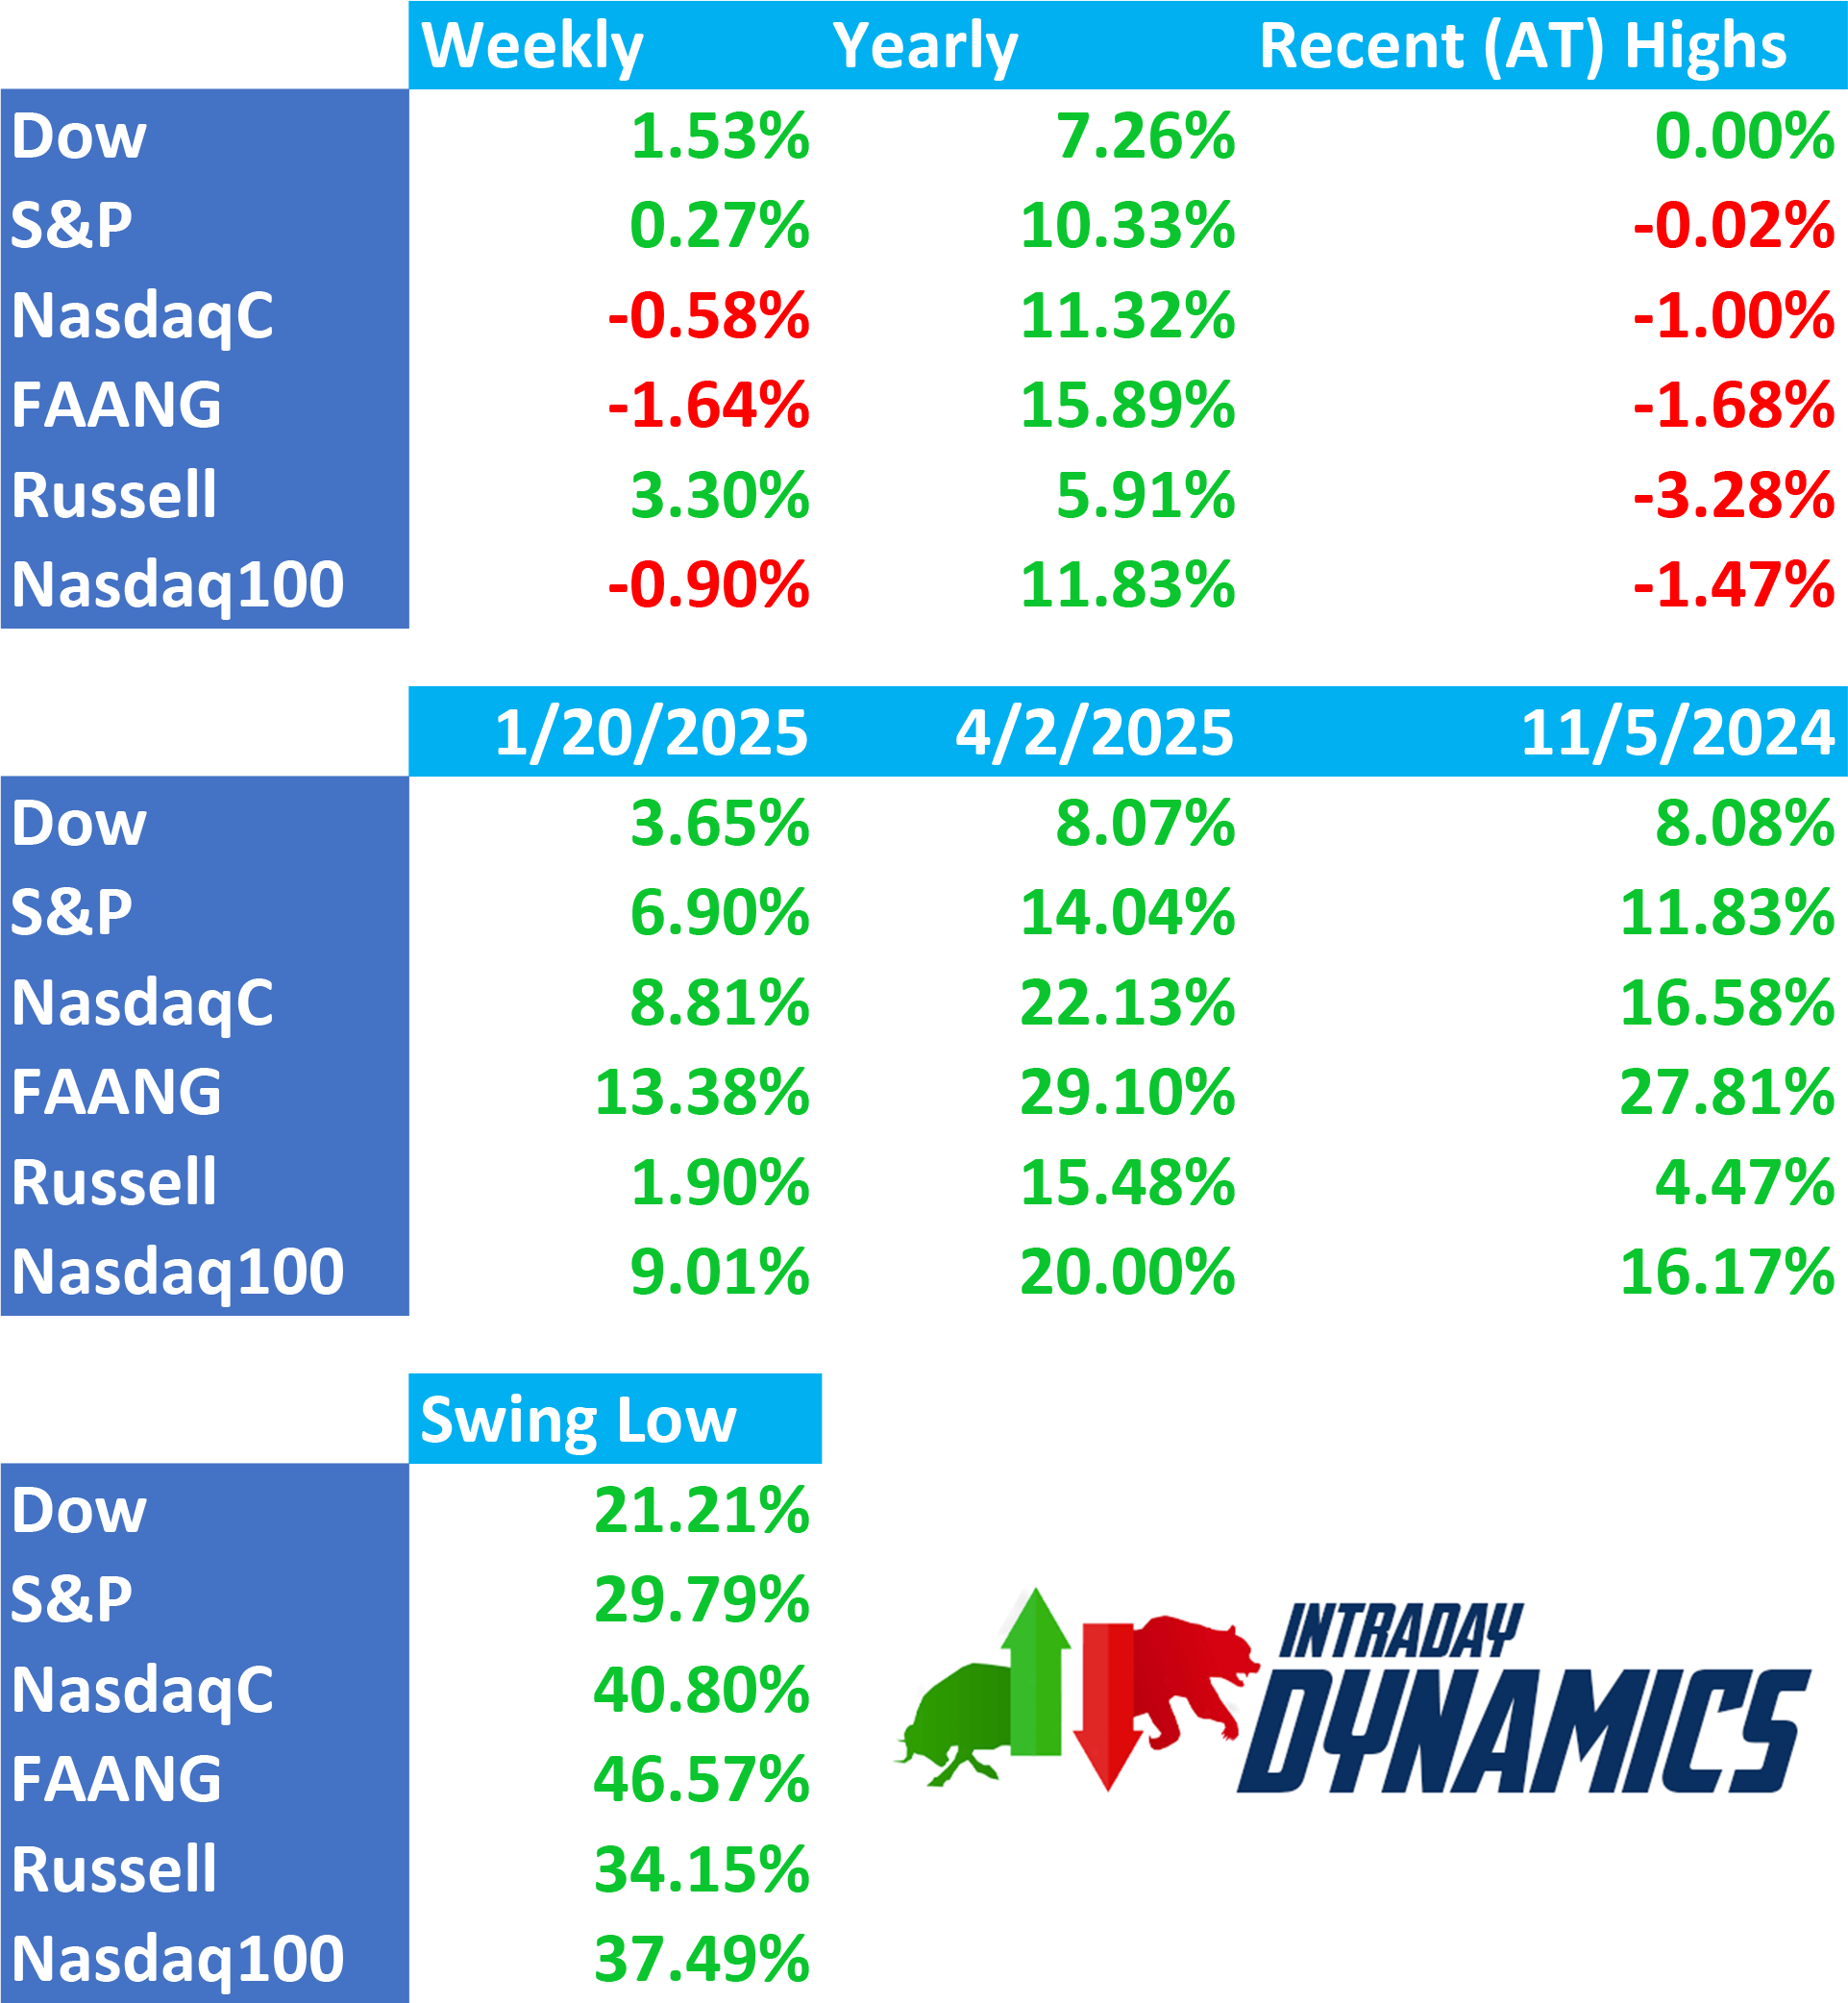
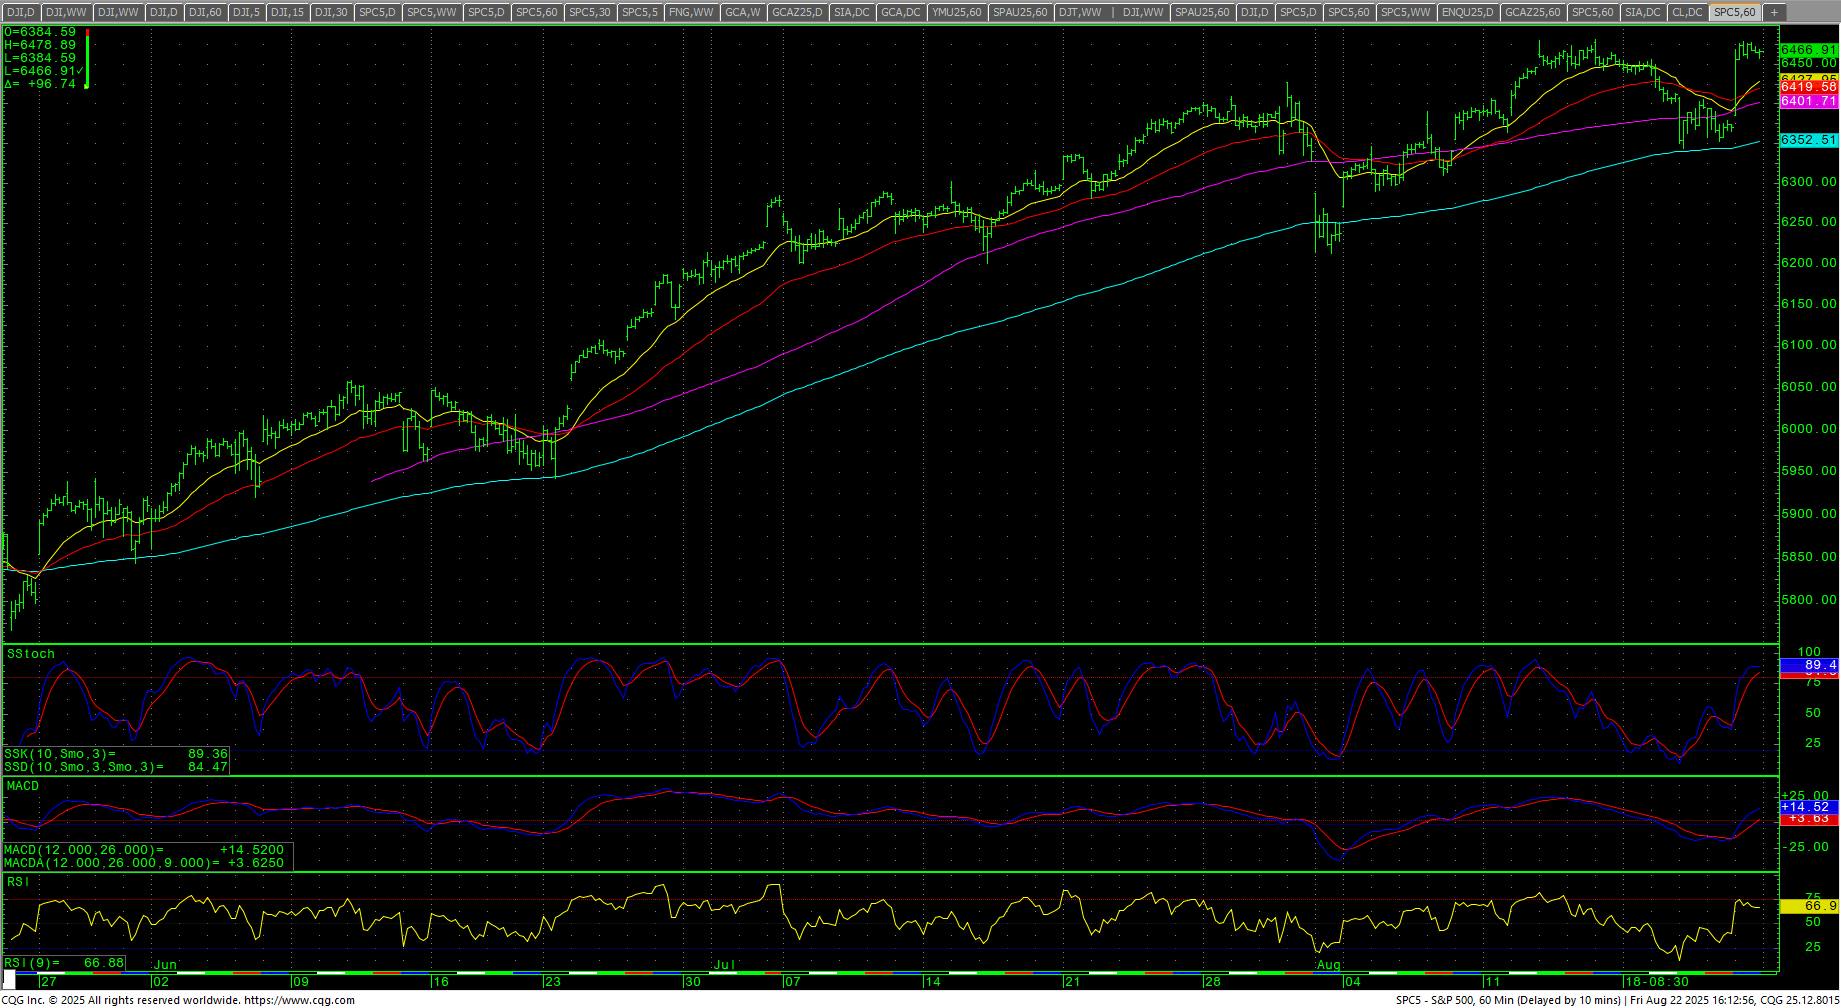
 The CNN Fear and Greed Index moved lower to 61 and reads greed. Breadth was flat on the week and reads neutral. Latest AAII Sentiment Survey: Pessimism Hesitates. The Dow A/D moved toward an ATH closing at 6958. The VIX traded a new 2025 low and settled down -5.77% closing on the bottom of the range. The Put/Call closed at 0.66 and reads greed. The 52-week, A/D moved to +2.03% and reads greed. The Dow closed the week up +1.53%, closing on the top end of the week’s the range at an ATH. The S&P settled up +0.27% setting a record high weekly close in the top of the range. The Nasdaq Composite was down -0.58% and the Nasdaq 100 was down -0.90%. The NYSE FANG traded lower all week but recovered Friday closing down -1.64% in the upper half of the range. The Russell was up +3.30% on the top of the range at an ATH. The 10-year notes reversed higher and closed on the top of the range. The yield on the 10YR moved down to 4.256%.
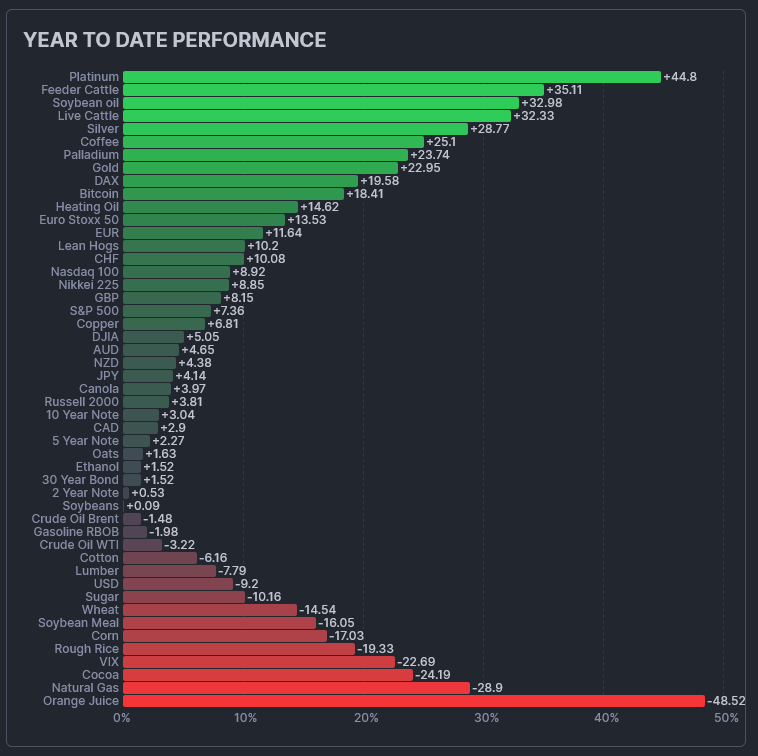 The CRB Index was up +1.21%. Crude oil traded a tight range and closed up a faction on top of the weekly range. Gold reversed higher and closed on the top of the range. The CoT for the S&P 500 saw very little change despite the high volume trade. The CFTC S&P 500 Non-Commercial Net Positions ended at -171.5K.
Timing Points
Critical timing hits Monday/Tuesday the 25th/26th. Friday is the PCE. See below.
- 08/25-26 *** X
- 09/05 **
- 09/12 *** X critical weekend through
- 09/16-17 *** X critical week to the 19th
- 09/23 ***
- 10/01 ** key to bonds/dollar
Dow Jones Industrial Average
Dow Jones Industrial Average Weekly H-L-C
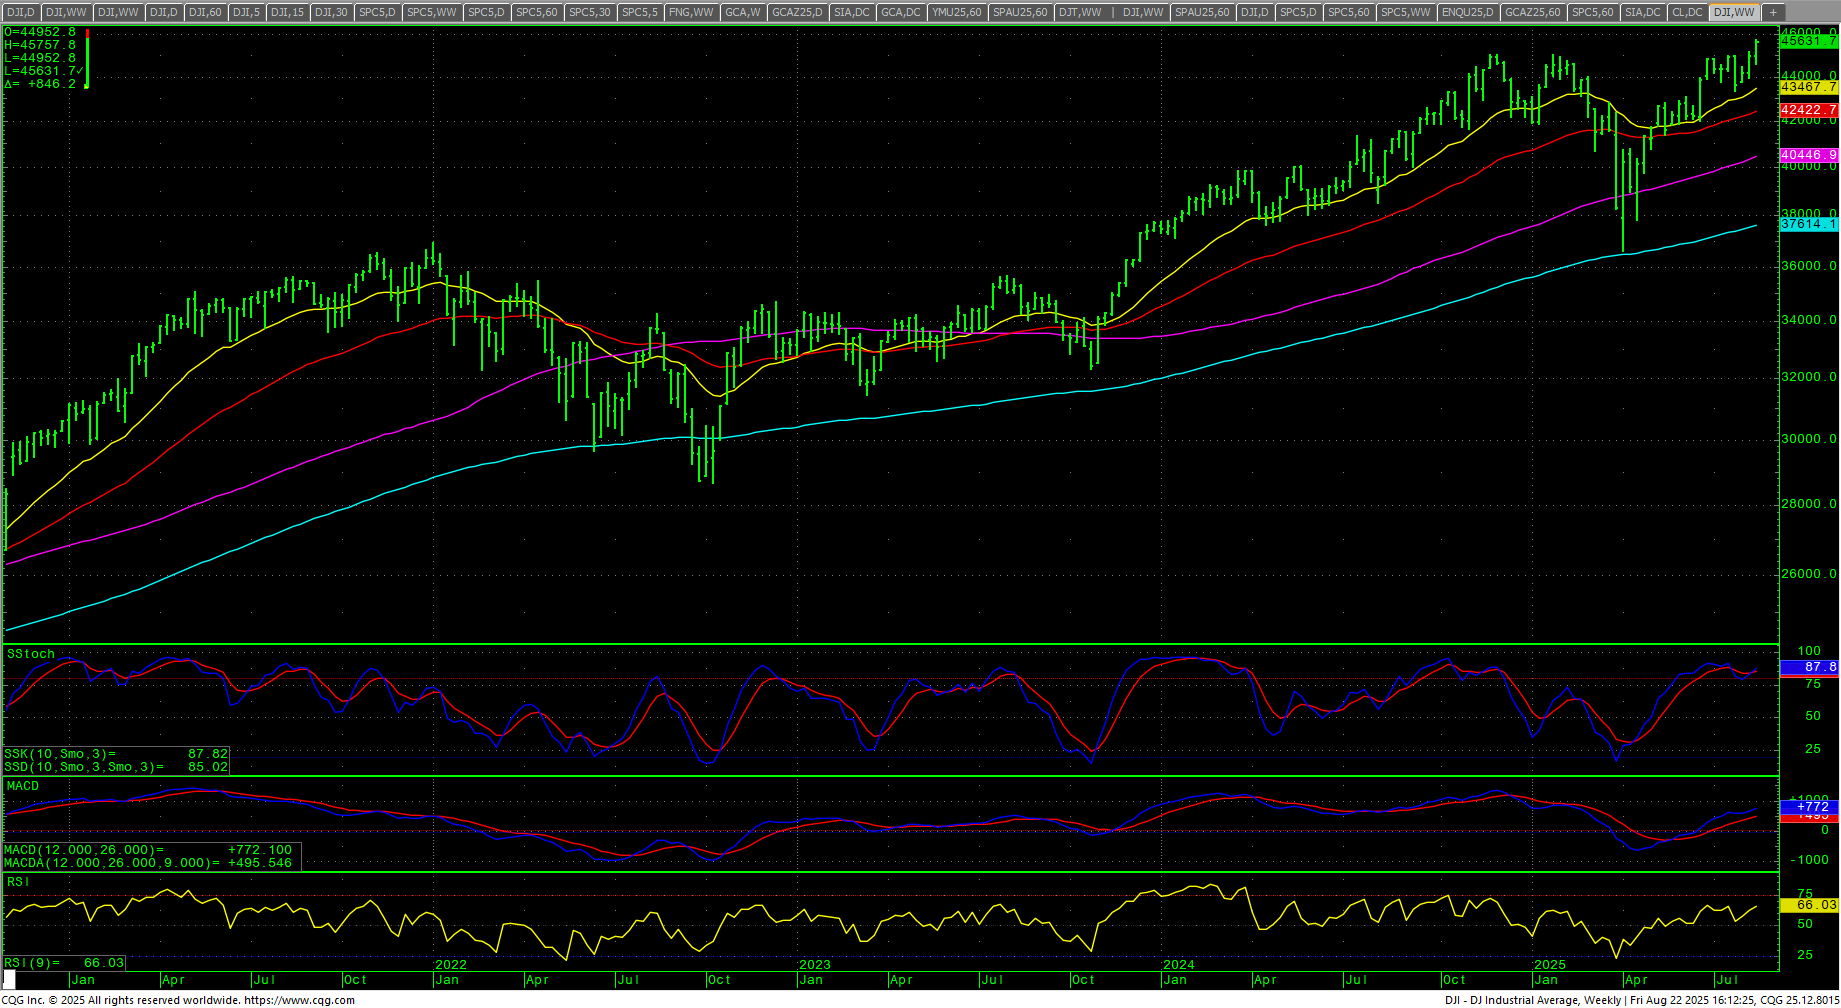 The Dow closed the week up +1.53% on the top end of the week’s range at new ATHs as prices finally took out the double-top pattern in a decisive and powerful thrust higher. The daily stochastics and MACD have turned up with preliminary bearish divergences. The daily RSI is 73.4. The 200-day MA starts the week at 42702.60 and is at record highs.
Dow Jones Industrial Average Daily Candles
 The breakout opens a myriad of extreme upside targets for the Dow. Resistance is 45758/45774. Rallies through 45774 can test 45846 and 45918 with counts to 45990 and 46062. Closes over 46062 setup 46134 and 46206 to 46278. Resistance is critical at 46368 and closes above that level would offer fuel toward longer-term monthly targets in the 47400 level with targets of 46568 and 46954.
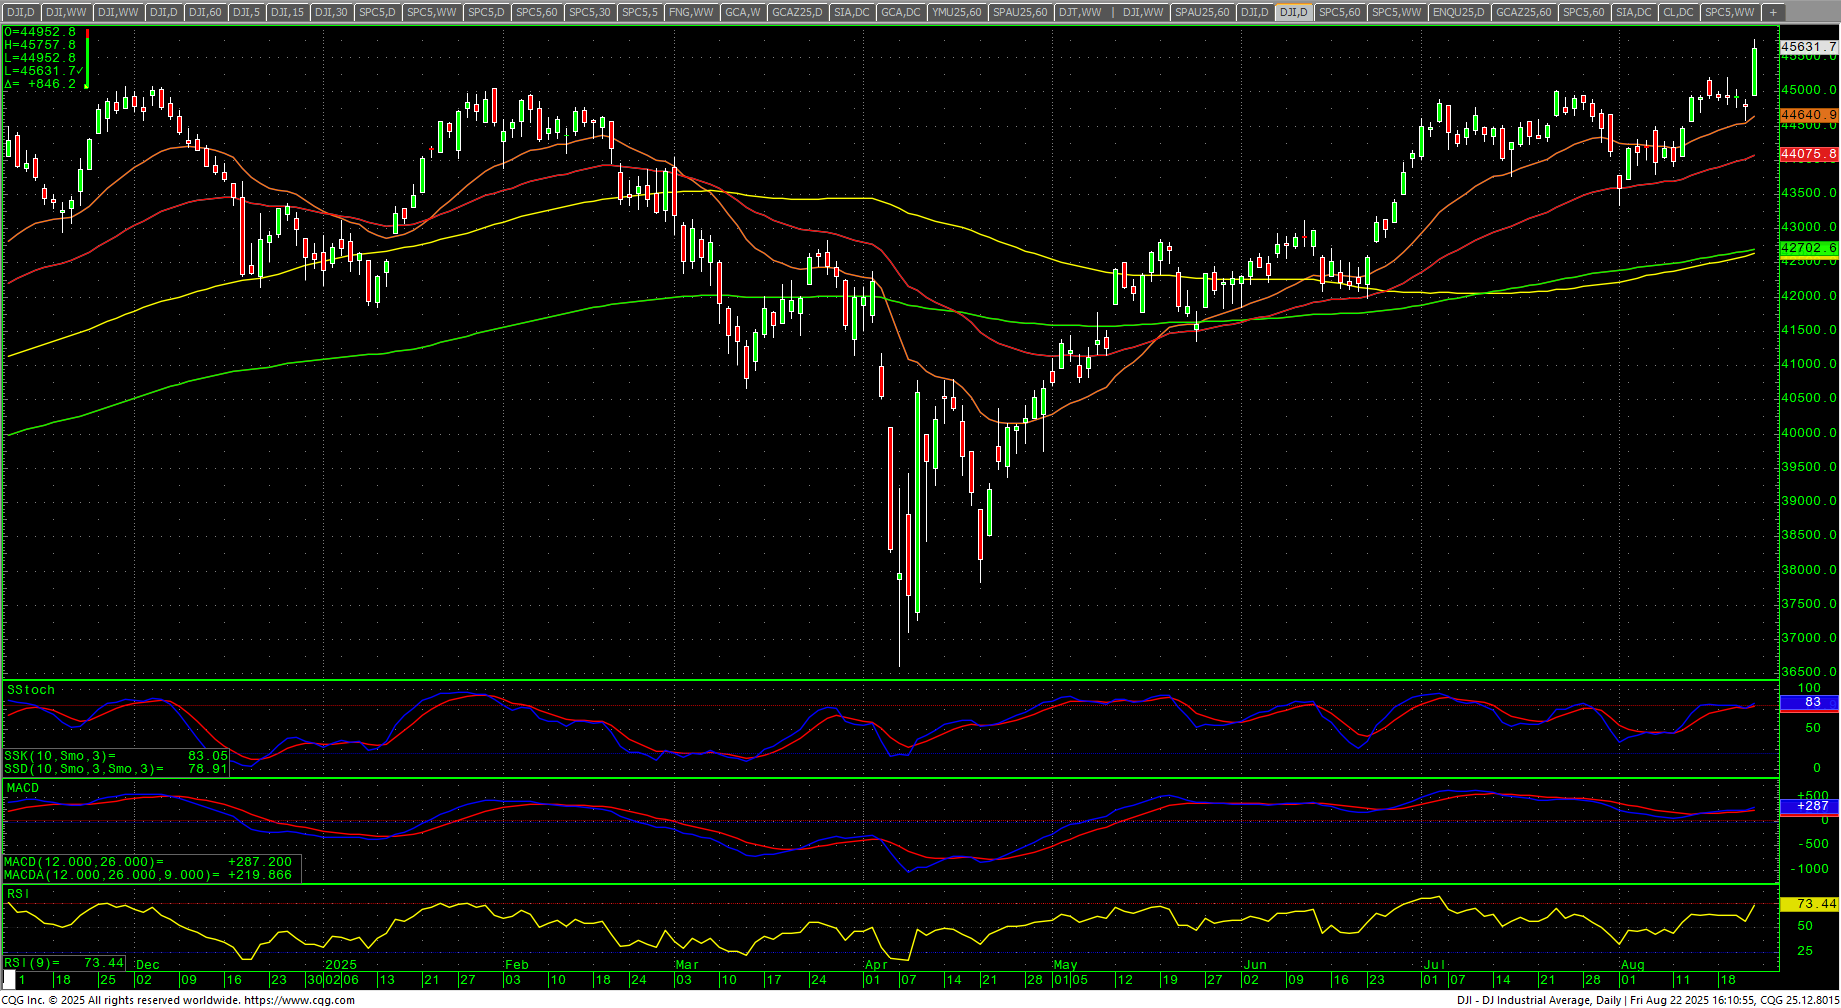
Dow Jones Industrial Average Hourly H-L-C
 The hourly is overbought on Friday’s close. Support is 45479 and 45307. A break under 45307 sets up 45168 with counts to 45029/45025. Under 45025 should test 44834. Closes below 44834 count to 44579/44549 with full potential to 44315/44260. Daily closes under 45260 are near-term bearish and open counts to 43869 with potential to critical support at 43423/43420. Closes under 43420 should minimally test 42925/42872 with counts to 42000/41921.
| Resistance | Support |
|
|
S&P 500 Cash Index: SPX
S&P 500 Index Weekly H-L-C
 The S&P staged a huge rally Friday, carrying prices back to the all-time highs and settling just off the record daily close of the week prior and a new ATH weekly close for the index. The daily stochastics and MACD are turning up with divergences. The weekly has hooked higher from overbought levels. The daily RSI is 63.10. The hourly is overbought on Friday’s close. The 200-day MA is 5929.39 and at record highs. The SPY closed at an ATH. The action leaves most of the technical levels the same.
SPY Weekly Candles
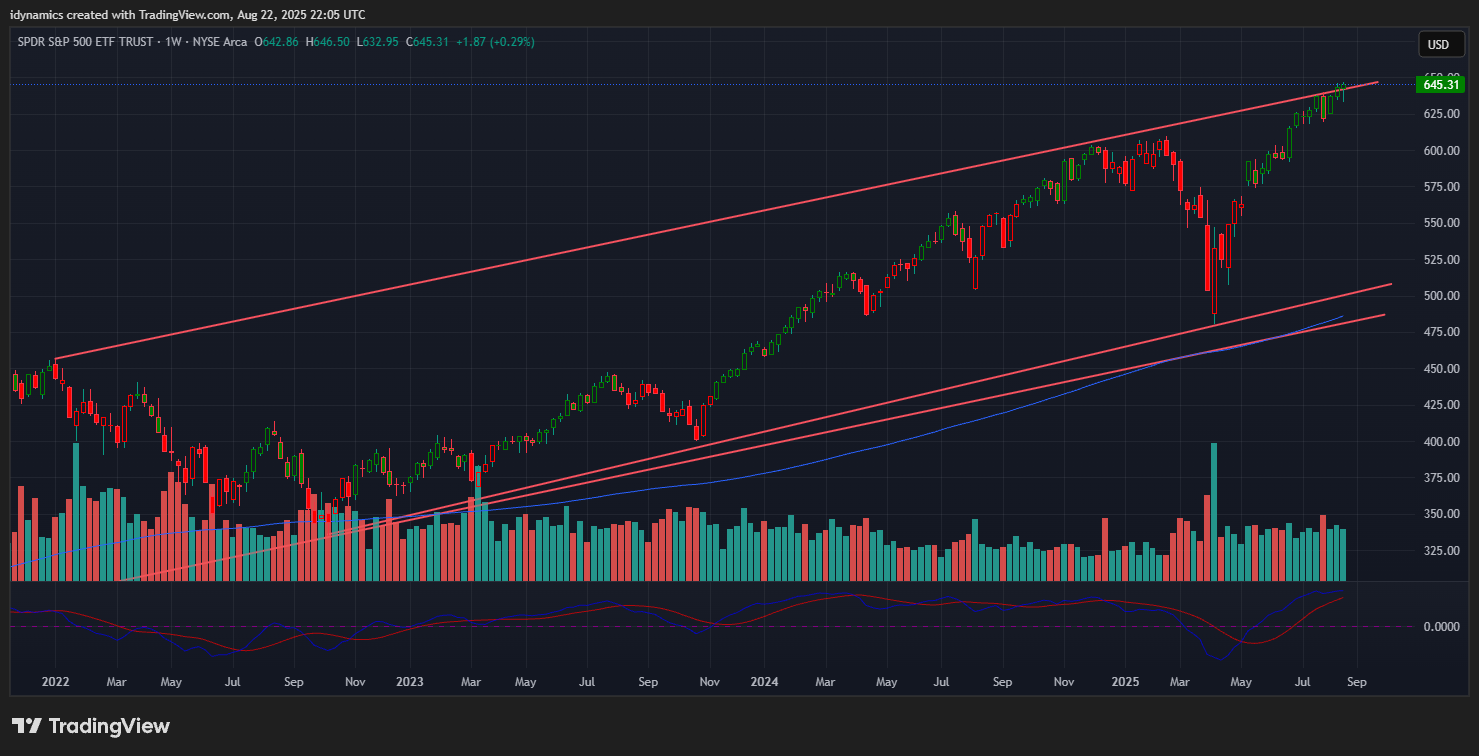 Resistance is 6481/6482 with resistance at 6494. Closes over 6482 will open counts to 6584 and resistance at 6602. A breakout over 6602 sets up 6638 and 6692. A breakout with closes over 6692 counts to 6764 and 6800. Closes over 6800 can carry to 6872 and 6908. Closes over 6908 have counts to 6944 and 6980 through 7016.
S&P 500 Index Hourly H-L-C
 Support is 6447, 6427, 6411 and 6395/6393. Under 6393 sets up 6347 with counts to 6315/6312. A breakdown under 6312 should minimally test 6279/6276 with counts to the hourly double bottom at 6212/6201 with potential to 6092. Closes under 6092 setup potential to 5852 through 5788. A breakdown with closes under 5788 can carry to 5658 with full counts to critical near-term support at 5463/5460. Daily closes under 5460 are bearish to 5246/5223. Closes under 5223 open counts to 4995 with full potential to 4835.
| Resistance | Support |
|
|
Charts courtesy of CQG, Inc., CNN, Koyfin, Trading View and AAII