
TECHNICAL ANALYSIS (by Intraday Dynamics)
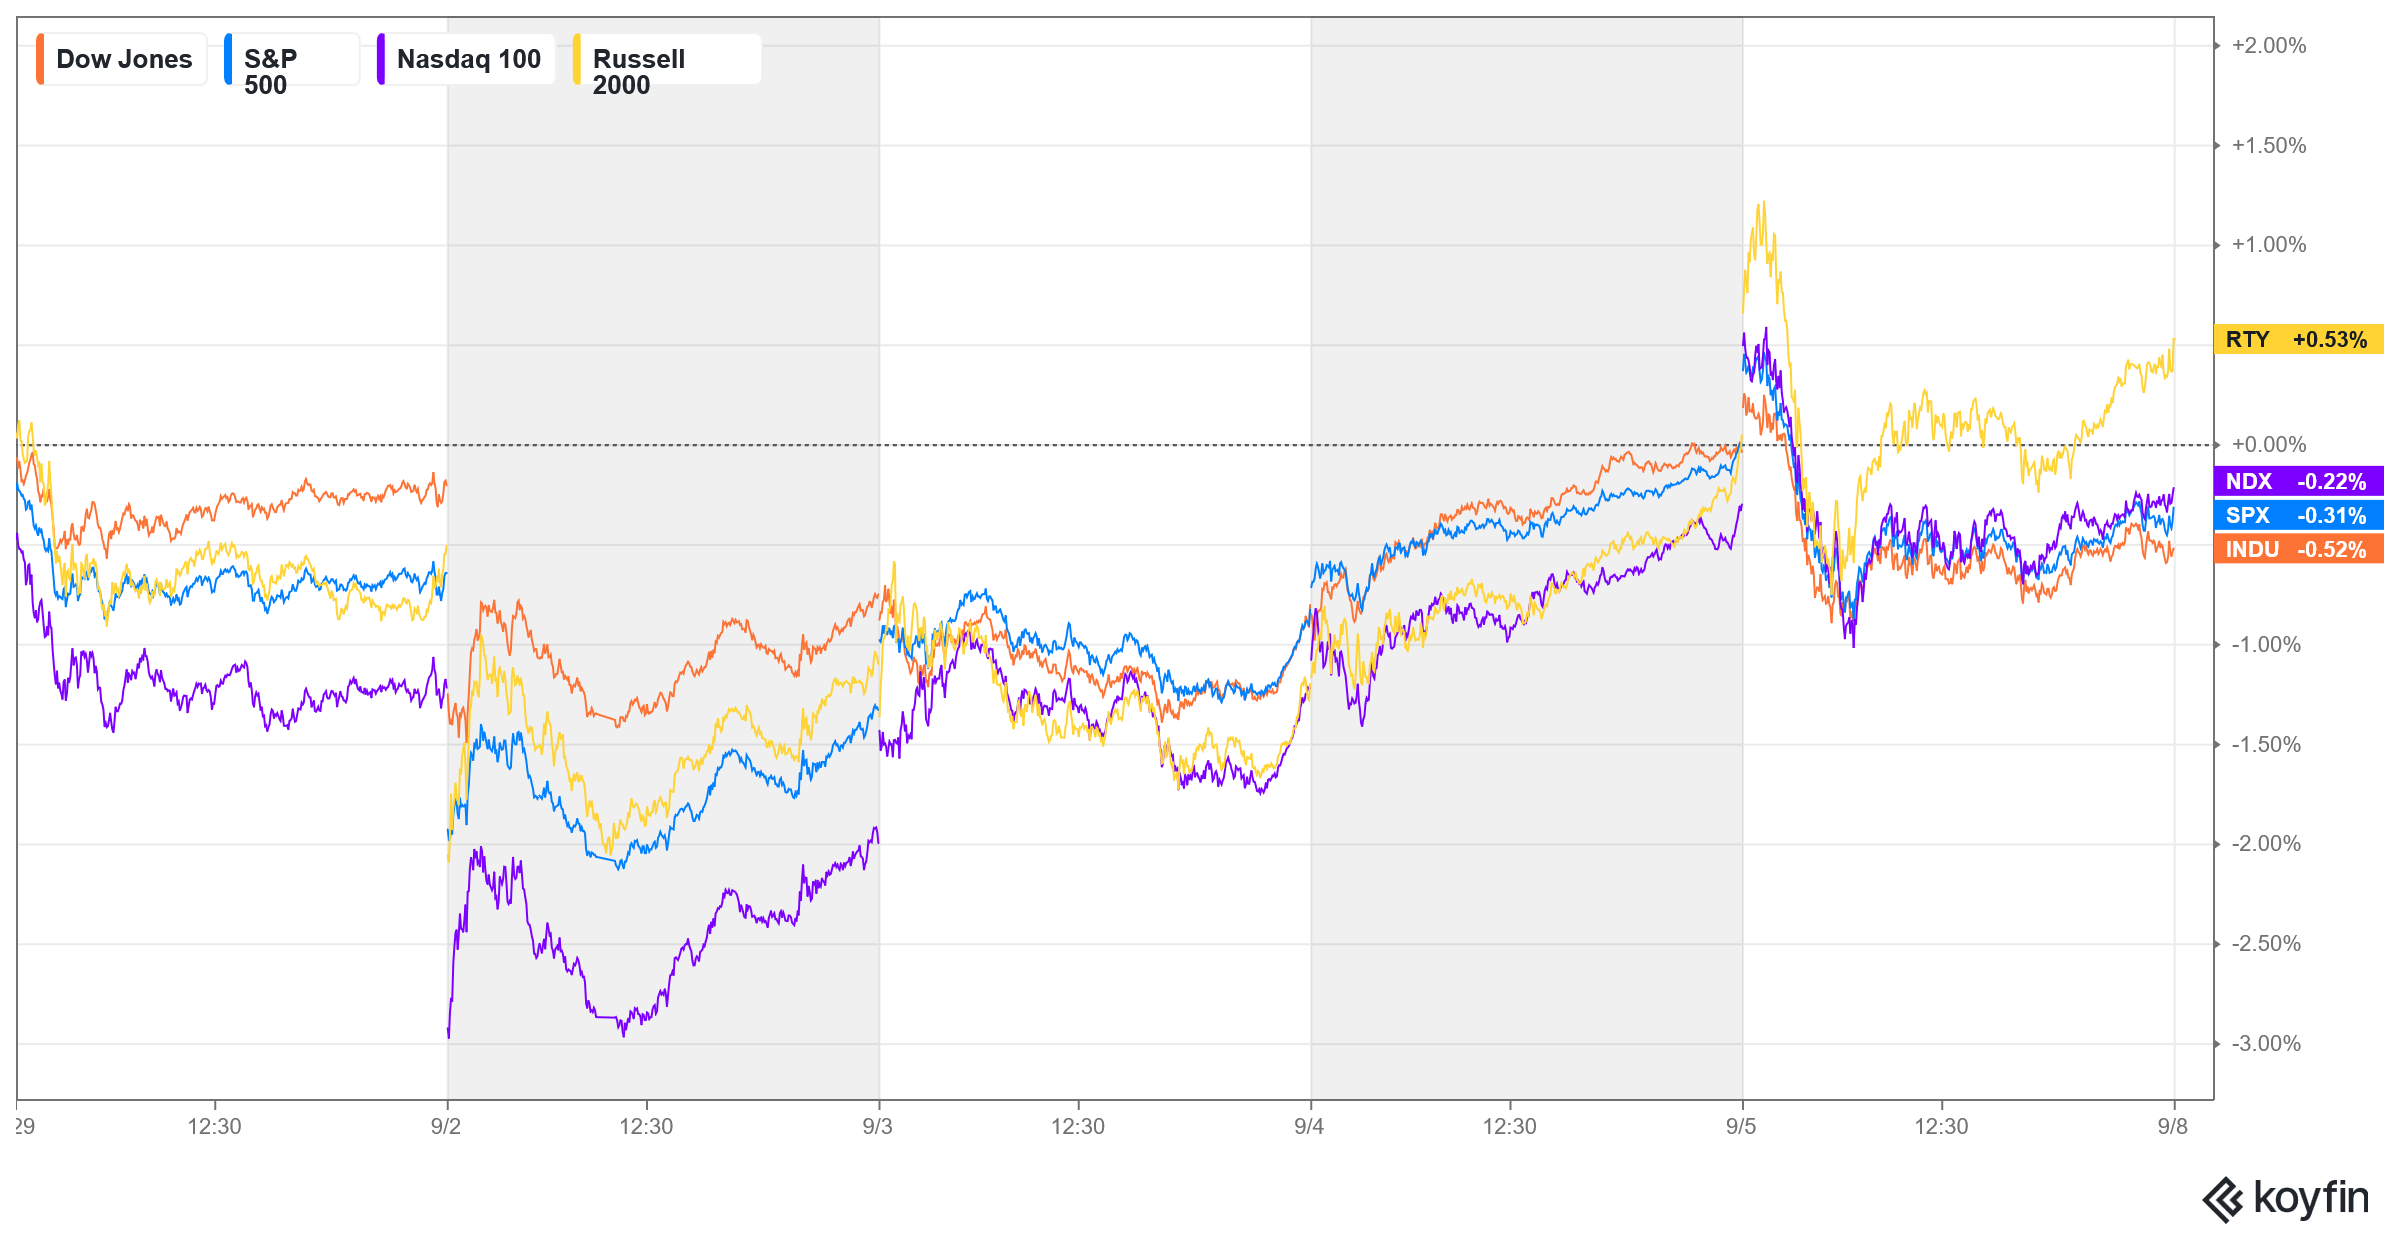
Major Indices Week of September 5, 2025
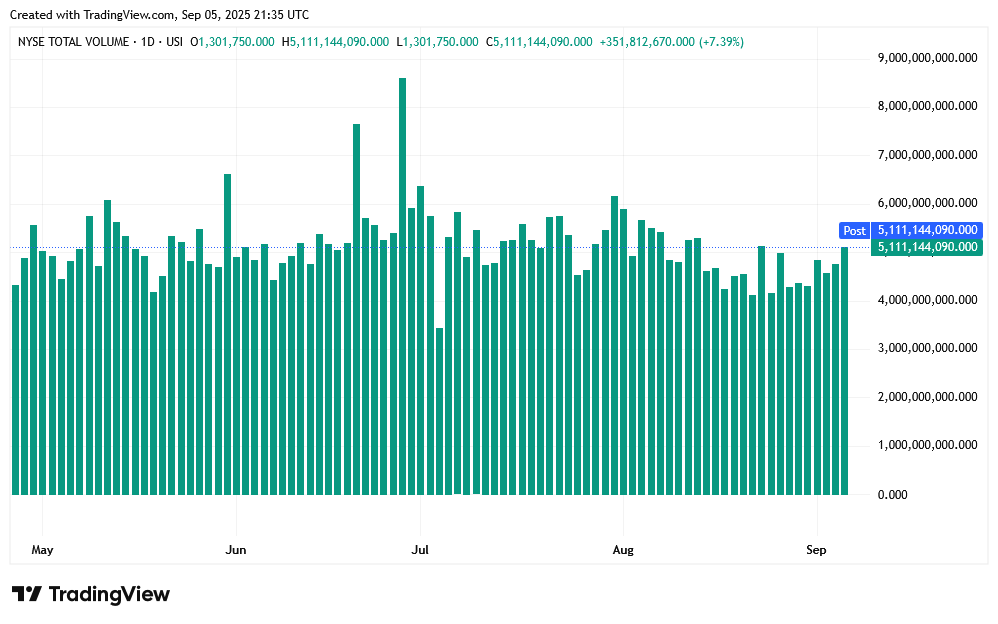
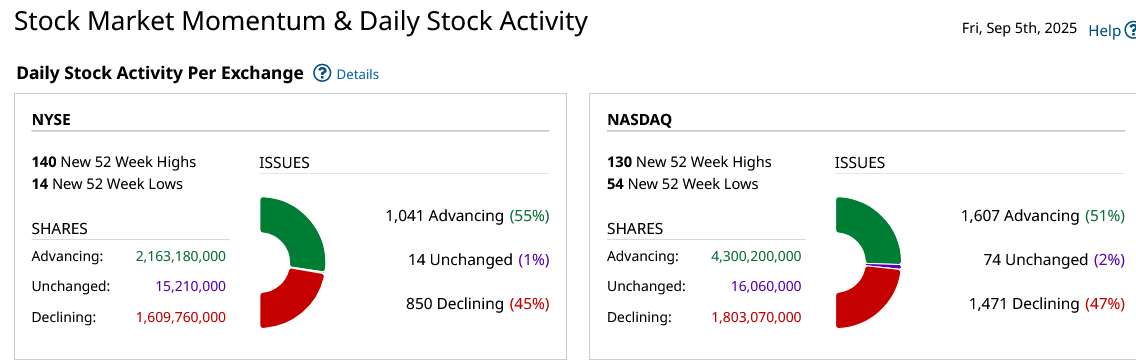
 NYSE Volume
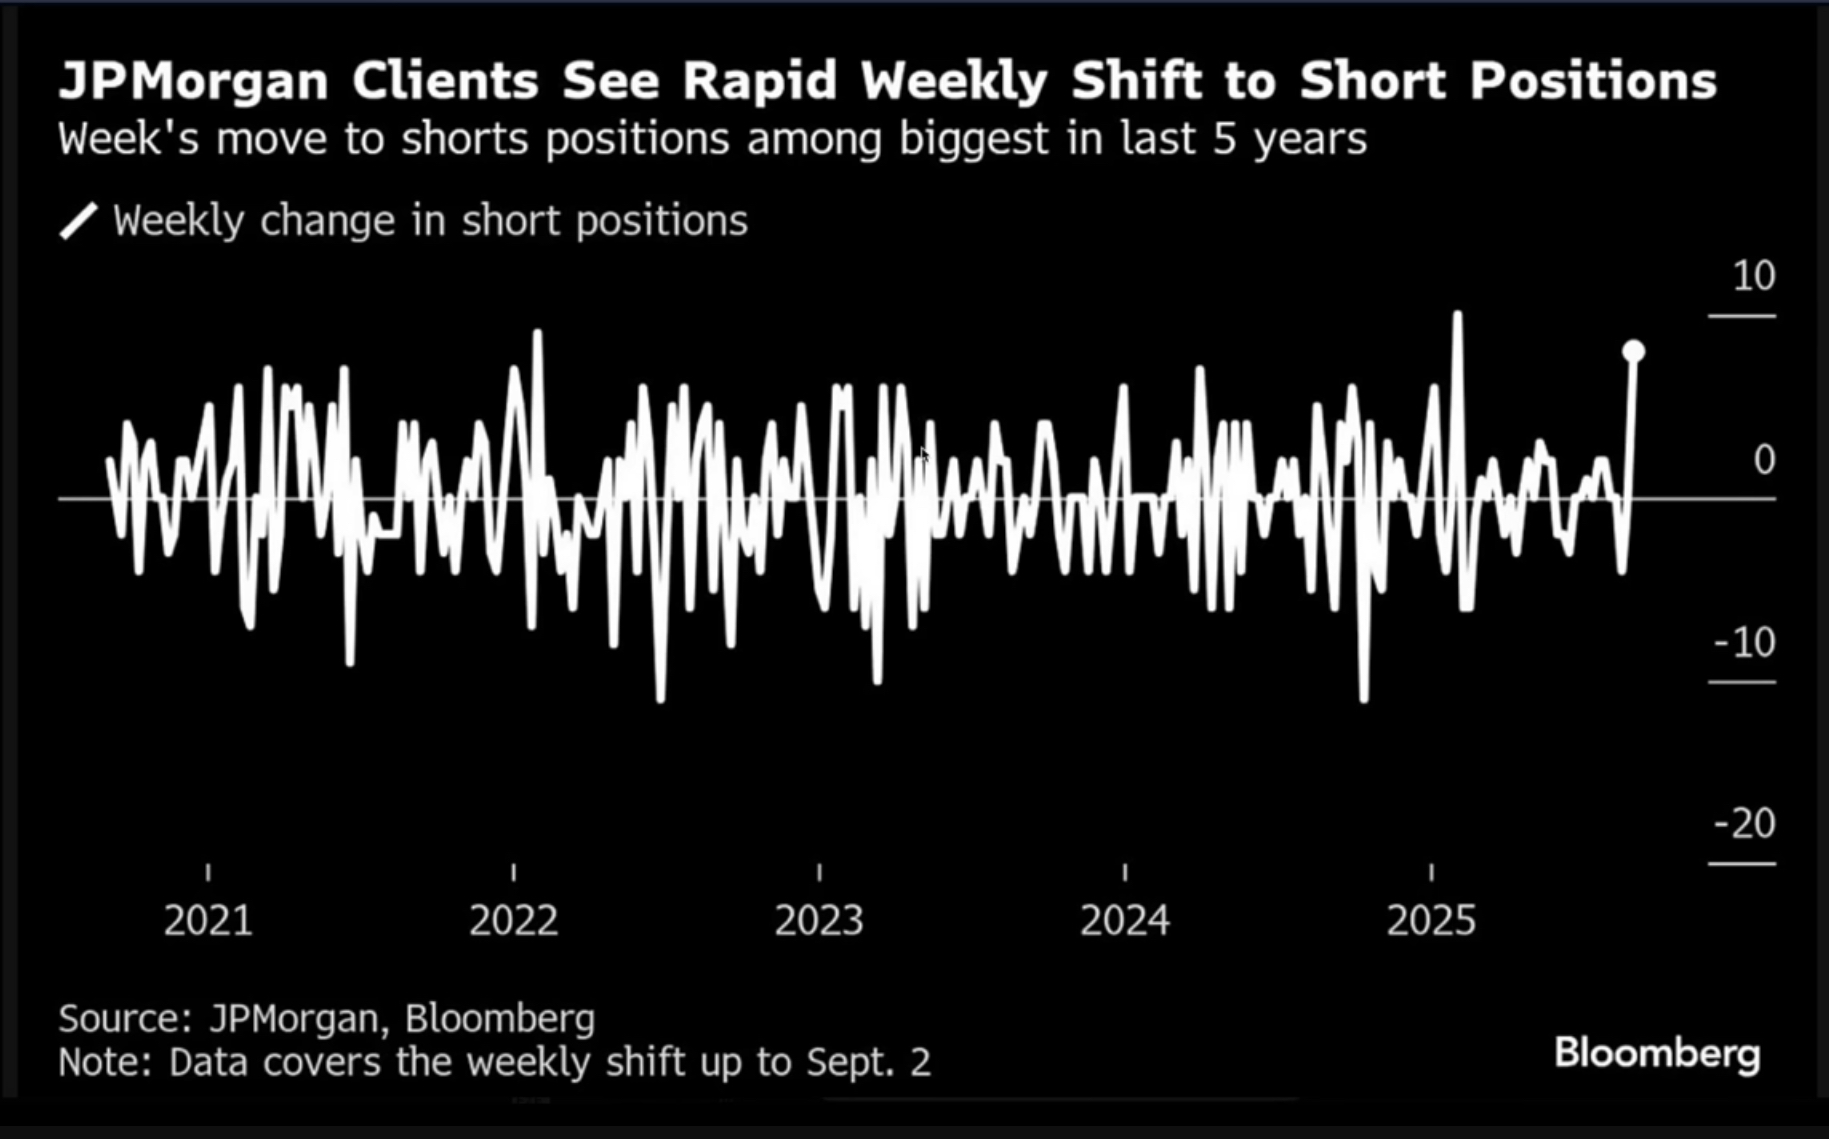
 Too Many Bears?
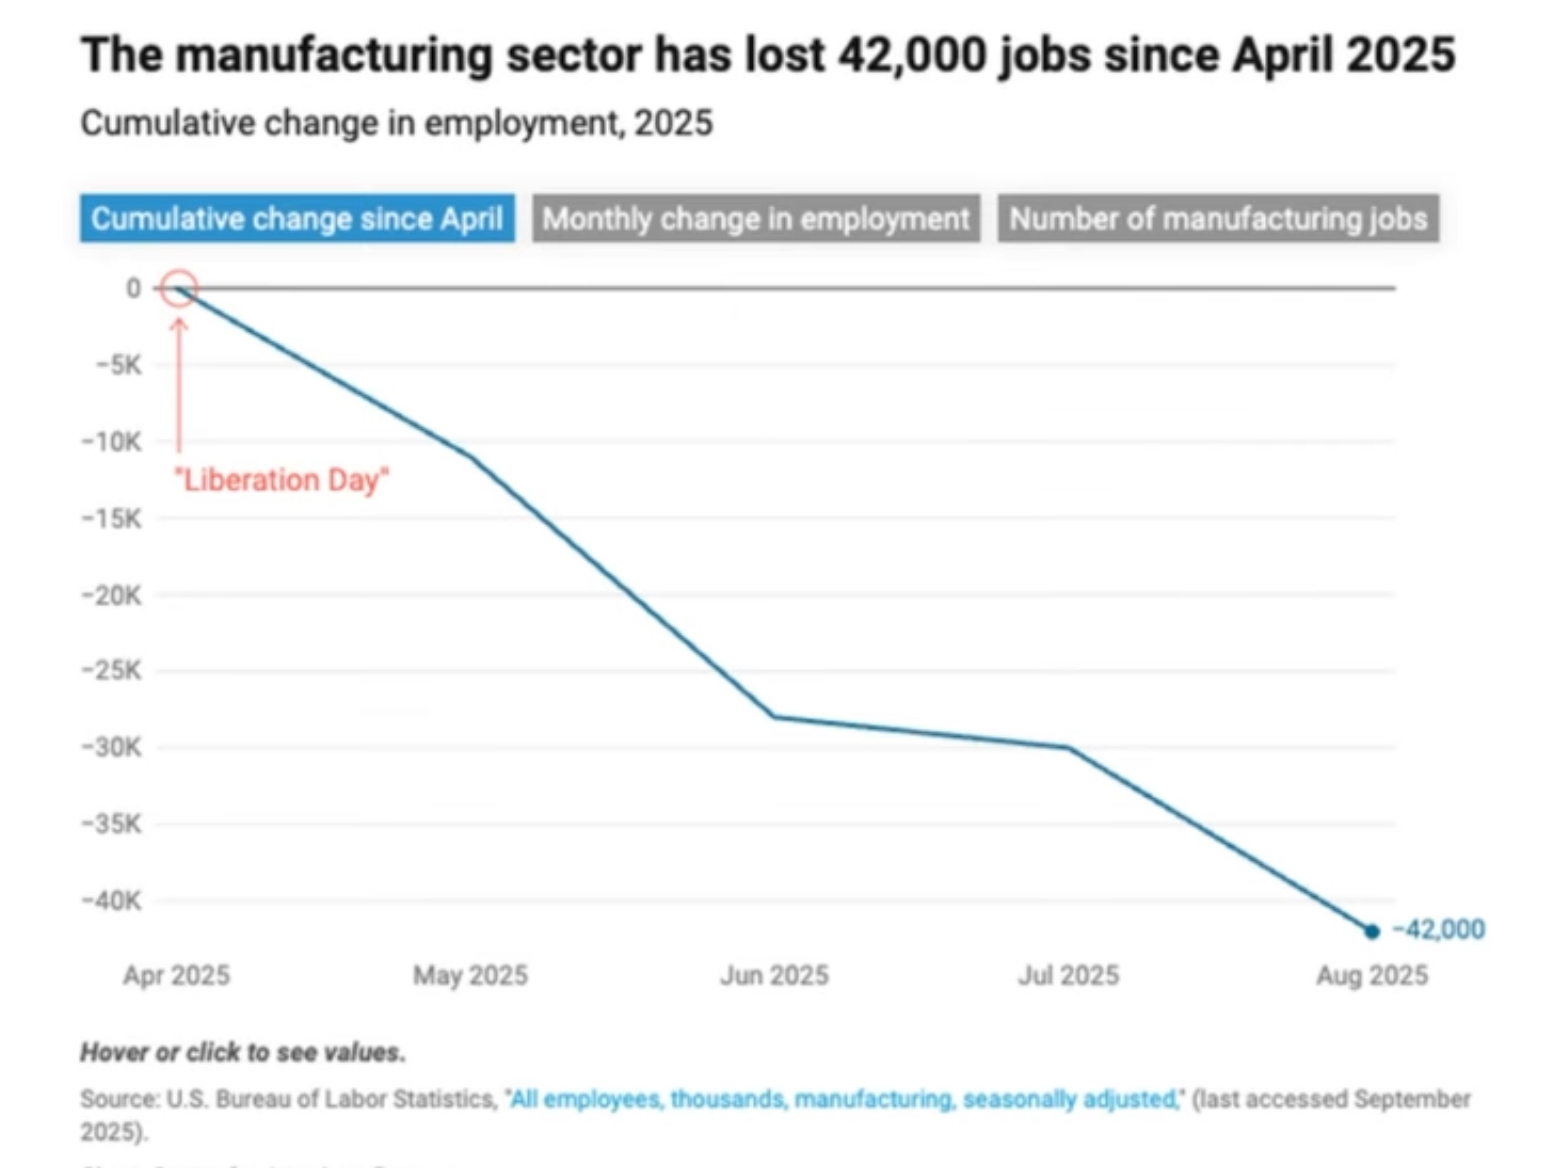
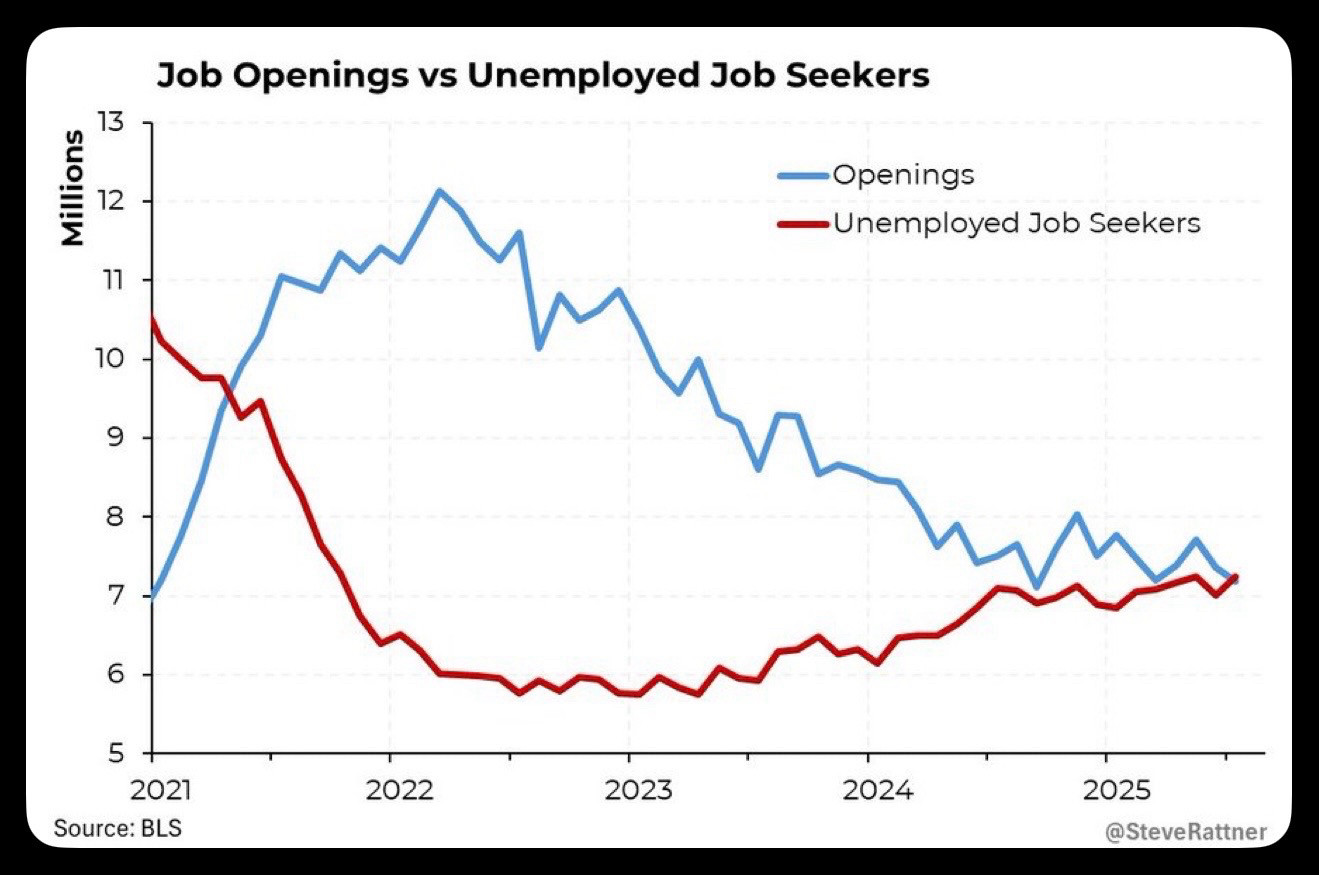
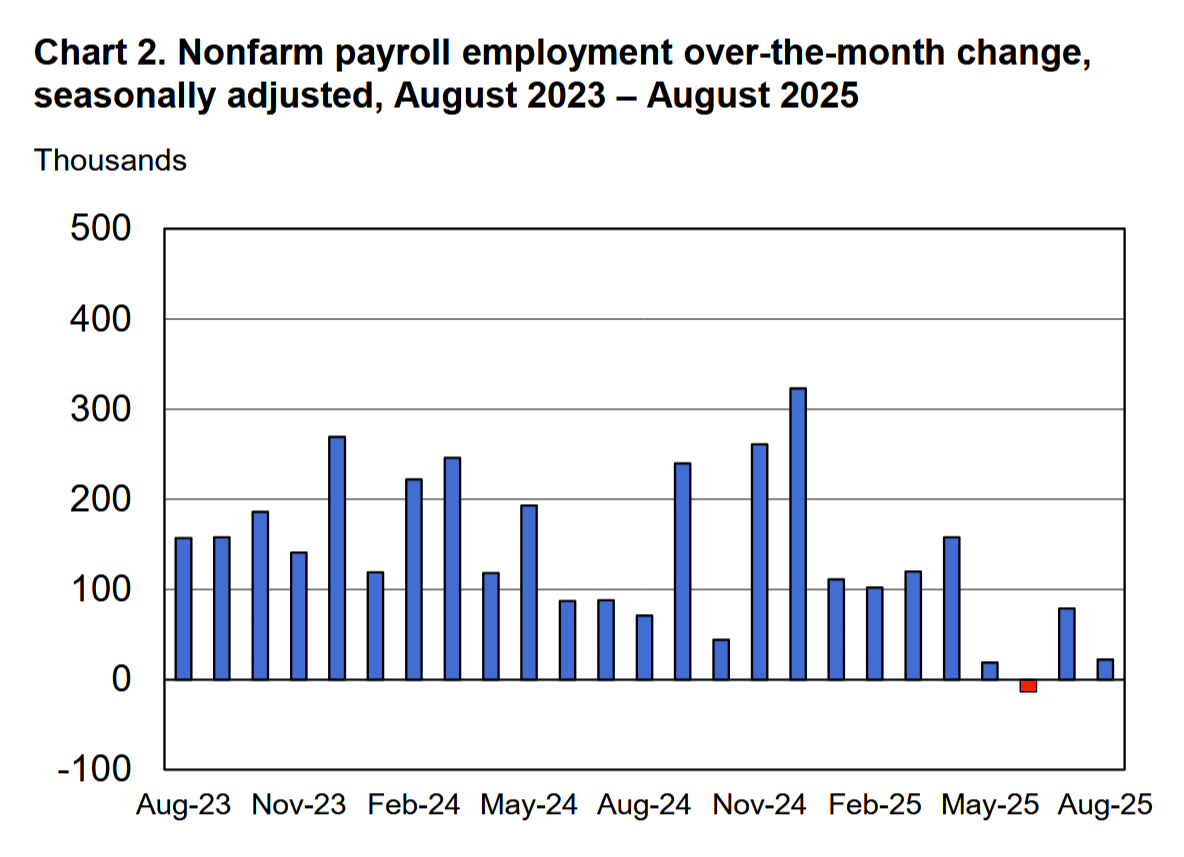
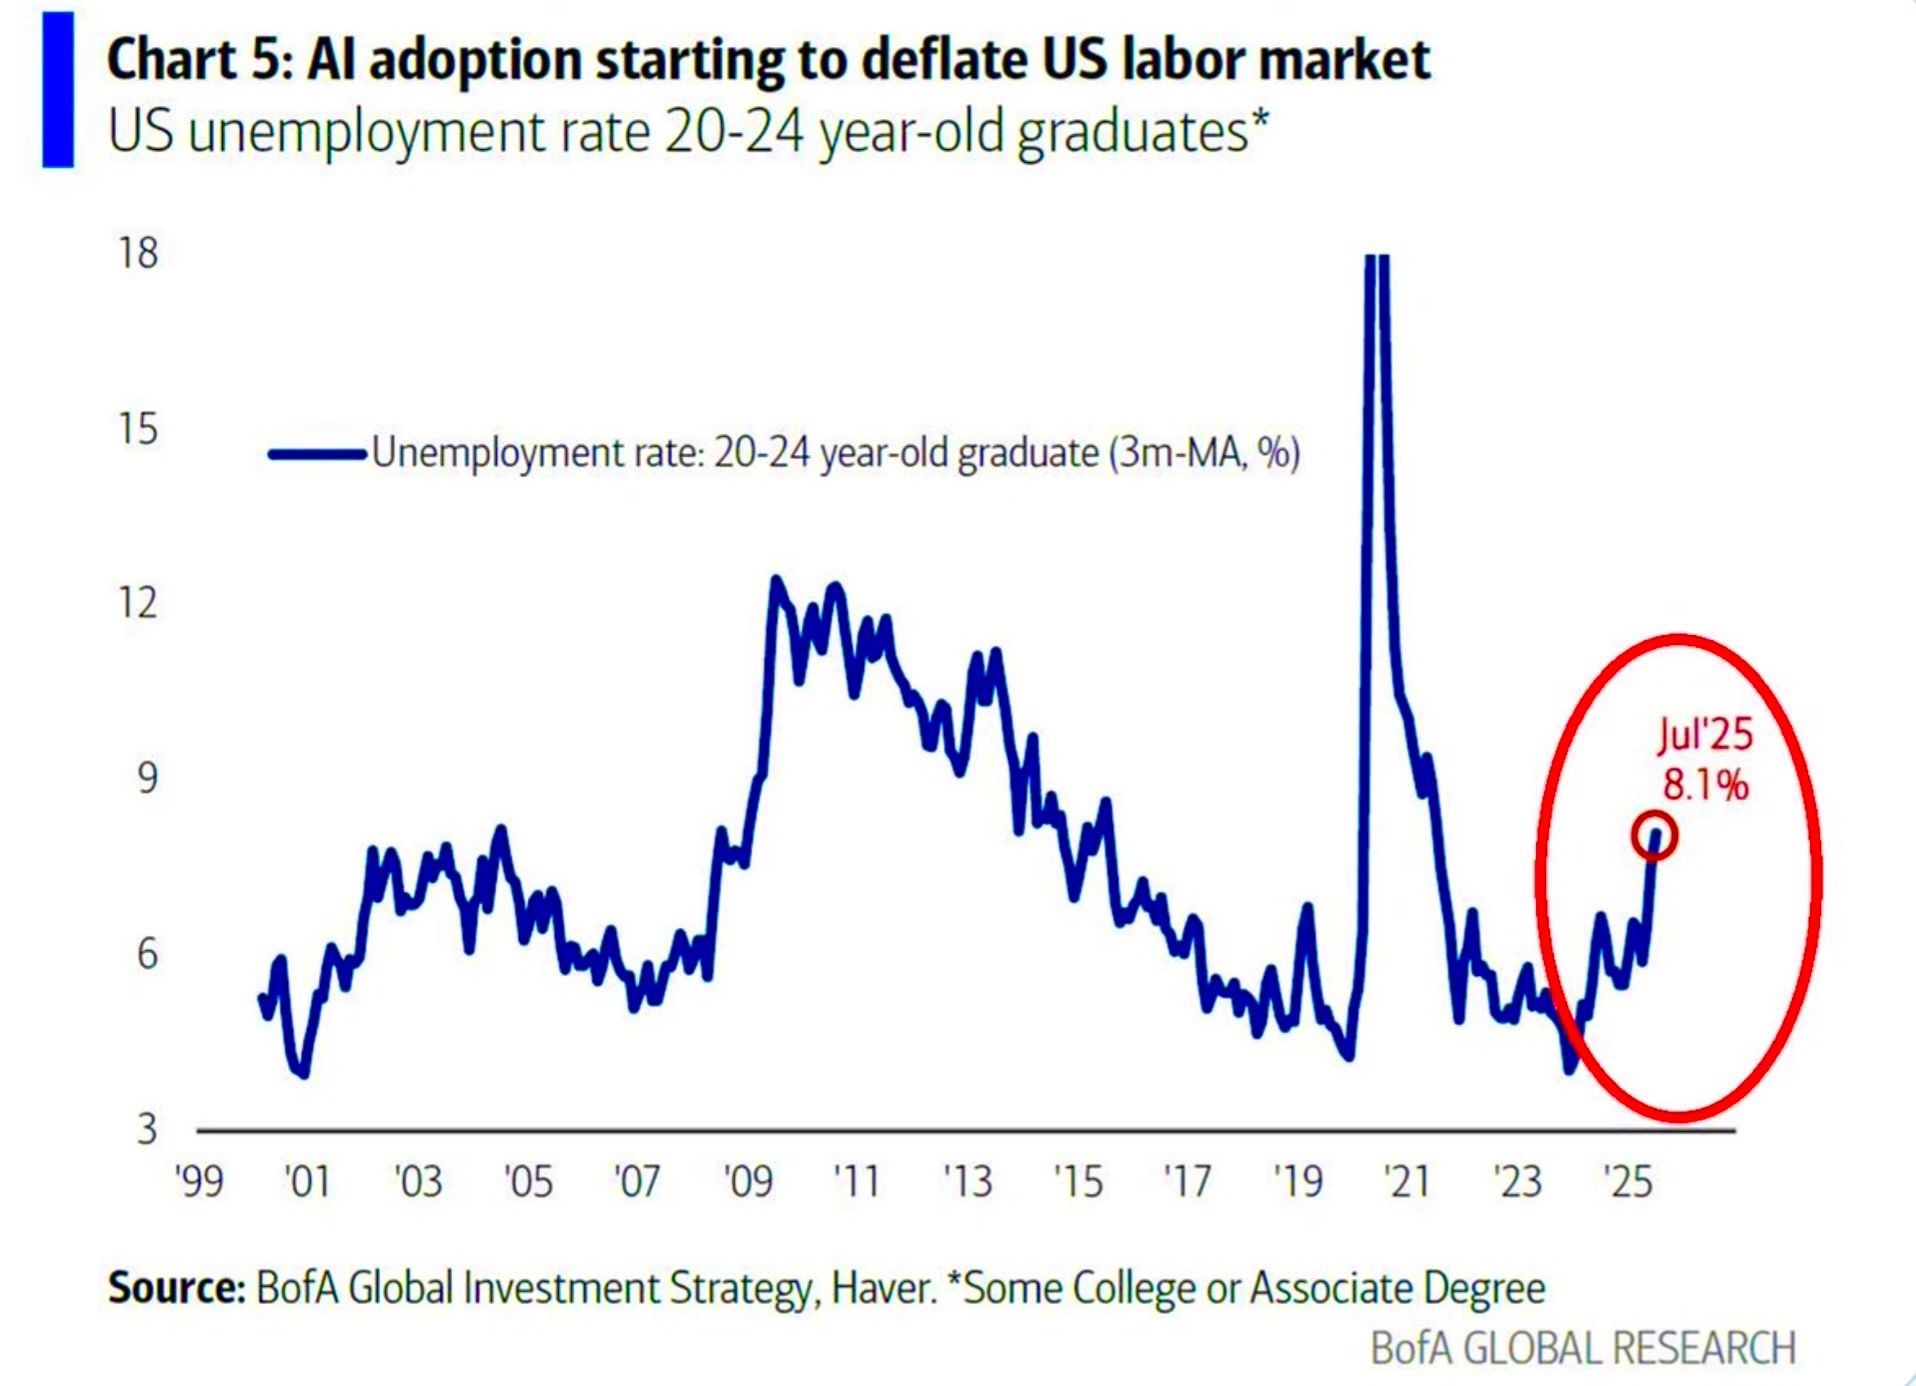
 As goes tech, so goes the market. Stocks started the week and the month with a large selloff that was once again met with the “buy the dip” that sent most of the big caps to new intraday highs by Friday’s trade where there was a reversal in the Dow and SPX. Friday’s trade was dominated by the big rally in Broadcom ($AVGO) that sent tech indexes higher and the release of the Non-Farm Payrolls that showed an increase of 22K in August and a bump to 4.3% in the Unemployment rate. Once again, manufacturing lost jobs and there have been a net loss of -78K manufacturing jobs since the start of 2025 and -42K since April 2025. The news sent bonds soaring and rates dropping with the 10YR dipping 10bps on Friday. In addition to the hit in manufacturing jobs, unemployment for 20-24 year olds is at 10.5% and 8.1% for 20-24 year old college graduates. The revisions showed job losses for June, the first loss in U.S. jobs since December 2020. There are now more job seekers than job openings.
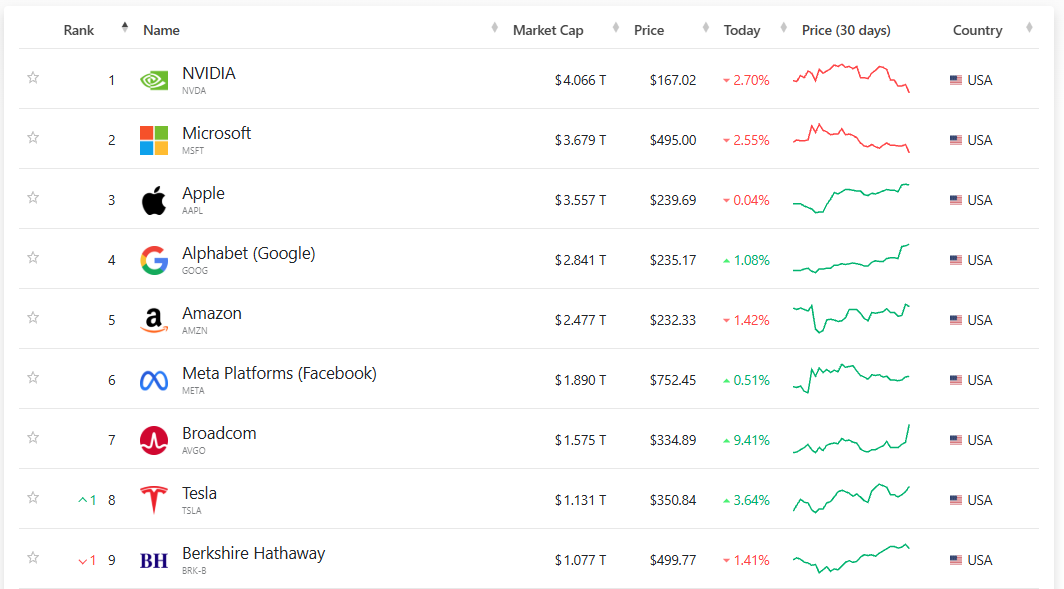
 Everyone knows that the markets are extremely overvalued/inflated right now…but sentiment is not manic, and we are not seeing the type of whipsaw volatility that comes when a major top is in process. The AAII still has more bears than bulls and every selloff brings players into the puts. Yes, insiders are selling, but they are up against a relentless retail crowd that continues to buy every dip. There are now more ETFs on Wall Street than there are individual stocks. It’s Las Vegas. It has come down to how can they keep ten stocks up with promises of some imaginary AI Revolution. Ten stocks that make up 40% of the market. TEN.
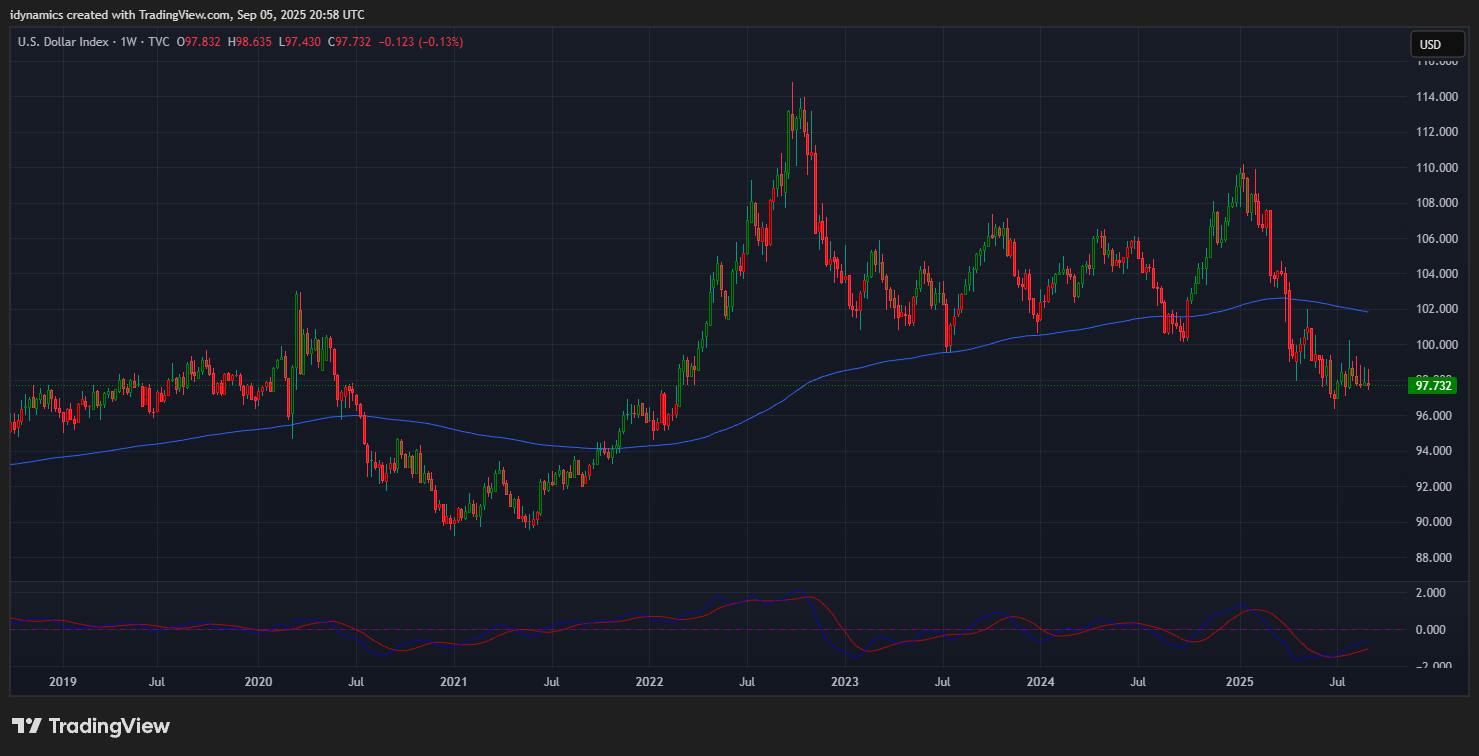
 Friday’s news pushed betting markets quickly to the Fed dropping rates by 100bps by spring of 2026. The MOVE volatility index shot up sharply ahead of the Employment report with traders expecting a rise in volatility in bonds. More will be known after this week when we see CPI and PPI data. If those numbers stay steady or hot, then analysts will begin to talk about the very real possibility of stagflation. Based on the price action in both gold and the dollar, this is looking much more like what is in store for the U.S. and the global economy.
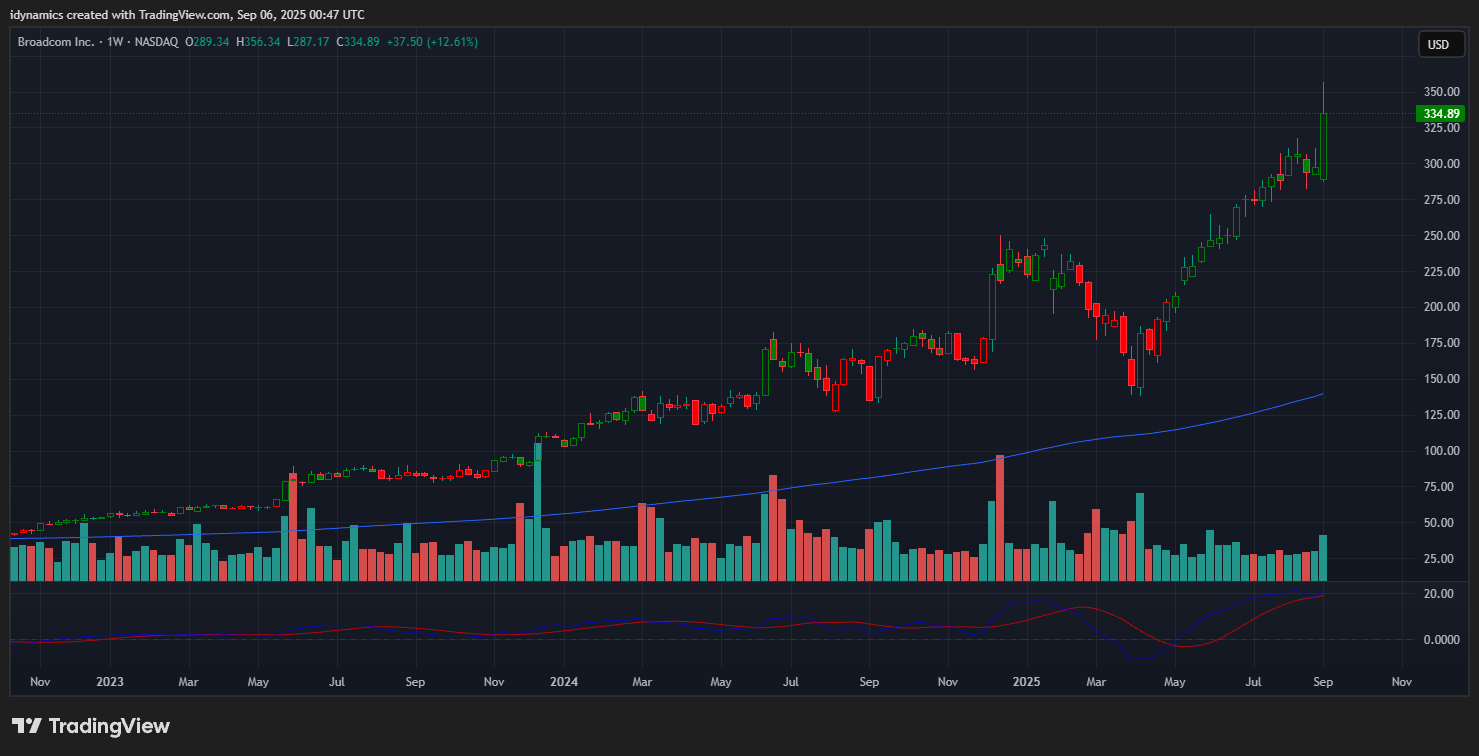
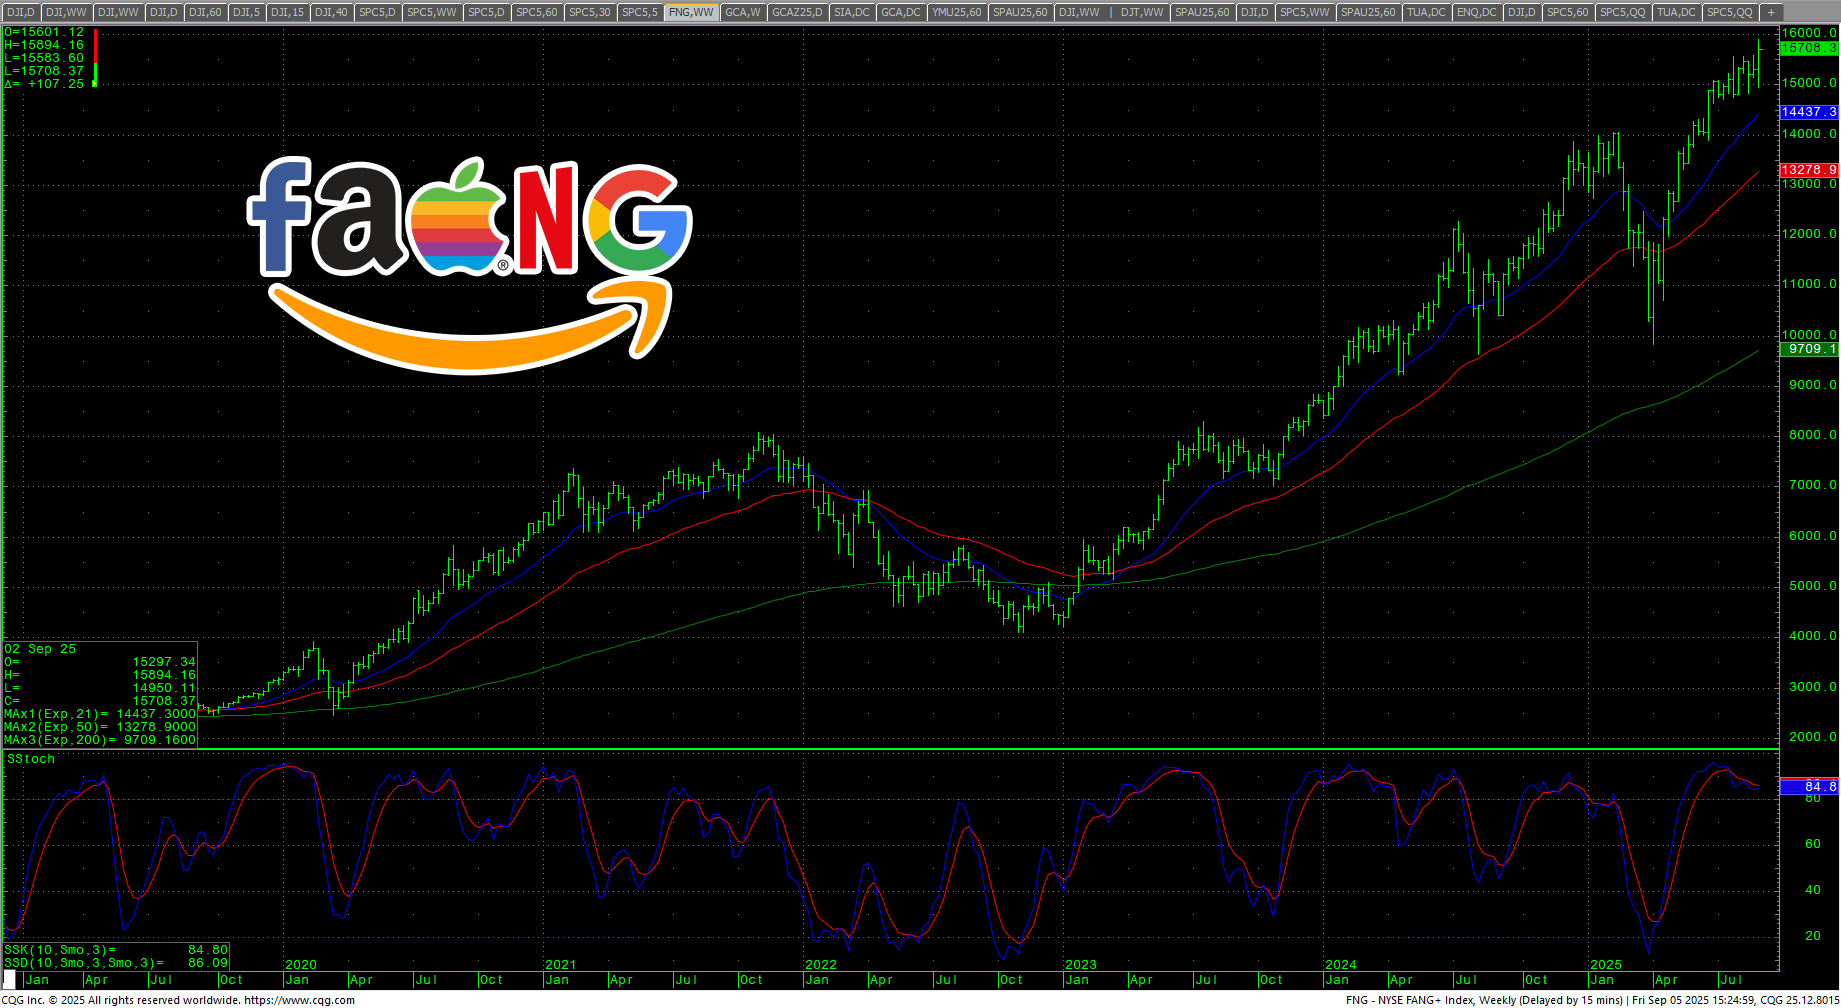
MAGS+ORCL+PLTR+AVGO Daily Candles
 Mag9?
Mag9?
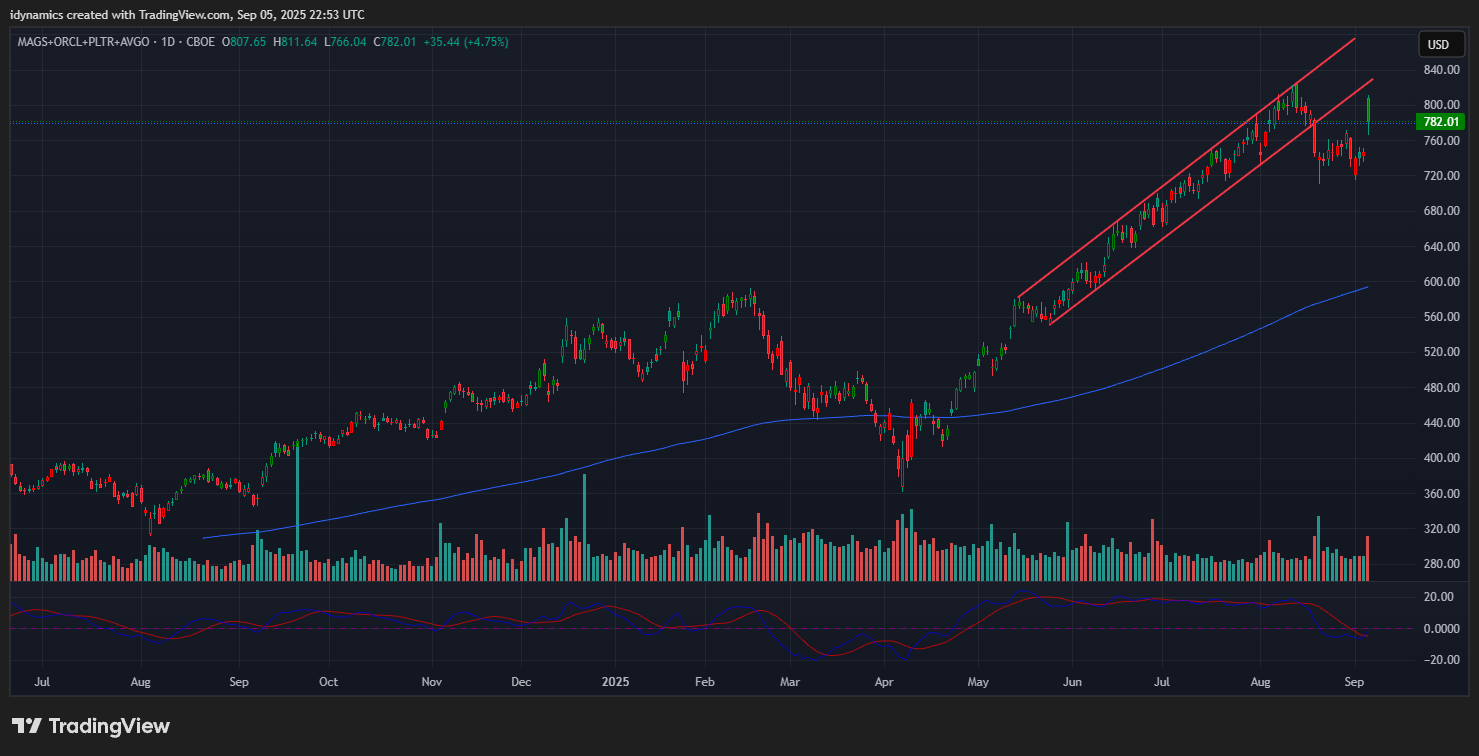
 The combined chart of MAGS+ORCL+PLTR+AVGO jumped sharply Friday as Broadcom rallied and moved above a $1T market cap, joining the MAG7 in the $1T+ club. We now have a “MAG9,” even though $TSLA is pretty much a joke as it trades at a P/E of over 200. Some tech stocks and indexes are beginning to show cracks, but there simply is not bearish action yet to support topping forecasts. We must see lower lows and lower highs before the charts will have a say in any bearish scenario.
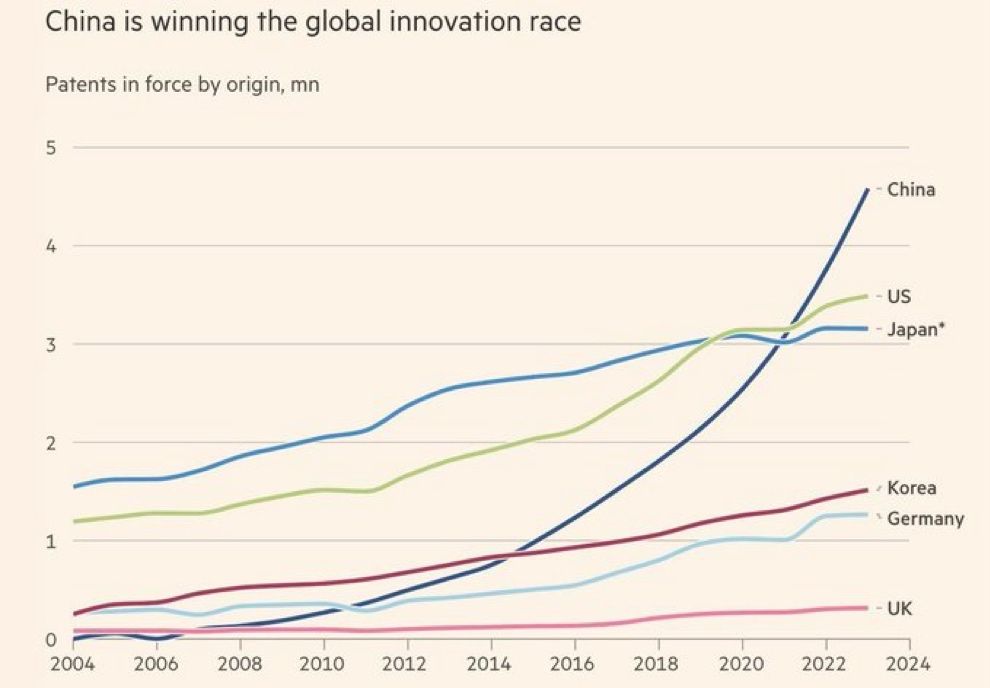 The big party in China with India participating should be a wake up call for the markets. China’s productivity is accelerating and outstripping the globe. Ray Dalio spoke out last week, warning about an impending “debt crisis.”
“Remember in the last Cycle Timing Update, I pointed out that the parallel to 1987 is very real…and, in that year, prices moved higher into late August and then started a correction. If we are truly rhyming, this may be the case for 2025. (In 1987, the highs came on August 23rd). The reality is that we are now in a 6-9 month window of extremely volatile longer-term cycles. The next two months are a place where there is strong potential for an exogenous event to occur.”
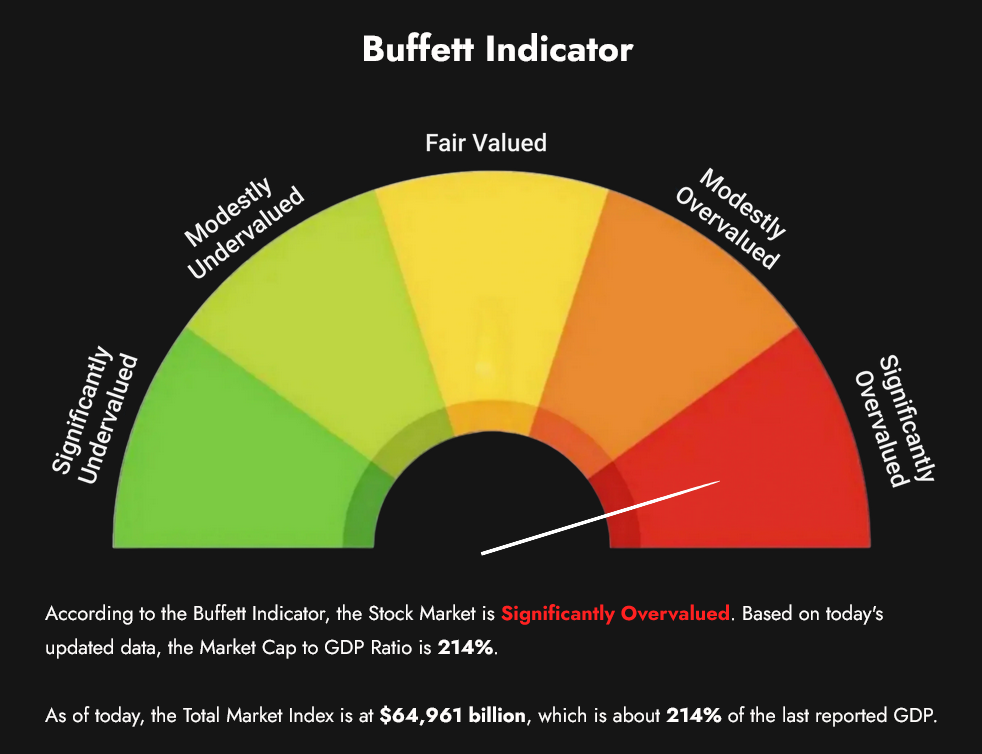 The VIX remains subdued and complacent. The Buffet Indicator hit another ATH at 214%.
Dow Theory
Dow Theory is still bearish.
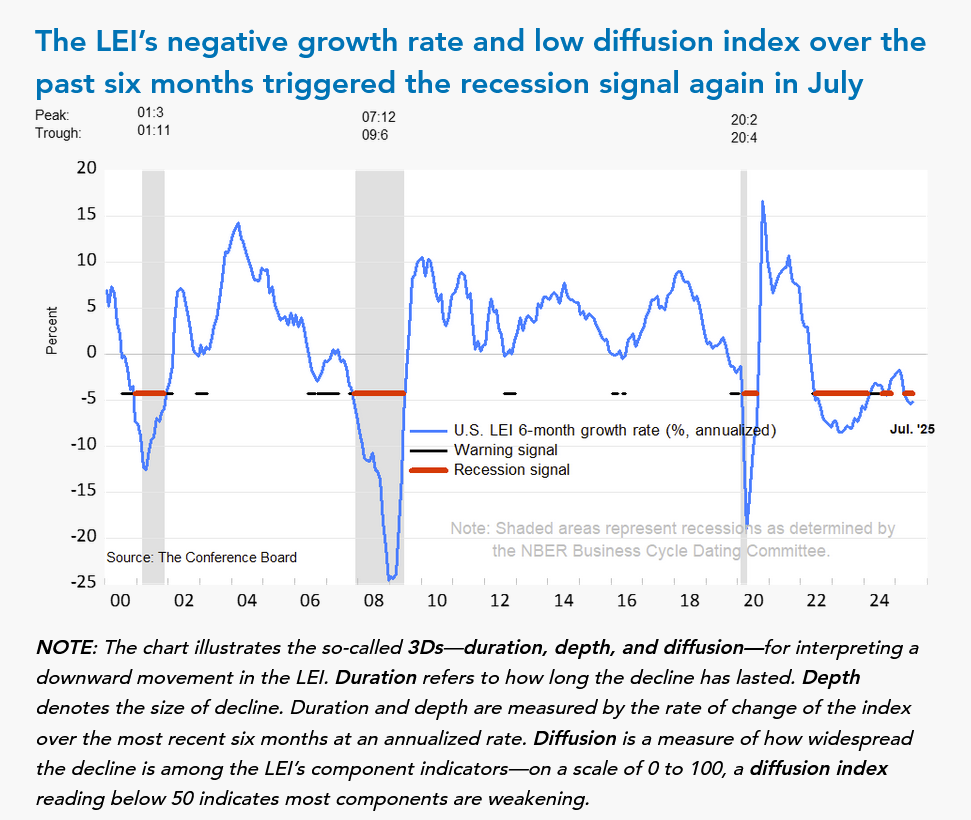
Leading Indicators are Flashing Recession
SPX Quarterly H-L-C
 *We initiated two short trades in the SEP S&P E-mini (SPU). Took a loss on one and holding a short position at 648500. Stop is 652500. Updates on LinkedIn.
S&P 500 Stocks Above the 200-day MA
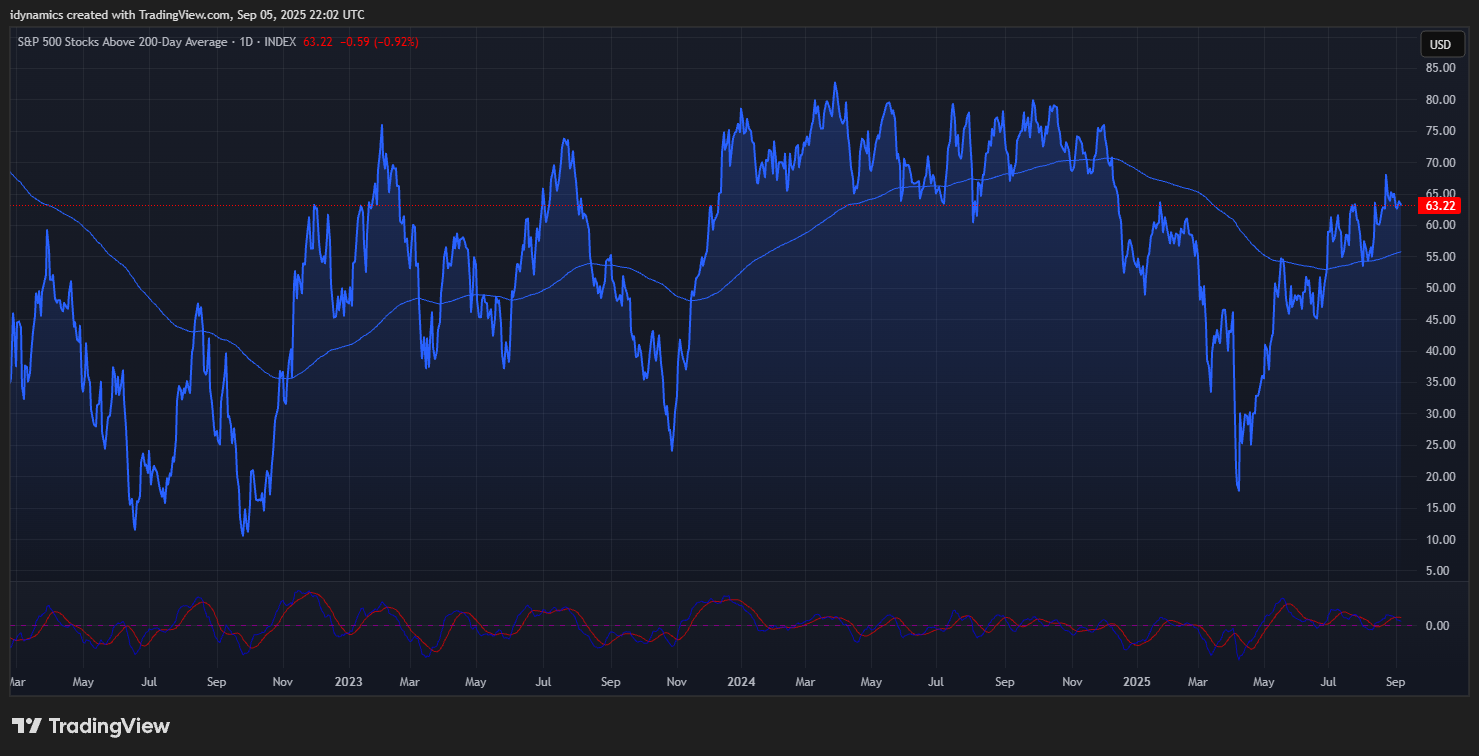 Breadth was flat for the SPX on the week, declining to 63.22%. The high in September 2024 was 72.92% and 82.70% in March of 2024. Divergence is still the name of the game.
MAGS (Magnificent 7) Weekly Candles
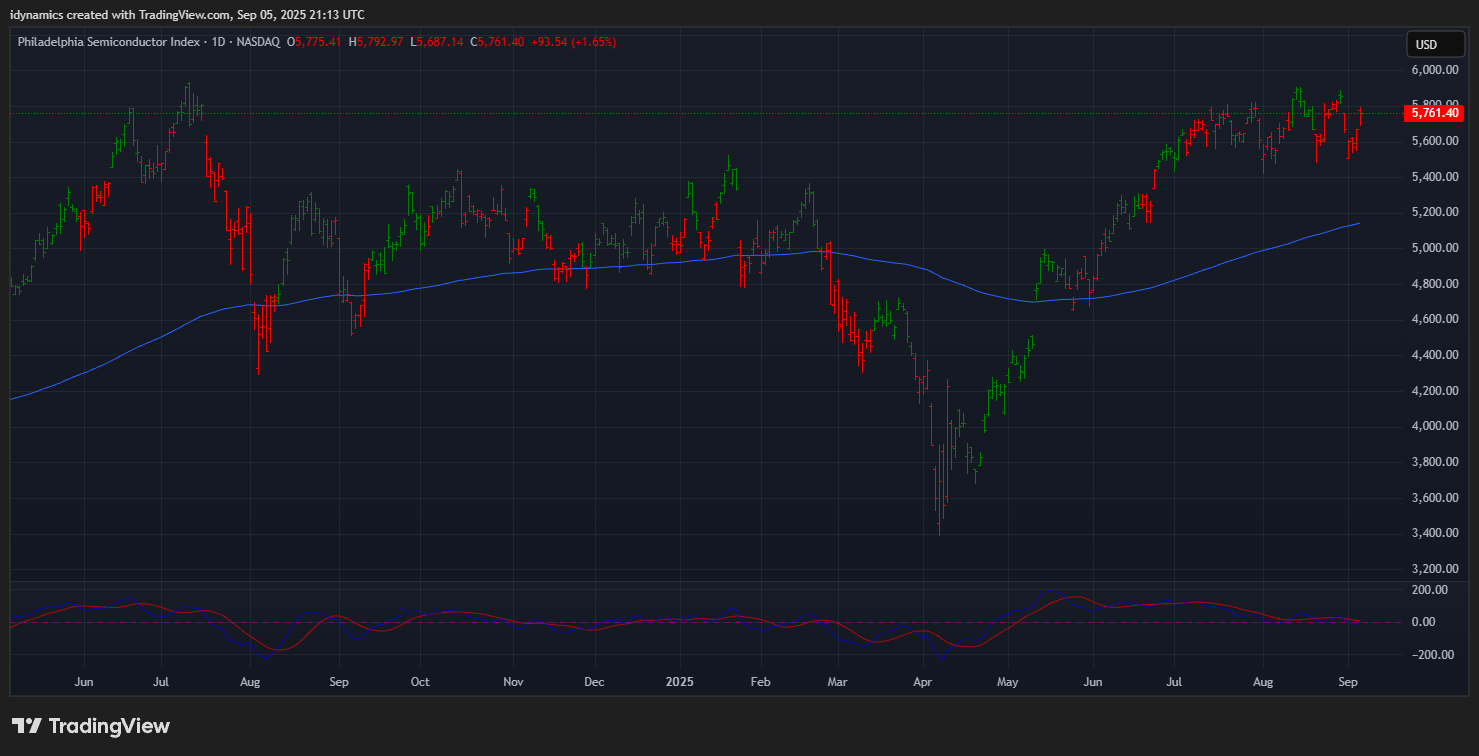
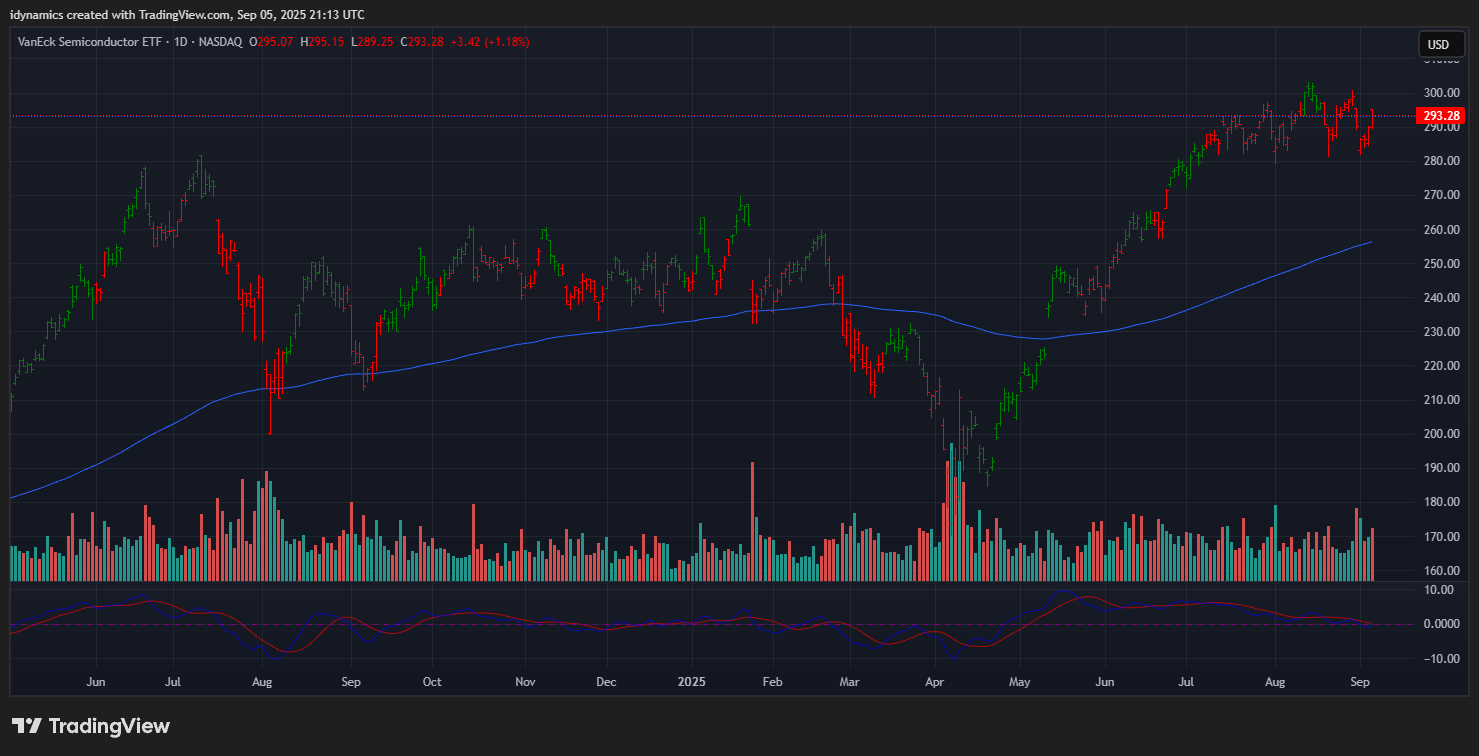
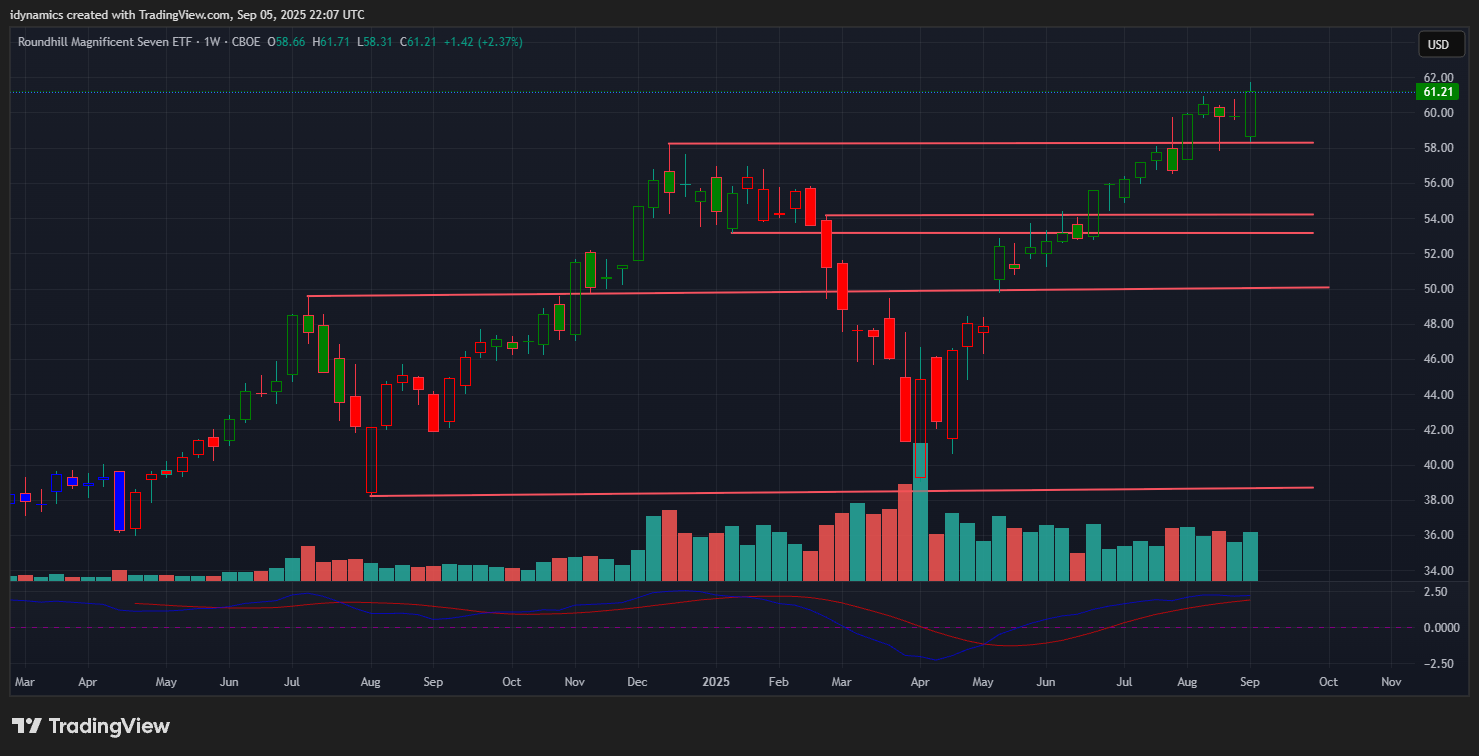 The MAGS moved to a record high on the week in a wide outside week up and closed near the high end of the weekly range, up +1.42%. There is an upside target of 63.04 and resistance at 64.50. Support is 58 and key against the 54.16/53.14 level. Both the SOX and SMH reversed higher and on the top end of their ranges…rescued midweek by AVGO as it closed up +12.61%.
QQQE Slowing
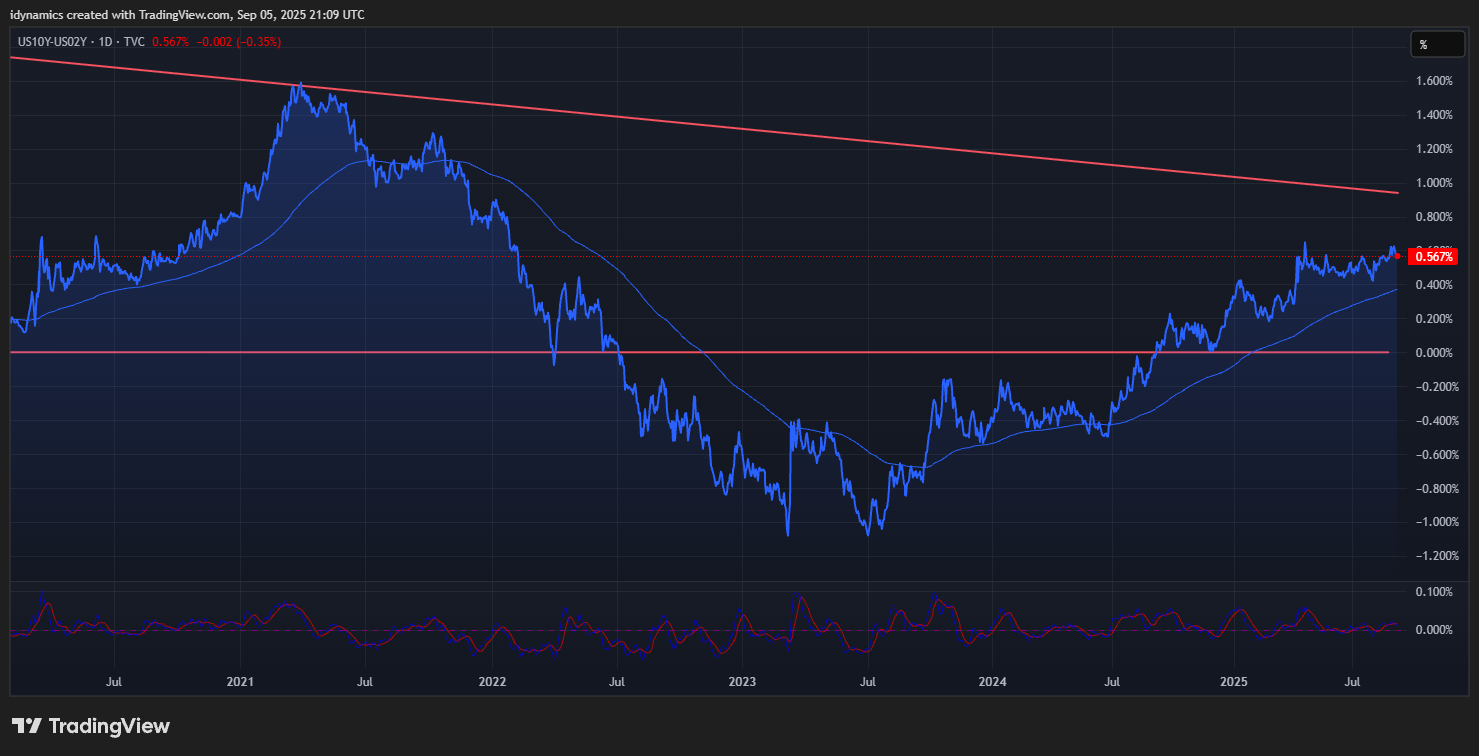
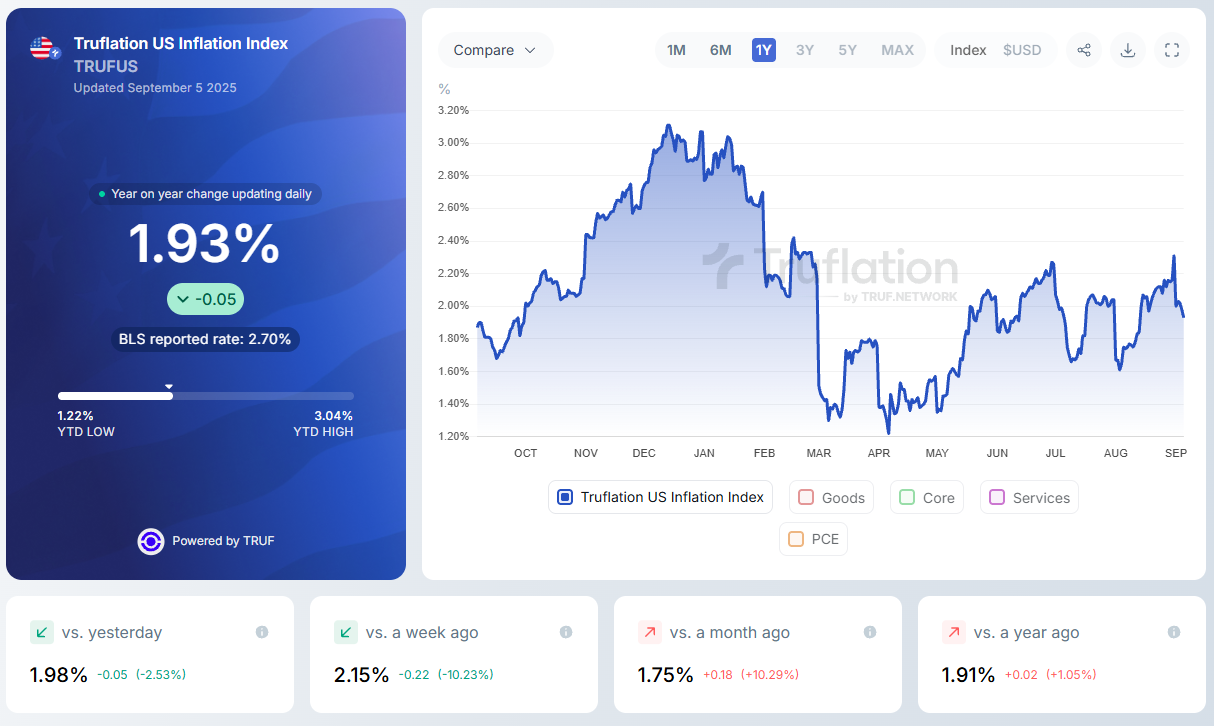
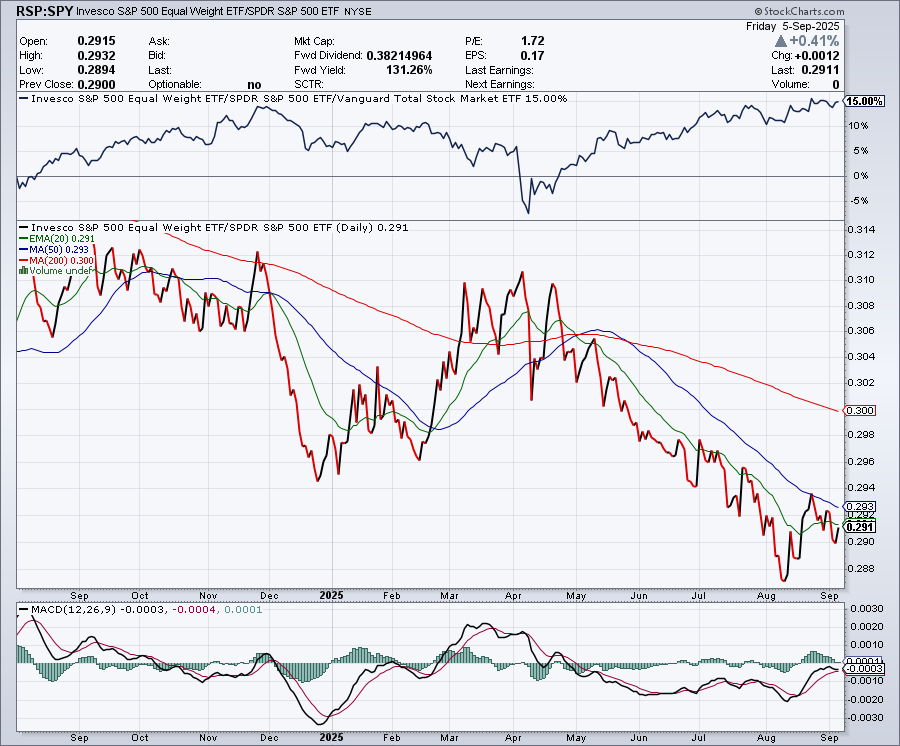
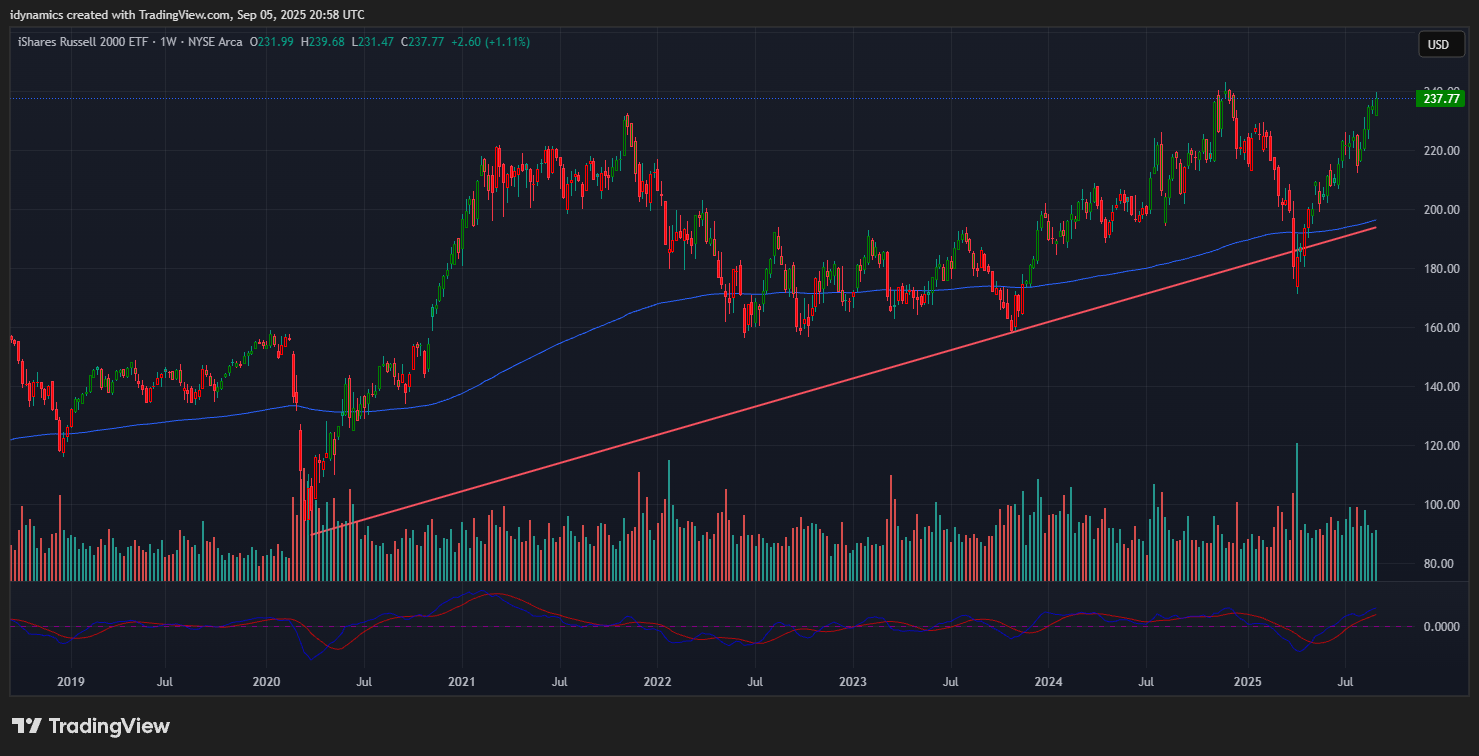
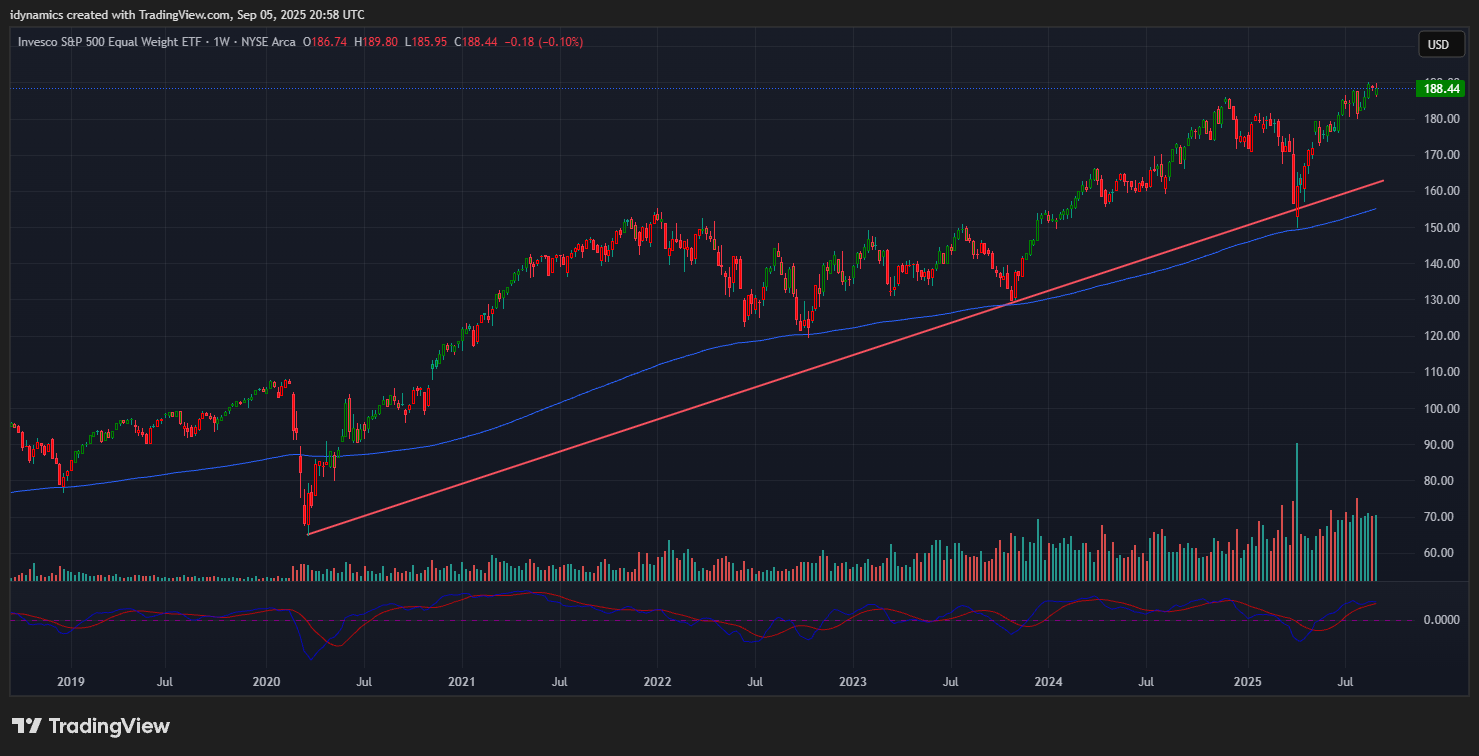
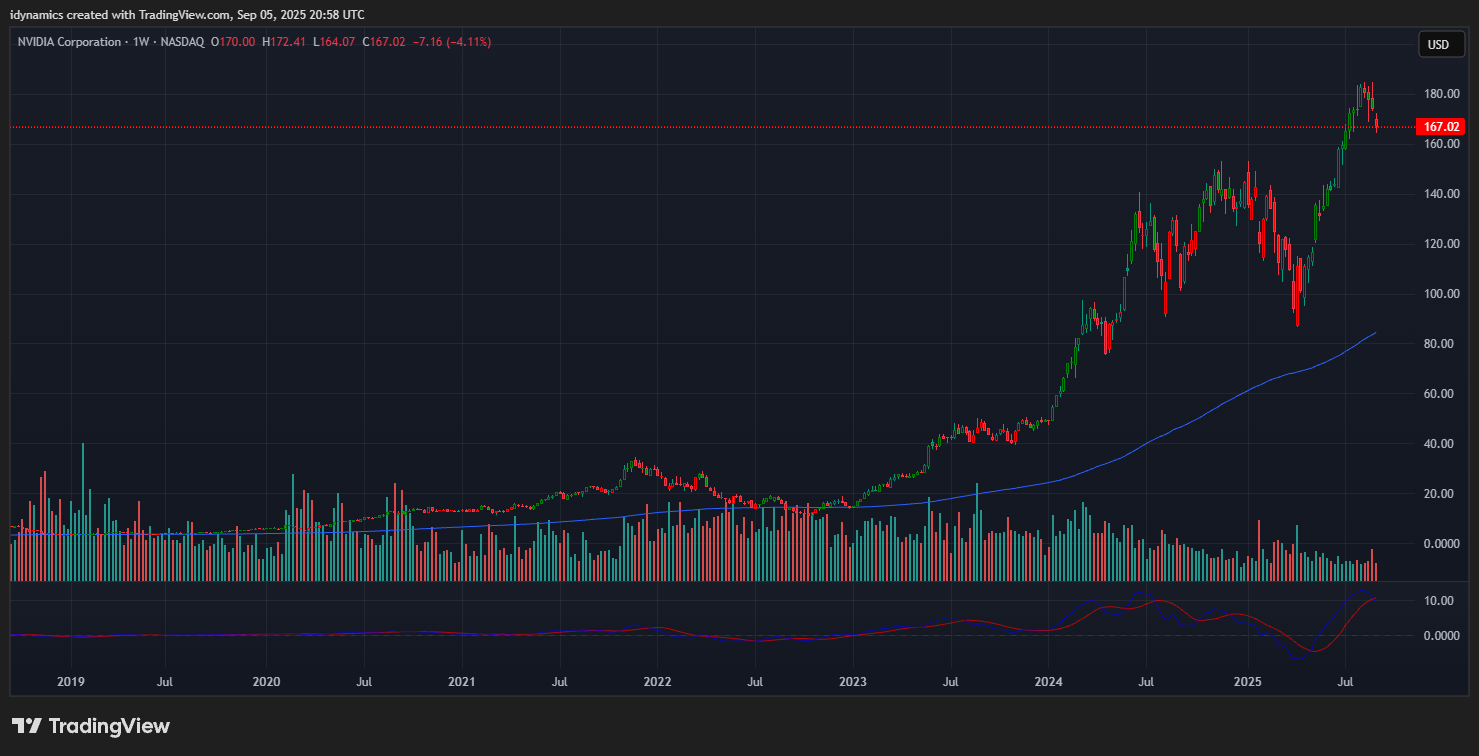
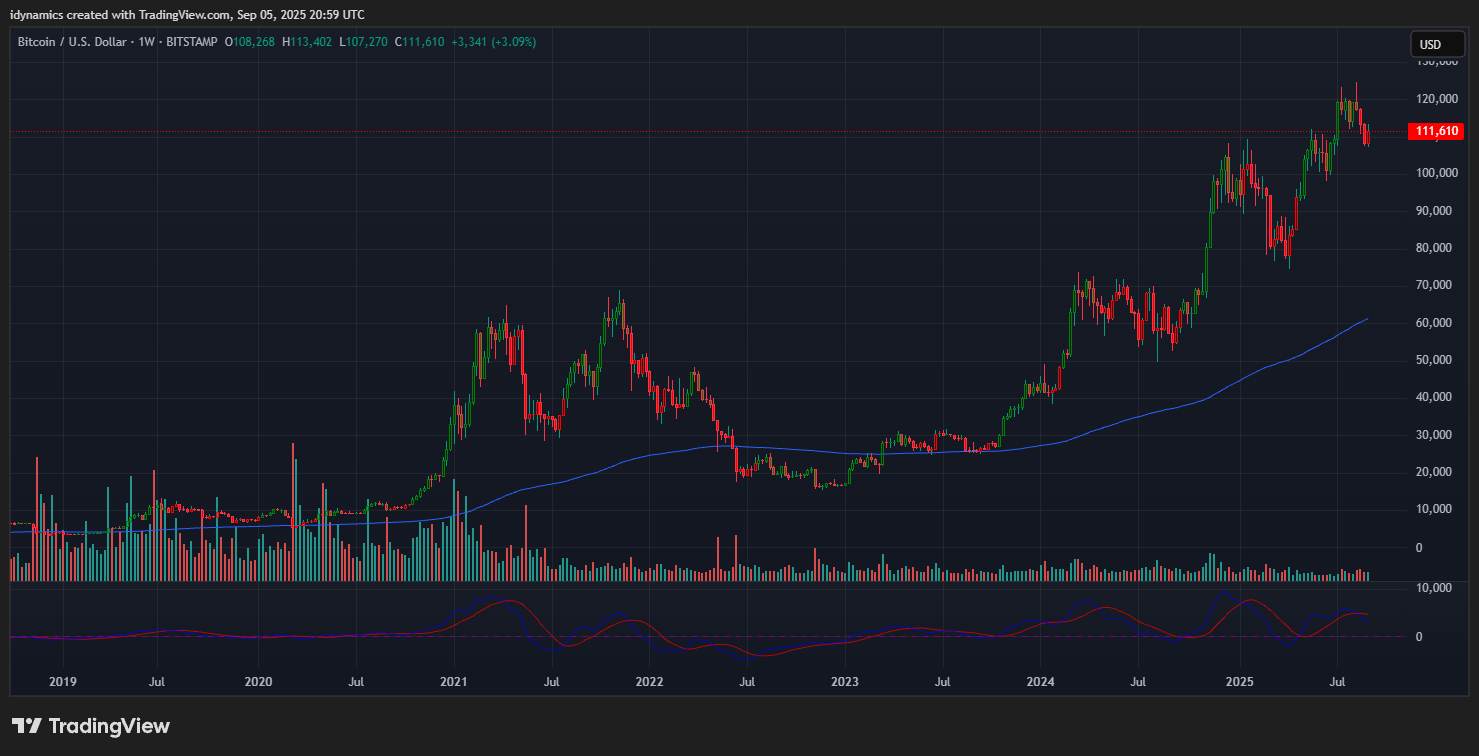
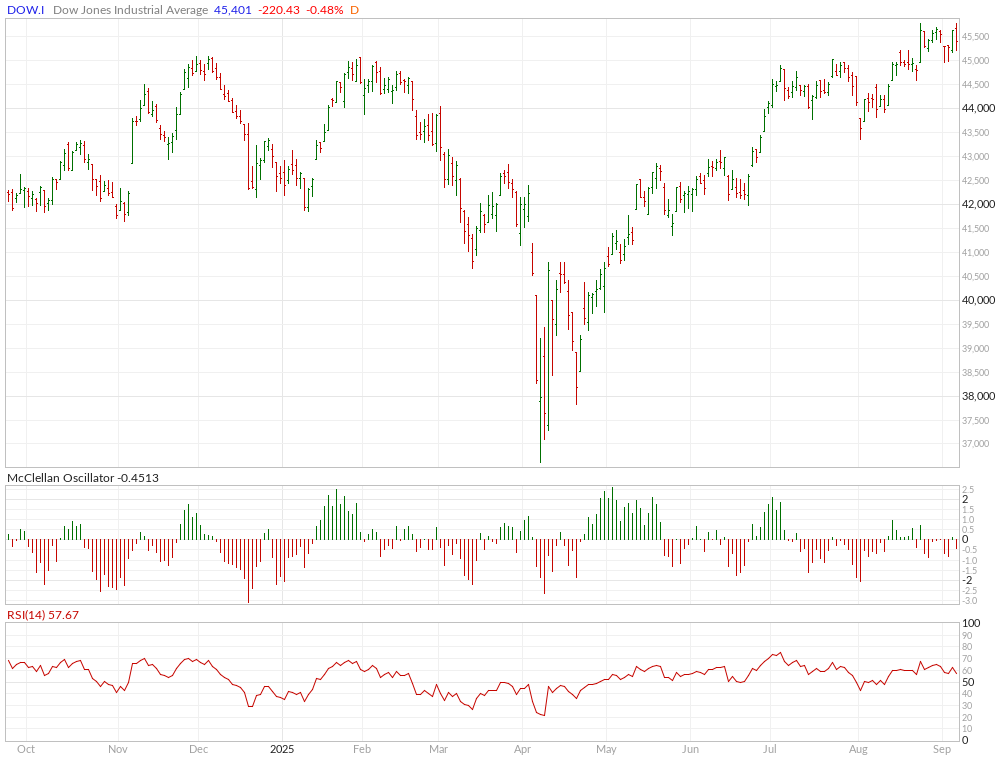
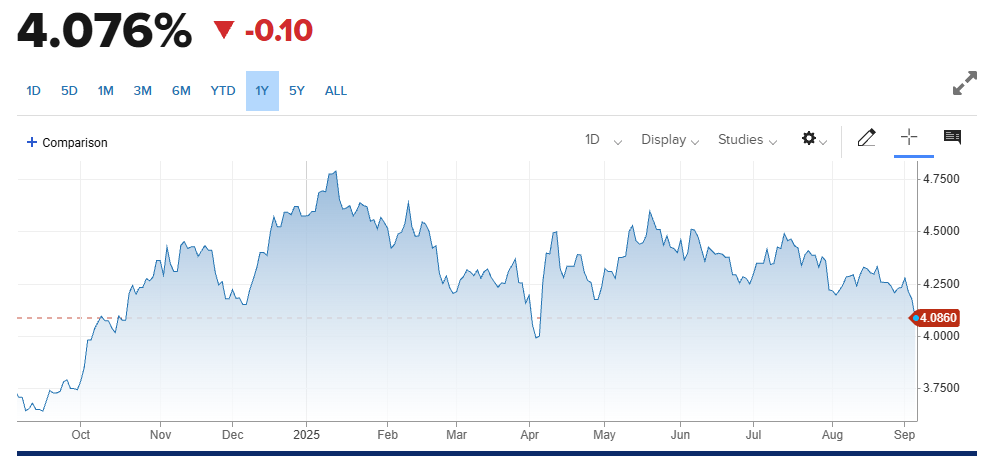
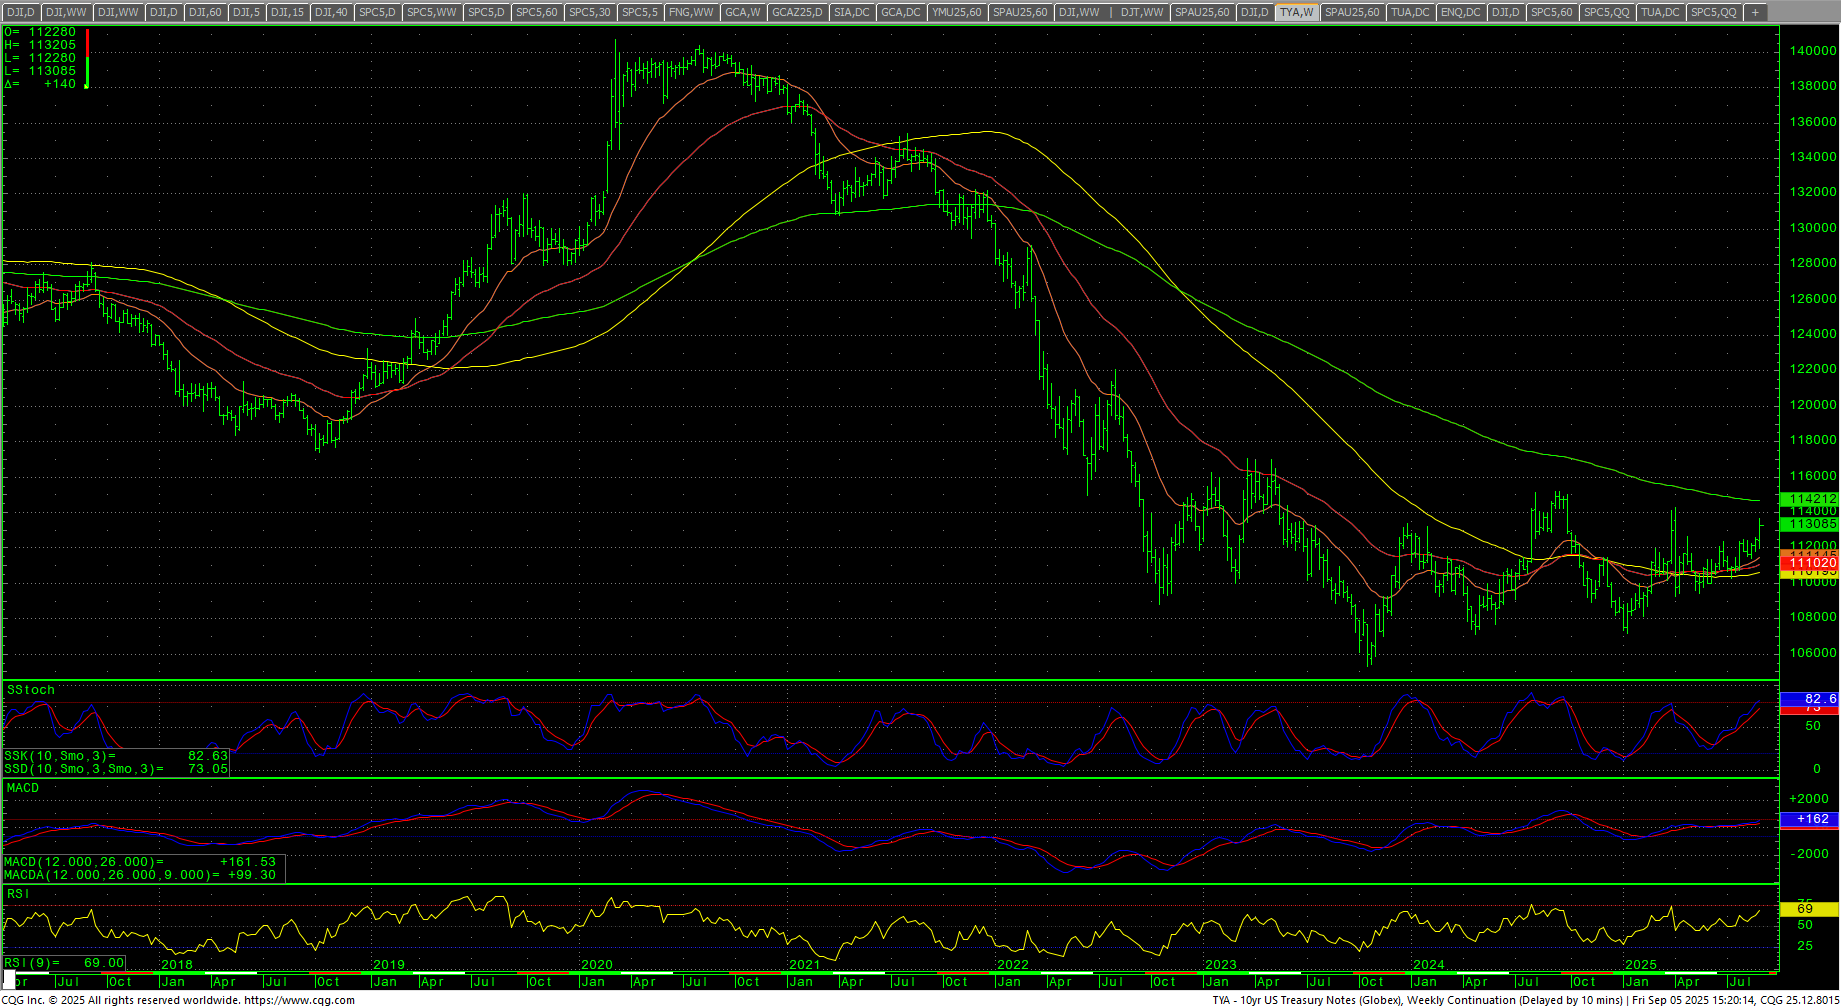
 The RSP:SPY held steady, the chart looks the same. The spread chart remains extremely weak. The weekly is trending lower in an oversold position and the MACD is down but might be attempting a hook higher. Resistance is .294. The IWM staged an outside week up, closing up +1.11% in the top of the range and is testing the ATH. The RSP also traded an outside week but ended down -0.10% in the upper half of the range. NVDA gapped lower and closed on the weekly low, down -4.11. Bitcoin held in an inside week and closed -2.34% after retesting support at 110/108. McClellan Oscillators are neutral for the Dow. The Yield Curve narrowed, closing at +0.567%. The 10YR yield declined sharply, closing at 4.076%. Truflation dropped to 1.93%. Corporate bond spreads are at a 27-year low.
On Thursday, the U.S. sold $100 billion in 4-week Treasury bills. That’s the largest short-term auction in history.
10YR-2YR Yield Curve Daily
 VIX Weekly Candles
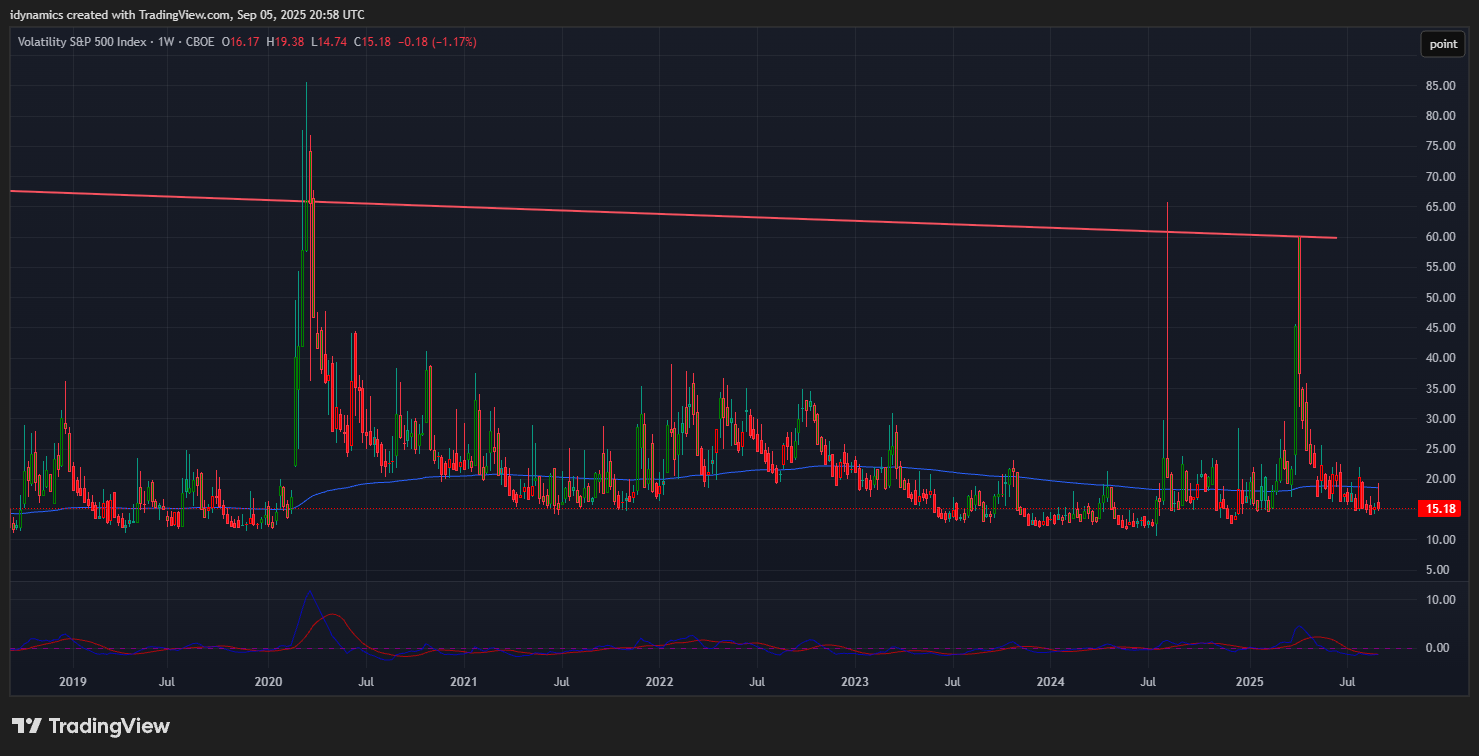
The VIX was up sharply to start the week and then plunged to close on the lows, up +1.17. The US Dollar had another failed rally and closed on the bottom of the range, down -0.12%.
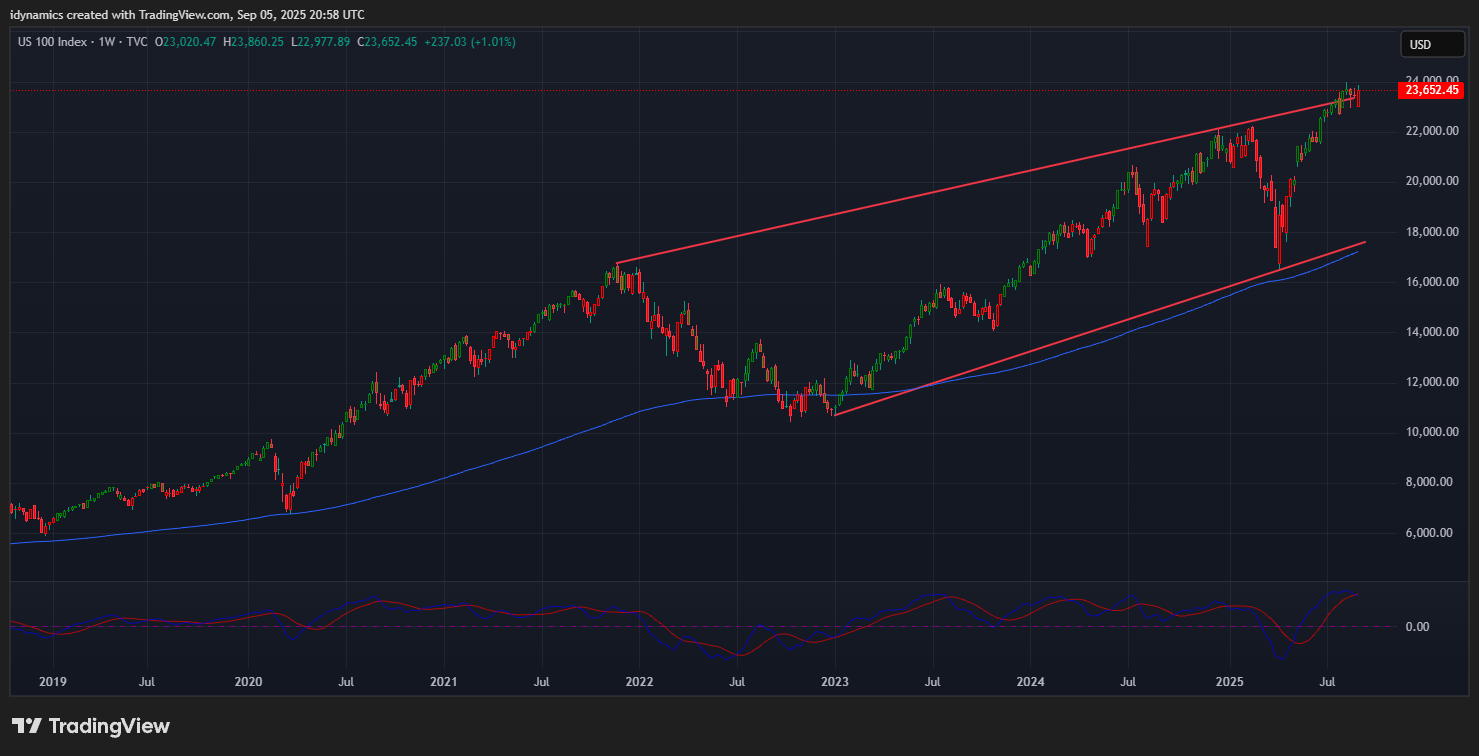
 Nasdaq 100 Weekly Candles
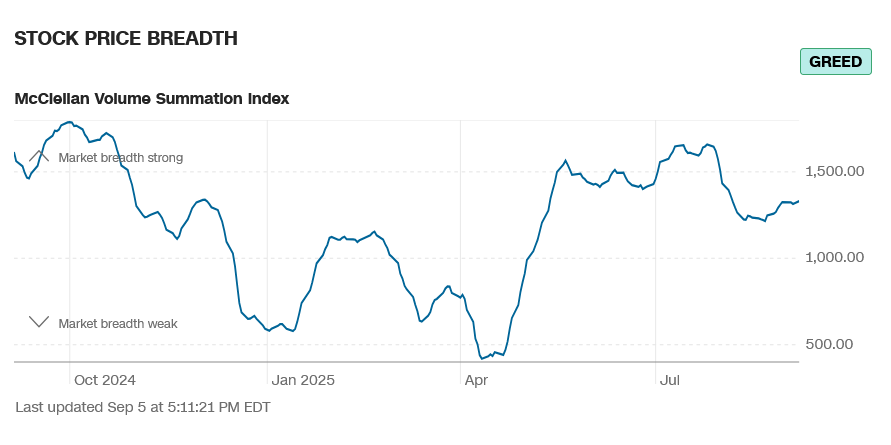
Daily Breadth 
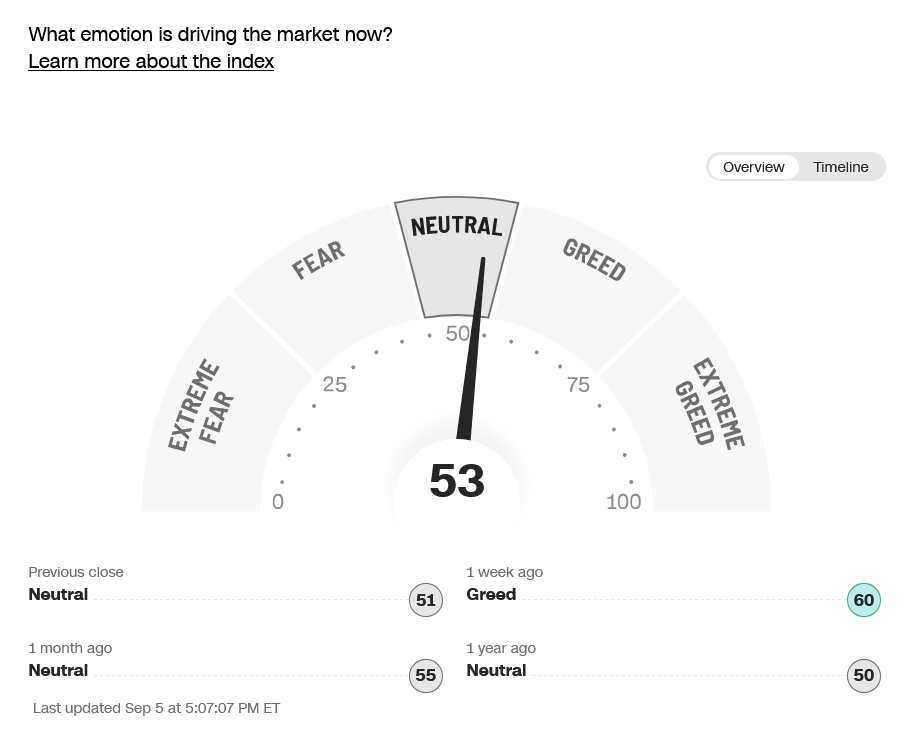
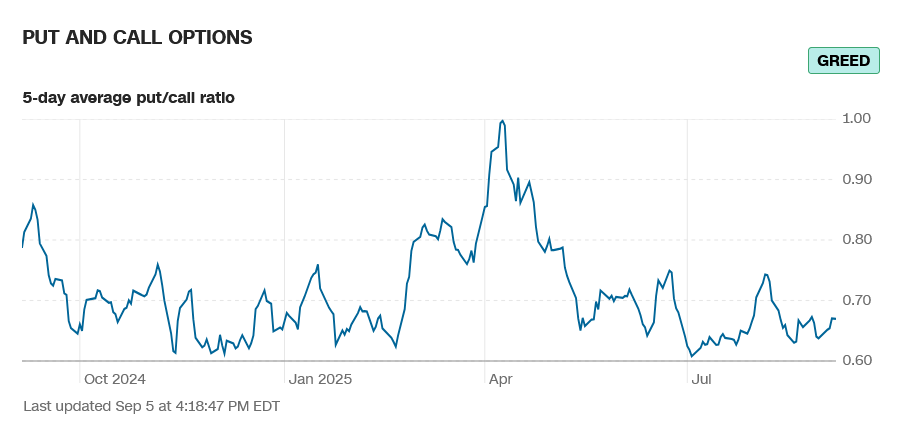
Breadth was mixed in Friday’s trade and improved slightly on the week. Sentiment still reads greed.
CNN Fear & Greed Index
 AAII Investor Sentiment Survey
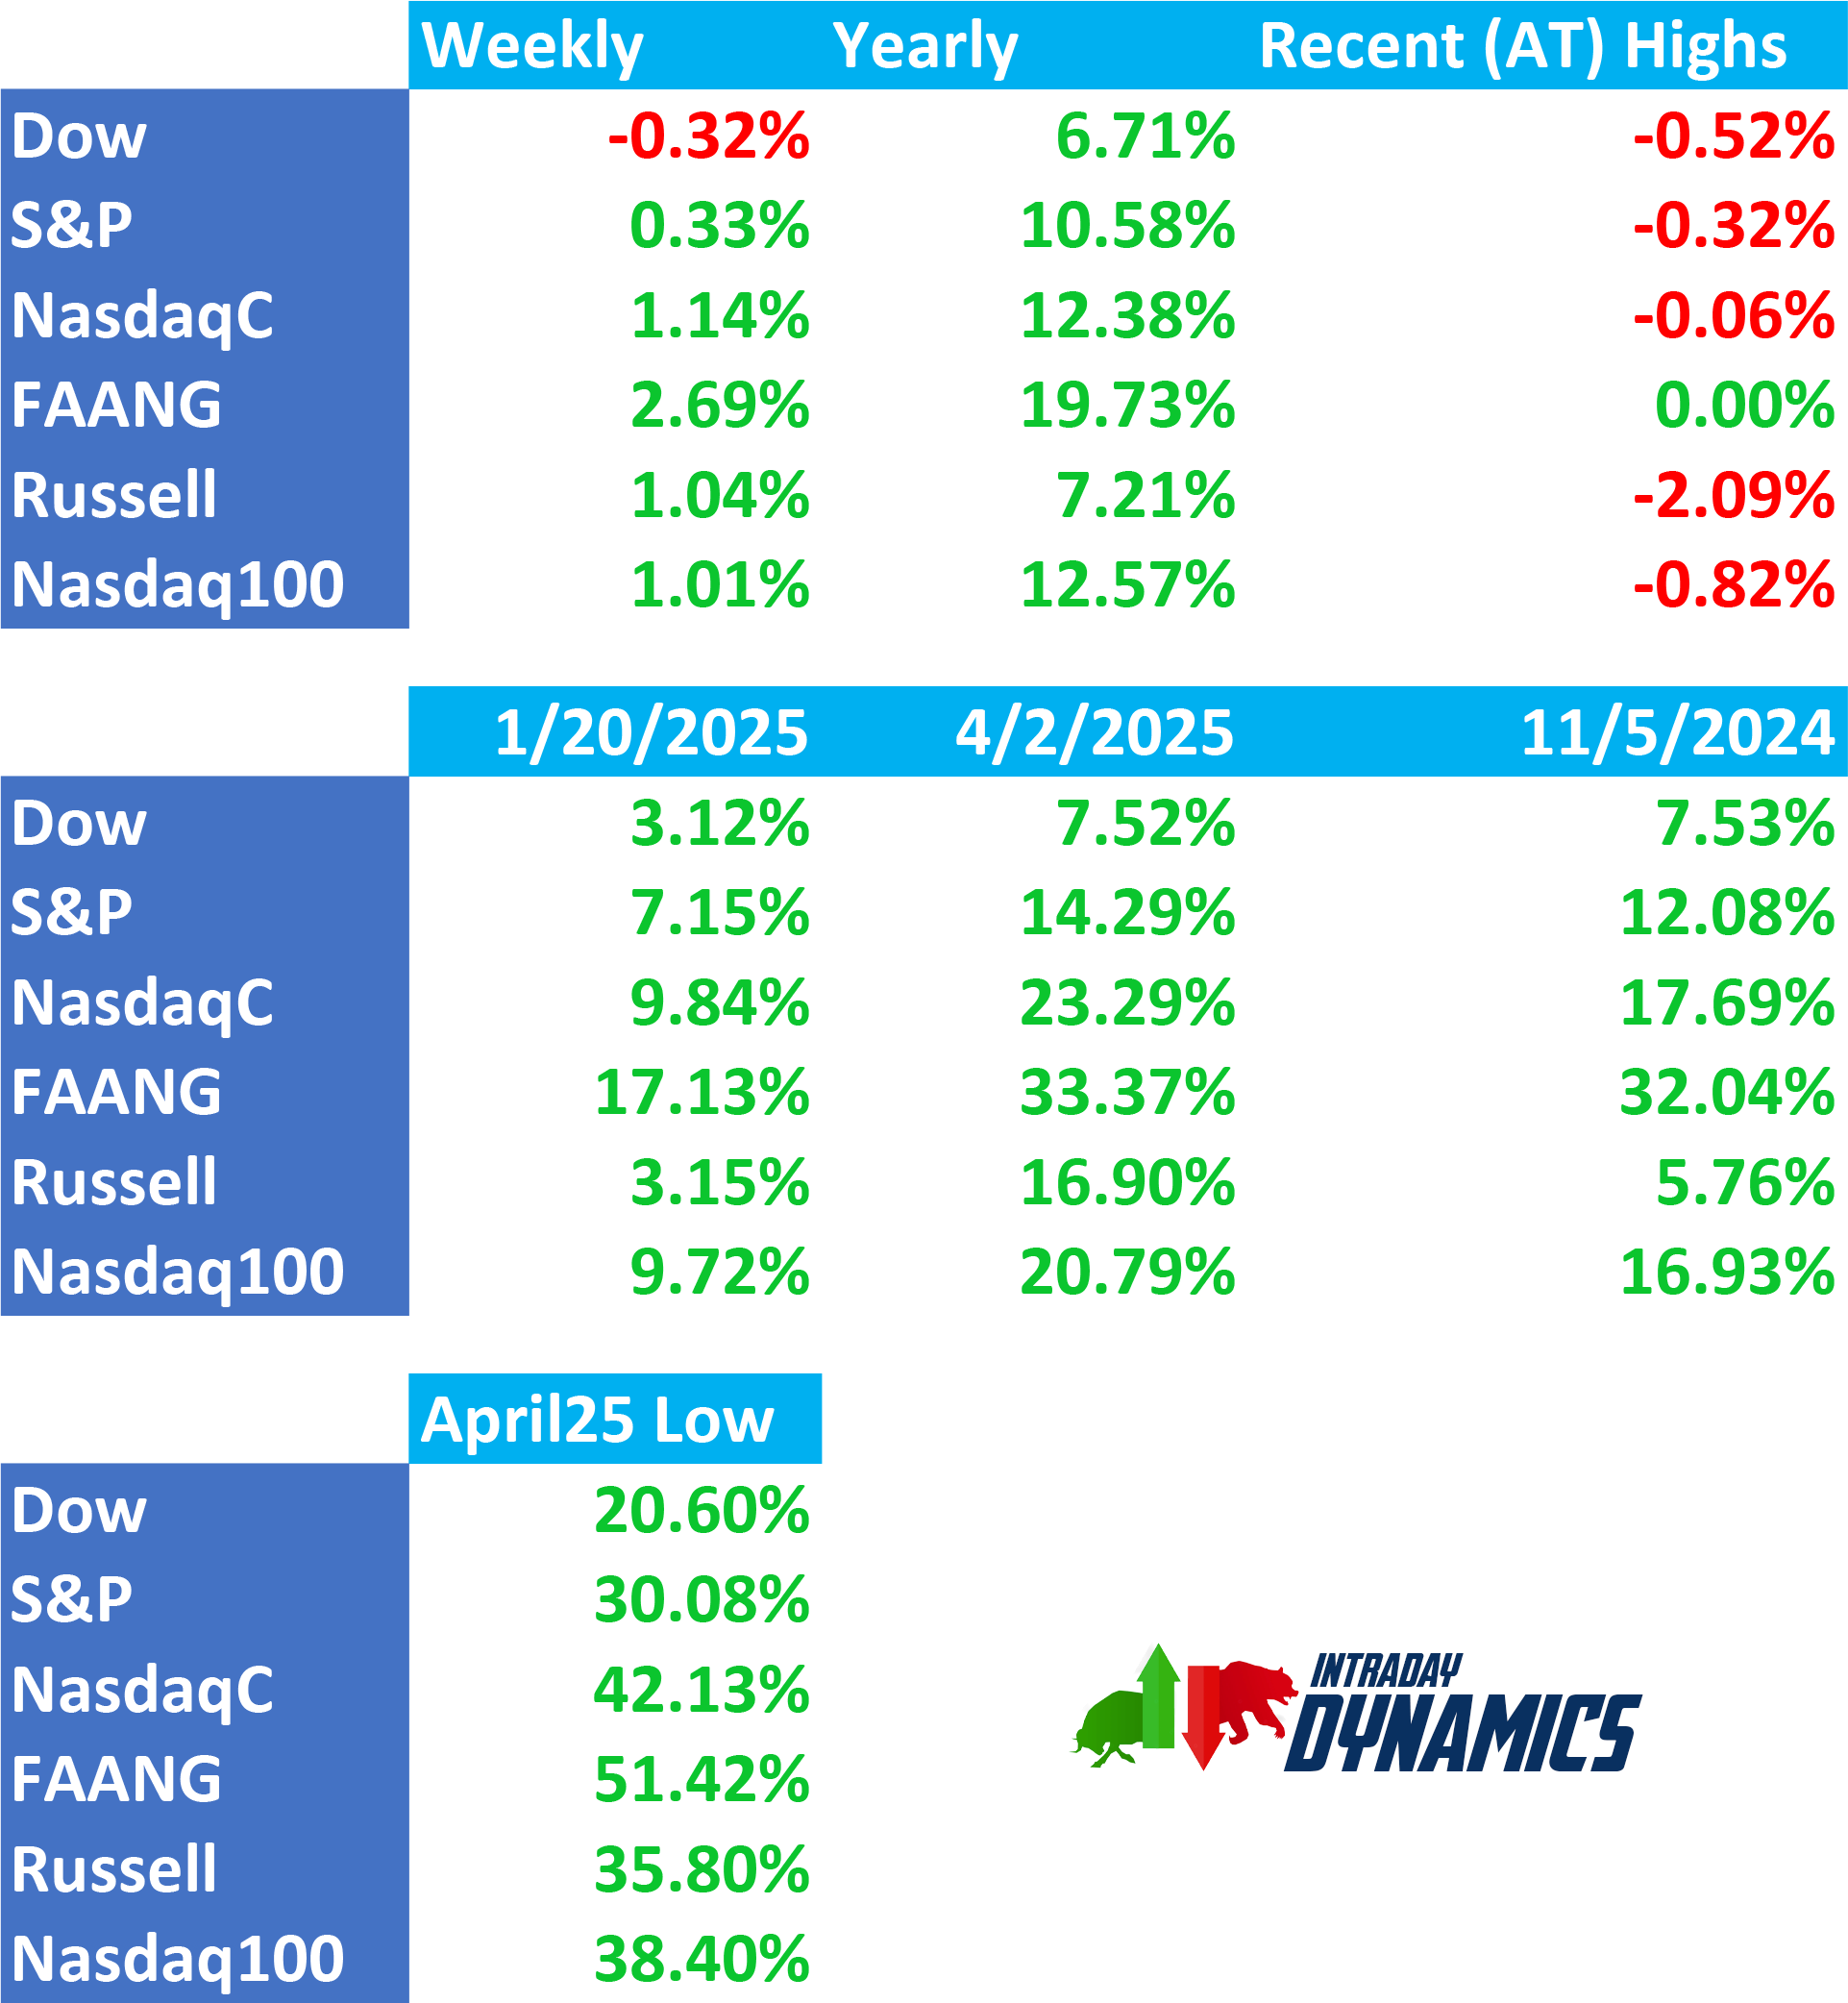
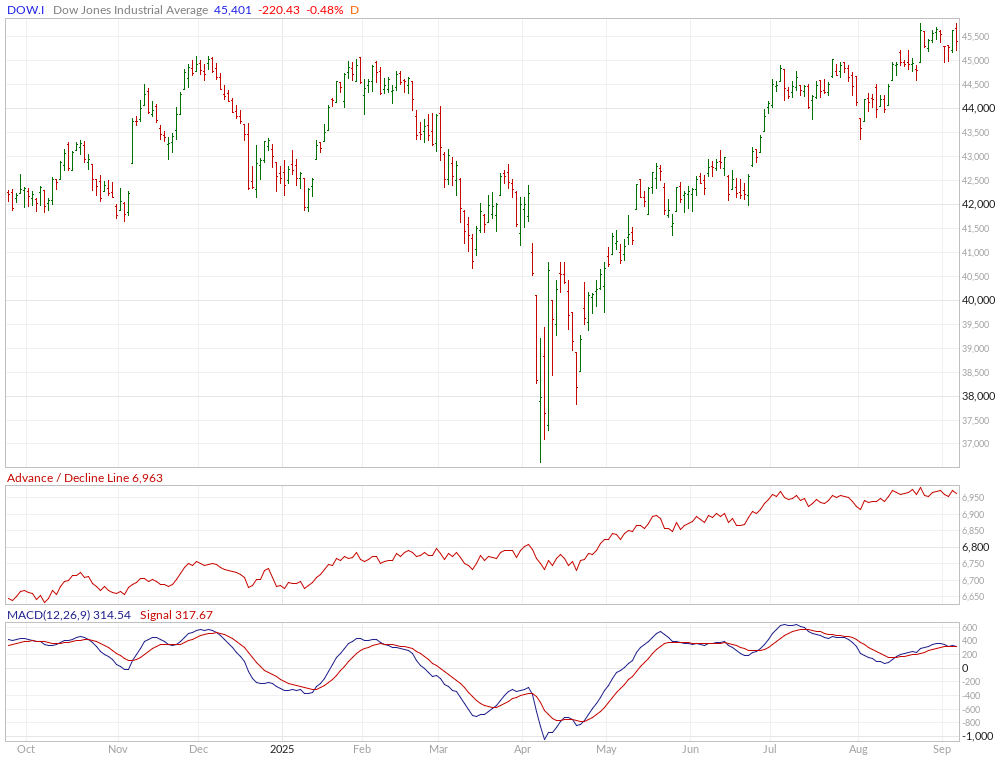
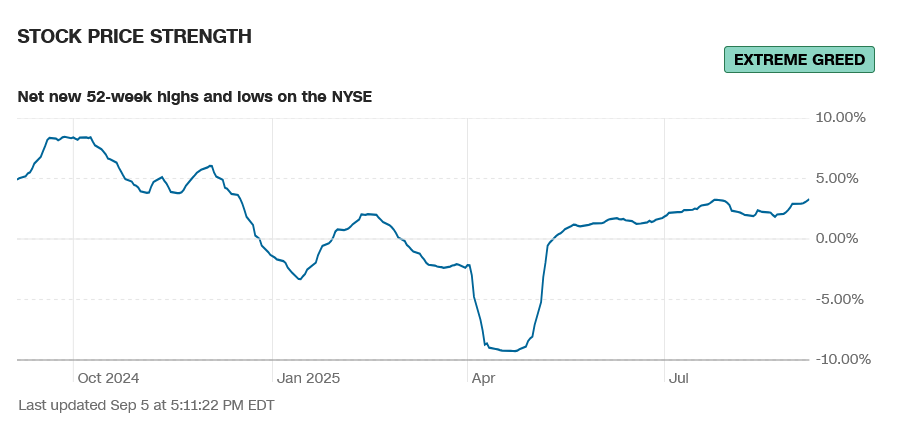
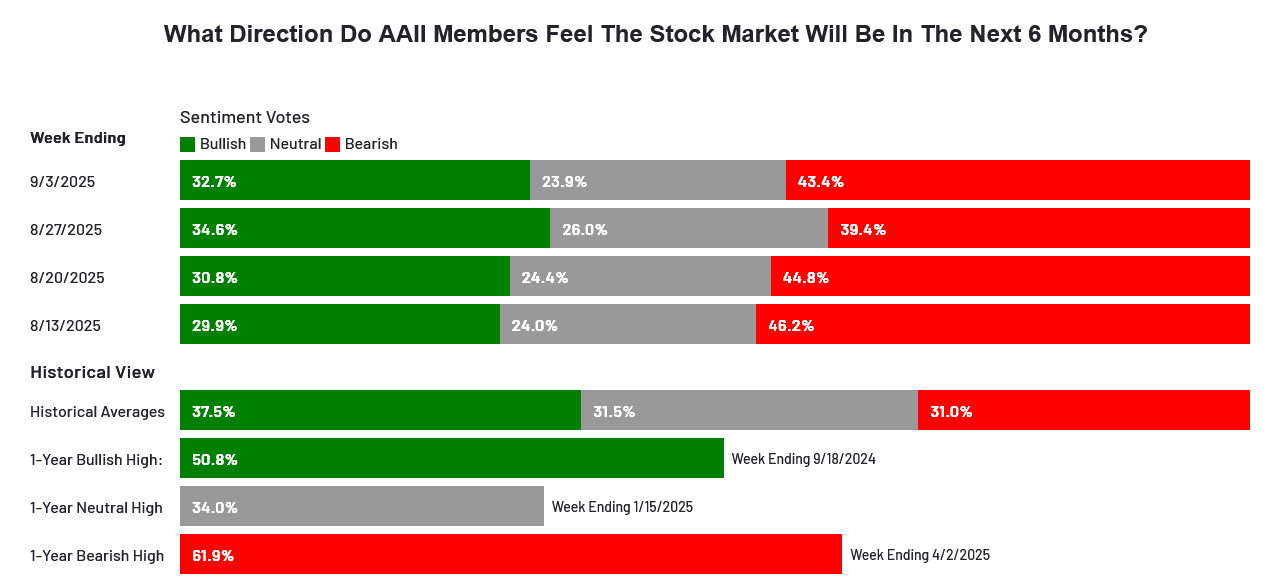 The CNN Fear and Greed Index moved lower to 53 and reads neutral. Breadth improved slightly on the week and reads greed. Latest AAII Sentiment Survey: Pessimism Reverses. The Dow A/D drifted lower from the recent ATH closing at 6963. The VIX was up sharply to start the week and then plunged to close on the lows, up +1.17. The Put/Call closed at 0.67 and reads greed. The 52-week, A/D moved up to +3.30% and reads extreme greed. The Dow closed the week down -0.32%, closing in the middle of an outside week’s range after setting a record intraday high. The S&P traded a record intraday high and settled up +0.33% in the upper end of an outside week reversal and the close is a record high weekly close. The Nasdaq Composite was up +1.14% and the Nasdaq 100 was up +1.01%. The NYSE FANG closed up +2.69% in the top of the range at a new ATH. The Russell was down -0.10% in the top of the range. The 10-year notes rallied sharply and closed on the top of the range at the highest levels since 3 October 2024. The yield on the 10YR plunged to 4.076%.
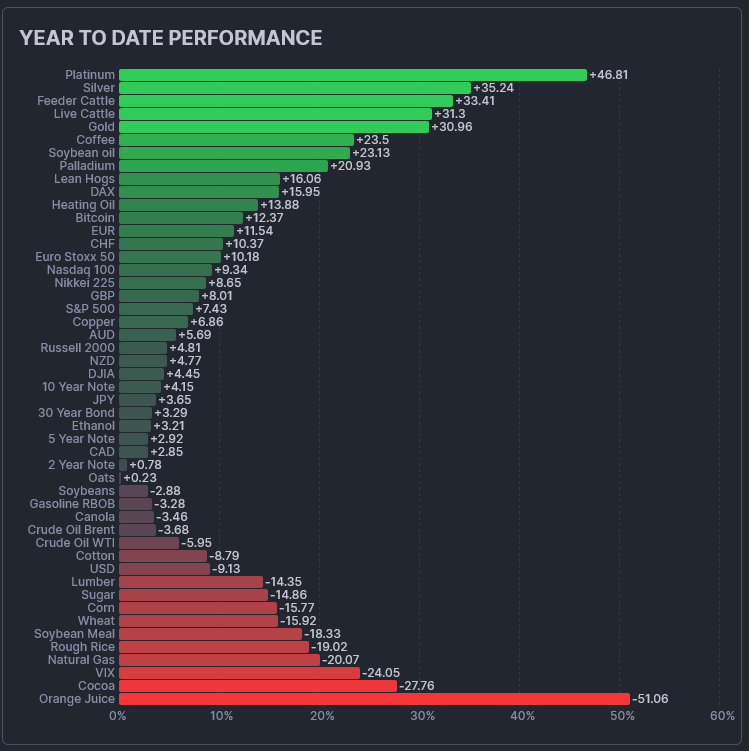
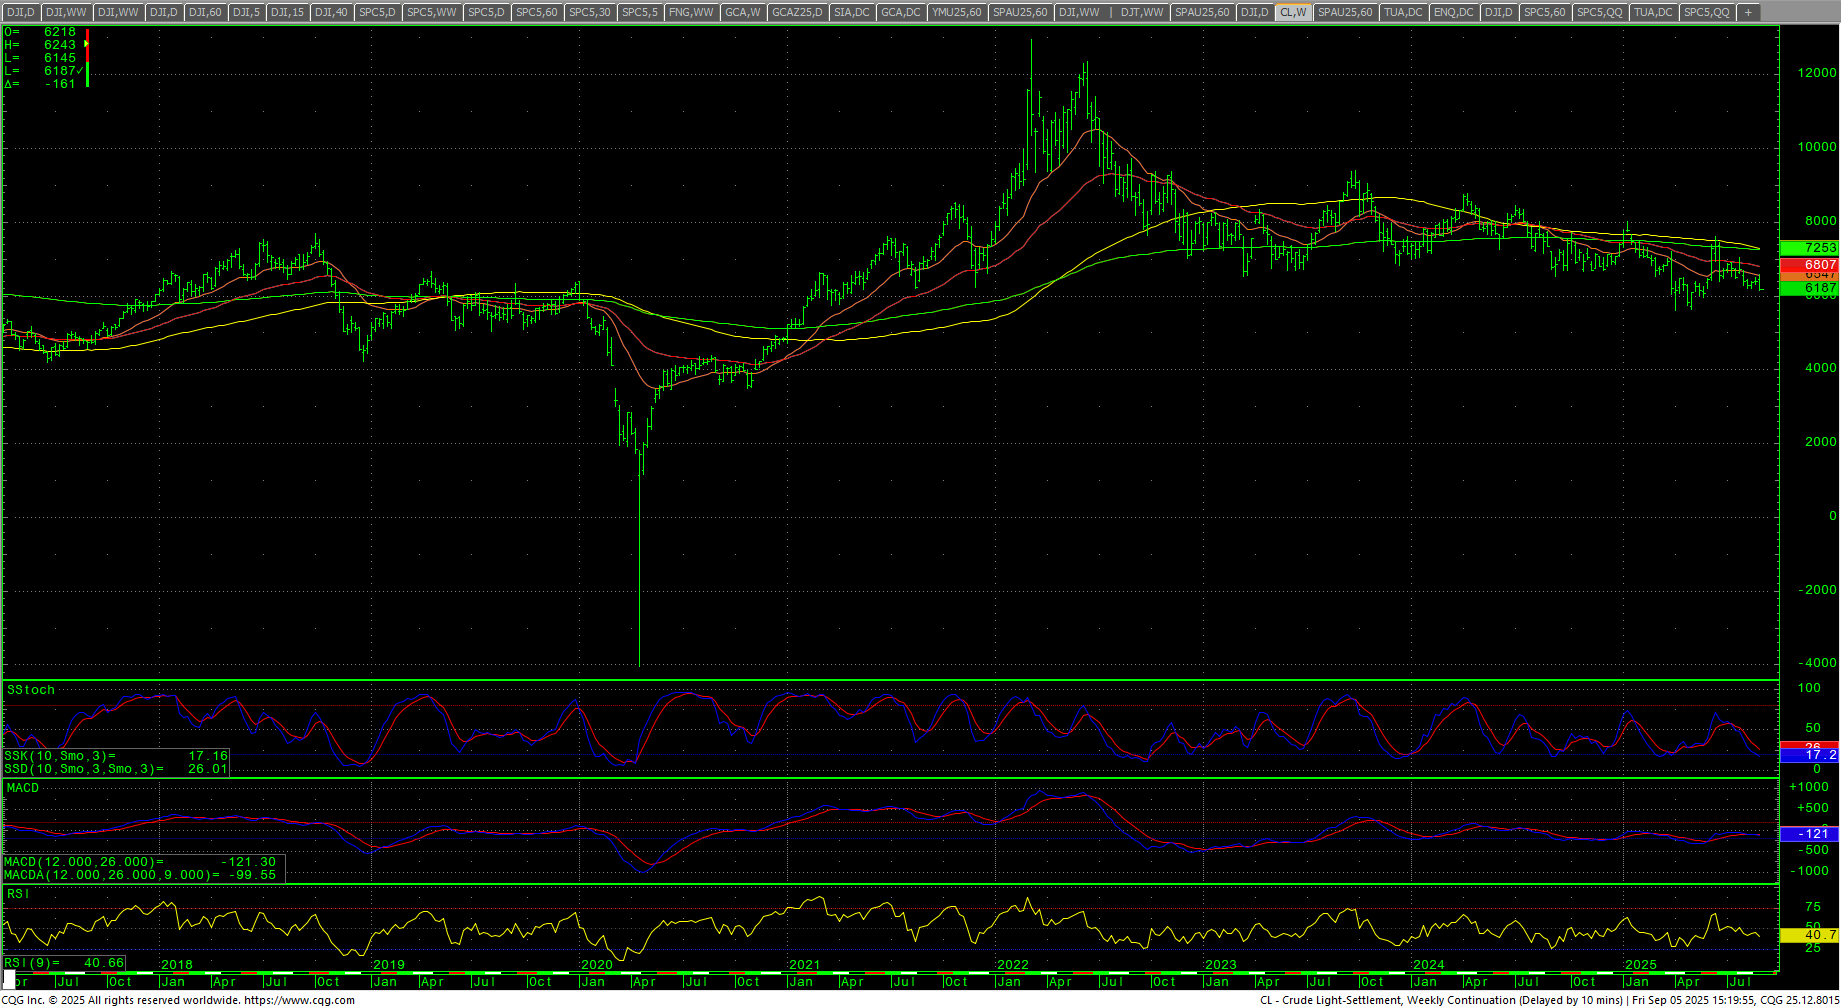
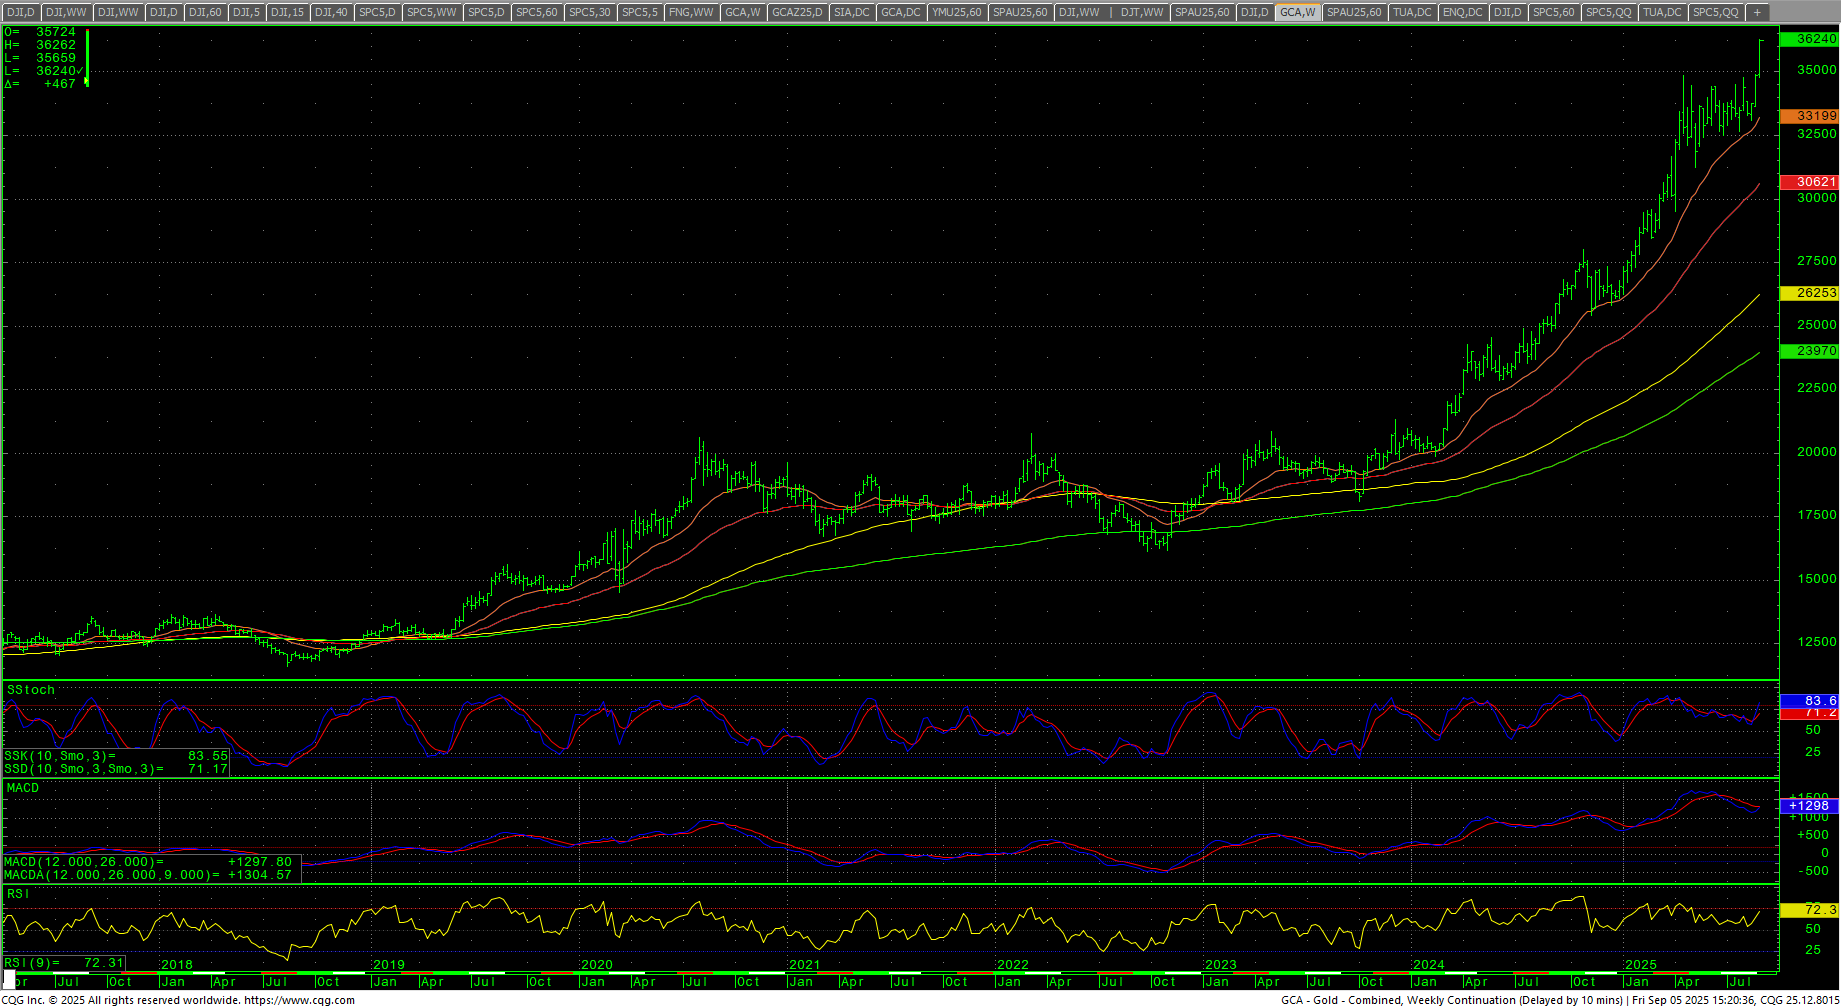
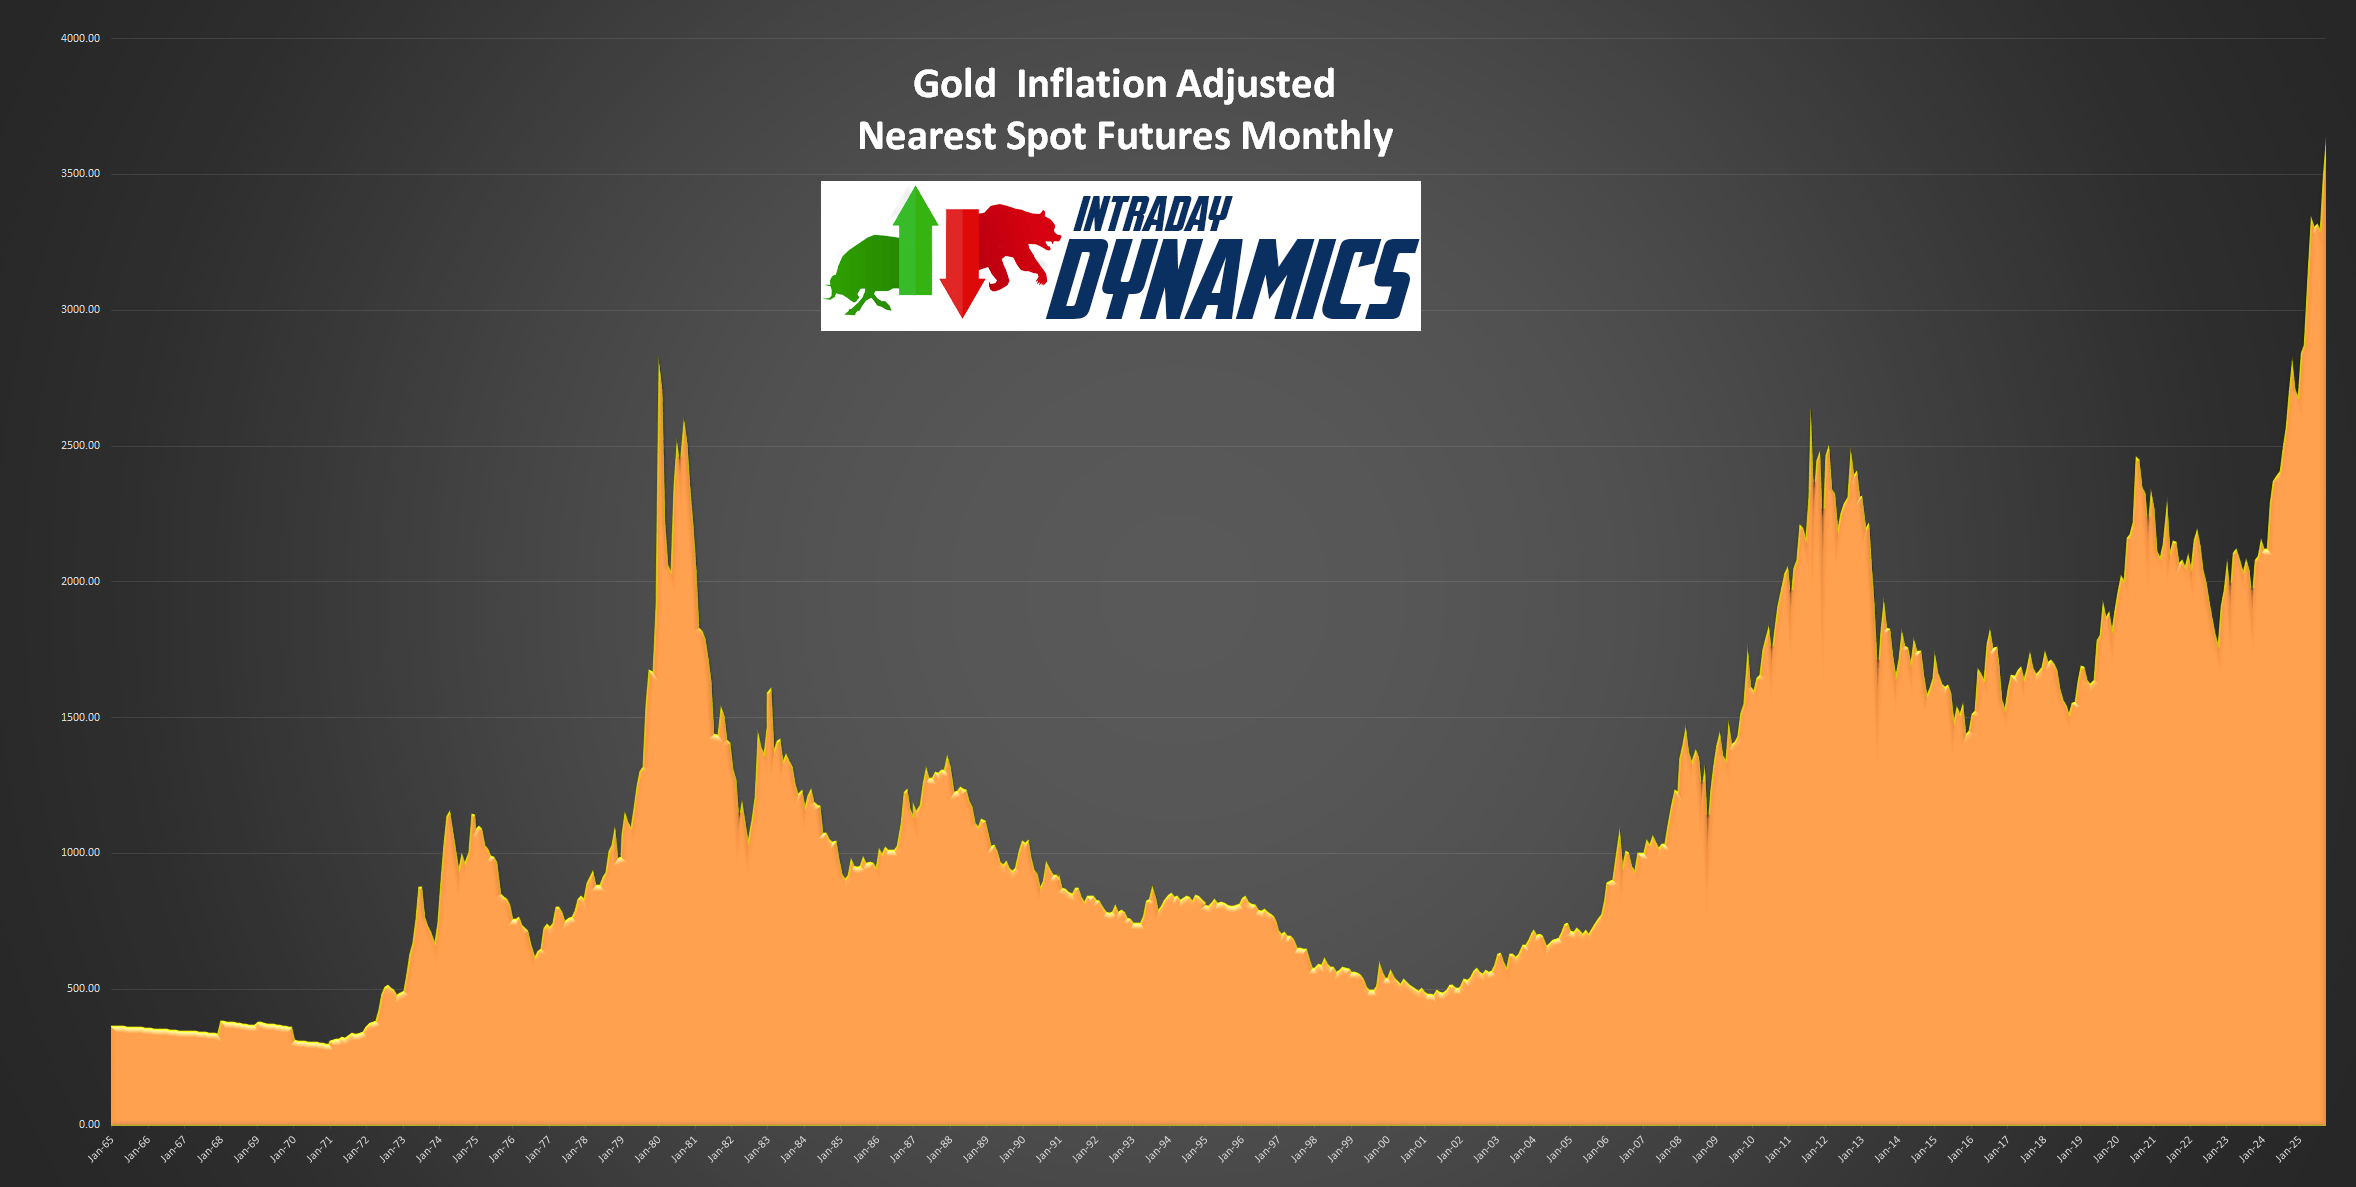 The CRB Index was down -0.38%. Crude oil tried to rally early and then plunged to close on the lows at the lowest weekly close since 30 May 2025. The XLE collapsed with the oil market and failed on the breakout to a new high for the drive the previous week. Gold soared to a record high for the spot futures and settled on the top of the weekly range, up +4.04% as it nears the $3600 level. The CoT for the S&P 500 saw more unwinding from large specs with small specs piling in. The CFTC S&P 500 Non-Commercial Net Positions ended at -161.1K.
Timing Points
We are coming into a massive window of CRITICAL from the 12th through the 19th of September.
- 09/12 *** X critical weekend through
- 09/16-17 *** X critical week to the 19th
- 09/23 ***
- 10/01 ** key to bonds/dollar
- 10/06 **
- 10/13 *** X
- 10/22 ***
- 10/28-29 *** X
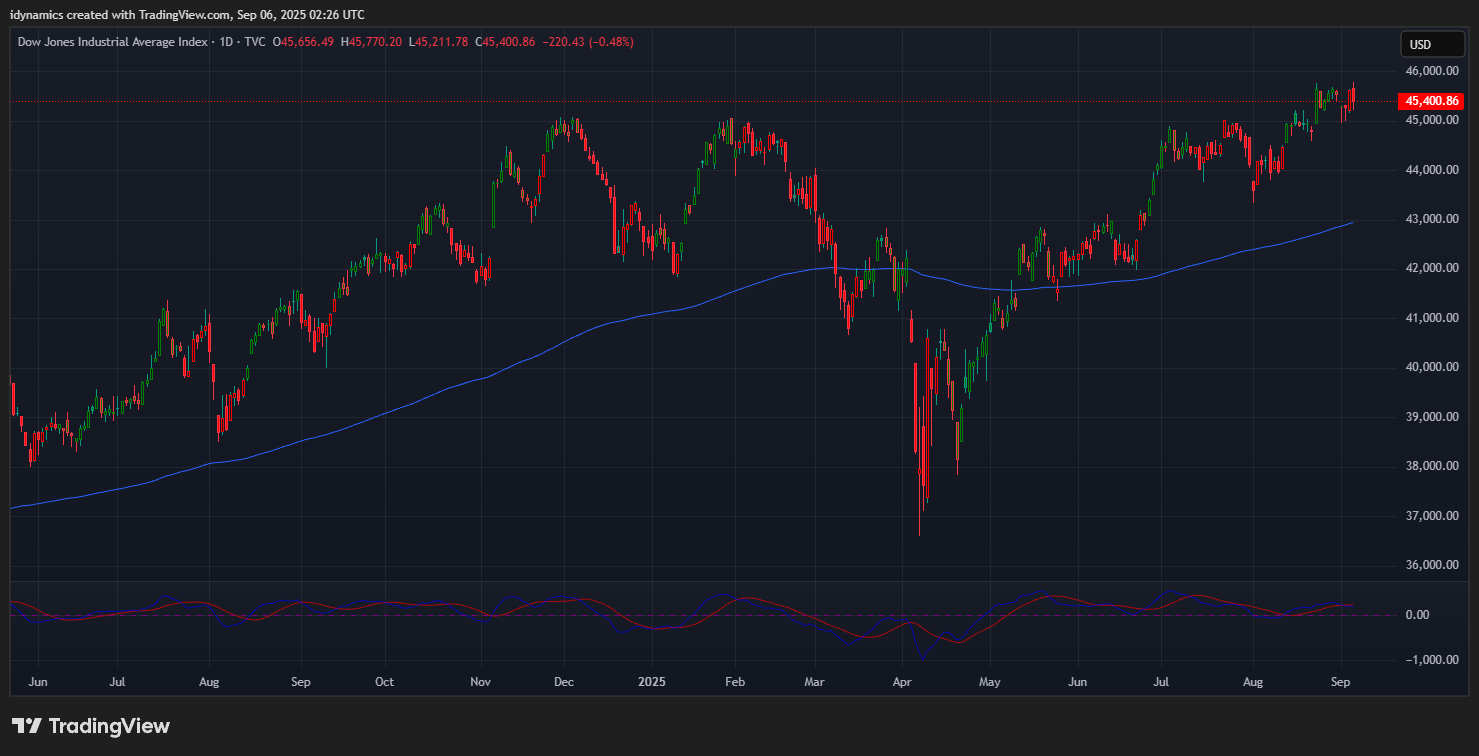
Dow Jones Industrial Average
Dow Jones Industrial Average Weekly H-L-C
T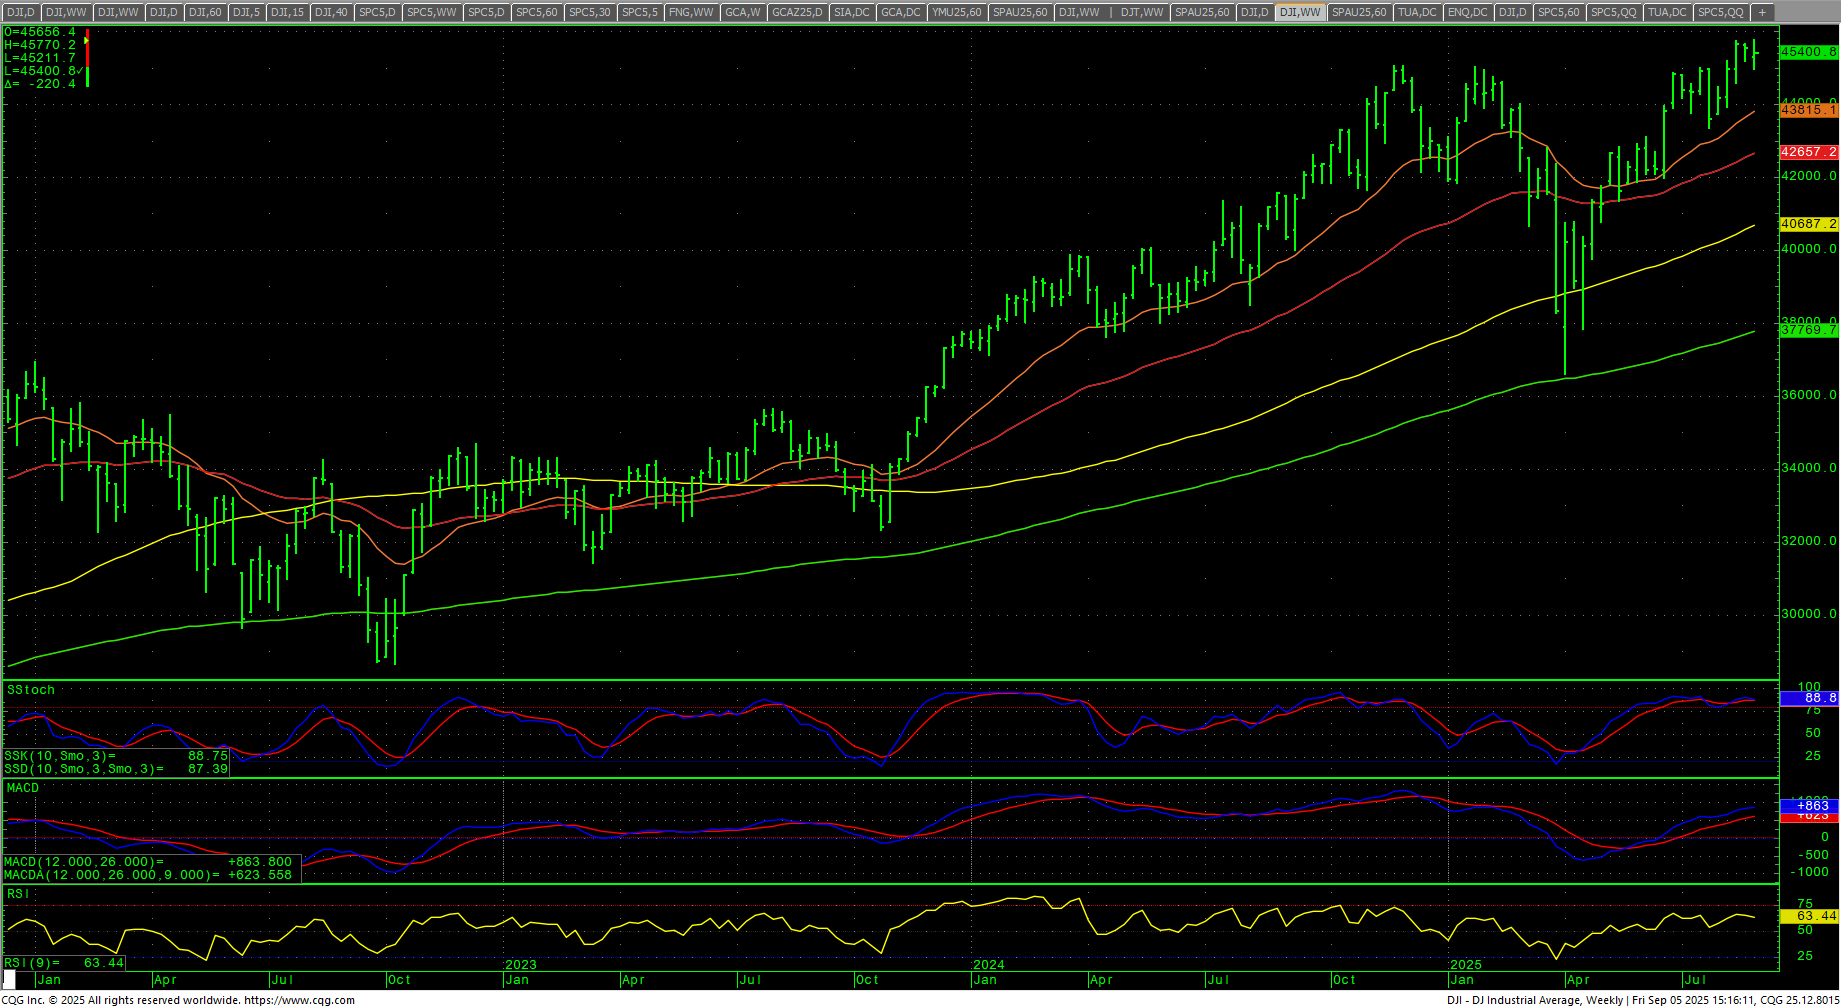 he Dow closed the week down -0.32% in the middle of an outside week’s range after setting a record intraday high on Friday at 45770.20. The daily stochastics and MACD are up with preliminary bearish divergences. The daily RSI is 63.4. The 200-day MA starts the week at 42938.90 and is at record highs. The action leaves the support and resistance numbers mostly the same.
Dow Jones Industrial Average Weekly Candles
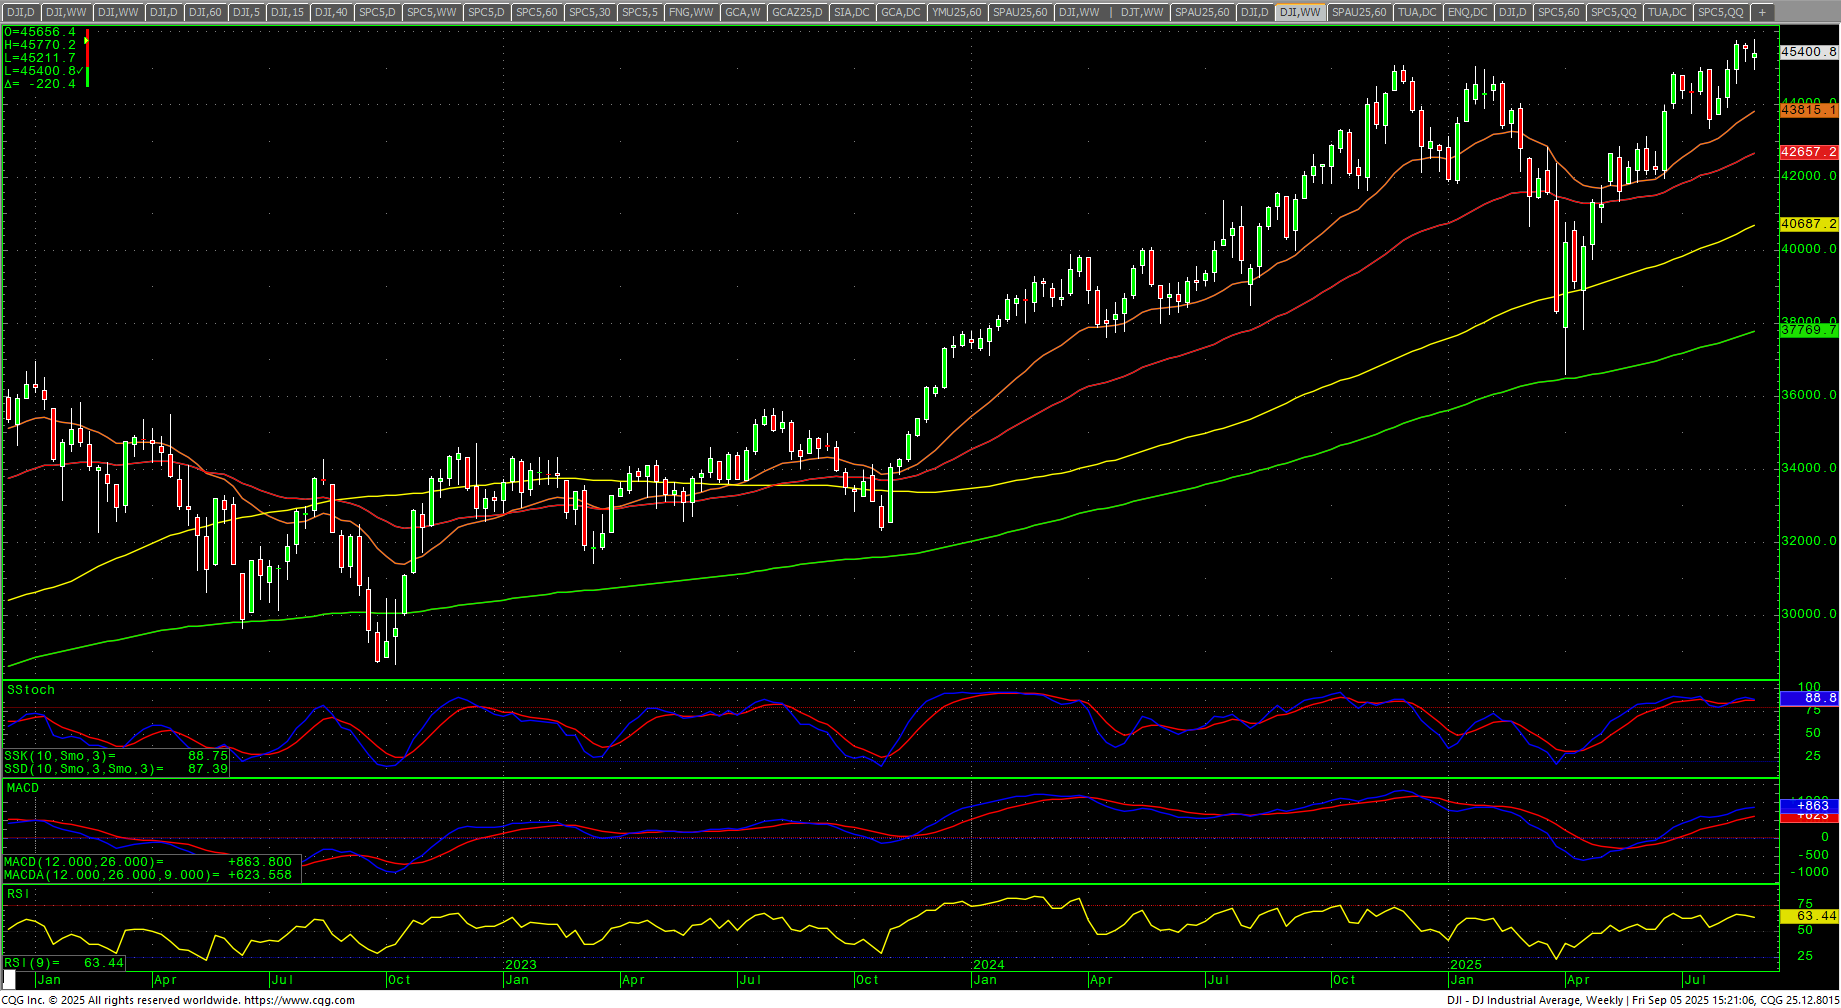 Resistance is 45490 and 45556/45560. A drive above 45560 can test 45638 and 45770/45774. Rallies through 45774 can test 45846 and 45918 with counts to 45990 and 46062. Closes over 46062 setup 46134 and 46206 to 46278. Resistance is critical at 46368 and closes above that level would offer fuel toward longer-term monthly targets in the 47400 level with targets of 46568 and 46954.
Dow Jones Industrial Average Hourly H-L-C
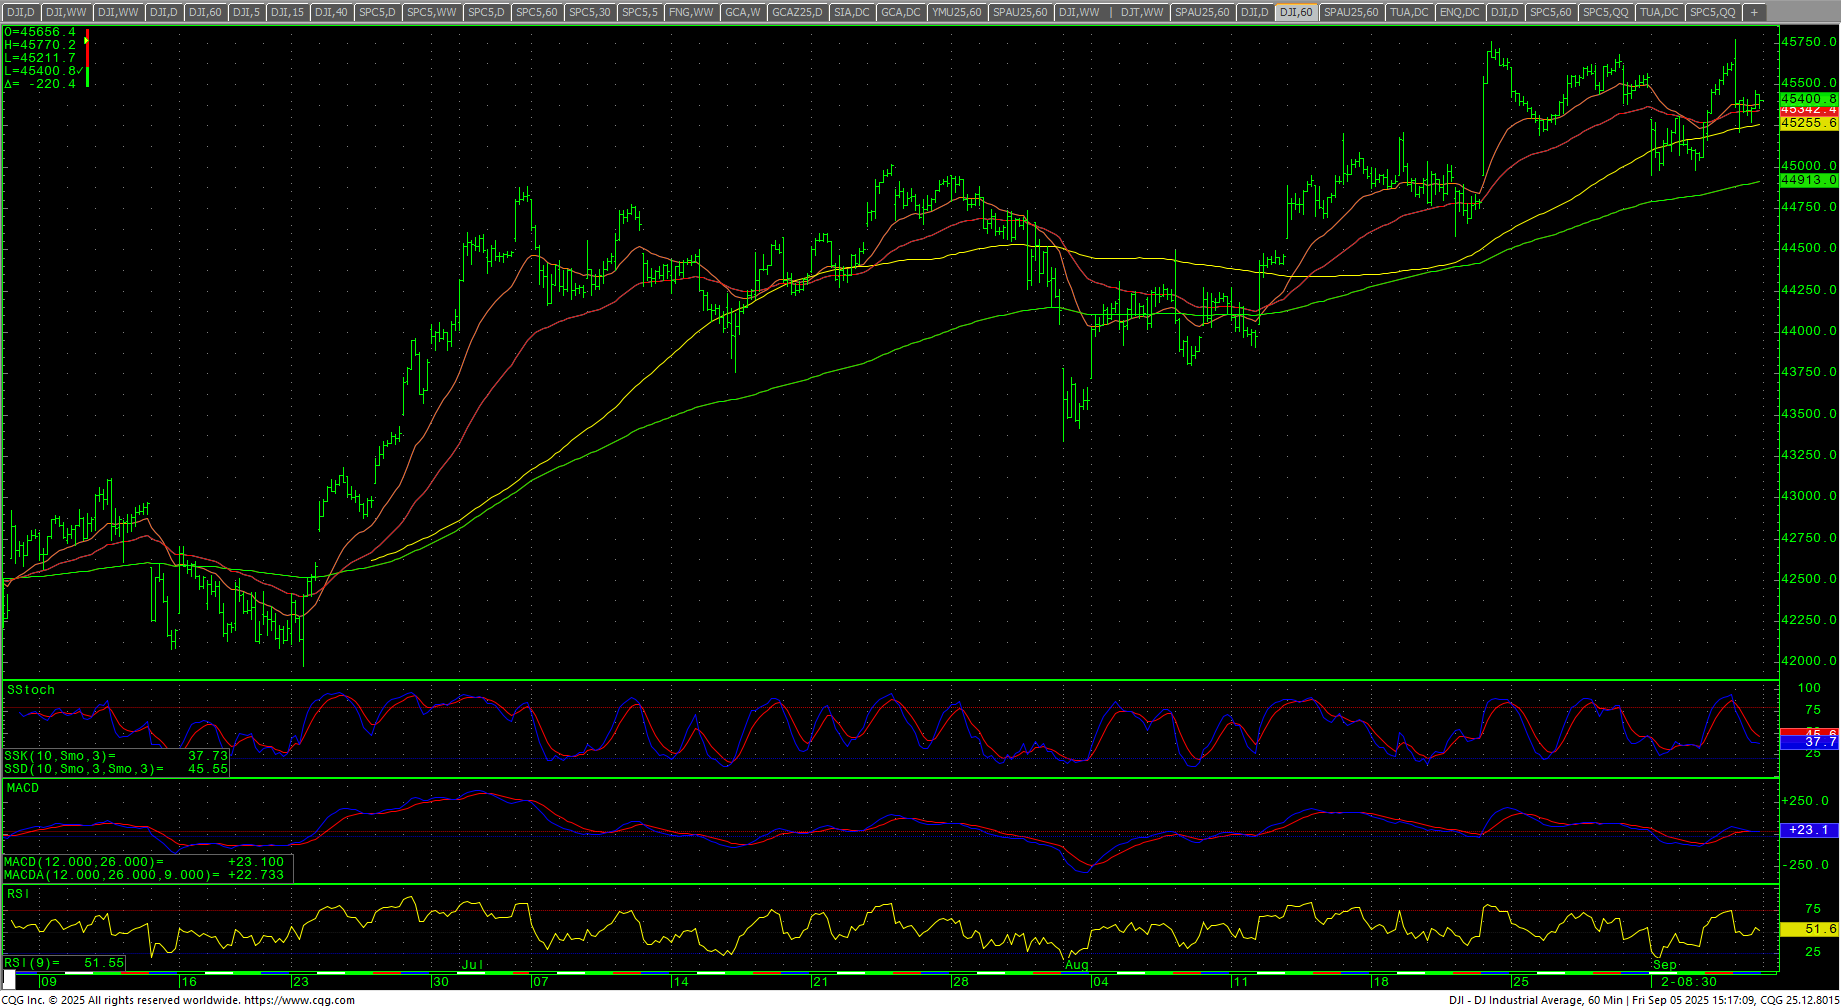 The hourly is slightly oversold on Friday’s close. Support is 45174 and 45034/45039. A break under 45030 sets up 44948 and 44842 with counts to 44555. A near-term break under last week’s lows at 44948 would be the first signal that price is stressed. Under 44555 should test pivotal near-term support at 44333/44322 and 44268/44265. Daily closes under 45265 are near-term bearish and open counts to 43875 with potential to critical support at 43428/43425. Closes under 43425 should minimally test 42928/42875 with counts to 42000/41921.
Dow Jones Industrial Average Daily Candles
| Resistance | Support |
|
|
S&P 500 Cash Index: SPX
S&P 500 Index Weekly H-L-C
 The S&P set a record intraday high on Friday and closed out the week at a record high weekly close after setting a daily ATH high close intraweek…ending up +0.33%. The daily stochastics and MACD are up with preliminary bearish divergences. The weekly has hooked higher from overbought levels with a preliminary bearish divergence. The daily RSI is 57.30. The hourly is neutral on Friday’s close with a bear flag forming. The 200-day MA is 5975.61 and at record highs. The SPY set an ATH Thursday before a slight break Friday. The action leaves the technical levels mostly the same.
SPY Weekly Candles
 Resistance is 6488 and 6498/6500. Rallies over 6500 should test 6511 with counts to 6532/6533. A drive over 6533 sets up 6584 with counts to resistance at 6602. A breakout over 6602 sets up 6638 and 6692. A breakout with closes over 6692 counts to 6764 and 6800. Closes over 6800 can carry to 6872 and 6908. Closes over 6908 have counts to 6944 and 6980 through 7016.
S&P 500 Index Hourly H-L-C
 Support is 6410, 6372 and 6334/6332. A breakdown under 6332 should minimally test 6292/6288 with counts to the hourly double bottom at 6212/6201 with potential to 6132. Closes under 6132 setup potential to 5884 through 5819. A breakdown with closes under 5819 can carry to 5683 with full counts to critical near-term support at 5483/5480. Daily closes under 5480 are bearish to 5259/5235. Closes under 5235 open counts to 4995 with full potential to 4874/4835.
| Resistance | Support |
|
|
Charts courtesy of CQG, Inc., CNN, Koyfin, Trading View and AAII