TECHNICAL ANALYSIS (by Intraday Dynamics)
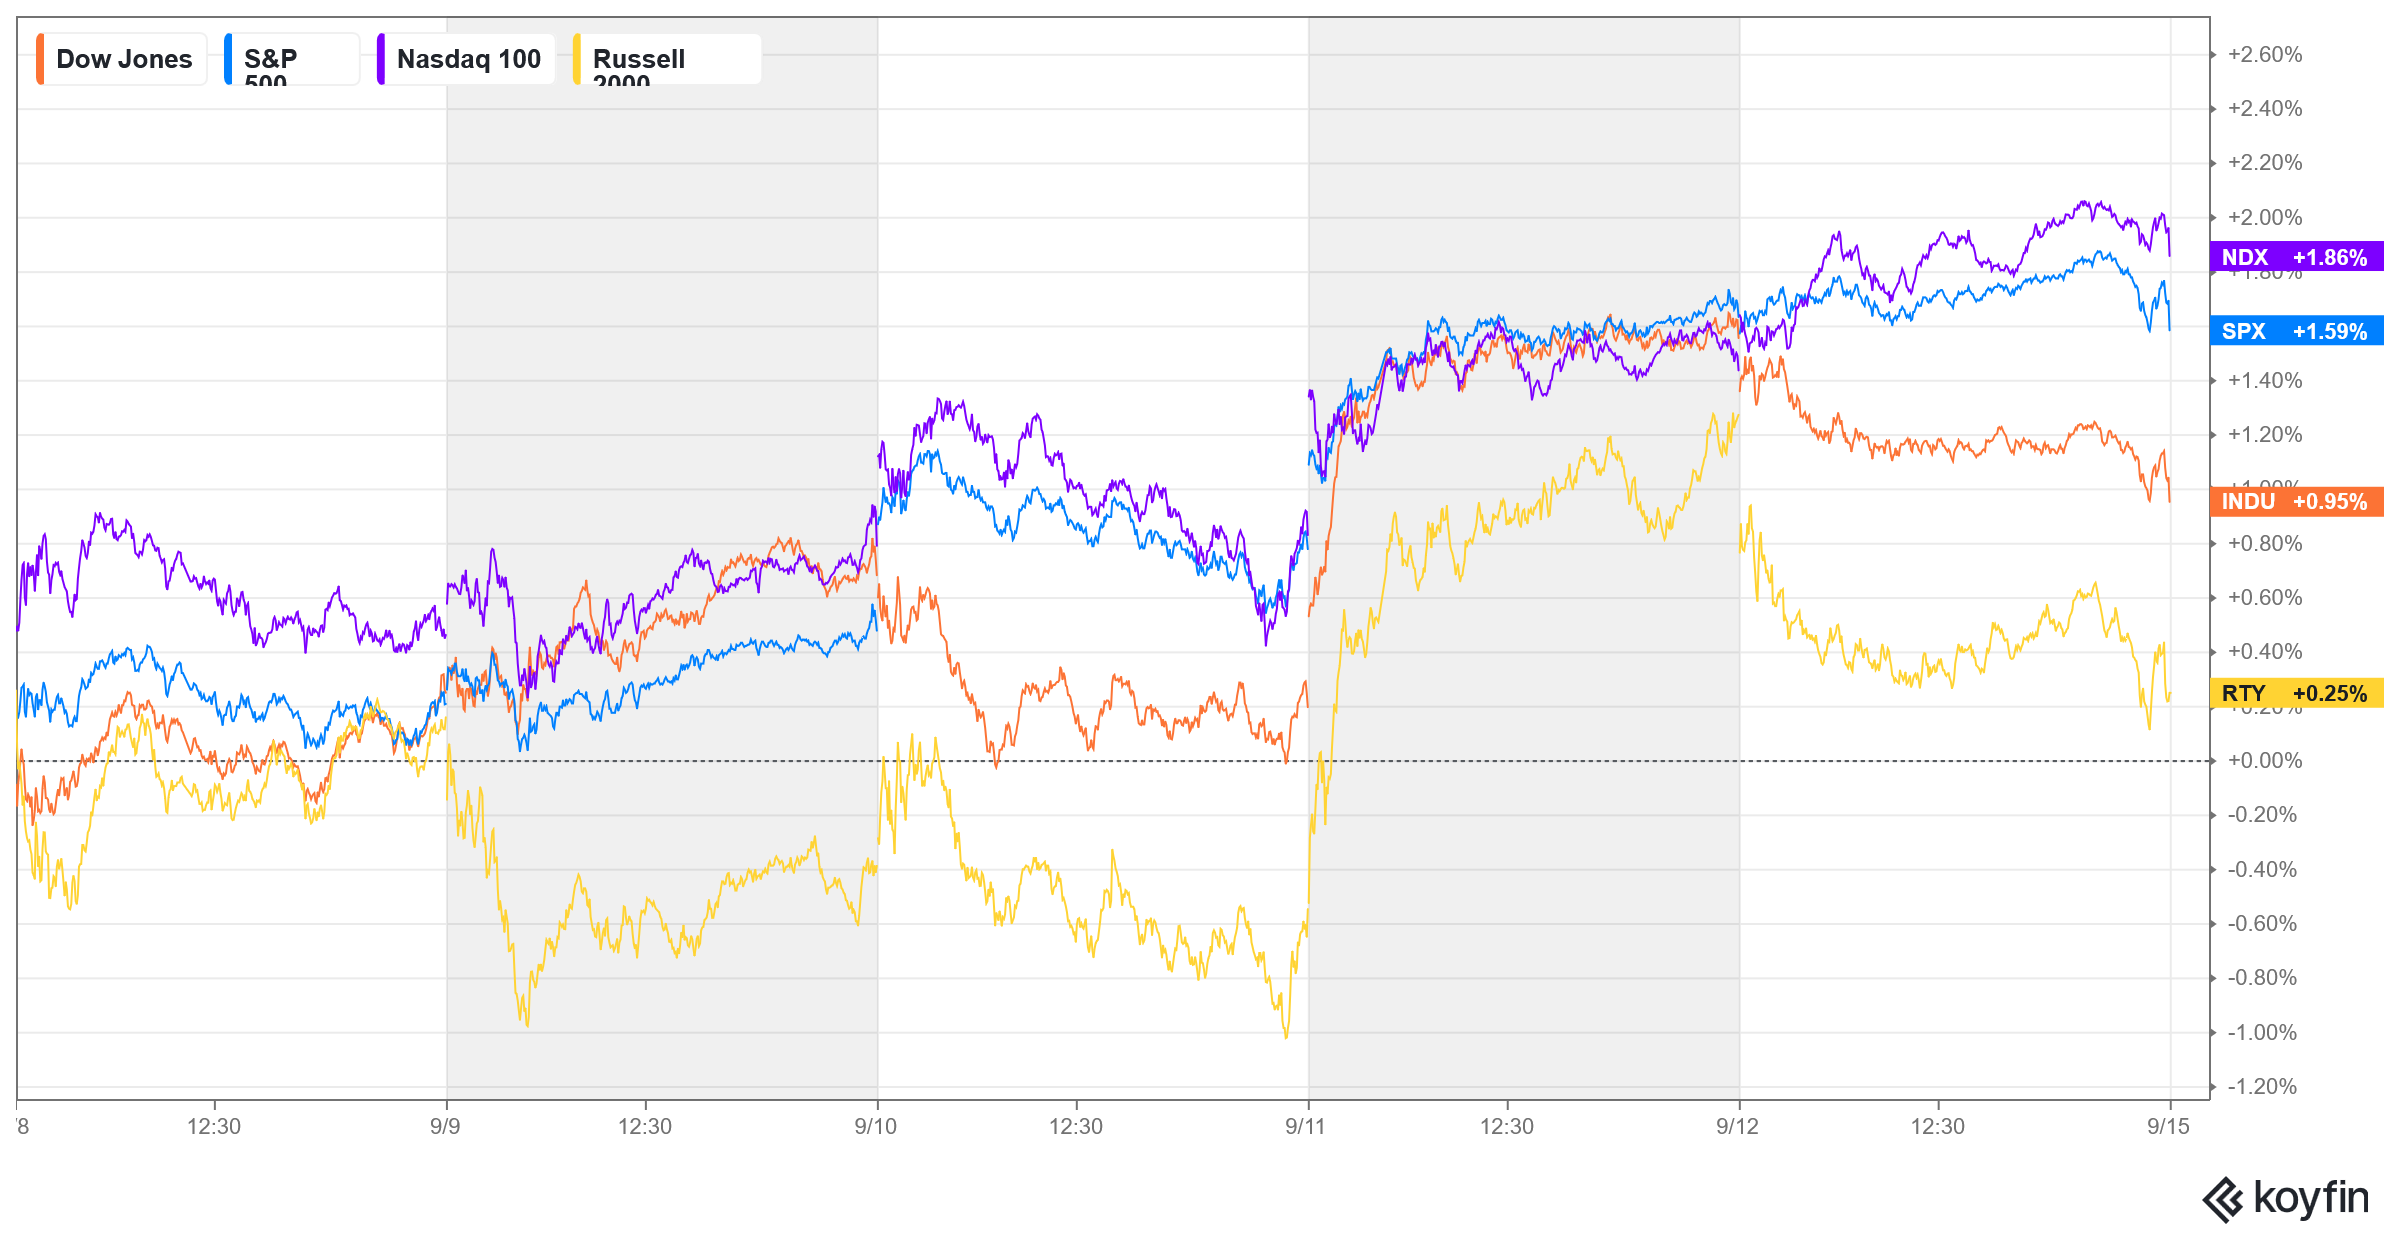
Major Indices Week of September 12, 2025
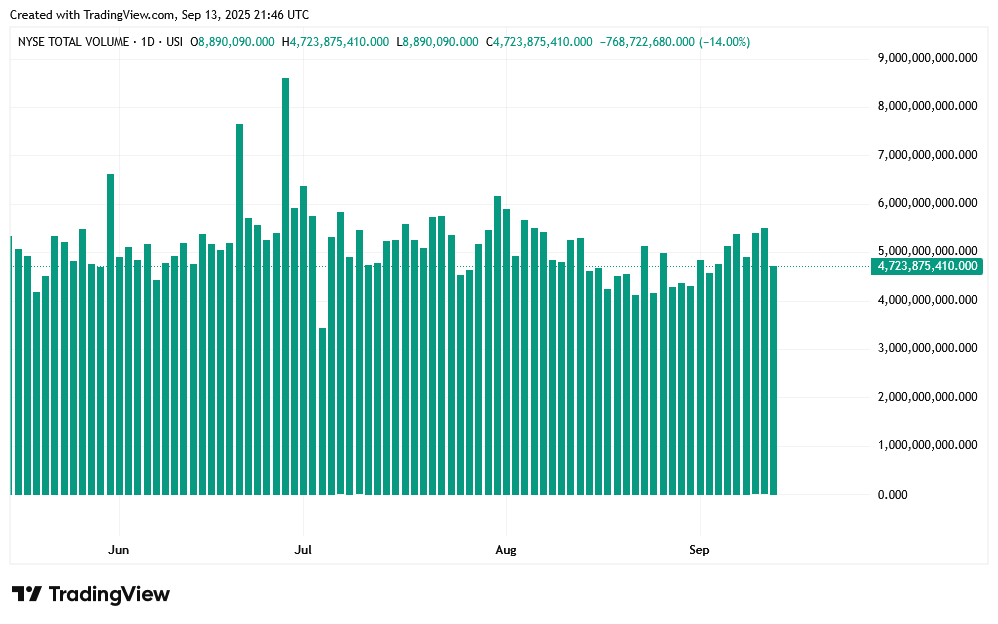
 NYSE Volume
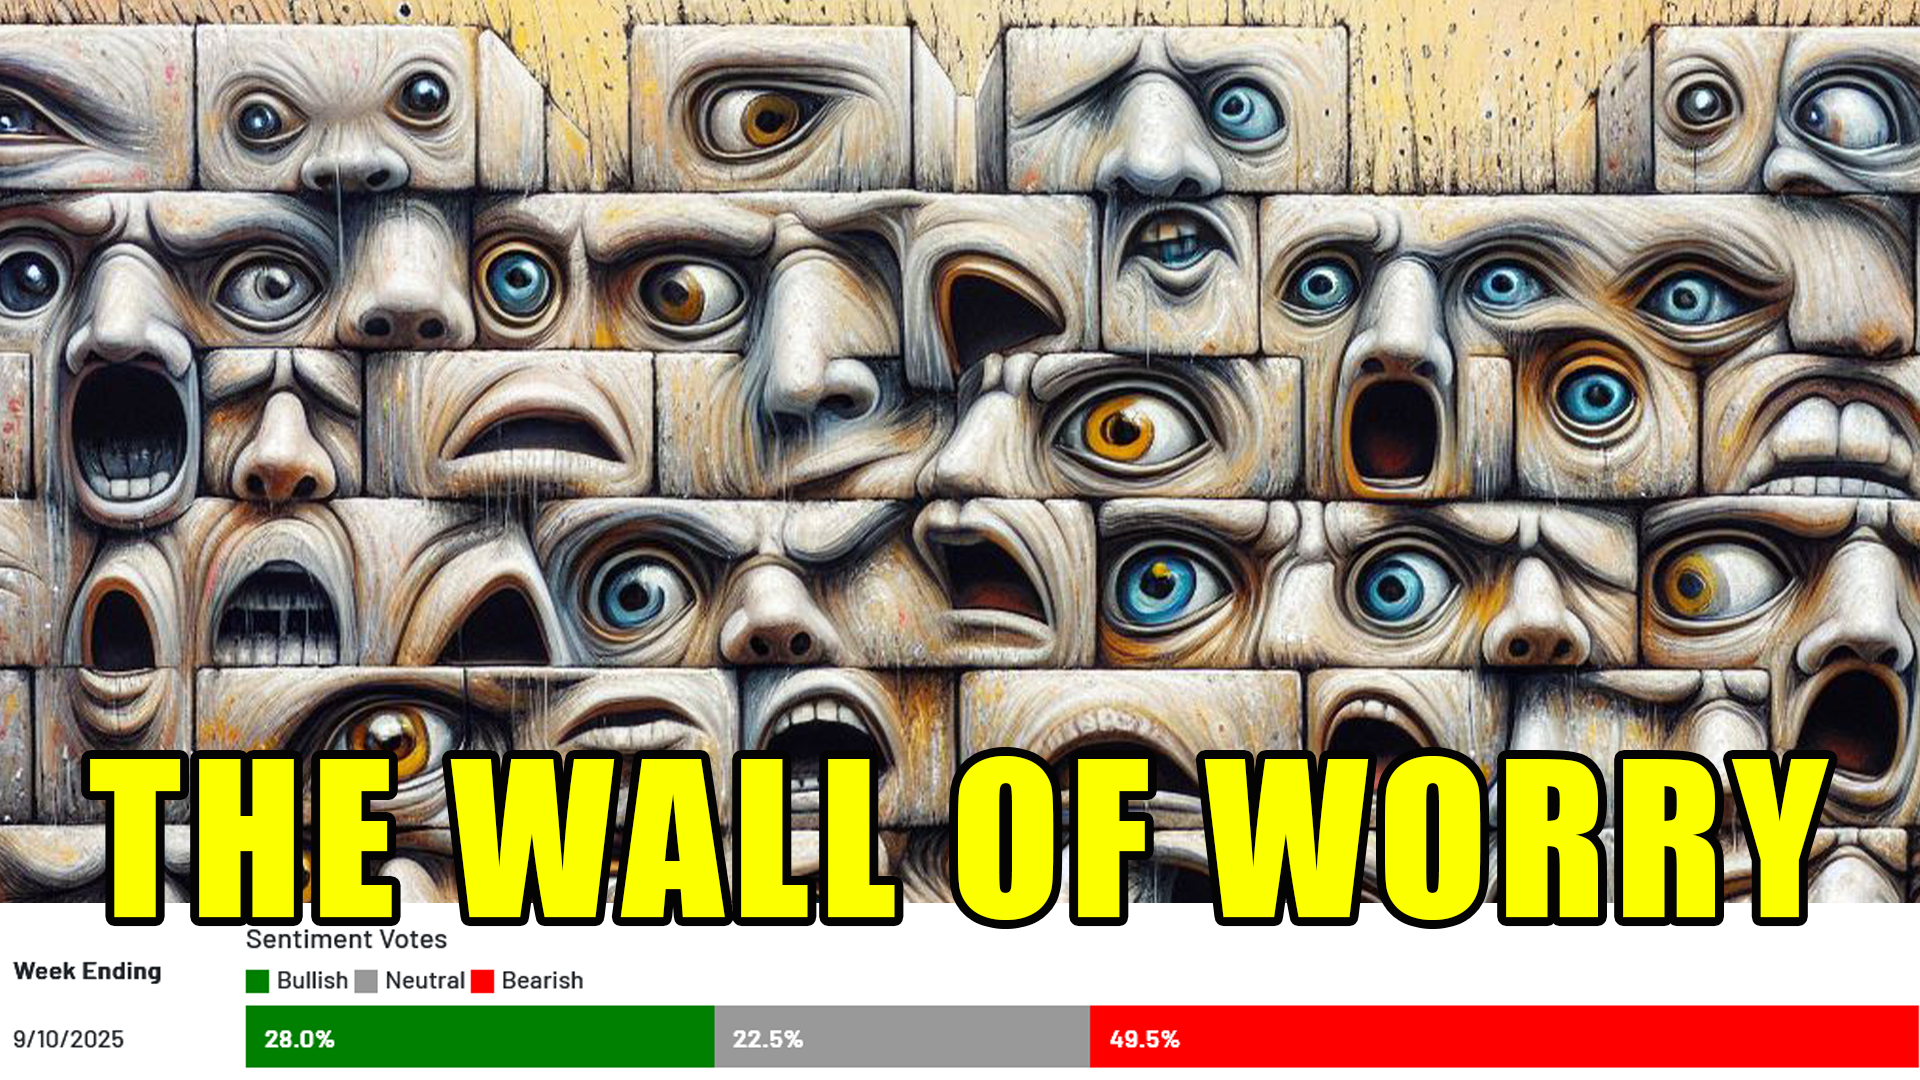
 As goes tech, so goes the market. Stocks continued to climb the wall of worry to record highs with the main focus of the week on inflation data, which was mixed, unemployment claims which reached a four year high and bets on the rate cut coming this week in critical cycle timing. The week’s fundamental data is starting to look a lot like Stagflation is in the early stages.
 This week marks CRITICAL CYCLE TIMING and is as significant as the February time period earlier this year.
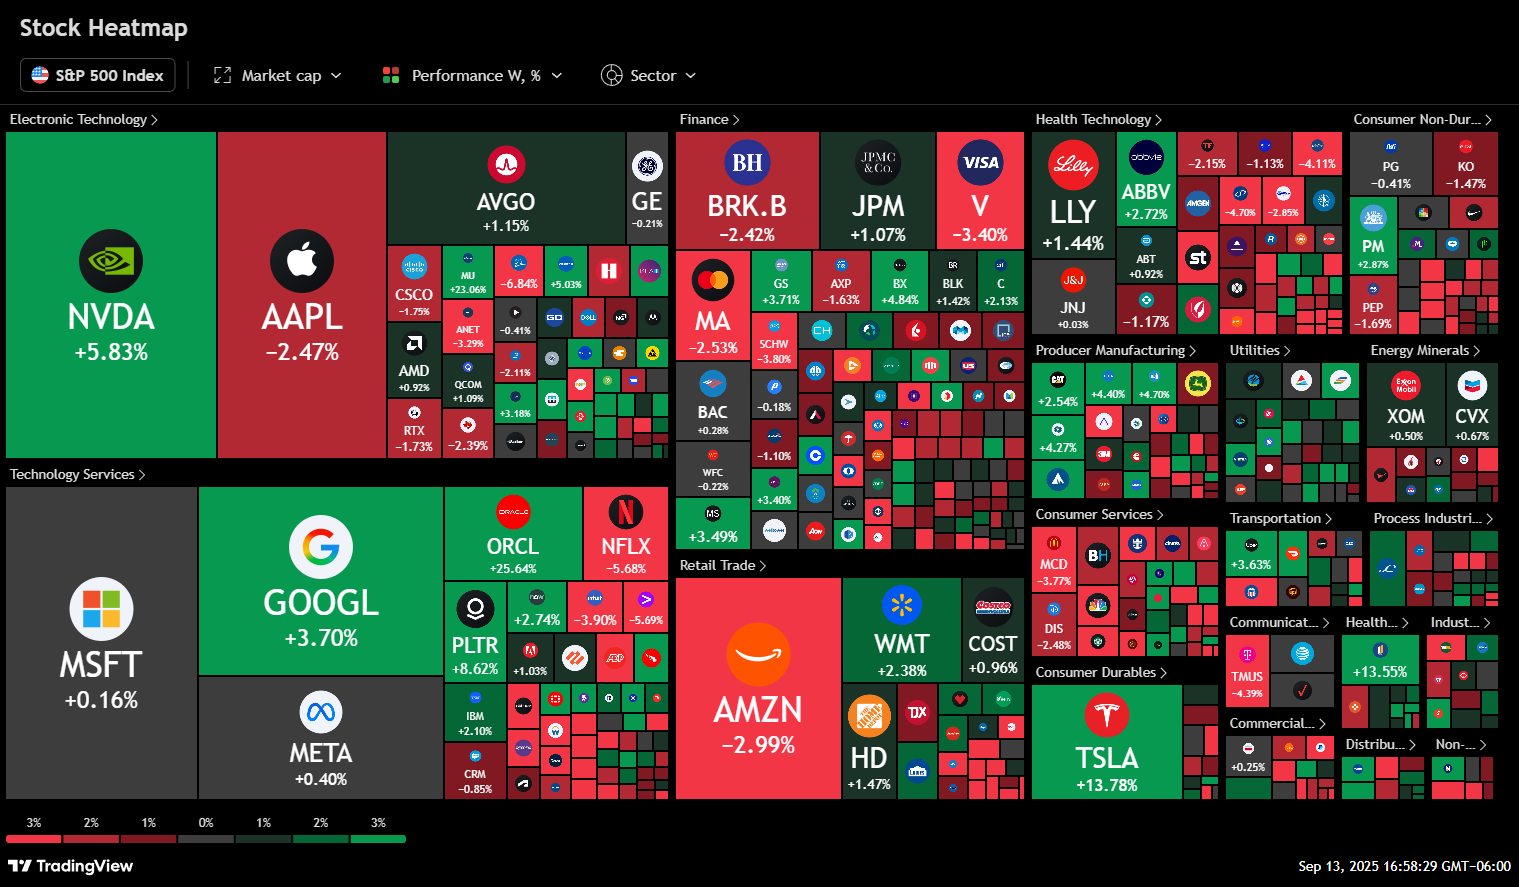
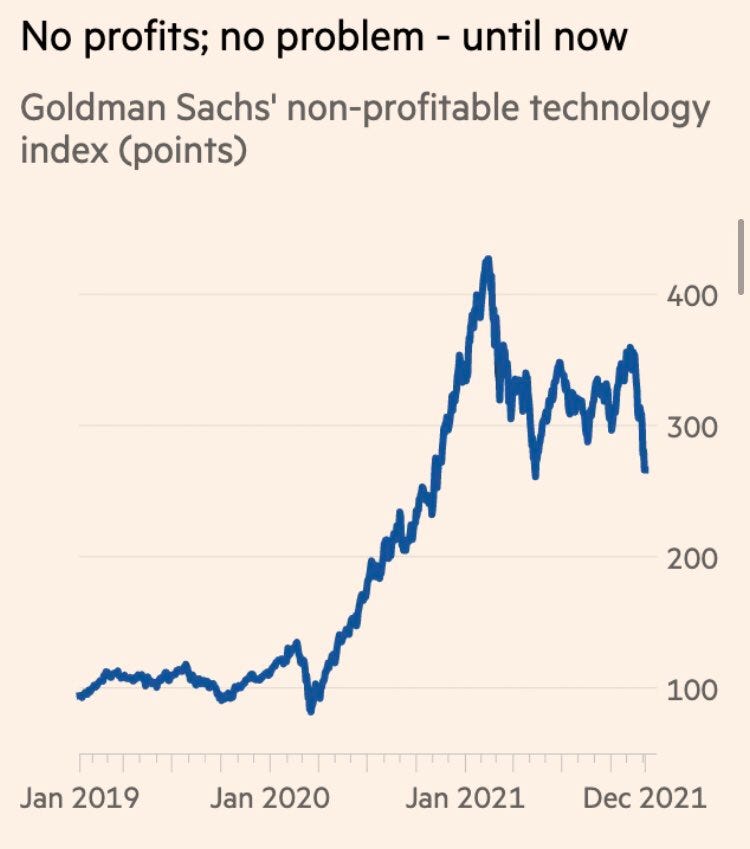
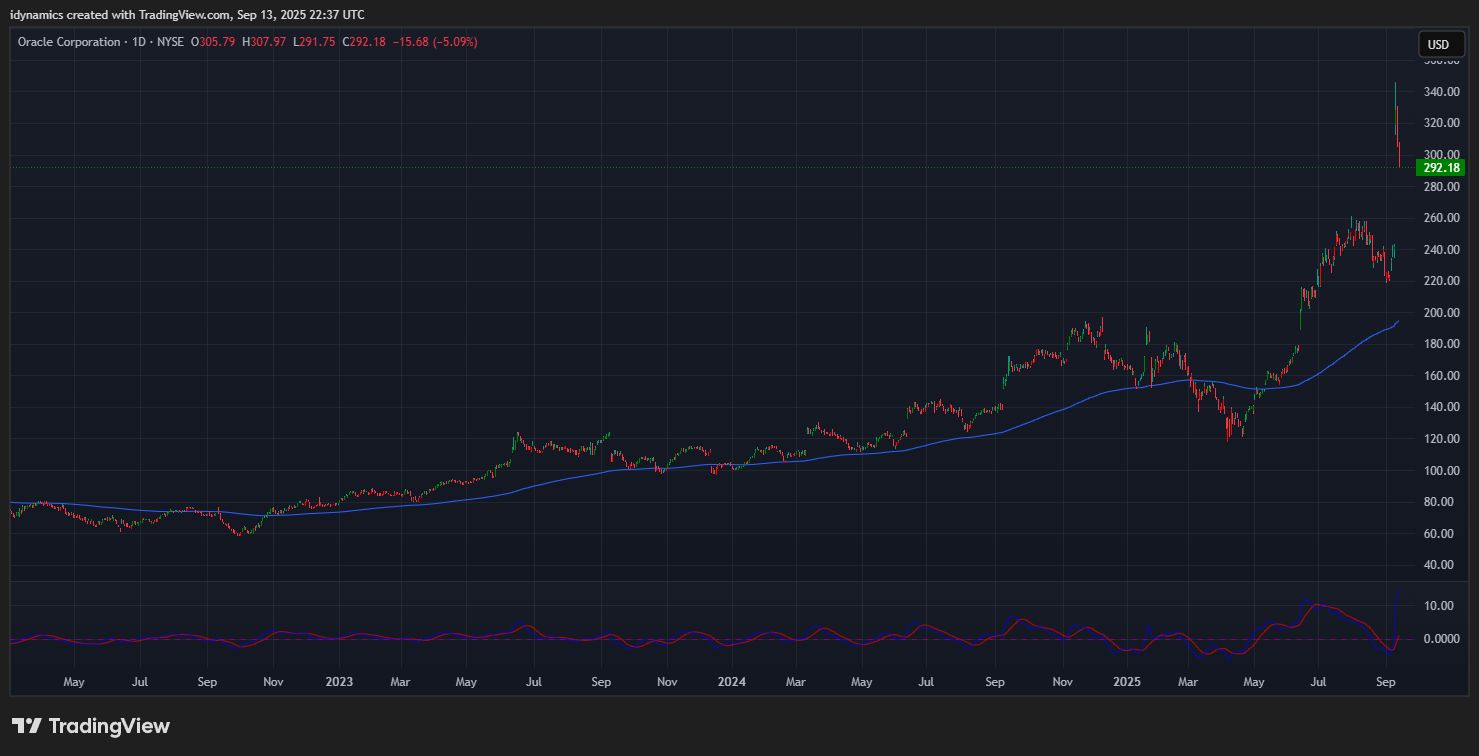
The other big factor on the week was Oracle ($ORCL) which exploded 40% higher in Wednesday’s session. As pointed out last week, there simply are no traditional indicators of topping action such as overblown sentiment and manic volatility. Indeed, it is the opposite as Google searches still show high volume for searches such as “Bubble” etc.
Is the $ORCL move a bubble sign? Is AI really more overdone than the dot.com bubble? As the author of this post states:
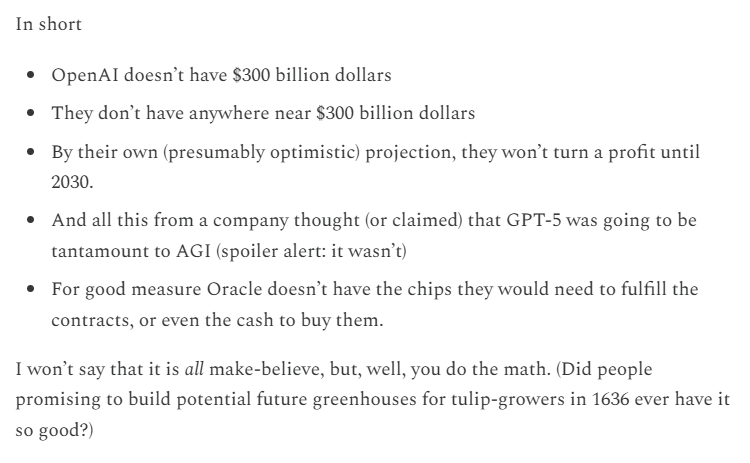
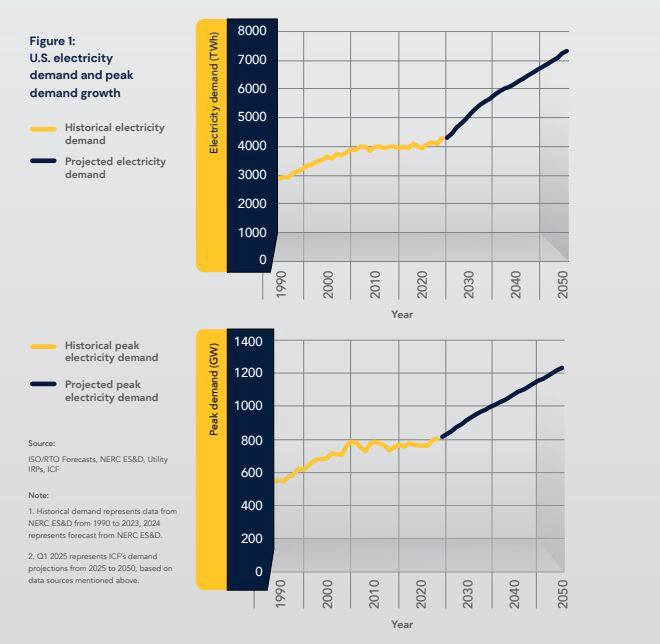
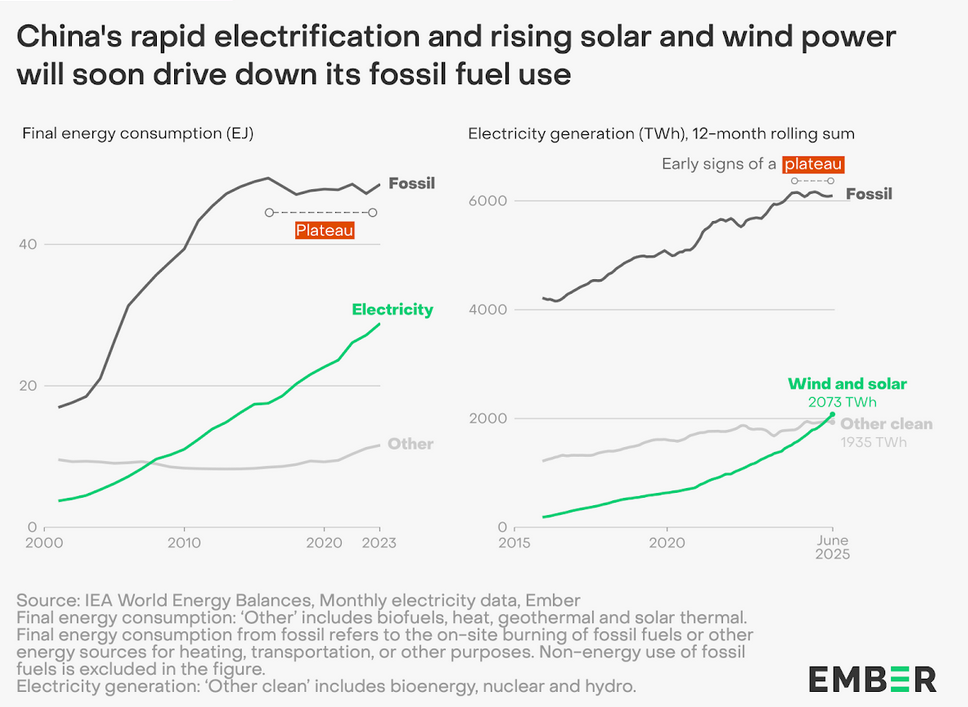
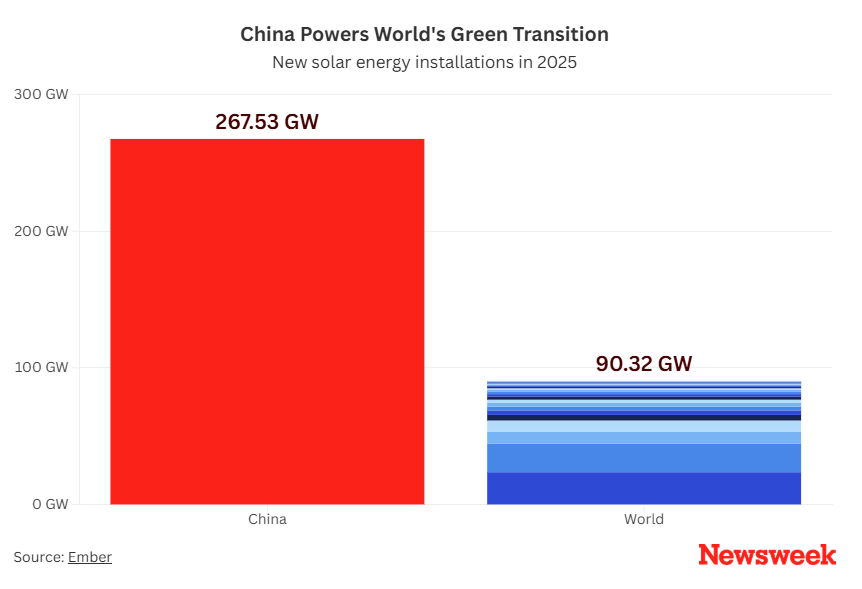
The clear problem facing “AI,” outside of the reality that there is no ROI…is energy for the predicted “data centers.” With the USA turning its back on renewables, this leaves China out front of the planet when it comes to energy production. China owns the renewable energy space…thus, they own the AI race.
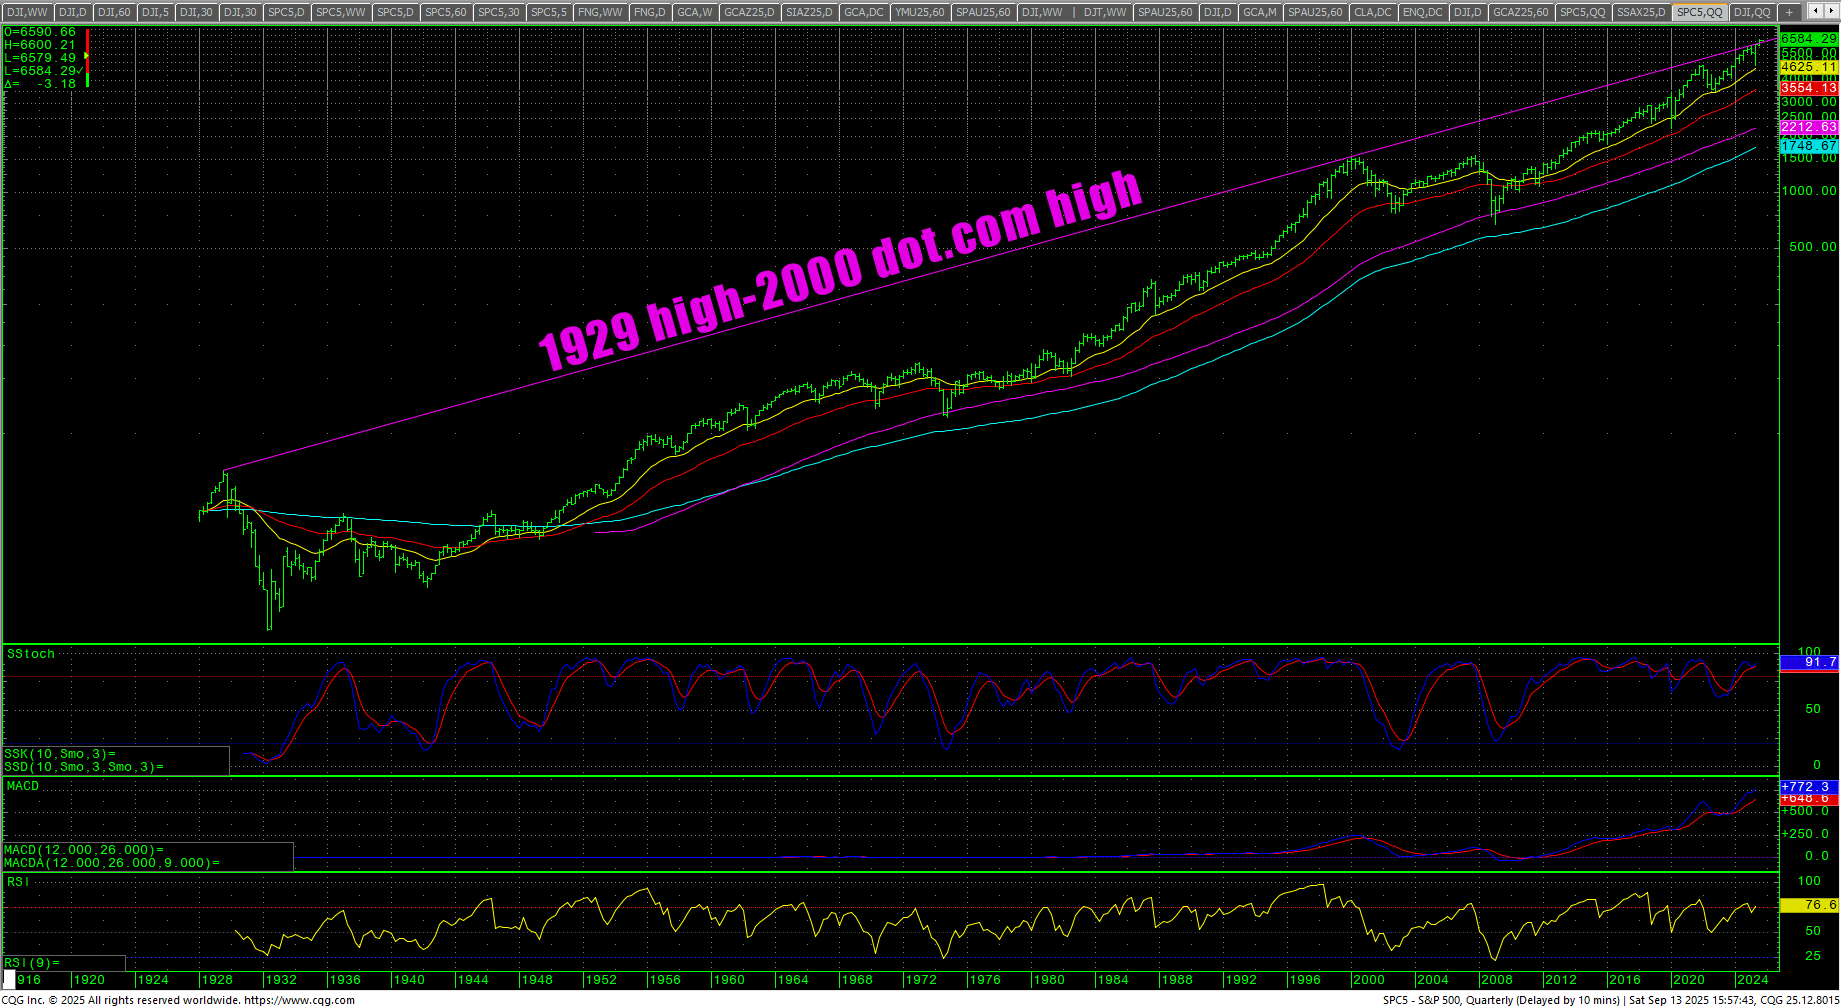
 Yes, the markets are extremely overvalued/inflated right now…but sentiment is not manic, and we are not seeing the type of whipsaw volatility that comes when a major top is in process. The AAII still has more bears than bulls and every selloff brings players into the puts. Remember that the top 10% of the country owns 93% of the stock market. They hold 70% of the total value of stocks. The game now is how can they keep ten stocks up with promises of some imaginary AI Revolution. Ten stocks that make up 40% of the market. TEN. With the SPX moving above the trendline from the 1929 highs through the 2000 dot.com highs, will it now “melt up” to some of the Street targets being bandied about now such as 7000? Dow Jones 50K? 55K?
SPX Quarterly H-L-C
 The MOVE volatility index plunged sharply from the recent jump and bets ahead of this week’s FOMC is 100% for a cut of at least 25bps. A 25 basis point cut will likely be a buy the rumor sell the fact event. 50bps is a coin toss. 50bps might create even more euphoria. Conversely it could induce fear that inflation will come roaring back.
MAGS+ORCL+PLTR+AVGO Daily Candles
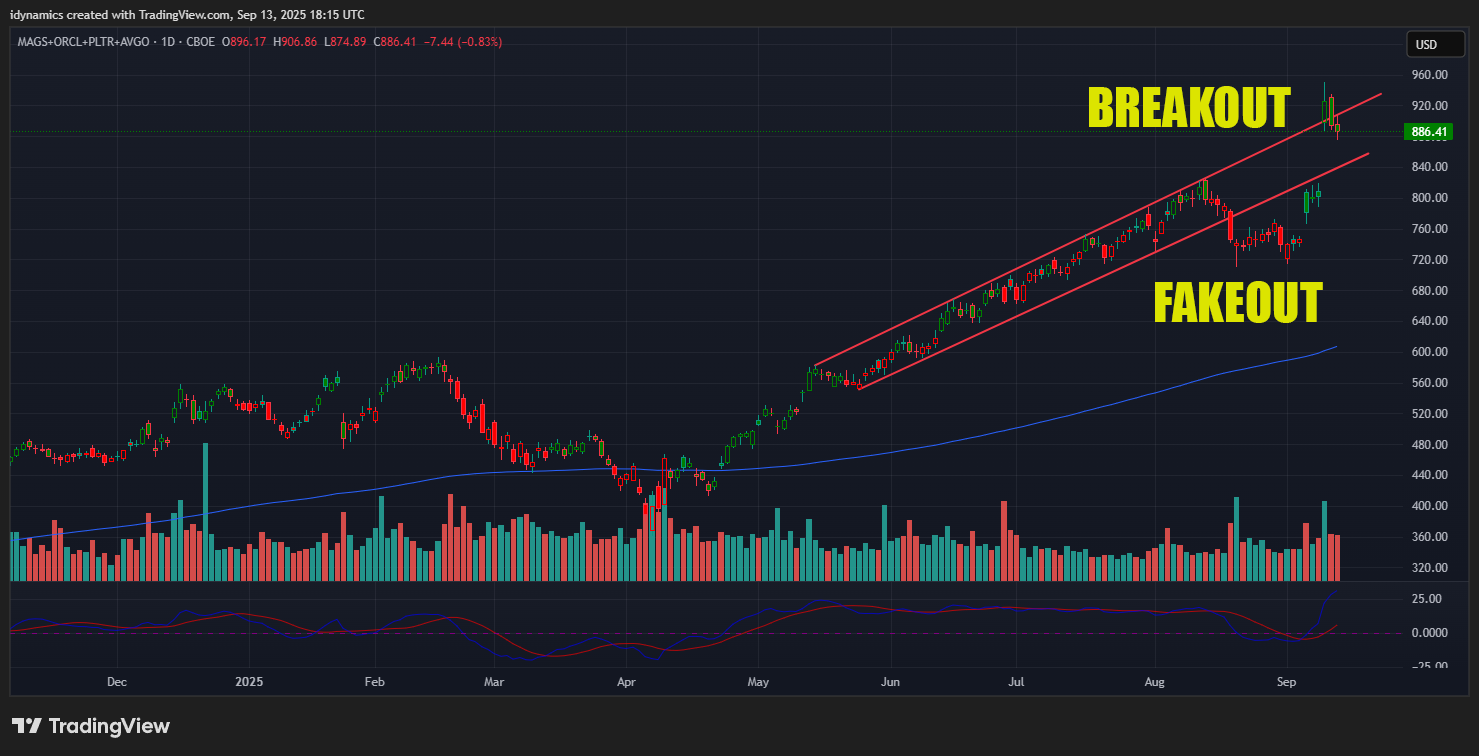
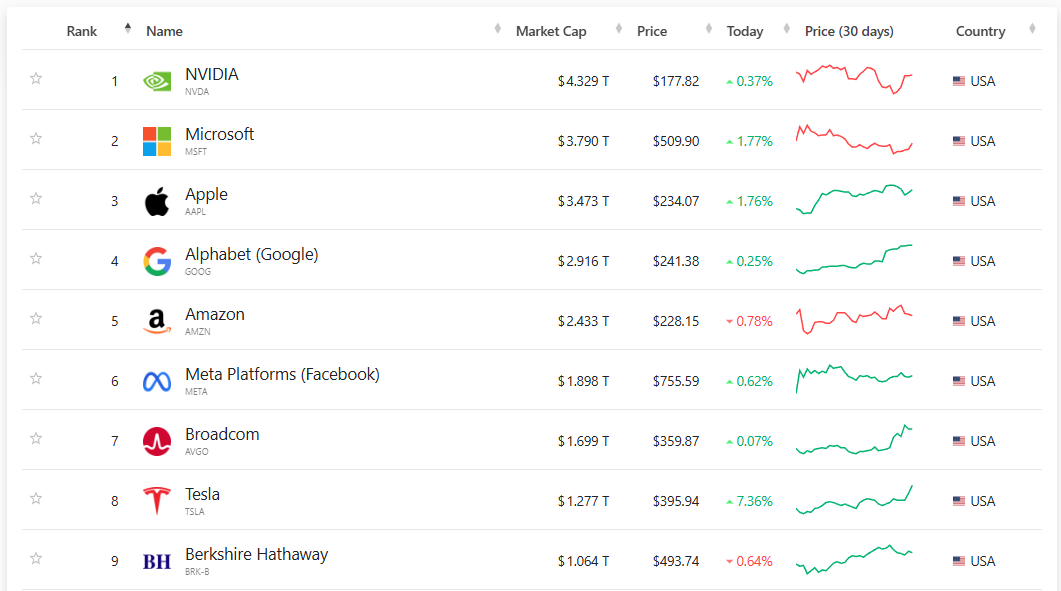 The combined chart of MAGS+ORCL+PLTR+AVGO jumped sharply Wednesday as $ORCL exploded +40% and ended the day up +36%. Oracle and JP Morgan are now fighting to join the +$1T market cap club where nine stocks currently hold the top slots. The combined value of the “Mag9” is larger than ALL of the European markets COMBINED.
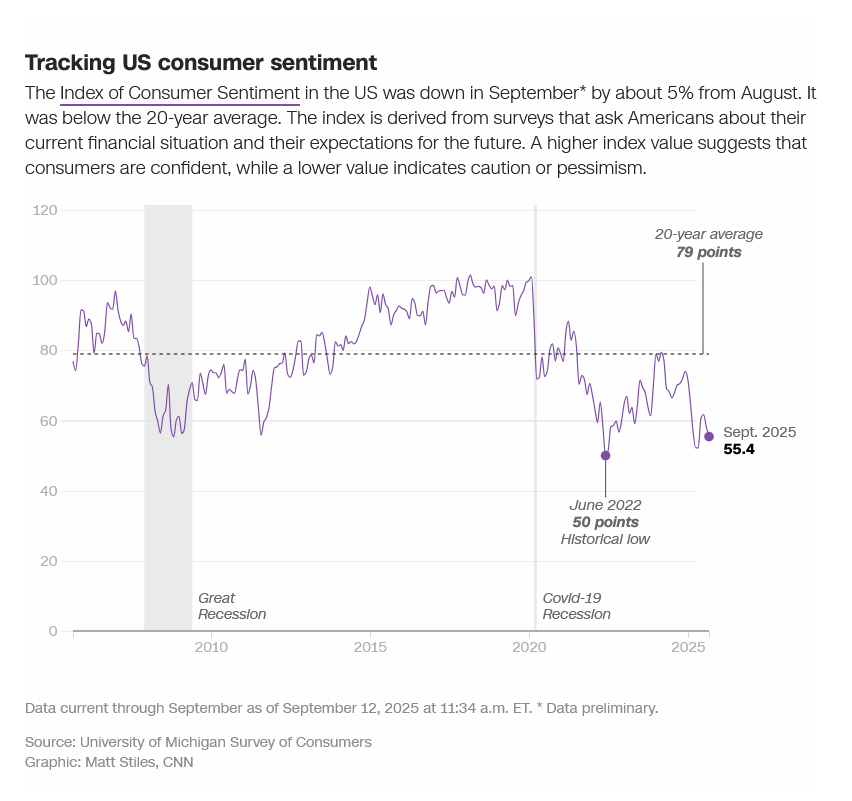
And yet Consumer Sentiment is still deteriorating as the “Vibecession” continues with prices rising for consumers and inventory purchased ahead of the tariffs dwindles. Prices keep climbing the Wall of Worry with the enticing belief that the Fed will pour more kerosene on the conflagration.
“From the last Cycle Timing Update, we remain in a 6-9 month window of extremely volatile longer-term cycles. The next two months are a place where there is strong potential for an exogenous event to occur. Expect extreme volatility to enter the markets in the next two quarters.”
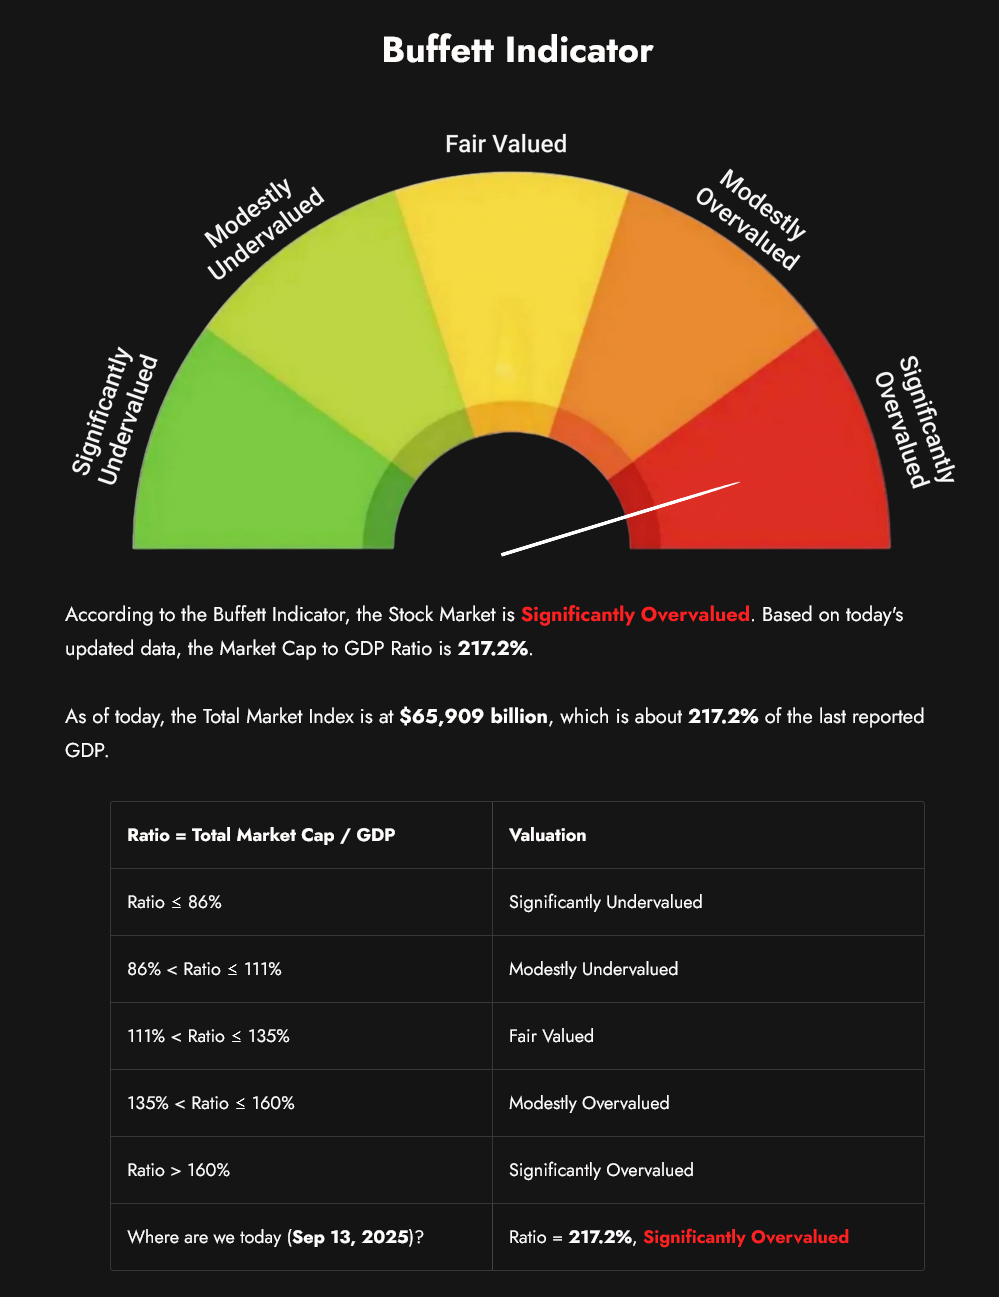
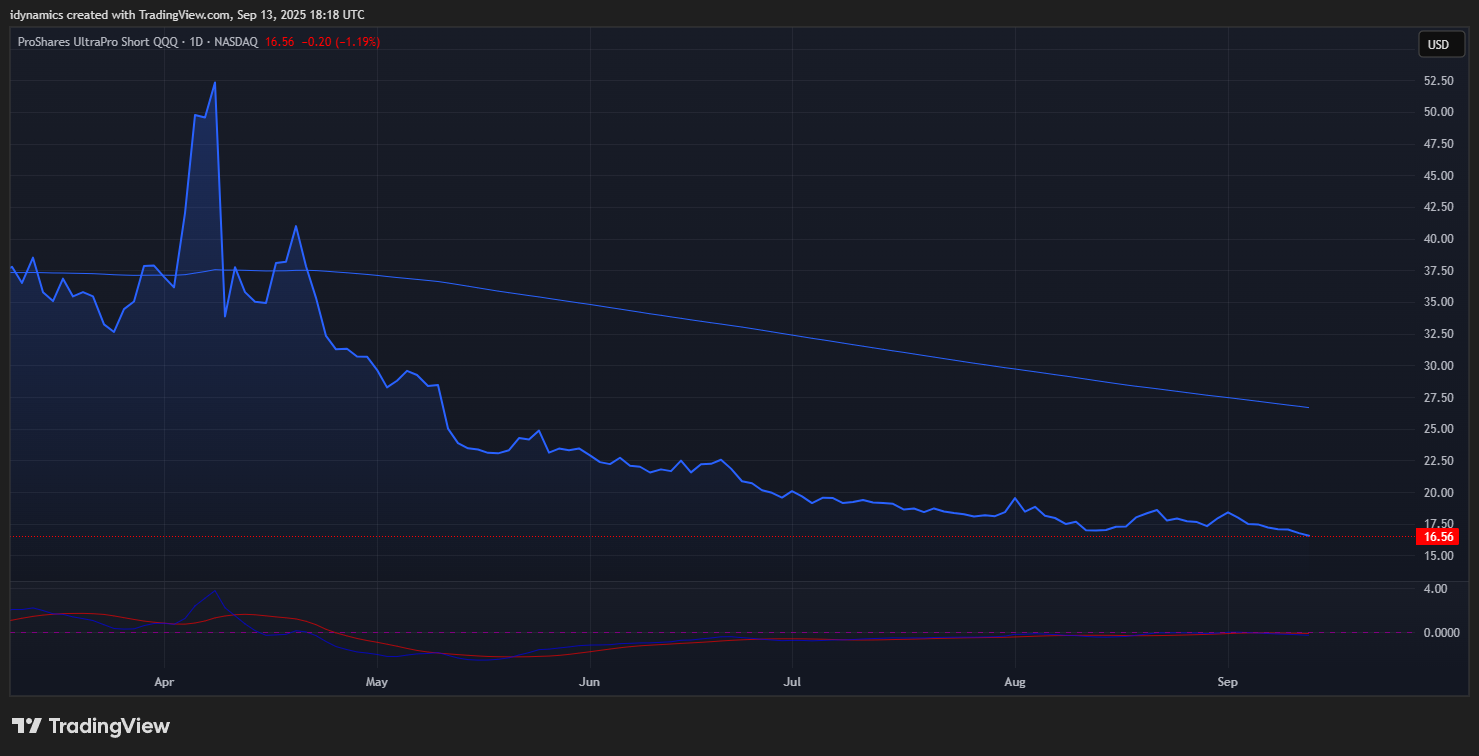 The VIX remains subdued and complacent. The Buffet Indicator hit another ATH above 217%. The SQQQ is in deep, deep complacency.
*We initiated one short trade in the SEP S&P E-mini (SPU). Took a small profit after being stopped out. In updates on LinkedIn, we discussed a potential meltup coming during the week due to the abnormal fear at all time highs.”
S&P 500 Stocks Above the 200-day MA
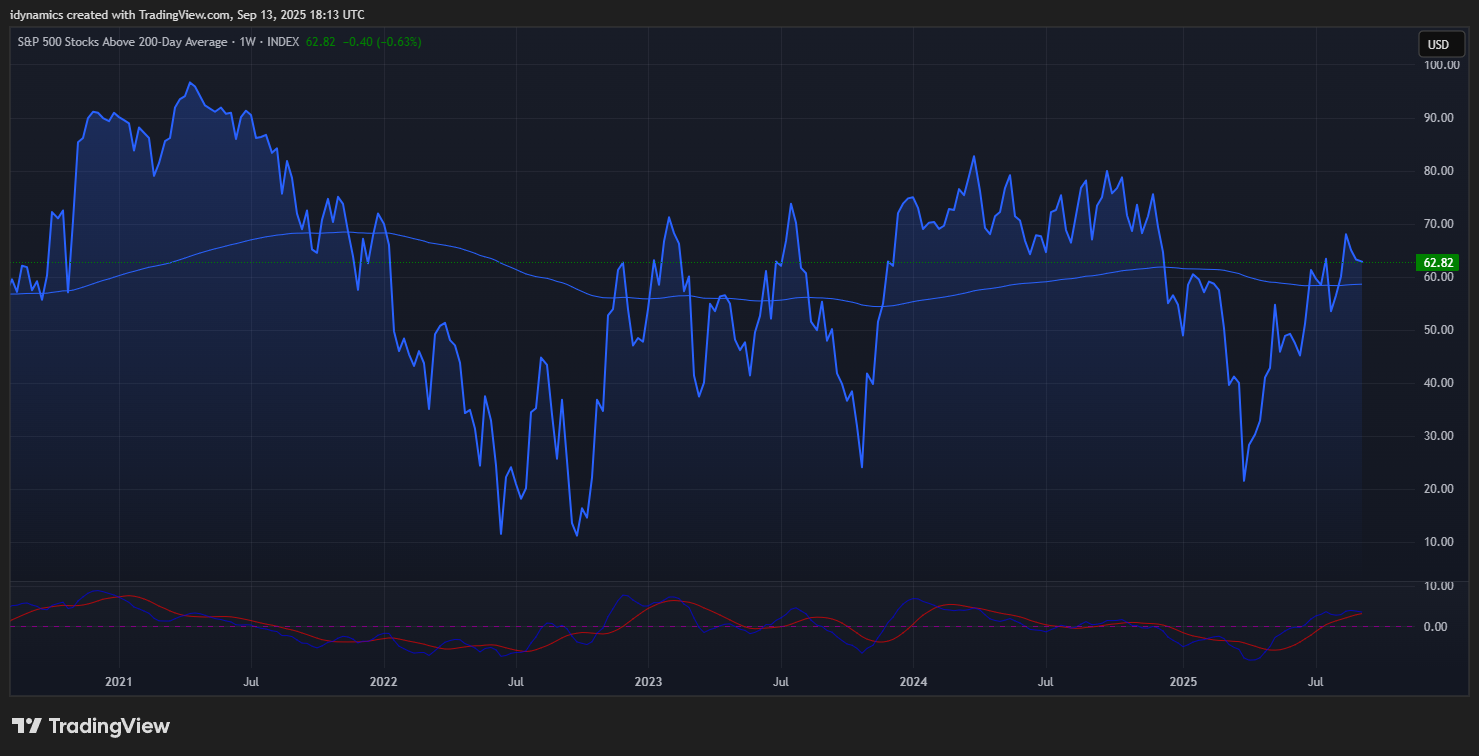 Breadth was flat for the SPX on the week, declining to 62.82%. The high in September 2024 was 72.92% and 82.70% in March of 2024. Divergence is still the name of the game.
MAGS (Magnificent 7) Weekly Candles
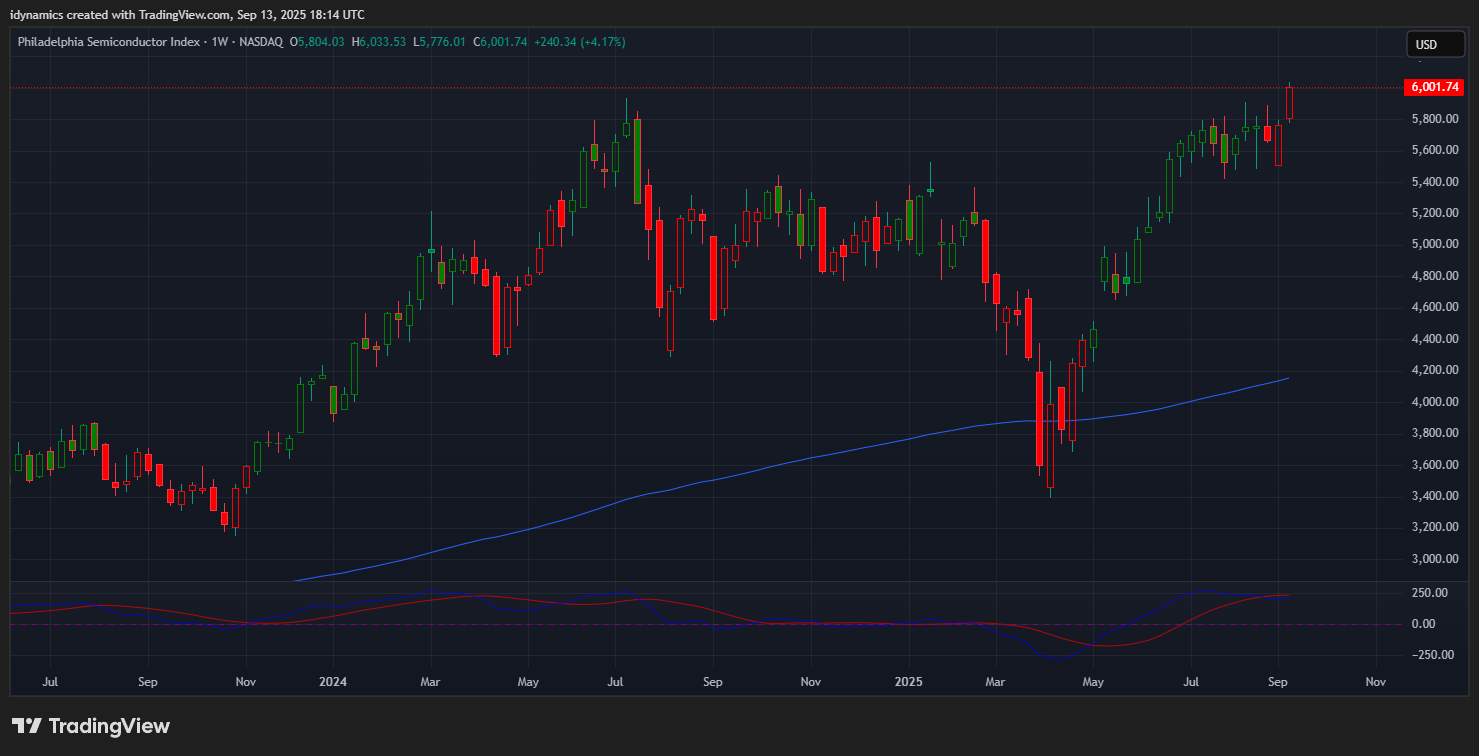
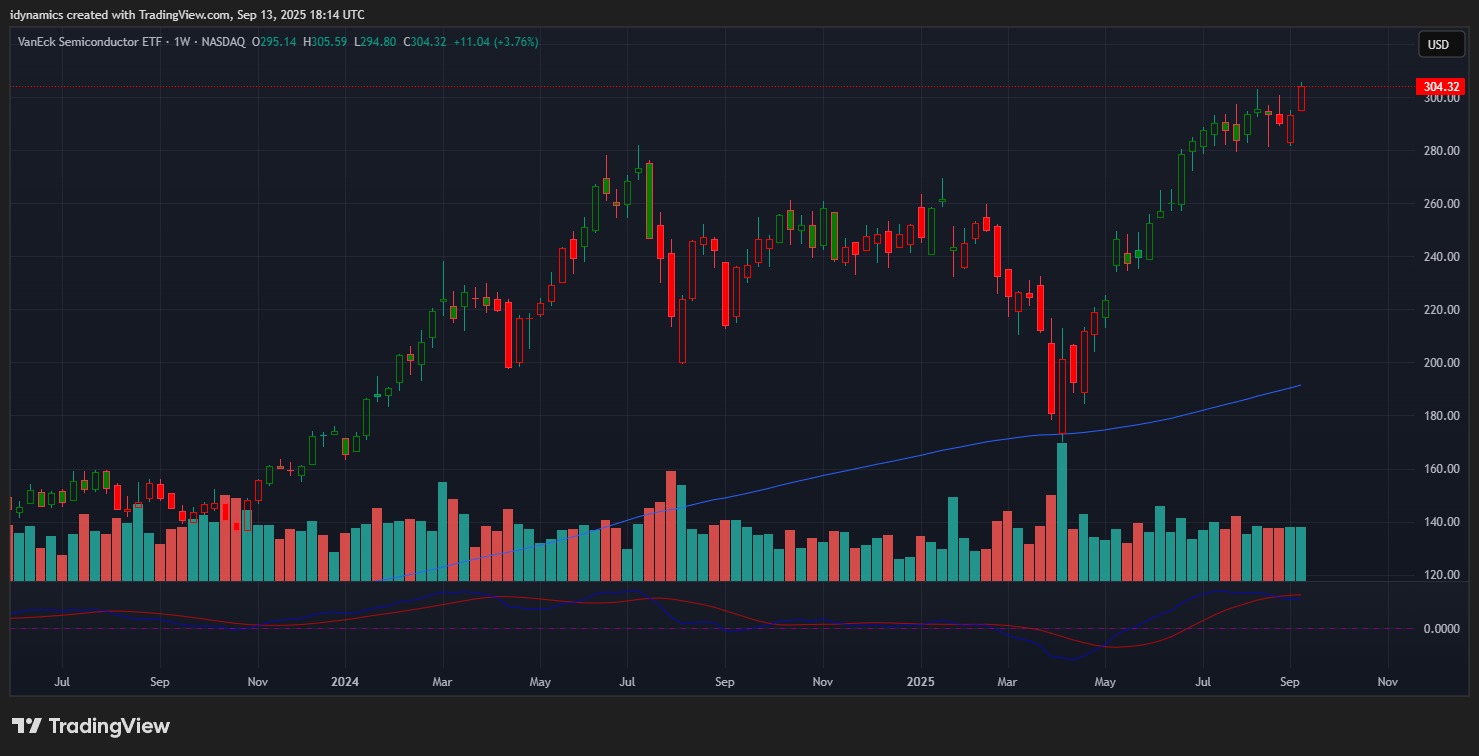
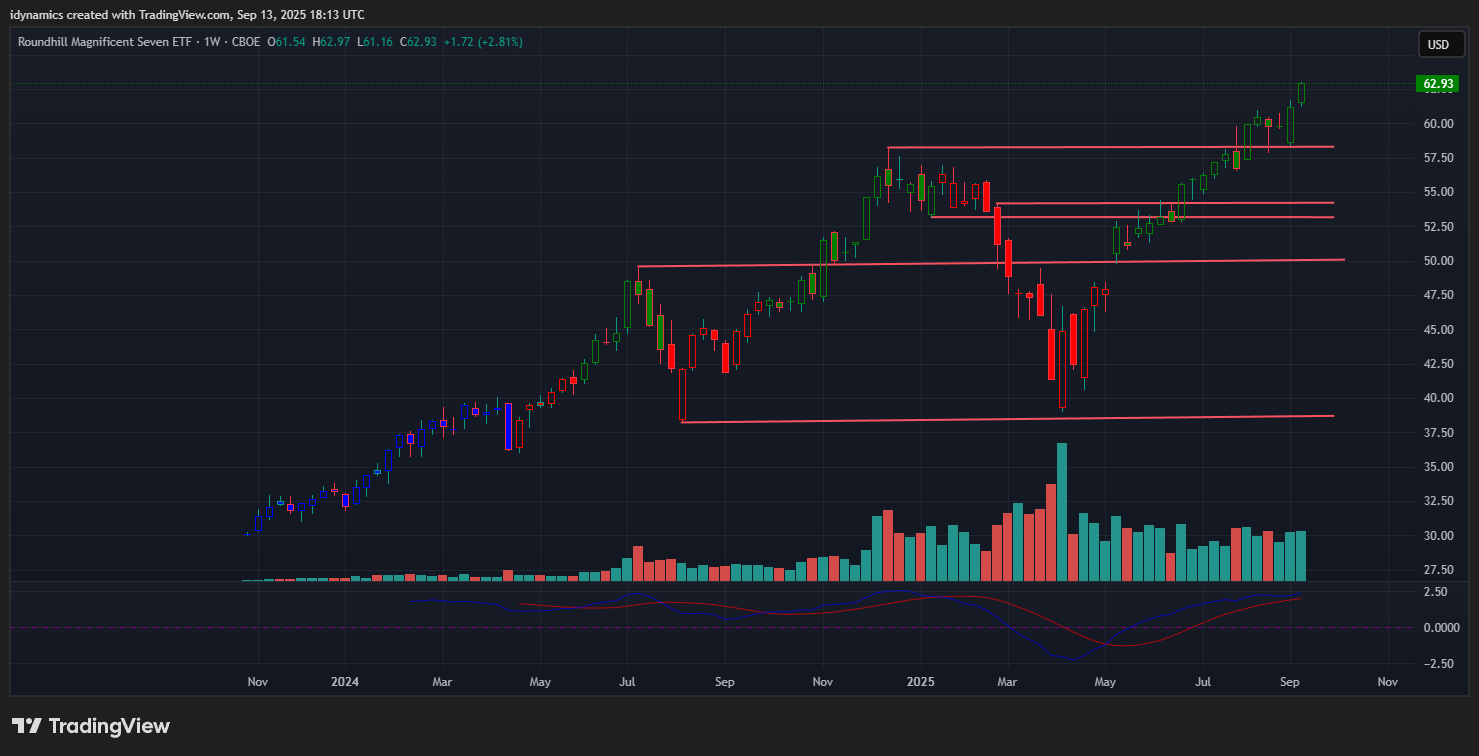 The MAGS moved to a record high on the week and closed on the highs, up +1.72% as prices near the target area of 63.04 and 64.50. Support remains at 58 and key against the 54.16/53.14 level. Both the SOX and SMH set record highs and closed at the top end of their ranges. $ORCL closed out the week up +25.51%.
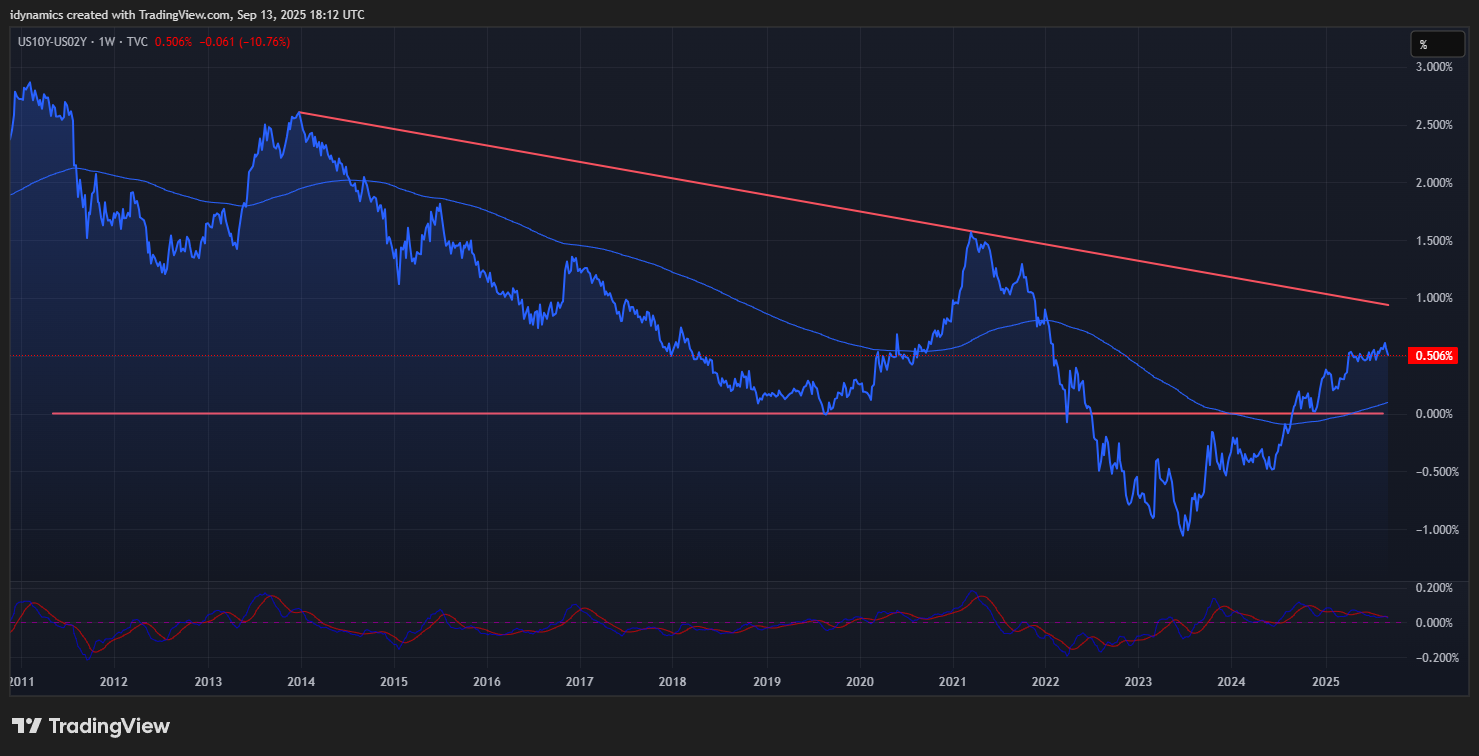
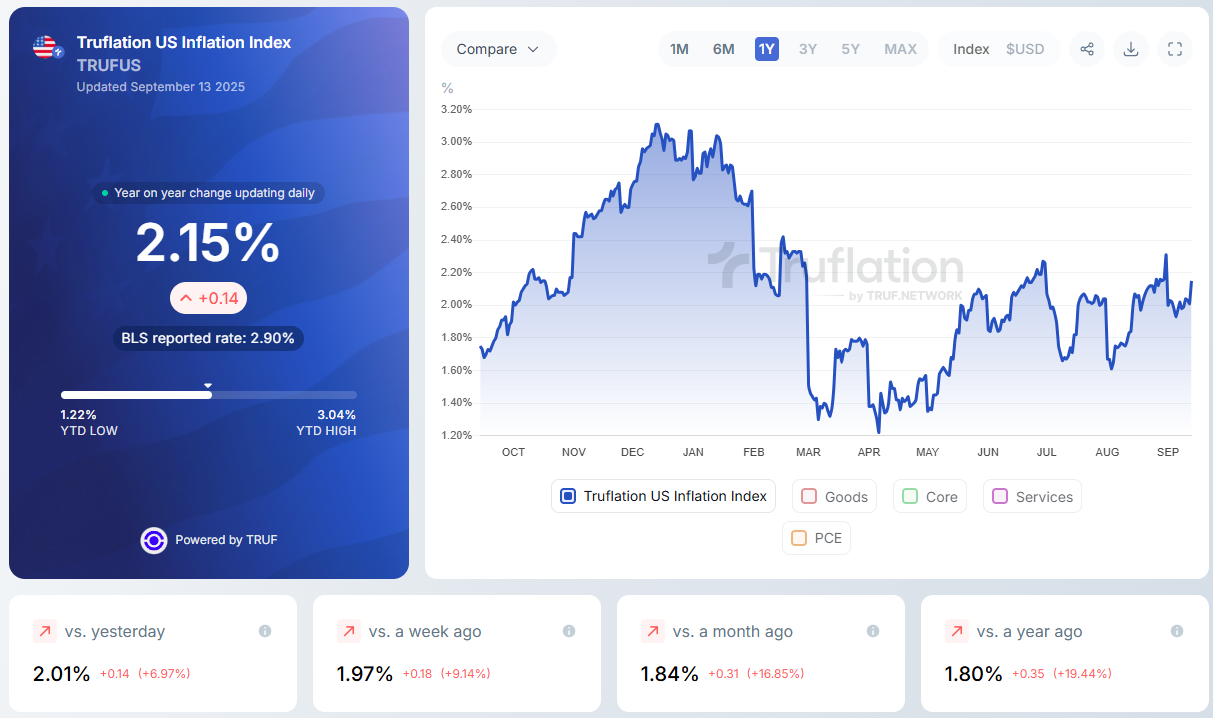
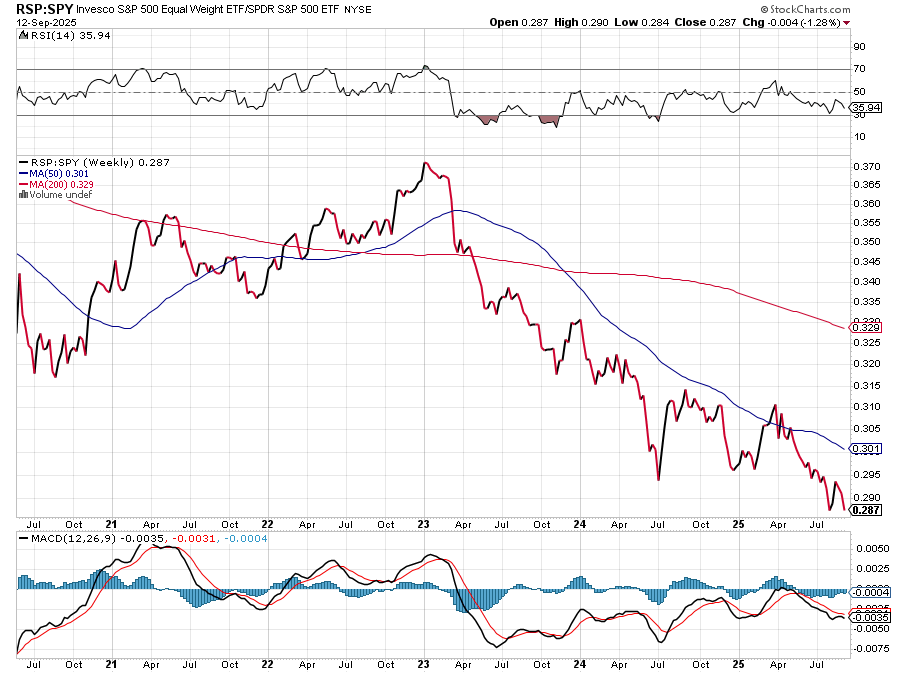
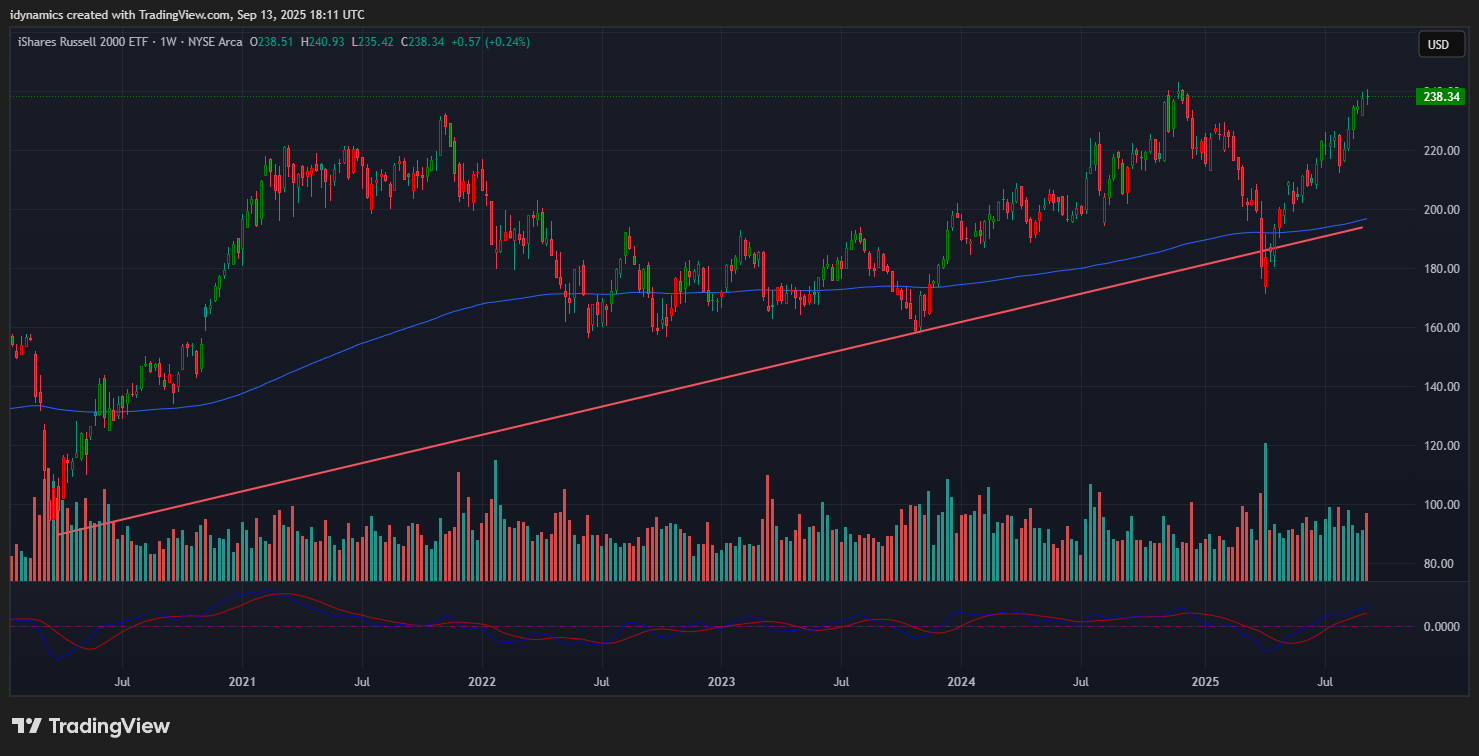
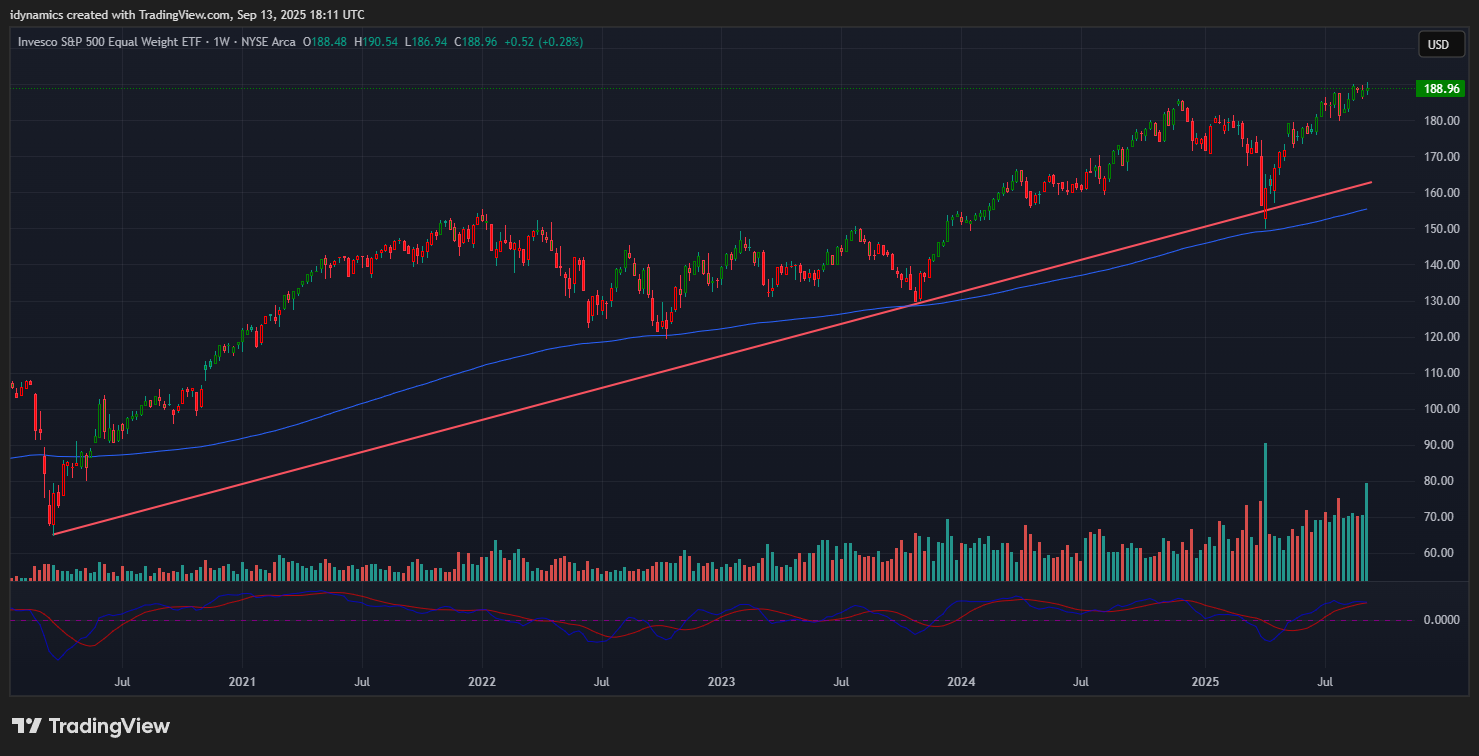
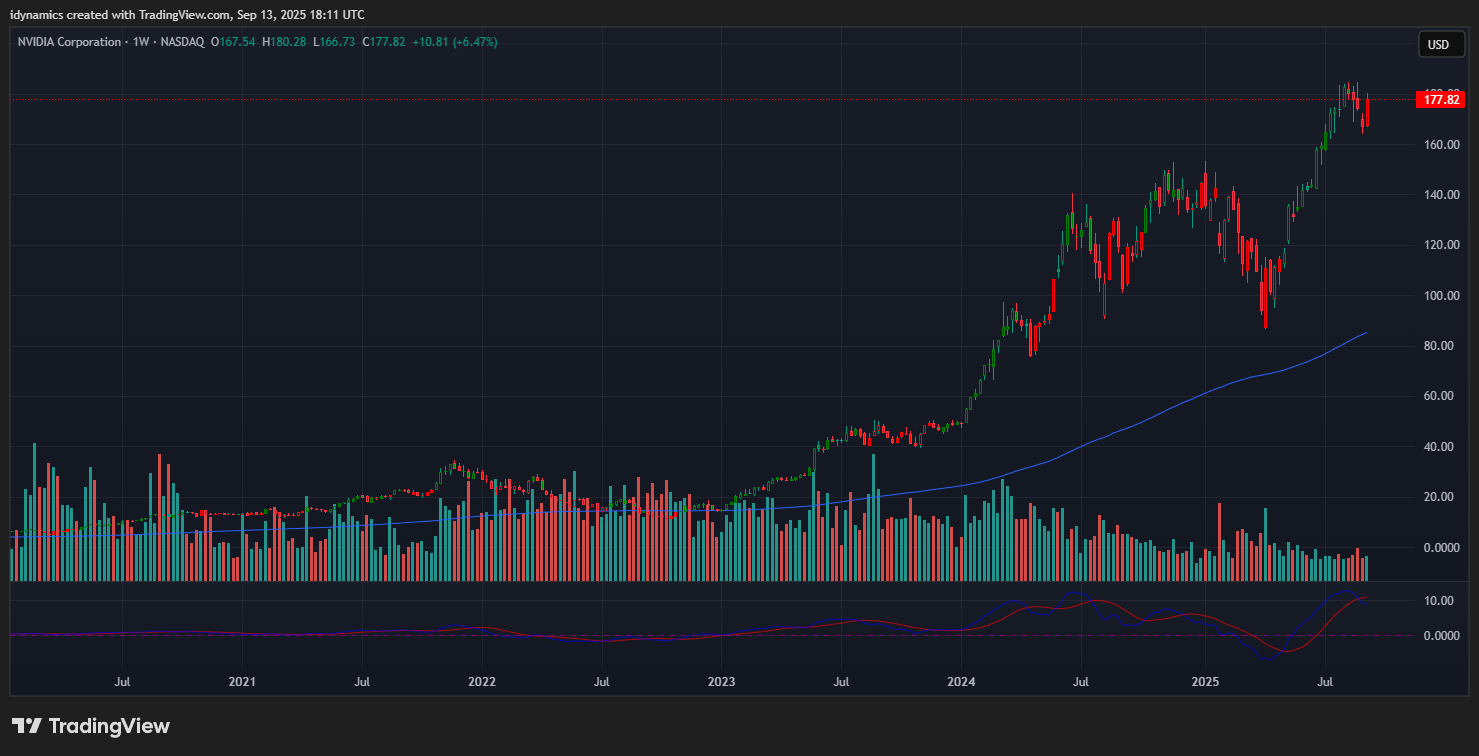
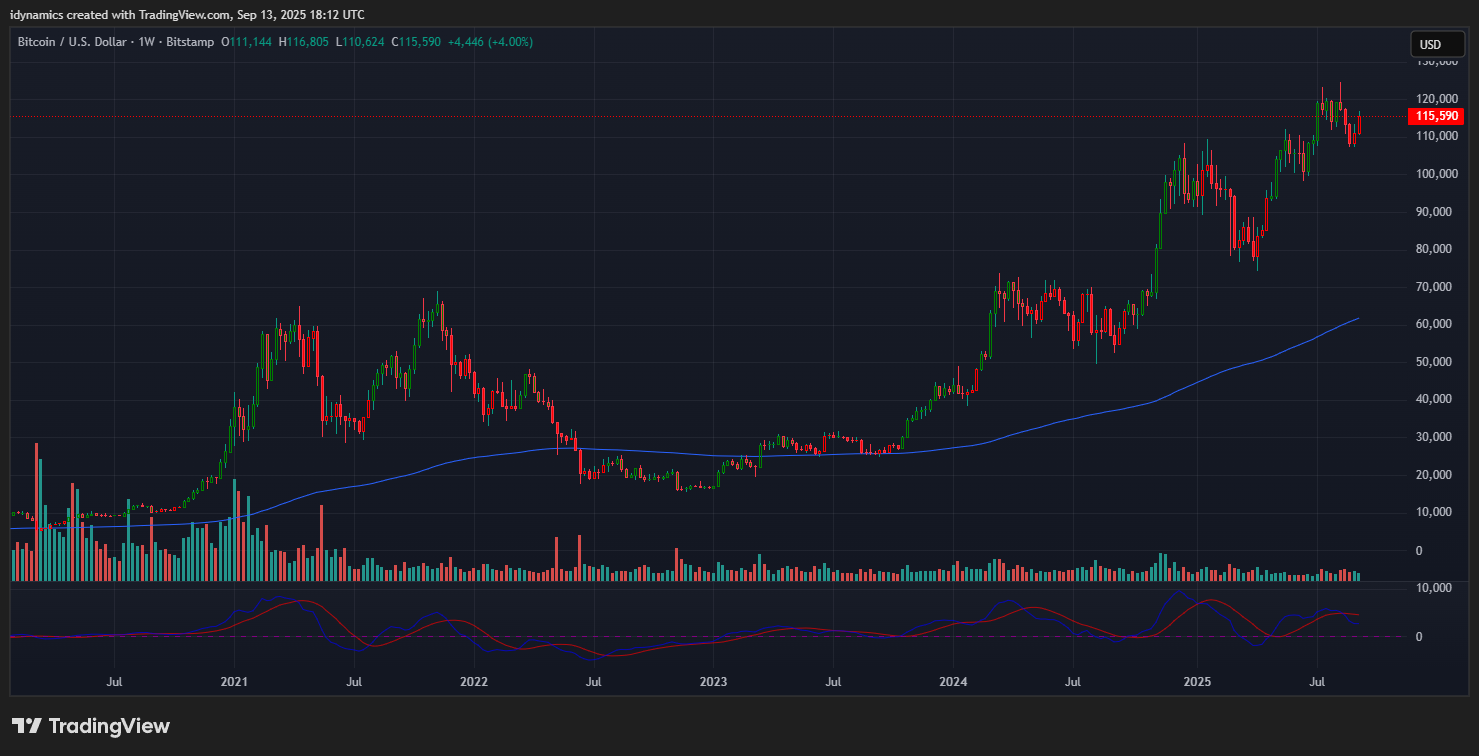
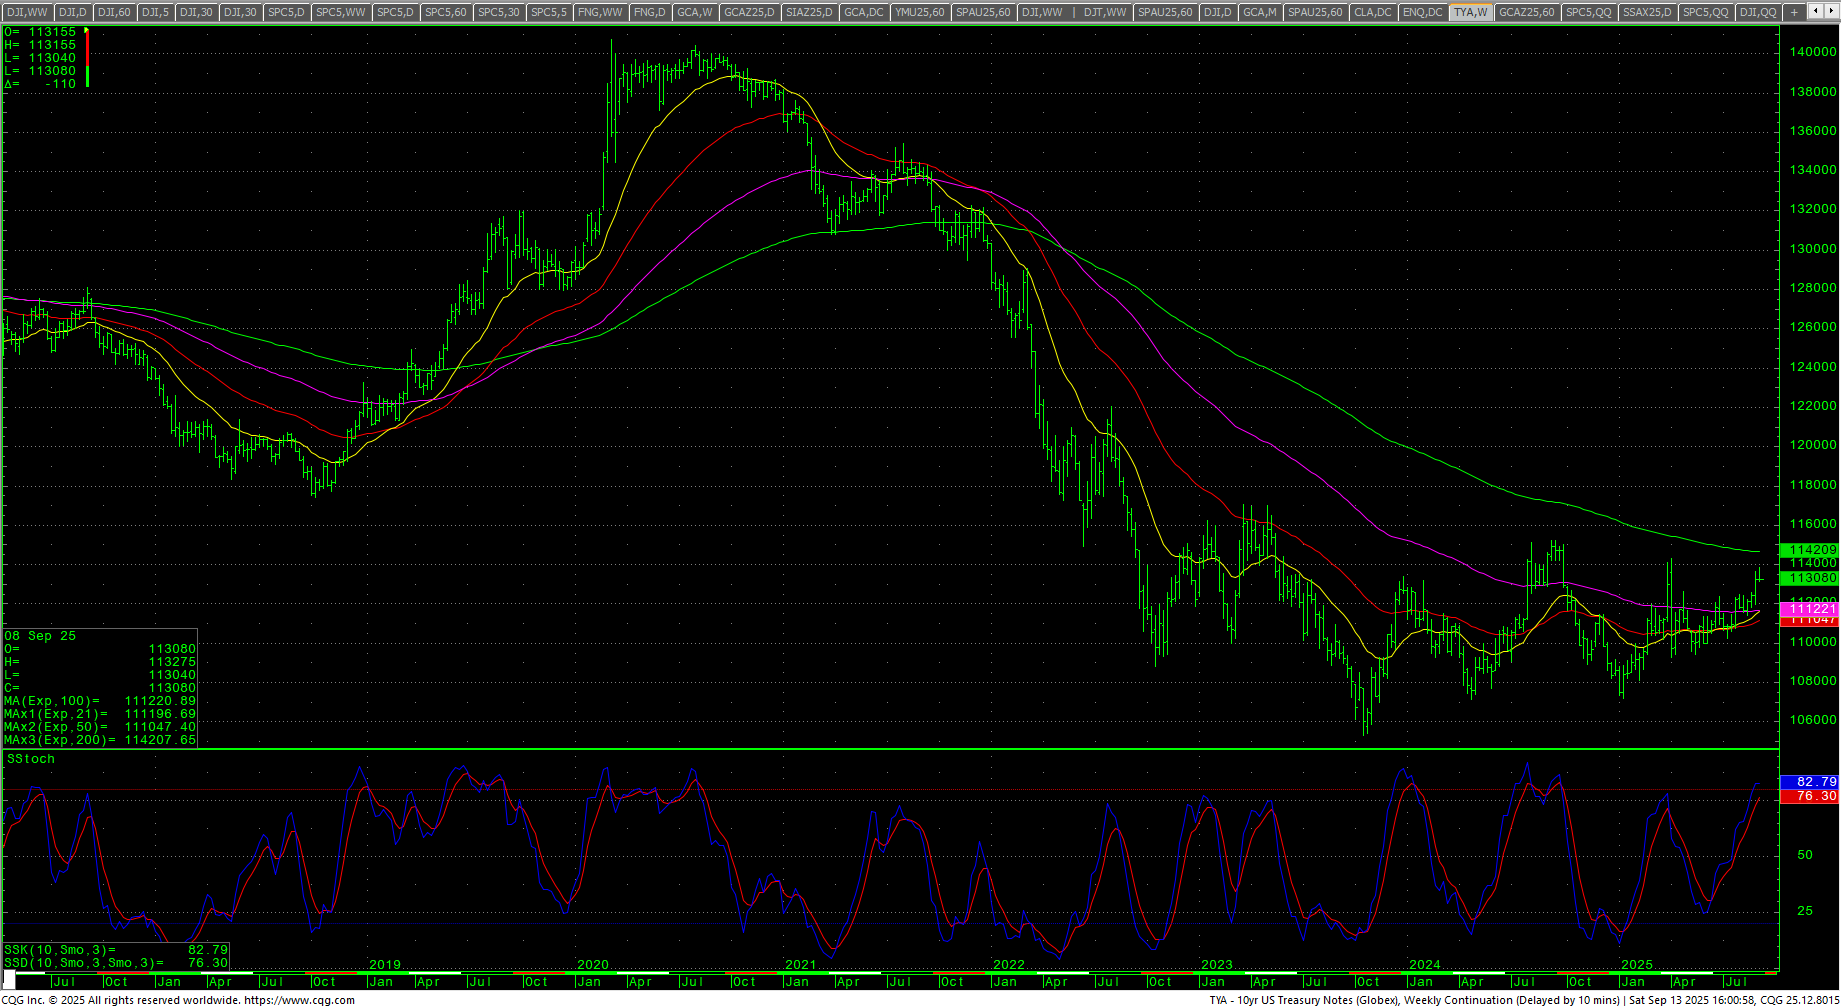
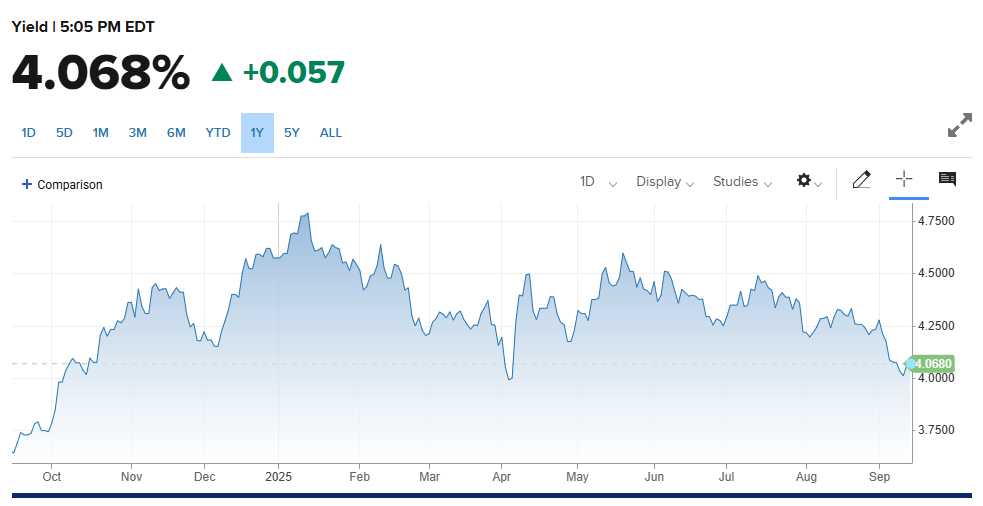
The RSP:SPY continues to drag into multi-year lows. The weekly is trending lower in an oversold position and the MACD is down. Resistance is still .294. The IWM tested record highs and closed in the middle of the range up +0.24%. The RSP set a record high and settled the up +0.28% in the middle of the range. NVDA roared back on the $ORCL news and closed on high of the week, up +6.47%. Bitcoin also bounced back and closed up +4.35%. Support remains pivotal at 110/108. McClellan Oscillators are neutral for the Dow. The Yield Curve expanded early and then narrowed, closing at +0.506%. The 10YR yield was flat, closing at 4.068%. Truflation jumped to 2.15%. Corporate bond spreads are at a 27-year low.
10YR-2YR Yield Curve Weekly

 VIX Weekly Candles
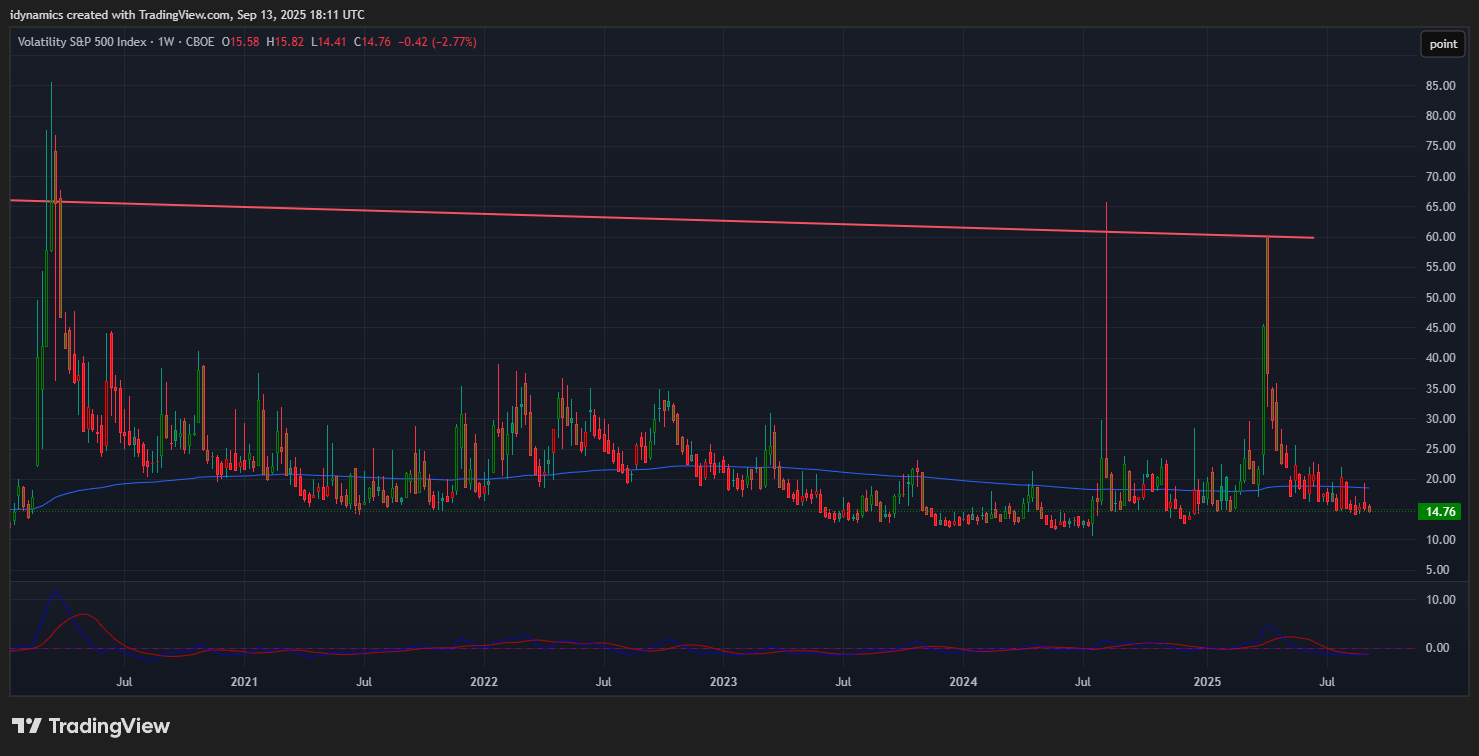
The VIX held in a tight range and closed on the lows, down -2.77%. The US Dollar closed on the bottom of the range, down -0.12%.
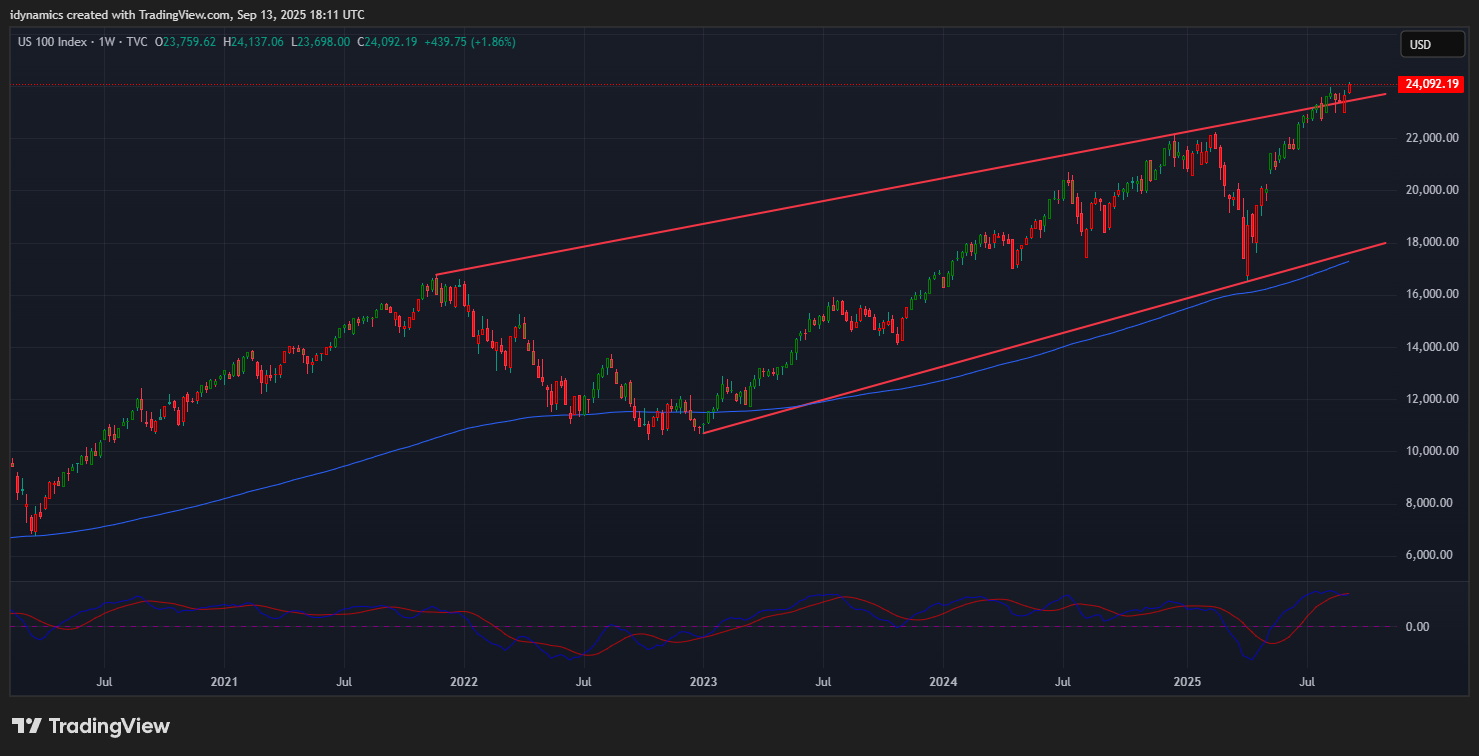
 Nasdaq 100 Weekly Candles
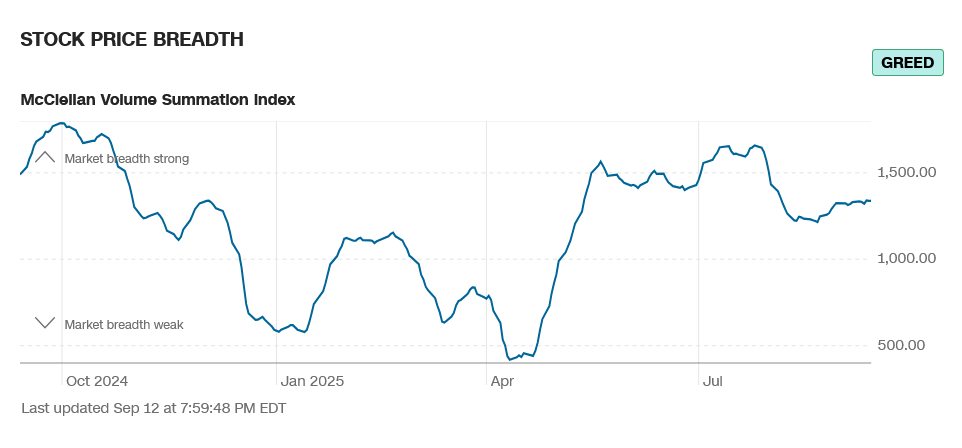
Daily Breadth 
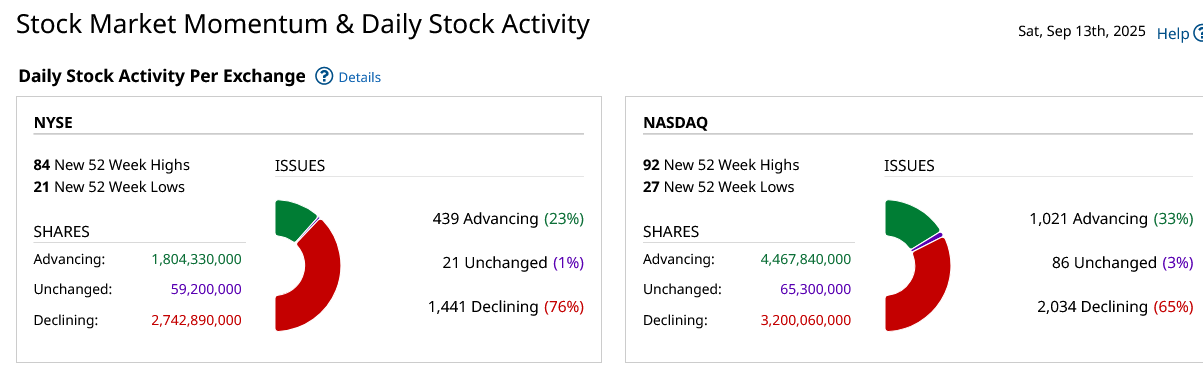
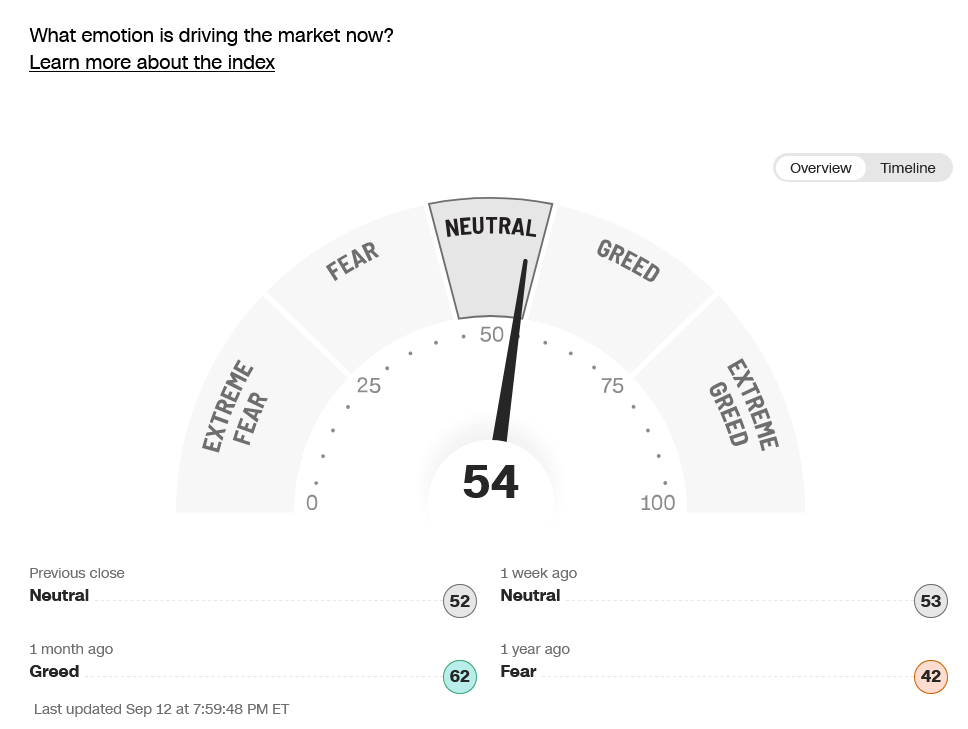
Breadth was weaker in Friday’s trade and was flat on the week. Sentiment still reads greed.
CNN Fear & Greed Index
 AAII Investor Sentiment Survey
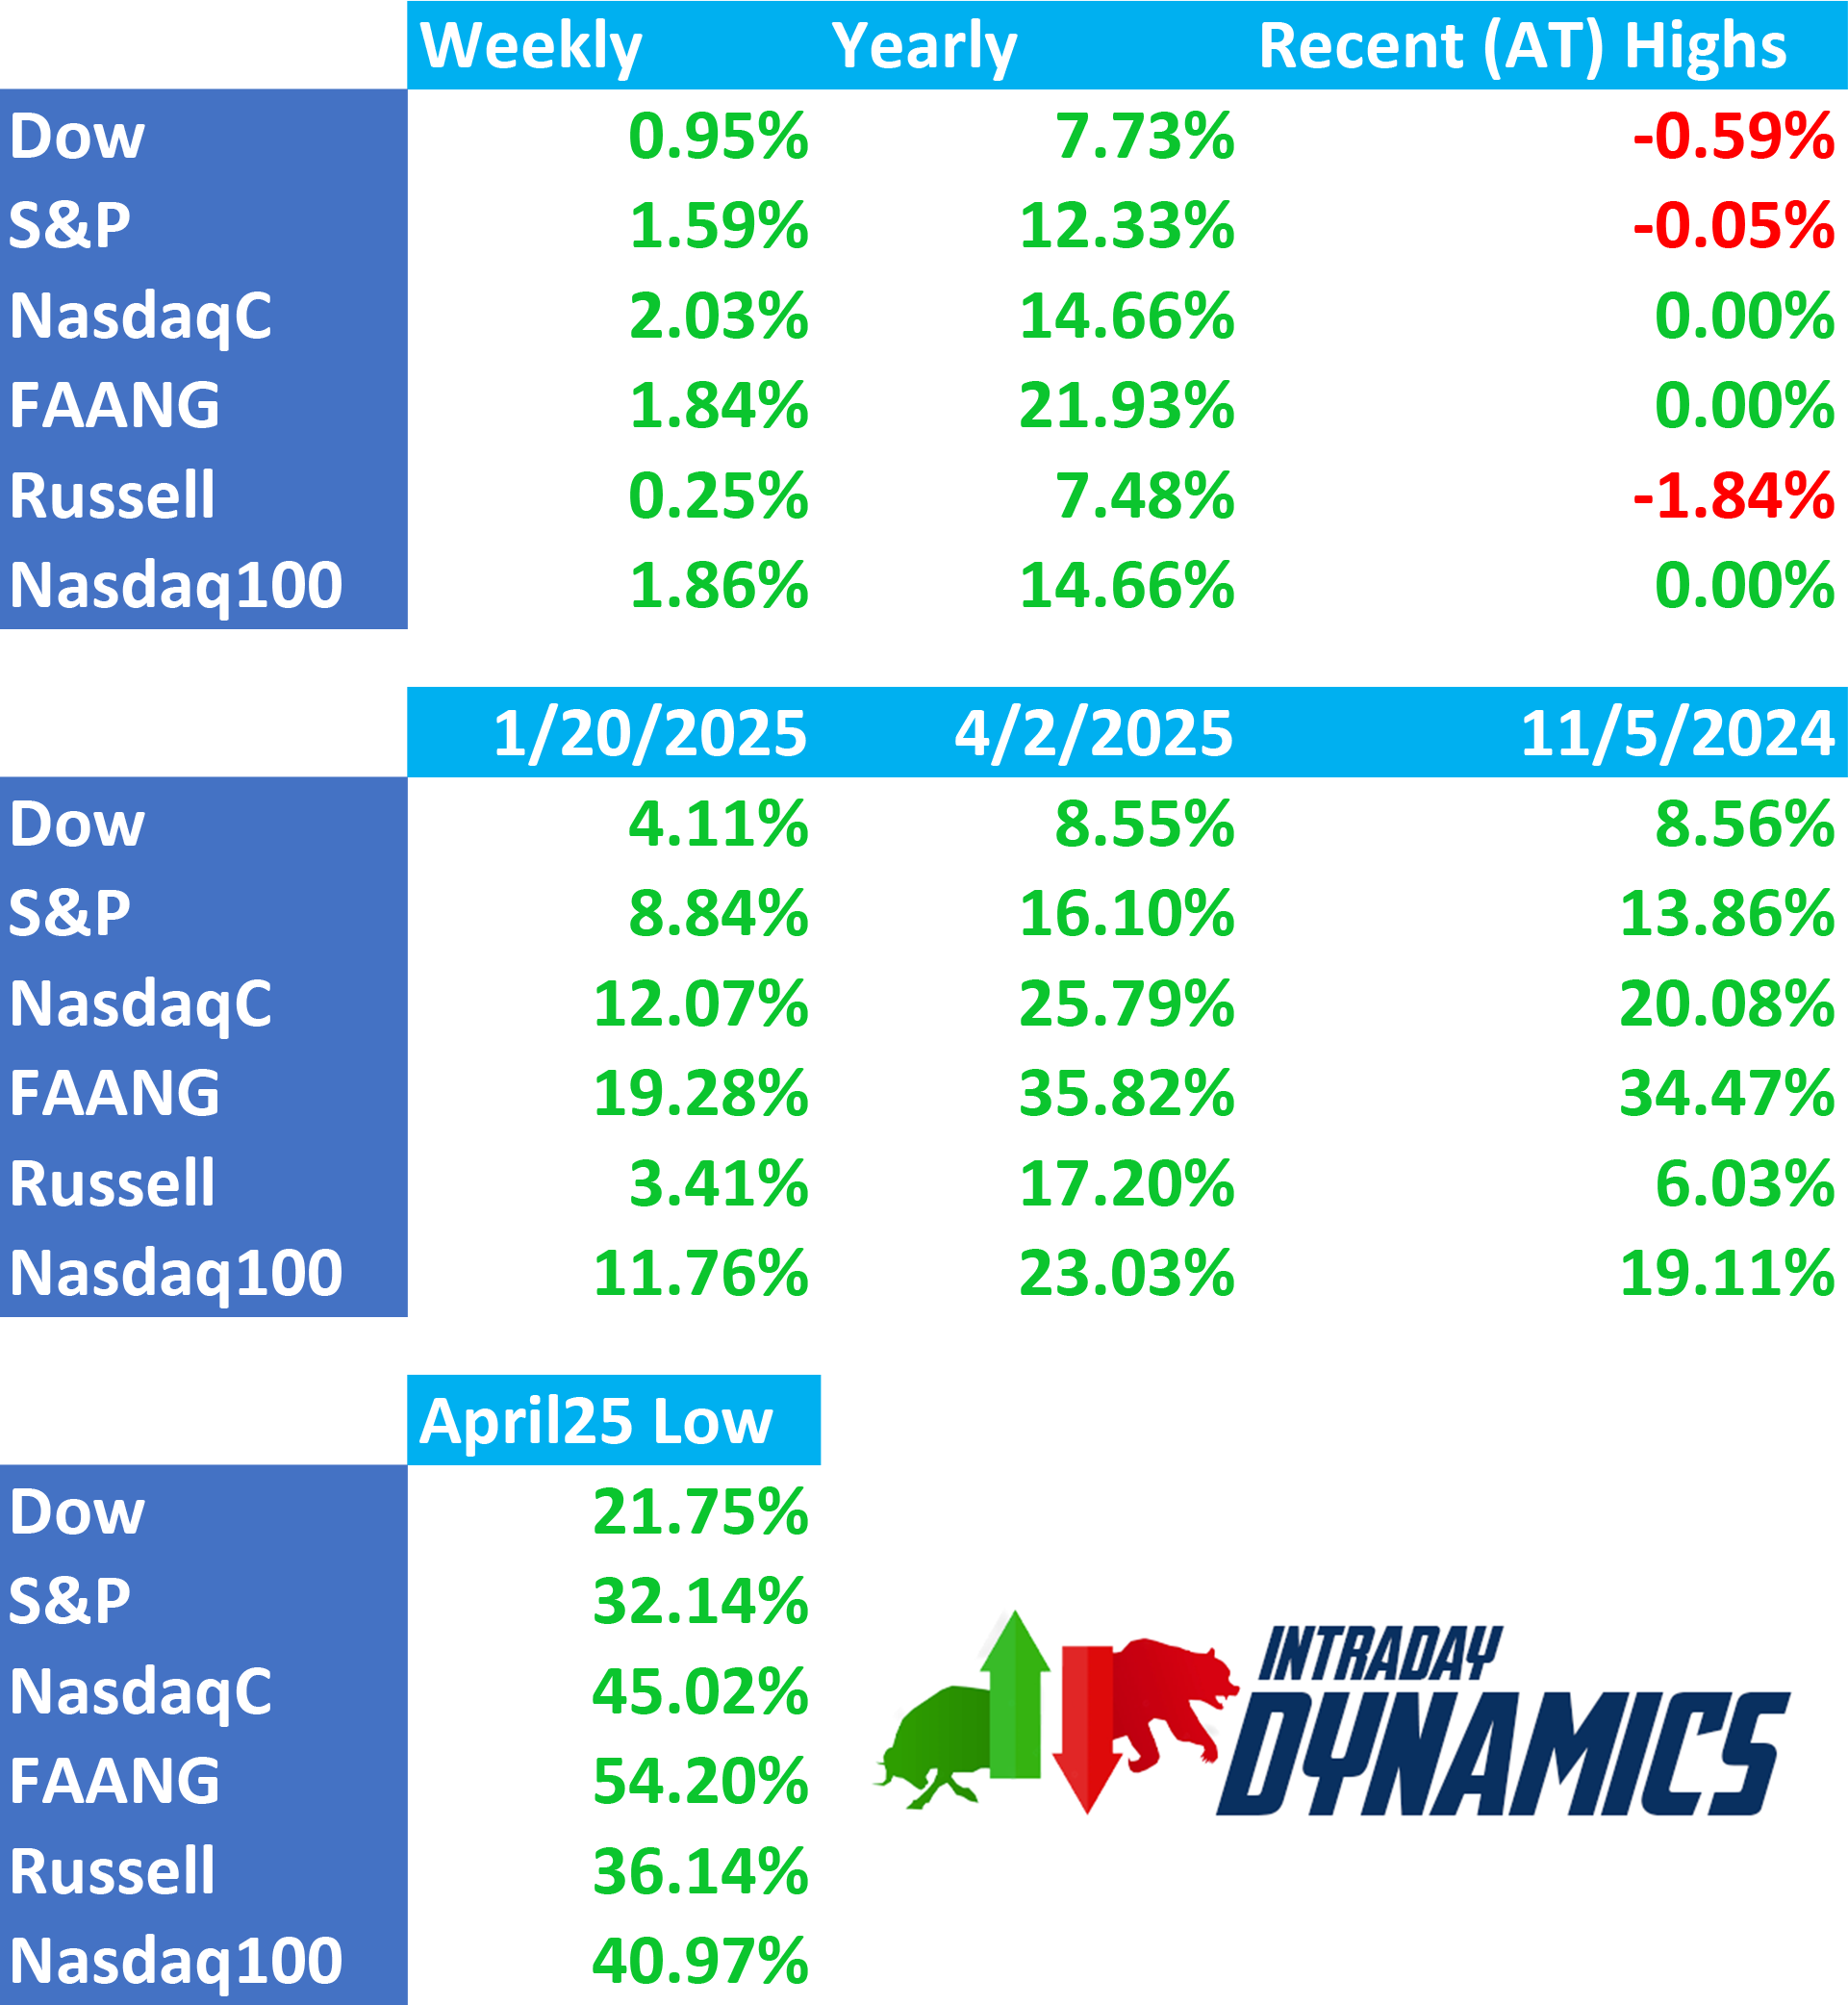
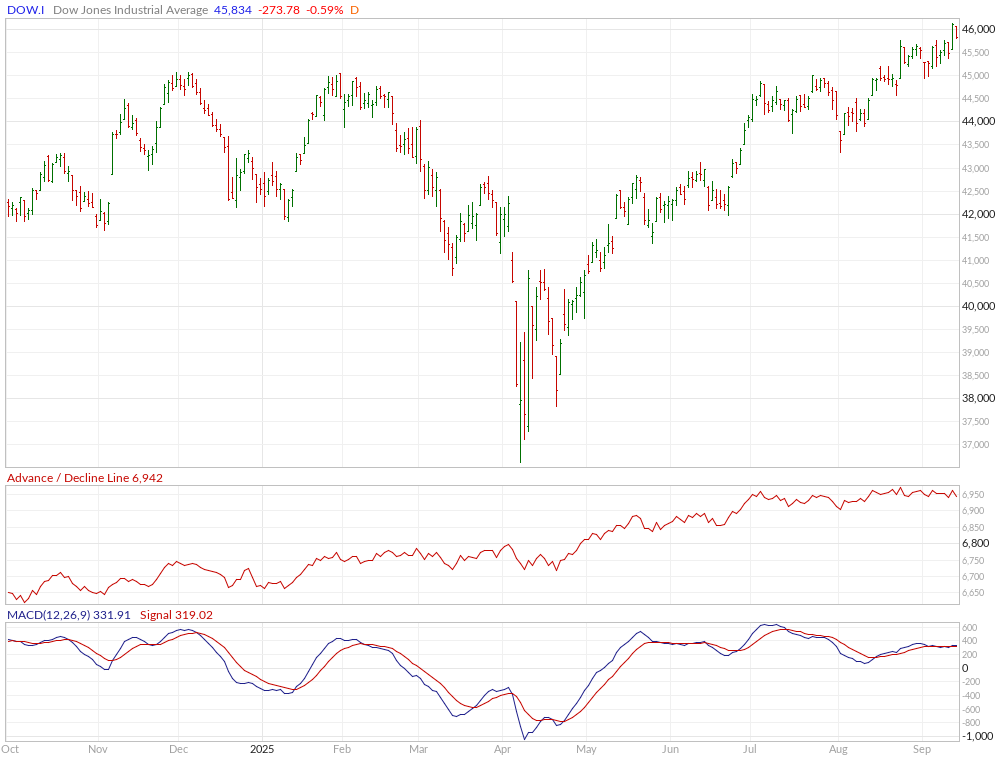
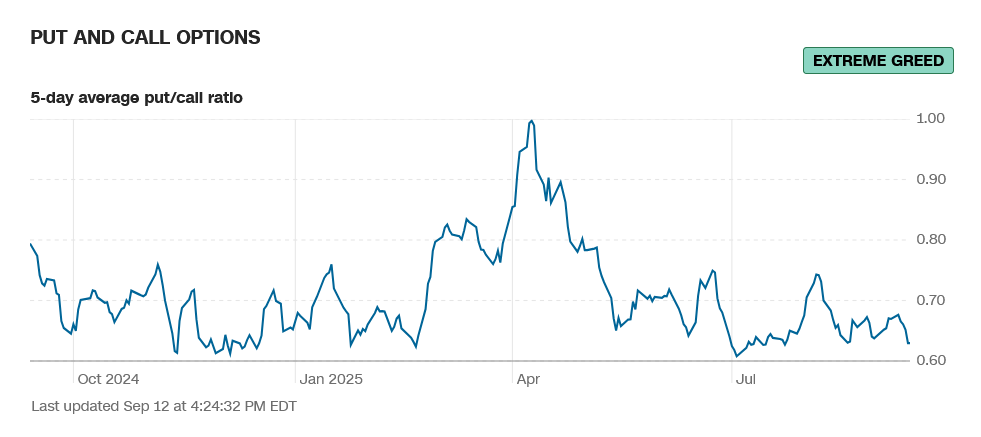
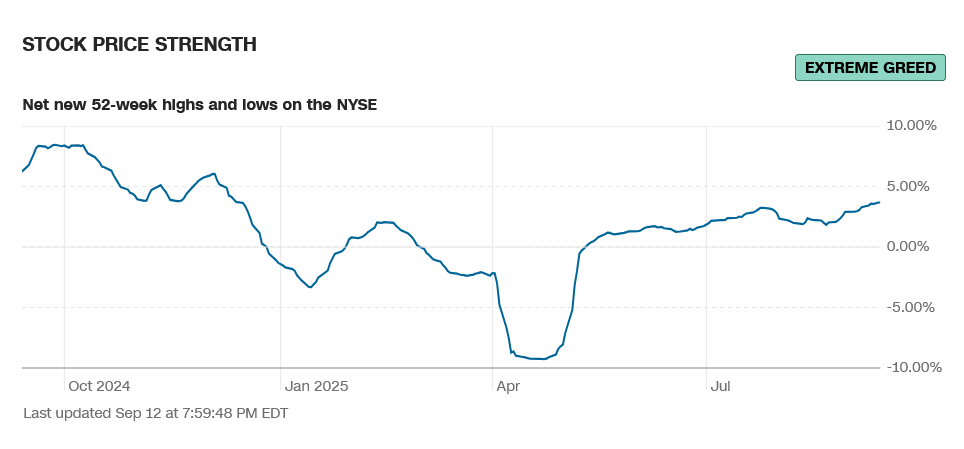
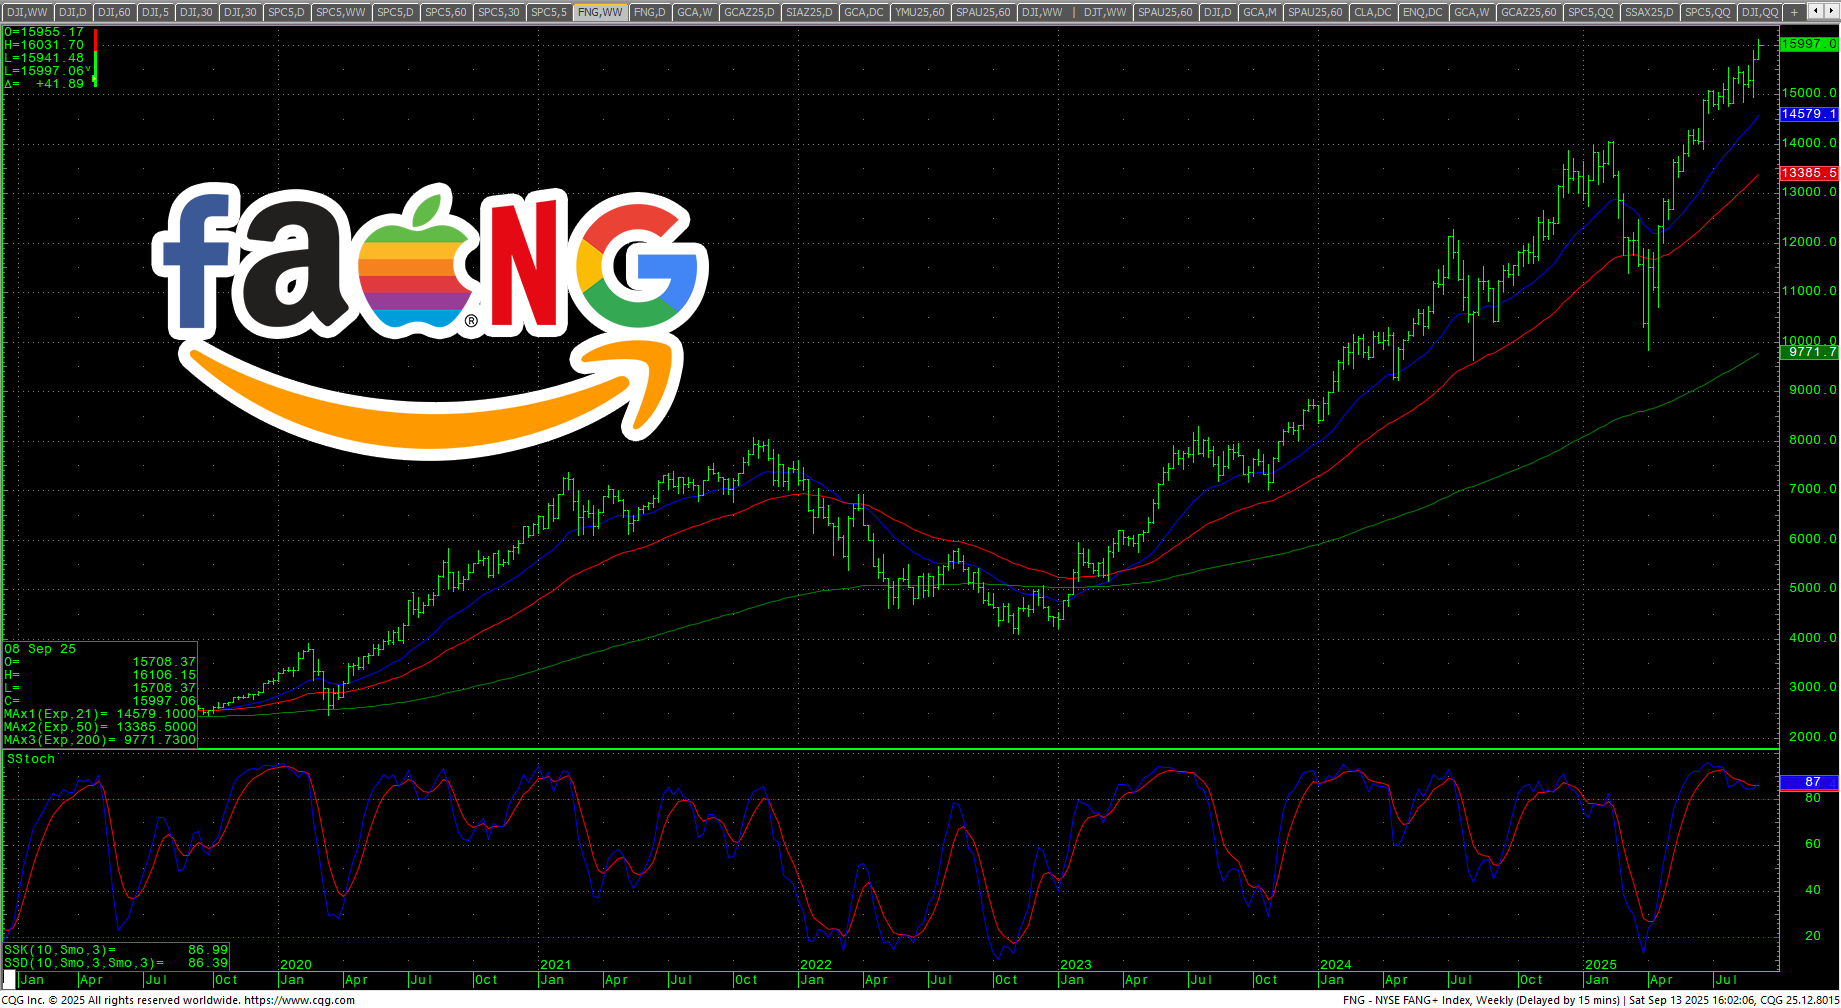
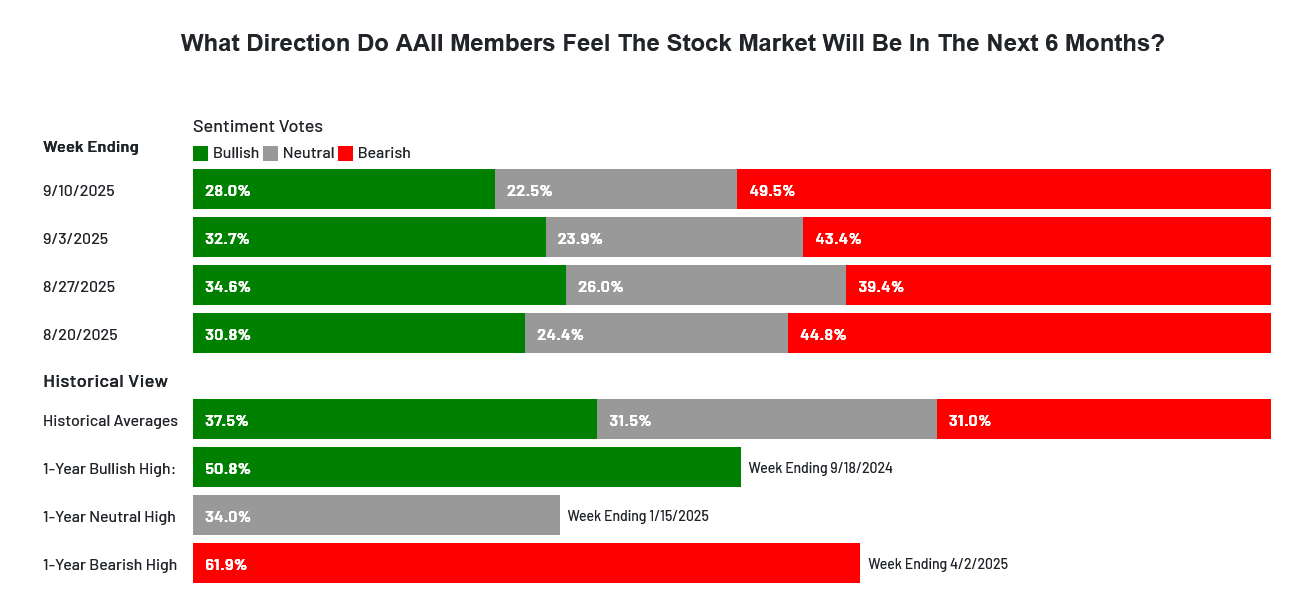 The CNN Fear and Greed Index moved to 54 and reads neutral. Breadth was flat on the week and reads greed. Latest AAII Sentiment Survey: Pessimism Pushes Higher . The Dow A/D drifted lower from the recent ATH closing at 6992. The VIX held in a tight range and closed on the lows, down -2.77%. The Put/Call closed at 0.63 and reads extreme greed. The 52-week, A/D moved up to +3.68% and reads extreme greed. The Dow closed the week up +0.95%, closing in the top of the week’s range at a record high. The S&P traded record highs and settled up +1.59% in the upper end of the range. The Nasdaq Composite was up +2.03% and the Nasdaq 100 was up +1.86% both at record highs. The NYSE FANG closed up +1.84% in the top of the range at a new ATH and is up +54.20% from the April lows. The Russell was up +0.25% in the upper half of the range. The 10-year notes closed flat on the bottom of the. The yield on the 10YR was flat at 4.068%.
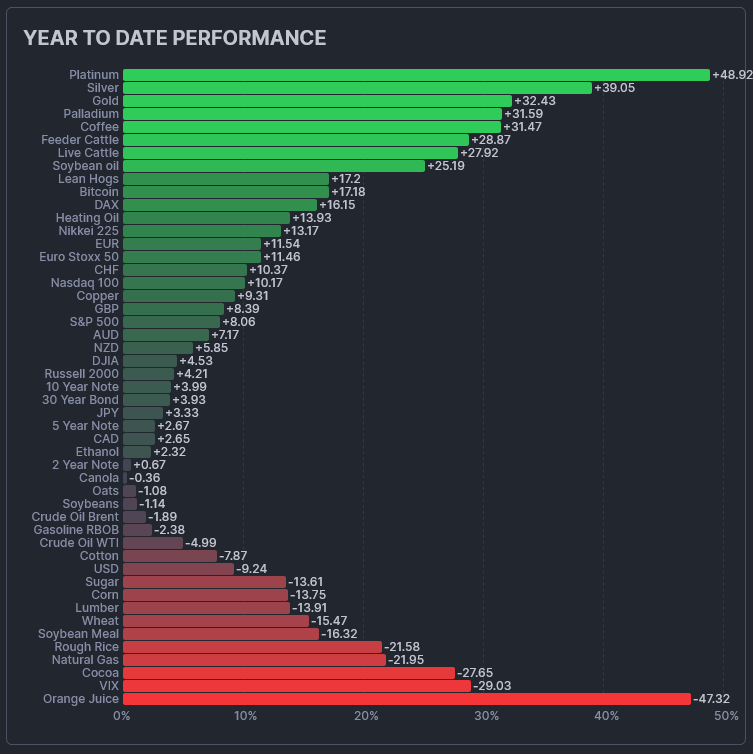
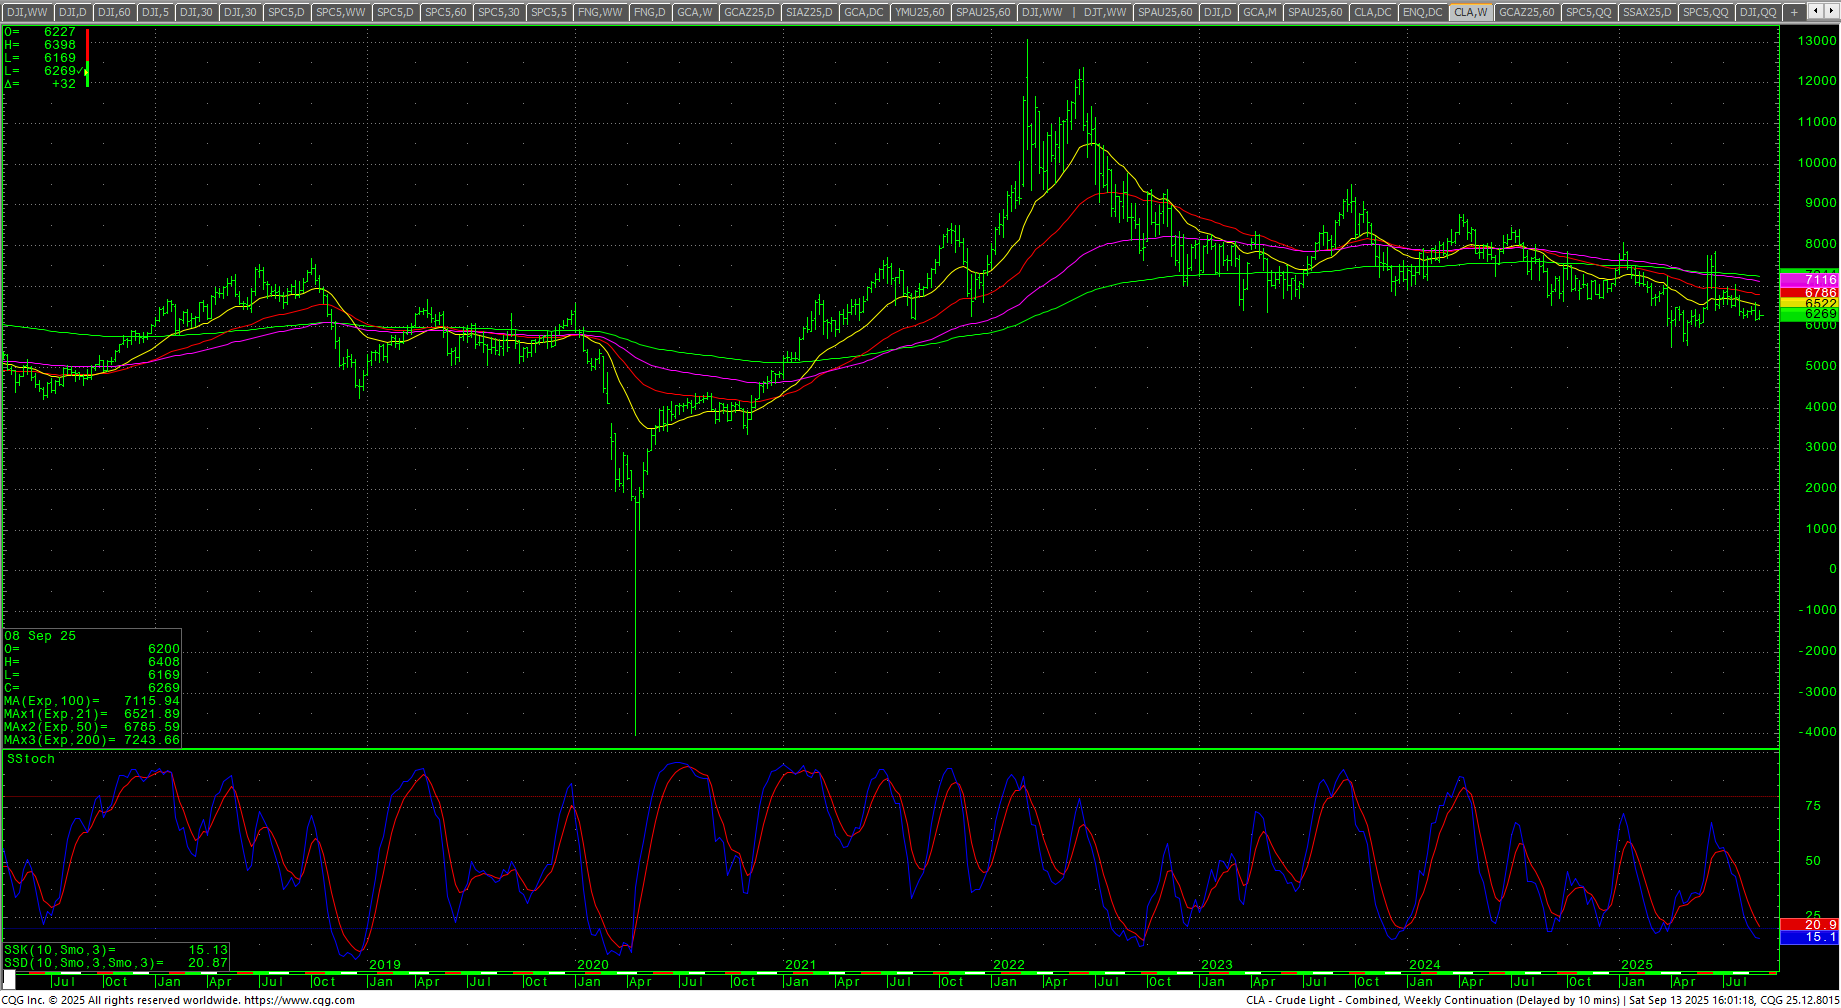
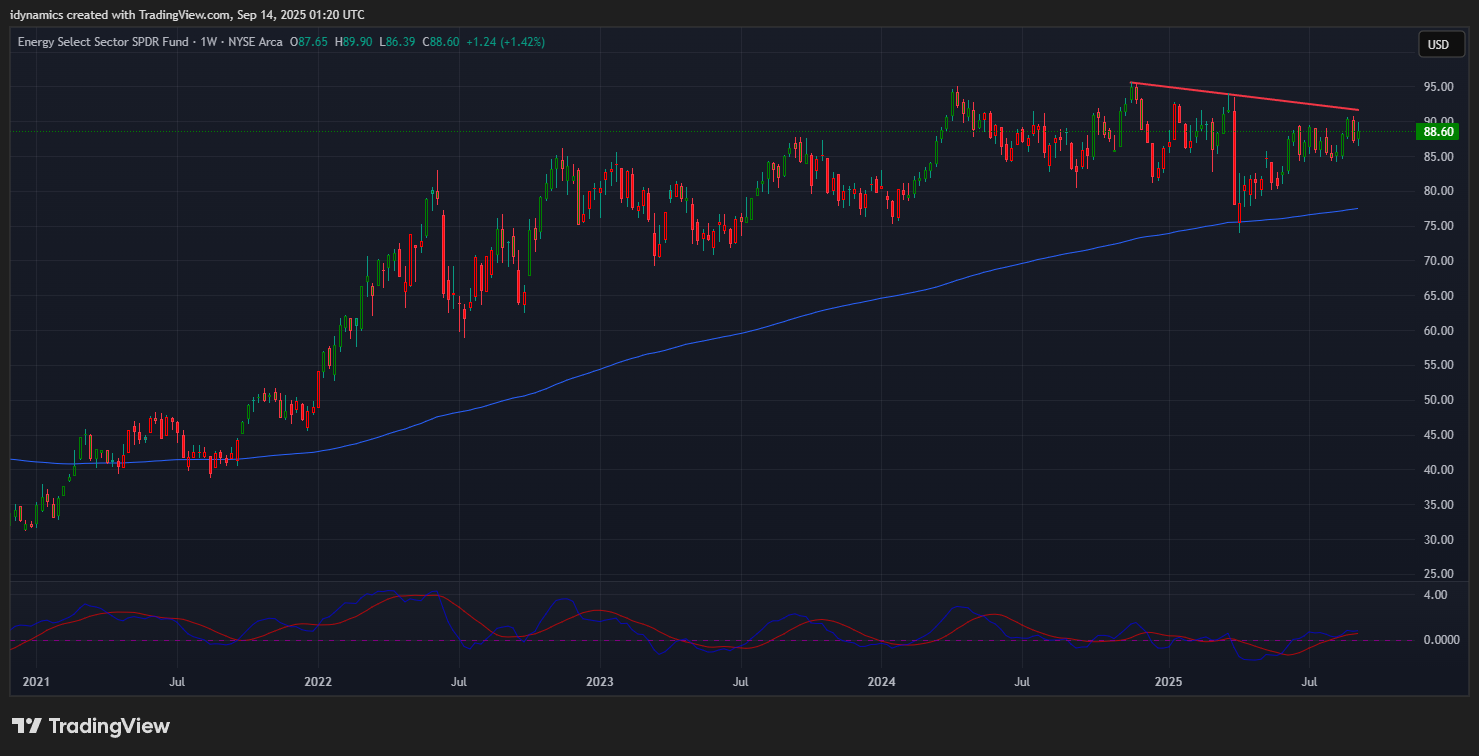
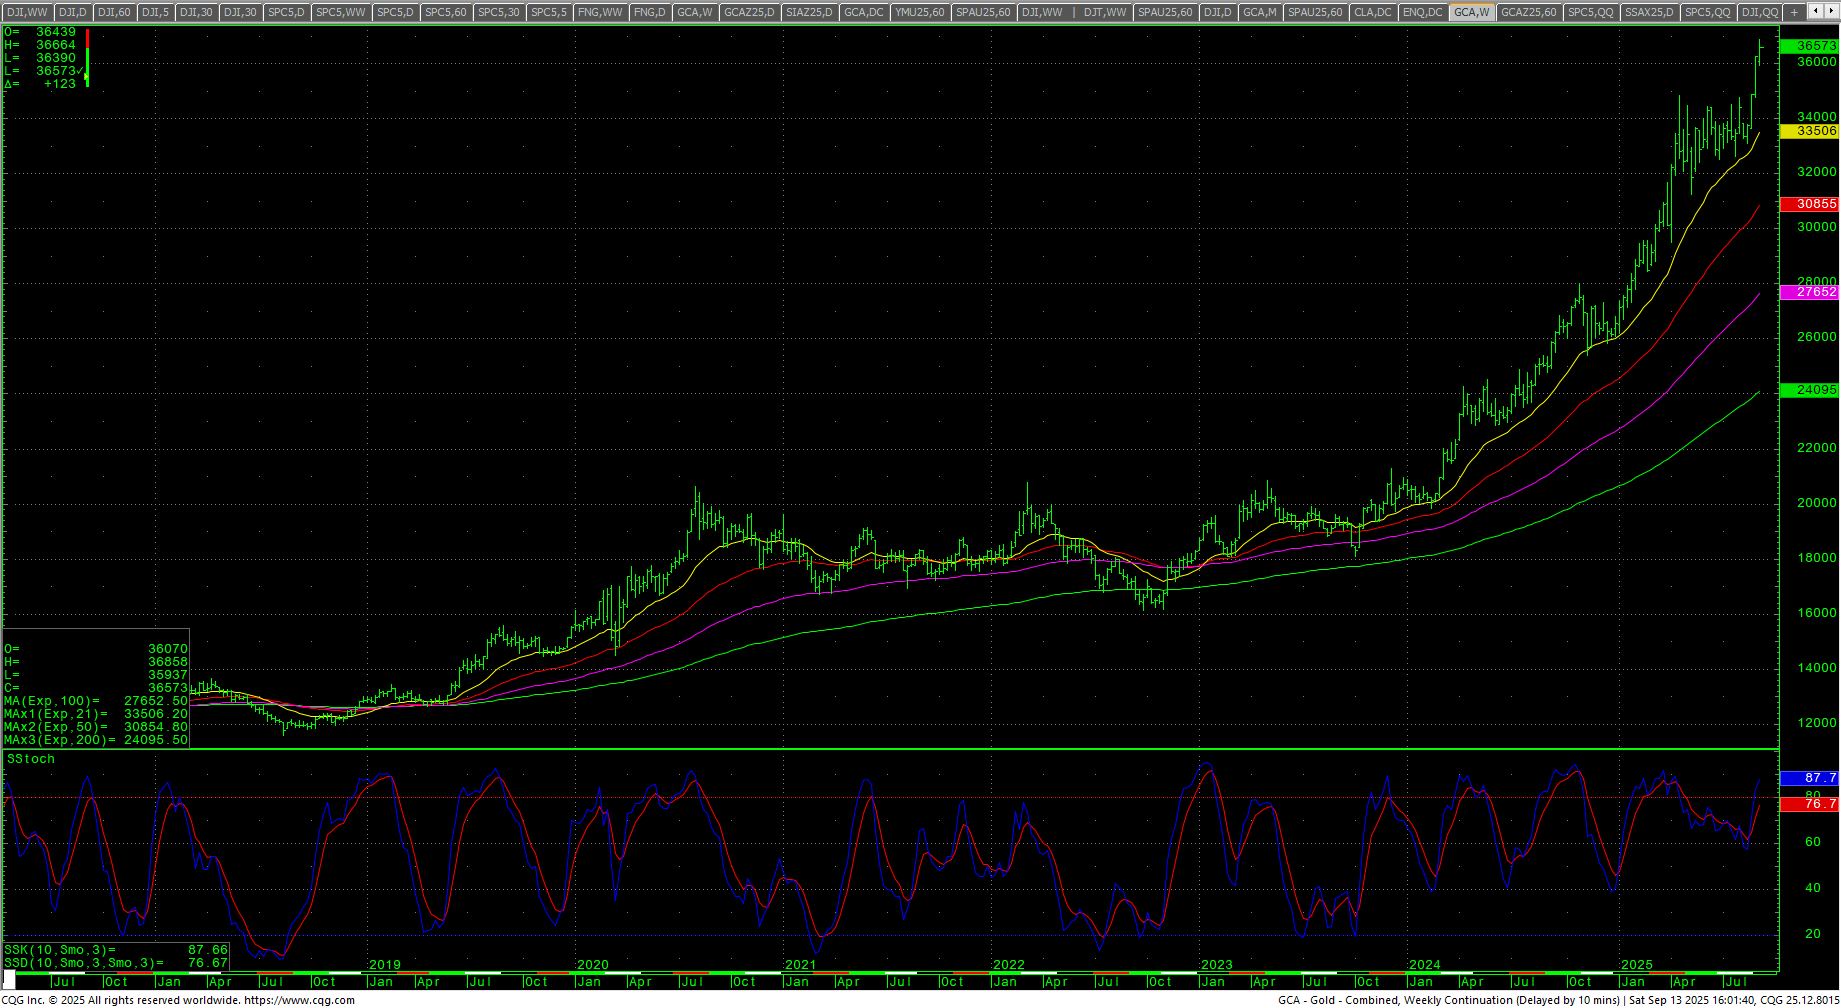
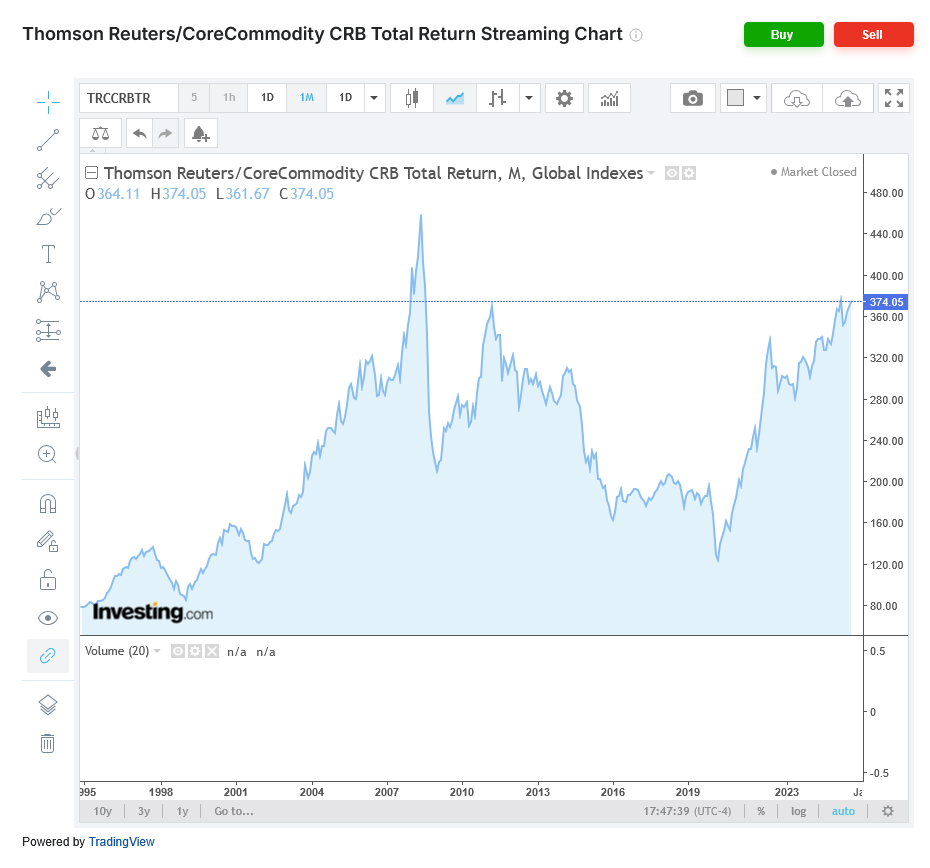 The CRB Index was up +0.54%. Crude oil held in an extremely tight range and closed up slightly. The XLE rallied back as it congests just under the recent tops. Gold rallied to record highs for the spot futures as it tested the $3700 level. Silver exploded to the highest levels since 2011 and cleared the $42 level. The CoT for the S&P 500 shows asset managers holding steady with small specs adding slightly. The CFTC S&P 500 Non-Commercial Net Positions ended at -173.7K.
Timing Points
This week is a CRITICAL CYLCE WEEK through the 19th of September.
- 09/16-17 *** X critical week to the 19th
- 09/23 ***
- 10/01 ** key to bonds/dollar
- 10/06 **
- 10/13 *** X
- 10/22 ***
- 10/28-29 *** X
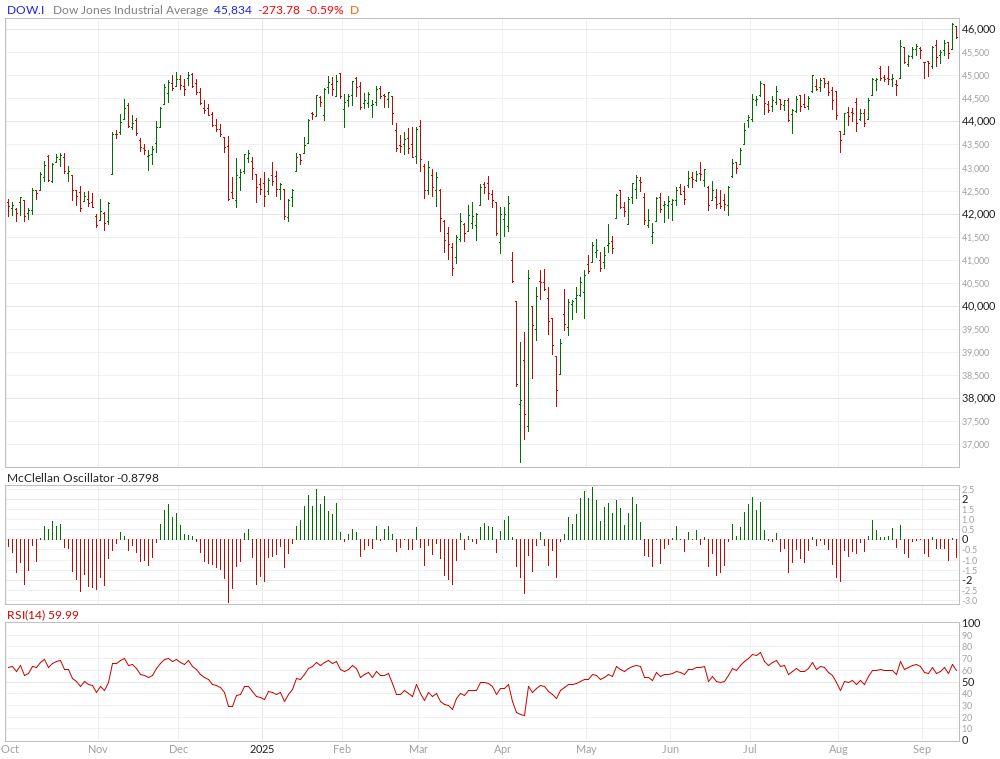
Dow Jones Industrial Average
Dow Jones Industrial Average Weekly H-L-C
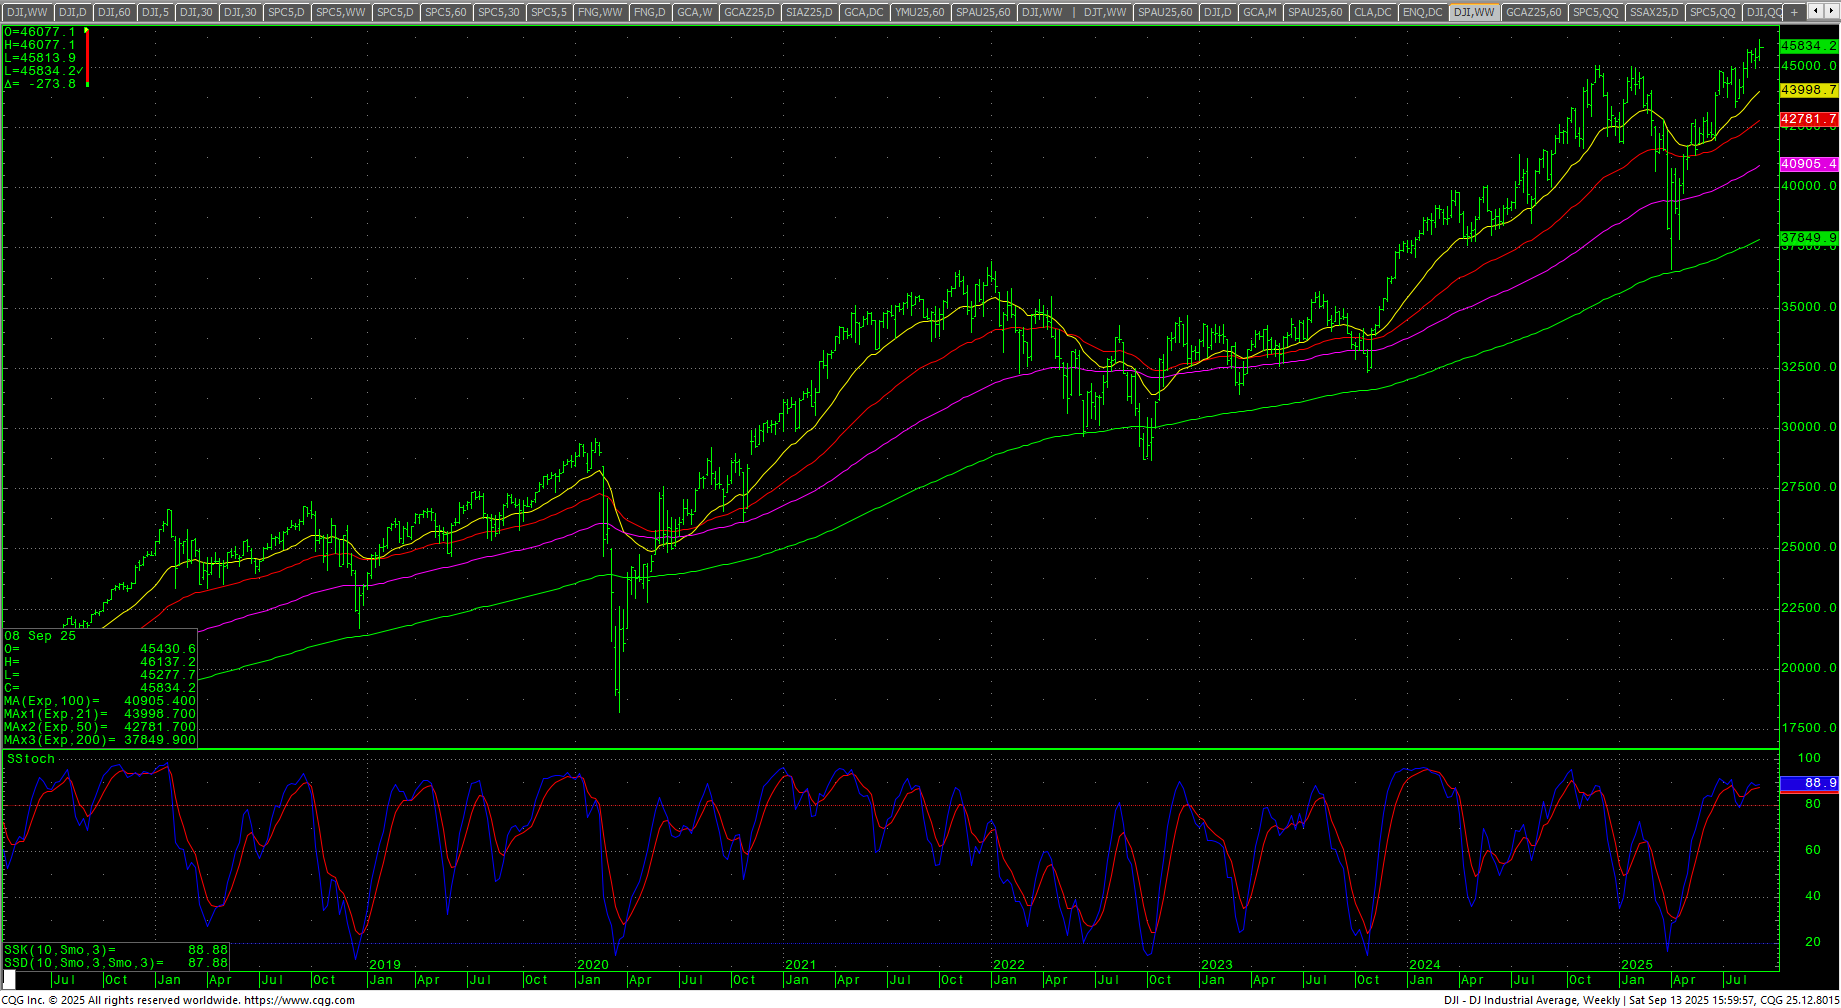 The Dow closed the week up +0.95% on the upper end of the range setting new all-time highs. The daily stochastics and MACD are up with preliminary bearish divergences. The daily RSI is 59.8. The 200-day MA starts the week at 43075.20 and is at record highs.
Dow Jones Industrial Average Weekly Candles
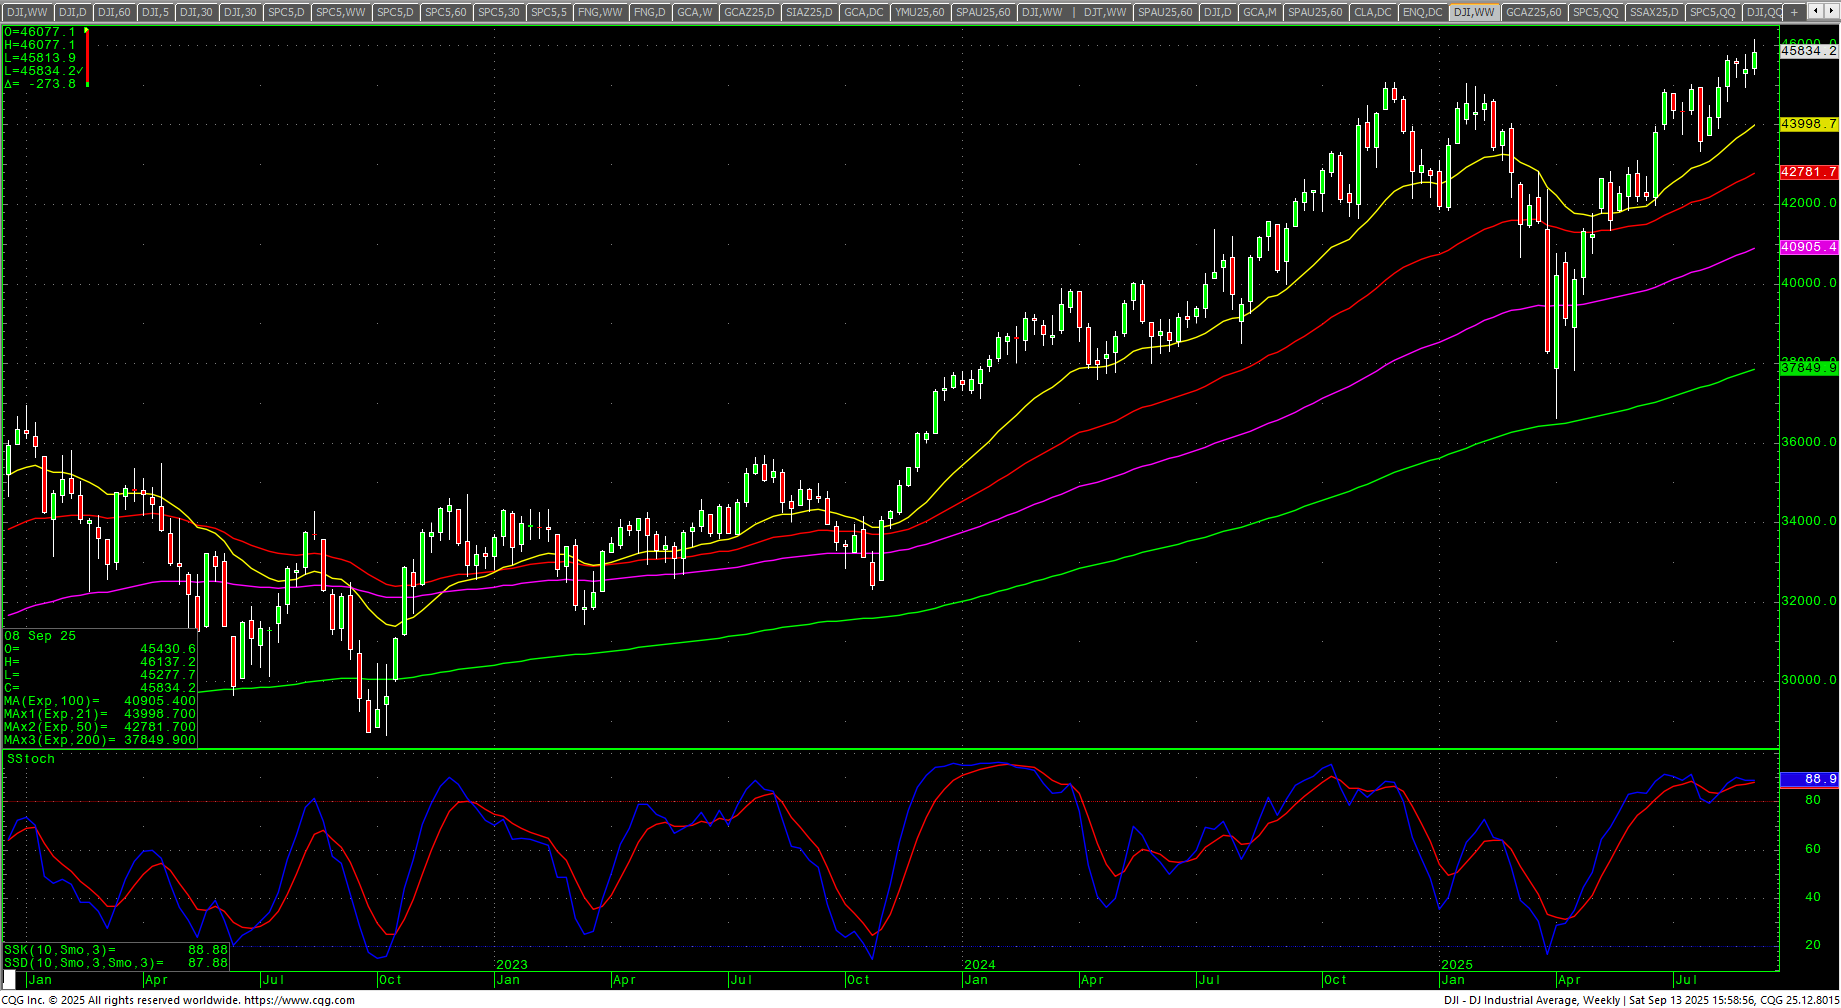 Resistance is 45975 and 46013/46015. A drive above 46015 sets up key resistance now at 46062/46077. Closes over 46077 sets up 46134 and 46206 to 46278. Resistance is critical at 46368 and closes above that level count to 46494 and 46566. Closes over 46566 setup a move to 46710 with counts to 46854. A drive above 46854 would offer fuel toward longer-term monthly targets in the 47400 level with targets at 46998/47000.
Dow Jones Industrial Average Hourly H-L-C
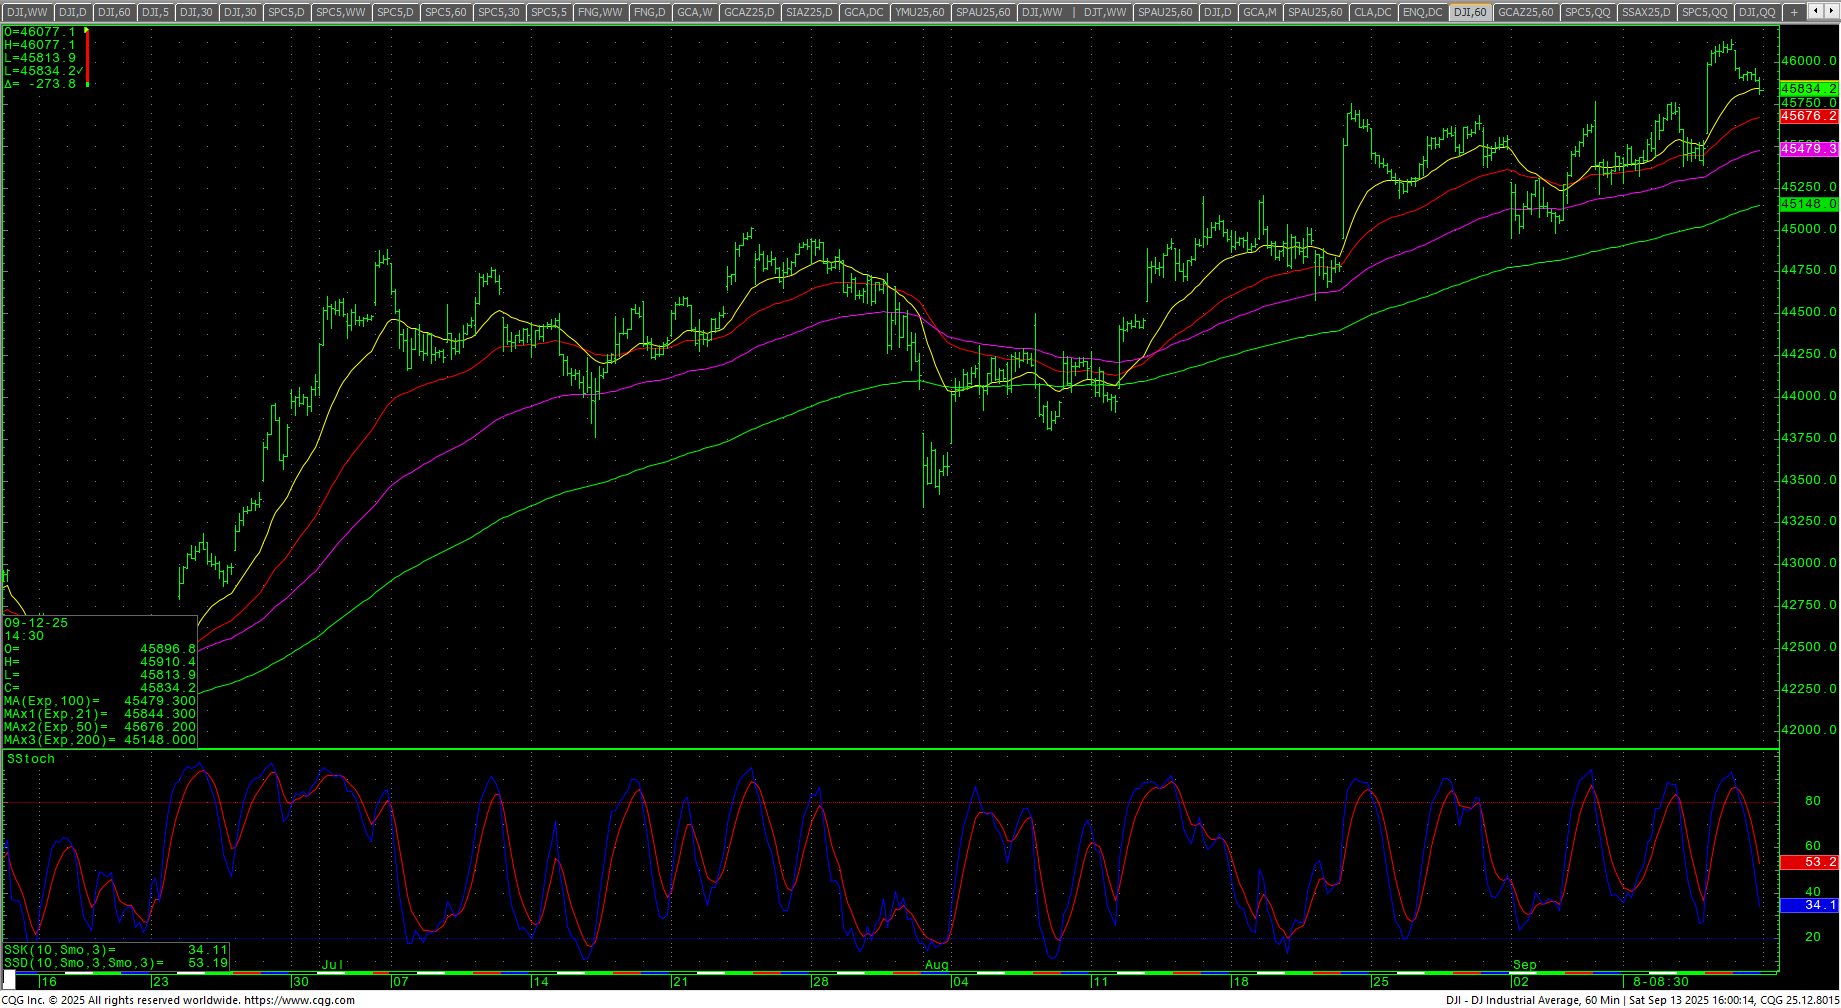 The hourly is neutral on Friday’s close. Support is 45770 and 45682. A break under 45682 sets up 45542 with counts to 45402/45400. Closes under 45400 are near-term bearish with counts to 45245/45228 through 45211 with full potential to 45068 and 44948. A near-term break under 44948 would be the first signal that price is stressed. Under 44948 should minimally test 44738 with potential to critical short-term support at 44408/44405. Daily closes under 44405 should minimally test 44039 through 44000 and opens full counts to 43340.
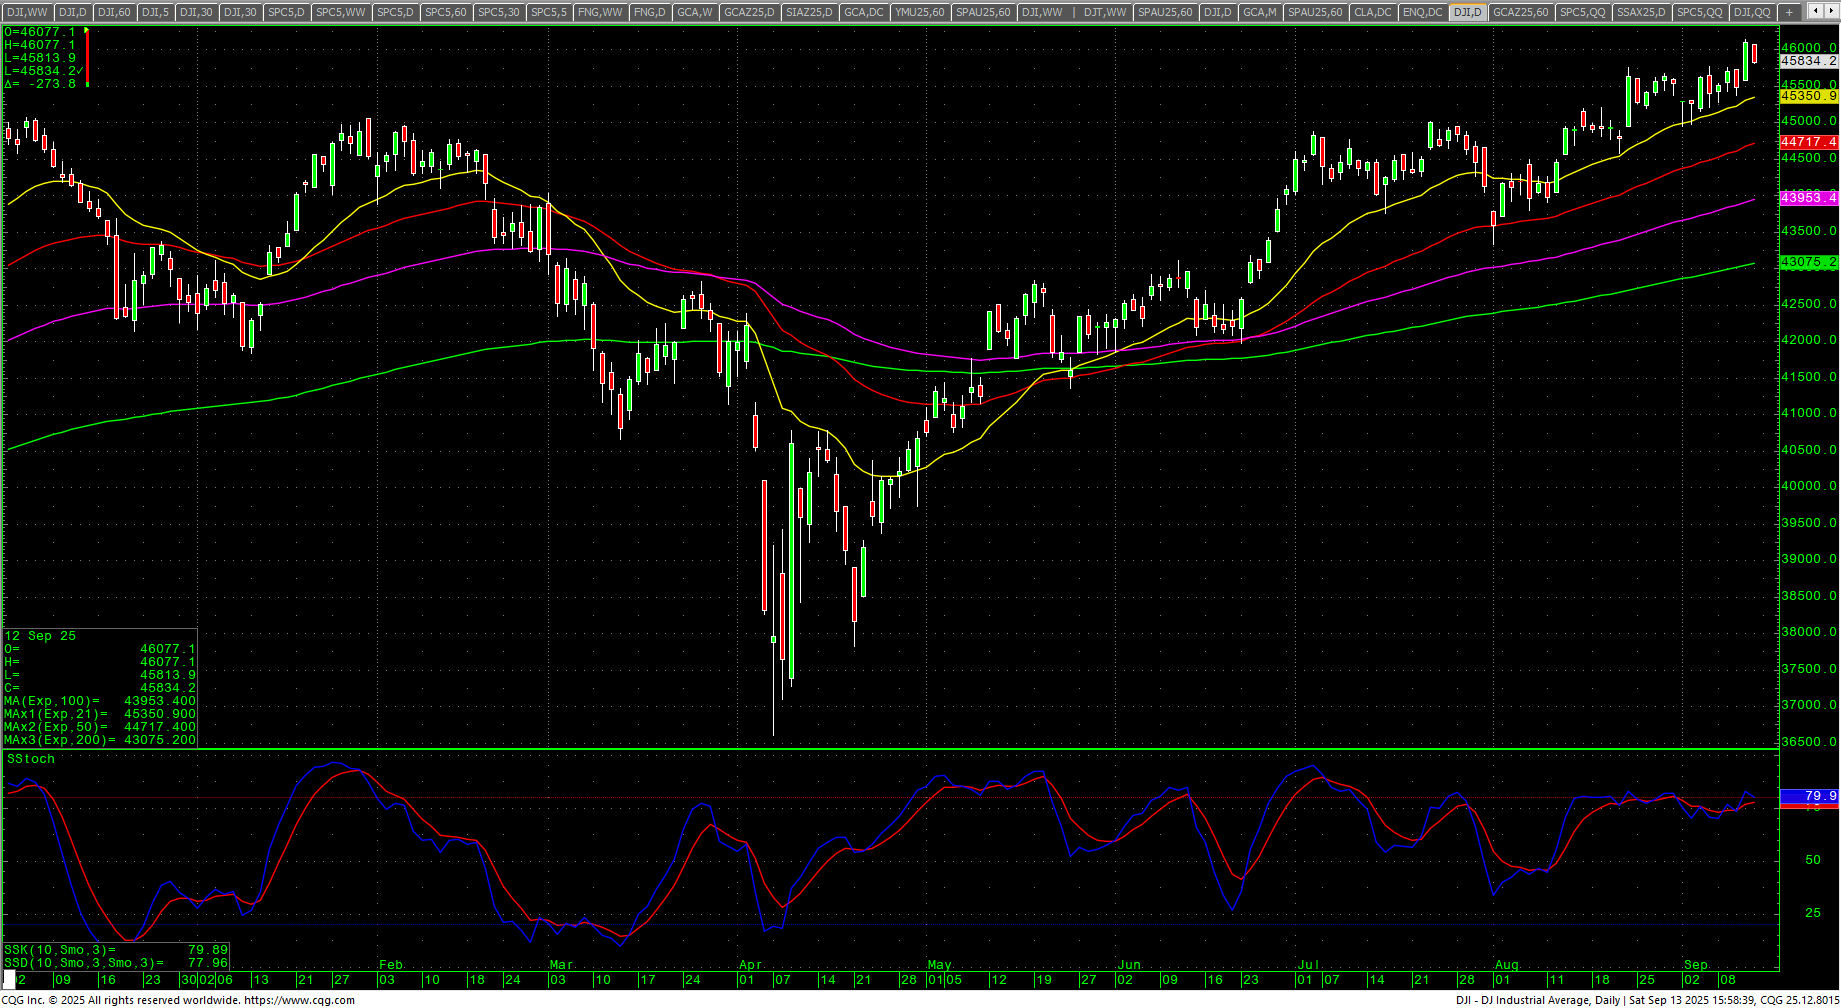
Dow Jones Industrial Average Daily Candles
| Resistance | Support |
|
|
S&P 500 Cash Index: SPX
S&P 500 Index Weekly H-L-C
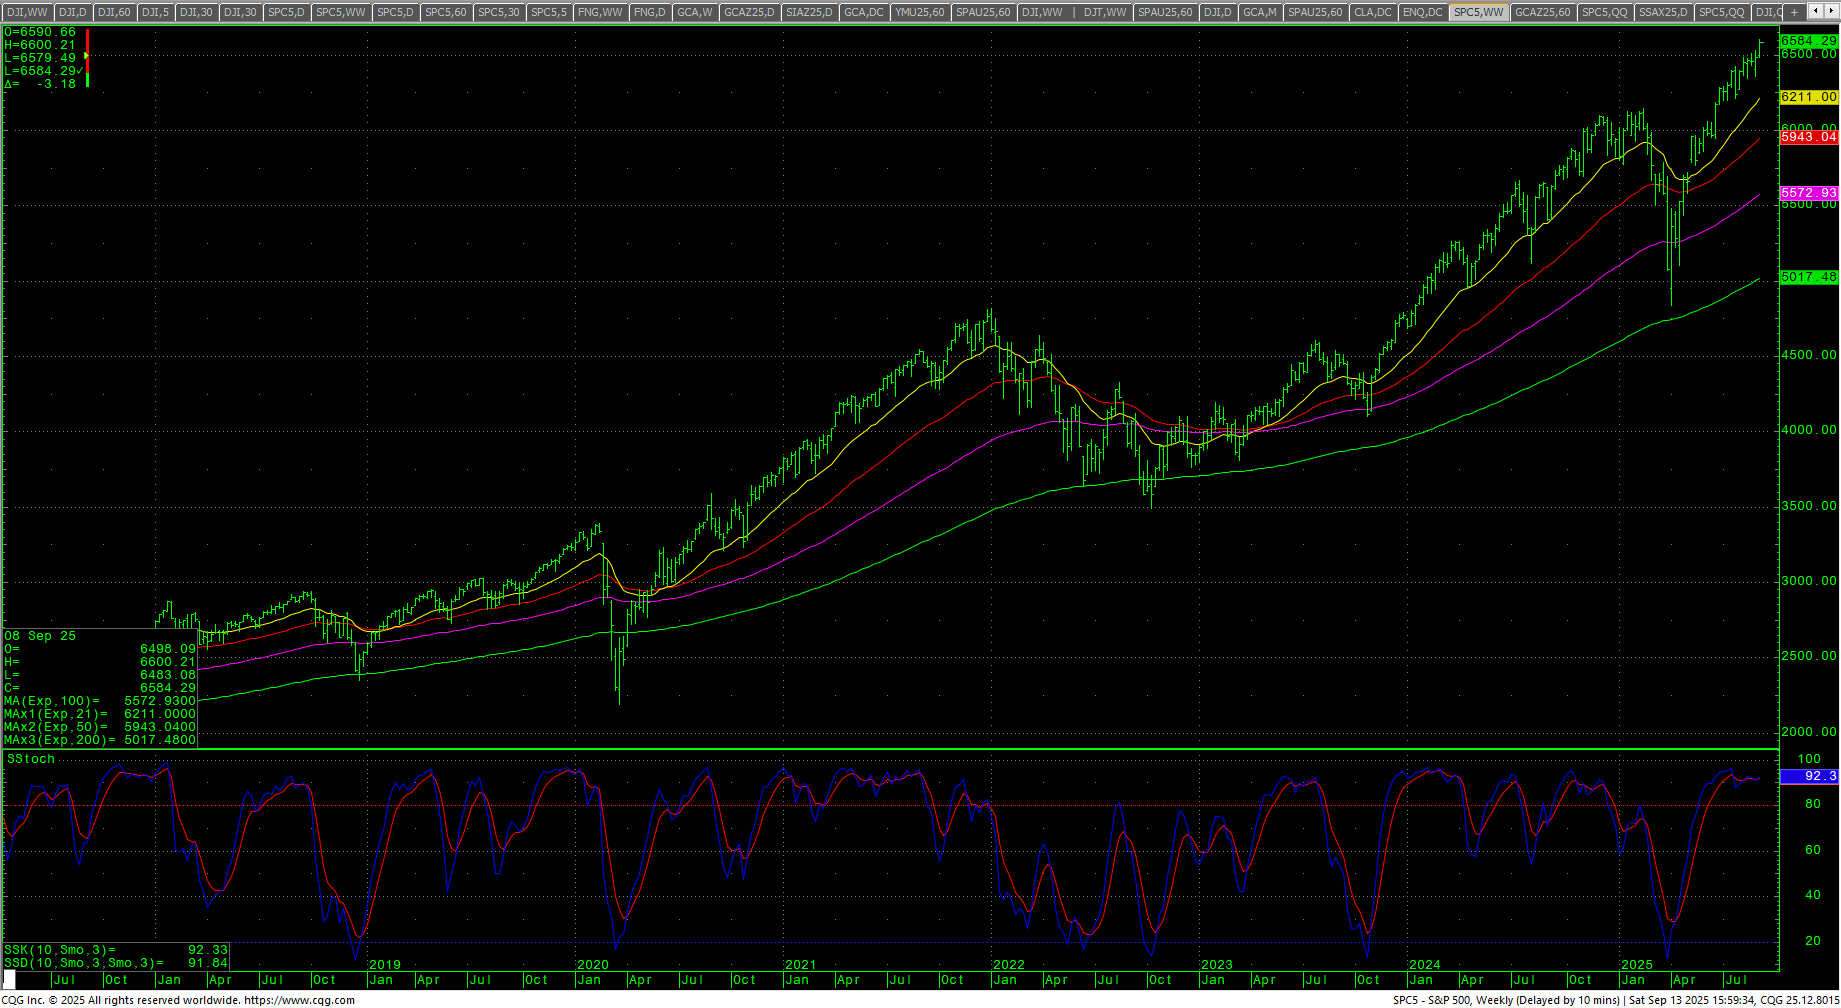 The S&P moved into record territory but closed flat on Friday and closed out the week at a record high weekly close after setting a daily ATH high close intraweek just above the 5600 level…ending up +1.59%. The daily stochastics and MACD are up with preliminary bearish divergences. The weekly is up with a preliminary bearish divergence. The daily RSI is 70.09. The hourly is overbought on Friday’s close. The 200-day MA is 6003.27 and at record highs. The SPY set an ATH Thursday before a slight break Friday.
SPY Weekly Candles
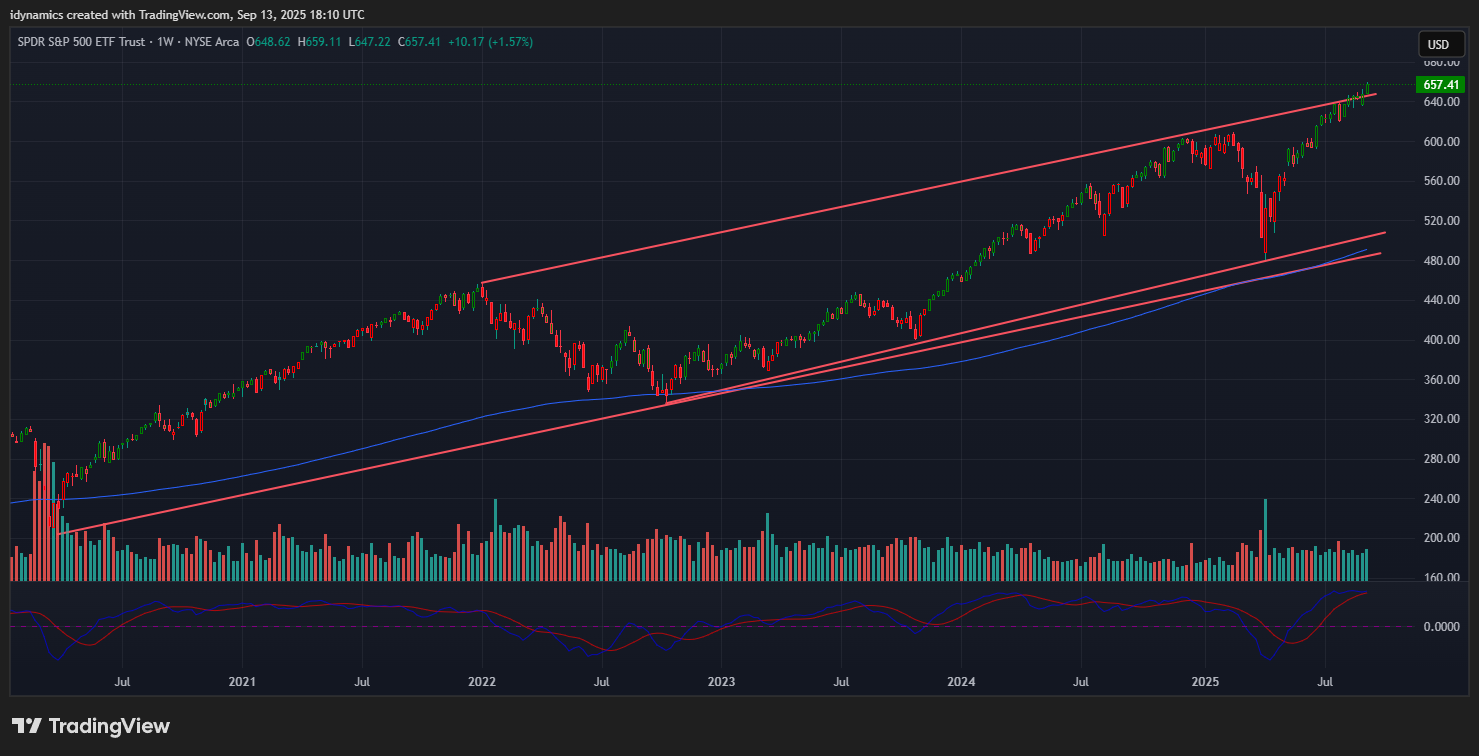 Resistance is 6592/6594. Rallies over 6594 should retest pivotal resistance at 5600/5602. A breakout over 6602 sets up 6638 and 6692. A breakout with closes over 6692 counts to 6764 and 6800. Closes over 6800 can carry to 6872 and 6908. Closes over 6908 have counts to 6944 and 6980 through 7016. A close over 7016 offers counts to 7088,7160 and 7214.
S&P 500 Index Hourly H-L-C
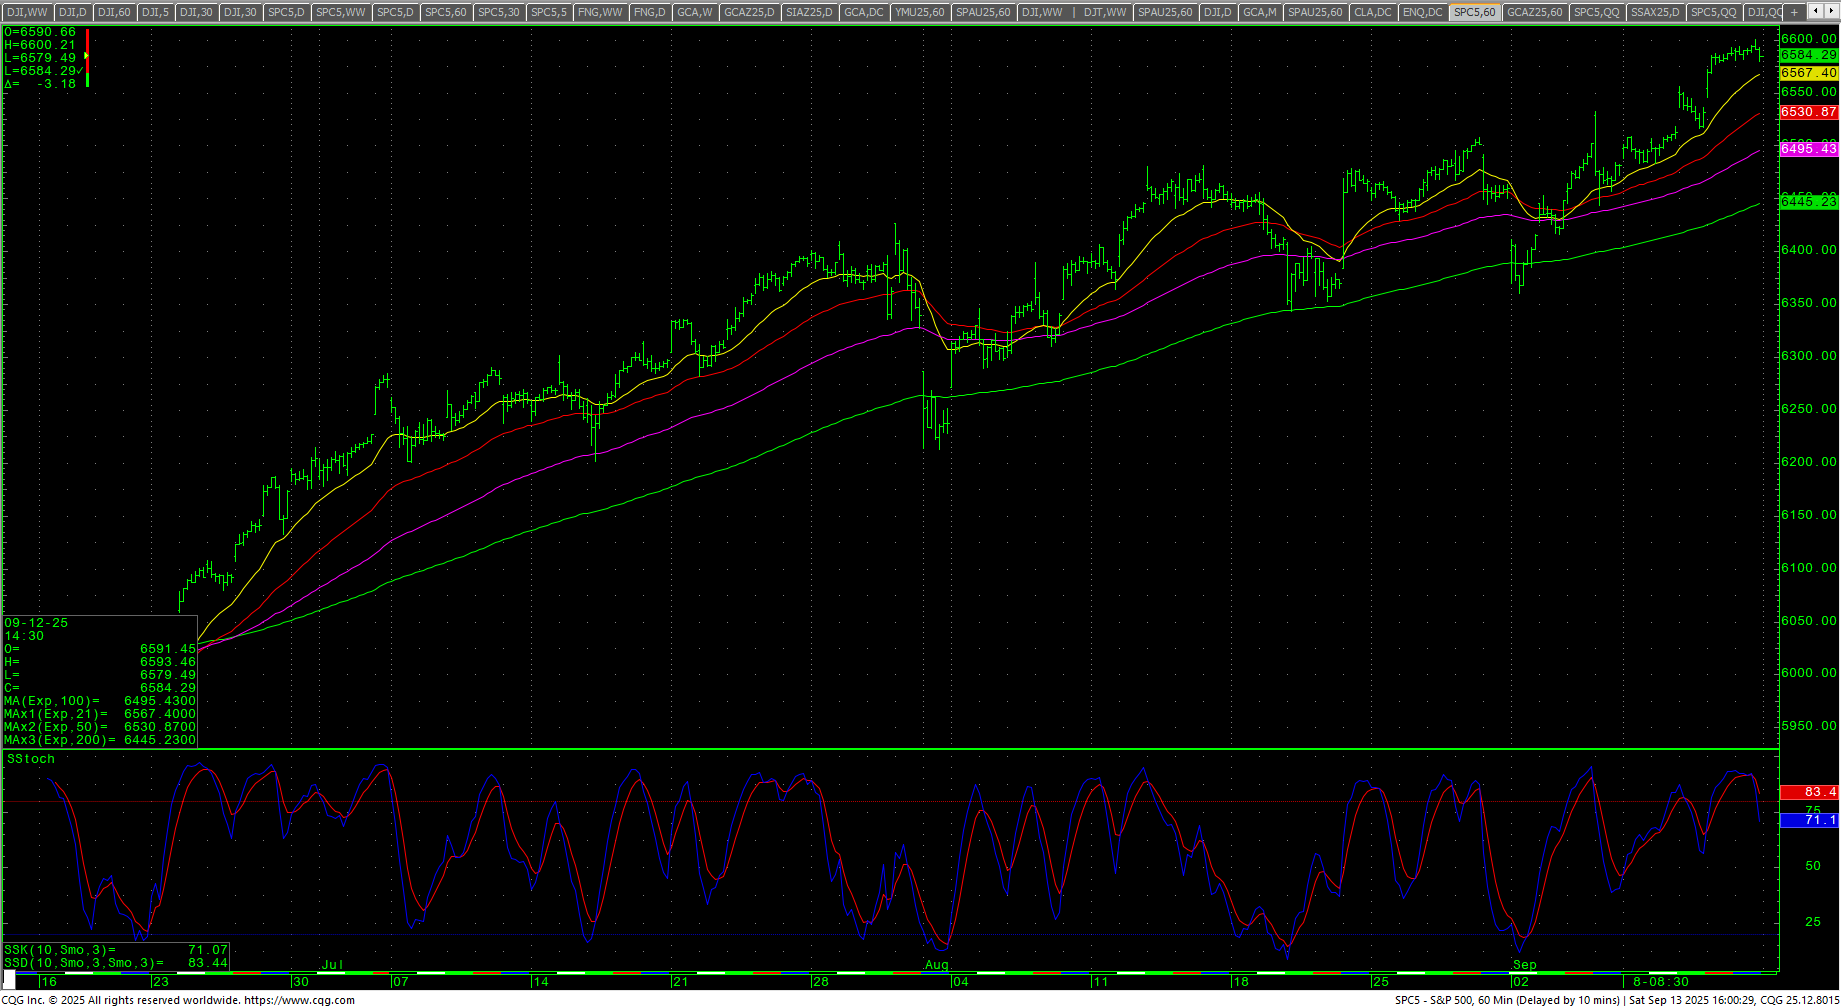 Support is 6543 and 6508. A breakdown under 6508 should test 6480 with counts to 6452/6450. Closes under 6450 should test 6418/6416 and opens counts to 6310/6306 with support at 6343. A breakdown under 6306 should minimally test 6213 through 6201 at the hourly double bottom. Closes under 6201 setup 6158 with full counts into potential to 6132. A breakdown with closes under 6132 can carry to 6059 with full counts to critical near-term support at 5925/5920.
| Resistance | Support |
|
|
Charts courtesy of CQG, Inc., CNN, Koyfin, Trading View and AAII