
TECHNICAL ANALYSIS (by Intraday Dynamics)
Note: There will be no weekly update on the 26th. I might do a short-term support and resistance update early in the week ending October 3rd. In the meantime: “As goes tech, so goes the market.”
Major Indices Week of September 19, 2025
 NYSE Volume
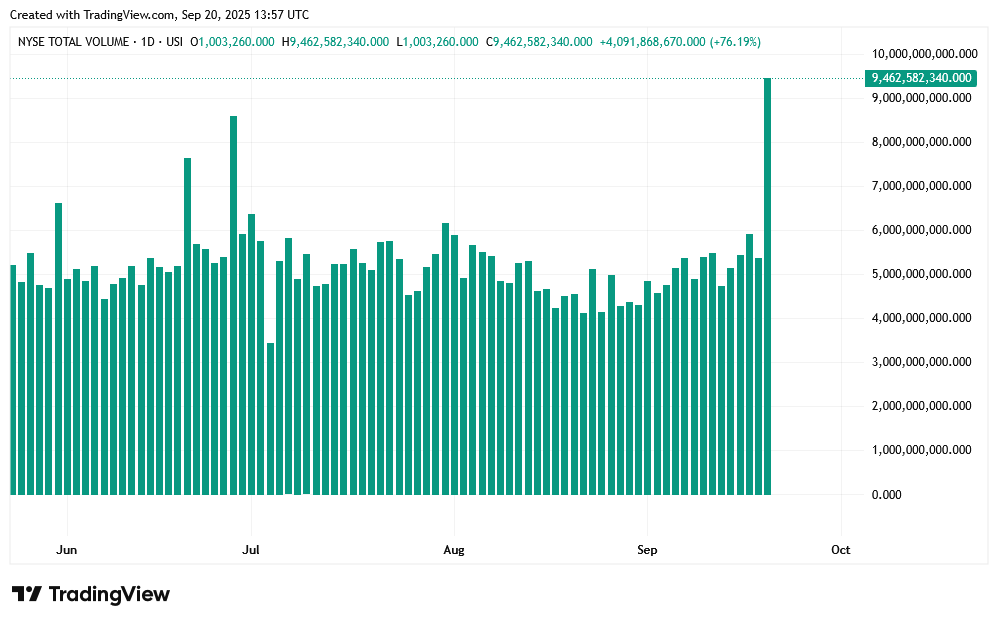 As goes tech, so goes the market. Stocks continued to climb the wall of worry to record highs. Friday’s Quadruple Witching happened with record volume and remarkably little volatility. Remember that the past week marked critical cycle timing, so the action away from the week of 19 September 2025 should be key to short-term trends and possibly intermediate-term trends.
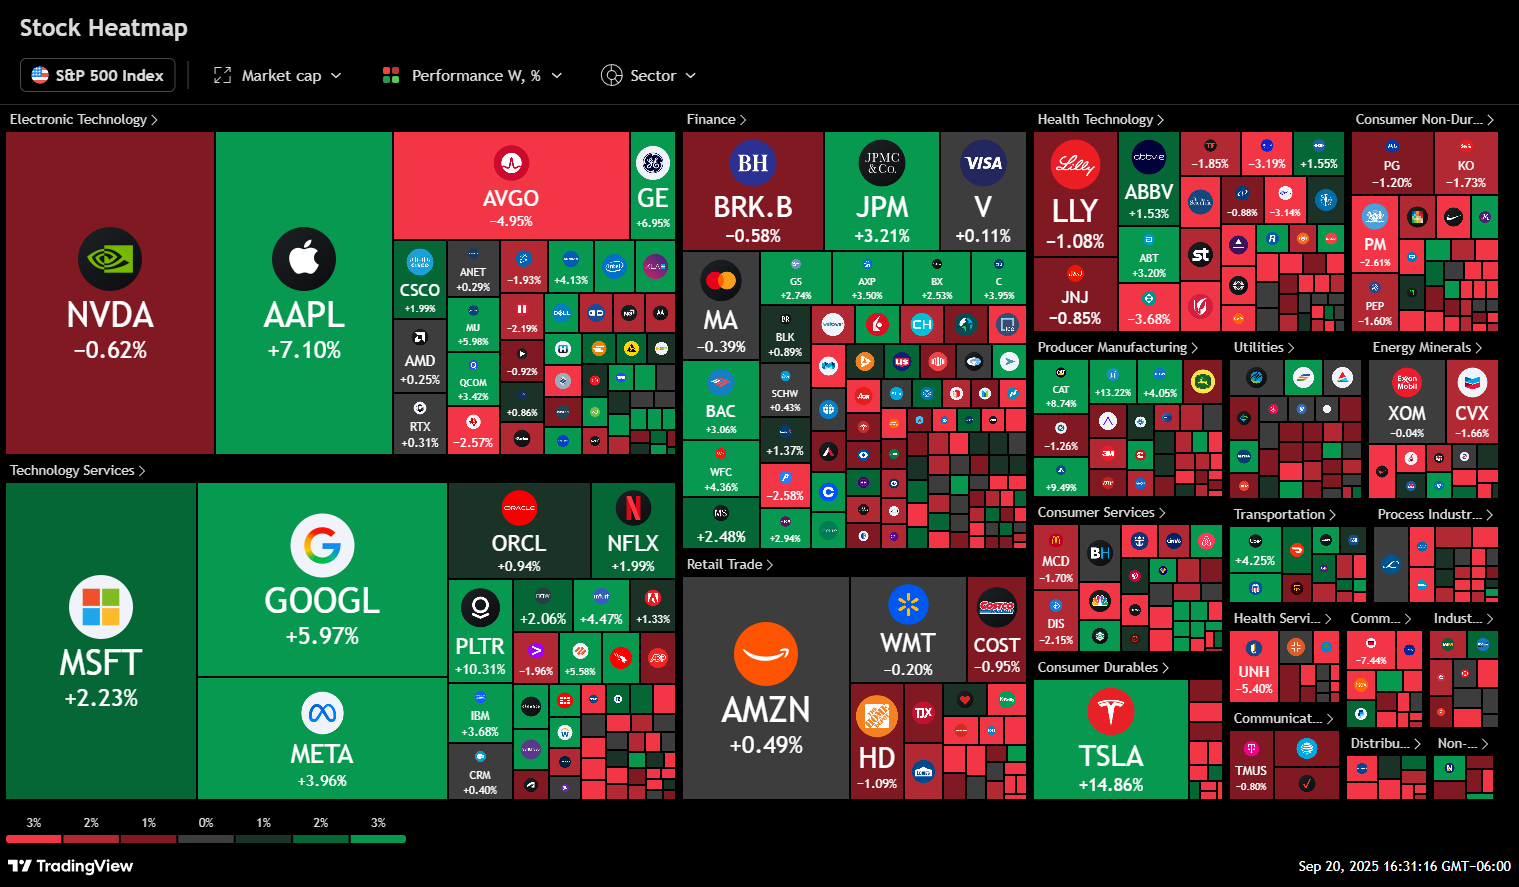
The focus of the week was the FOMC with the (100% certainty) 25bps rate cut. Rather than a “sell the fact,” the indexes took it as a signal that “liquidity is king.” Big tech sees this as a license to keep spending and the tech stocks got juiced on the news.
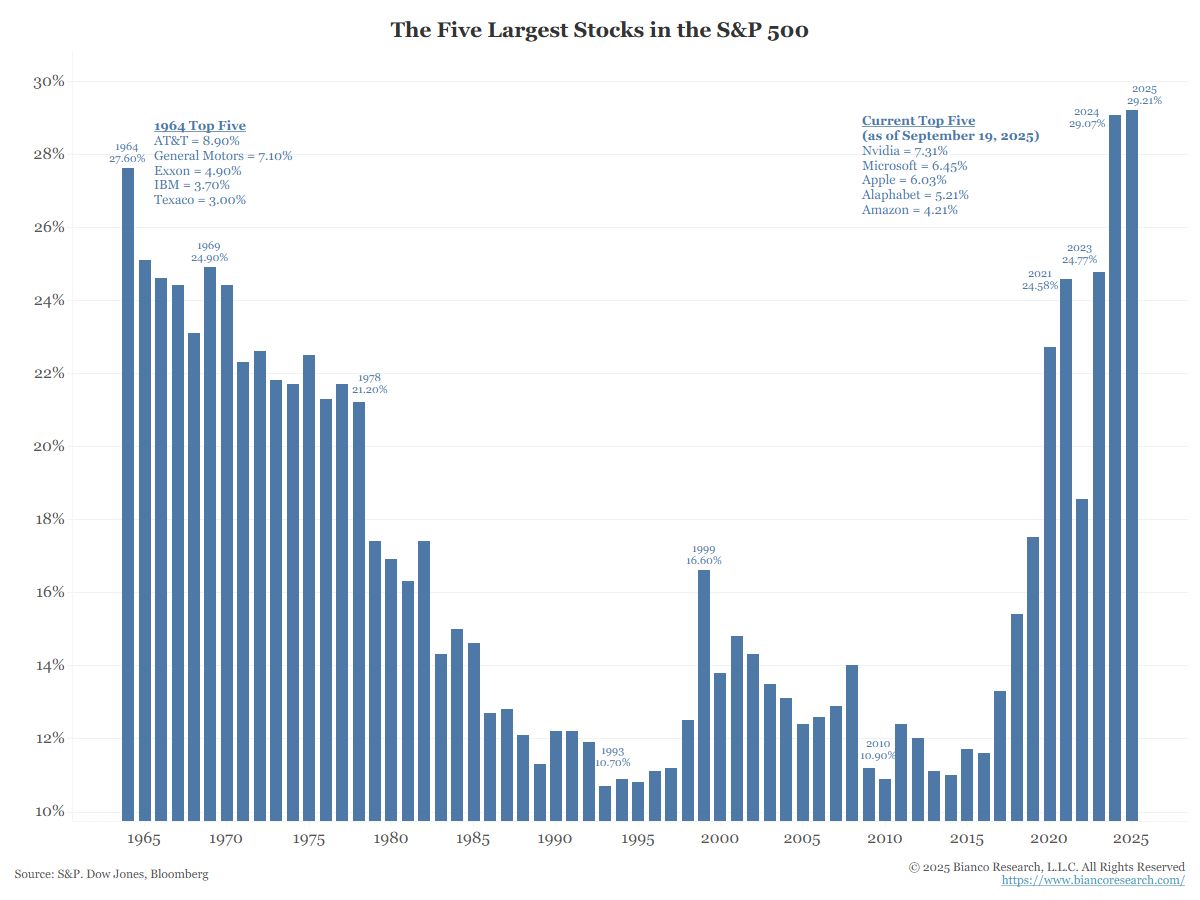
Remember that the market is incredibly concentrated with only ten stocks making up 40% of the entire SPX. Five U.S. companies control the algorithms of their feeds and they act as a neural jack to the country’s population. The algorithms are built on division and rage bait and they remain unregulated as they pump out toxic information to citizens.
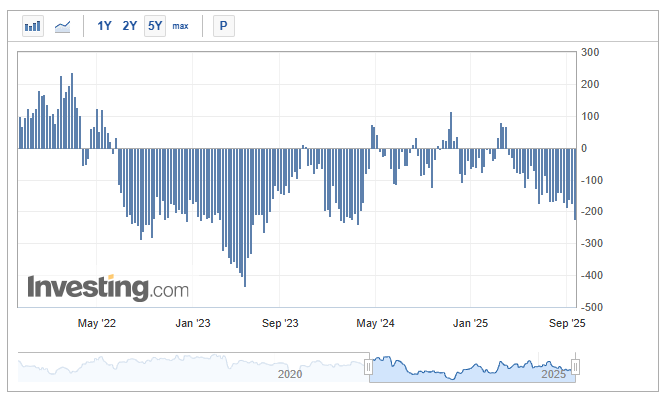
Sentiment jumped a bit with some indicators moving back into greed and extreme greed and the CFTC S&P 500 speculative net positions have plunged to -225.1K, a two year low, which is often a precursor to increased volatility.
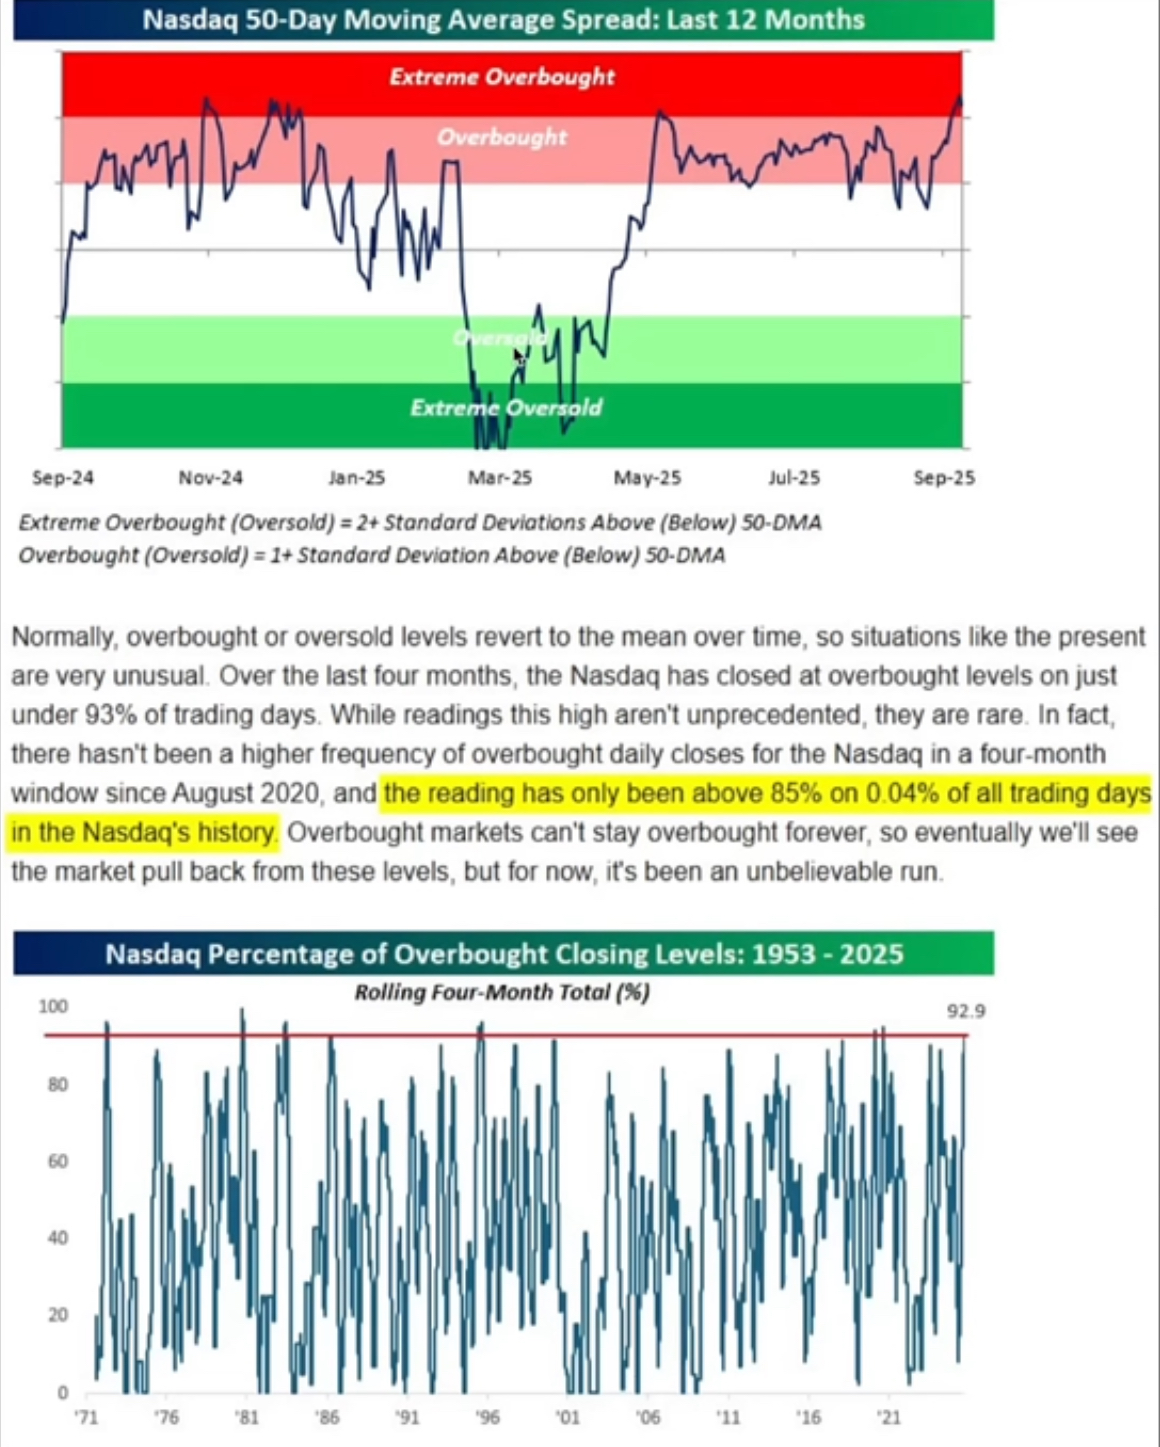 The Nasdaq is not only setting price records, but it is now in all-time record high territory for sentiment as can be seen in the chart above. This is rare air, and we need to go back to 2020 to find readings this euphoric.
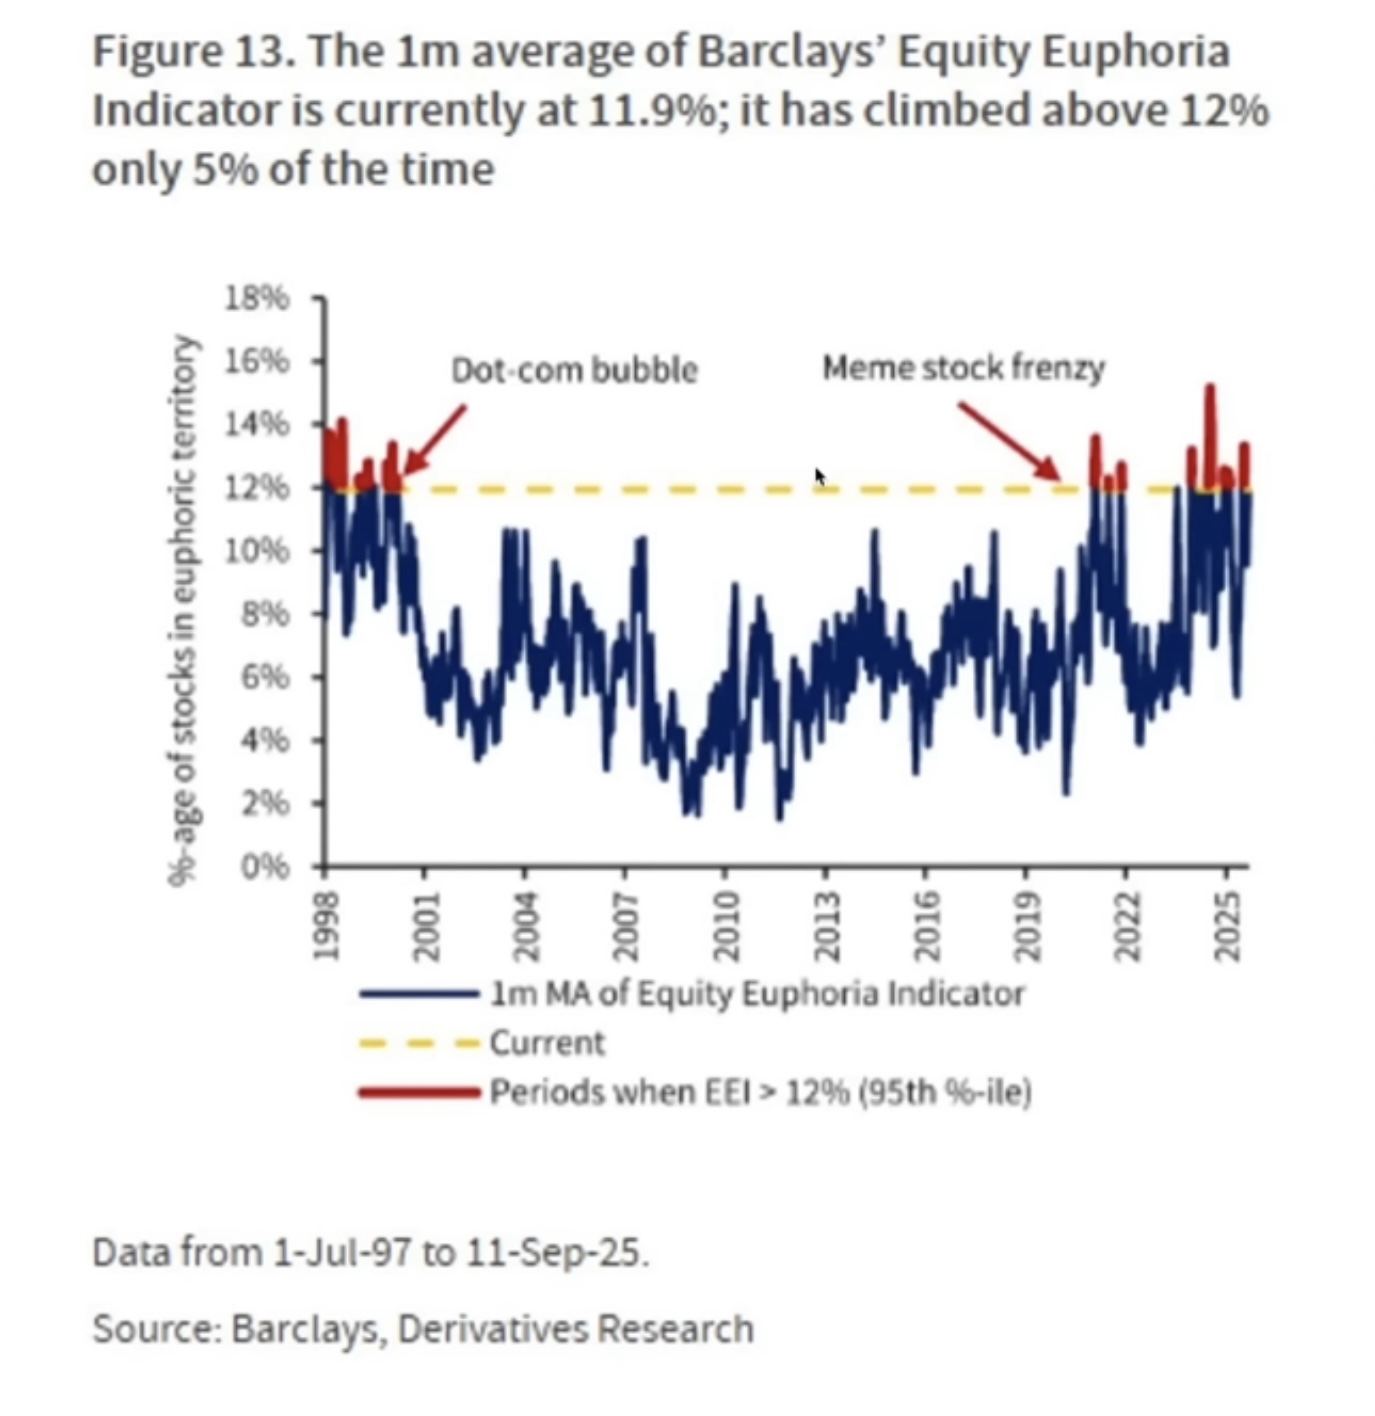
This also puts the Barclay’s Euphoria Indicator into stratospheric readings. While not fully reflected in standard sentiment indicators, this has brought out some pretty insane targets from analysts with people calling for 7000+ on the SPX and Dow 50K+ etc., etc. “…we are not seeing the type of whipsaw volatility that comes when a major top is in process.”
SPX Quarterly H-L-C
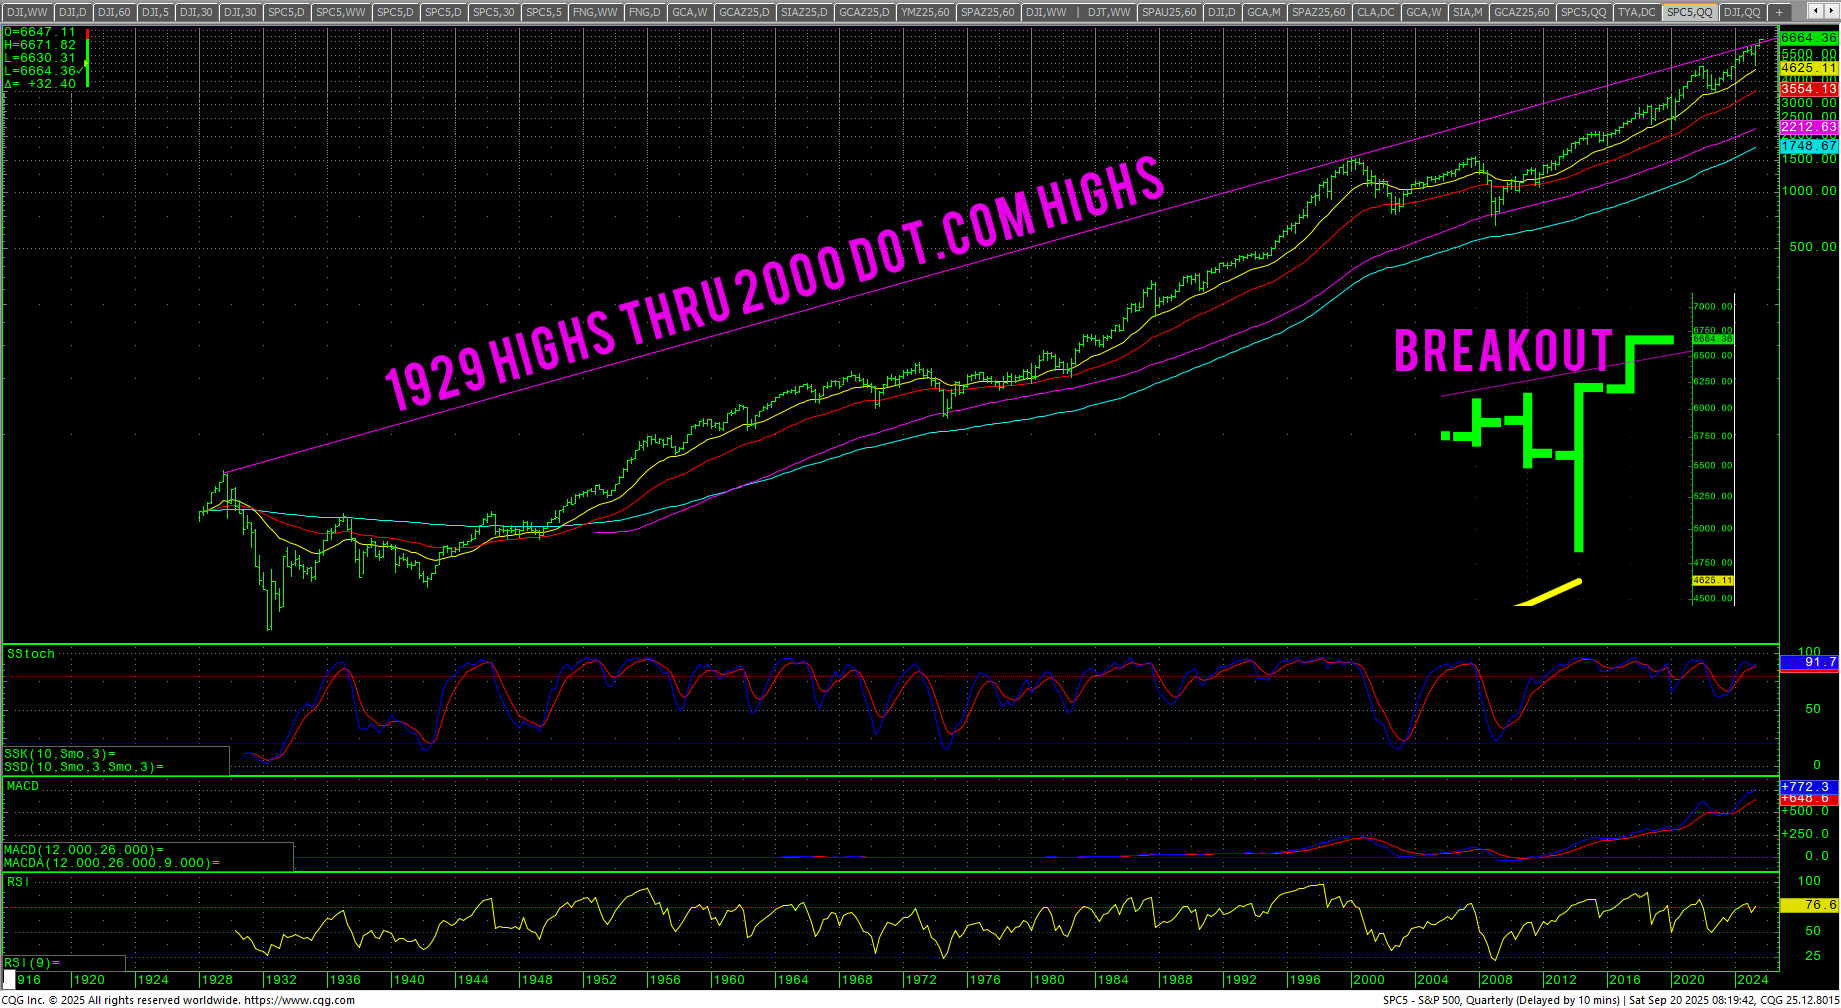 Technically, you could build a case for the super bulls target levels with the SPX on a clean breakout above the trendline that connects the 1929 tops through the 2000 Dot.com tops. There simply is zero technical evidence that suggests prices are exhausting and only a high volume reversal would lend credence to a bearish case. Higher highs and higher lows is the picture and El Trendo es su Amigo.
MAGS+ORCL+PLTR+AVGO Daily Candles
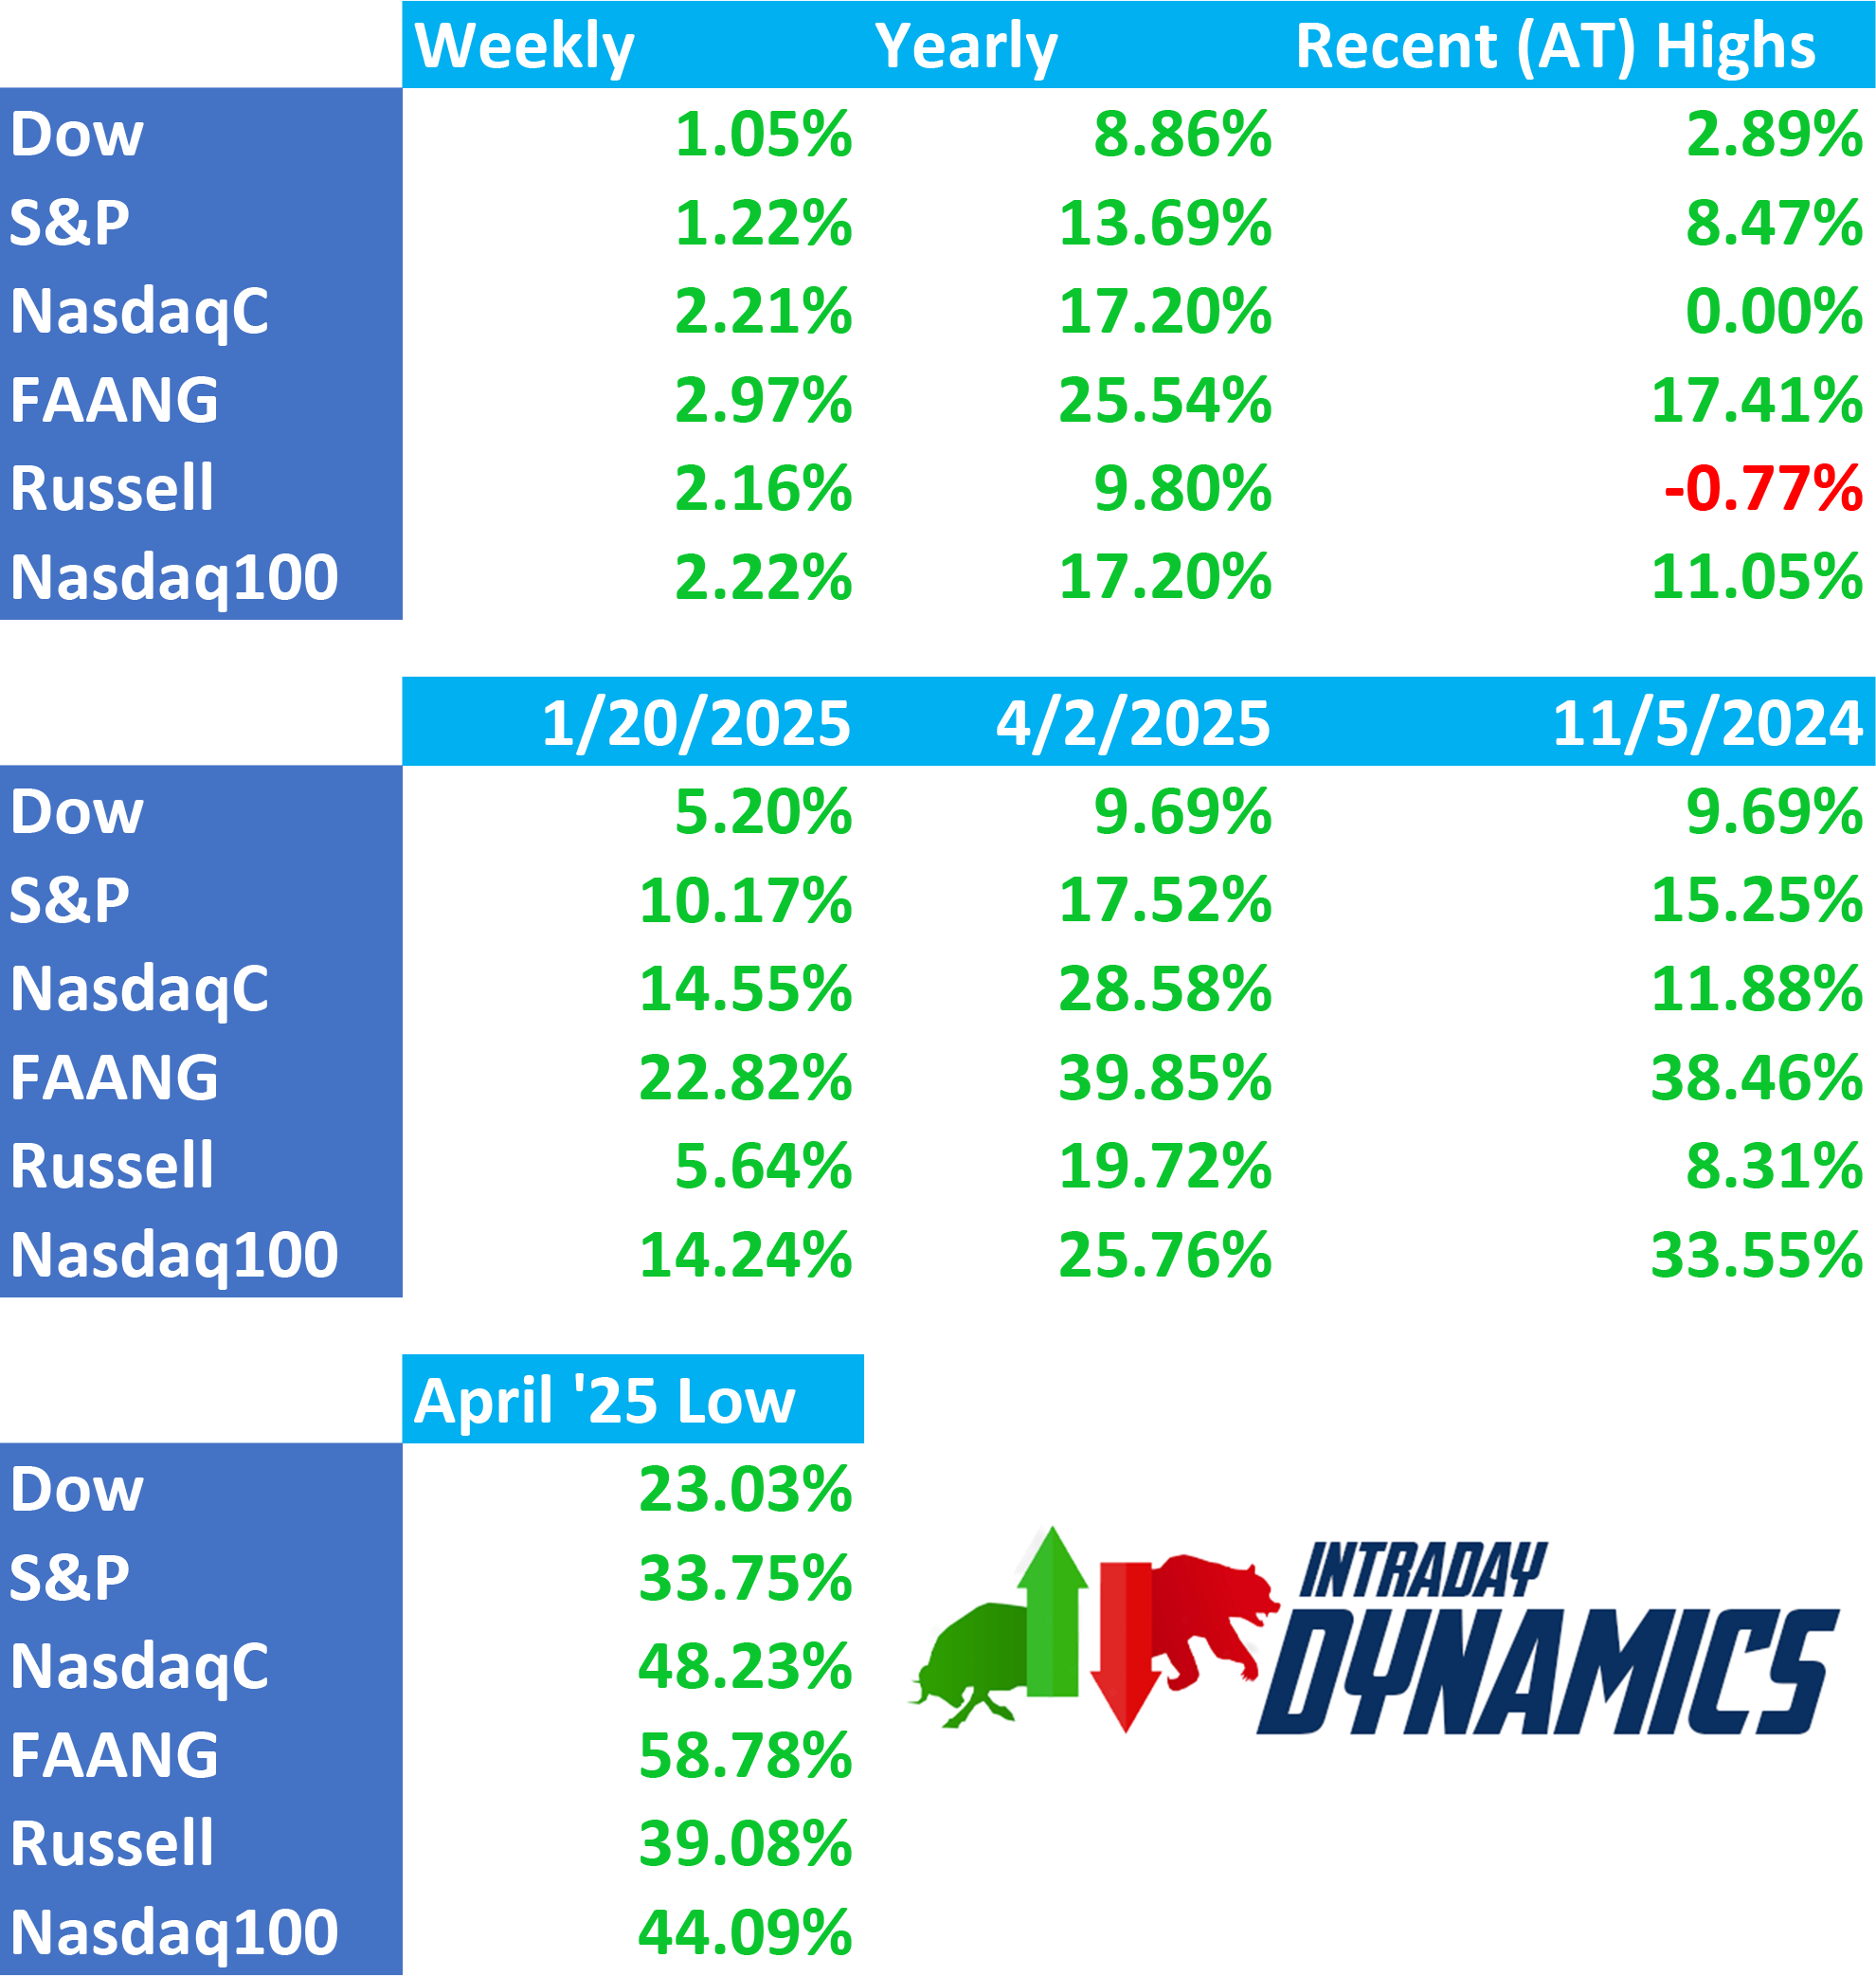
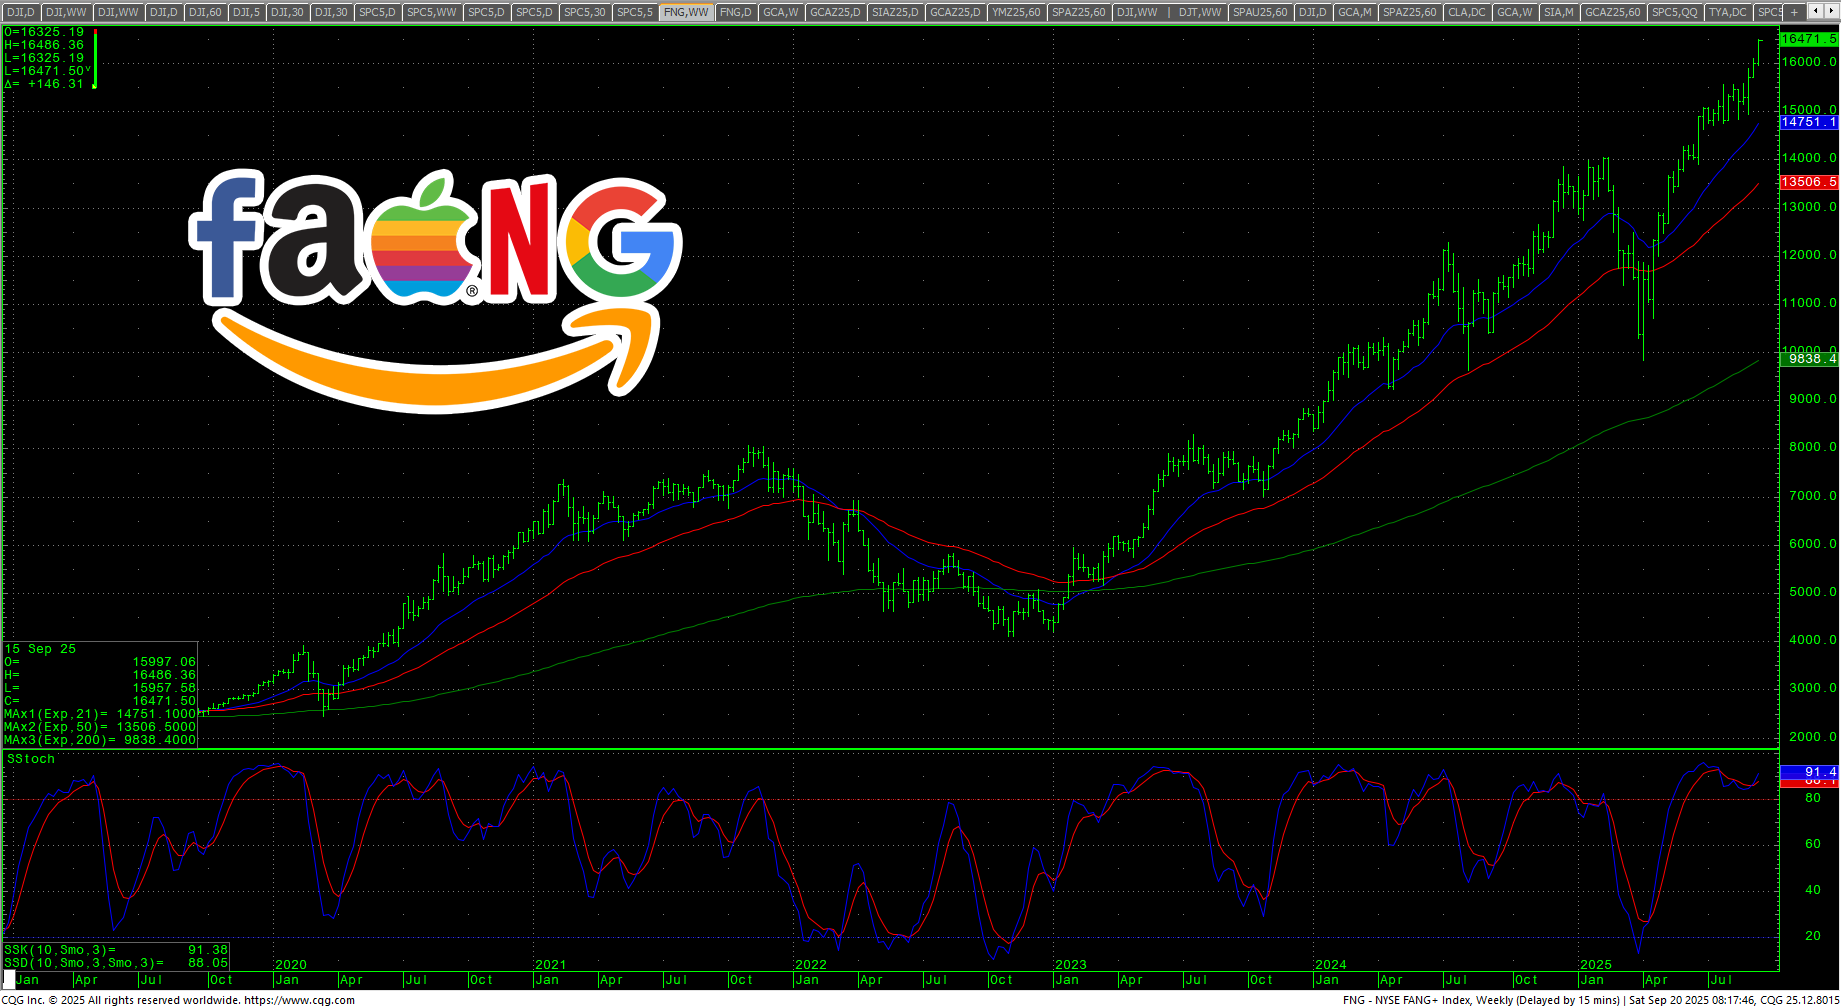
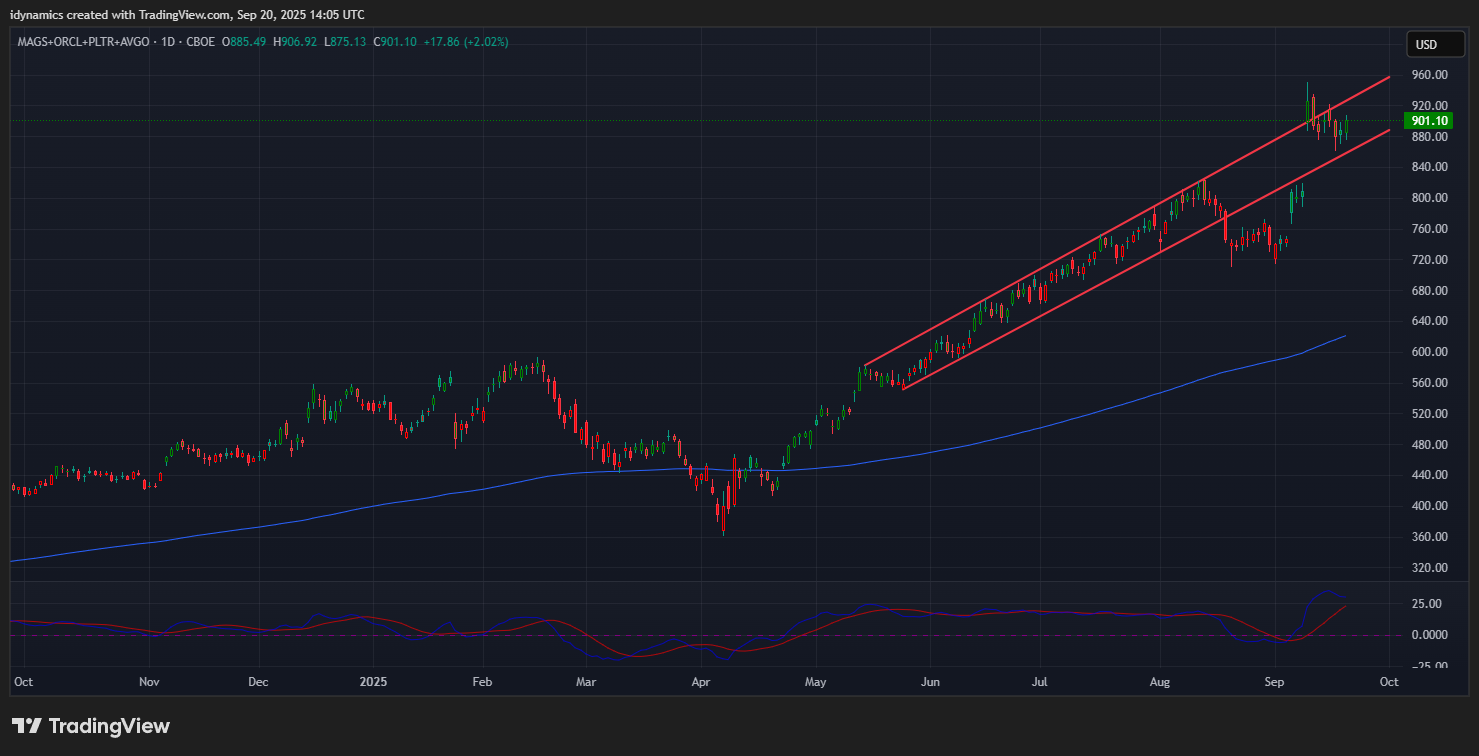 The combined chart of MAGS+ORCL+PLTR+AVGO is now flagging after rejecting the previous breakdown and expanding its massive up channel. The FANG is up +58.78% from the April swing low,
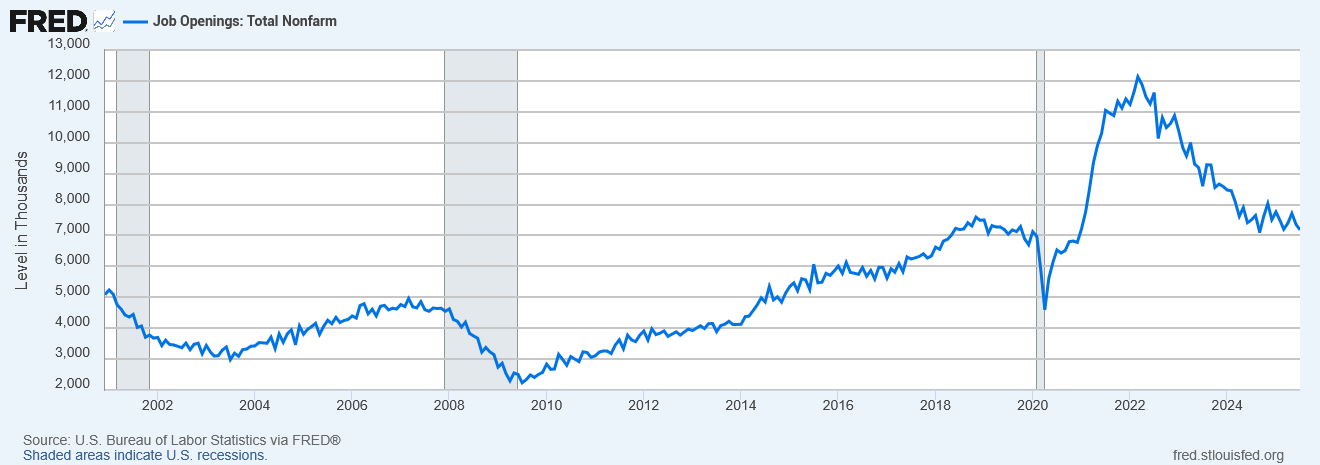
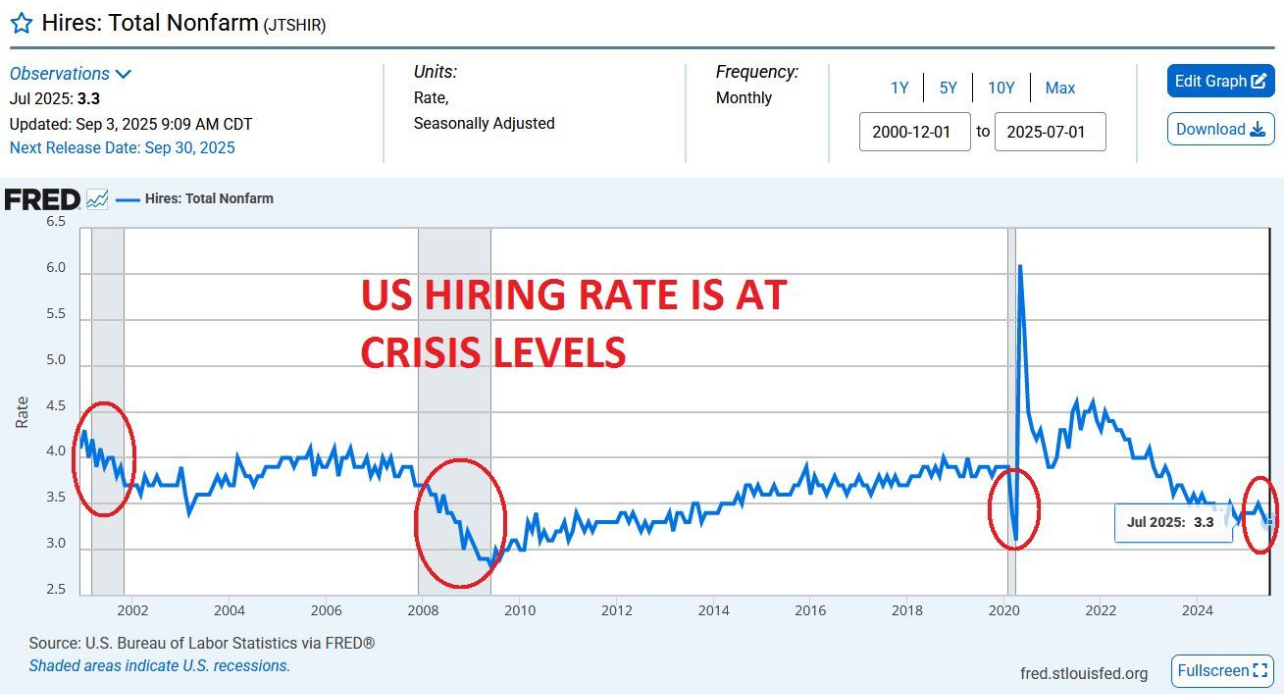 The Fed moved because the job market is deteriorating. Youth unemployment is at 10.5%. In normal times, youth unemployment is often the canary in a coal mine for the overall job market. Black unemployment has risen to 7.5% since Spring.
“From the last Cycle Timing Update, we remain in a 6-9 month window of extremely volatile longer-term cycles. I want to update this comment by stating the recent “political assassination” in the U.S. qualifies as an “endogenous” event…although some conspiracies are floating that it may be “exogenous.” Continue to expect extreme volatility to enter the markets in the next two quarters.”
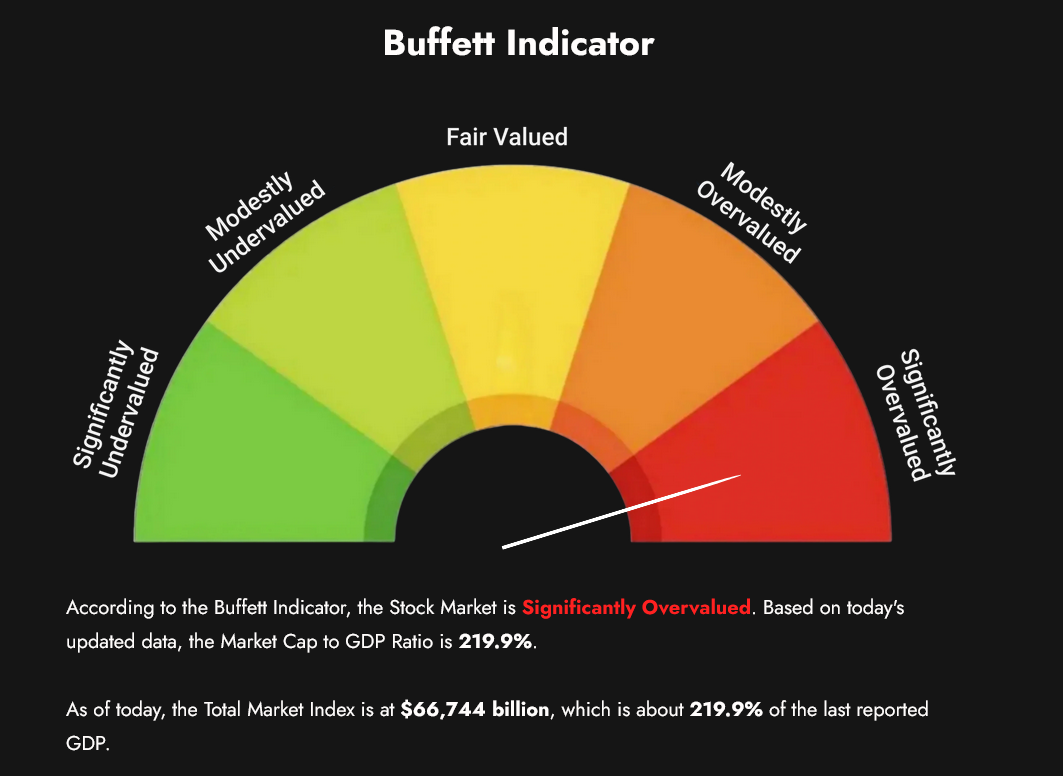
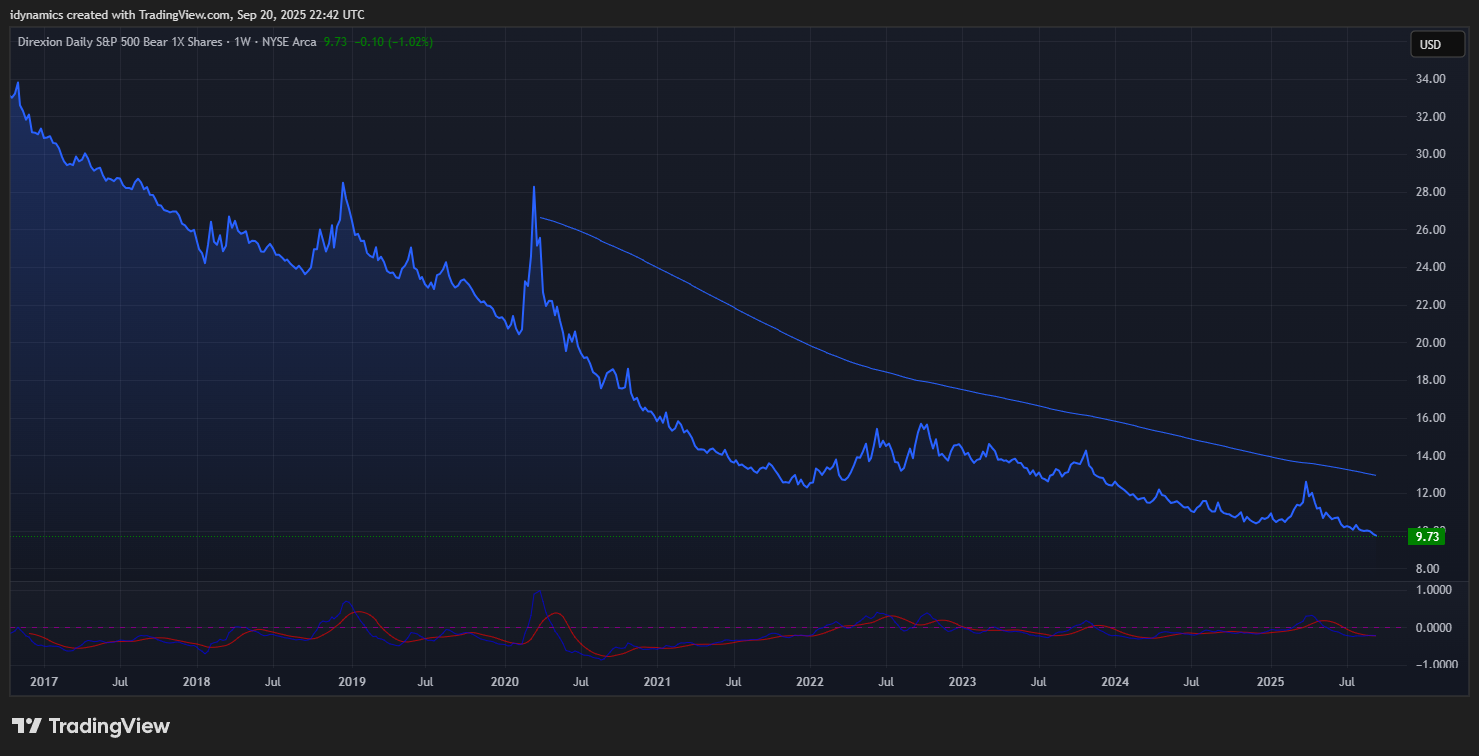 The VIX remains subdued and complacent. The Buffet Indicator hit another ATH above 219.9%. S&P Bear 1X Shares are collapsing to multi-year lows. Other than a plethora of key bearish divergences on the charts, the only indicator that throws any caution is the CFTC position reading.
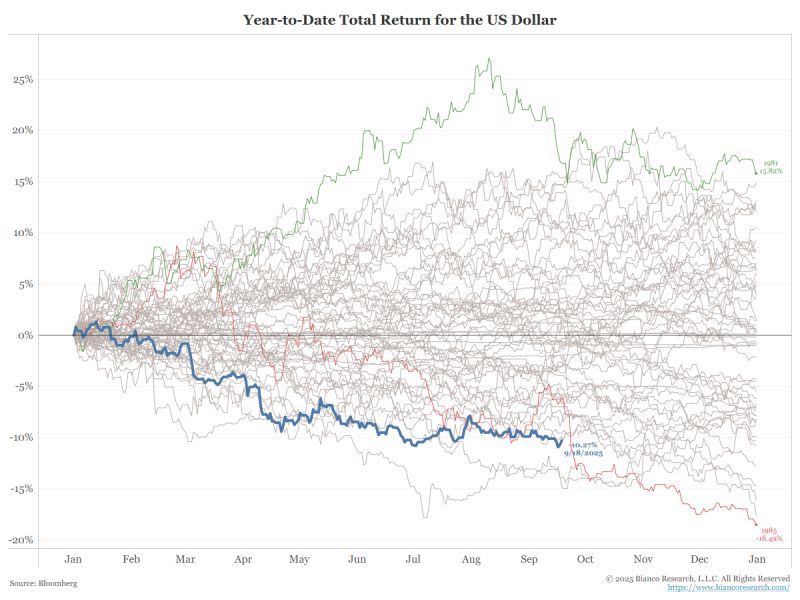
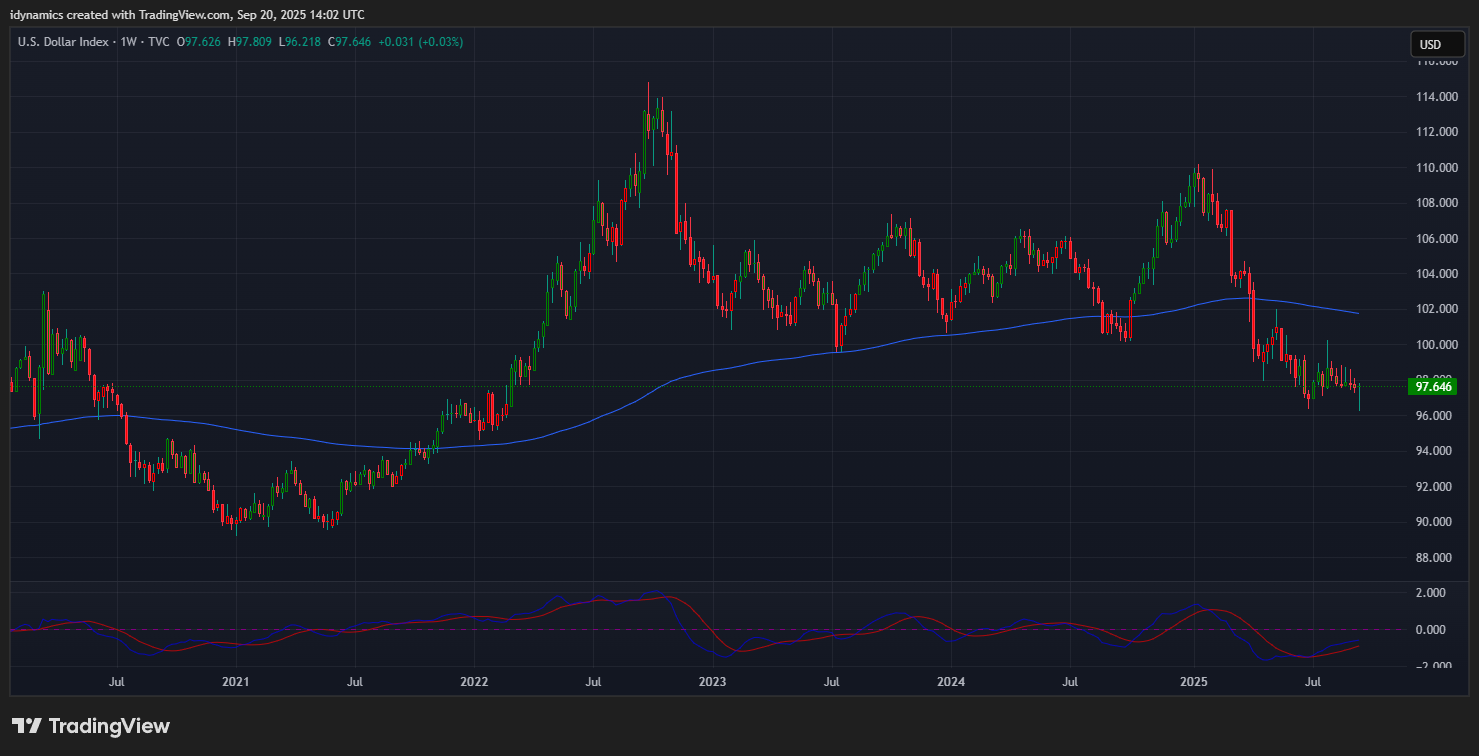
As James Bianco’s analog chart show, the U.S. Dollar is having one of the worst years ever recorded.
*We initiated one short trade in the YMZ and took a ten-tick loss on a stop.”
S&P 500 Stocks Above the 200-day MA
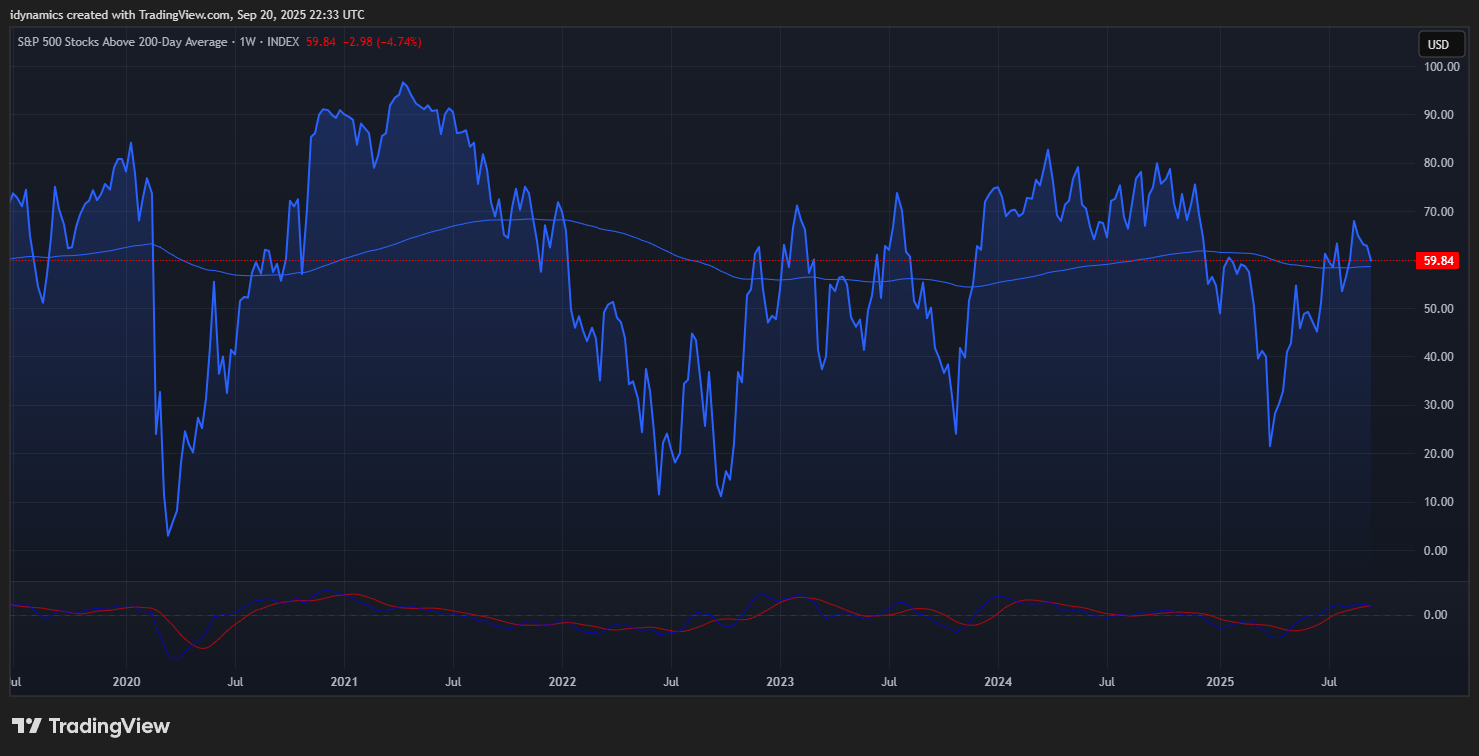 Breadth was lower for the SPX on the week, declining to 59.84%. The high in September 2024 was 72.92% and 82.70% in March of 2024. Divergence remains the name of the game.
MAGS (Magnificent 7) Weekly Candles
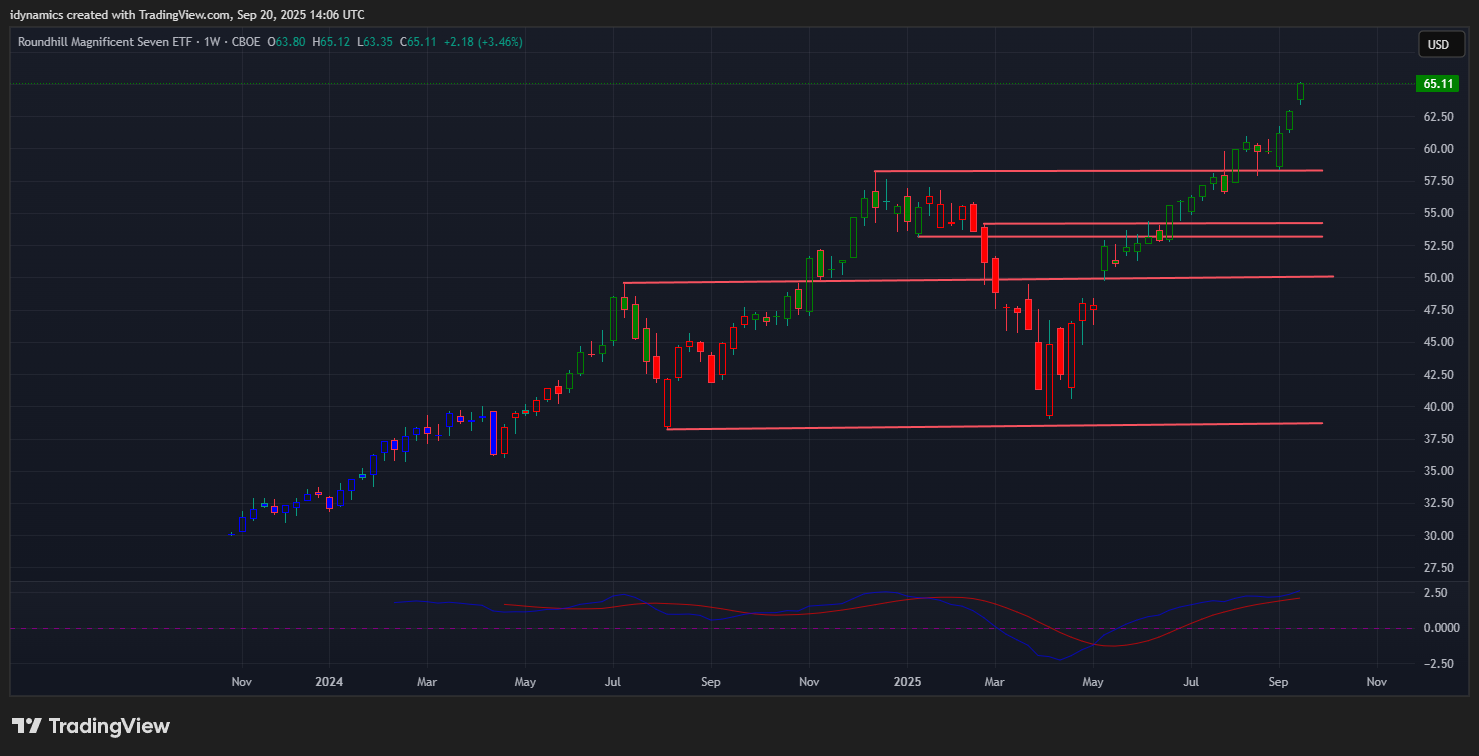
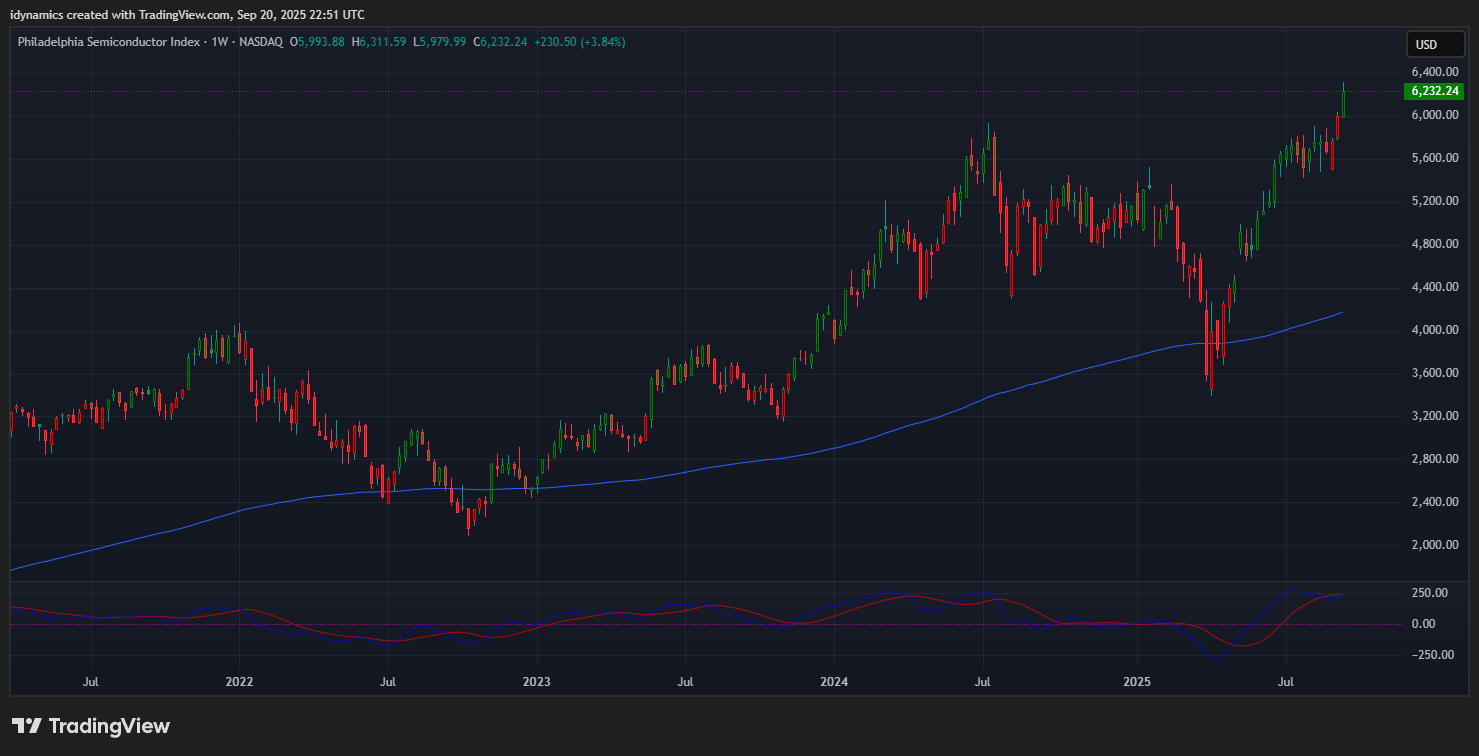
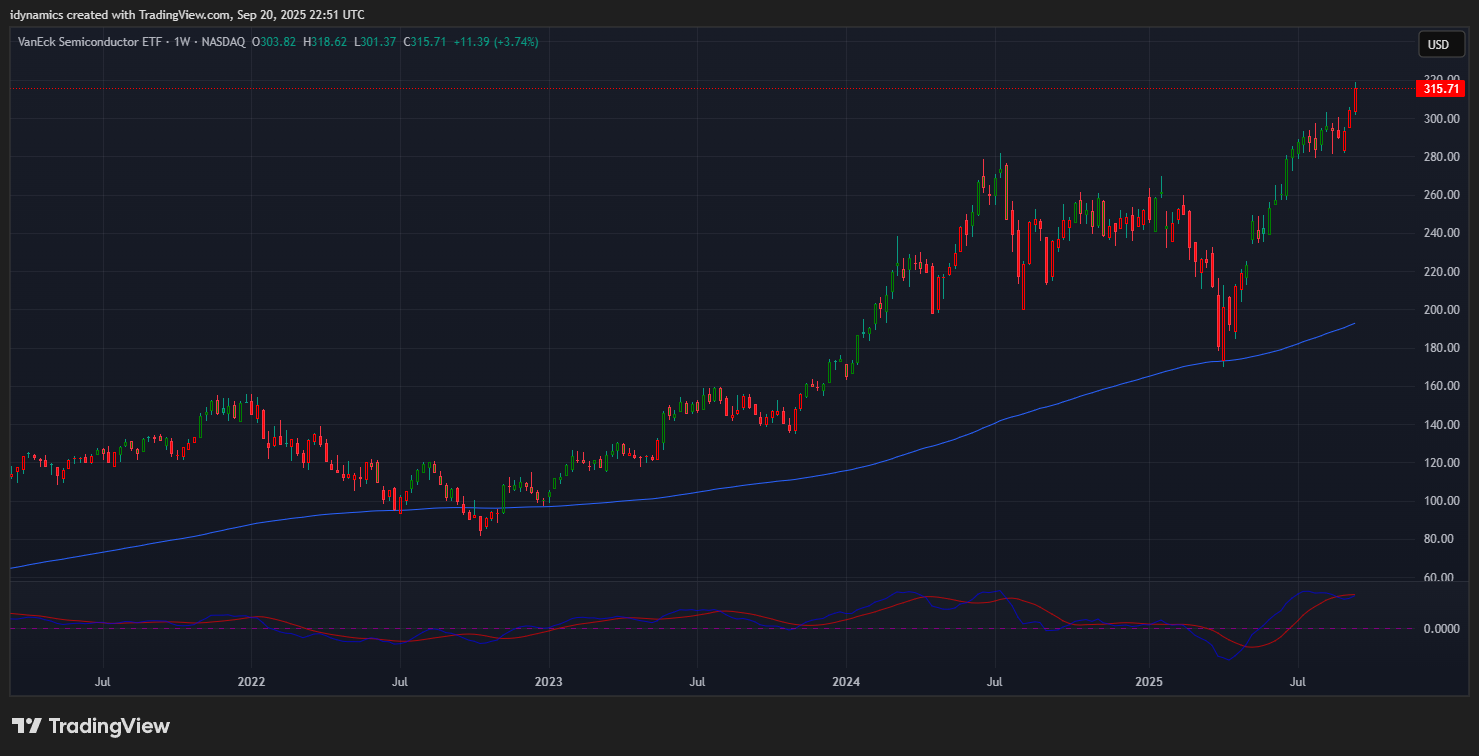
 The MAGS gapped higher on the week and soared to a record high and closed on the highs, up +3.46%. The index met and closed above the target of 64.50. The action opens a much higher target now at 74.30. Support is at 58.95/58.00 and 55.14. Under 55.14 can test 52.06 with critical support at 48.97/48.80. Both the SOX and SMH rocketed into record highs and closed at the top end of their ranges. We have to go back to the 1960s to find a market more lopsided than the one in 2025, sixty years…the days of MAD Magazine. “You will buy these tech stocks….”
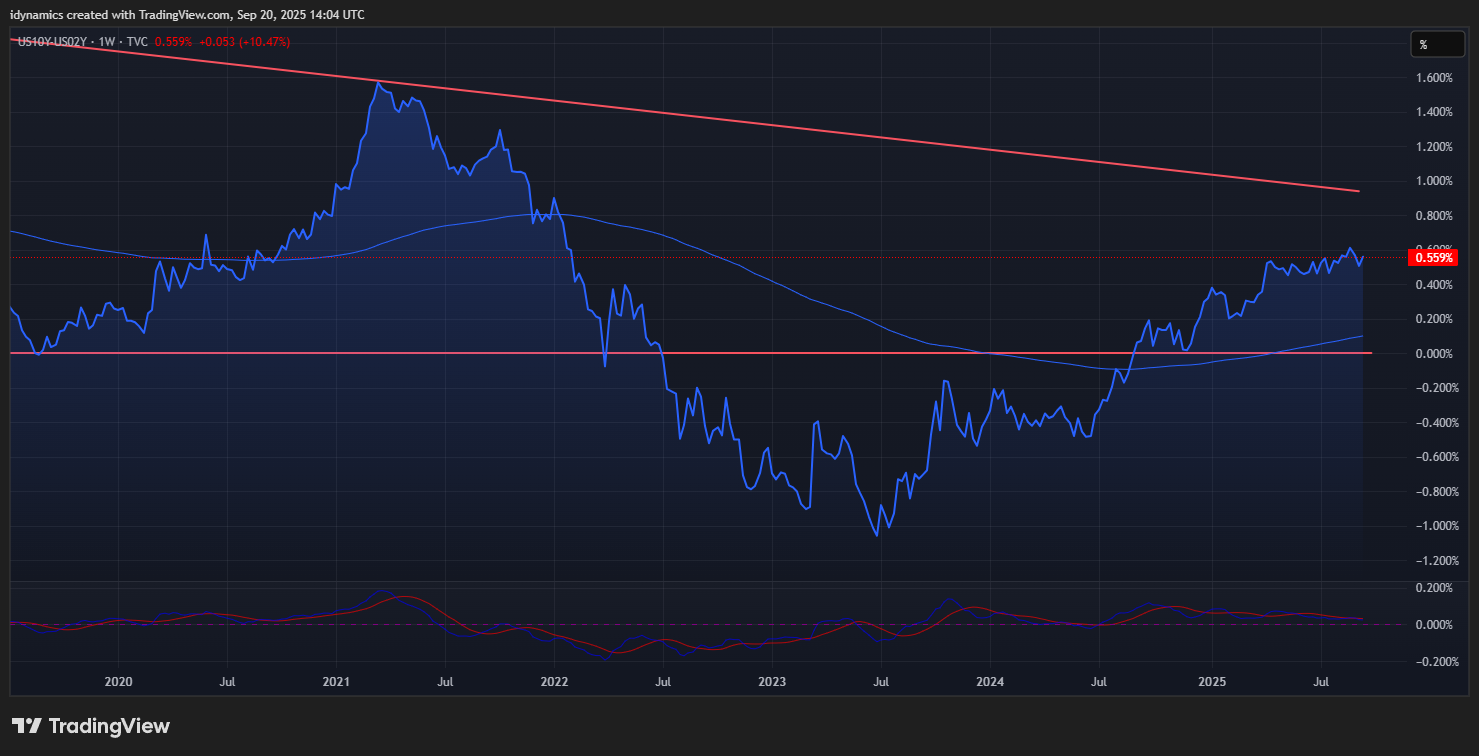
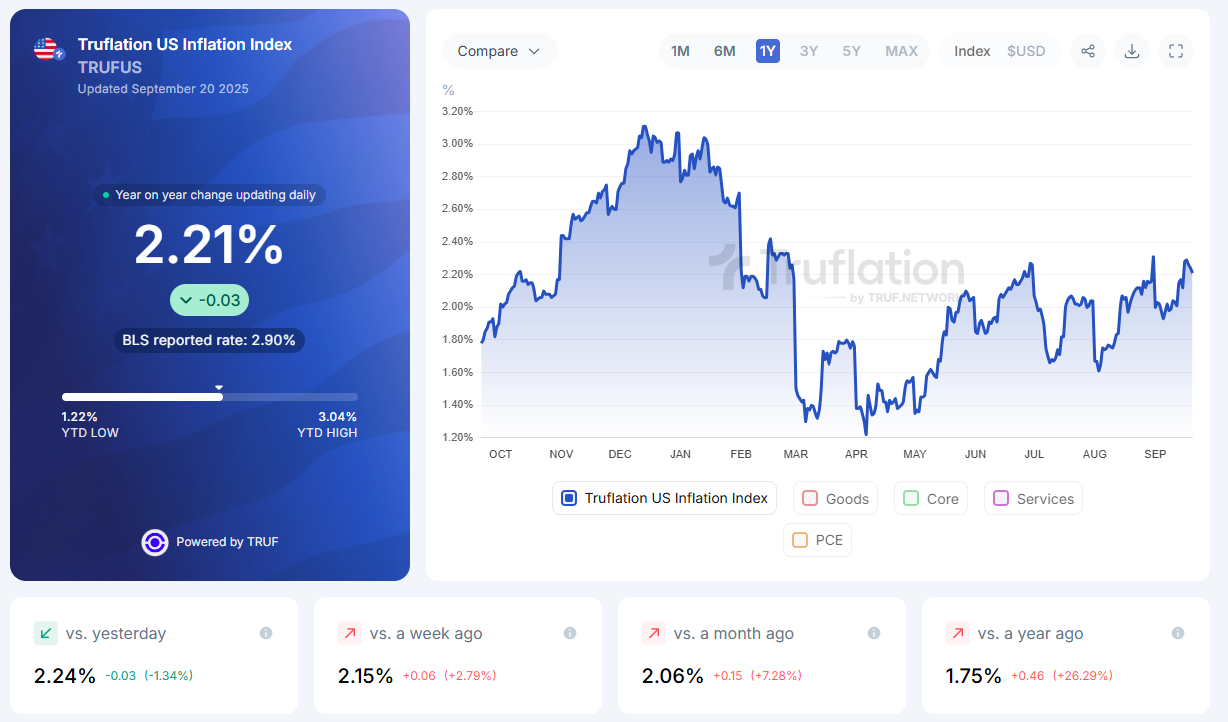
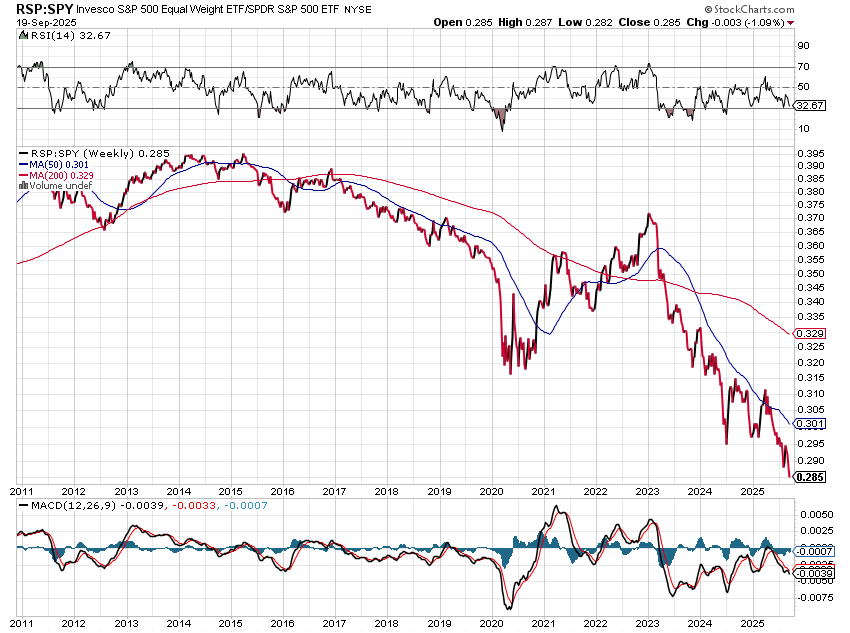
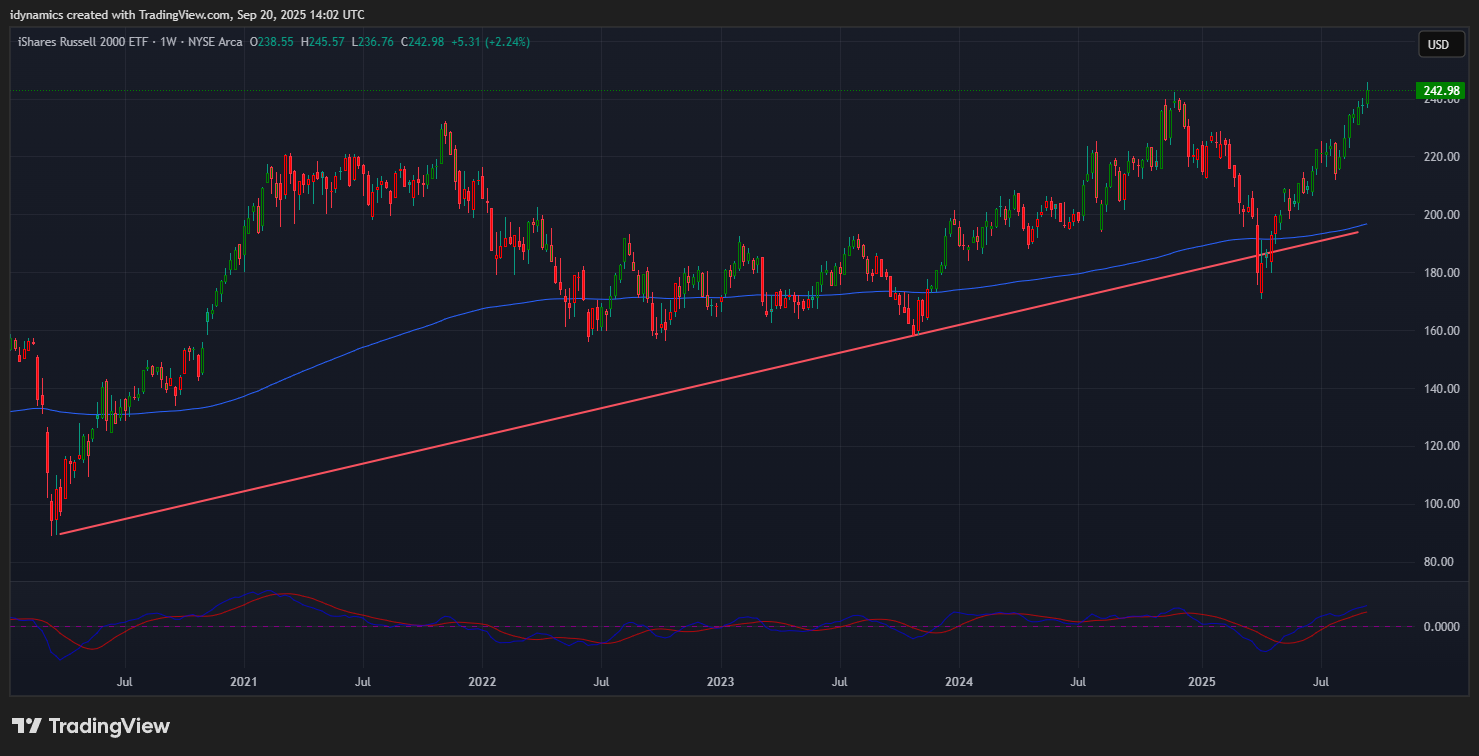
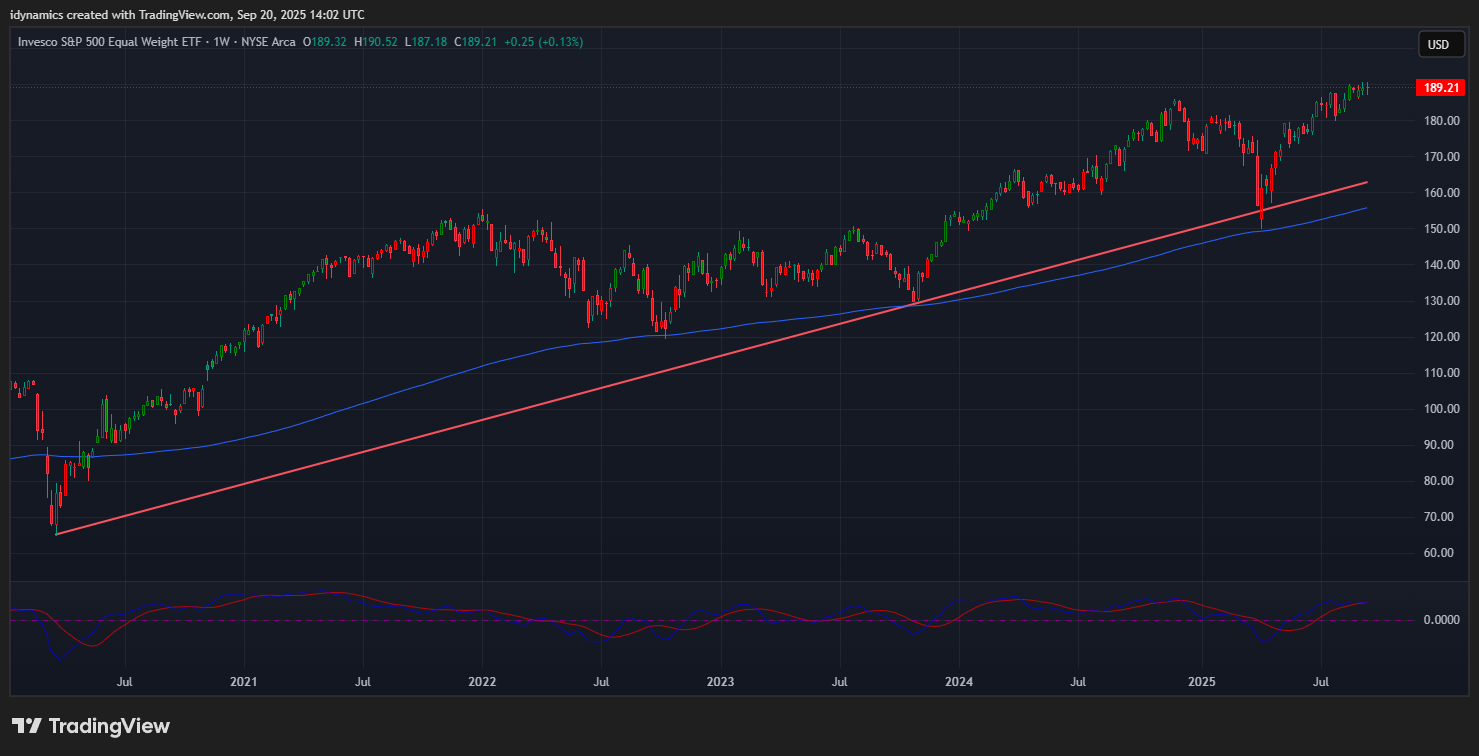
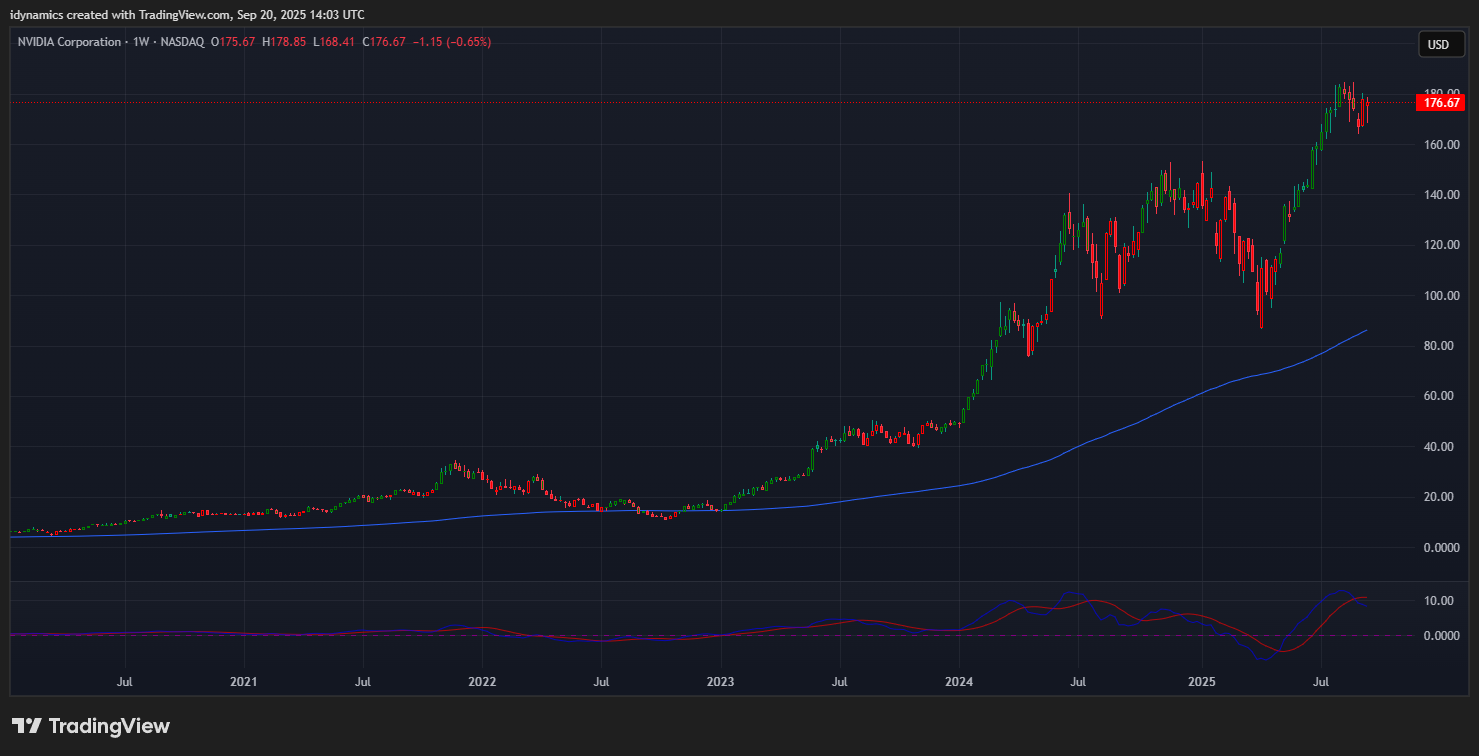
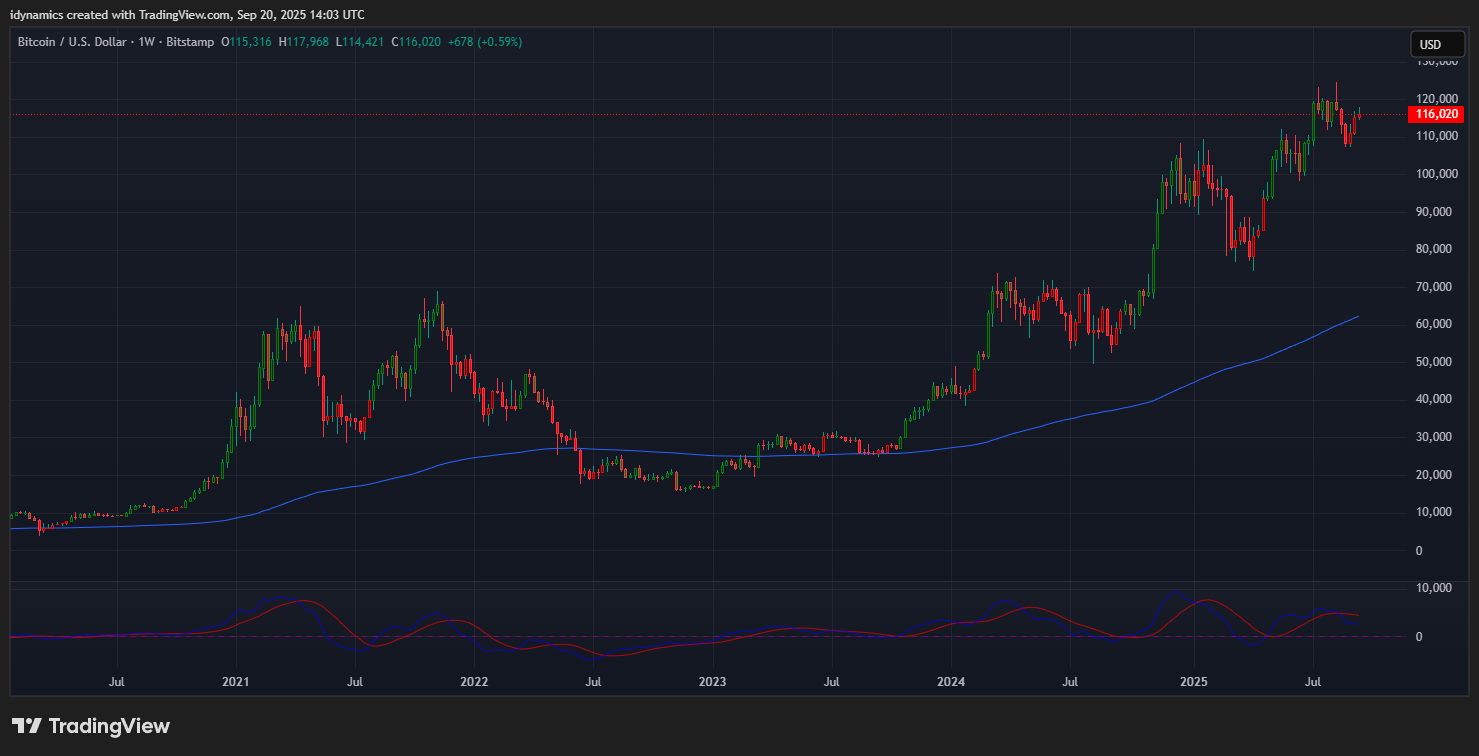
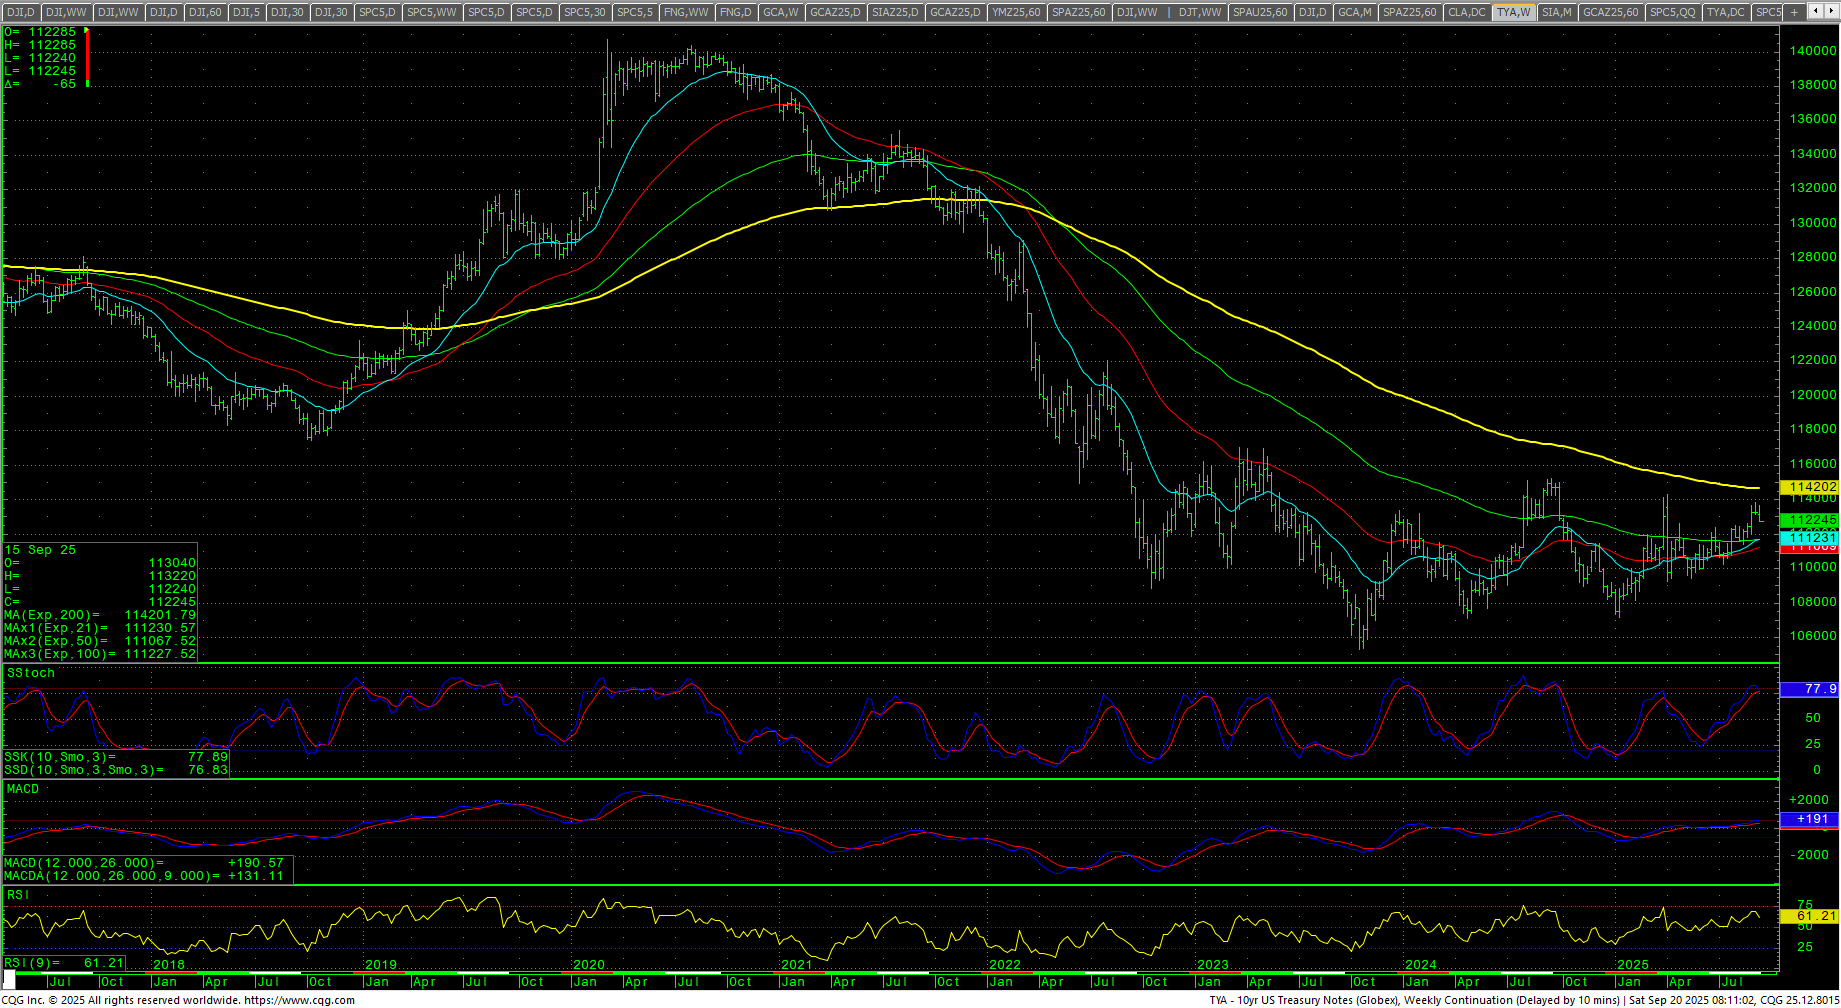
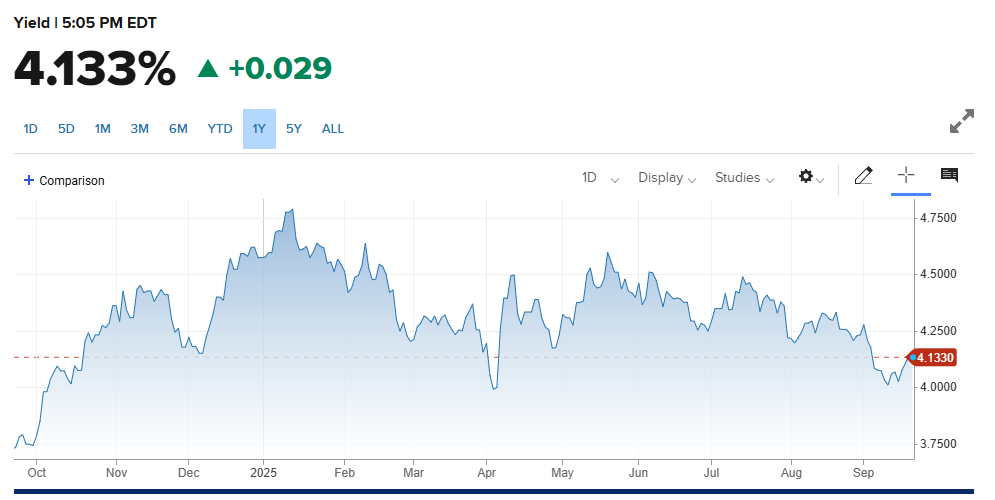
The RSP:SPY continued to deteriorate into multi-year lows. The weekly is trending lower in an oversold position and the MACD is down. Resistance is still .294. The IWM moved to record highs and closed in the top of the range up +2.24%. The RSP tested the record high and settled up +0.13% in the middle of the range. NVDA closed toward the top of an inside week’s range, ending down -0.65%. Bitcoin rallied and closed up +3.78% on the top end of the range. Support remains pivotal at 110/108. McClellan Oscillators are neutral and diverging for the Dow. The Yield Curve expanded, closing at +0.559%. The 10YR yield jumped, closing at 4.133%. Truflation increased to 2.21%. Corporate bond spreads are at a 27-year low.
10YR-2YR Yield Curve Weekly

 VIX Weekly Candles
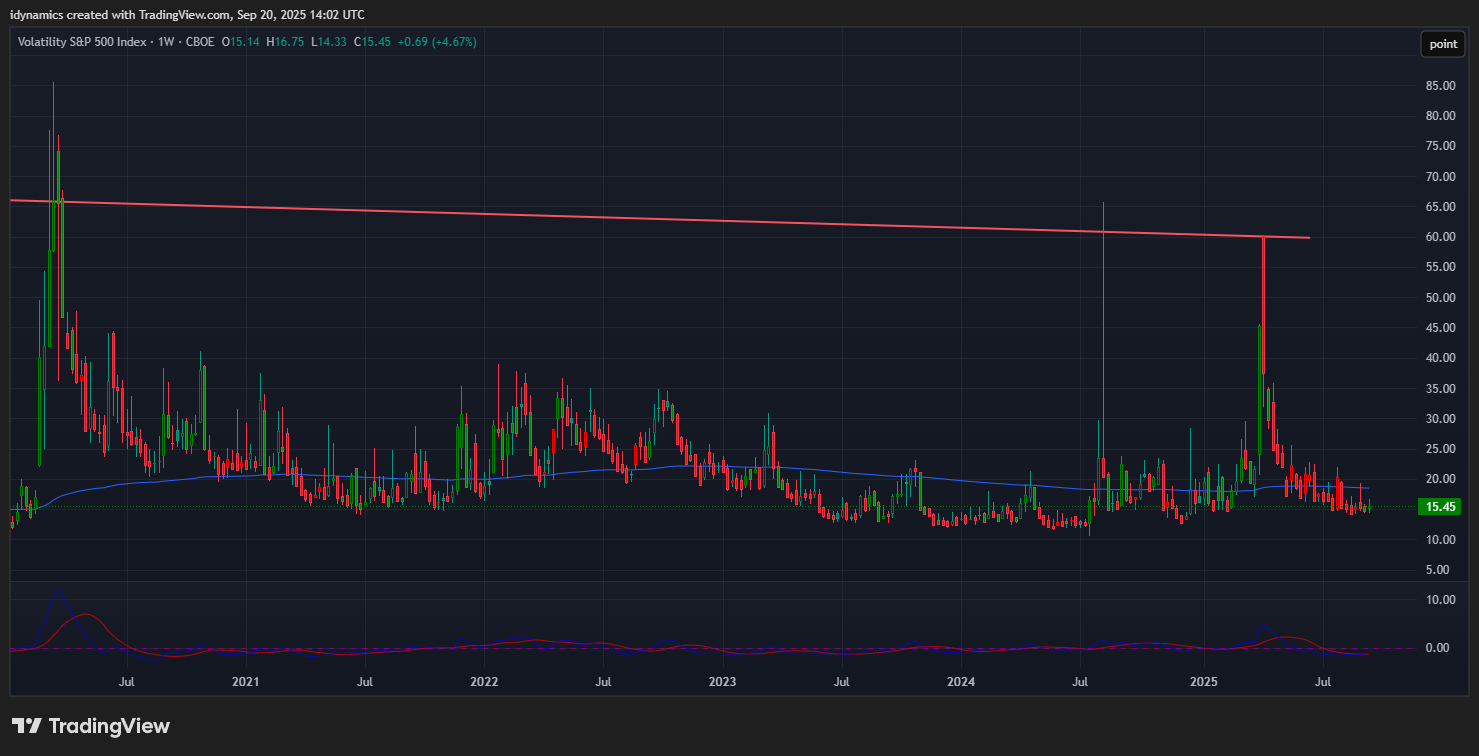
The VIX traded another tight range and closed in the middle, up +4.67%. The US Dollar traded a three year low and recovered late in the week for a reversal, closing up +0.03%.
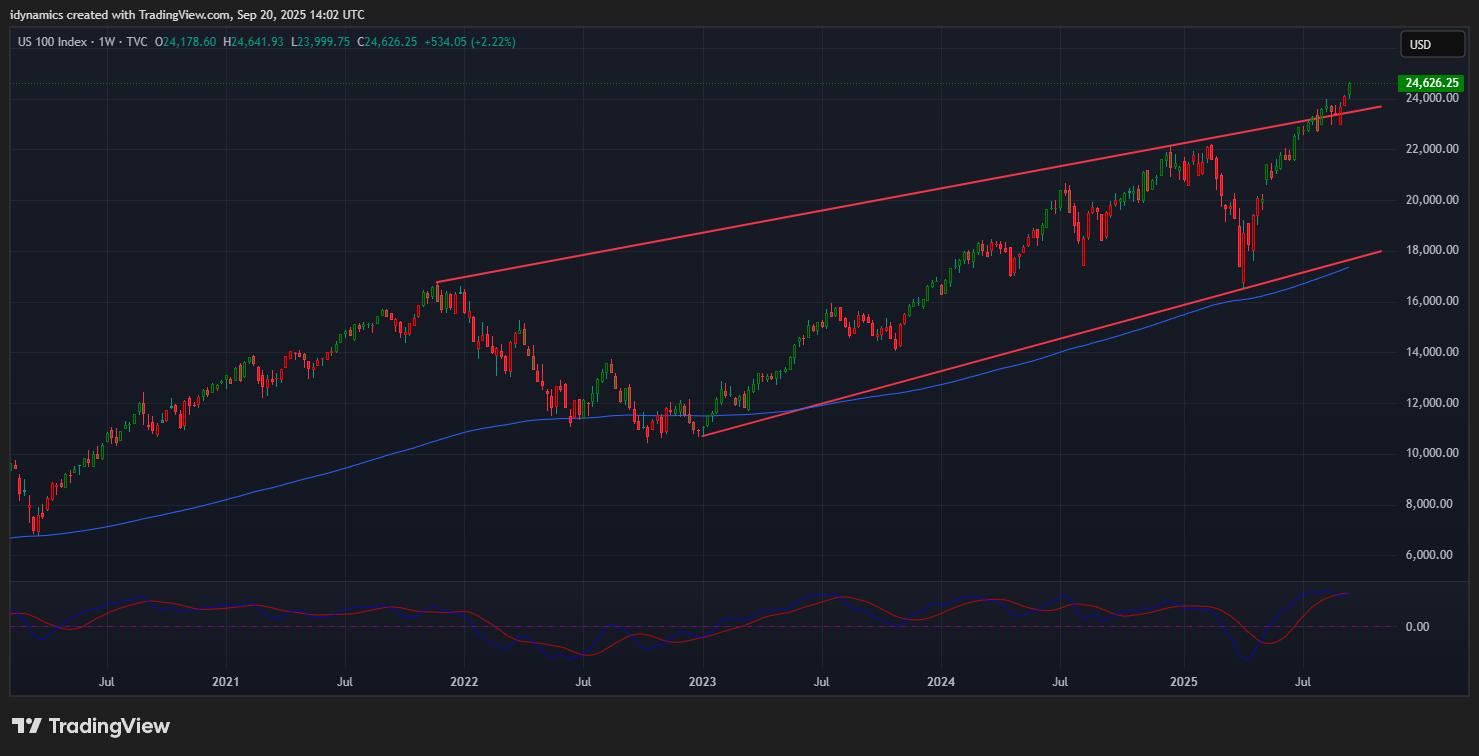
 Nasdaq 100 Weekly Candles
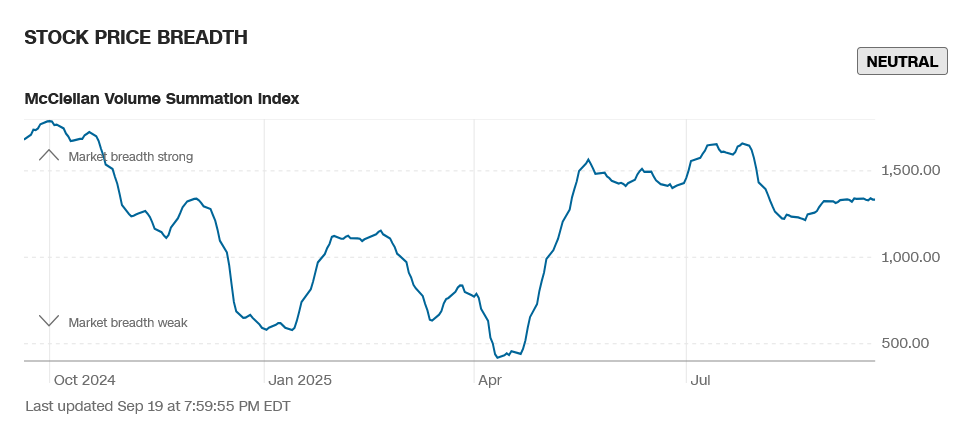
Daily Breadth 
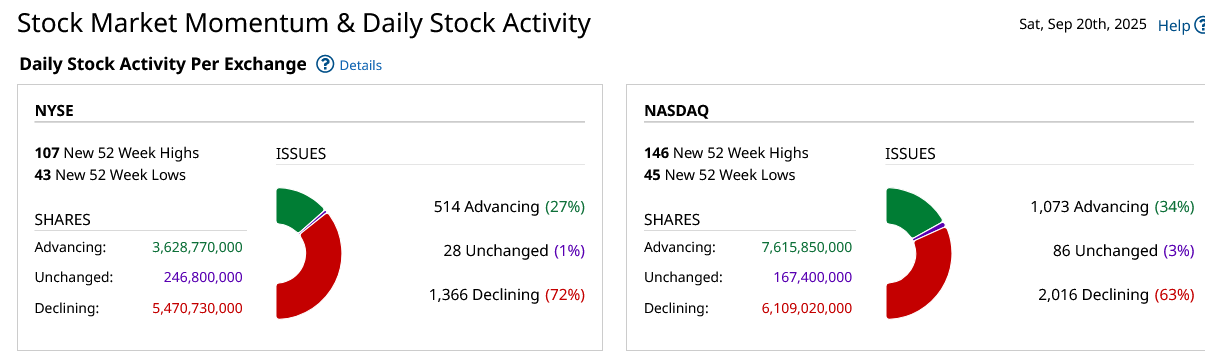
Breadth was weaker in Friday’s trade and was flat on the week. Sentiment has turned neutral.
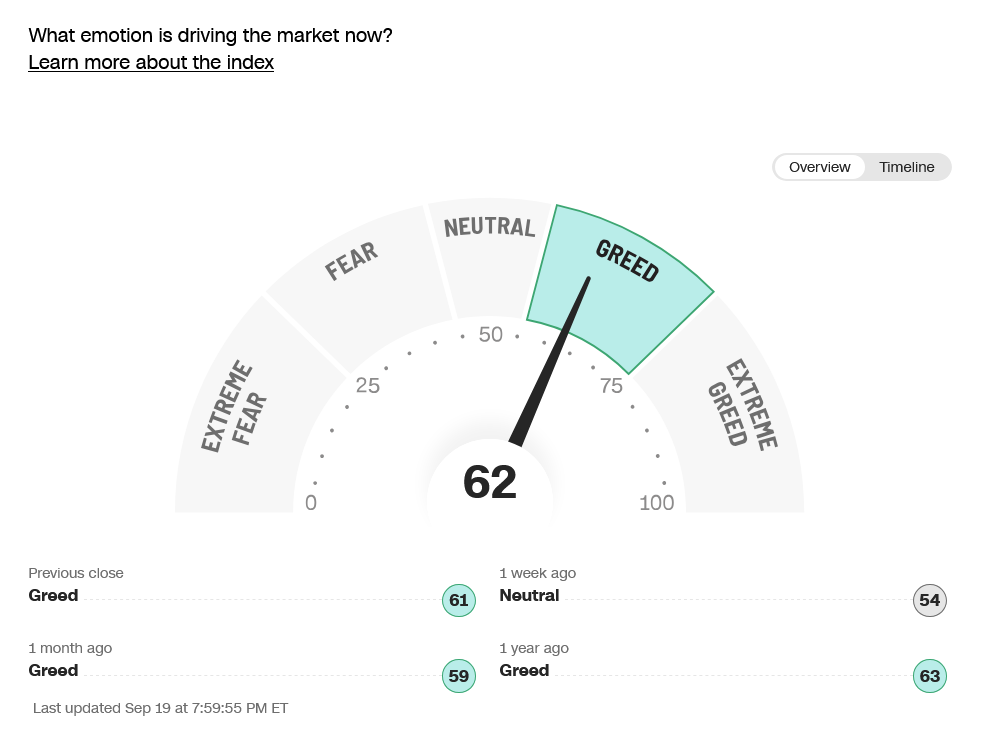
CNN Fear & Greed Index
 AAII Investor Sentiment Survey
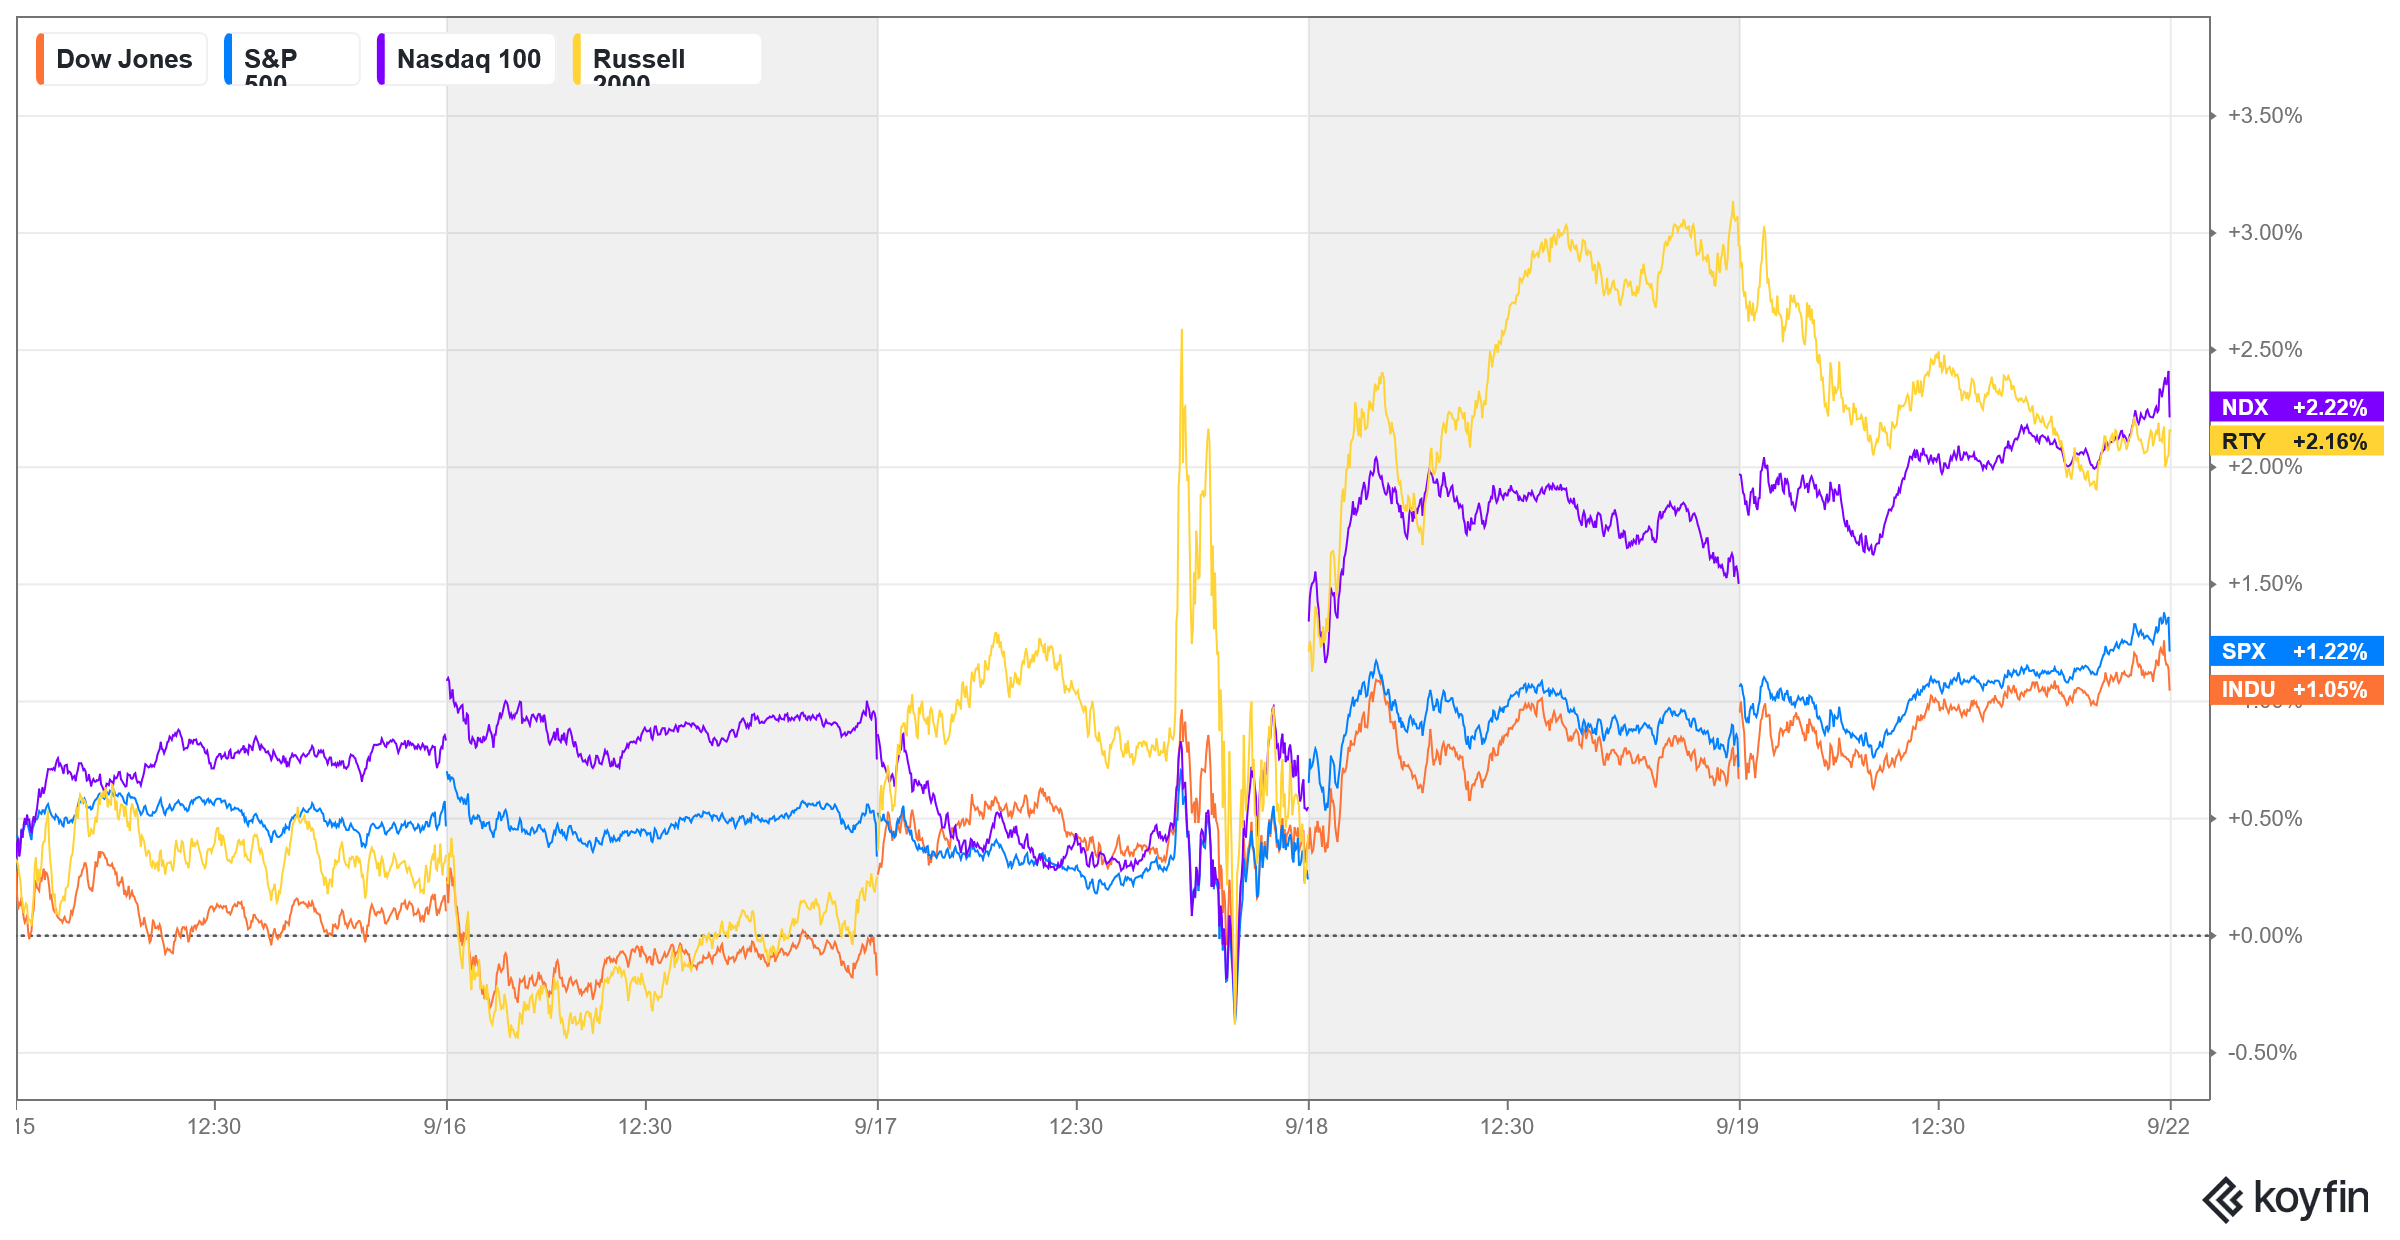
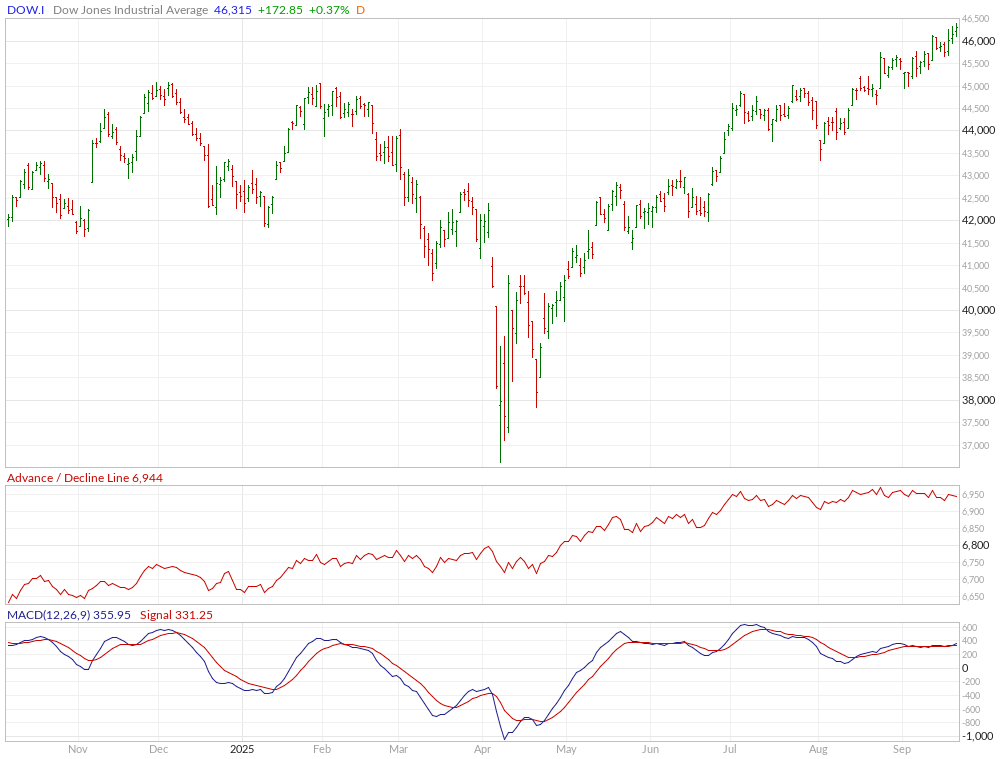
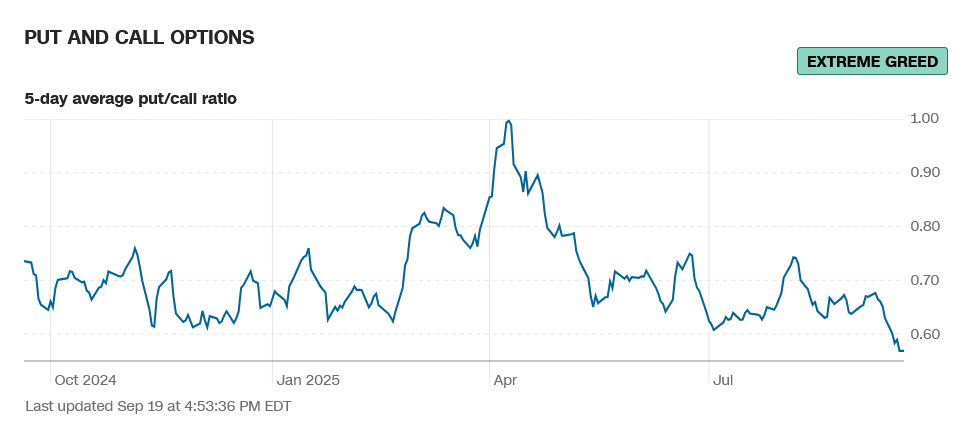
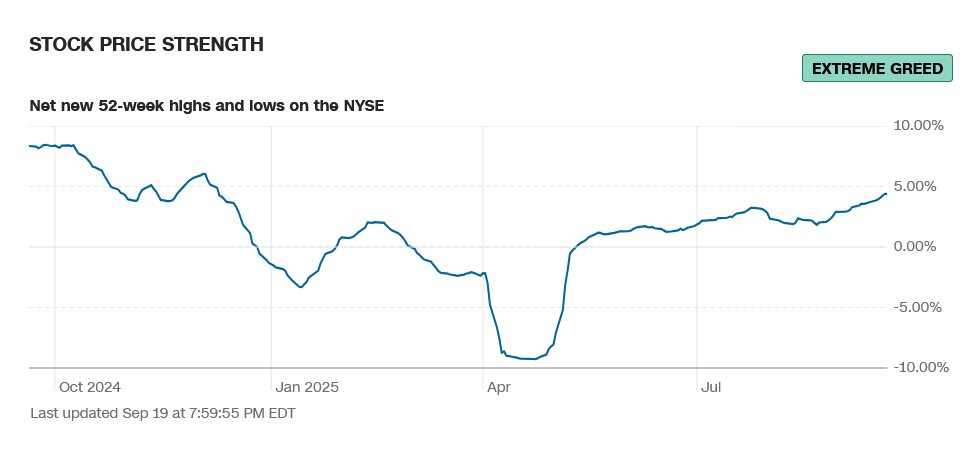
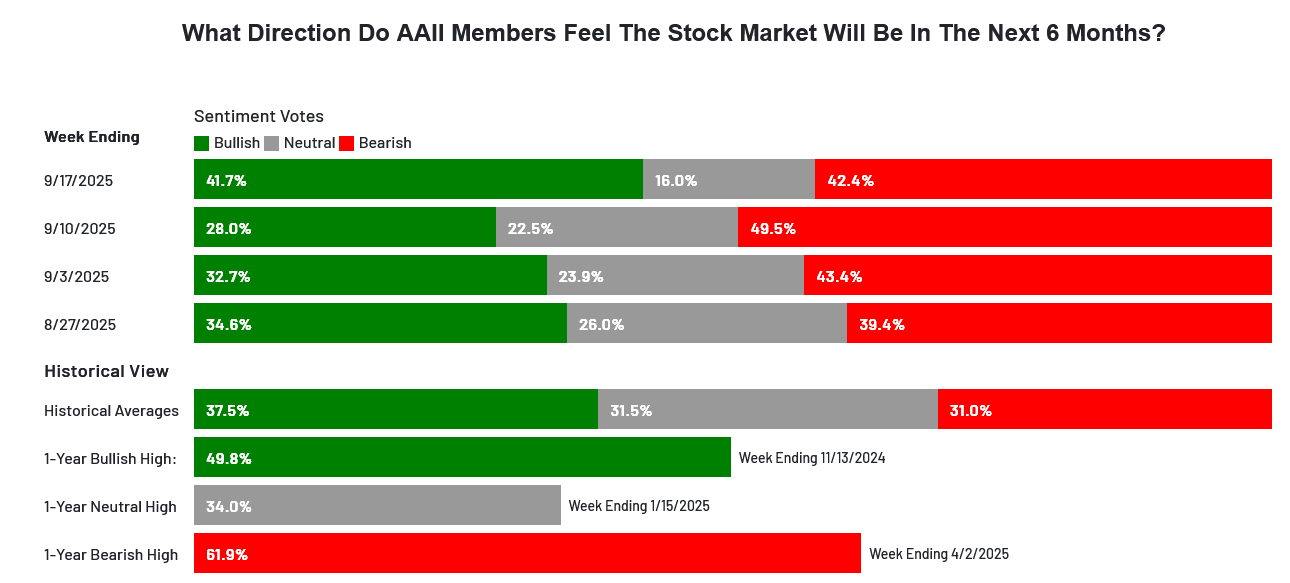 The CNN Fear and Greed Index jumped to 62 and reads greed. Breadth was flat on the week and reads neutral. Latest AAII Sentiment Survey: Optimism Skyrockets . The Dow A/D is now flashing a major bearish divergence as it dropped to 6944. The VIX traded another tight range and closed in the middle, up +4.67%. The Put/Call closed at a multi-year low of 0.57 and reads extreme greed. The 52-week, A/D moved up to +4.39% and reads extreme greed. The Dow closed the week up +1.05%, closing in the top of the week’s range at a record high. The S&P traded record highs and settled up +1.22% in the upper end of the range. The Nasdaq Composite was up +2.21% and the Nasdaq 100 was up +2.22% both at record highs. The NYSE FANG closed up +2.97% in the top of the range at a new ATH and is up +58.78% from the April lows. The Russell was up +2.16% in the upper half of the range. The 10-year notes closed lower on the bottom of the range. The yield on the 10YR rose to 4.133%.
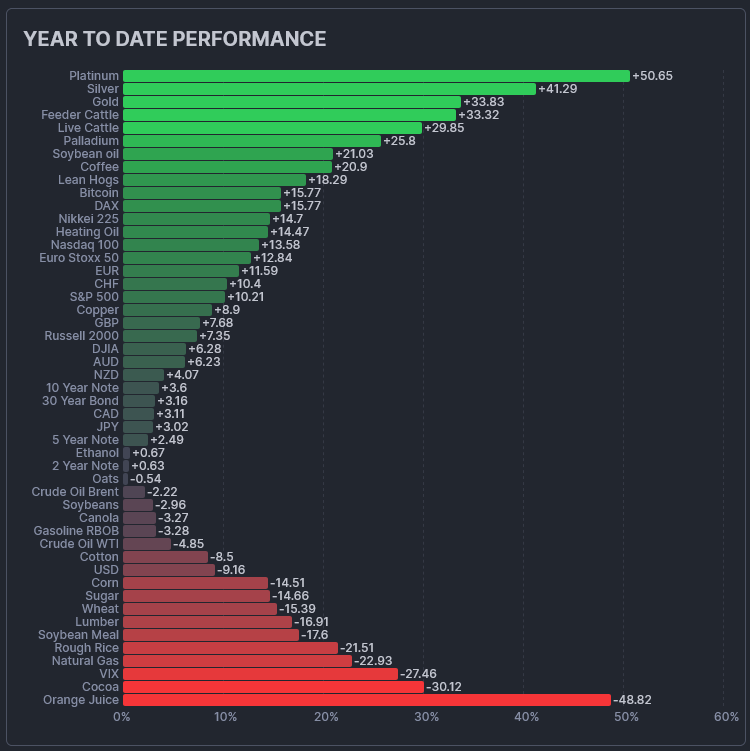
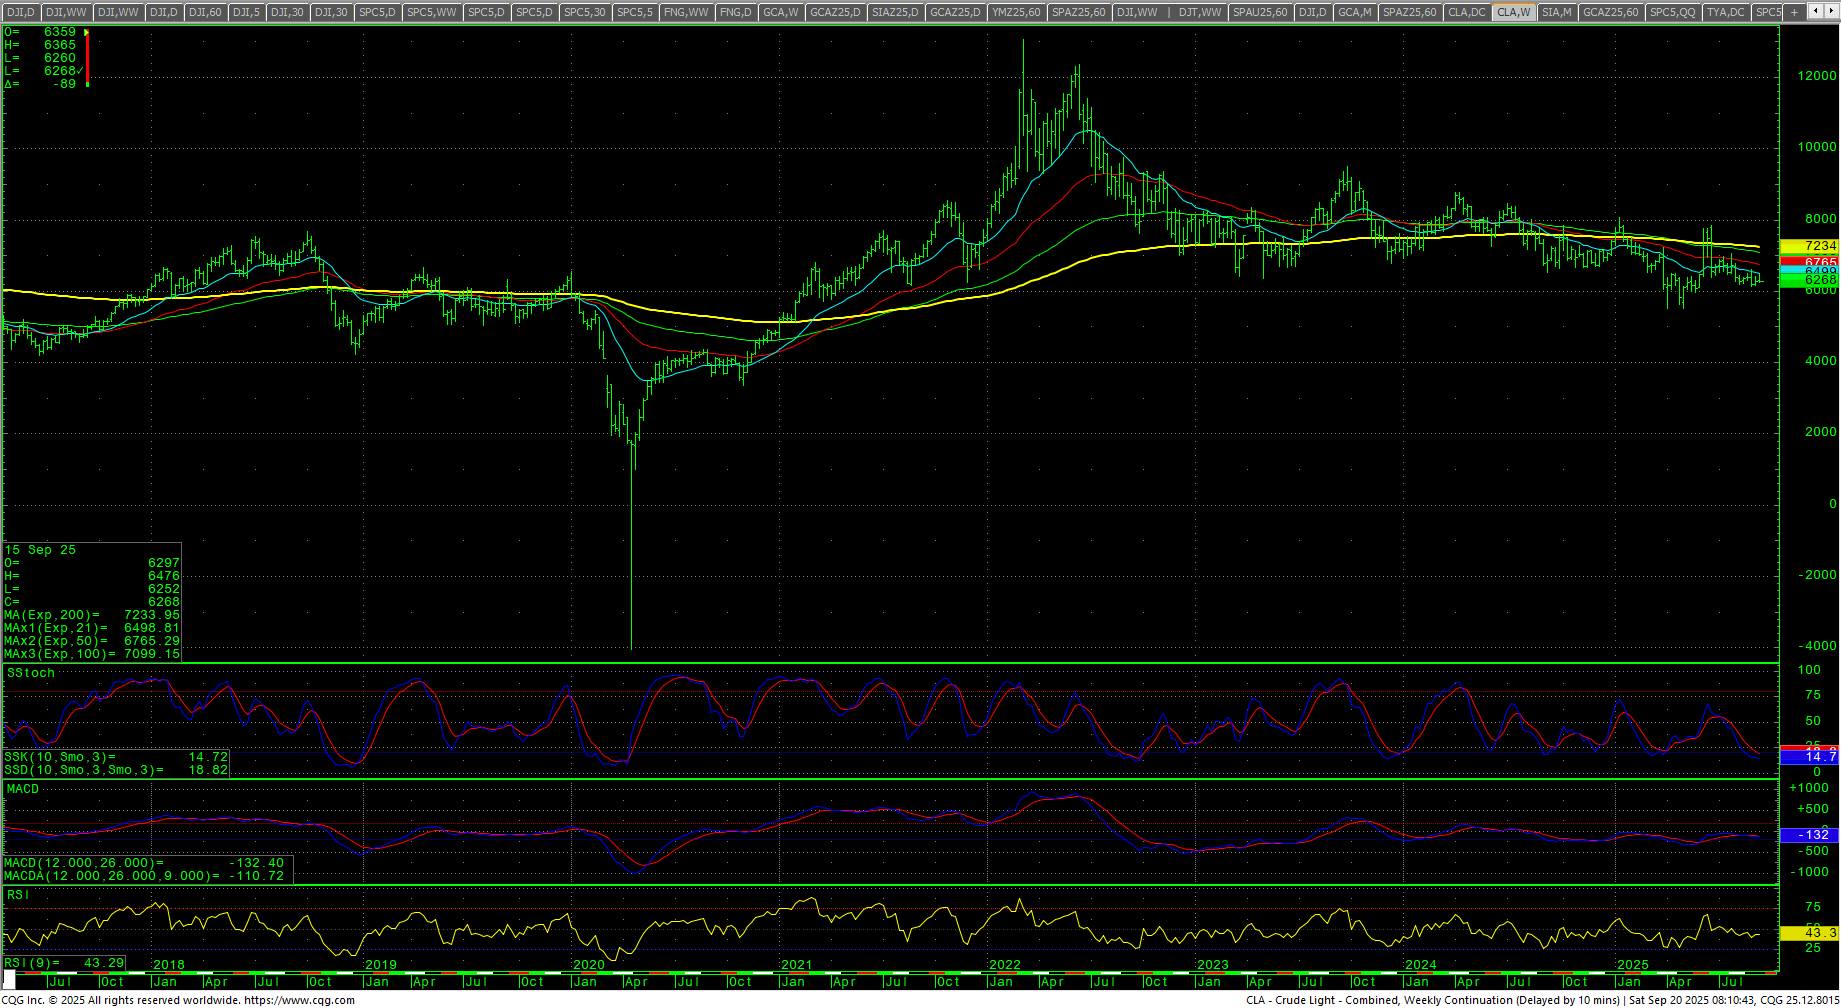
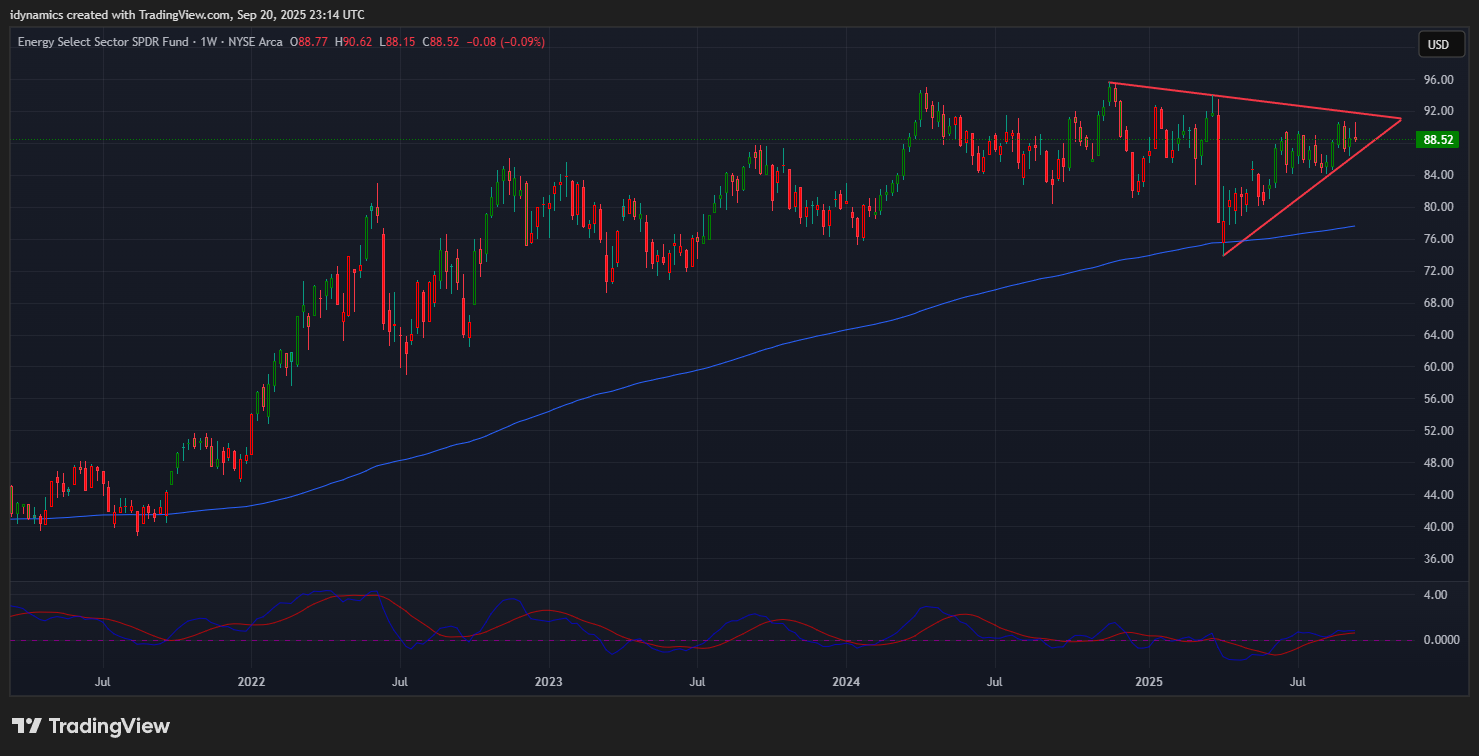
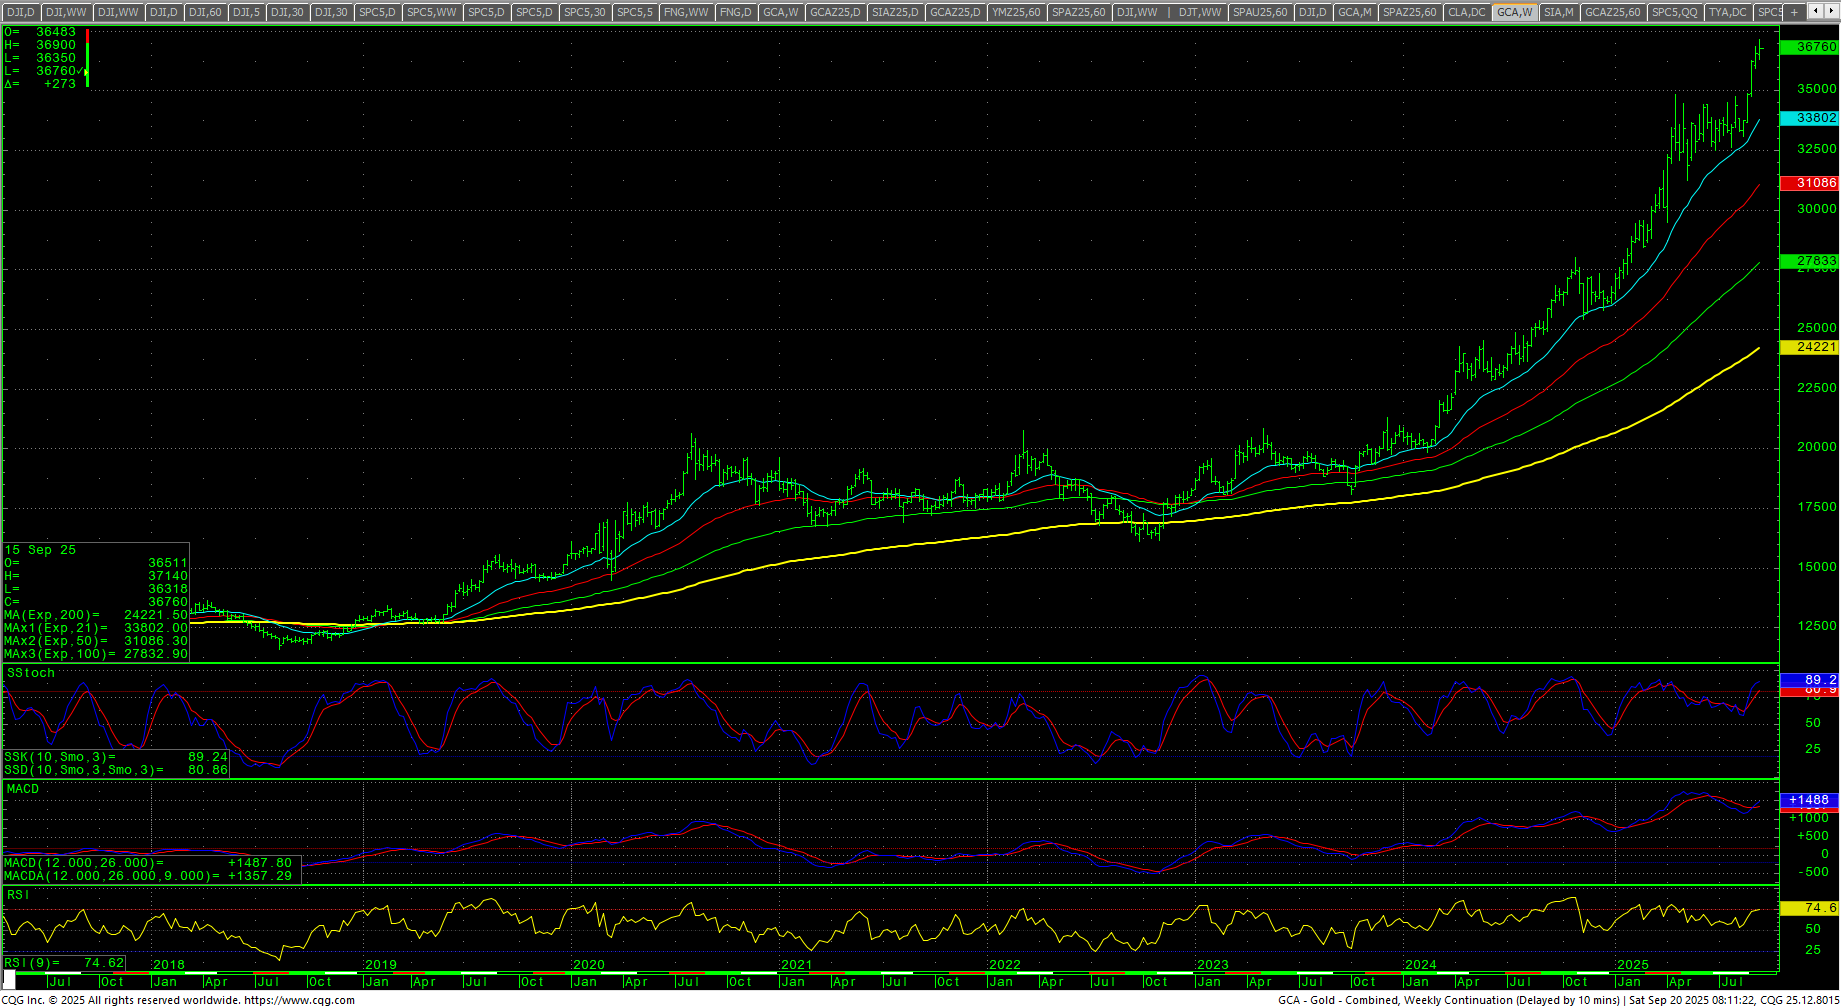
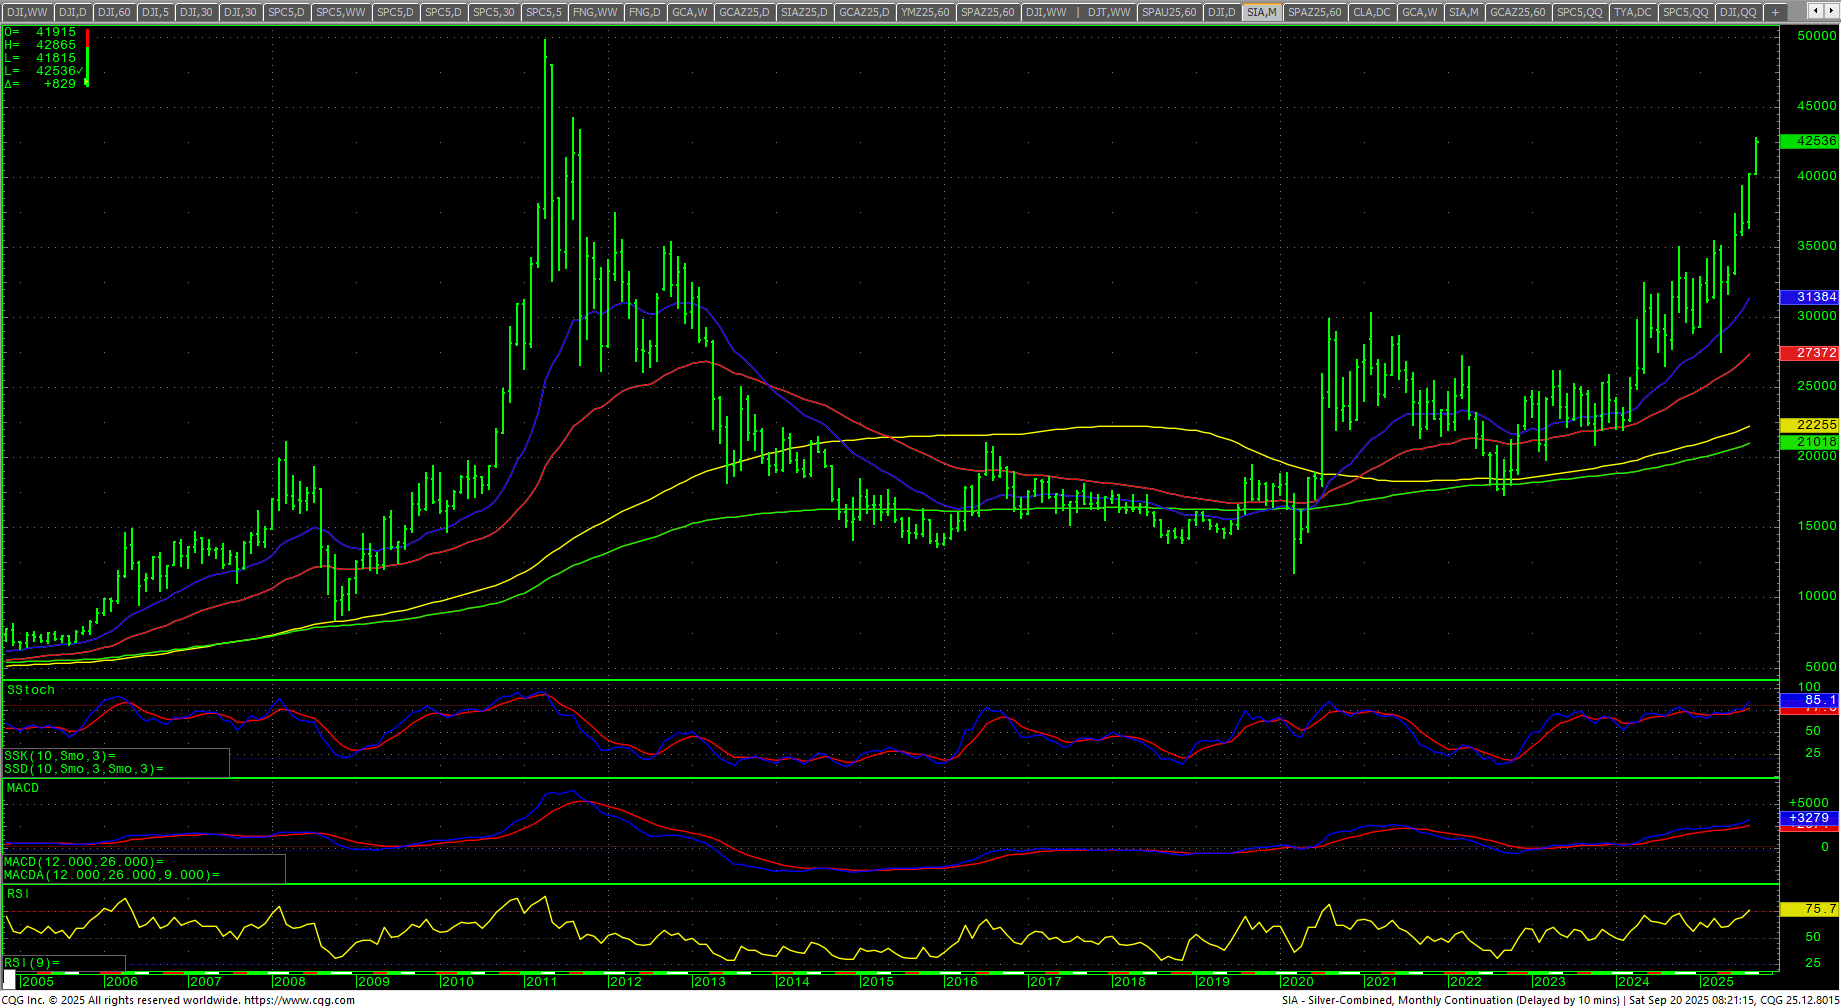
The CRB Index was down -0.83%. Crude oil failed in an early rally and closed on the lows in a reversal. The XLE followed suit by failing in an early rally as it builds a large symmetrical triangle on the weekly. Gold rallied to record highs for the spot futures as it tested the $3700 level. Silver exploded to the highest levels since 2011 as the CFDs cleared the $43 level. The CoT for the S&P 500 shows the big decline on the non-commercials positioning while commercials increased a bit. The CFTC S&P 500 Non-Commercial Net Positions ended at -225.074K.
Timing Points
Tuesday is a strong cycle date and 10/02/25 is key for bonds/interest rates/dollar and equities as well. This week’s big report is Friday’s PCE.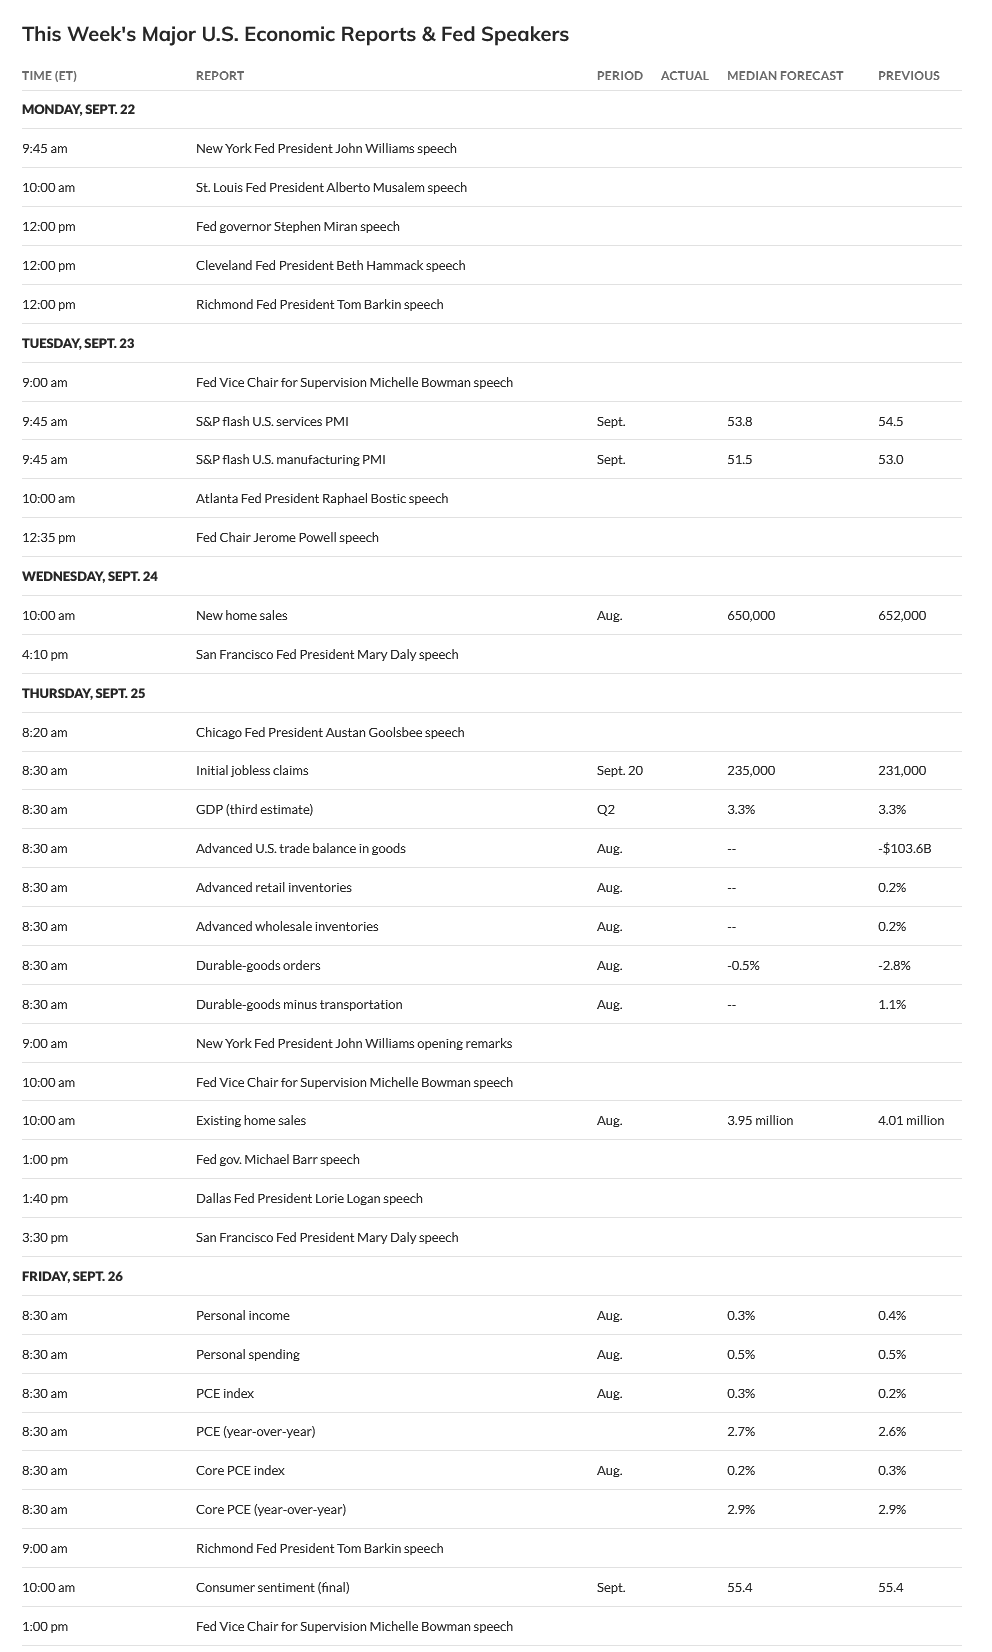
- 09/23 ***
- 10/01 ** key to bonds/dollar
- 10/06 **
- 10/13 *** X
- 10/22 ***
- 10/28-29 *** X
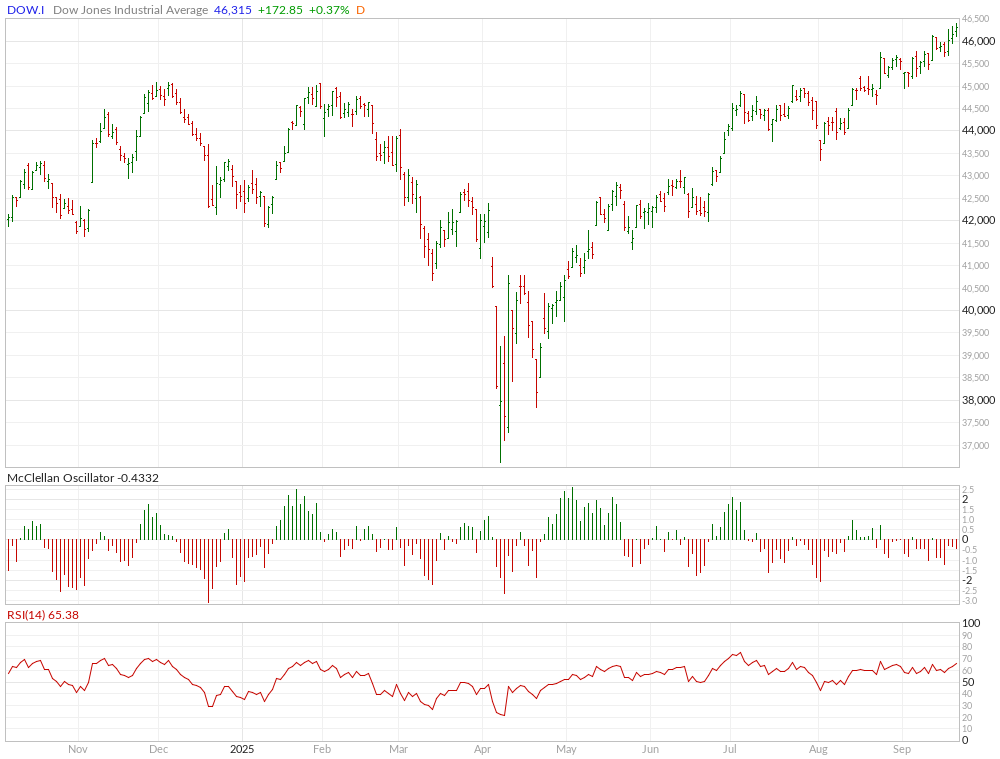
Dow Jones Industrial Average
Dow Jones Industrial Average Weekly H-L-C
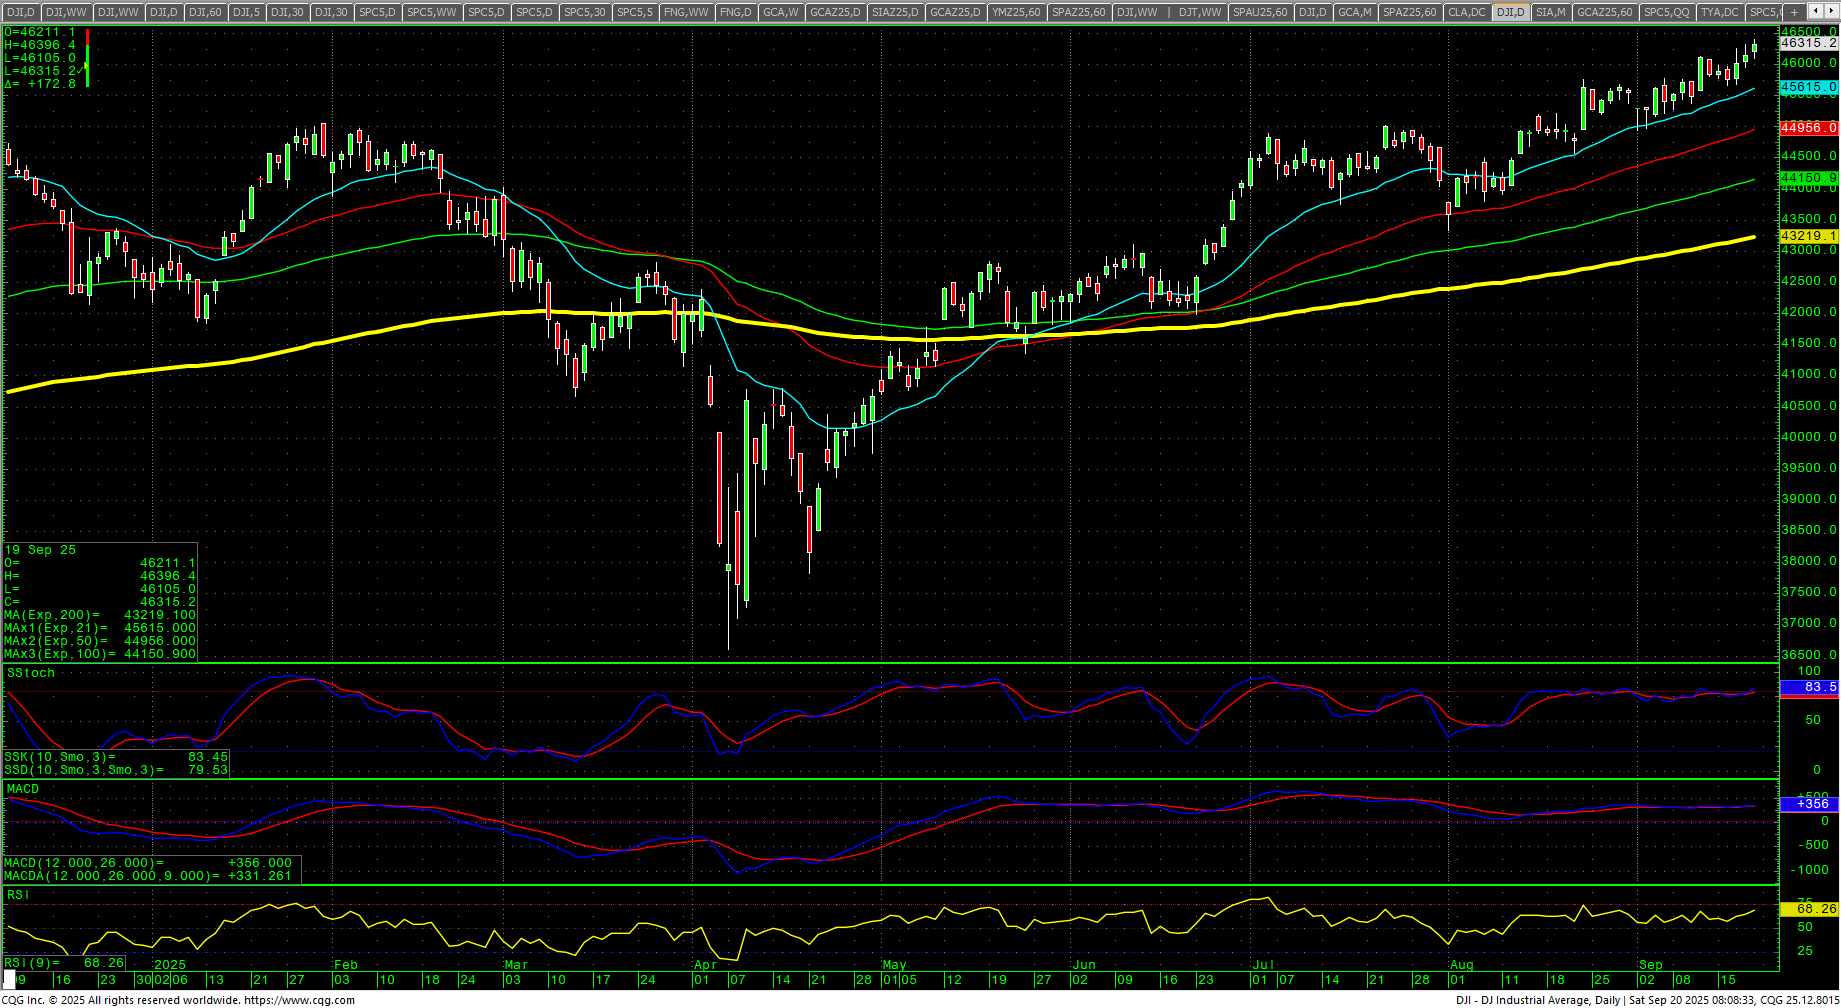
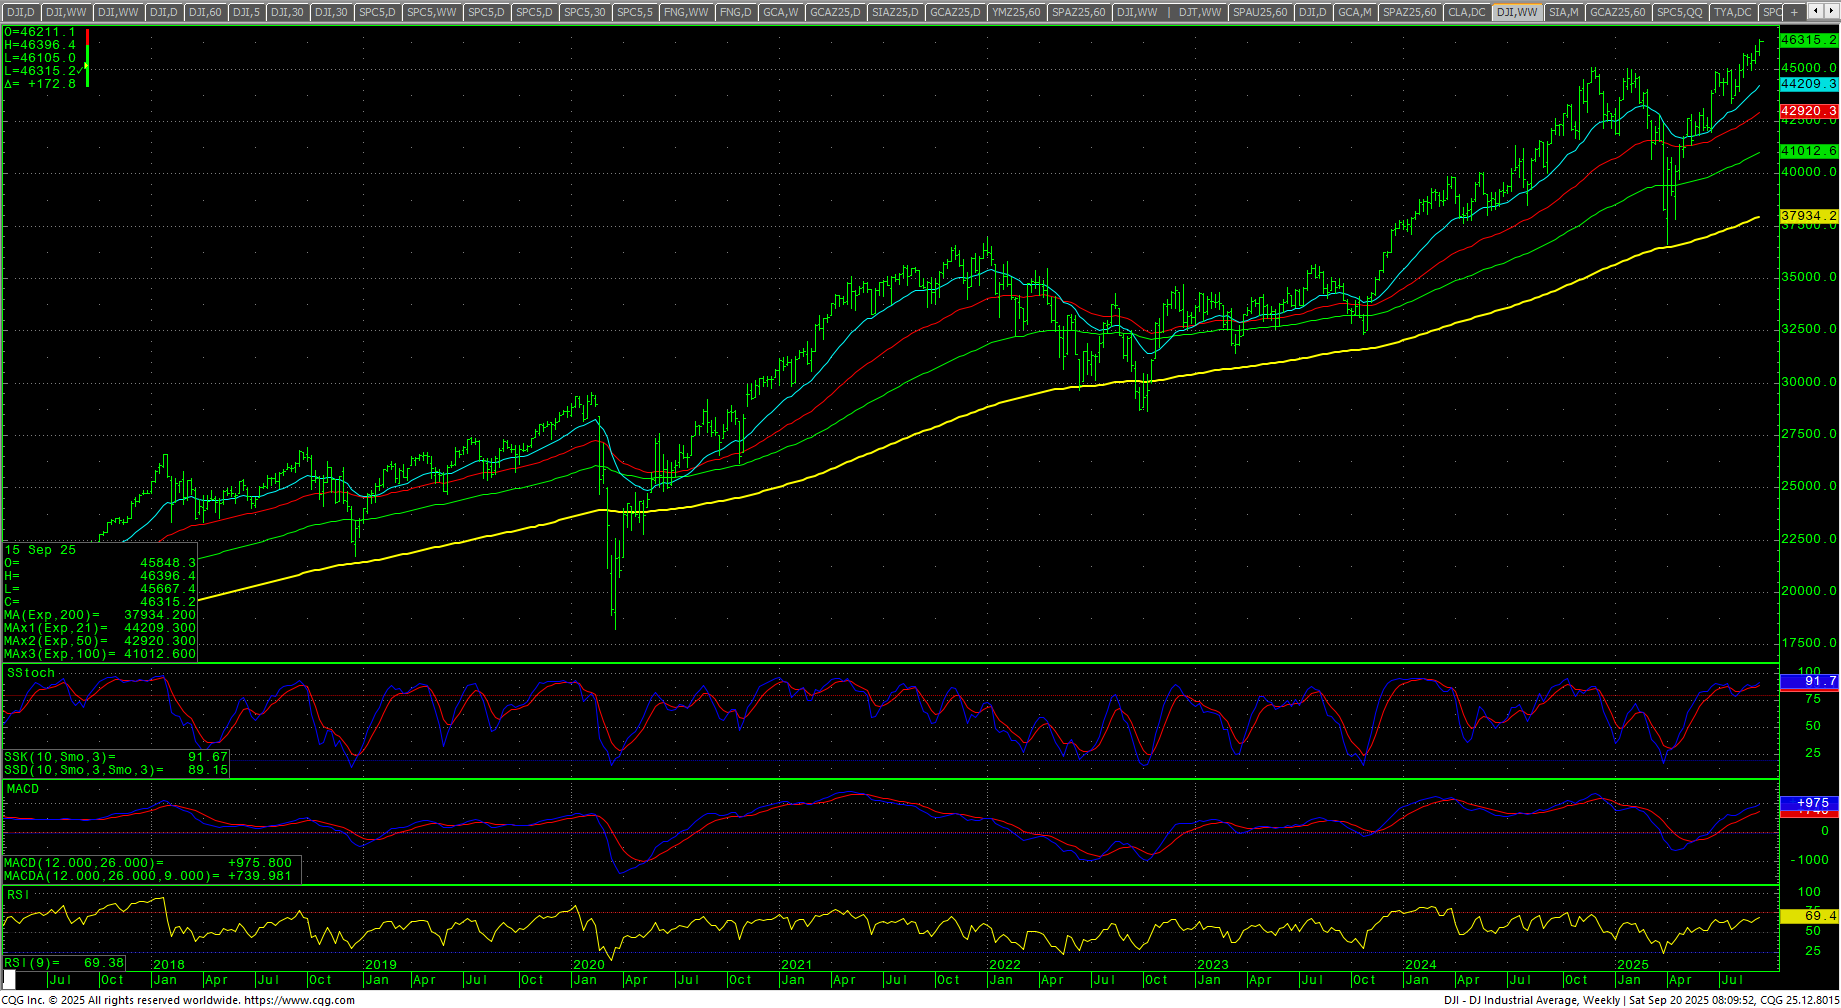 The Dow closed the week up +1.05% on the upper end of the range setting new all-time highs. The daily stochastics and MACD are up and still have numerous preliminary bearish divergences. The daily RSI is 68.3. The 200-day MA starts the week at 43219.10 and is at record highs. There is a potential target on the daily at 46692.80.
Dow Jones Industrial Average Weekly Candles
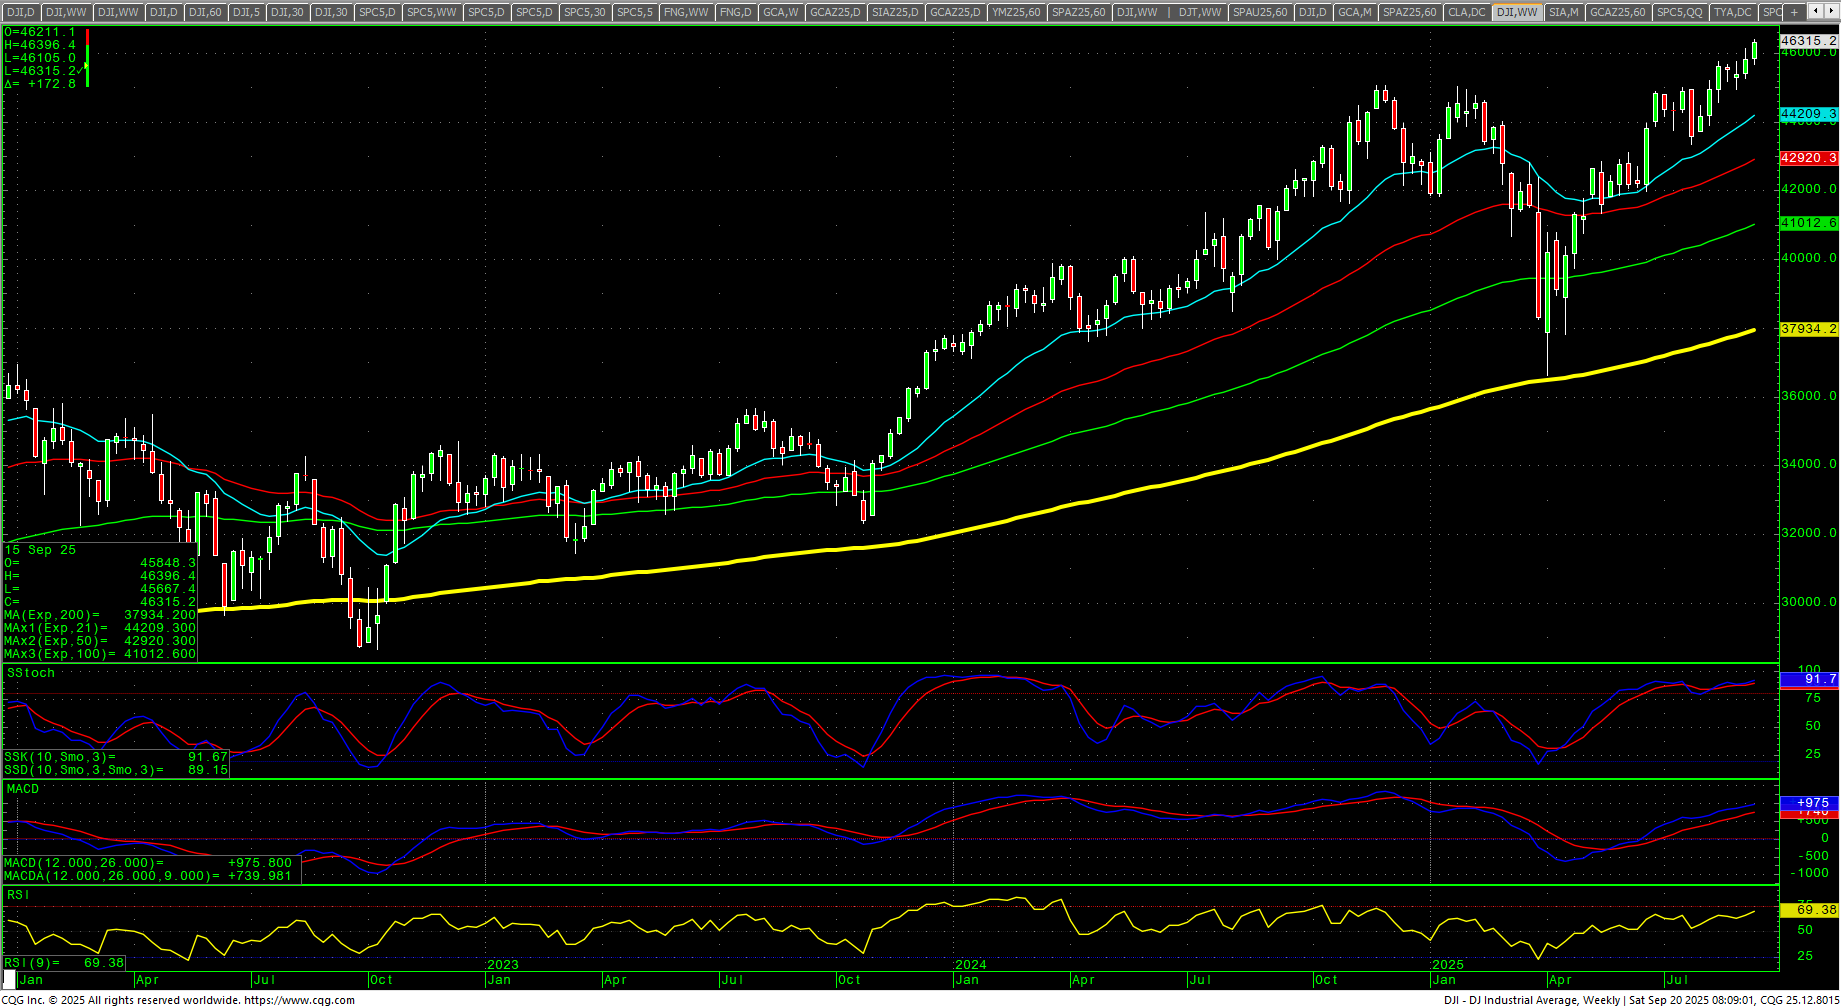 The market has met and closed just under a critical level of resistance at 46368. Continued rallies with closes above this level count to 46494 and 46566. Closes over 46566 setup a move to 46710 with counts to 46854 and pivotal resistance at 46800. A drive above 46854 would offer fuel moves toward 46998/47000 with longer-term monthly targets in the 47400.
Dow Jones Industrial Average Hourly H-L-C
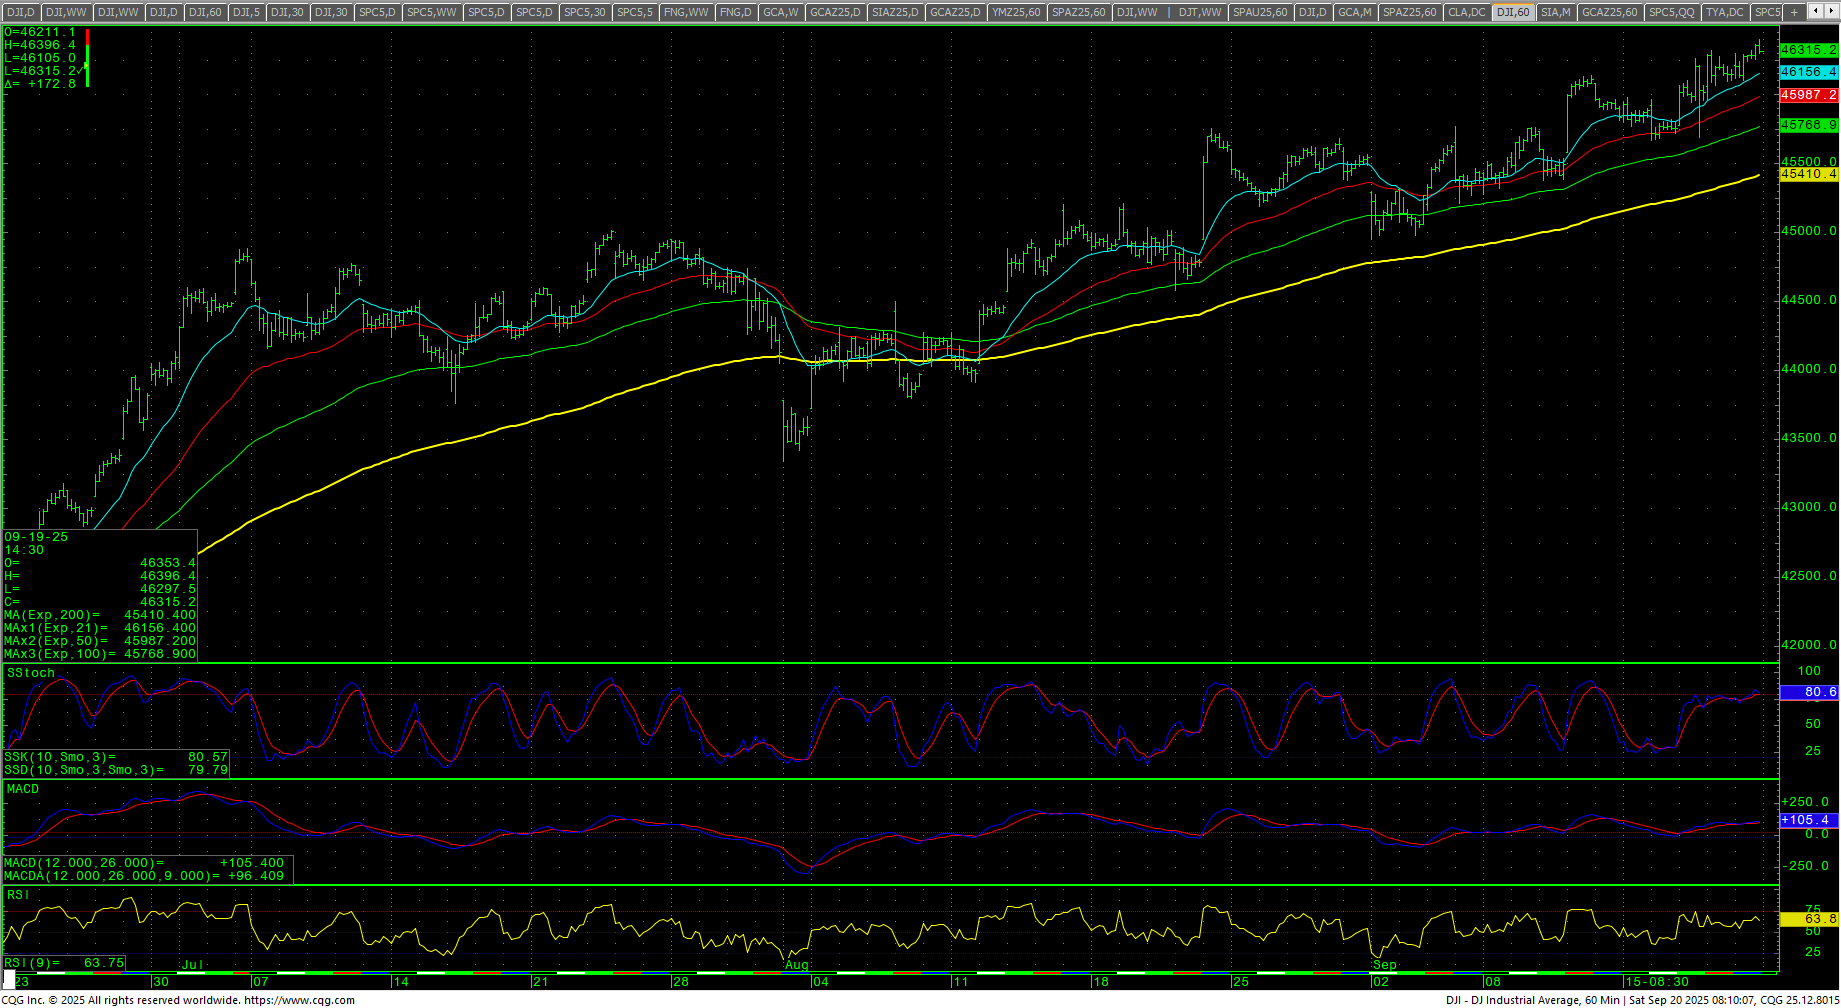 The hourly is overbought on Friday’s close. Support is 46224 and 46117. A break under 46117 sets up 46031 with counts to 45945/45940. Closes under 45940 are near-term bearish with counts to 45687/45667. Daily closes under 45667 would be a near-term bearish signal and open counts to 45229. A break under 45229 should minimally test 45112 with potential to critical short-term support at 44868/44865. Daily closes under 44865 should minimally test 44104 through 44061 and opens full counts to 43340.
Dow Jones Industrial Average Daily Candles
| Resistance | Support |
|
|
S&P 500 Cash Index: SPX
S&P 500 Index Weekly H-L-C
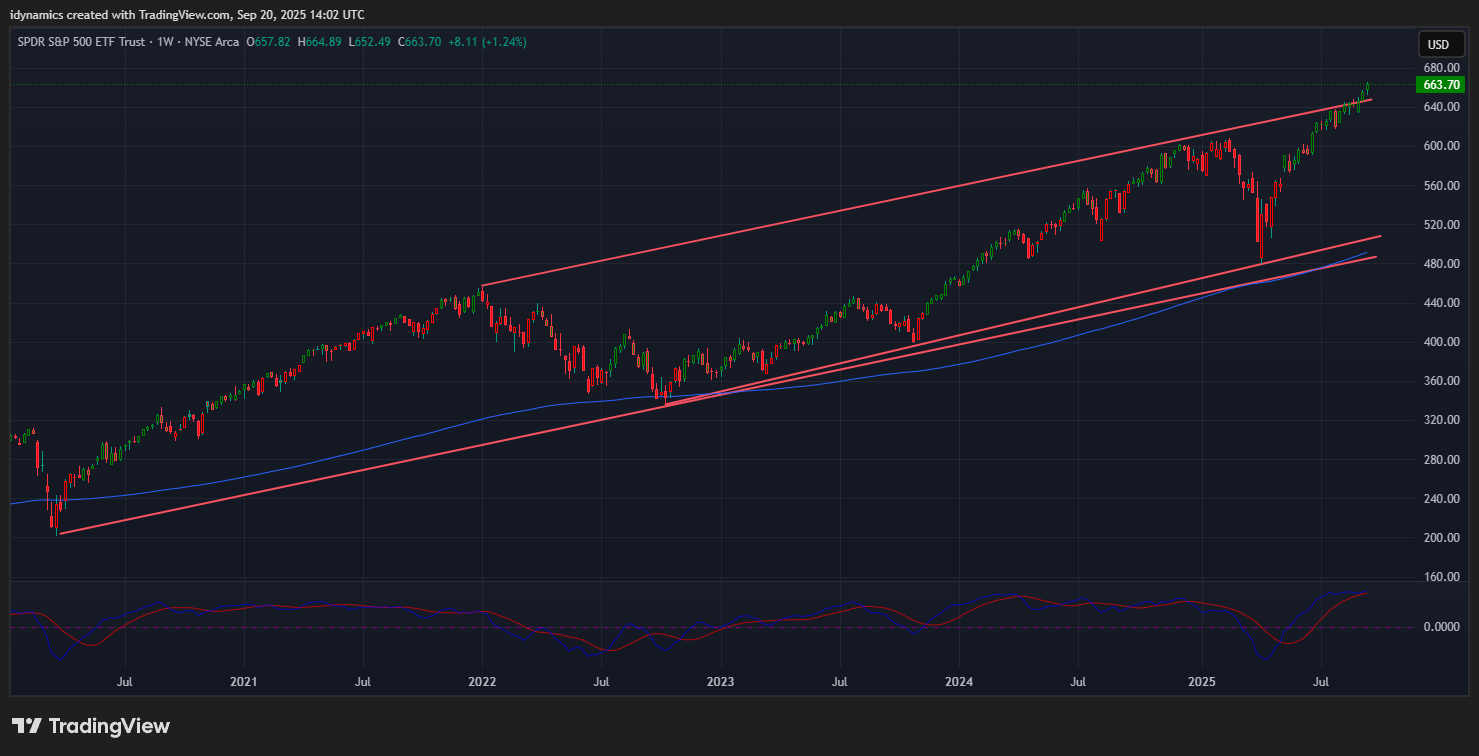
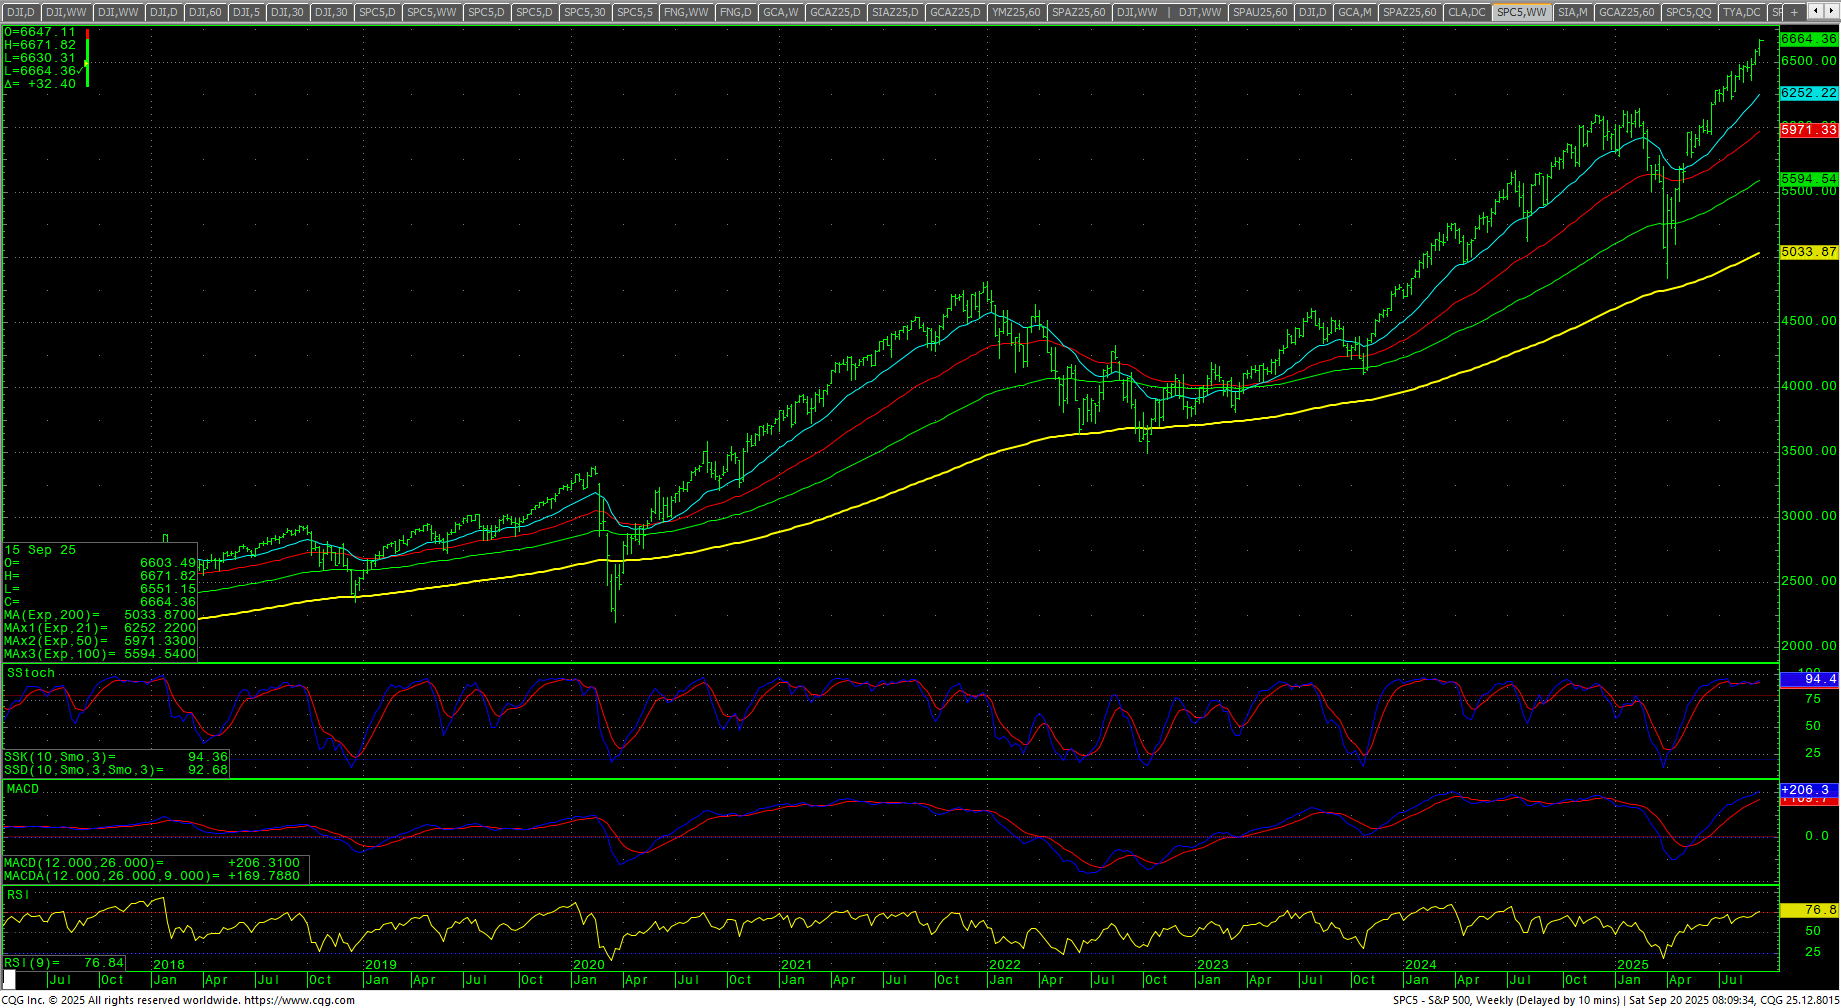 The S&P staged a small intraday blip on Fed Day and then reversed into record territory and closed out the week at the top of the range at a record high close…ending up +1.22% to bring the yearly gains to +13.69%. The daily stochastics are up and have reversed the preliminary bearish divergence with the MACD still on bearish divergence. The weekly is up with a preliminary bearish divergence. The daily RSI is a frothy 77.5. The hourly is overbought on Friday’s close and also in bearish divergence. The 200-day MA is 6033.55 and at record highs. The SPY set an ATH and is breaking out above key trendlines.
SPY Weekly Candles
 Resistance is 6666/6672. Rallies over 6672 should test 6692 with counts to 6764 and 6800. Closes over 6800 can carry to 6872 and 6908. Closes over 6908 have counts to 6944 and 6980 through 7016. A close over 7016 offers counts to 7088, 7160 and 7214. Closes over 7214 setup a drive to 7250 and 7286 while opening counts as high as 7448.
S&P 500 Index Hourly H-L-C
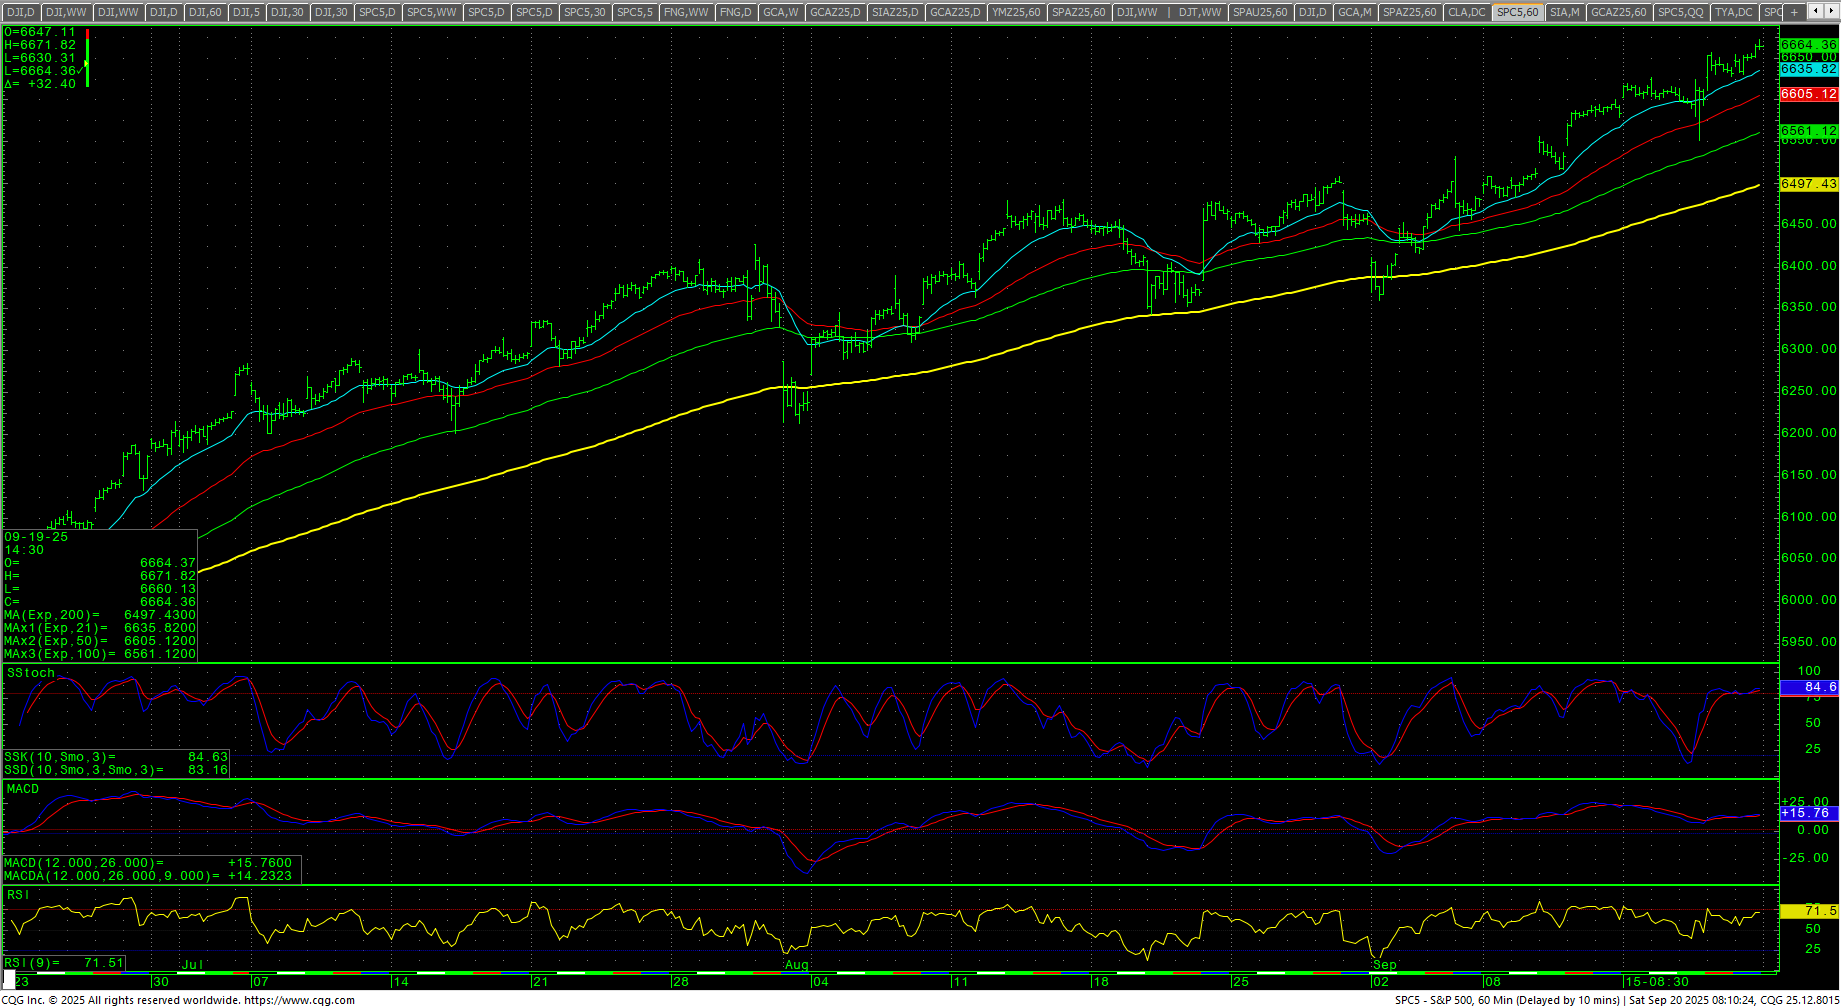 Support is 6625, 6611 and 6597/6595. A breakdown under 6595 should test 6579 with counts to 6551. Closes under 6551 should test 6497. Closes under 6497 opens counts to 6443 with potential to pivotal support at 6389/6386. A breakdown under 6386 will open counts to 6000/5970 with major support at 6212/6201. Daily closes under 5970 should minimally test 5767/5753 with counts to 5536/5533. A breakdown under 5533 is near-term bearish and should test the hourly double bottom in the 5200 level with support at 5456.
| Resistance | Support |
|
|
Charts courtesy of CQG, Inc., CNN, Koyfin, Trading View and AAII