
TECHNICAL ANALYSIS (by Intraday Dynamics)
Major Indices Week of October 3, 2025
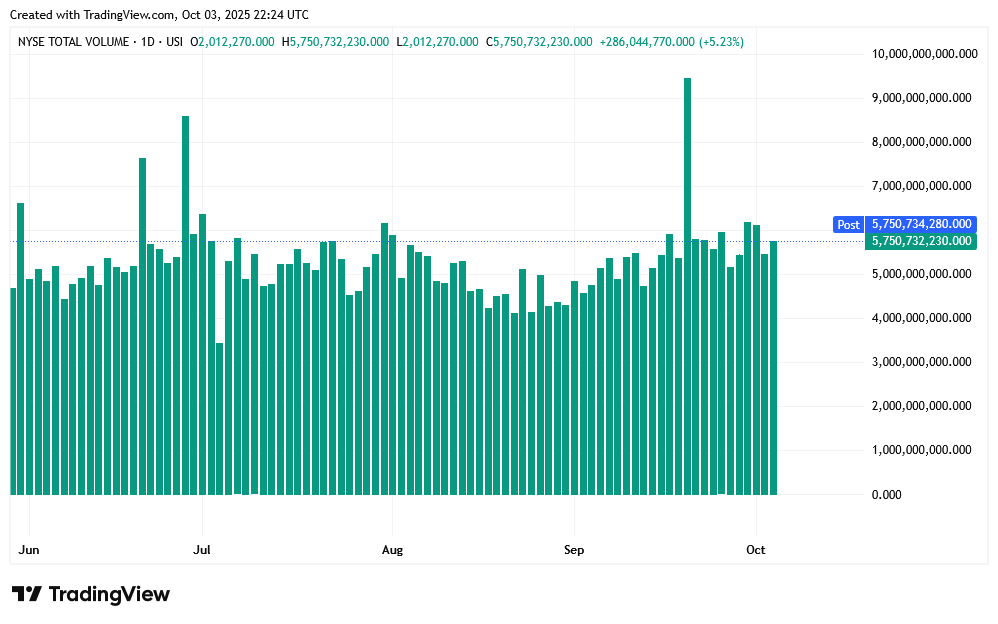
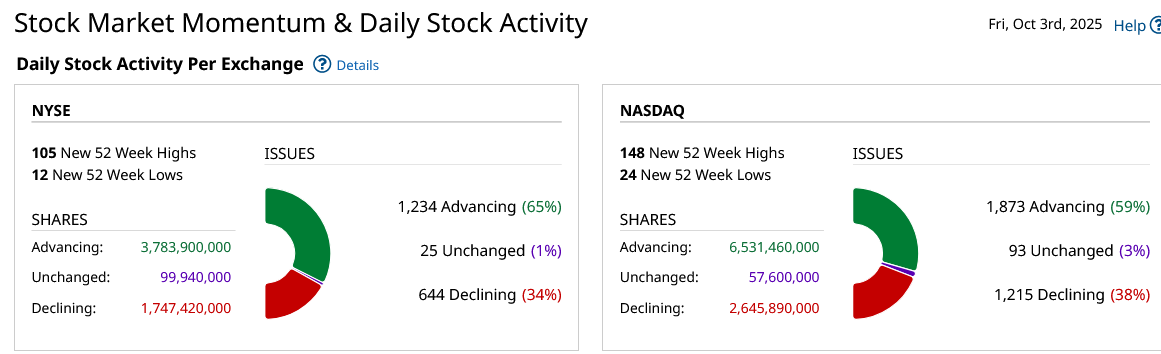
 NYSE Volume
 As goes tech, so goes the market. The beat goes on. Stocks continue to climb the wall of worry to record highs in Friday’s trade. With a government shutdown, there was no Non-Farm Payrolls report…however the ADP reported a decline of -32K jobs in September and adjusted August’s number to a negative -5K. Once again, the gains are centered in education and health and IT, with manufacturing and trade and transportation continuing their yearlong declines.
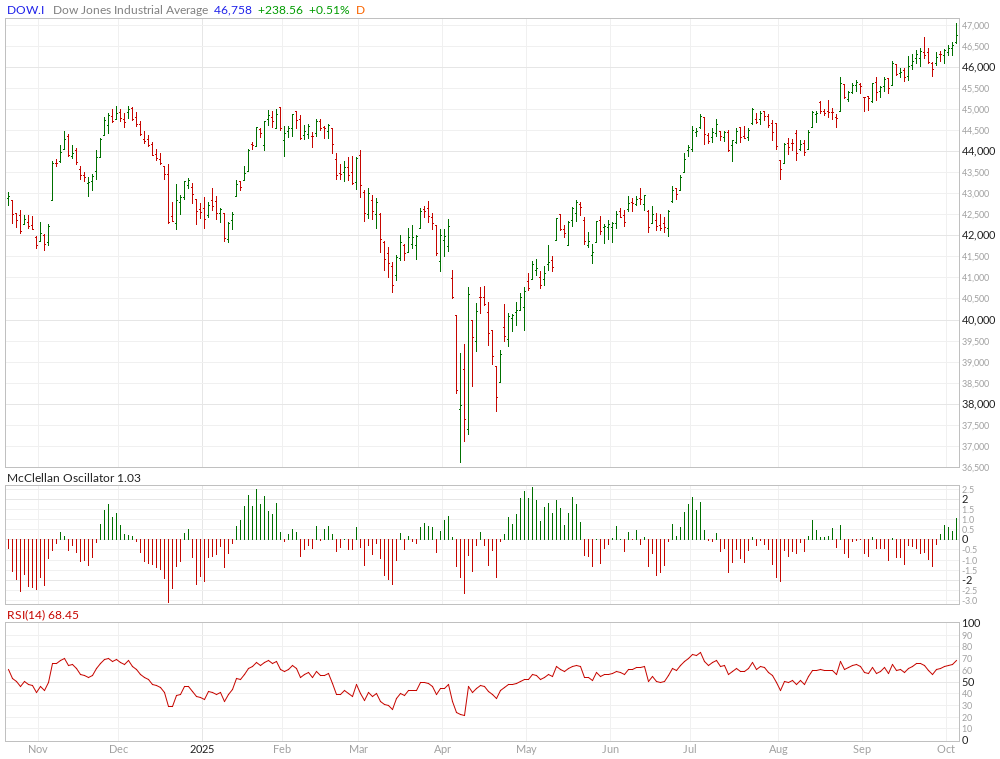
As has been pointed out in the past month+, there are no technical warning signs for this market. Sentiment is complacent but not frothy. Market action remains bullish with higher highs and higher lows. The continuation of prices through the critical cycle timing of the week ending 19 September 2025 is a positive sign and suggests further upside activity. El Trendo es su Amigo. (See the caveat with both XLF and FANG below)
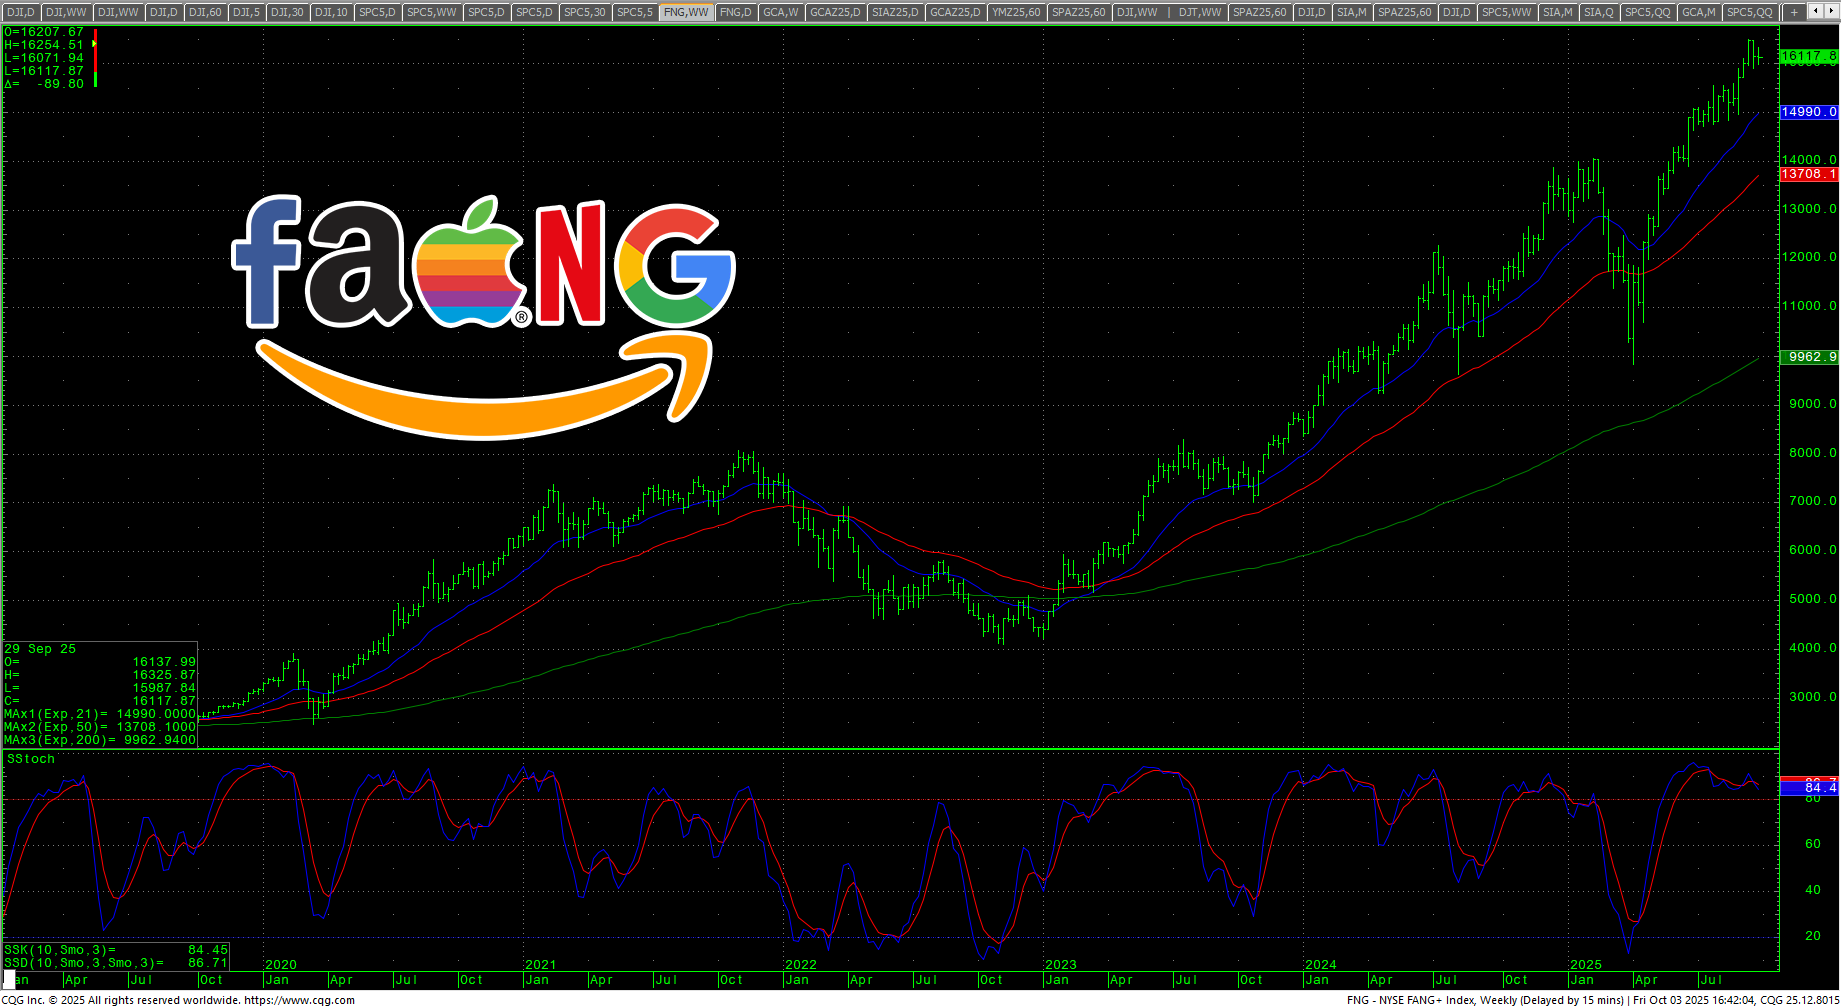
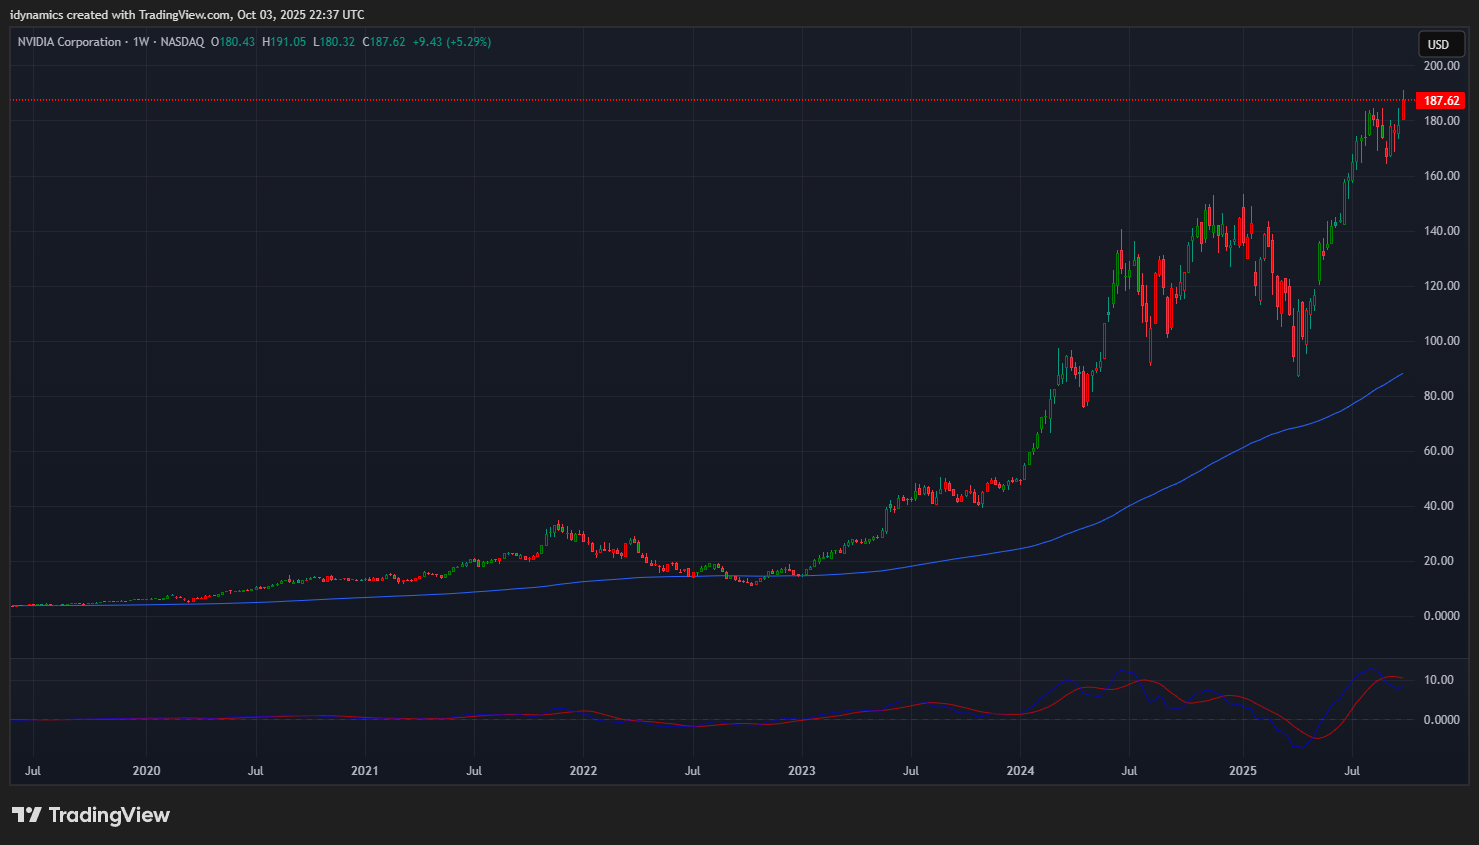
Prices were dragged higher by NVDA, which now represents around 3.6% of the entire U.S. market while the MAG7 make up a disproportionate amount of both U.S. and global stocks. The FANG closed out the week with a fractional loss and there are three charts that need attention based on September’s timing.
 The first is the XLF, which has stalled at record highs. Watch the XLF as it set its weekly closing high in the critical timing. In addition, the current FANG high also came in the critical cycle timing with major bearish divergence. These short-term moves might be a leading indicator.
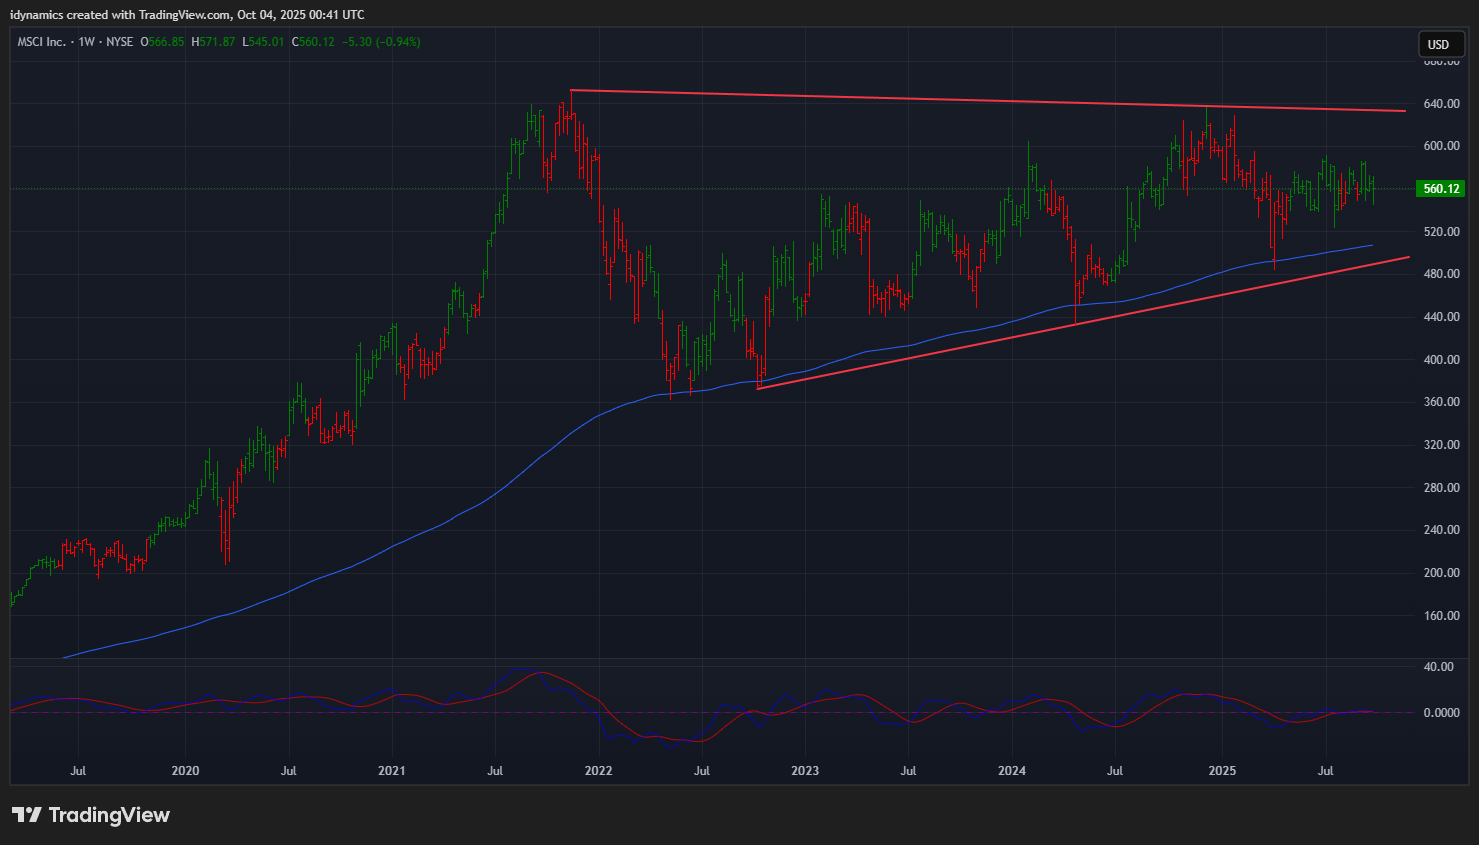 The next is the MSCI which is in a large pennant pattern.
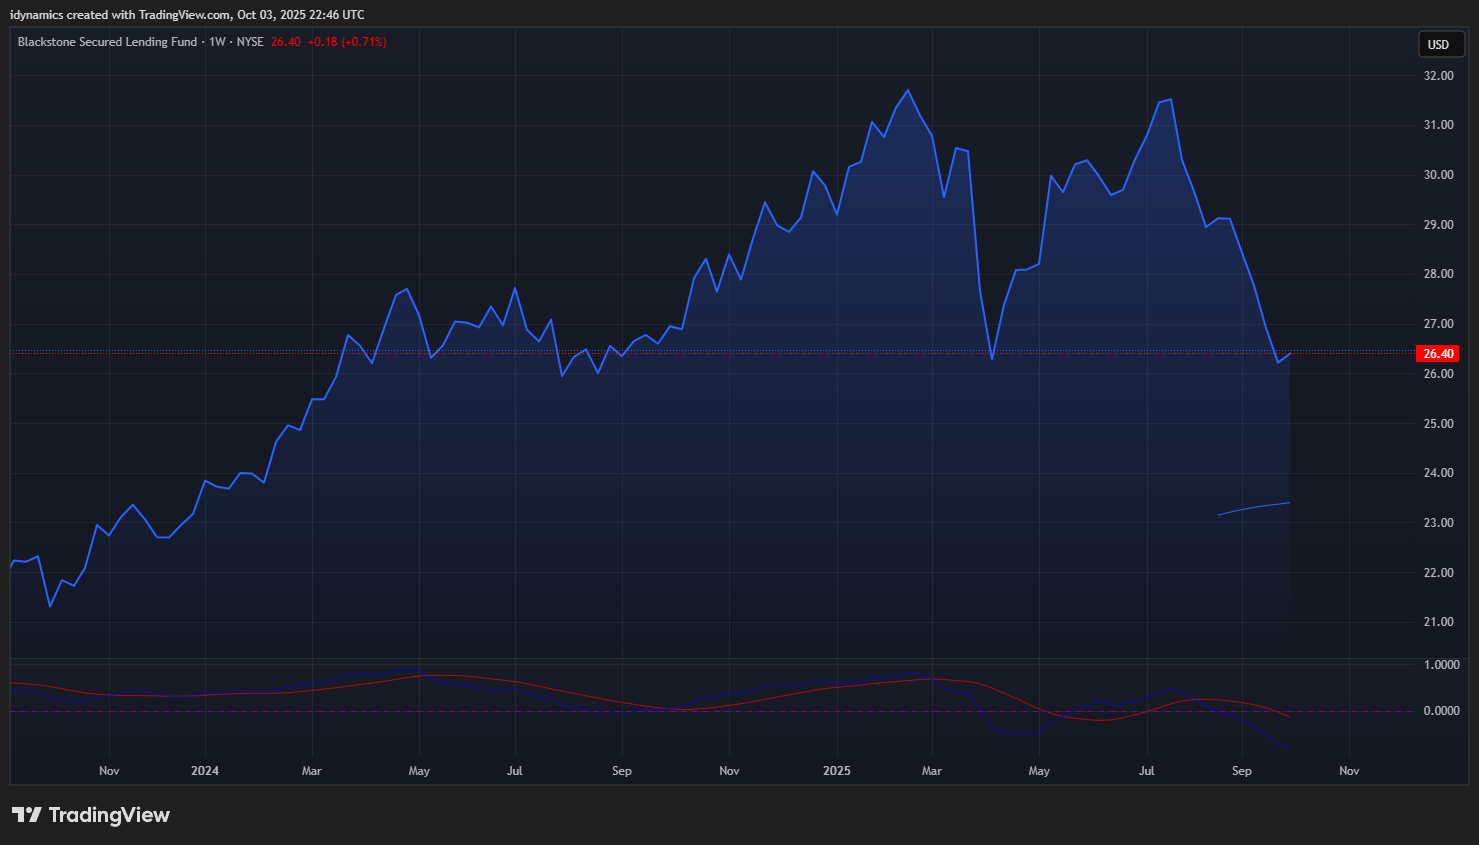 The third, and most critical, is the Blackstone Secured Lending Fund (BXSL) which is testing 15 month lows. This chart represents the grease on the AI Revolution wheels, e.g., the “bank.” If the BXSL starts taking out the April 2025 lows, the AI wheels might start to fly off.
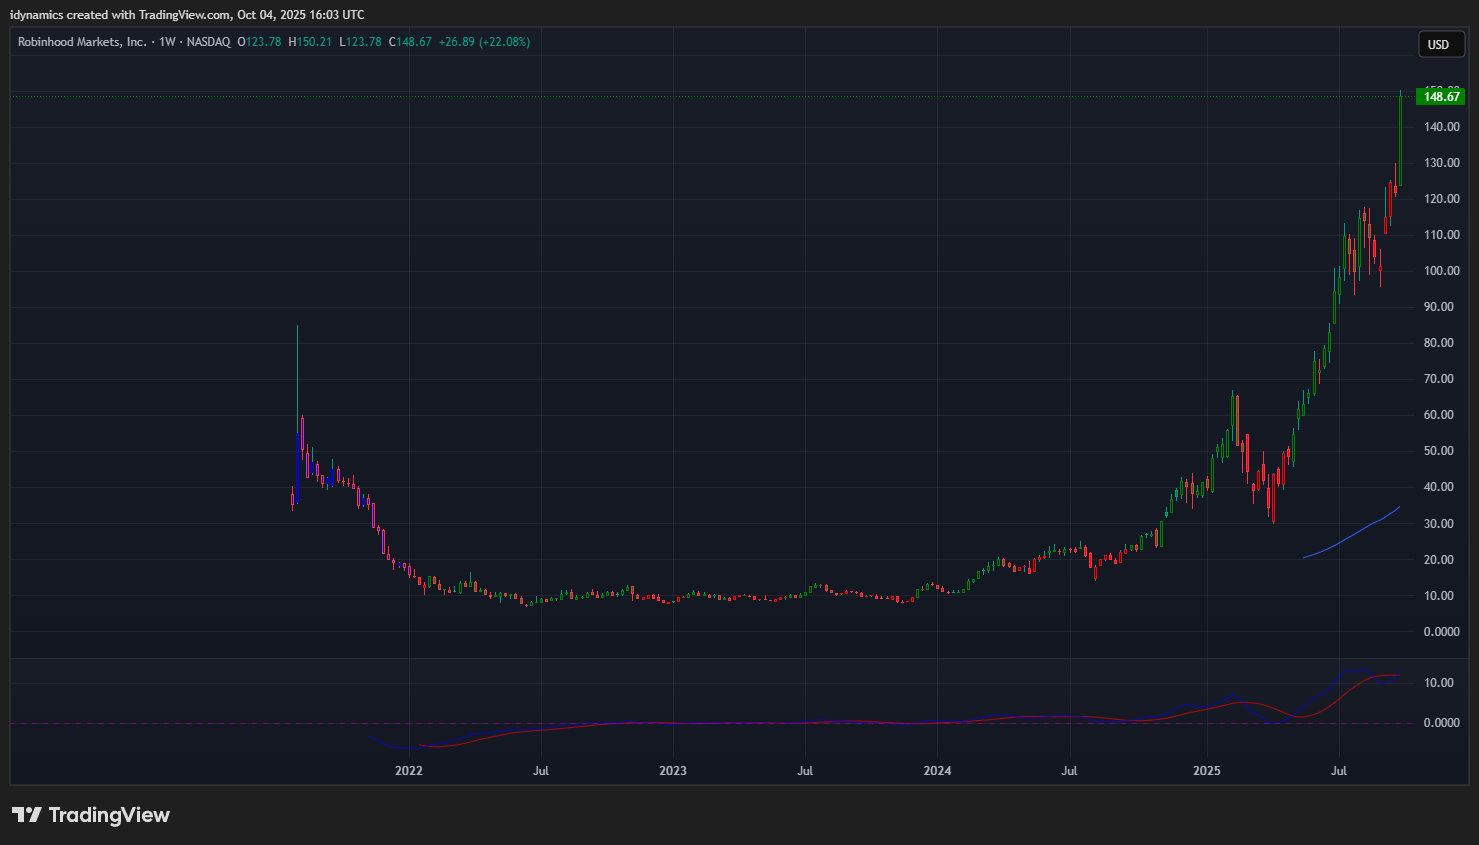
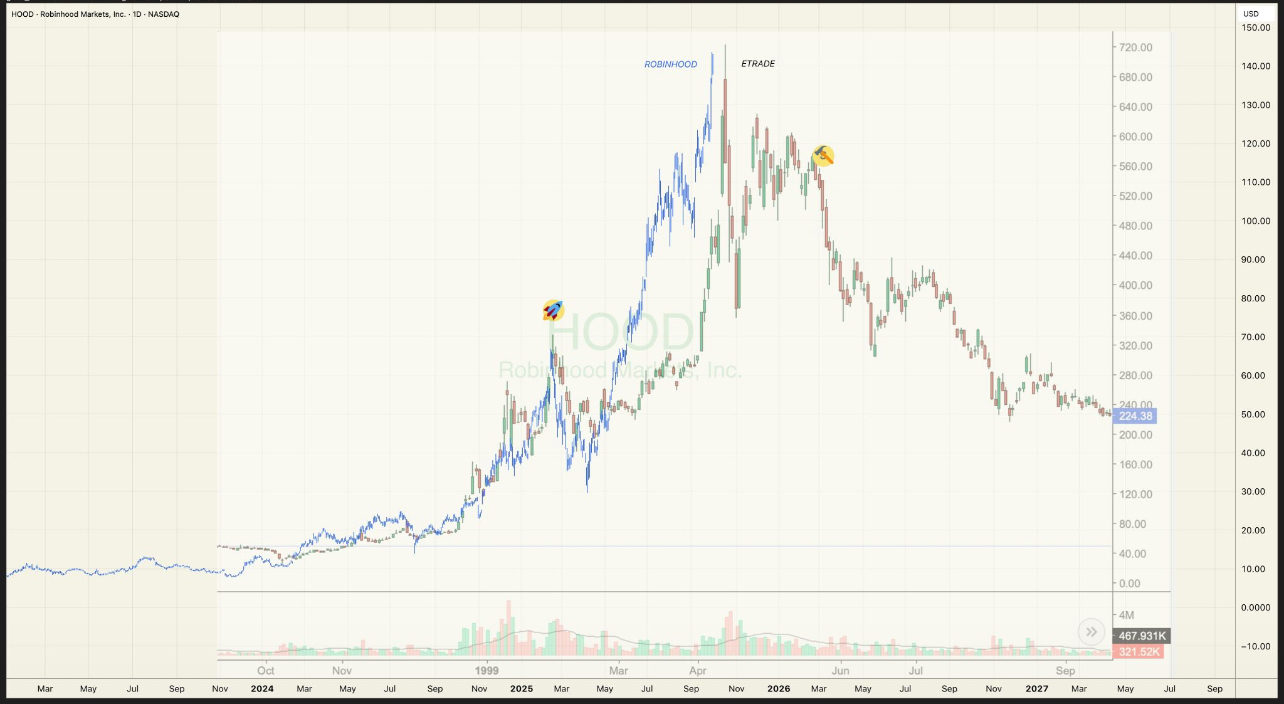 Retail traders continue to pile into the market on margin and this comparison chart between Robinhood now and E-Trade in the Dot.Com bubble is an eye opener.
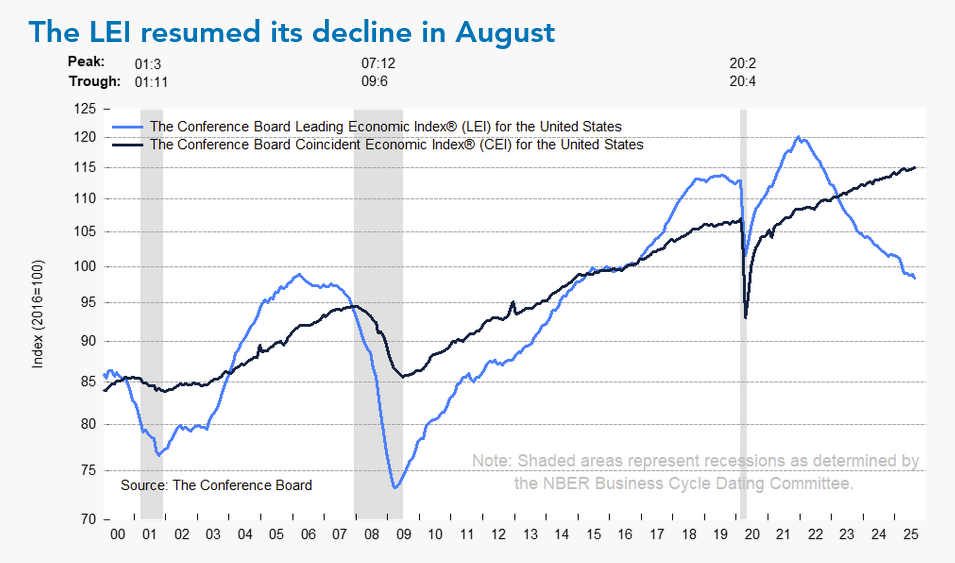
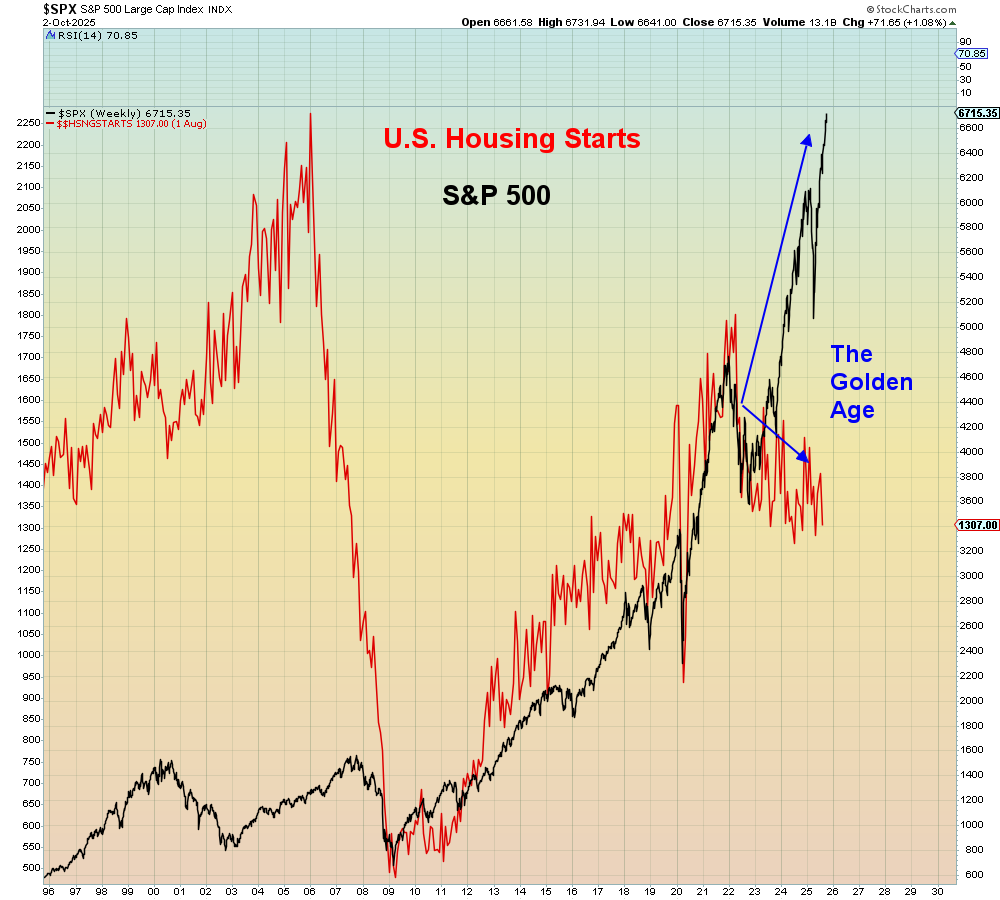 Two other indicators that show overall weakness are Leading Economic Indicators…predicting a recession coming, and Housing Starts, which are dragging way behind soaring equity prices.
Sentiment remains subdued overall, and the markets do not have the volume and/or volatility to suggest that there are any glitches in the Matrix. The CFTC S&P 500 speculative net positions shaved the negative numbers to -172.5K, off its recent two year low.
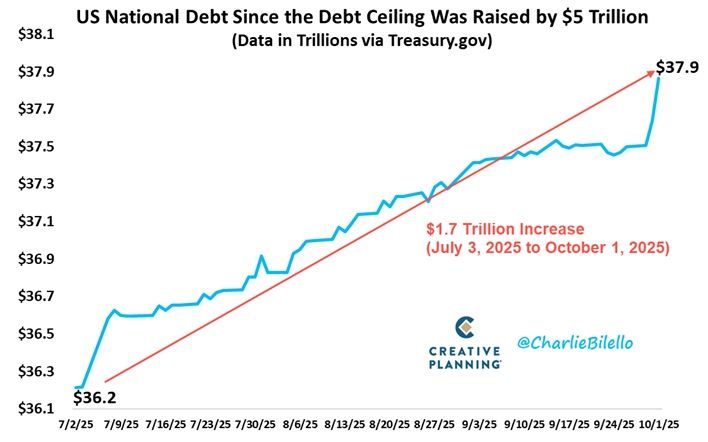
U.S. debt continues to explode higher following the expansion of the debt ceiling this past Spring…increasing +$1.7 trillion since July of this year.
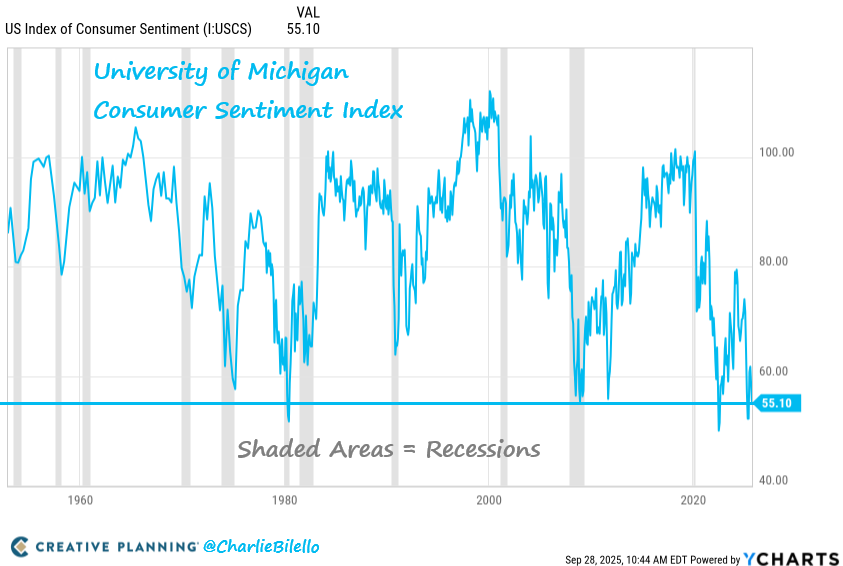 Consumer Sentiment is sitting in the 99th percentile at the bottom of the range since 1952. Spending by consumers is being driven by the top 10% of “earners,” who simultaneously own 90% of the stock market. The rest of the country is being dragged. There are now more ETFs traded than there are individual stocks in the U.S. market.
SPX Quarterly H-L-C
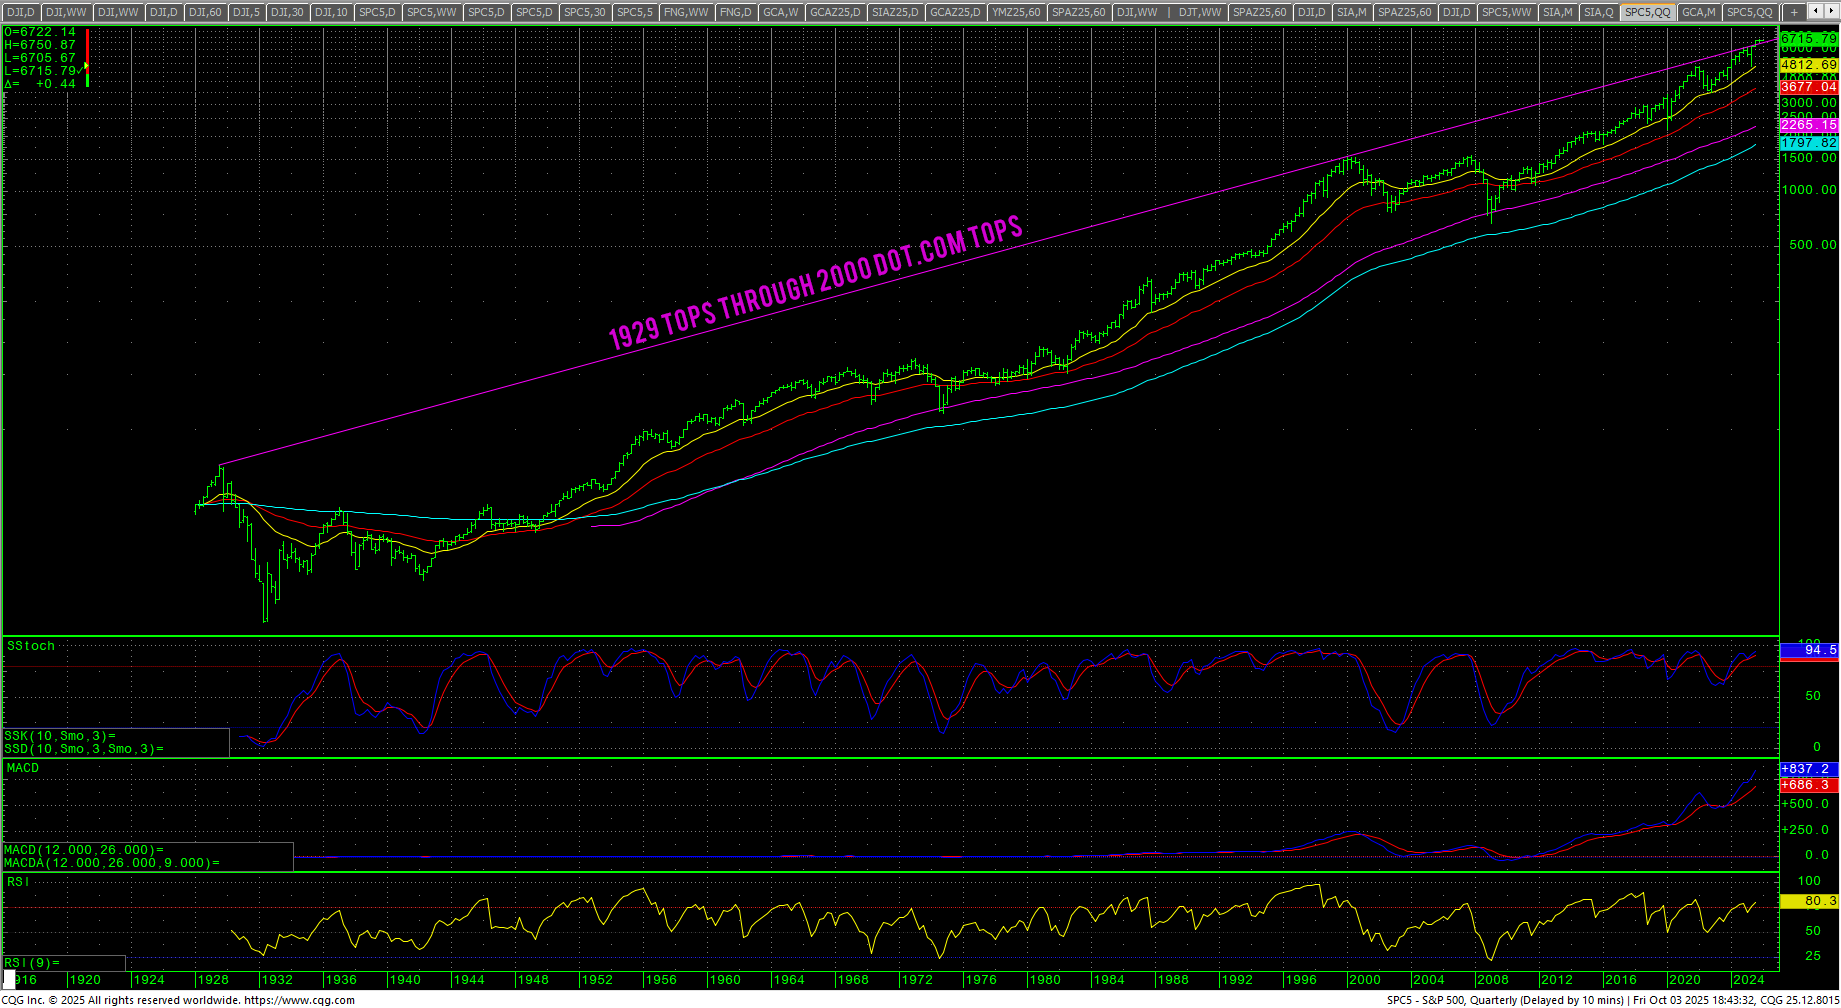 There is still a case for the super bulls target levels with the SPX on a clean breakout above the trendline that connects the 1929 tops through the 2000 Dot.com tops. There simply is zero technical evidence that suggests prices are exhausting and only a high-volume reversal would lend credence to a bearish case. Higher highs and higher lows makes for bull markets.
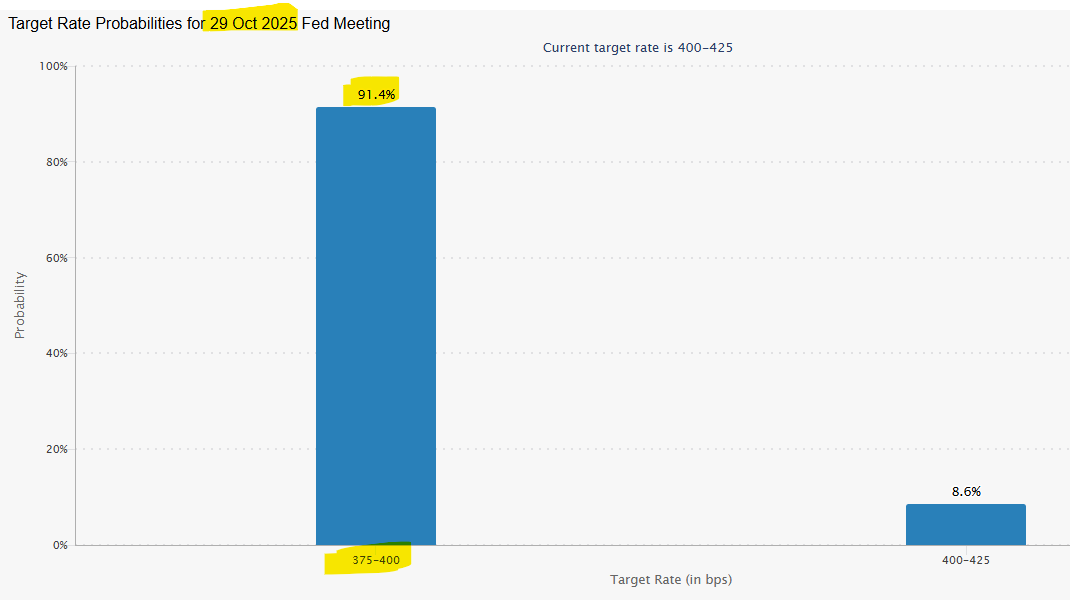 There is now a 91.4% bet that the Fed will lower rates again here in October. Source: Charlie Bilello.
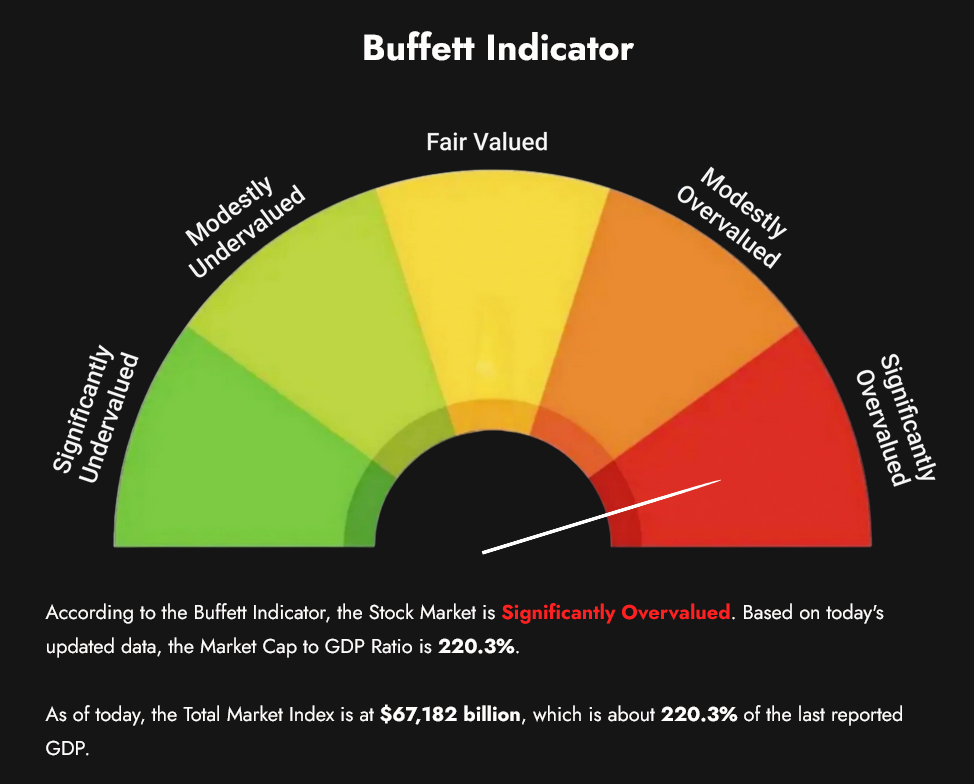
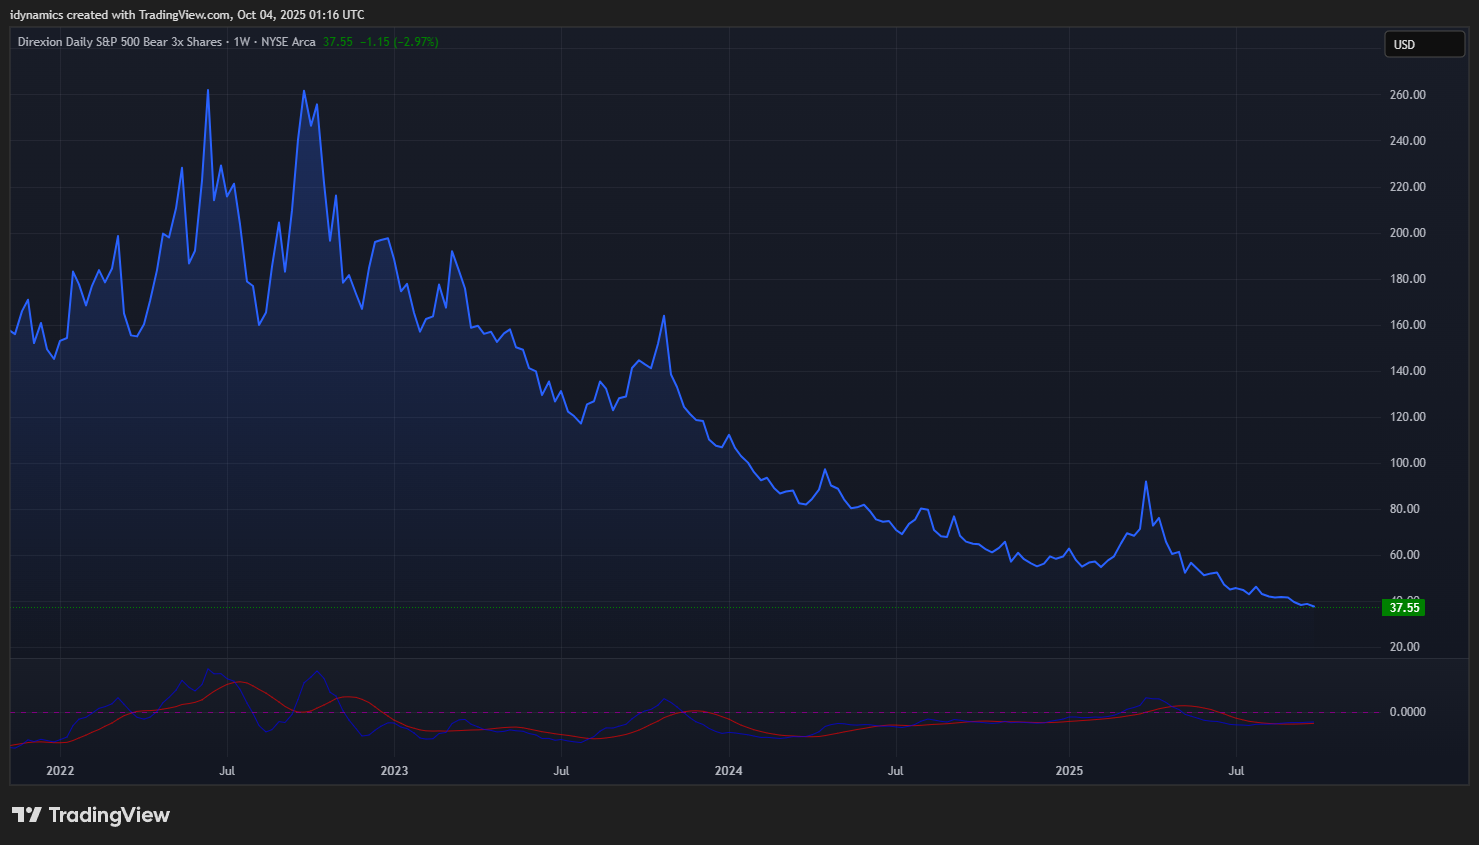 The Buffet Indicator hit another ATH at above 220.3%. S&P Bear 3X Shares continue their collapse to multi-year lows.
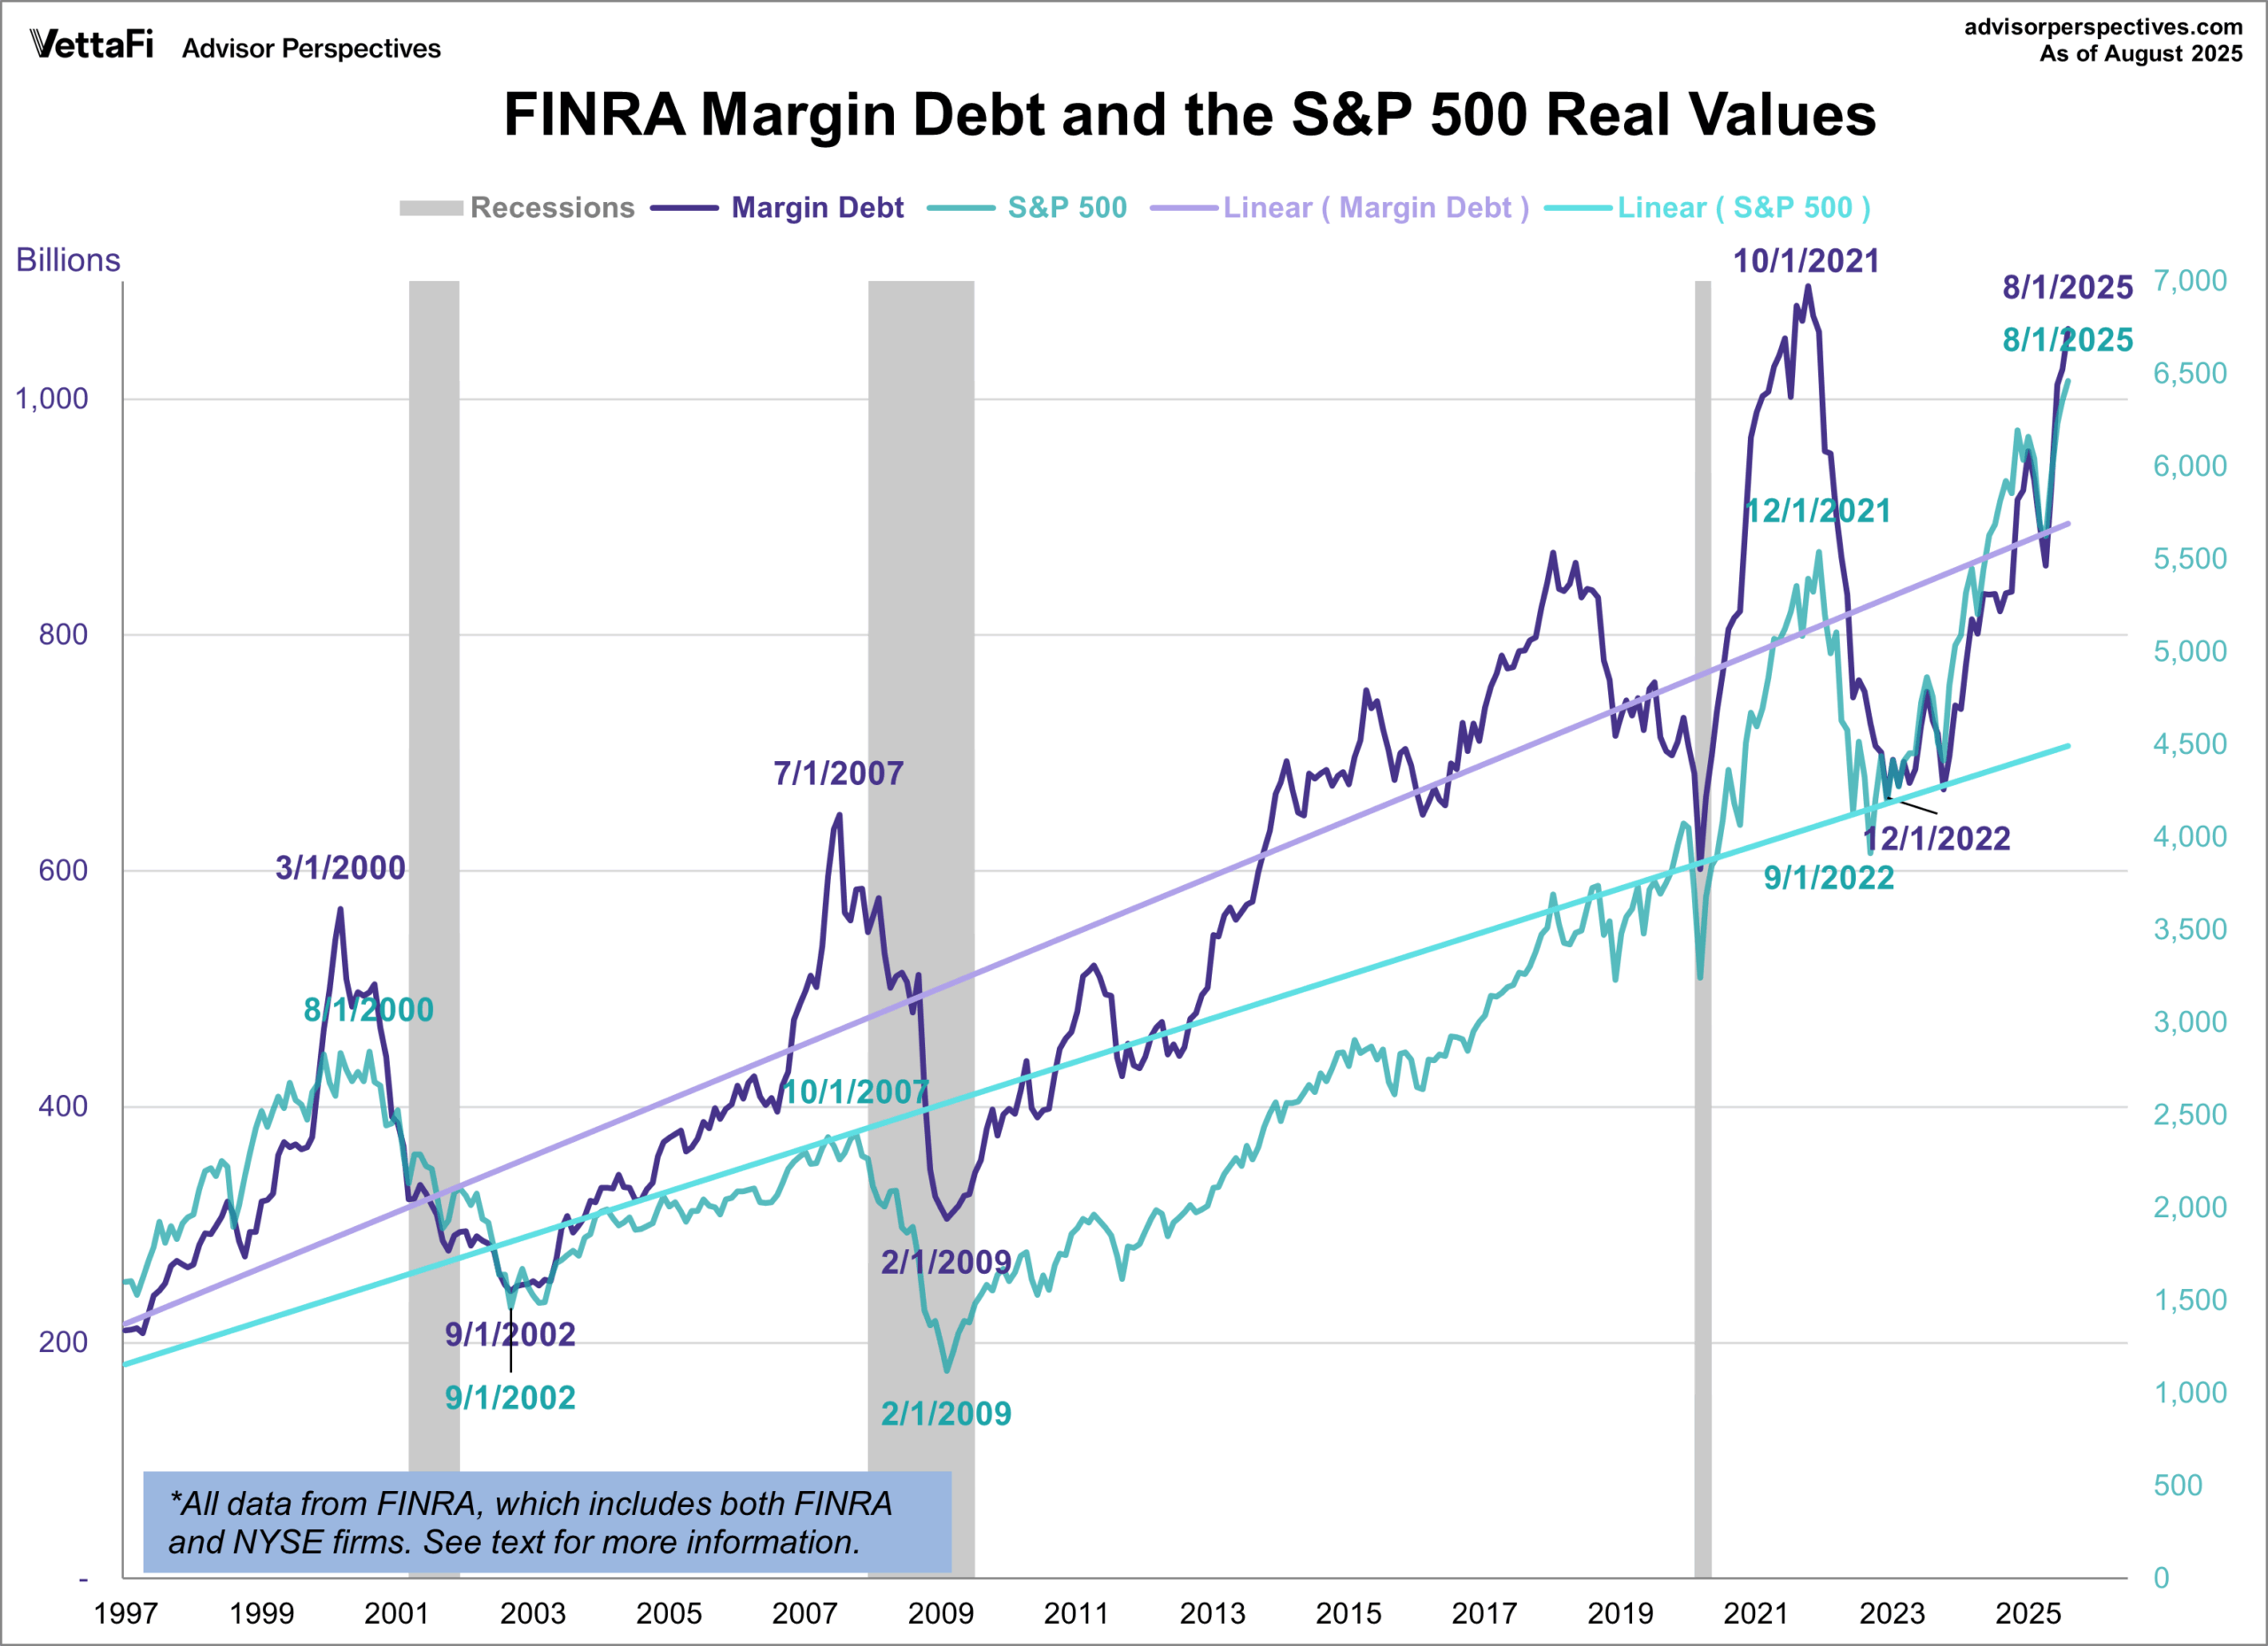 On Friday, Bravos Research put out a piece called: The 1.1 Trillion Dollar Warning Sign in which they outline the size of the margin market as it hits $1.1 trillion. In 1929, margin debt was 9% of the U.S. GDP. Today’s combined margins account for 20% of GDP…double the 1929 readings. Is the market overbought? Absolutely. Are there any whispers of a fat lady? Nope. (Unless you look at hourly trends on the XLF and FANG from the critical timing window).
S&P 500 Stocks Above the 200-day MA
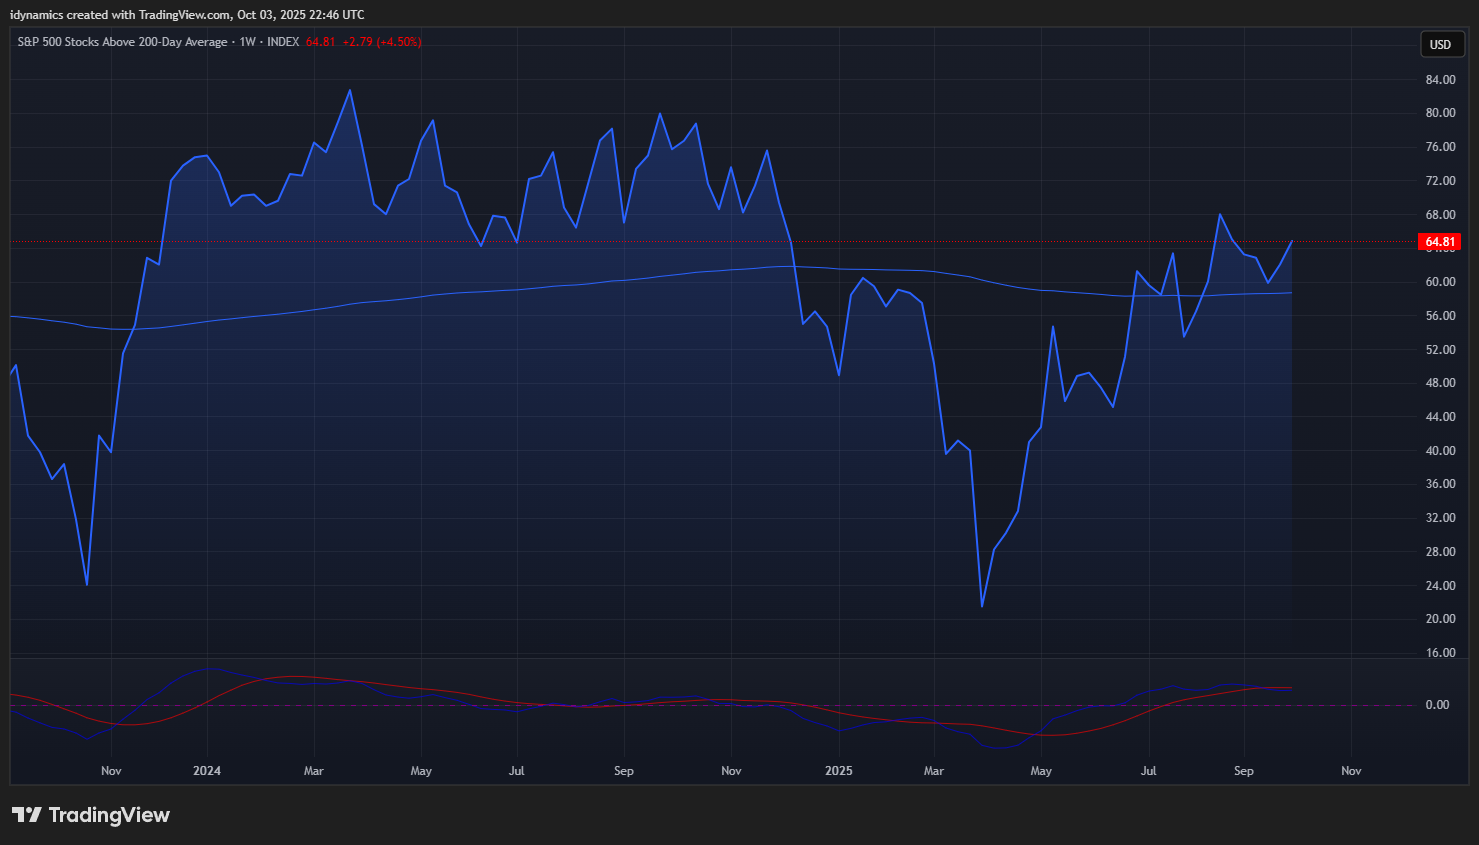 Breadth was flat for all the markets on the week with the share of SPX stocks above the 200-day MA at 64.81%. The high in September 2024 was 72.92% and 82.70% in March of 2024. Divergence remains the name of the game.
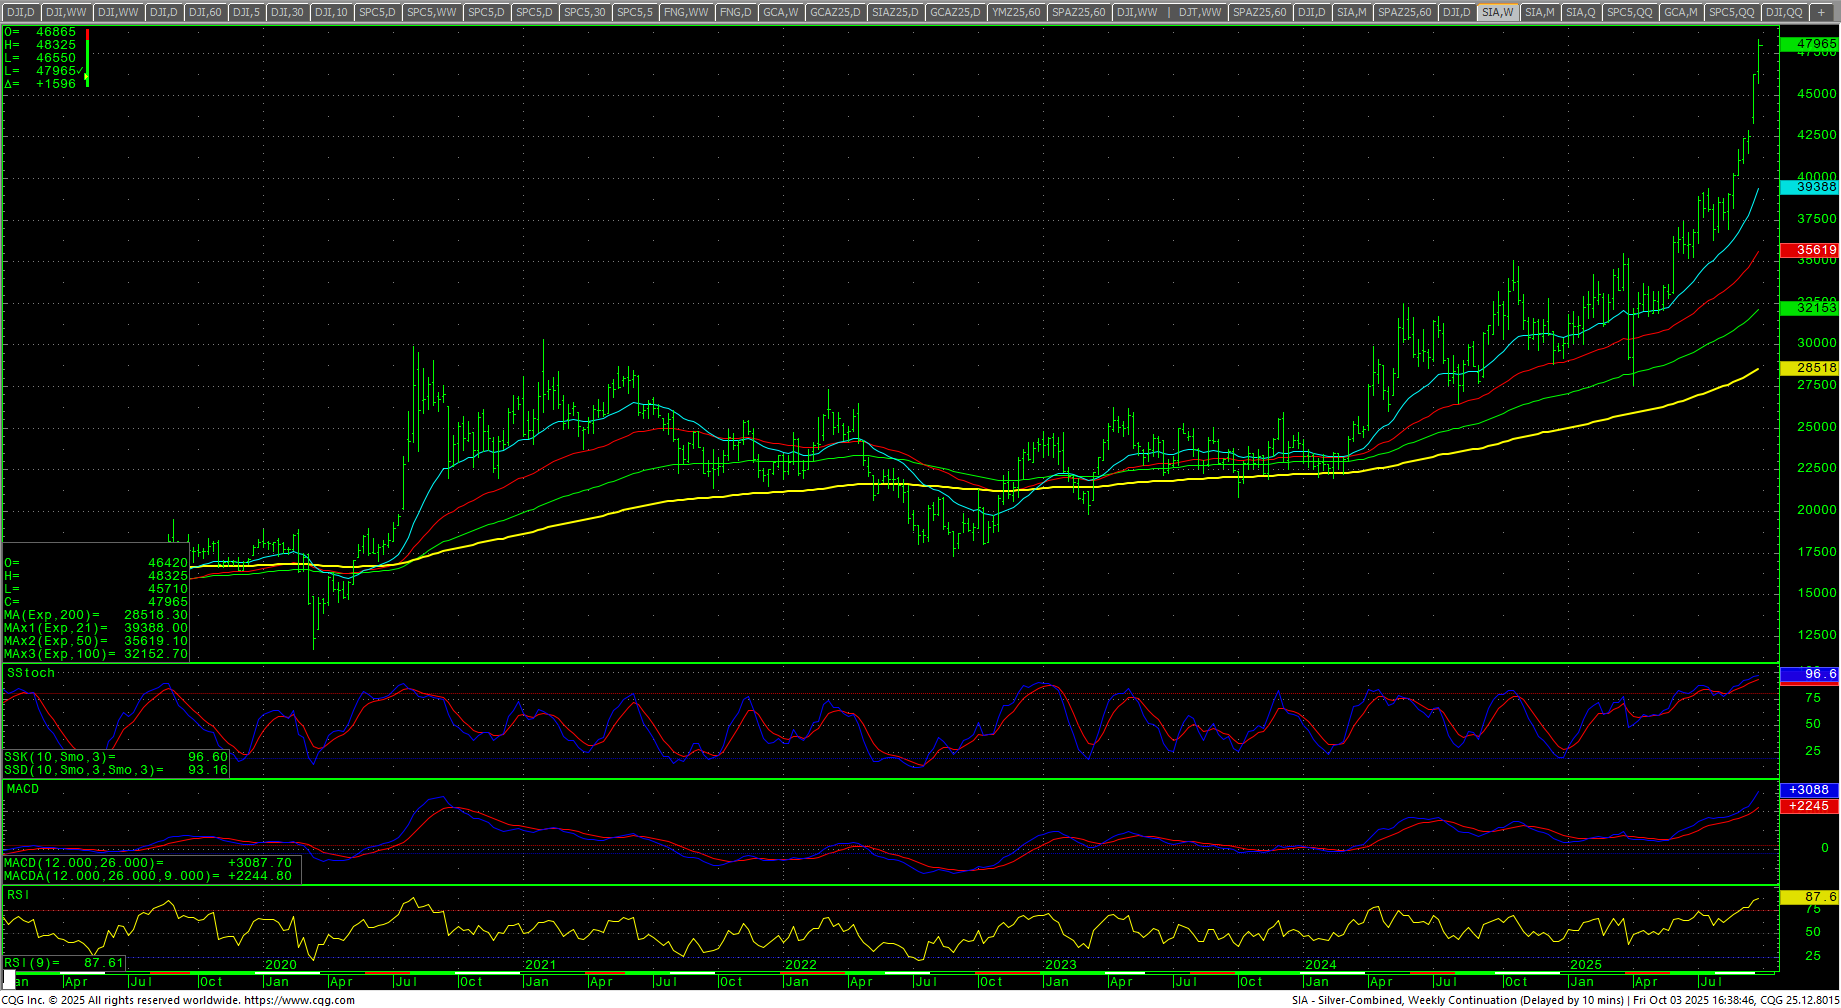
MAGS (Magnificent 7) Weekly H-L-C
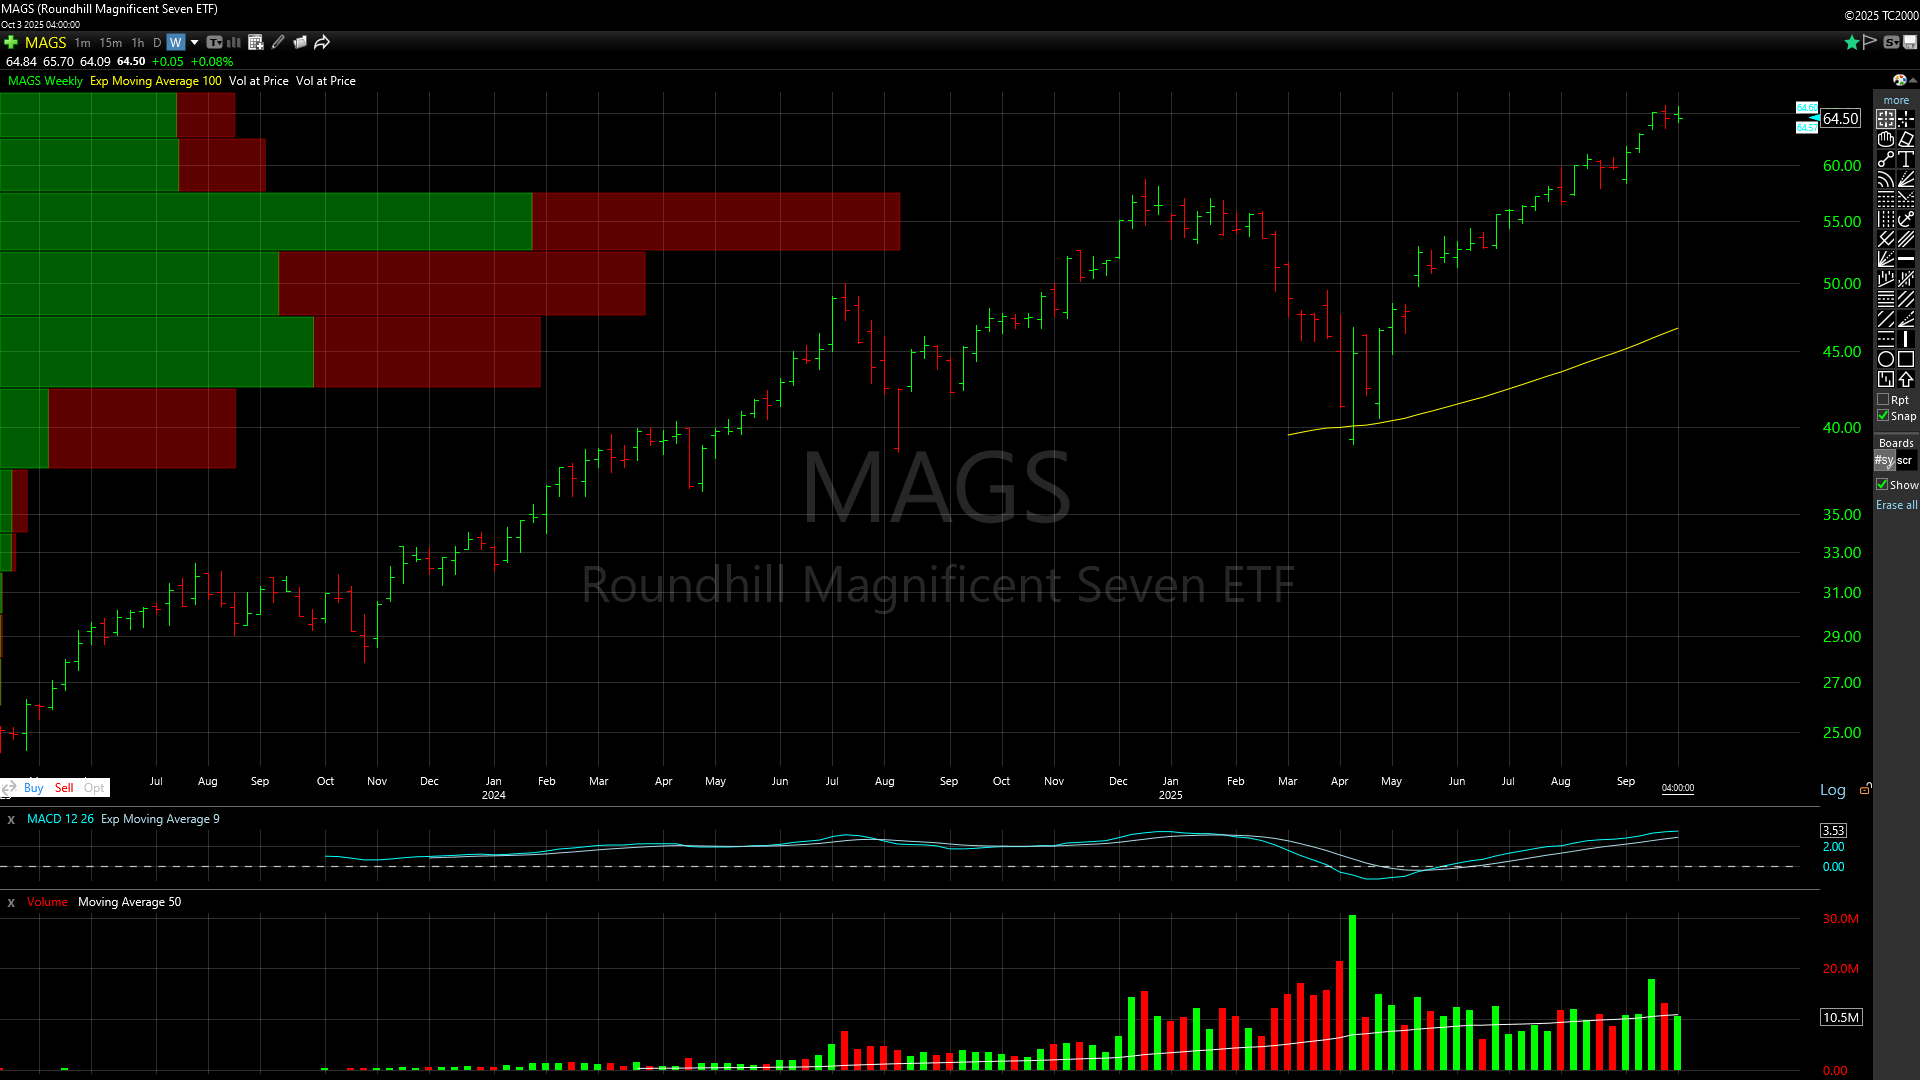 The MAGS traded an inside week and closed flat, down -0.03. The index is finding resistance against the target of 64.50. The chart has a much higher target now 74.30. Support is at 59.42/58.85 and 55.52. Under 55.52 can test 52.37 with critical support at 49.217/49.00.
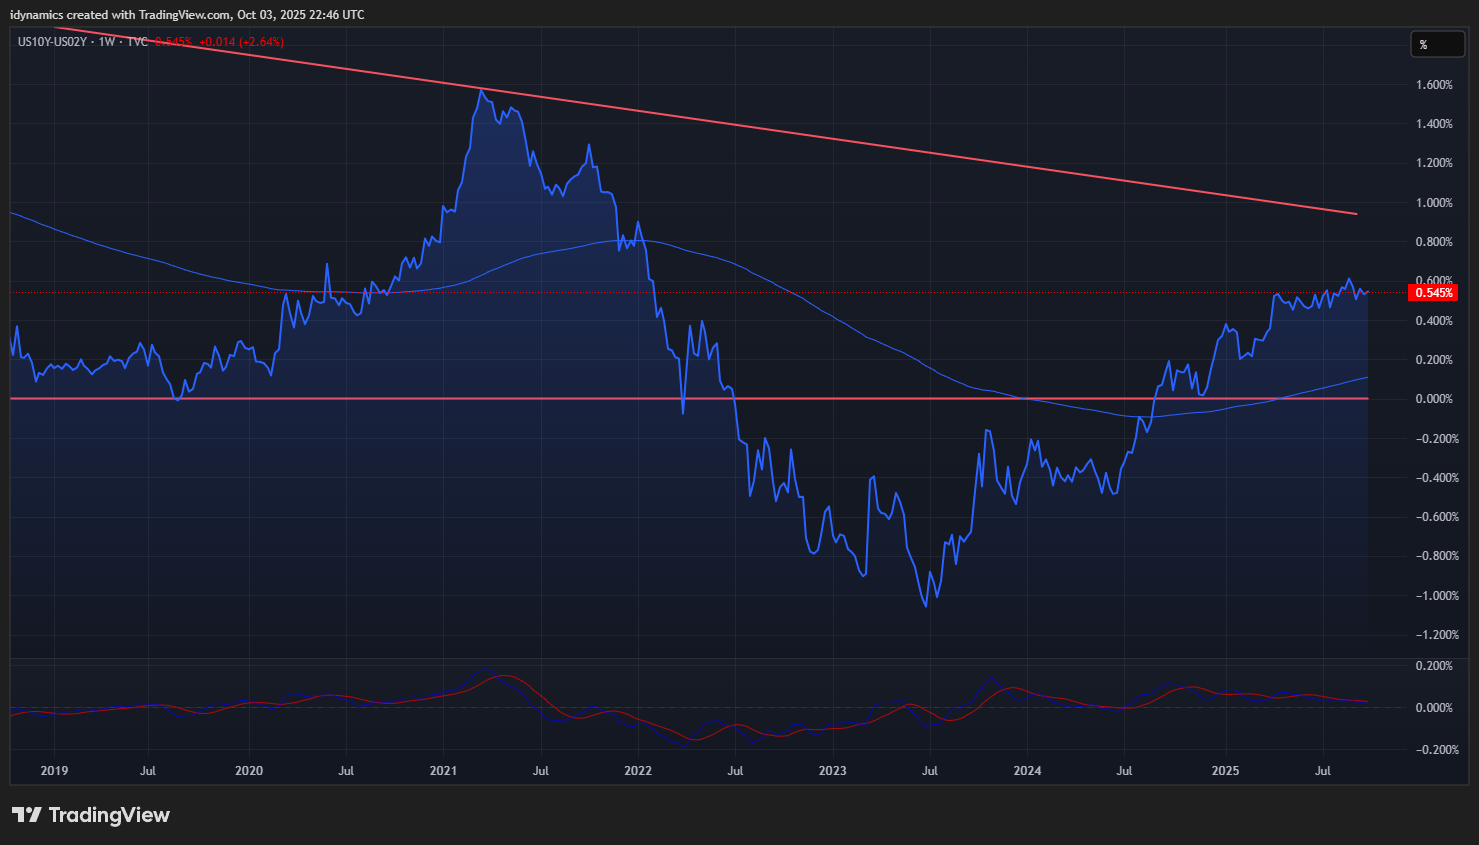
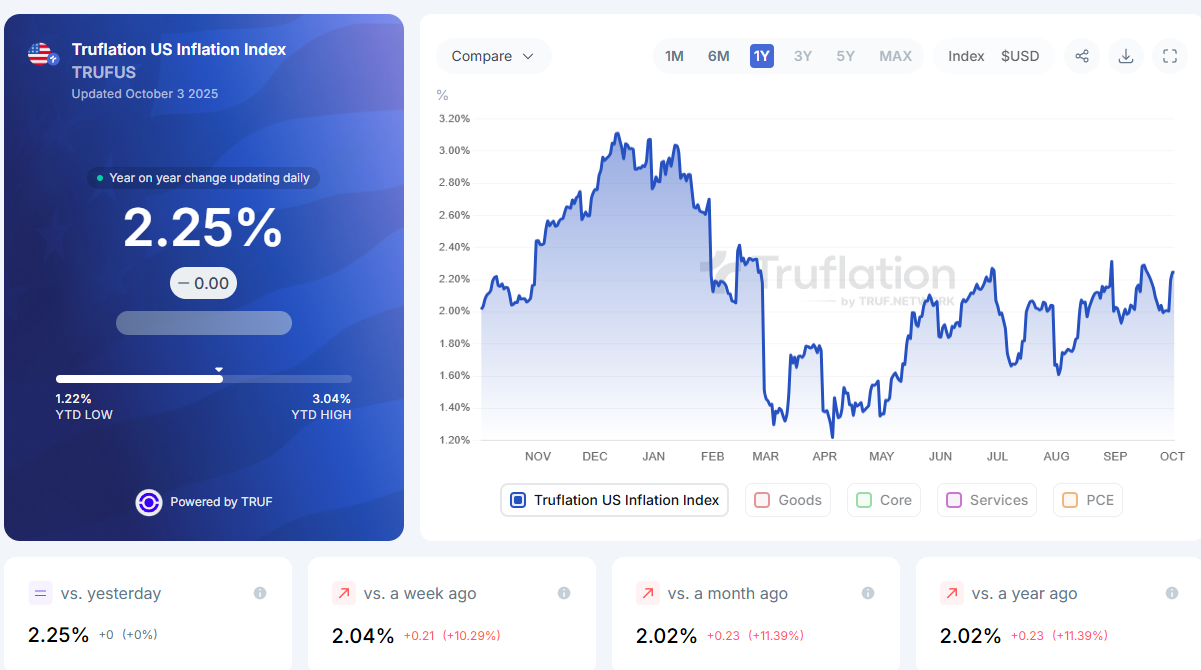
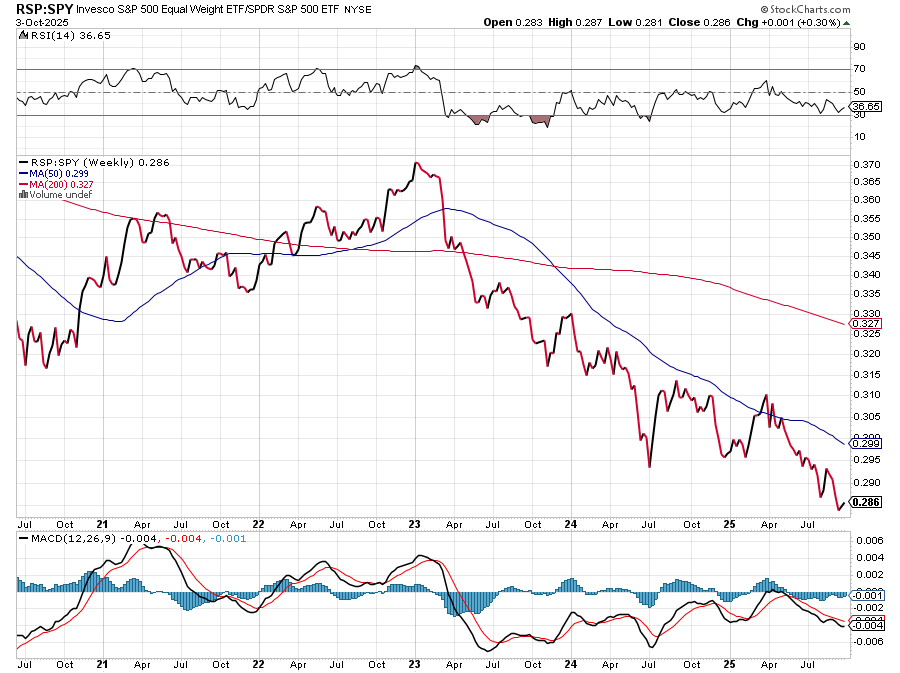
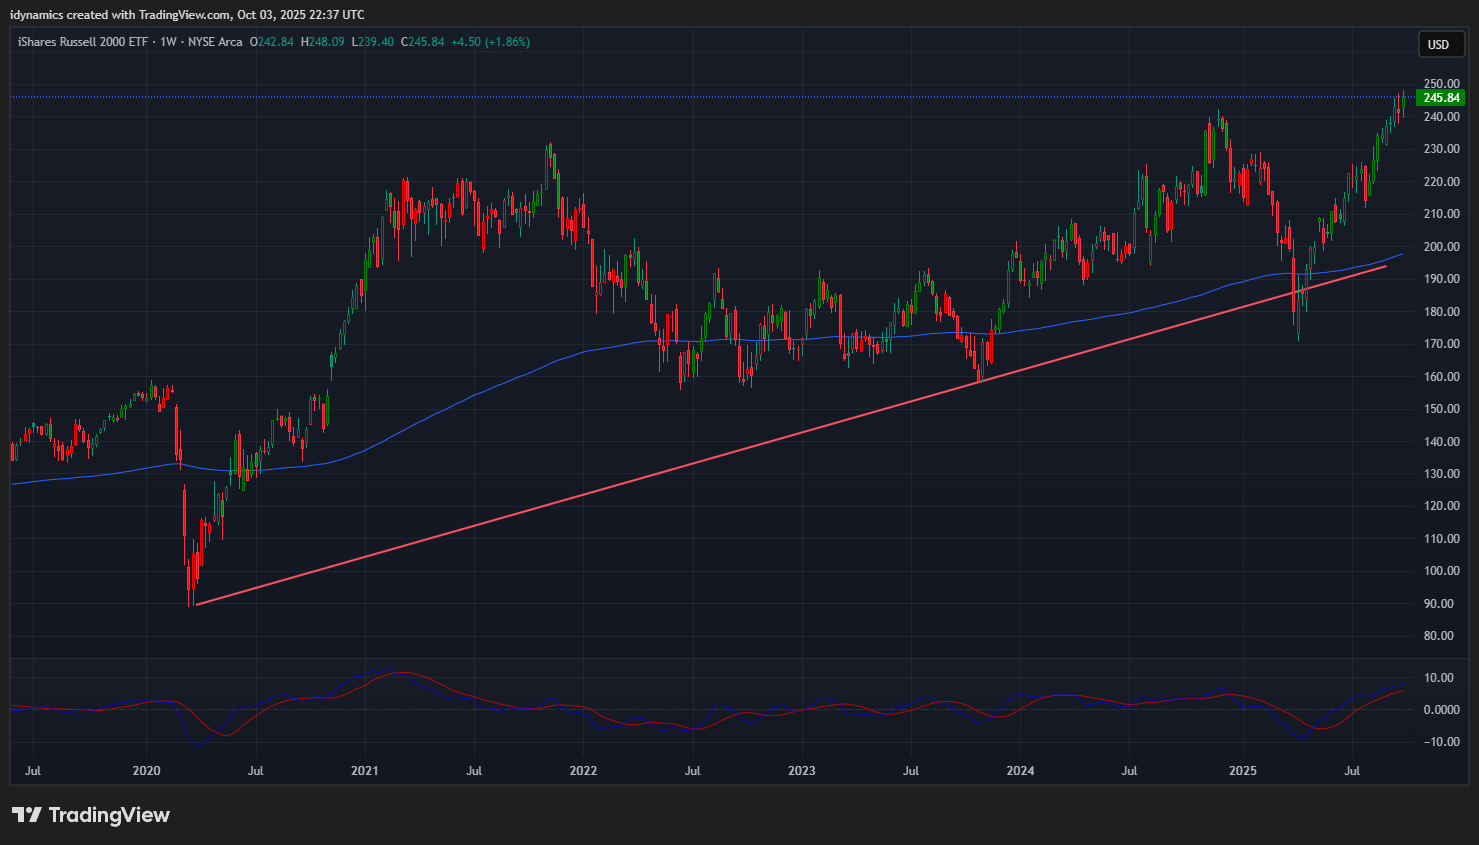
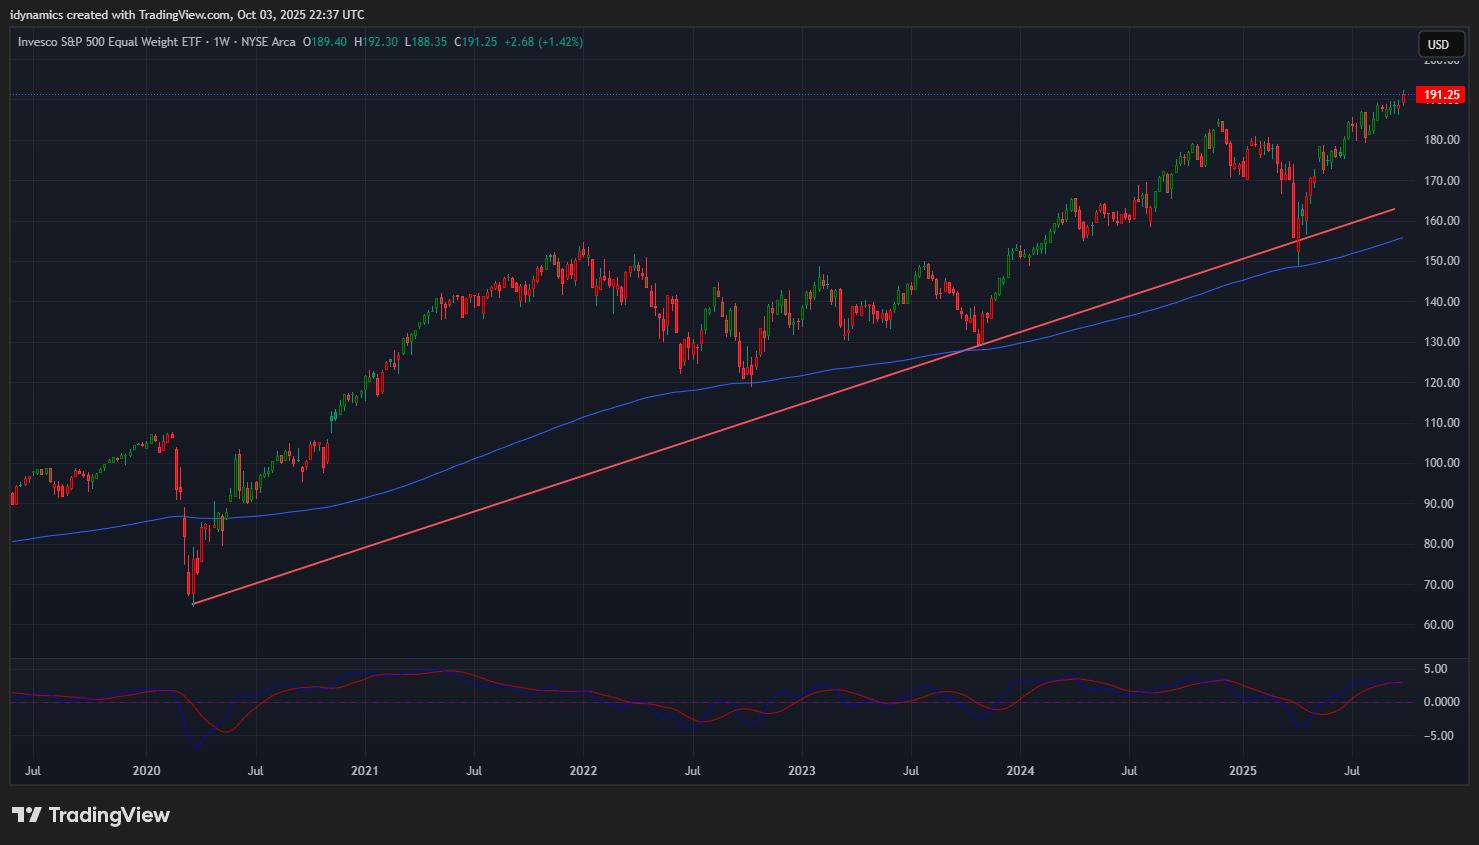
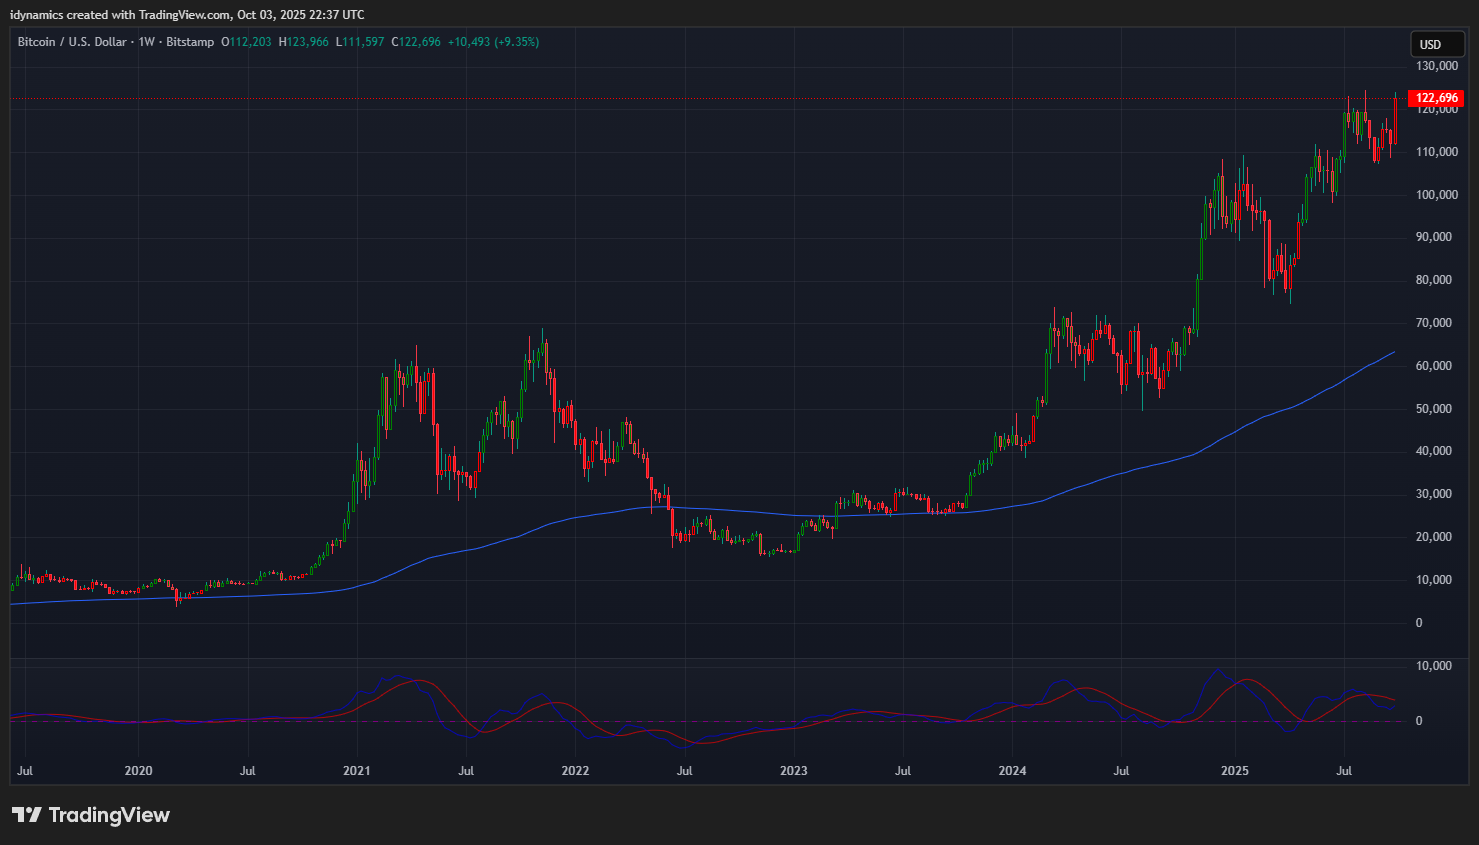
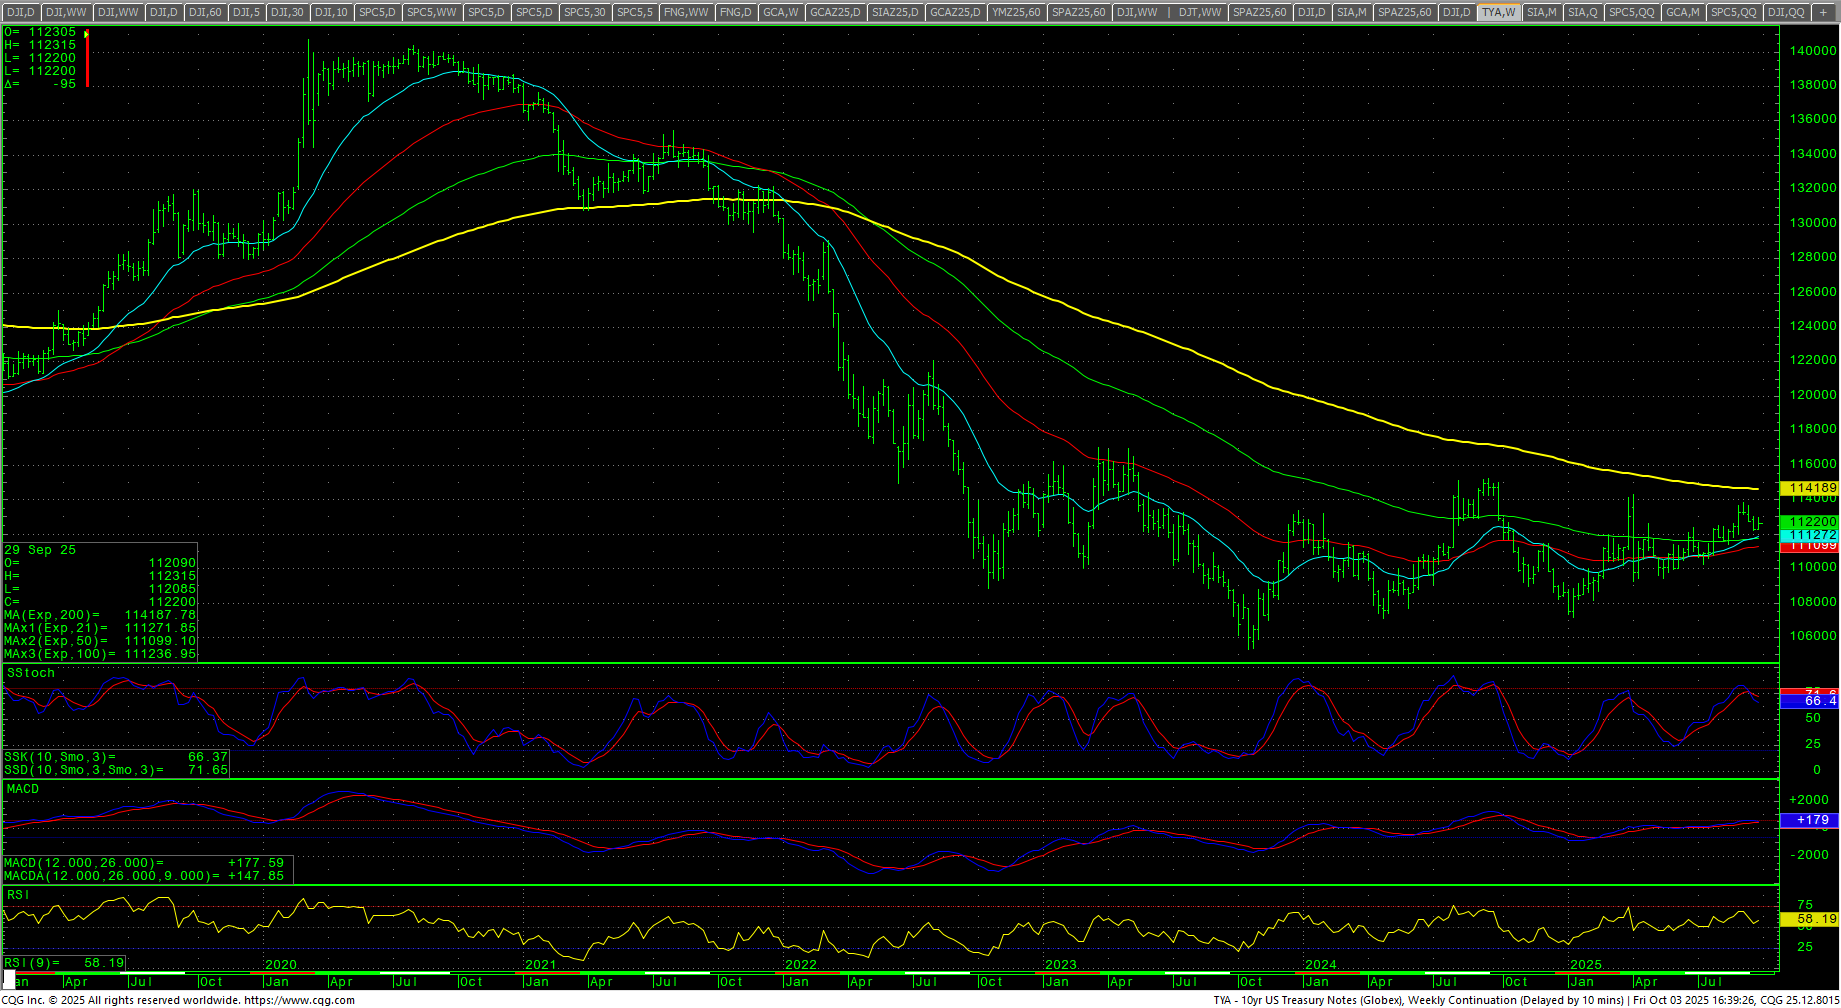
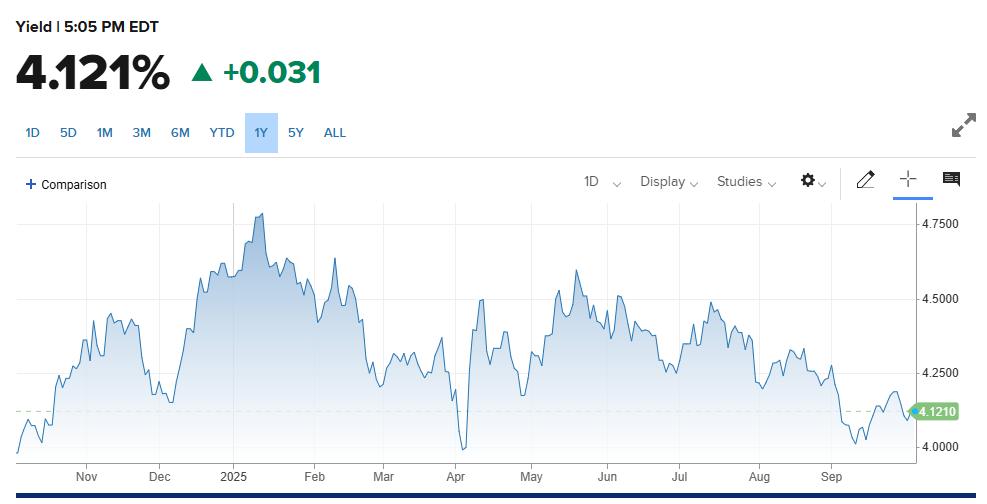
The RSP:SPY showed a slight bounce off the previous week’s multi-year lows. The weekly is trending lower in an oversold position and the MACD is down. Resistance is still .294. The IWM moved to record highs and closed in the top of the range up +1.86%. The RSP set a high and settled up +1.42% in the top of the range. NVDA ripped into record highs and closed up +5.29% on the top of the week’s range. Bitcoin rallied sharply and closed up +8.82% on the top end of the range at a record high weekly close. Support is 112/110 and pivotal at 98.7. McClellan Oscillators are supporting the record highs in the Dow. The Yield Curve expanded slightly, closing at +0.545%. The 10YR yield declined, closing at 4.121%. Truflation jumped to 2.25%. Corporate bond spreads are at a 27-year low.
10YR-2YR Yield Curve Weekly

 VIX Weekly Candles
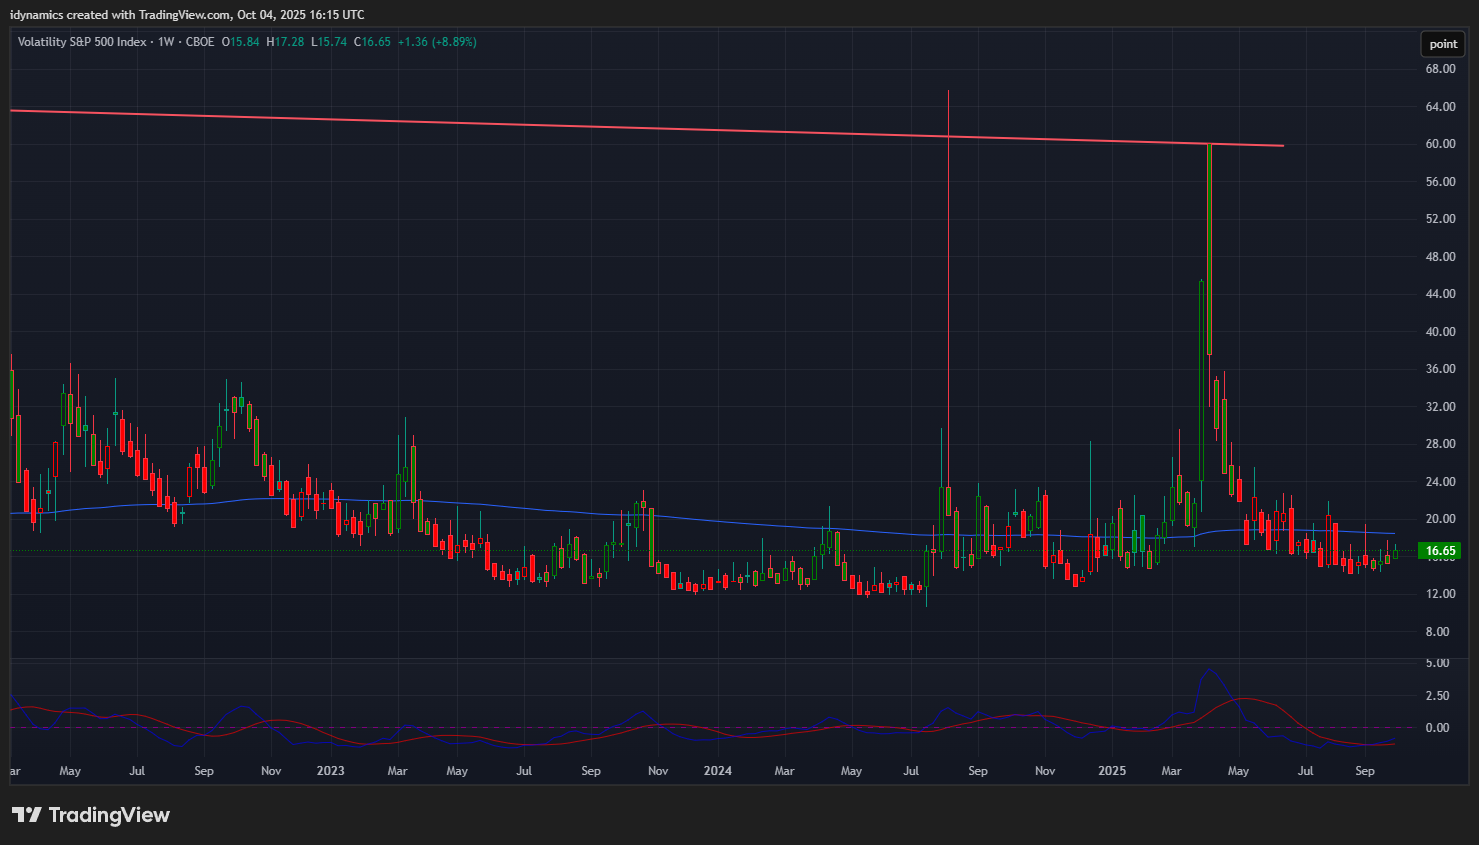
The VIX traded a tight inside week’s range and closed in the middle, up +8.89%. The US Dollar traded an inside week and closed down -0.48%.
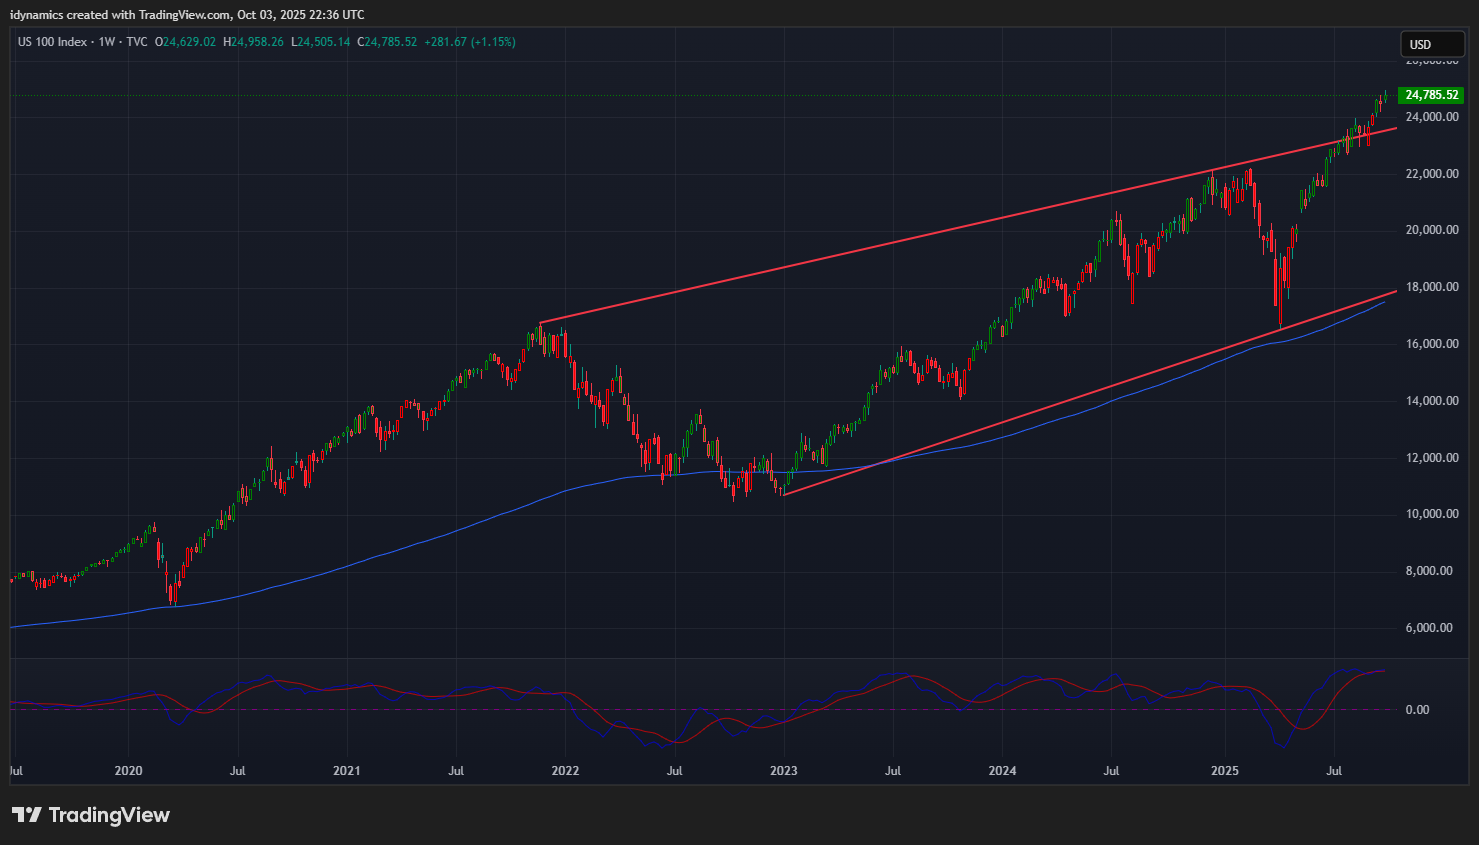
 Nasdaq 100 Weekly Candles
Daily Breadth 
Breadth was flat on the week. Sentiment now reads fear.
CNN Fear & Greed Index
 AAII Investor Sentiment Survey
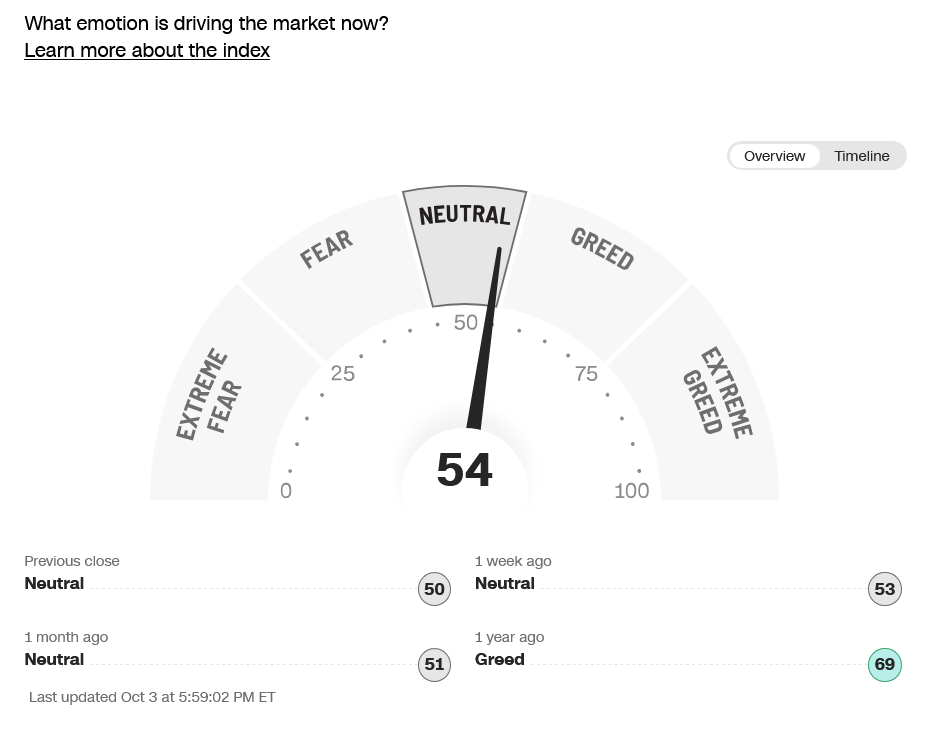
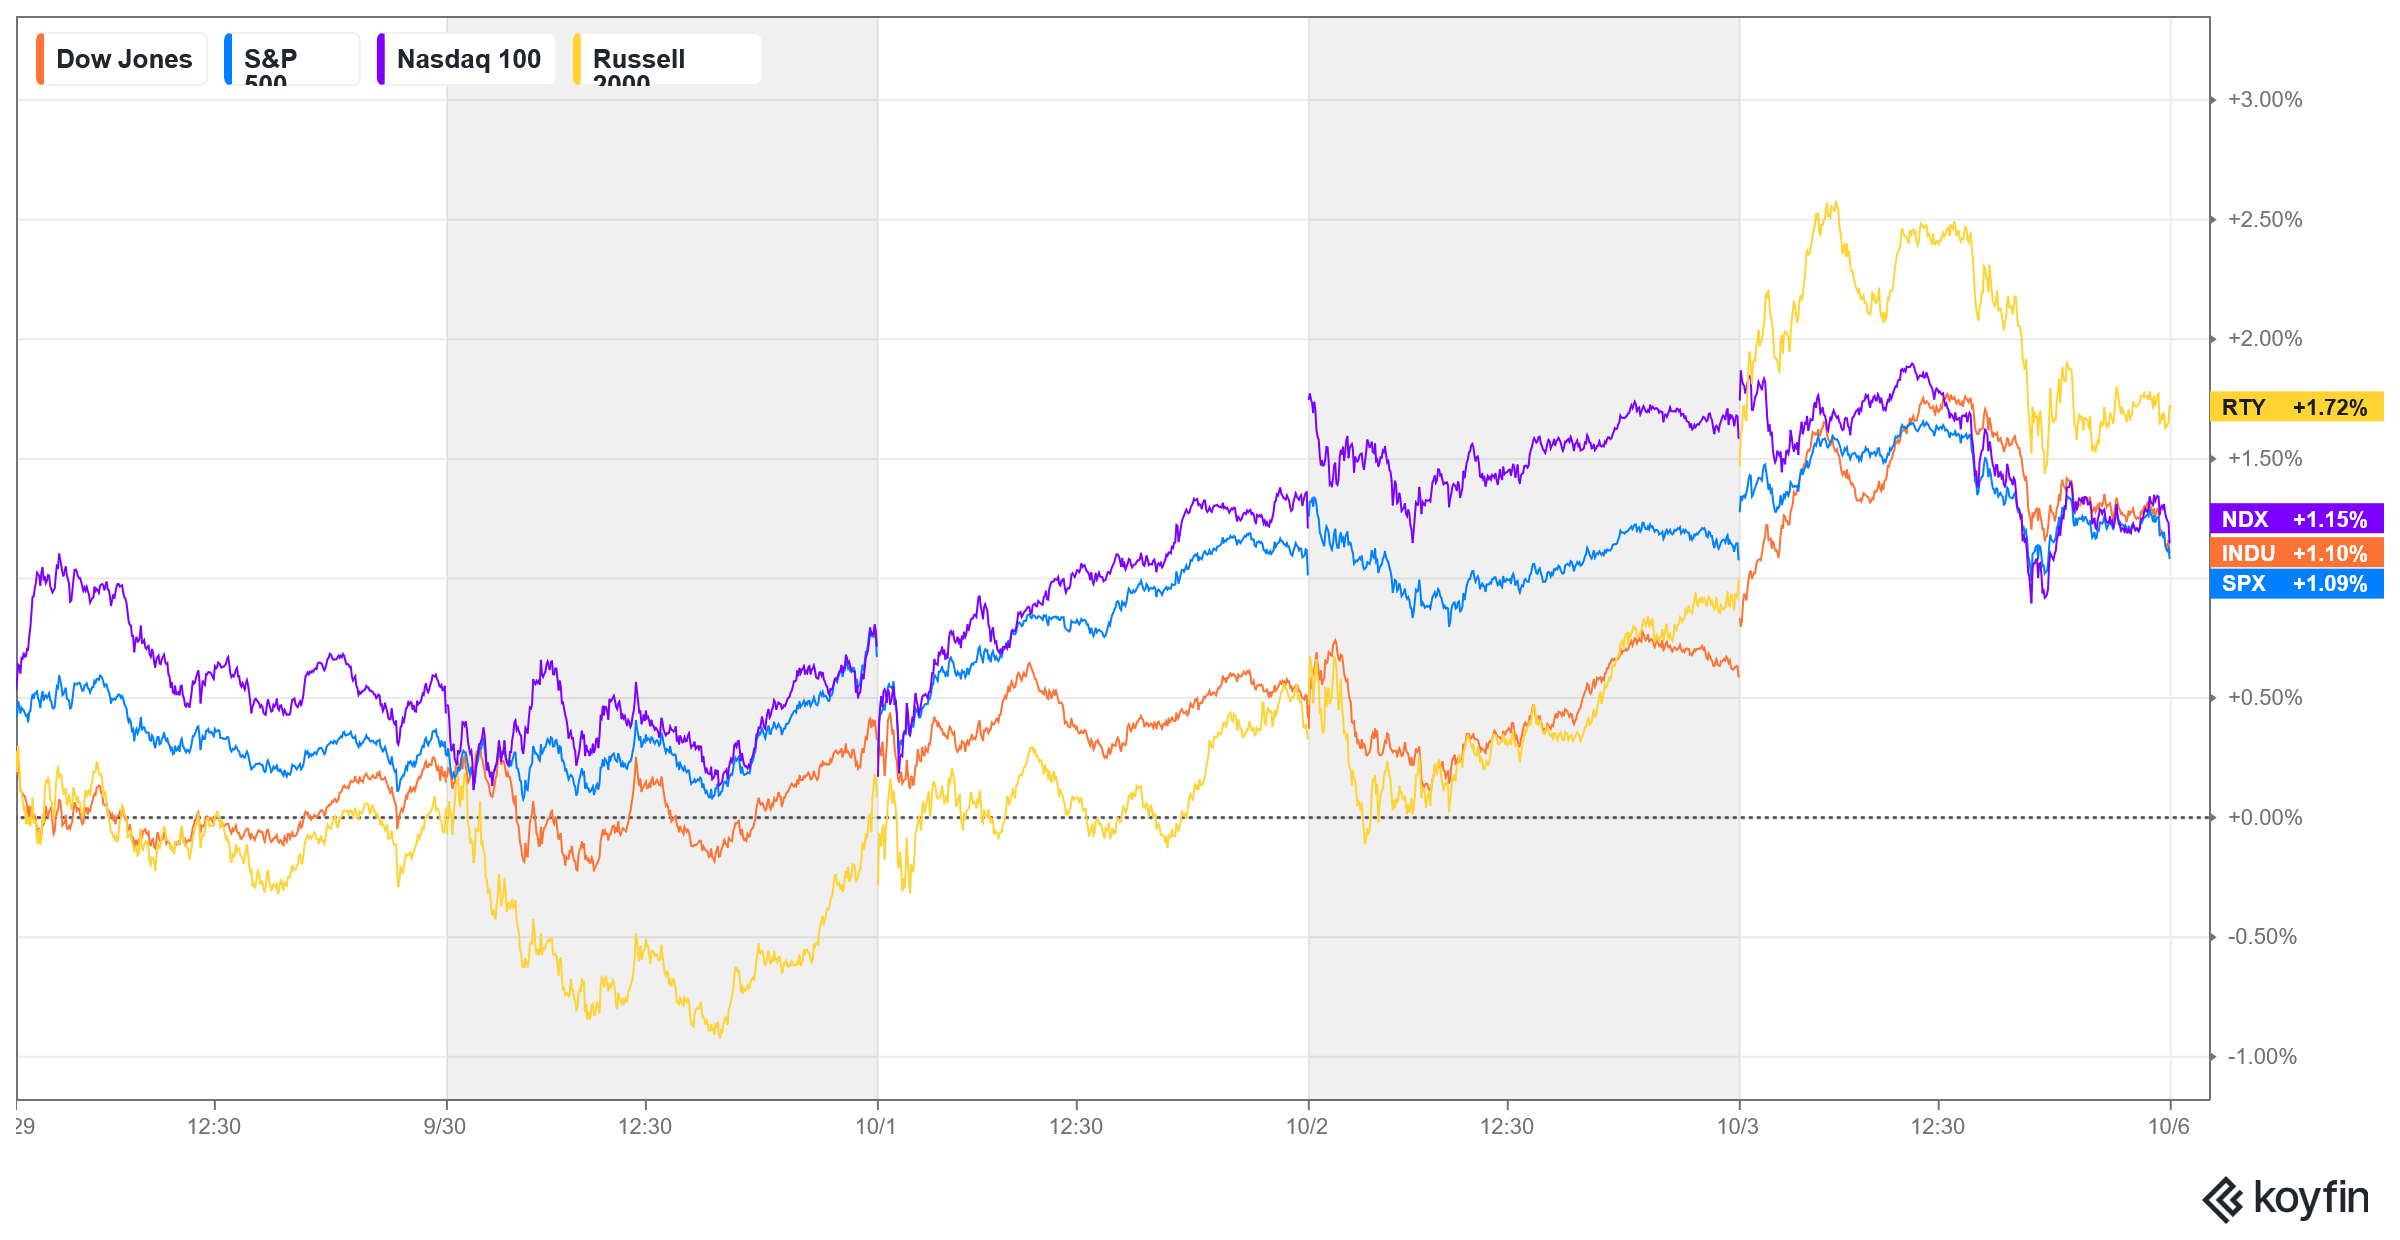
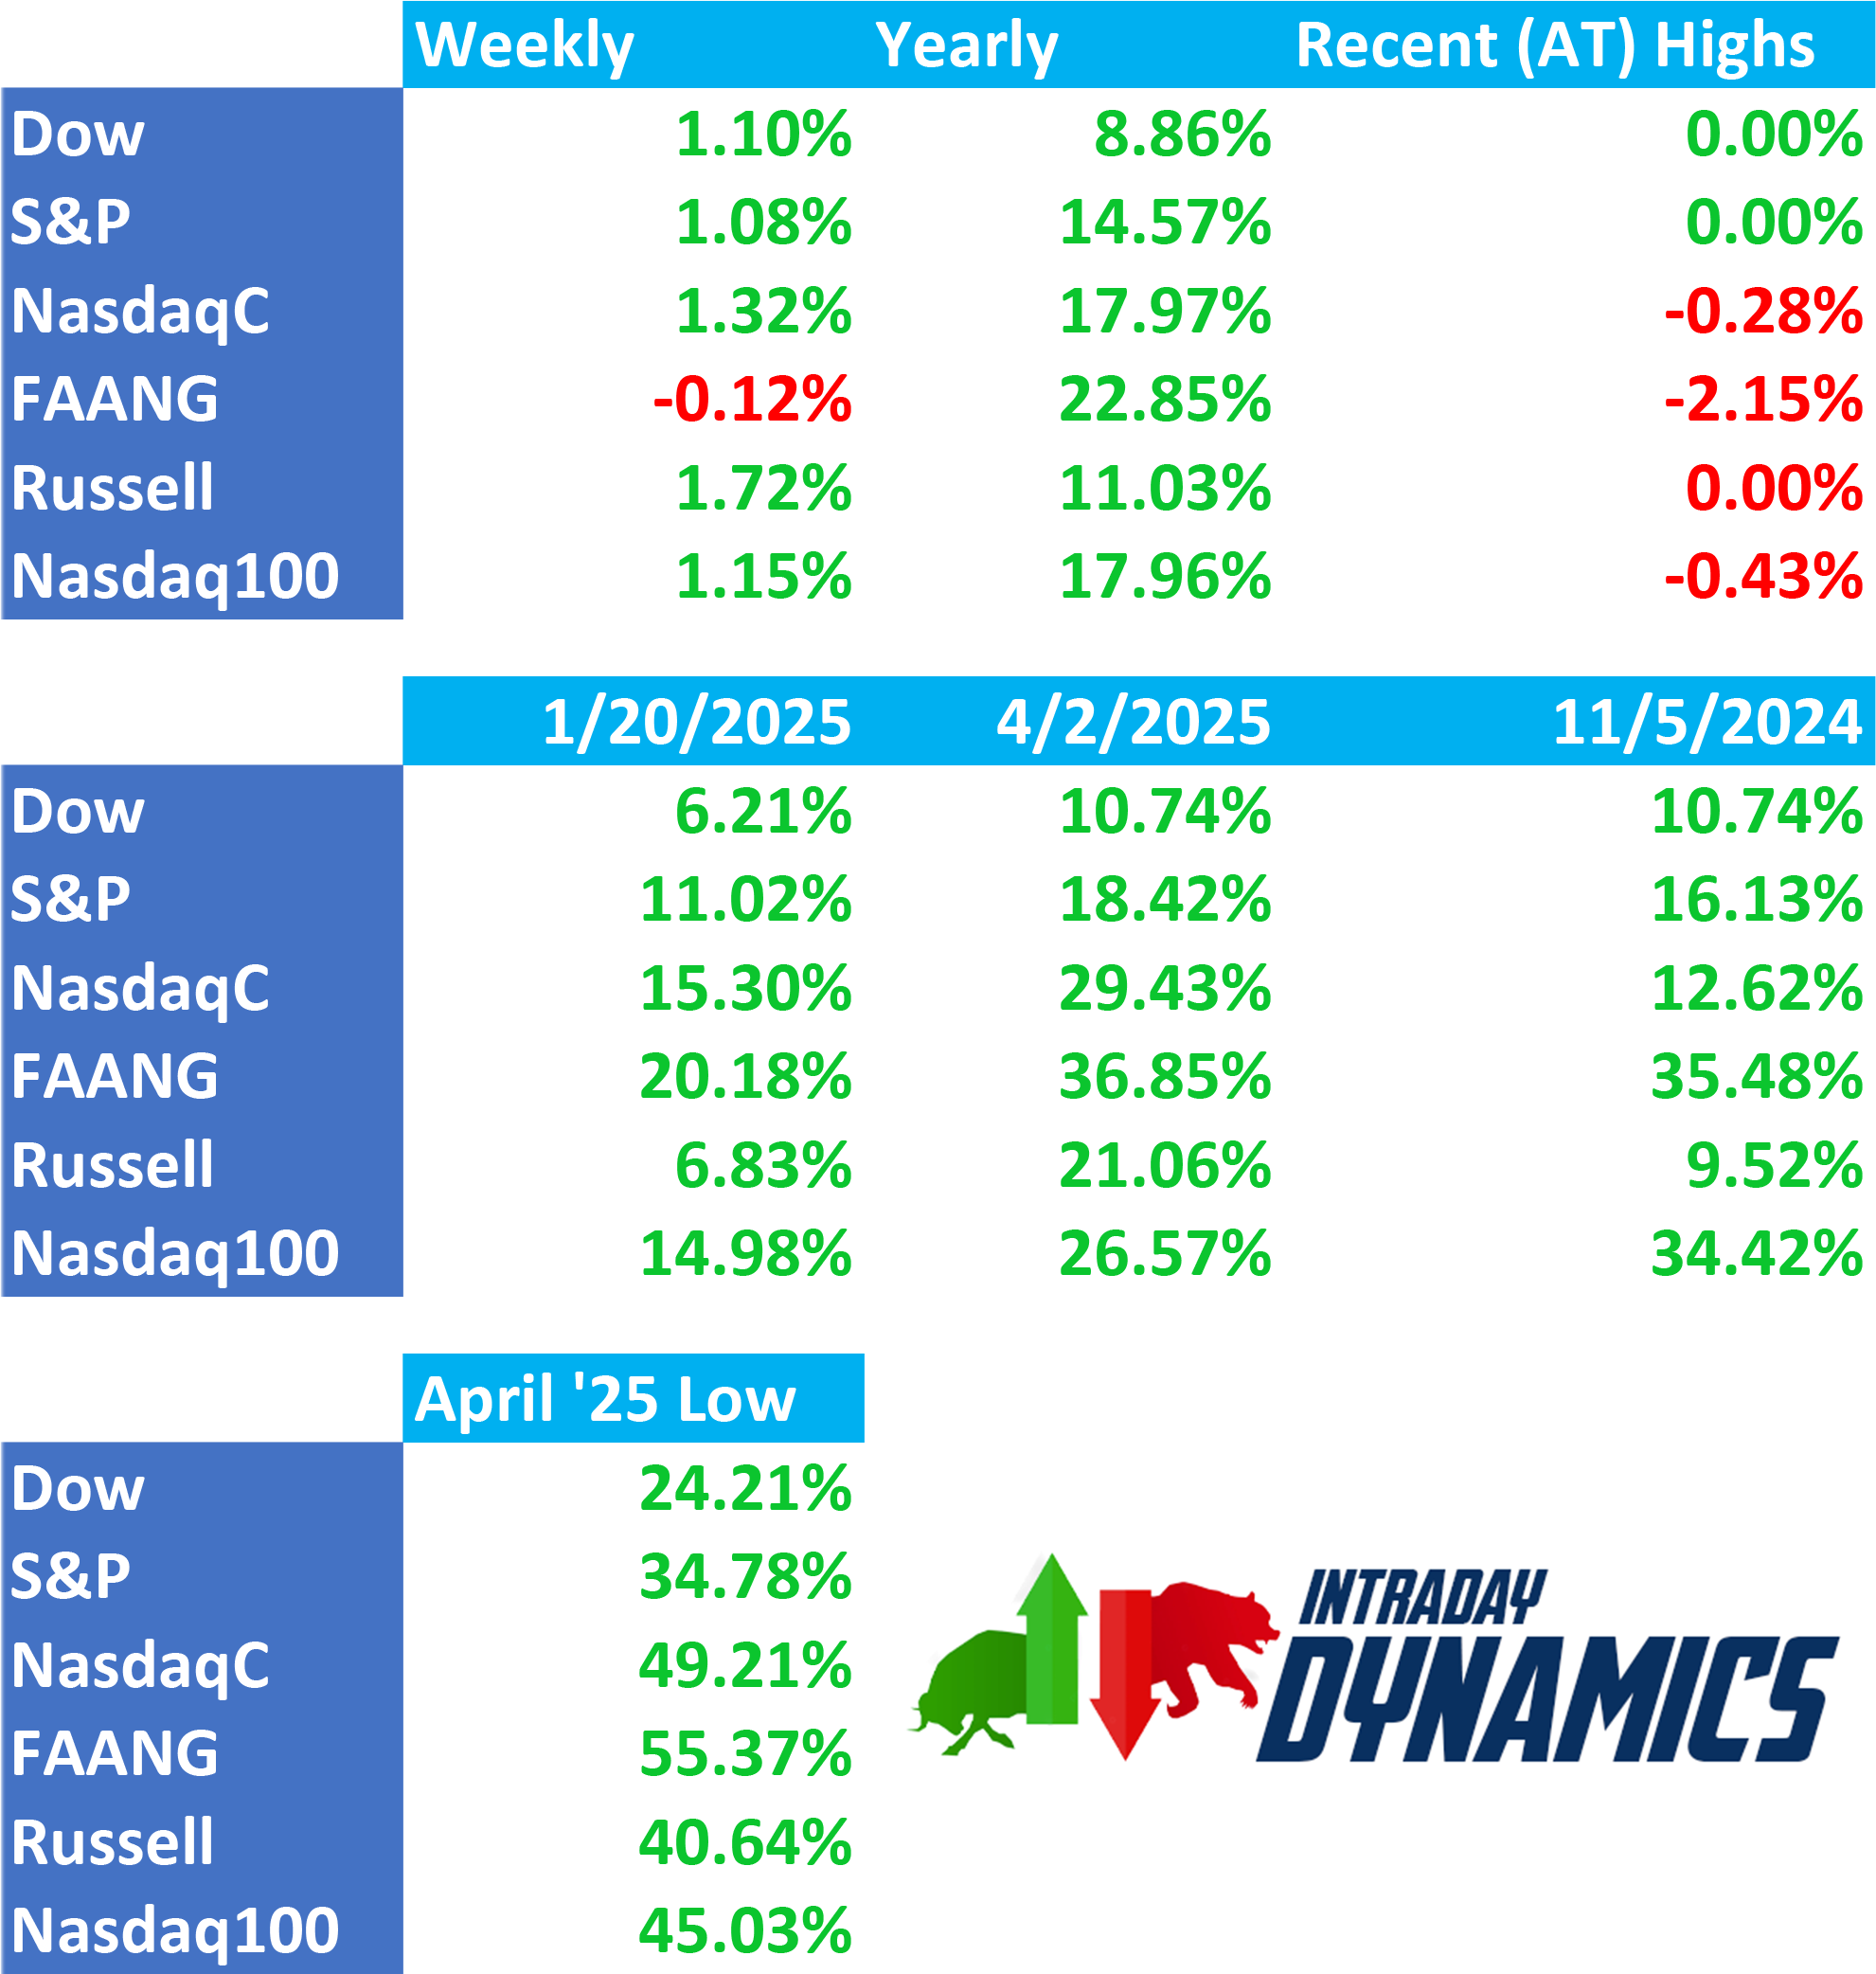
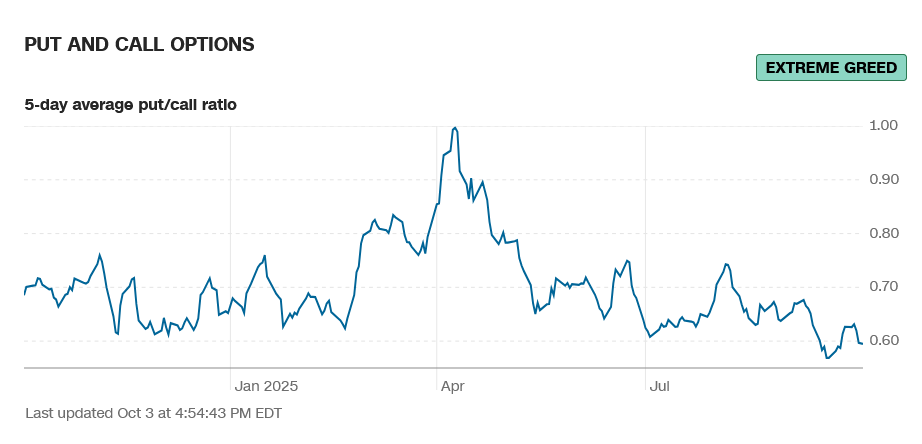
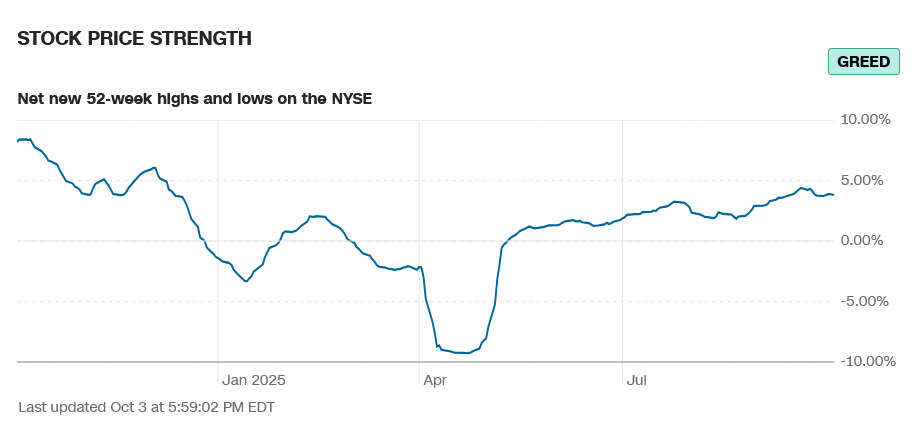
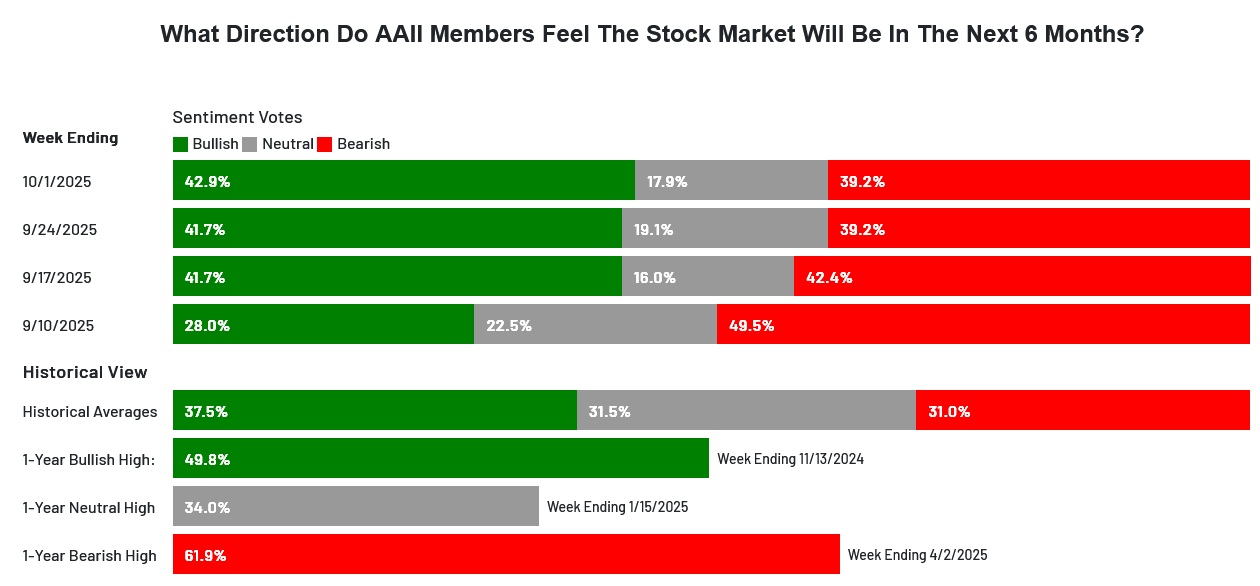 The CNN Fear and Greed Index is 54 and reads neutral. Breadth was flat on the week and reads fear. Latest AAII Sentiment Survey: Optimism Rises . The Dow A/D moved to a record high reading at 6992. The VIX traded a tight inside week’s range and closed in the middle, up +8.89%. The Put/Call closed at 0.60 and reads extreme greed. The 52-week, A/D moved to +3.80% and reads greed. The Dow closed the week up +1.10%, closing in the top of the week’s range at a record high. The S&P traded record highs and settled up +1.08% in the upper end of the range. The Nasdaq Composite was up +1.32% and the Nasdaq 100 was up +1.15% both at record highs. The NYSE FANG closed down -0.12% in the lower half of a tight inside week’s range. The Russell was up +1.42% in the upper half of the range at a record high. The 10-year notes closed higher in the middle of a tight inside week. The yield on the 10YR declined to 4.121%.
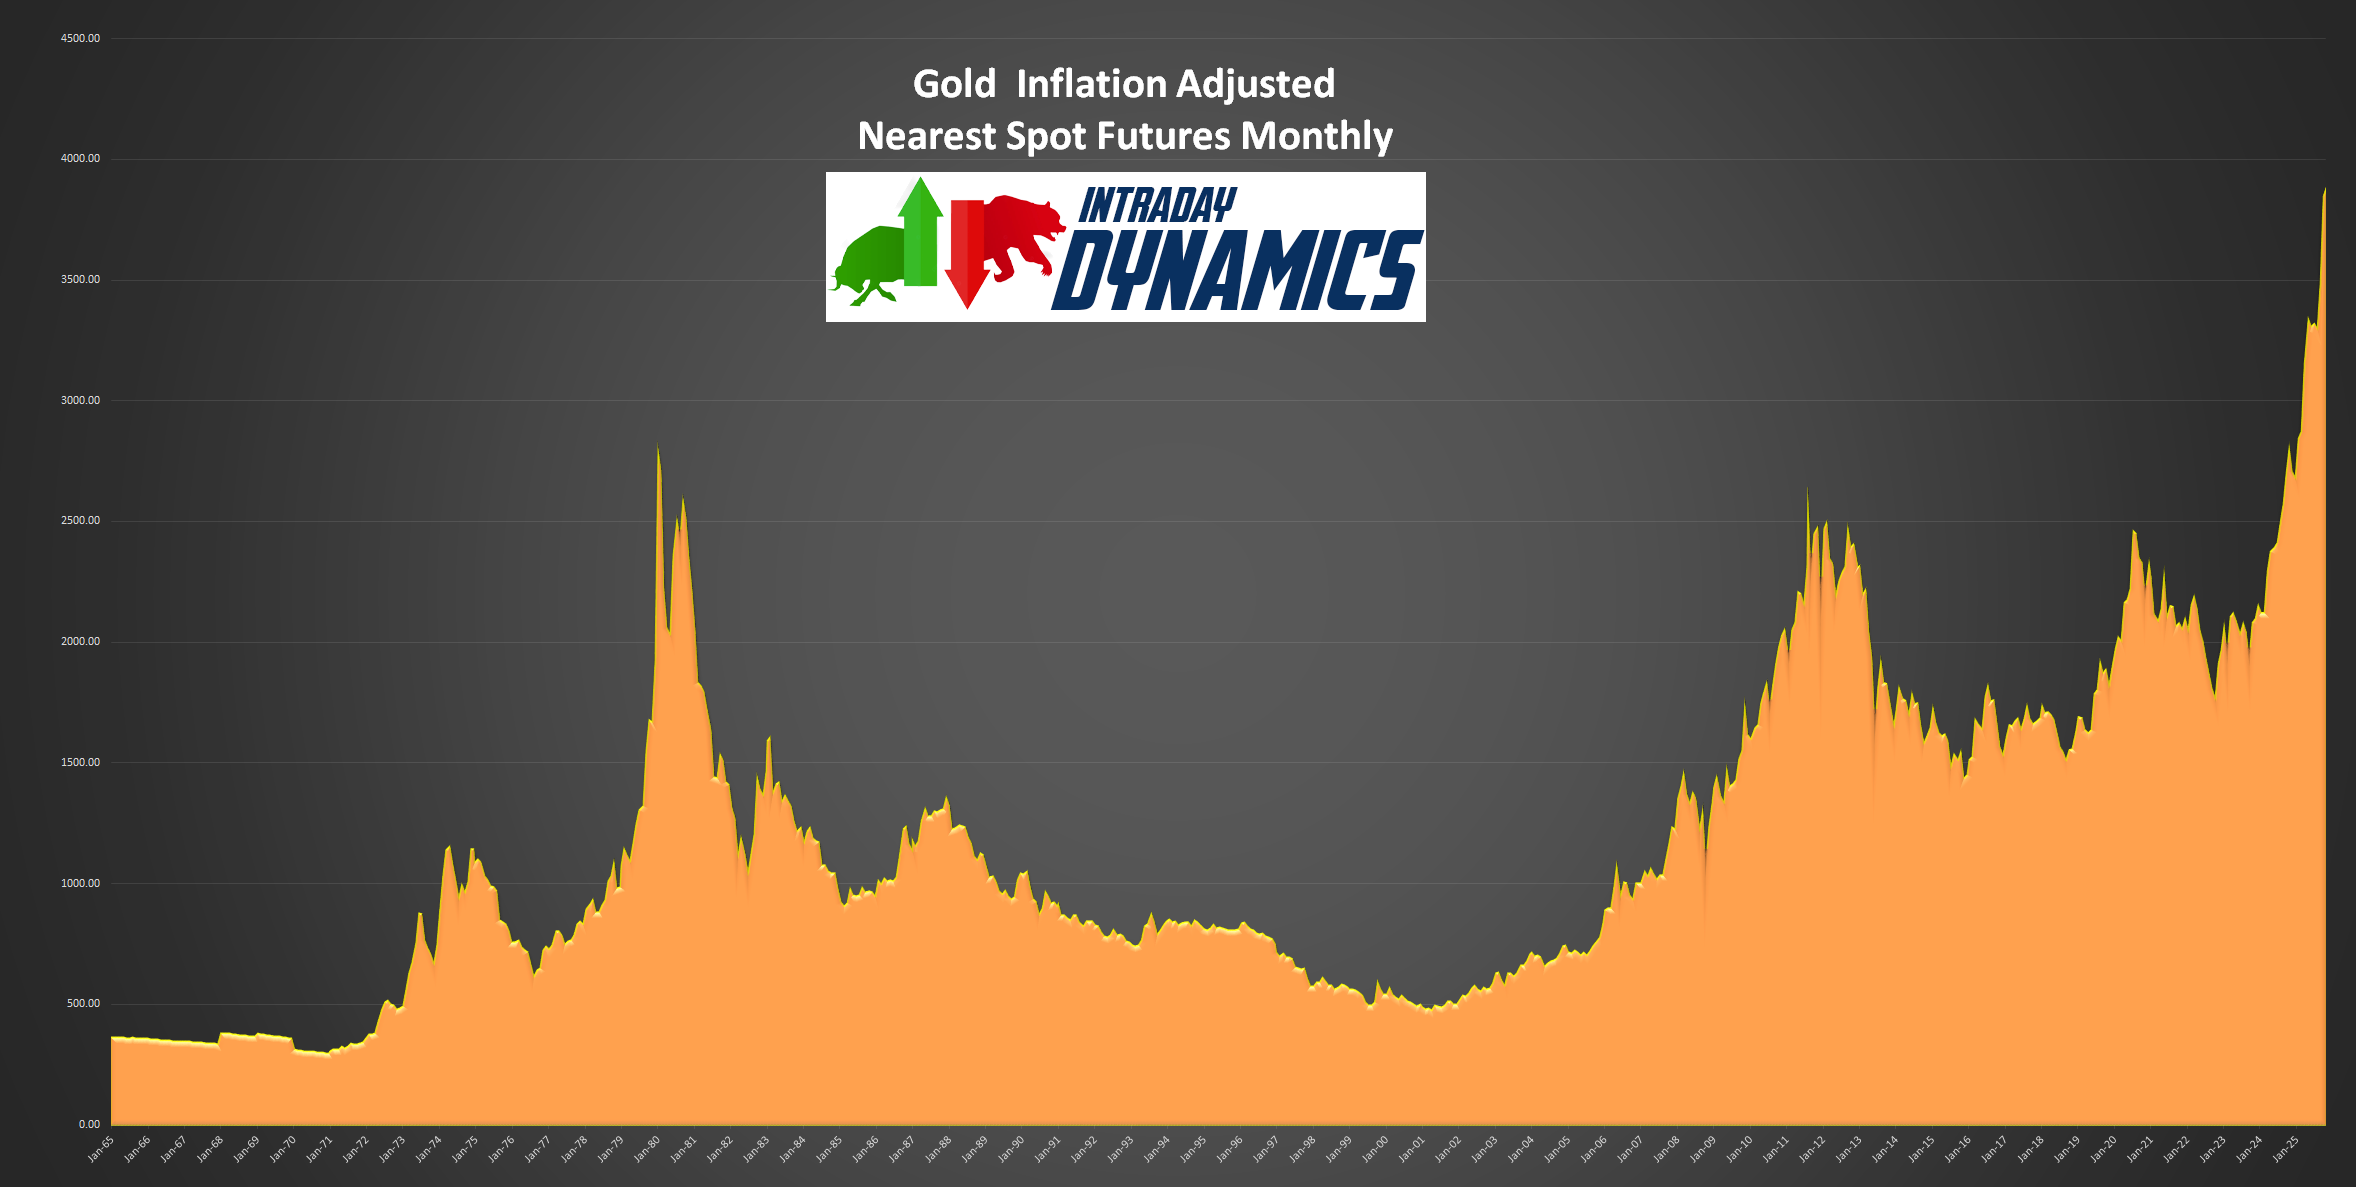
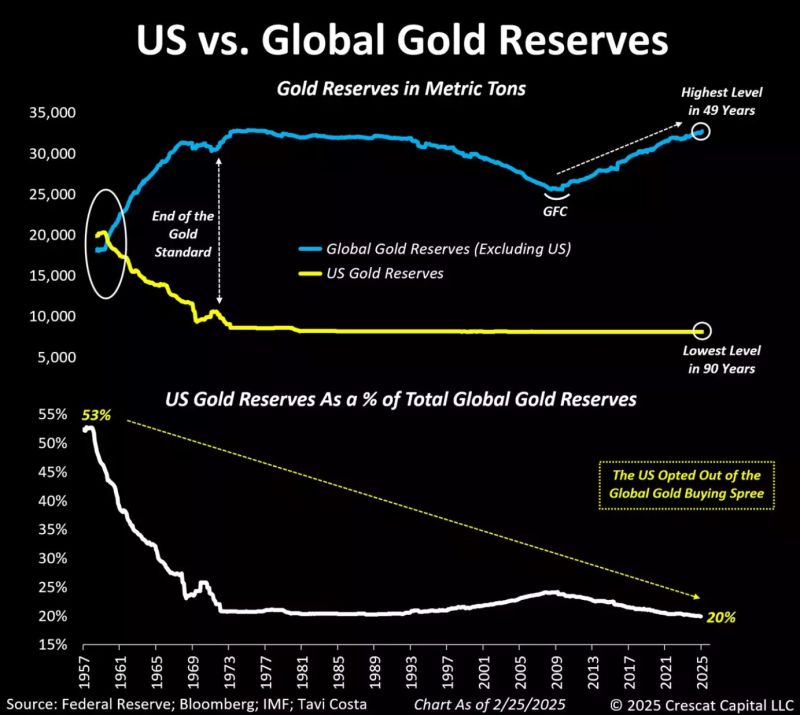 The CRB Index was down -2.13%. Crude oil collapsed to a four month low after setting a six week high the previous week. The XLE followed suit by failing after staging a bull-trap breakout the previous week. Gold rocketed to record highs for the spot futures as it tested the $3900 level. The weekly RSI is frothy for gold. The U.S. is now holding the lowest gold reserves in 90 years. Who has all the gold now? You guessed it, China. Silver exploded above $48 are it test all-time highs The CoT for the S&P 500 shows small speculators entering the market with leveraged funds selling to them. The CFTC S&P 500 Non-Commercial Net Positions ended at -172.549K.
Timing Points
Monday marks minor timing. The next critical cycle date is 10/13/25. 
- 10/06 **
- 10/13 *** X
- 10/22 ***
- 10/28-29 *** X
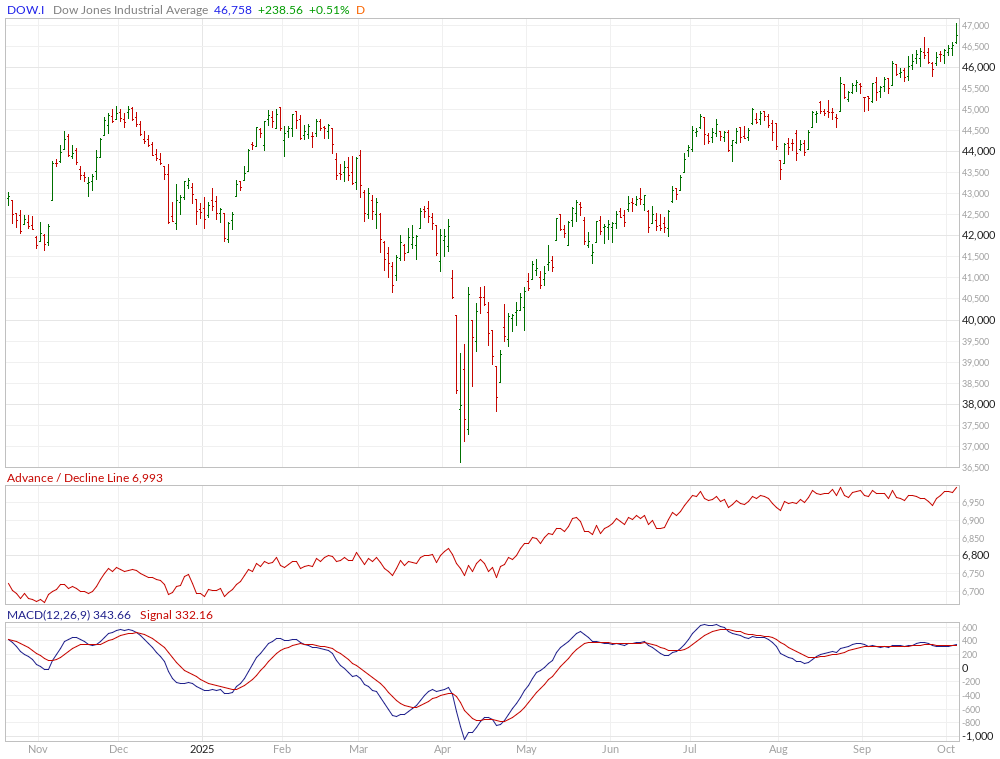
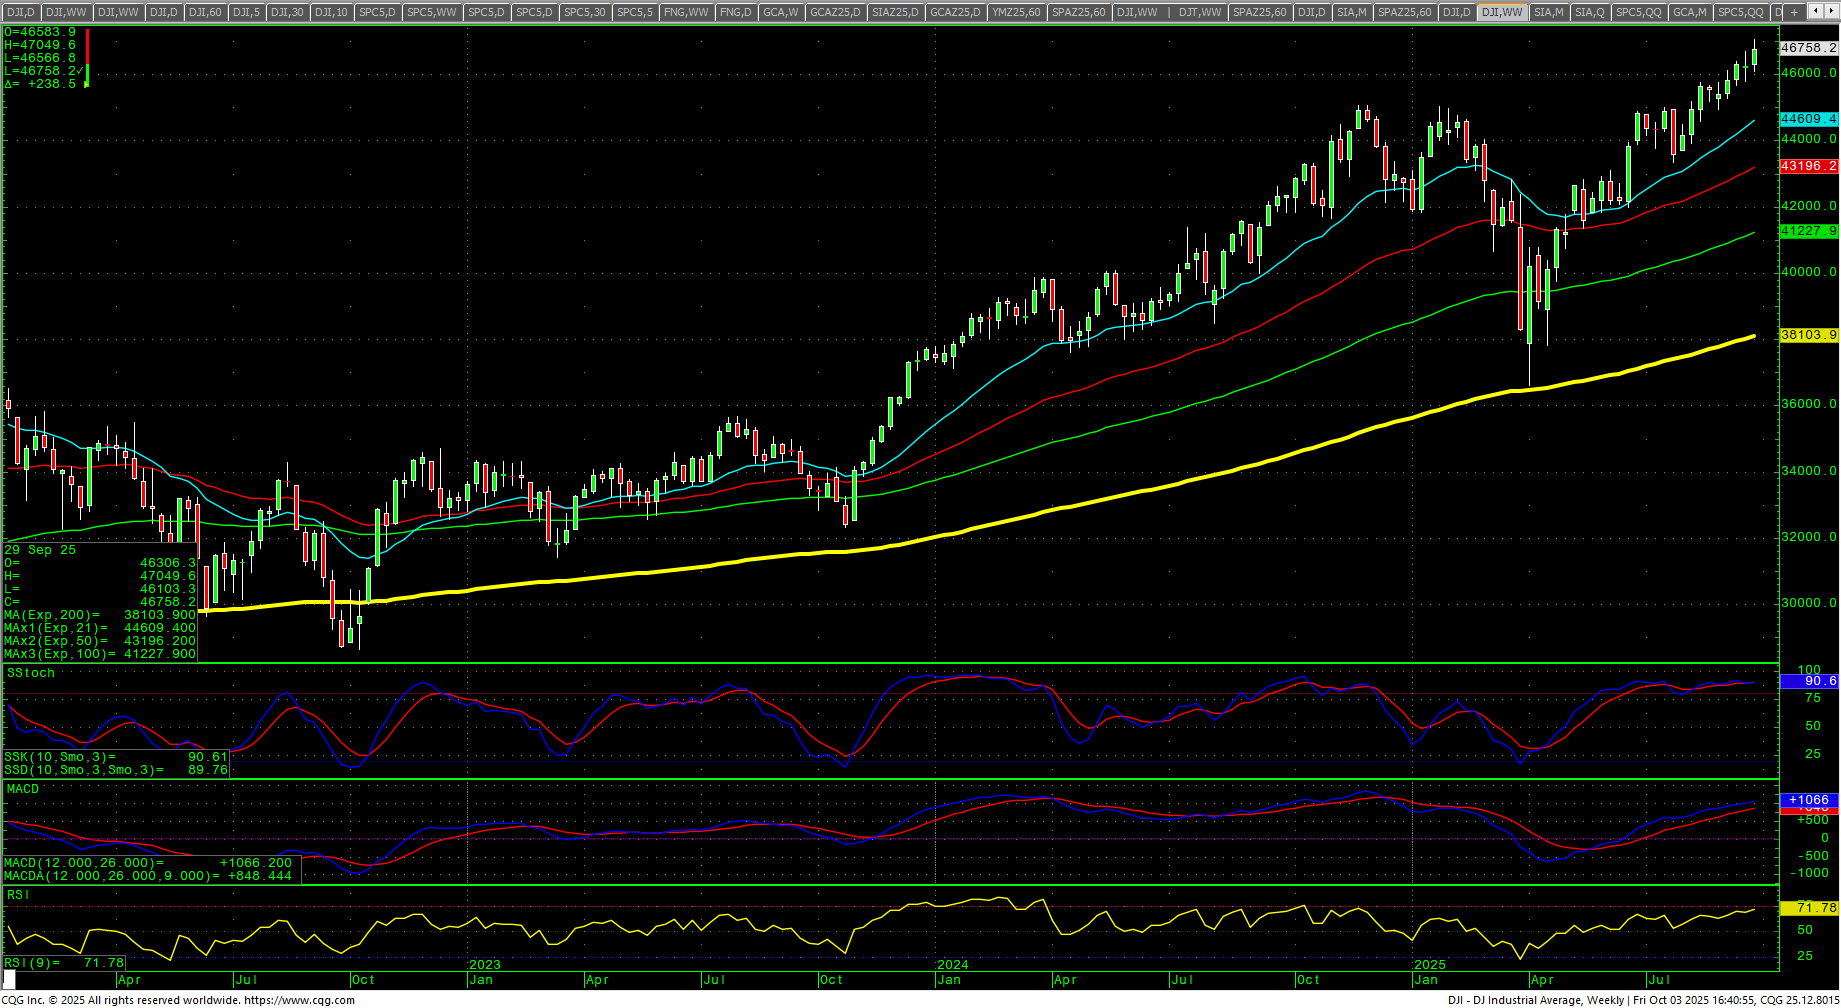
Dow Jones Industrial Average
Dow Jones Industrial Average Daily Candles
 Dow Jones Industrial Average Weekly H-L-C
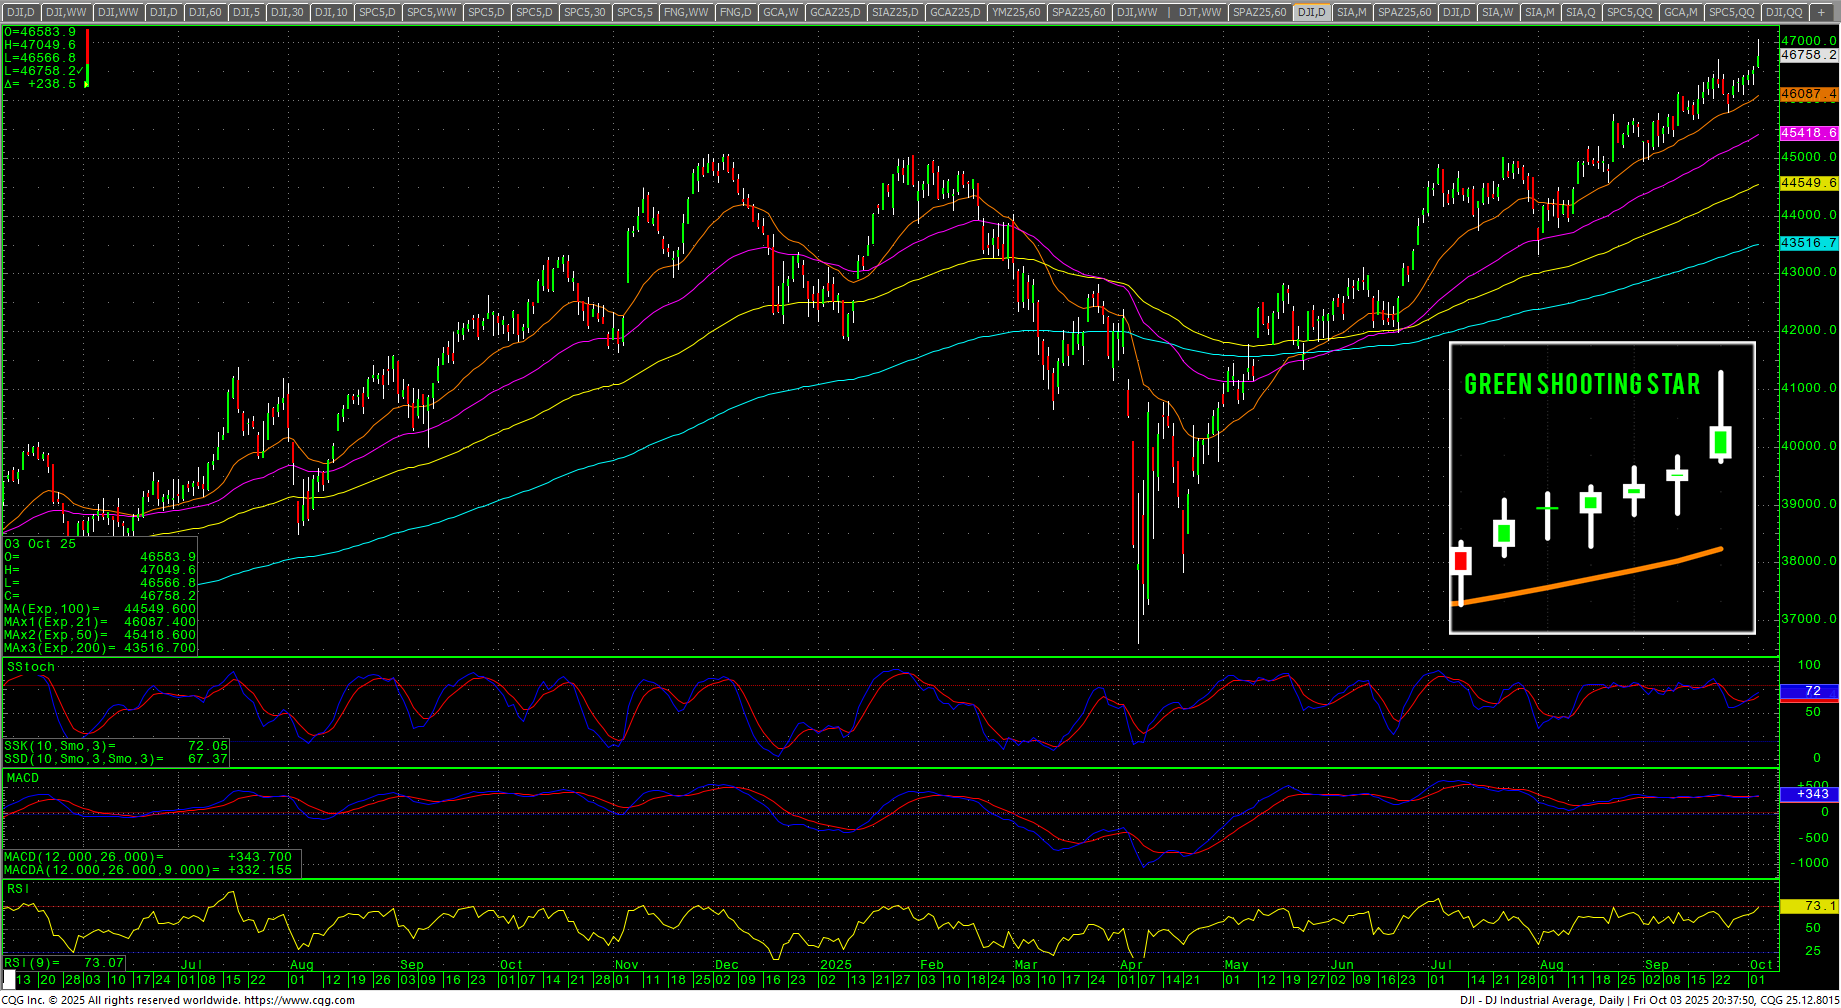
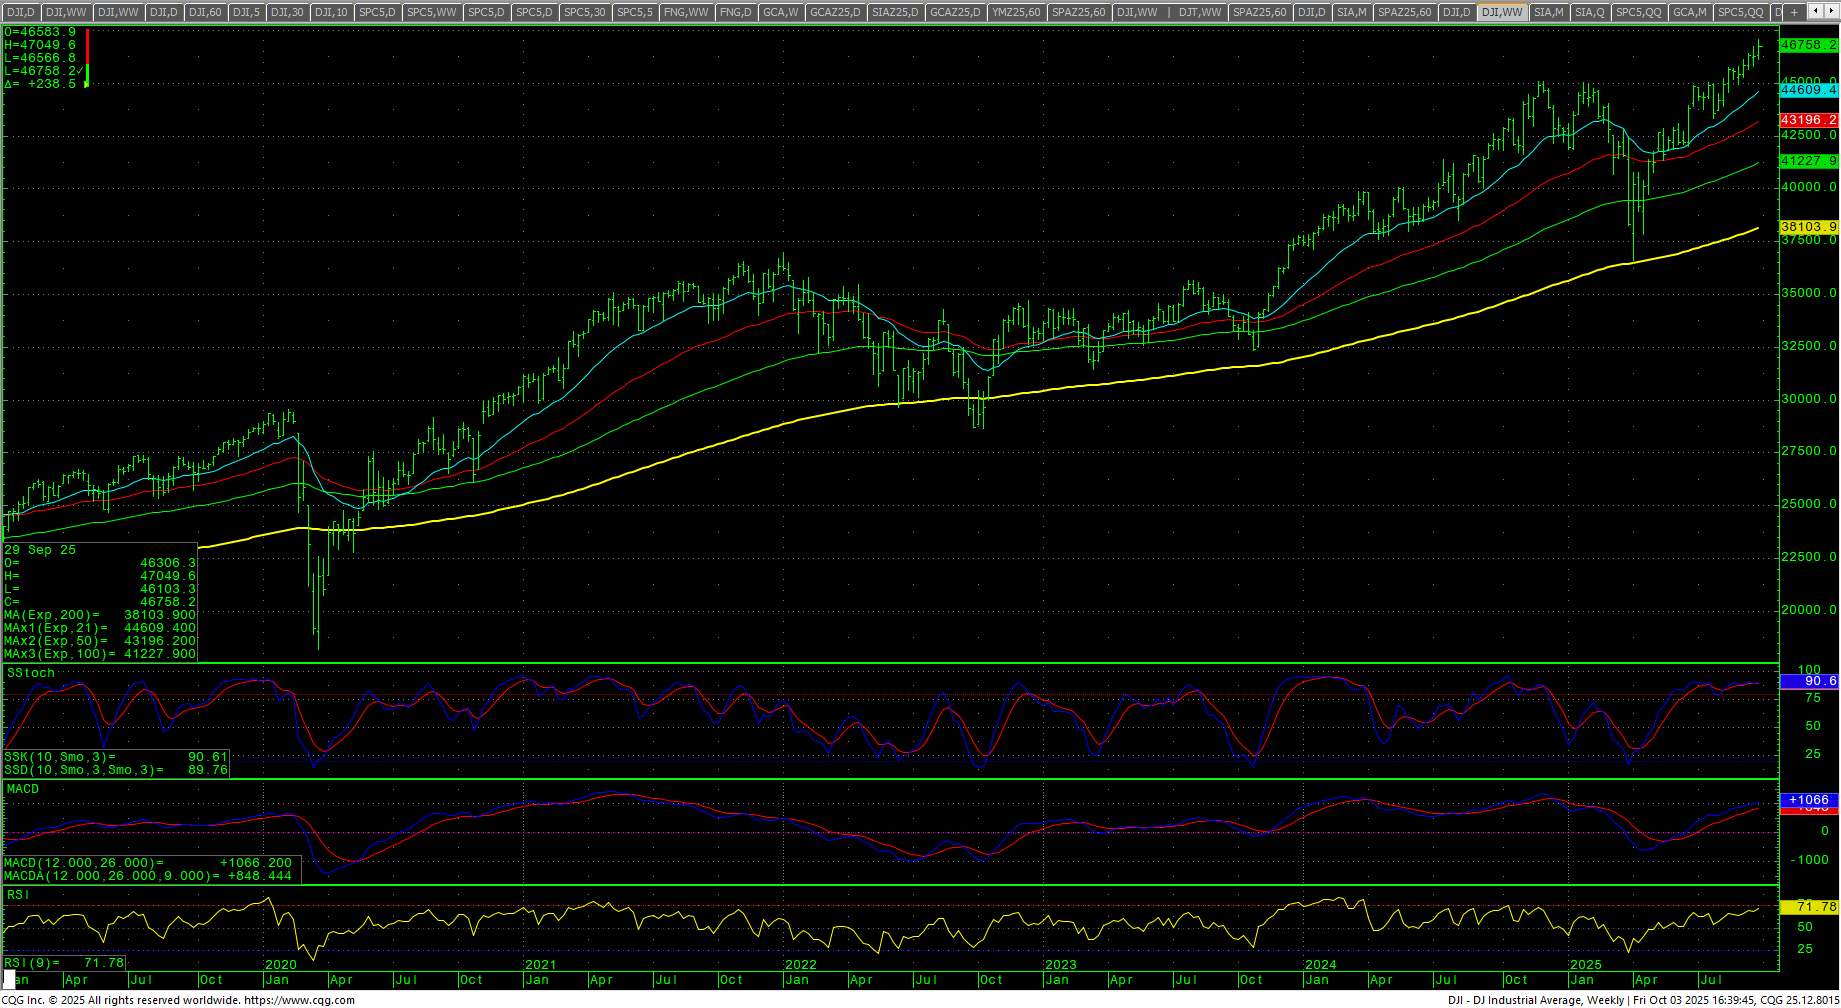 The Dow closed the week up +1.10% on the upper end of the range setting new all-time highs but in the lower half of Friday’s range after hitting 47K…hitting a daily at 46692.80. The daily stochastics and MACD are up with numerous preliminary bearish divergences. The daily RSI is 73.1. The 200-day MA starts the week at 43516.70 and is at record highs. Friday’s candle was a Green Shooting Star, so trading under Friday’s lows at 46566.8 might initiate short-term selling.
Dow Jones Industrial Average Weekly Candles
 Resistance is 46897 and 46933/46955. A drive above 46955 should minimally retest 46998/47005 with resistance at 47070. Closes over 47070. A breakout over 47070 sets up 47142 with counts to 47214. Closes over 47214 should test 47286 with full counts toward critical resistance of 47400/47430. Closes over 47430 will open counts to 47520 and 47610.
Dow Jones Industrial Average Hourly H-L-C
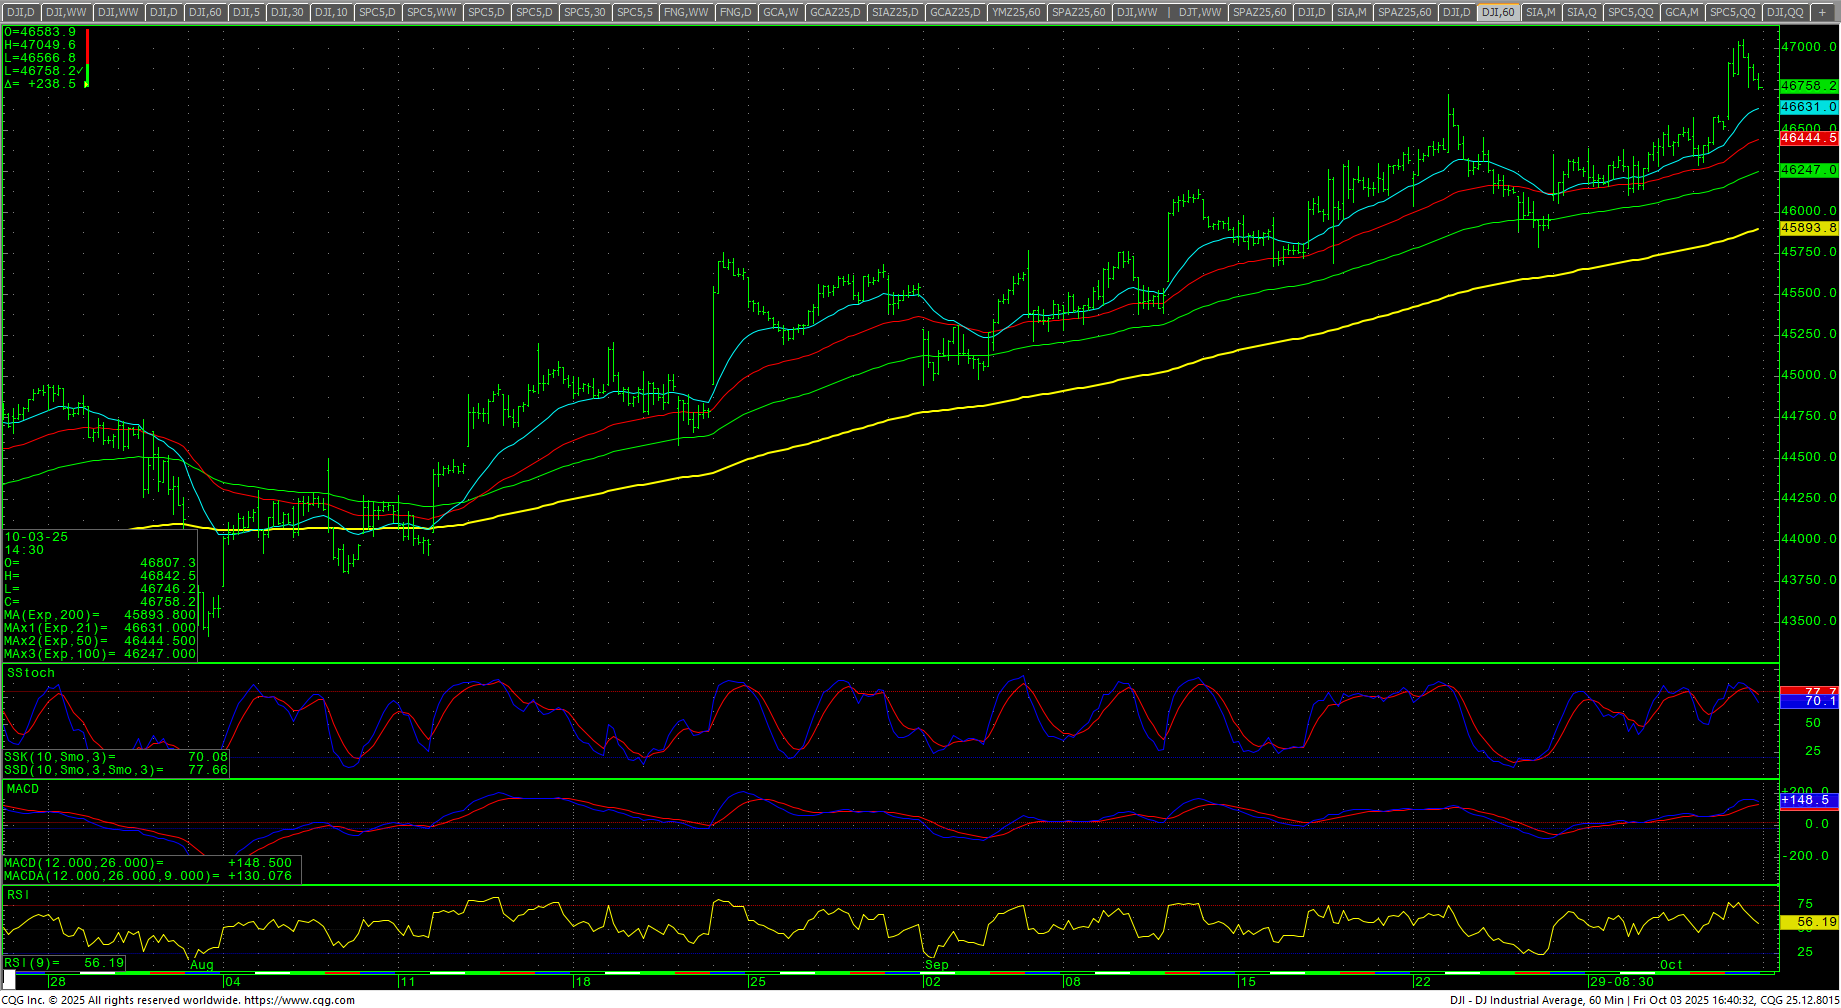 The hourly is overbought on Friday’s close with support just below at 46723. Support is 46566.8 and 46521. Under 46521 should test 46358 with counts to 46195/46174. Closes under 46174 are bearish and opens counts to 45632. A breakdown under 45632 sets up 45195 with counts to critical short-term support at 44757/44754 with support at 44976.
| Resistance | Support |
|
|
S&P 500 Cash Index: SPX
S&P 500 Index Weekly H-L-C
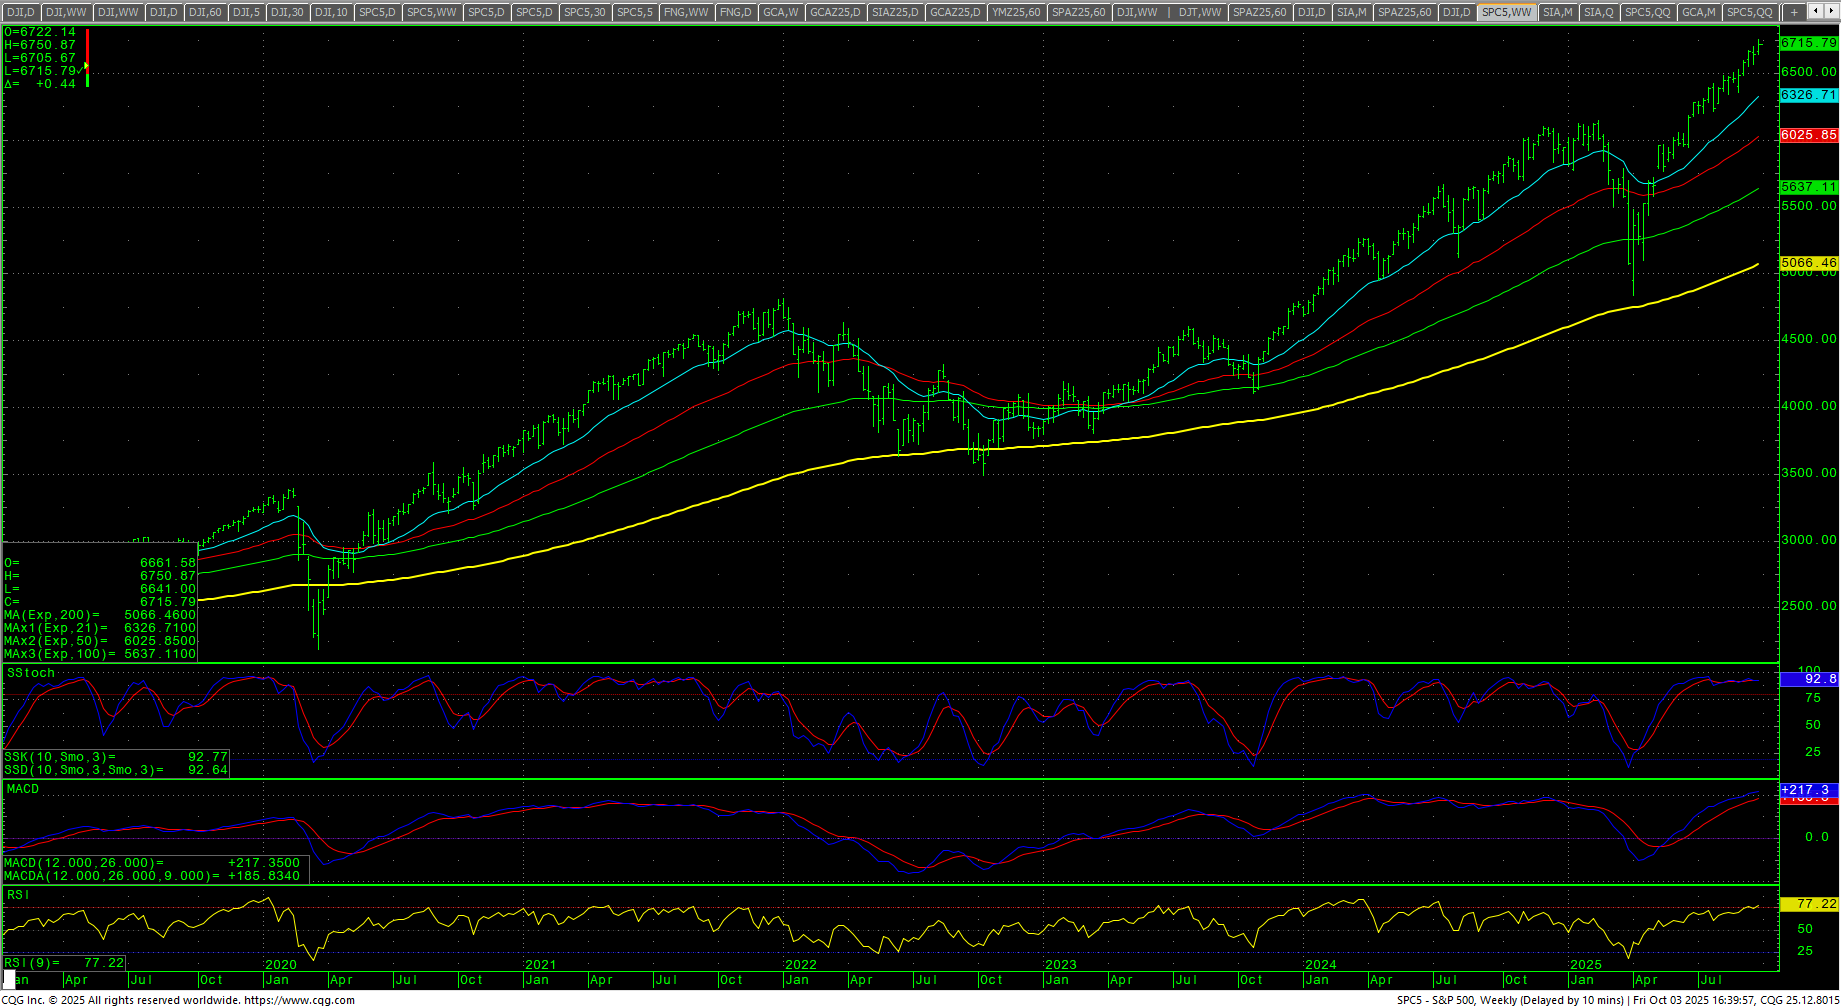 The S&P continued its run to new highs and the rally from the 2022 low now ranks as one of the largest and fastest rallies in history…in the top ten all time. The daily is up with multiple bearish divergences. Prices ended flat on Friday, nearly setting a reversal. The weekly is up with a preliminary bearish divergence. The daily RSI is 71.66. The hourly is turning down from overbought conditions in Friday’s trade with a significant bearish divergence. The 200-day MA is 6094.45 and at record highs. The SPY set an ATH and is breaking out above key trendlines.
SPY Weekly Candles
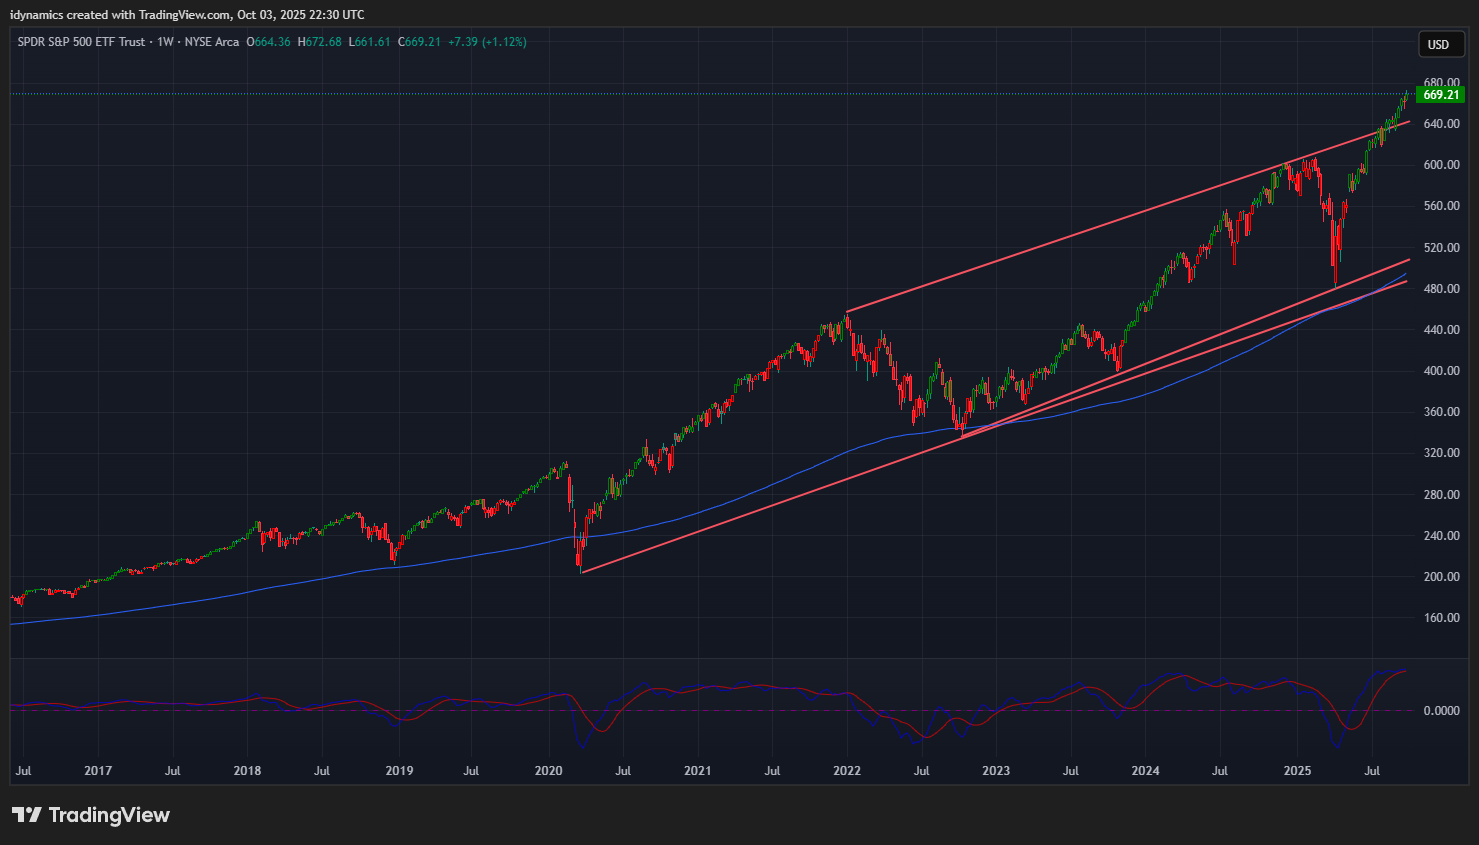 Resistance is 6733/6735. Rallies over 6735 should test the intraday high at 6750/6751 with resistance at 6764. A move above 6764 should test 6800. Closes over 6800 can carry to 6872 and 6908. Closes over 6908 have counts to 6944 and 6980 through 7016. A close over 7016 offers counts to 7088, 7160 and 7214. Closes over 7214 setup a drive to 7250 and 7286 while opening counts as high as 7448.
S&P 500 Index Hourly H-L-C
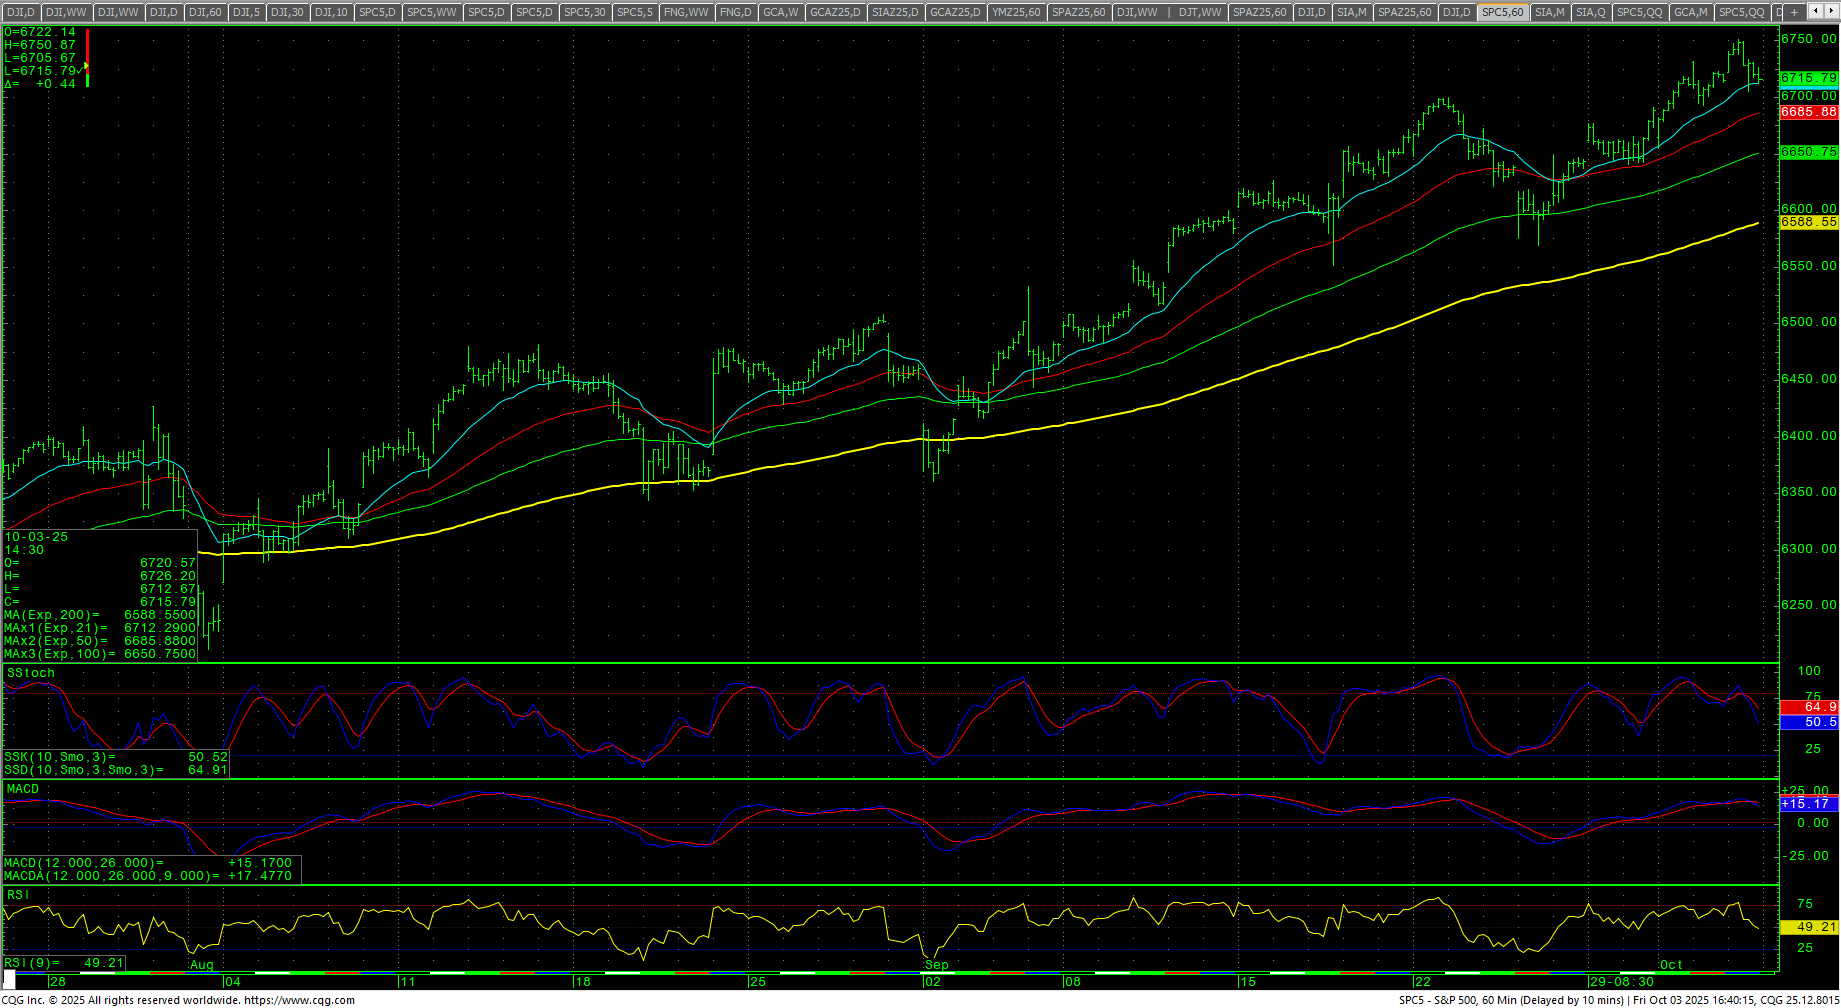 Support is 6693 and 6658. A breakdown under 6658 should test 6629 with counts to 6602/6600. Closes under 6600 should test 6555 with counts to 6509/6506. Closes under 6506 open counts to key support at 6443, 6421/6416 through 6488/6387. A breakdown under 6387 will open counts to 6101/5999 with critical hourly support at 6212/6201. Daily closes under 5999 should minimally test 5792 and 5675/5754 with counts to 5566/5563.
| Resistance | Support |
|
|
Charts courtesy of CQG, Inc., CNN, Koyfin, Trading View and AAII