
TECHNICAL ANALYSIS (by Intraday Dynamics)
Major Indices Week of October 24, 2025
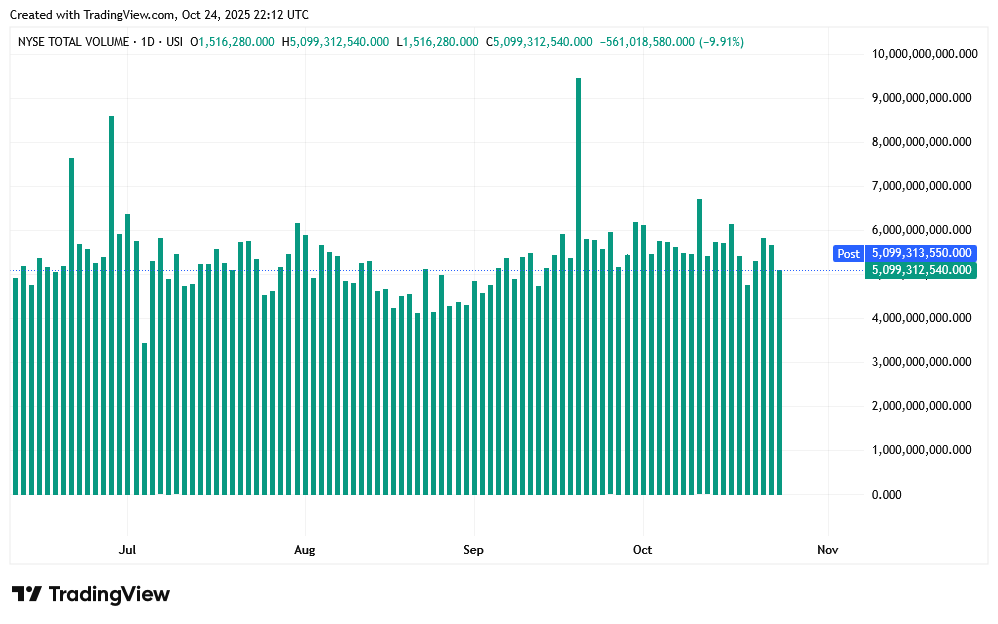
 NYSE Volume
 As goes tech, so goes the market. Stocks gapped into record highs on Friday and closed into record high territory for most of the major indexes. As I postulated the past few weeks, a blow off type rally could be in the offing…particularly if prices were able to clear the September cycle timing highs for the FAANG and other key charts. Friday was news driven by delayed CPI readings and talk of China.
“I am going to put out a timing update in November. I believe that we are looking at the bottom of the 9th inning now for stocks and that the end of this move will come in this long window we are in…most likely in the first month or two of 2026. Certainly by the 1st quarter.”
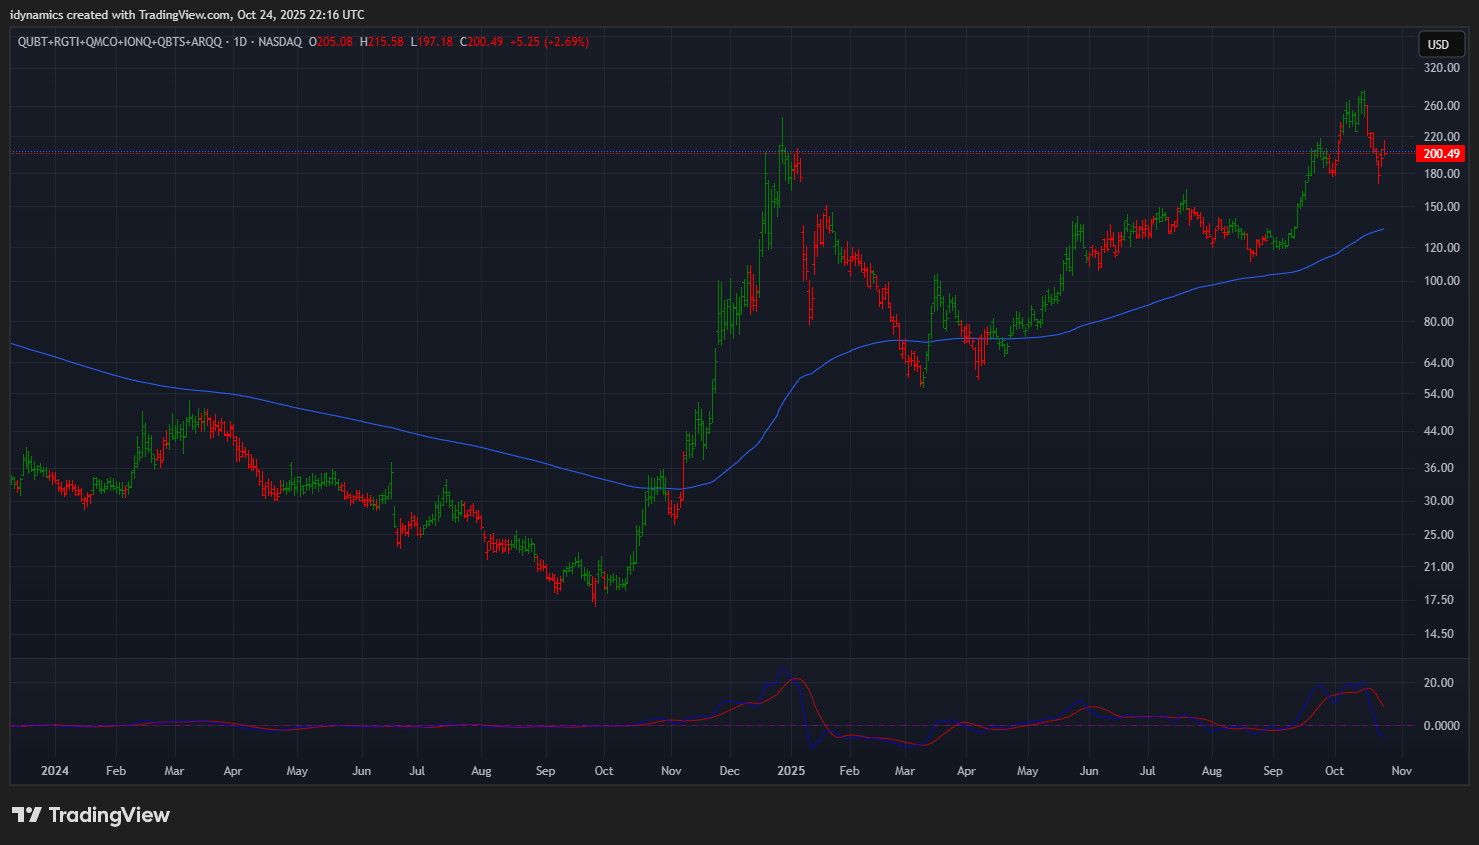
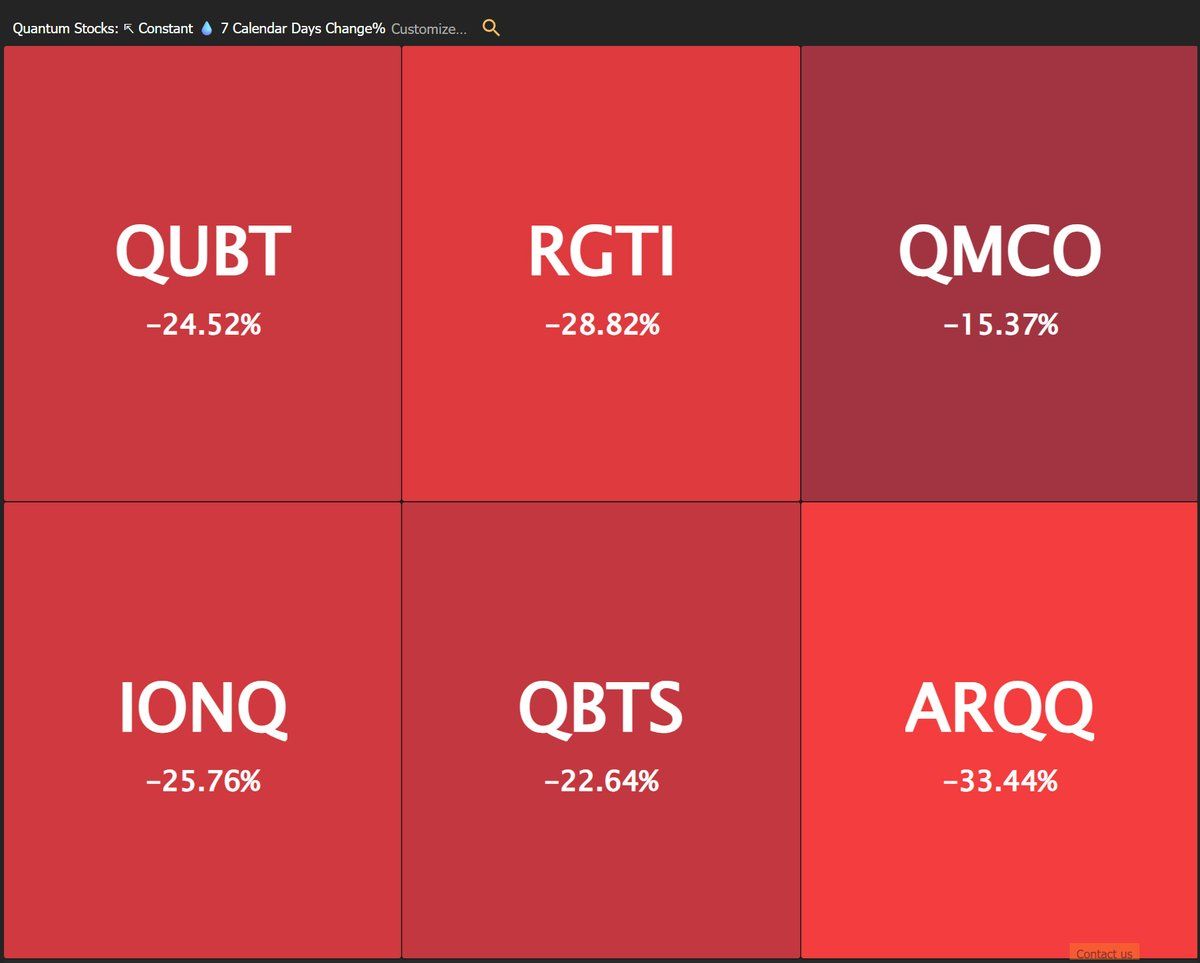
Sentiment remains far too bearish right now with most indicators reading FEAR as the market makes new highs. Prices were hit in the middle of the week with a massive meltdown in Quantum stocks, and that seemed like it might shake the technical outlook. It ended up being another one day move, followed immediately with BTD, buy the dip. Here is a look at the top Quantum stocks that were crushed in Wednesday’s cycle timing.
QUBT+RGTI+QMCO+IONQ+QBTS+ARQQ

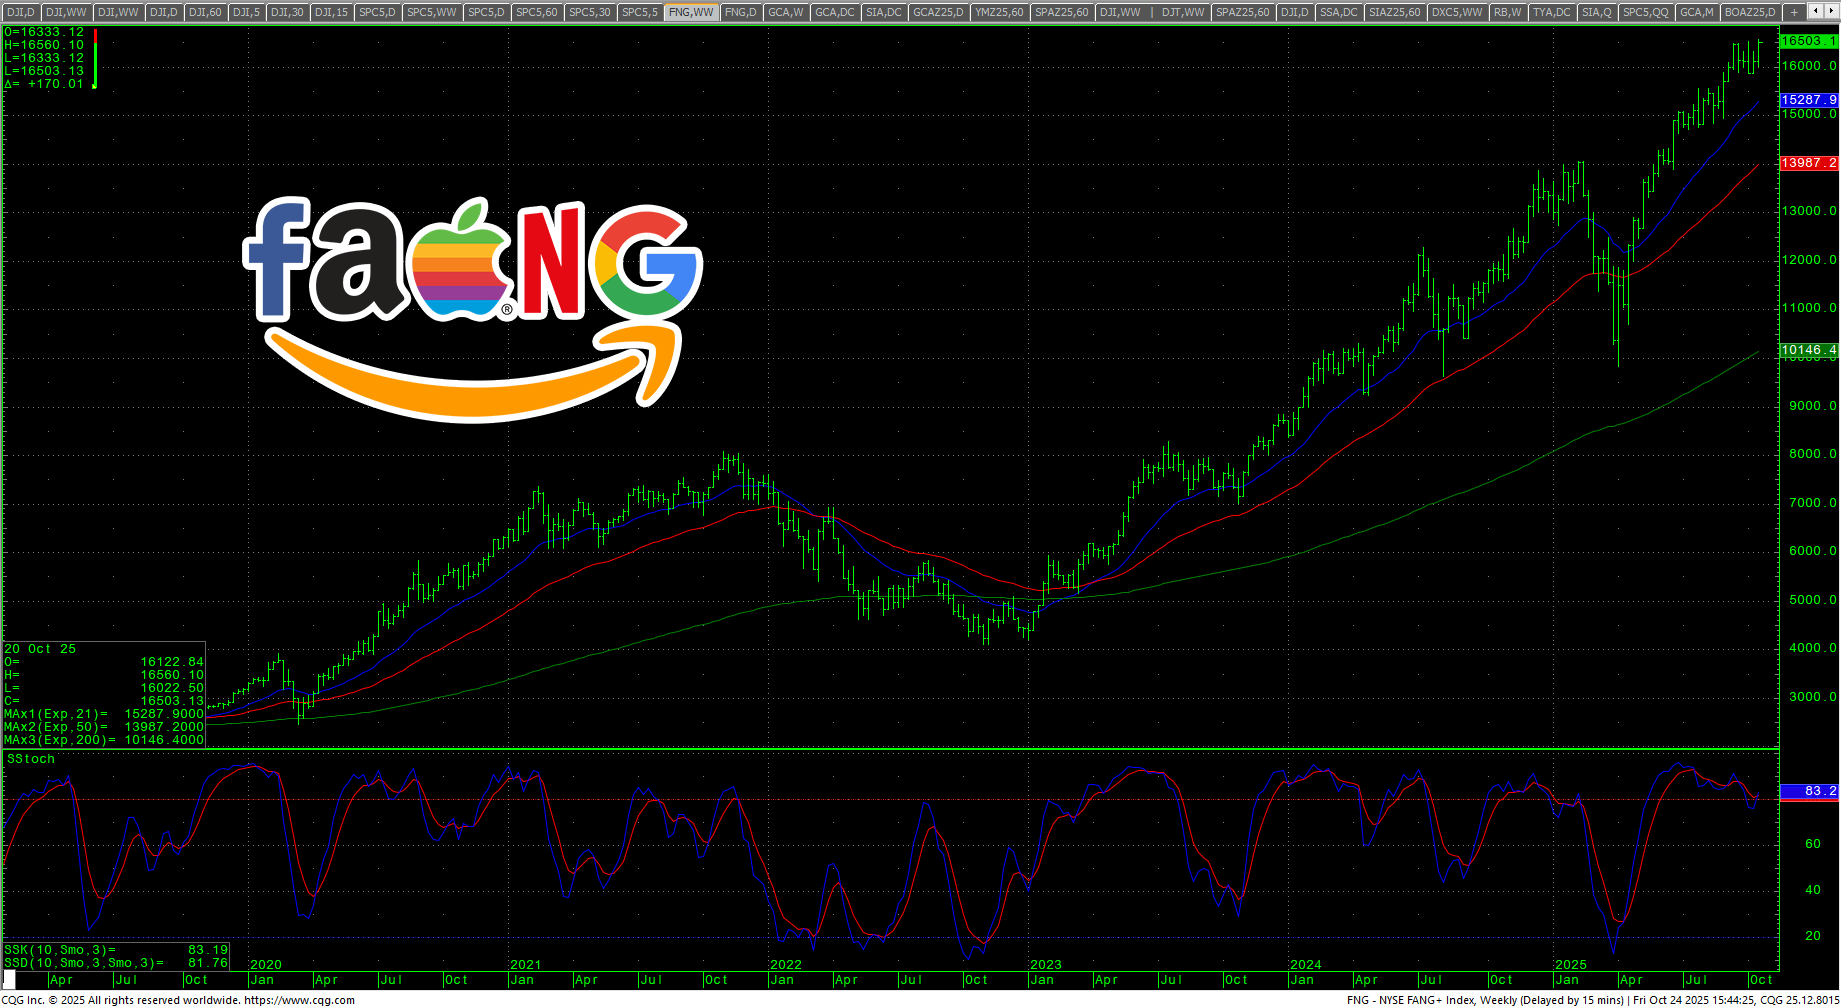
 NYSE FANG Daily Close
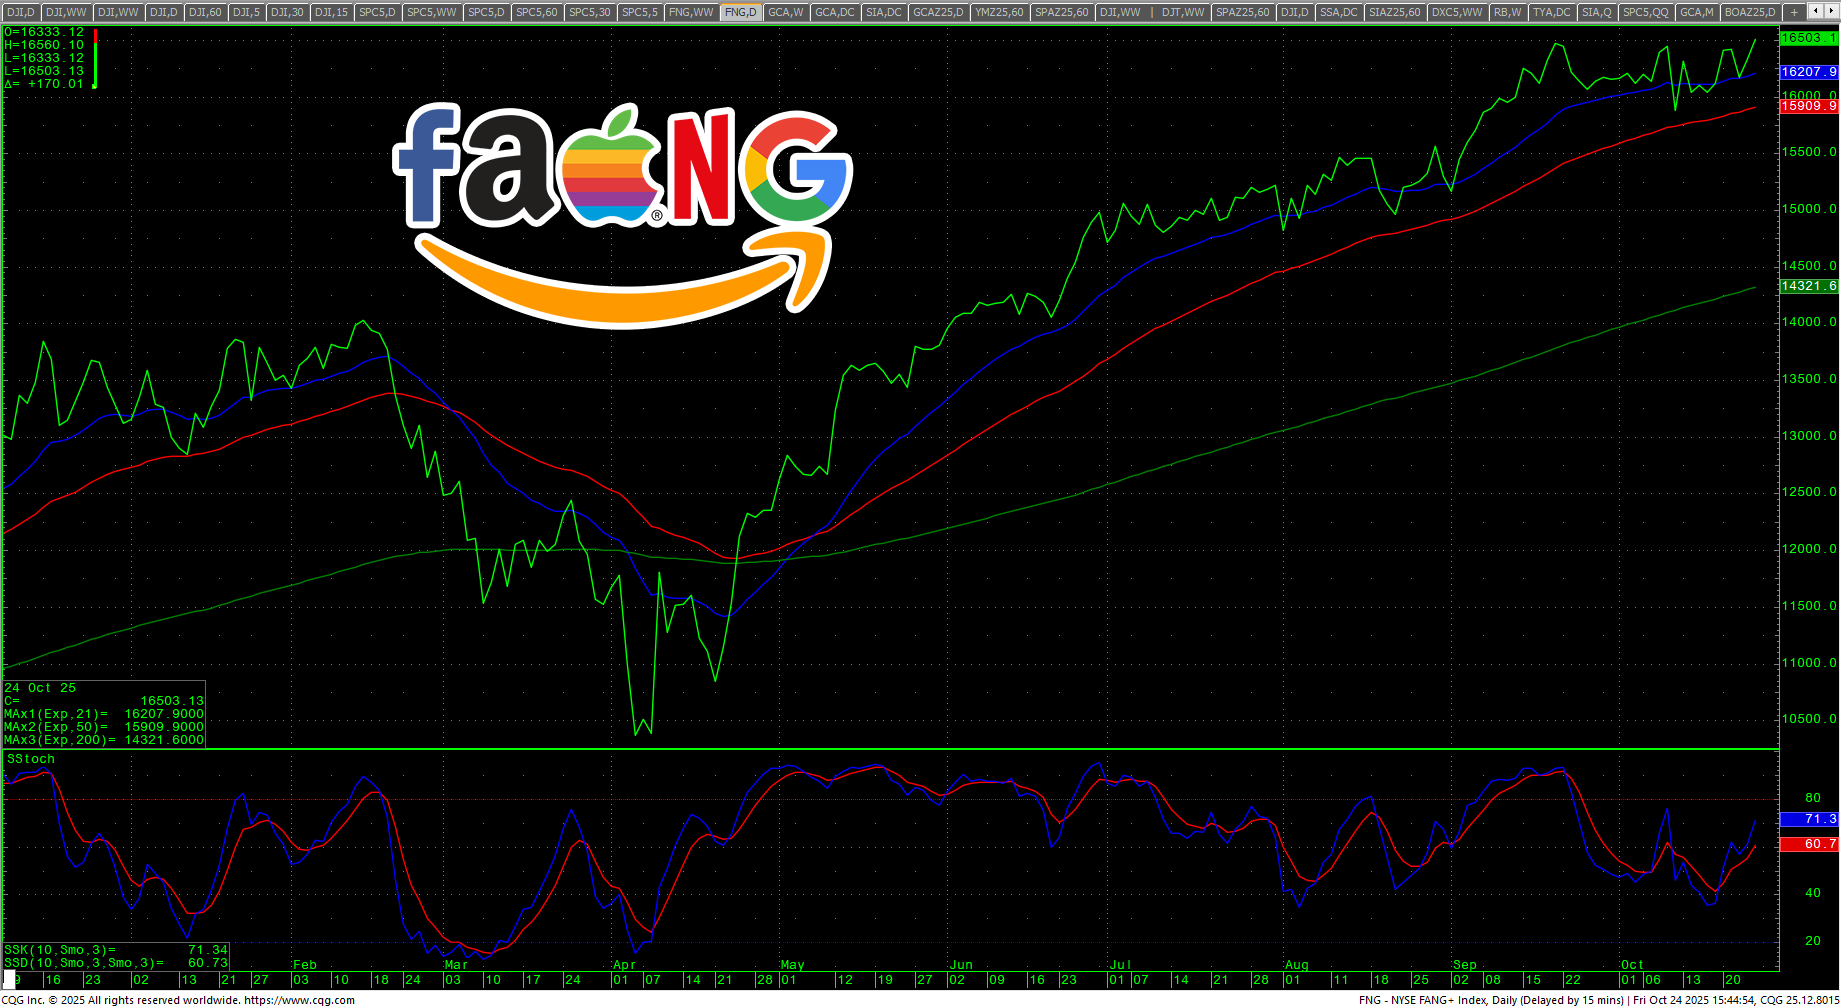 The NYSE FANG was able to move into record territory on Friday and has now eclipsed the critical cycle timing of the week ending September 19t.
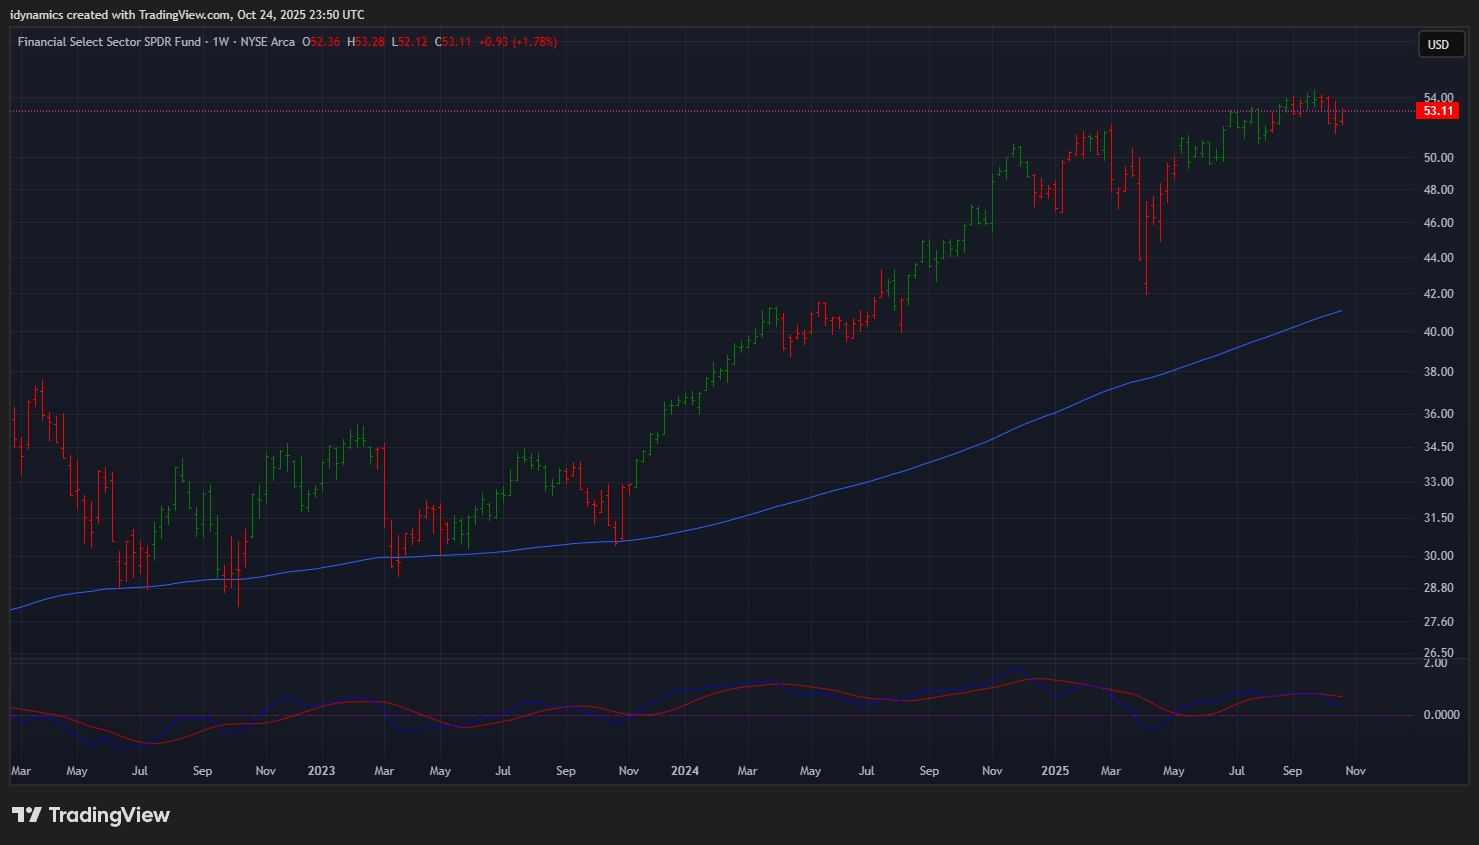 The XLF remains in a PIT (pullback in time) as it stalls at the recent record highs.
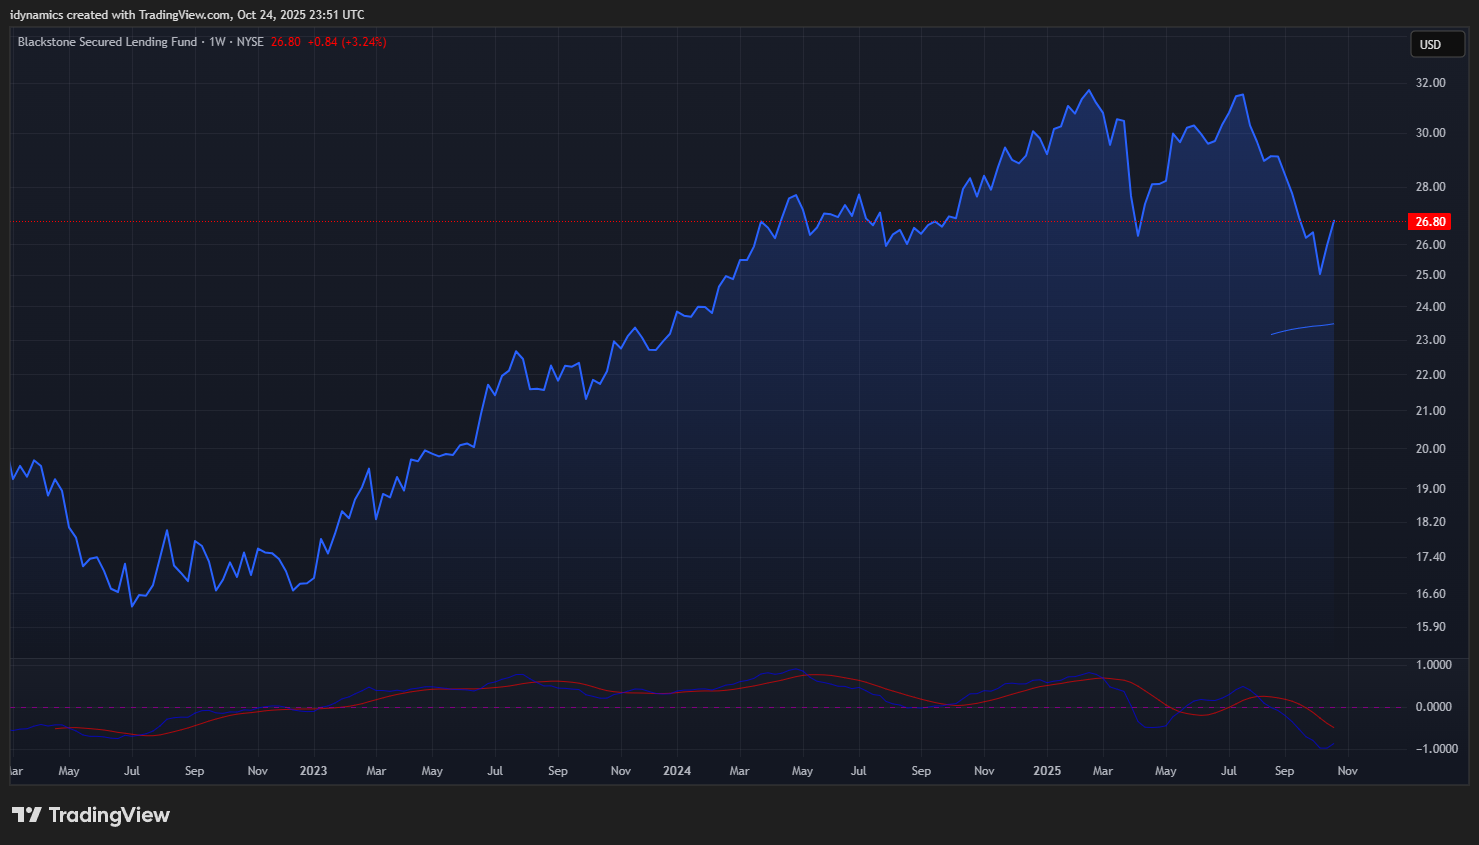 The Blackstone Secured Lending Fund (BXSL) saw a big rebound last week, closing up +3.24%. Remember that BXSL is the grease on the “AI Revolution” wheels, e.g., the “bank.” This is still a key chart to keep an eye on moving forward.
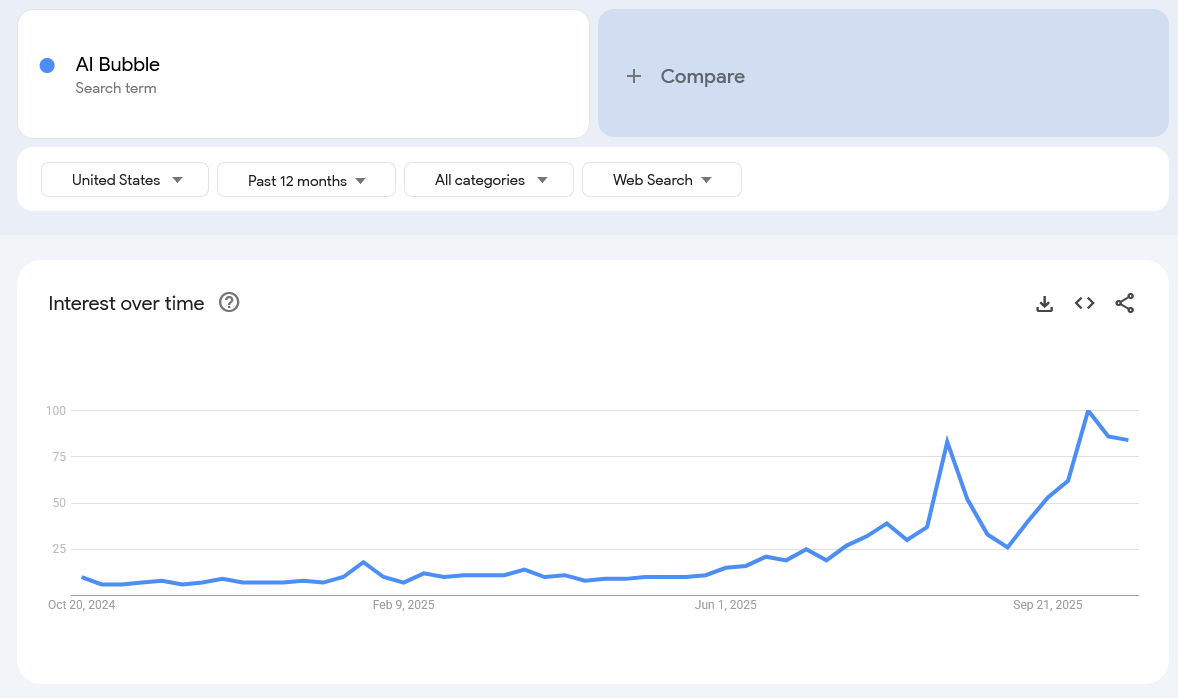
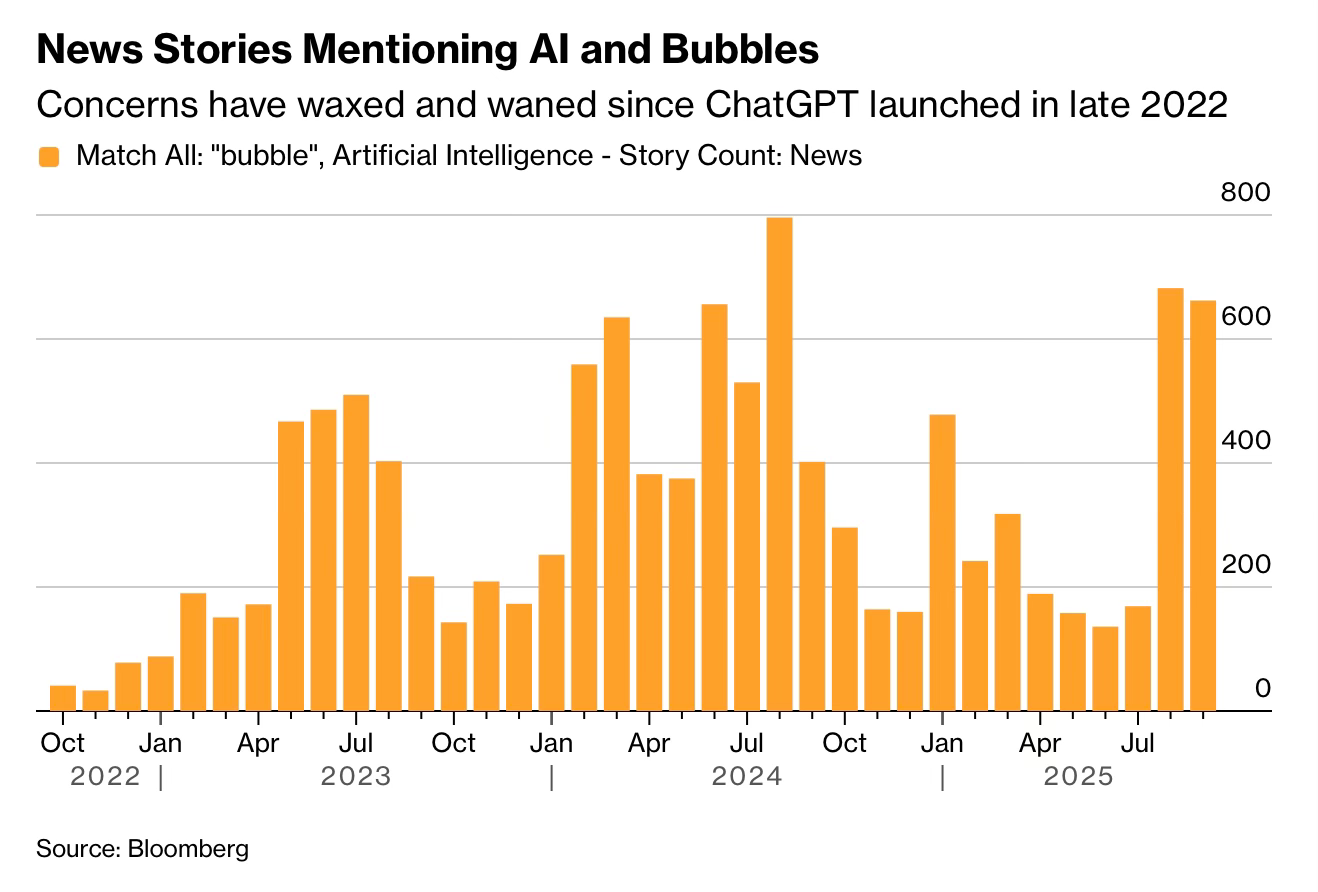
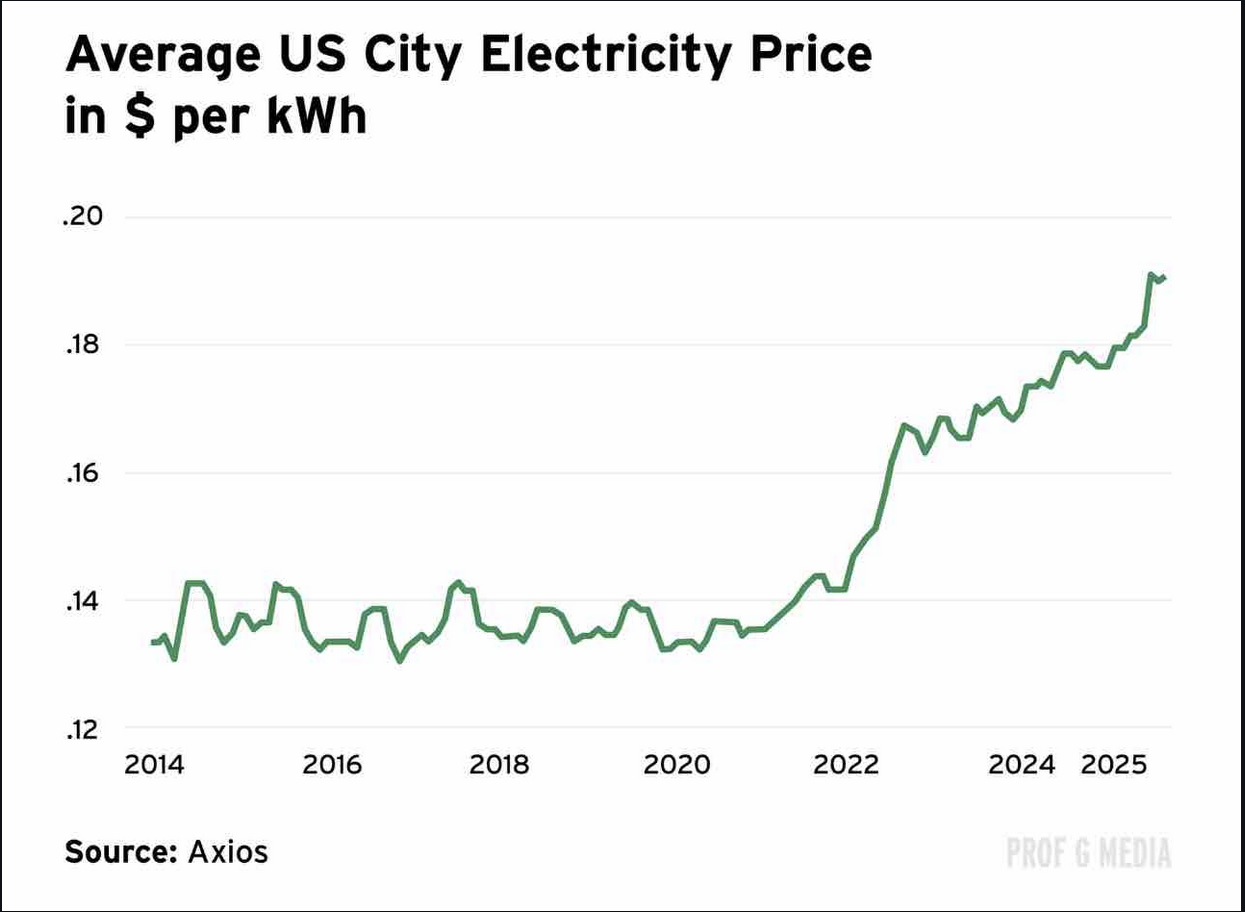
Speaking of which, searches for “AI Bubble” have surged this year. No wonder sentiment is in FEAR. When everyone knows it is a bubble, the fat lady most definitely is not singing. The BIG question that remains with this circular, daisy-chain of funding amongst the big players is, Where is the energy going to come from to power this trillion+ dollar “data center” CAPEX?
 SPX Quarterly H-L-C
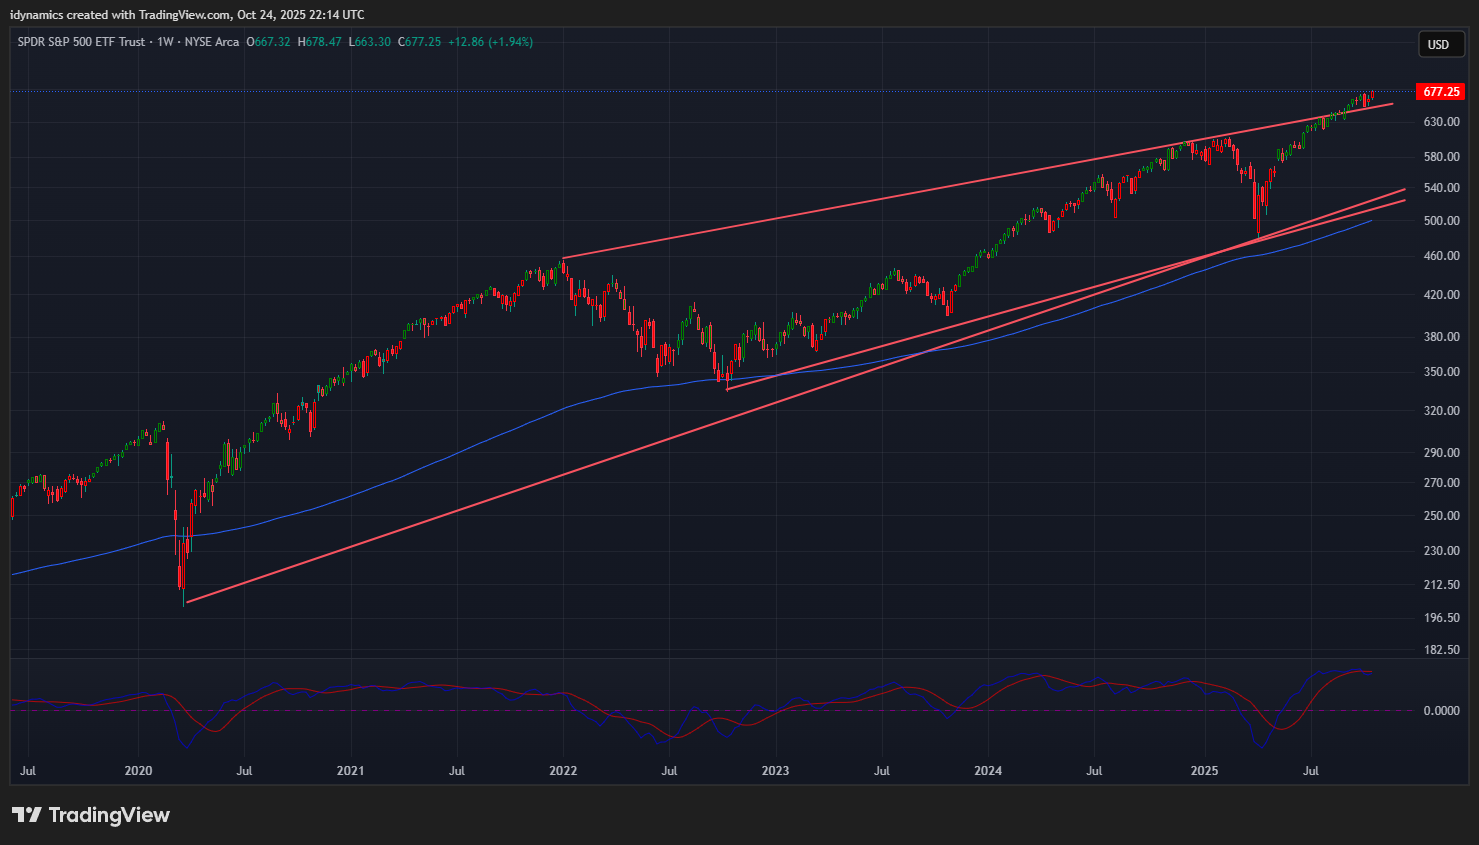
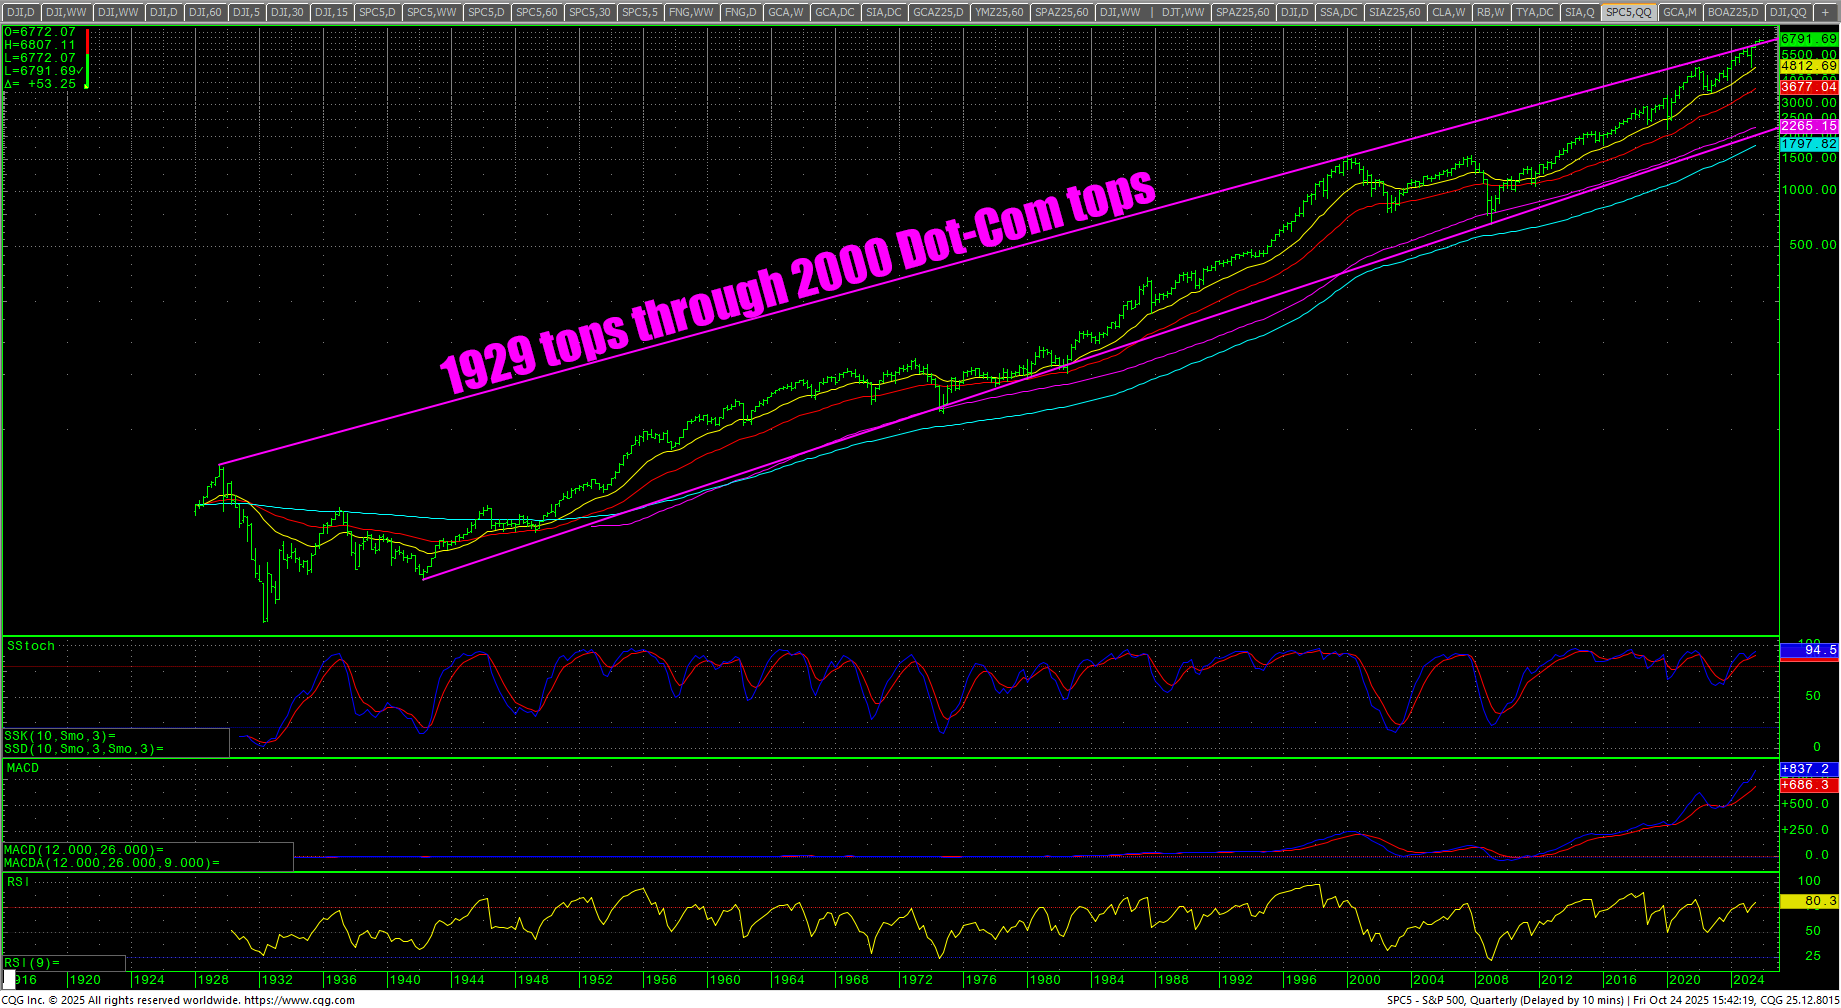 The SPX quarterly keeps alive the super bull scenario as prices break away from the overhead trendline that connects the 1929 tops through the 2000 Dot-Com tops. If prices start to trade back under the trendline, it could signal selling in equities. It also holds potential for a blowoff move.
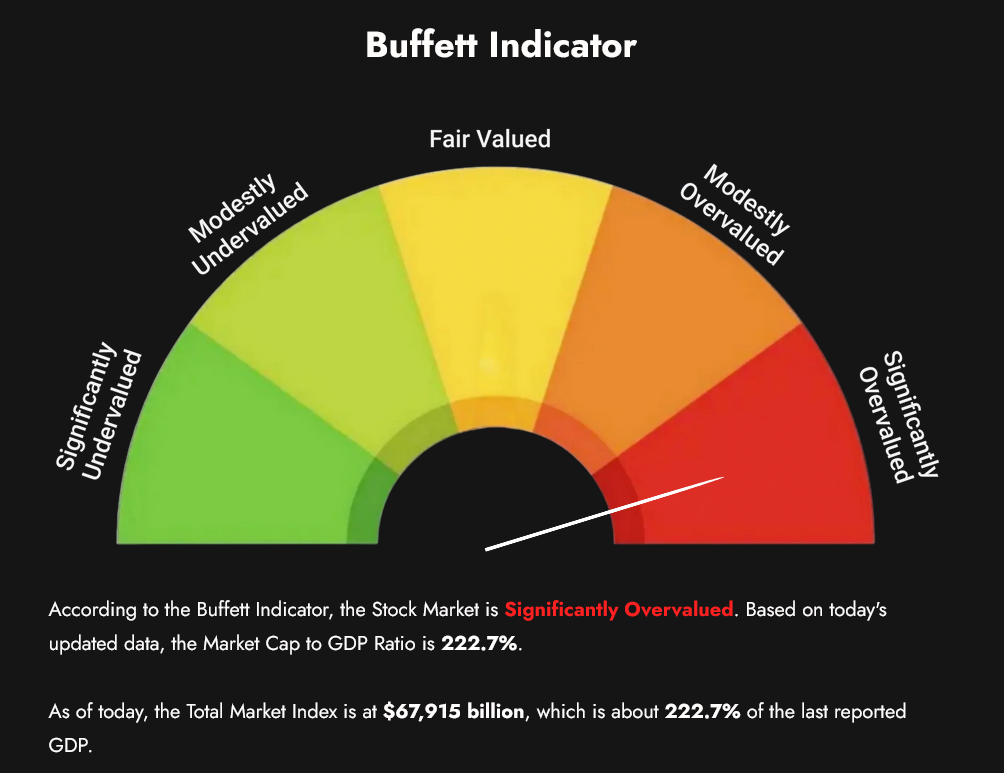 The Buffet Indicator set an ATH Friday, now sitting at 222.7%.
Dow Theory
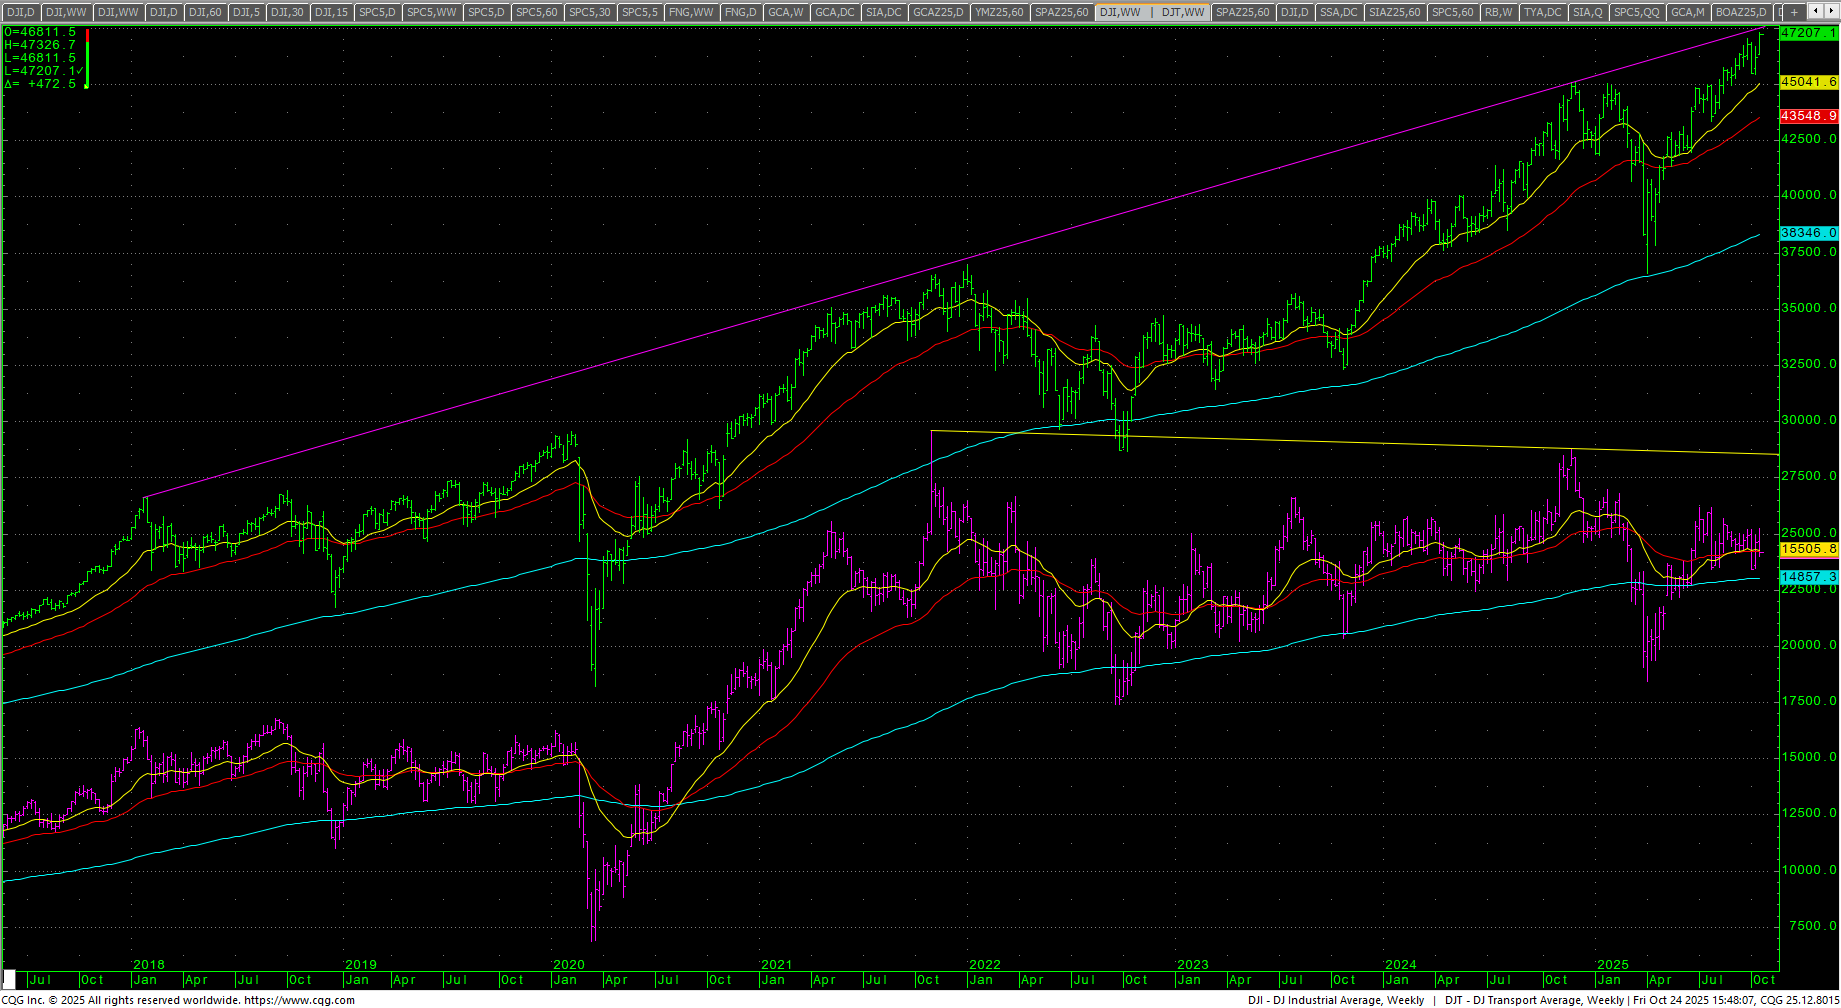 Dow Theory still shows a bearish divergence.
S&P 500 Stocks Above the 200-day MA
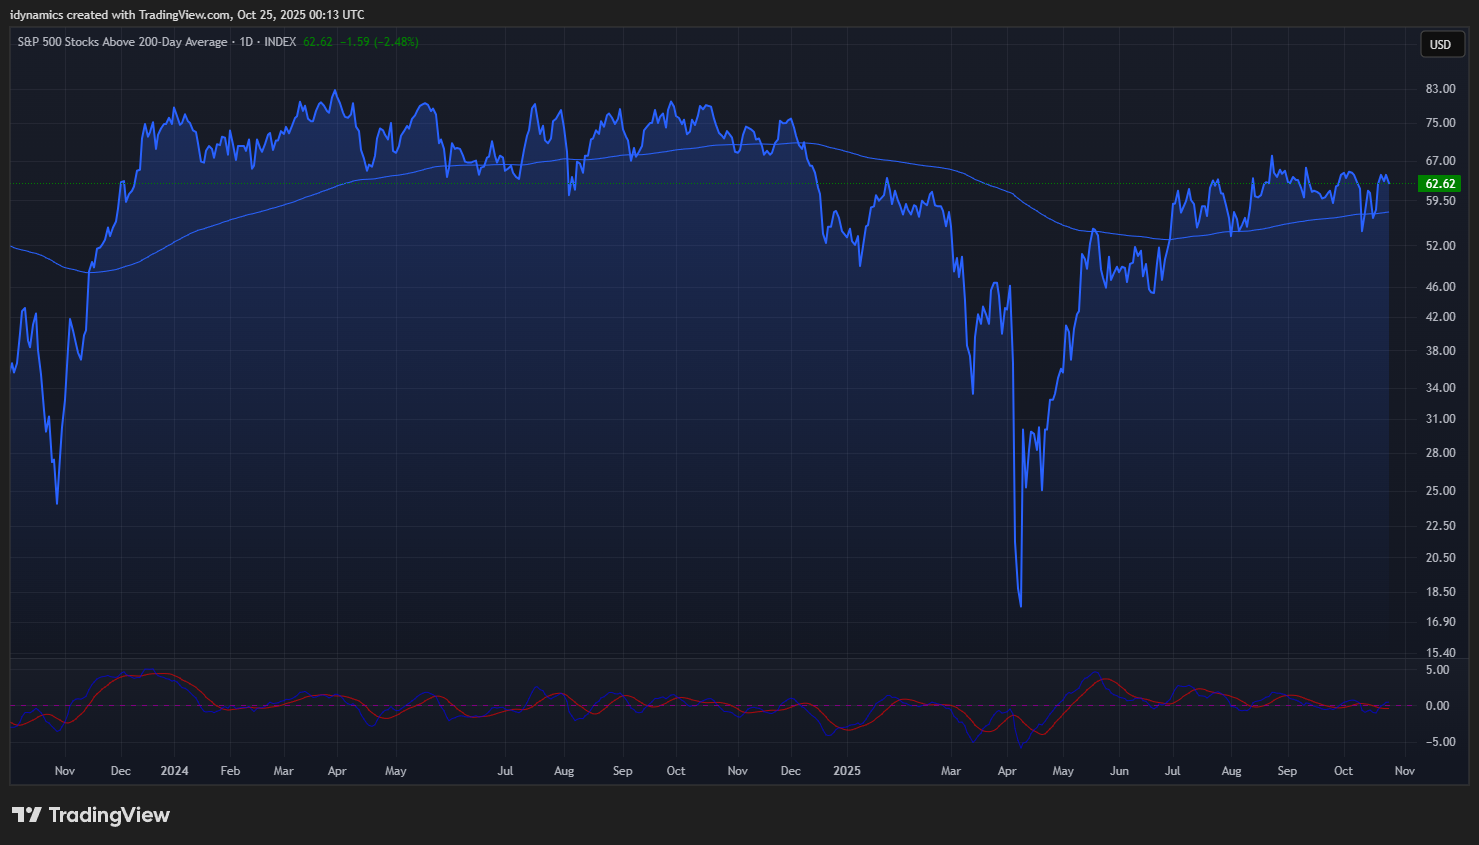 Breadth improved slightly on the week with the share of SPX stocks above the 200-day MA moving to 62.62%. The high in September 2024 was 72.92% and 82.70% in March of 2024. Divergence remains the name of the game. 10 stocks make up 40% of the SPX.
Consumer Sentiment
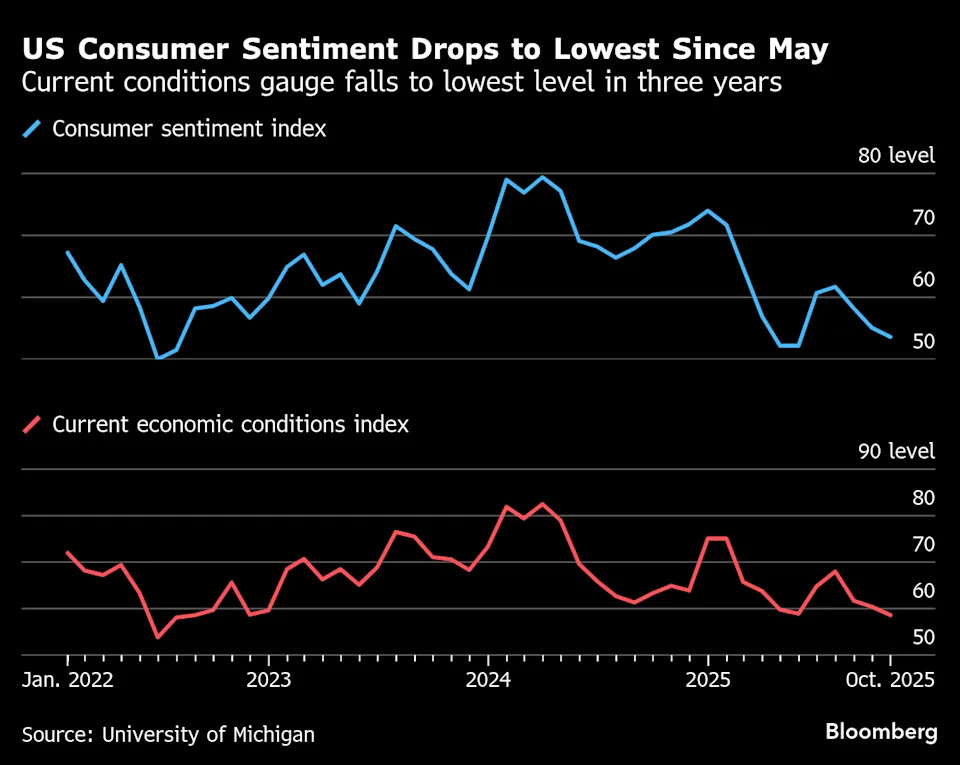 Consumer Sentiment has dropped to the May lows as U.S. consumers are strapped with things about to get much, much worse. Right now, the top 10% is accounting for 50% of the entire consumer economy, whereas the bottom of the country normally accounts for roughly 2/3rd.
MAGS (Magnificent 7) Weekly Candles
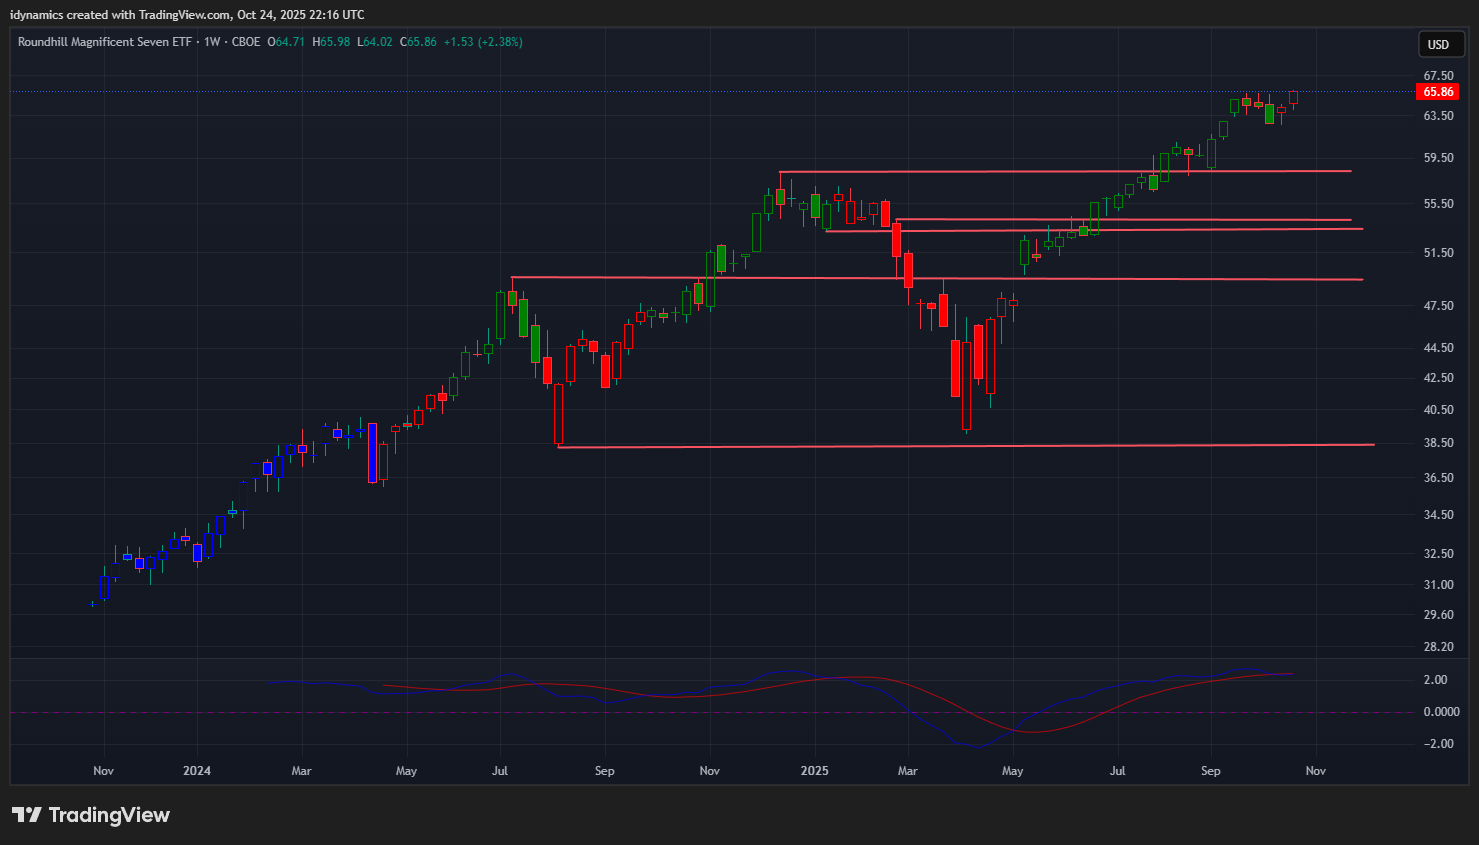 The MAGS rallied to record highs and closed up +2.38% on the top of the week’s range. The chart still has a higher target at 74.00/74.30. Support is at 59.61/58.85 and 55.67. Under 55.67 can test 52.49 with critical support at 49.31/49.20.
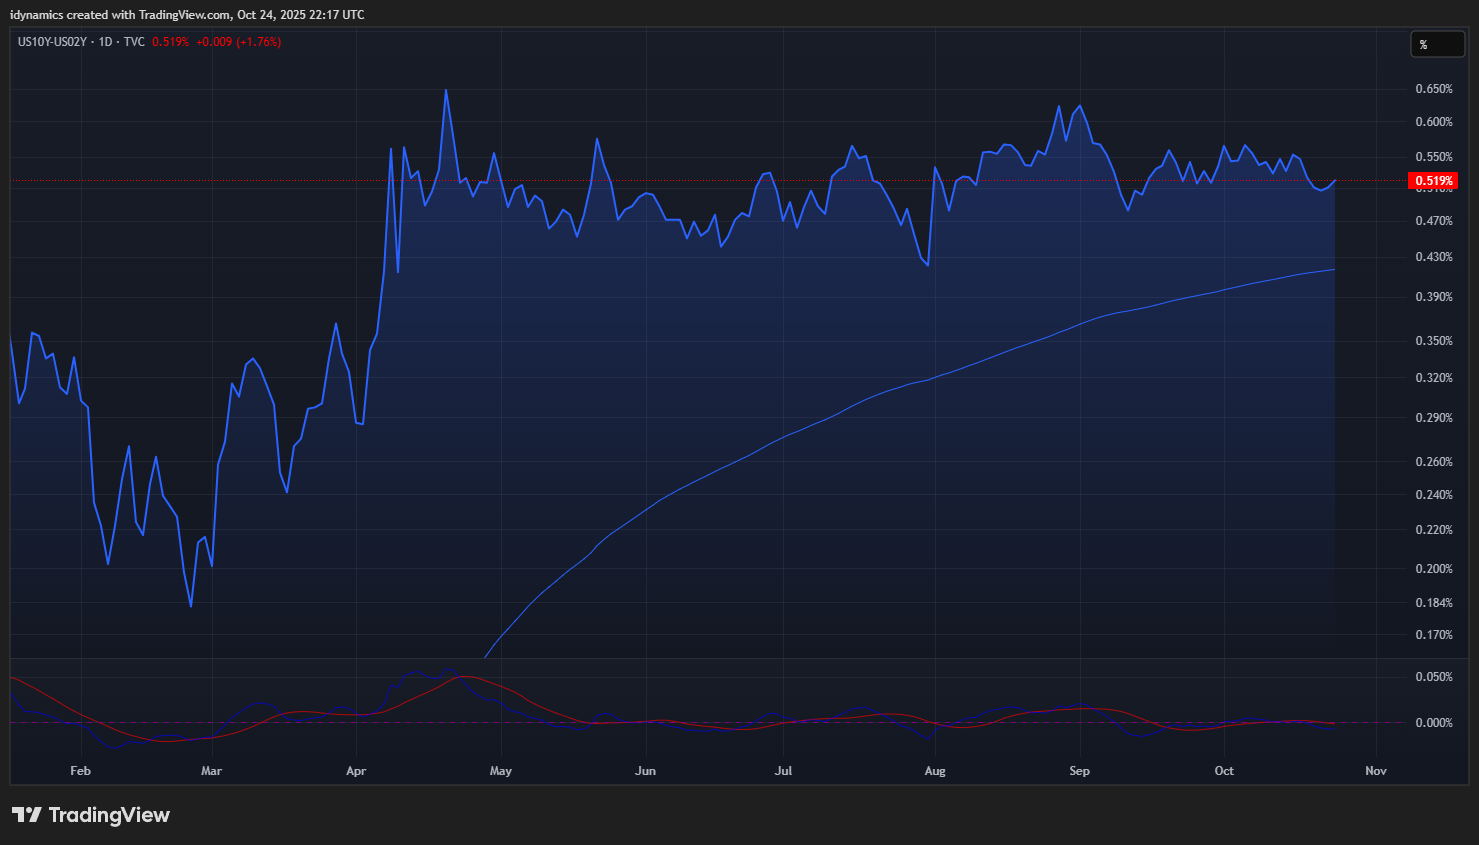
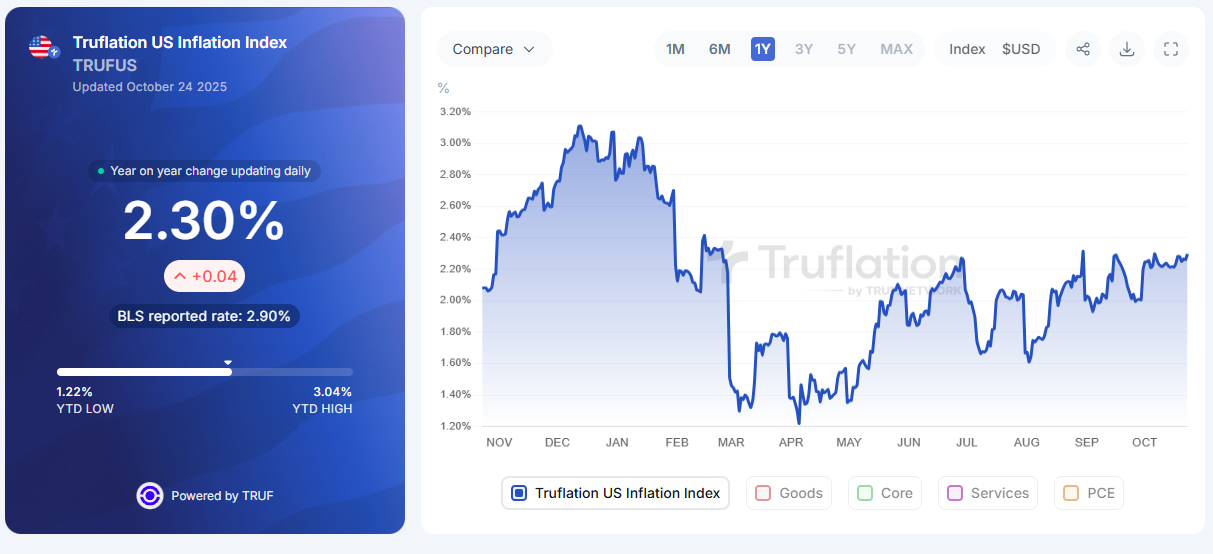
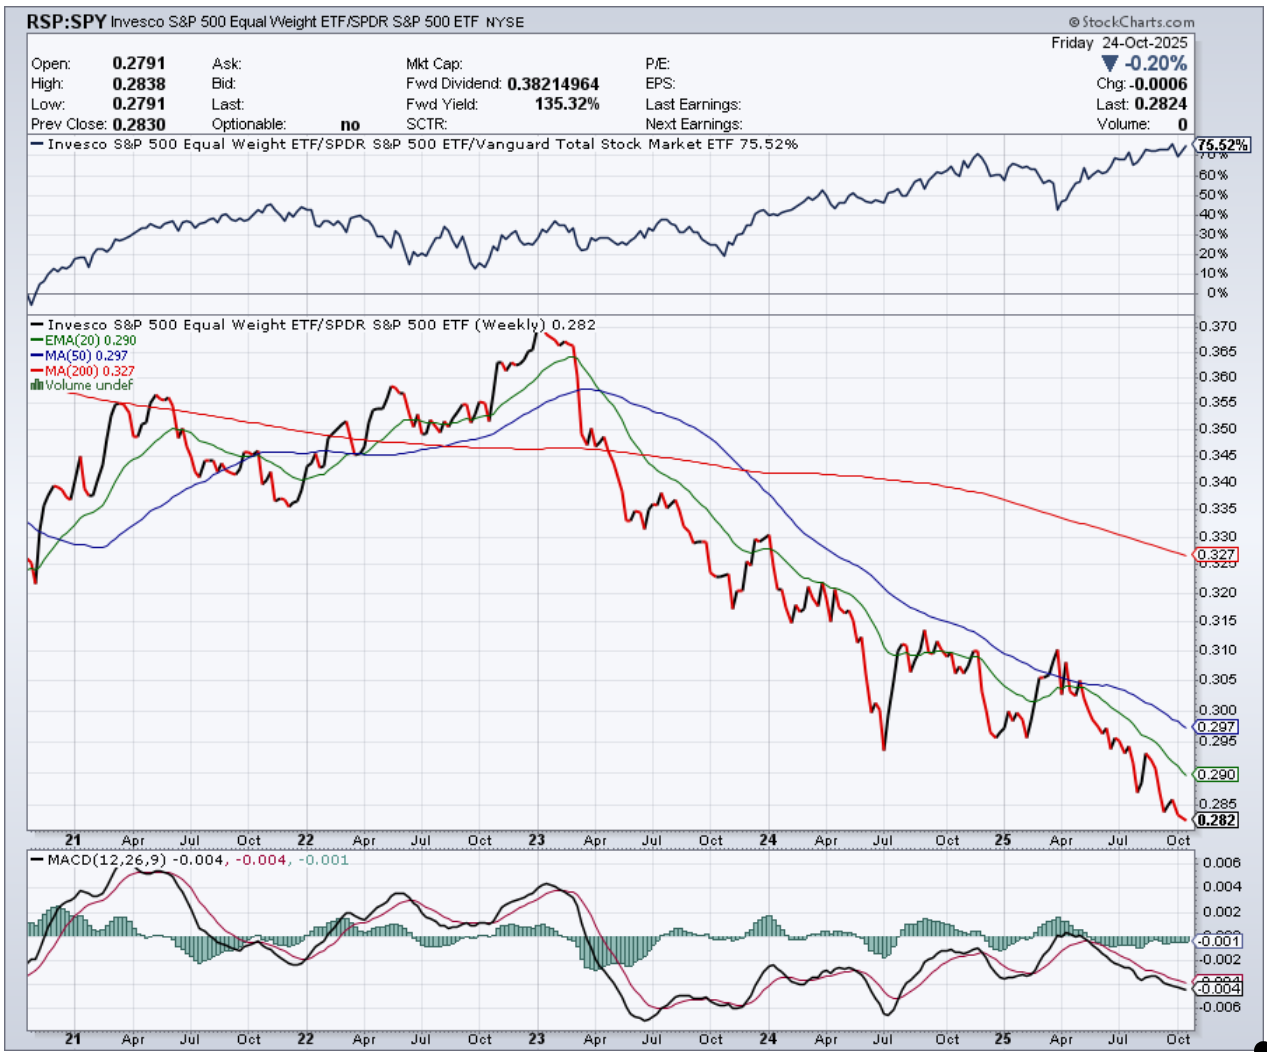
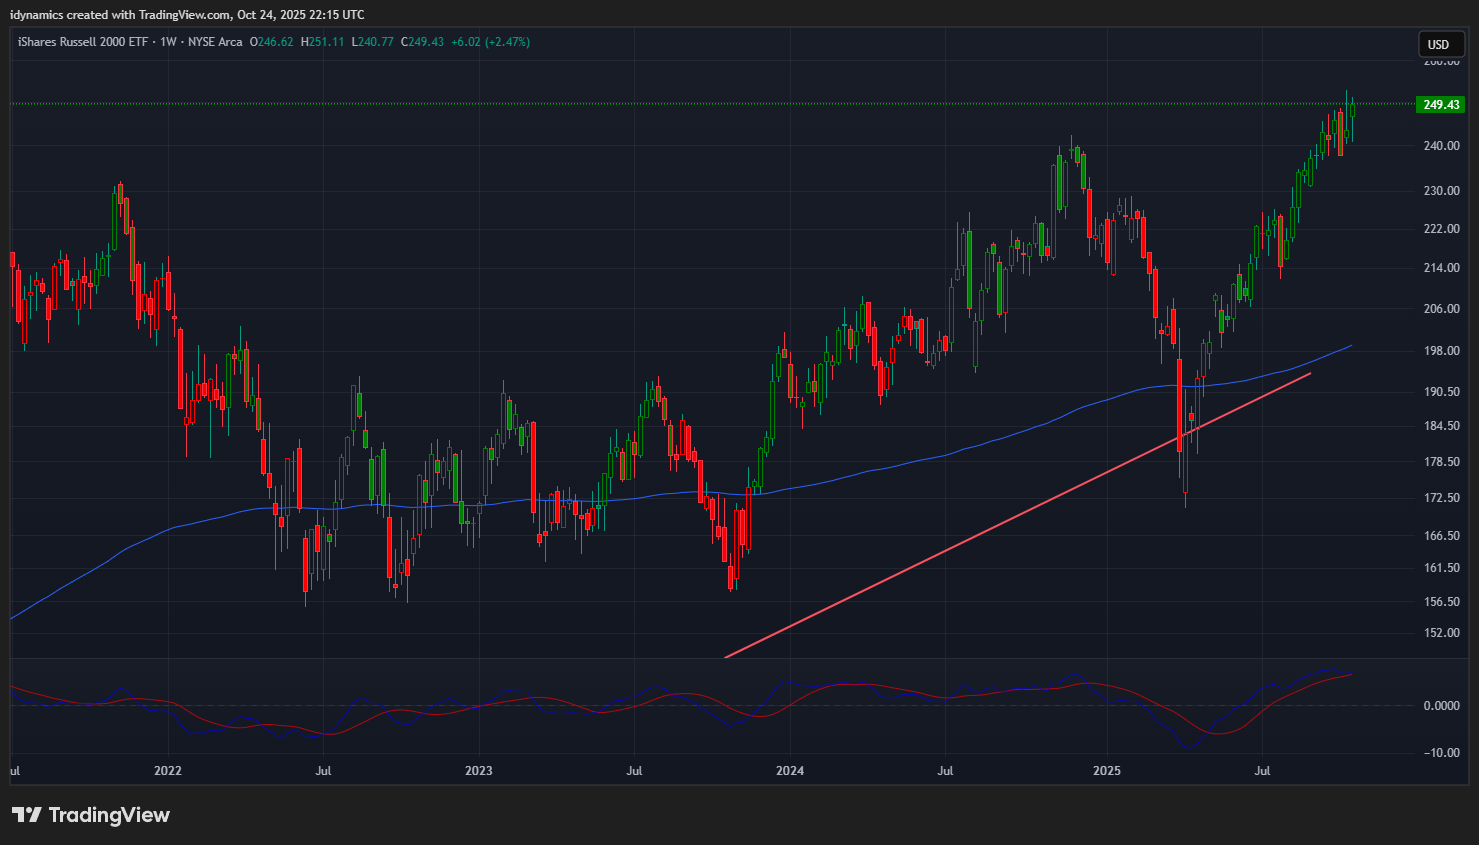
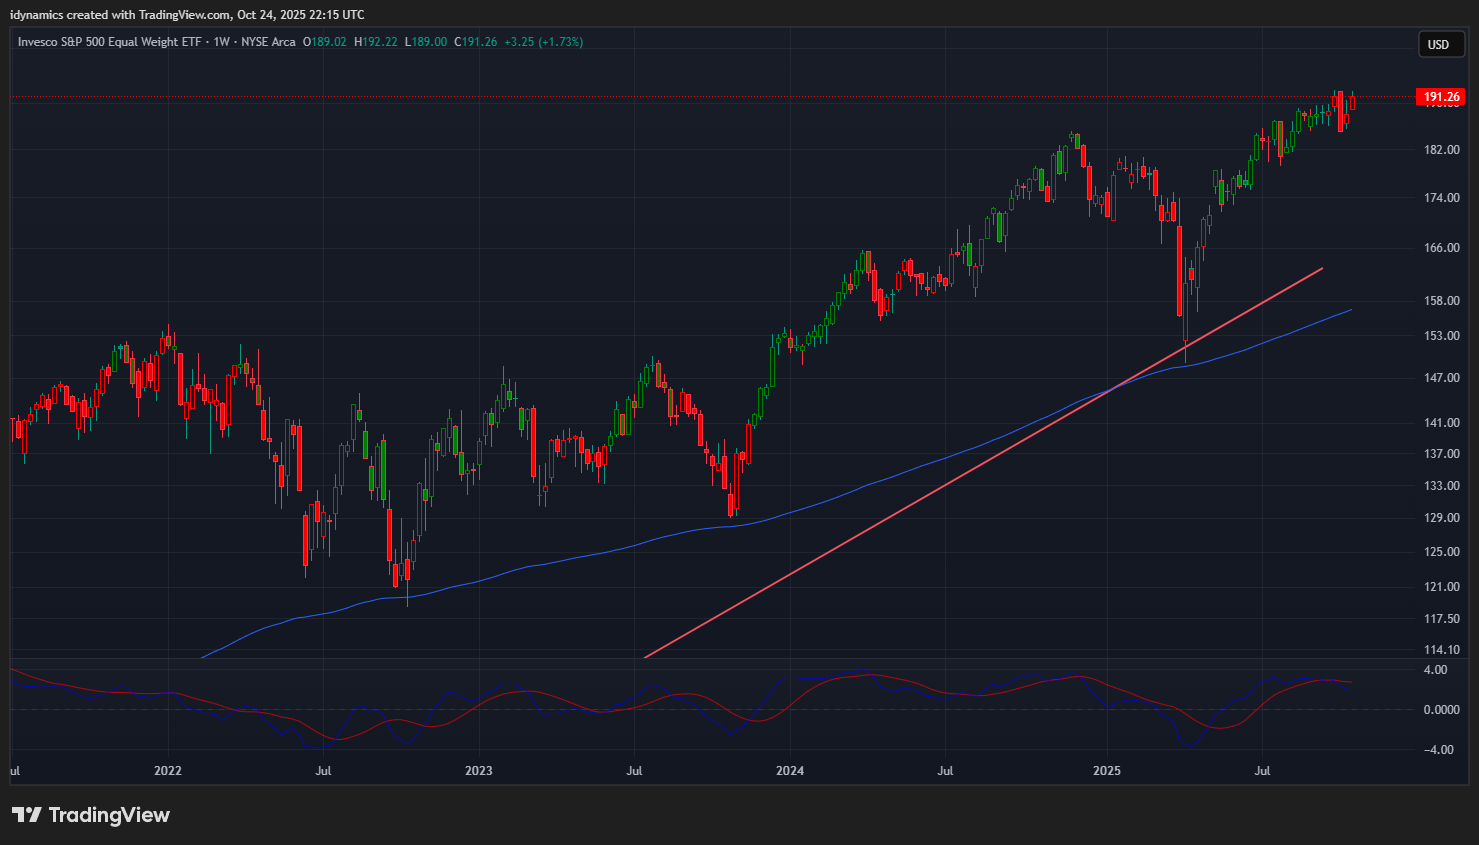
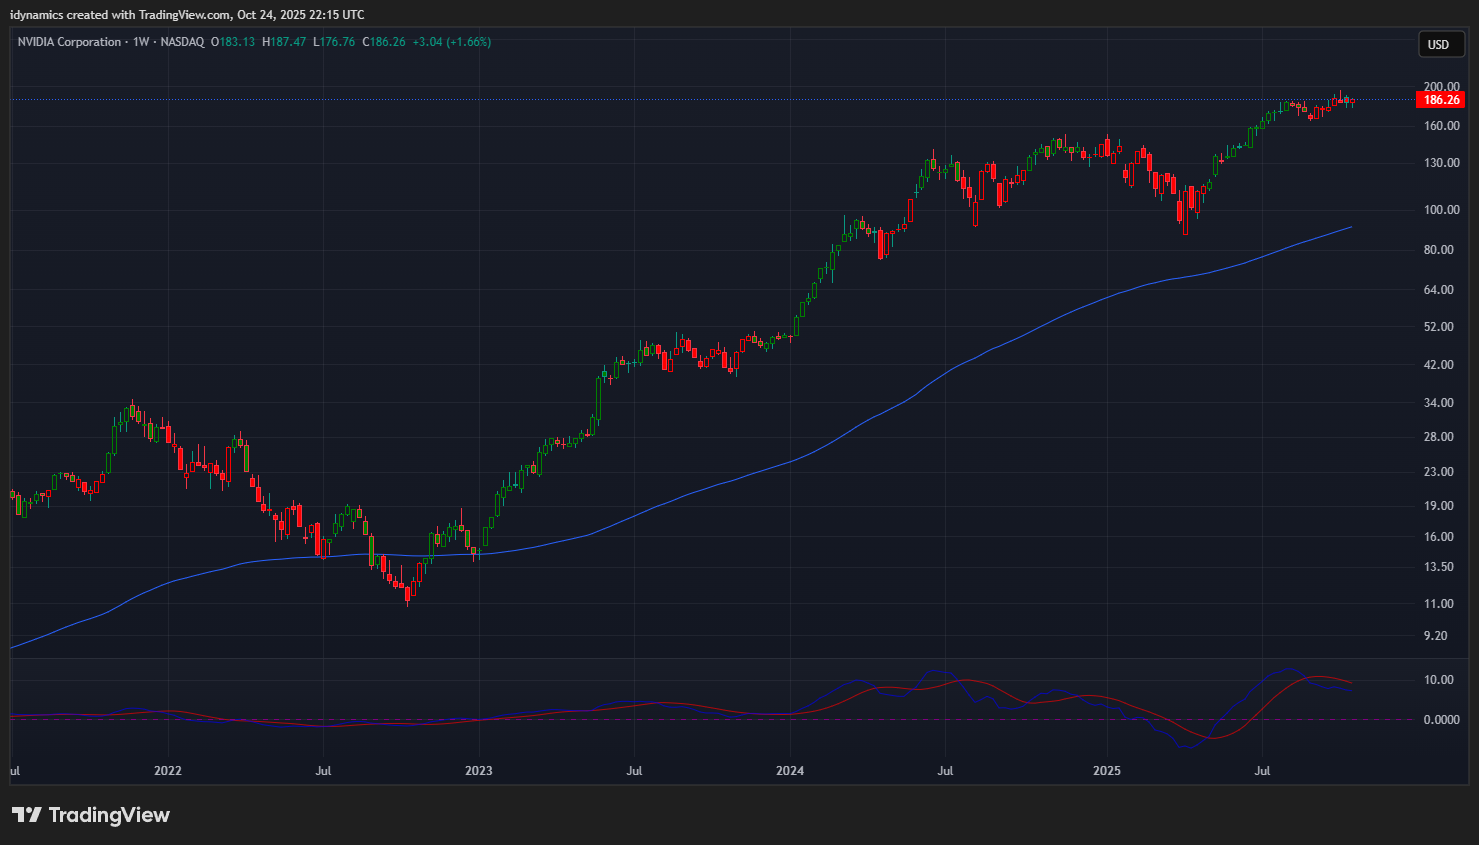
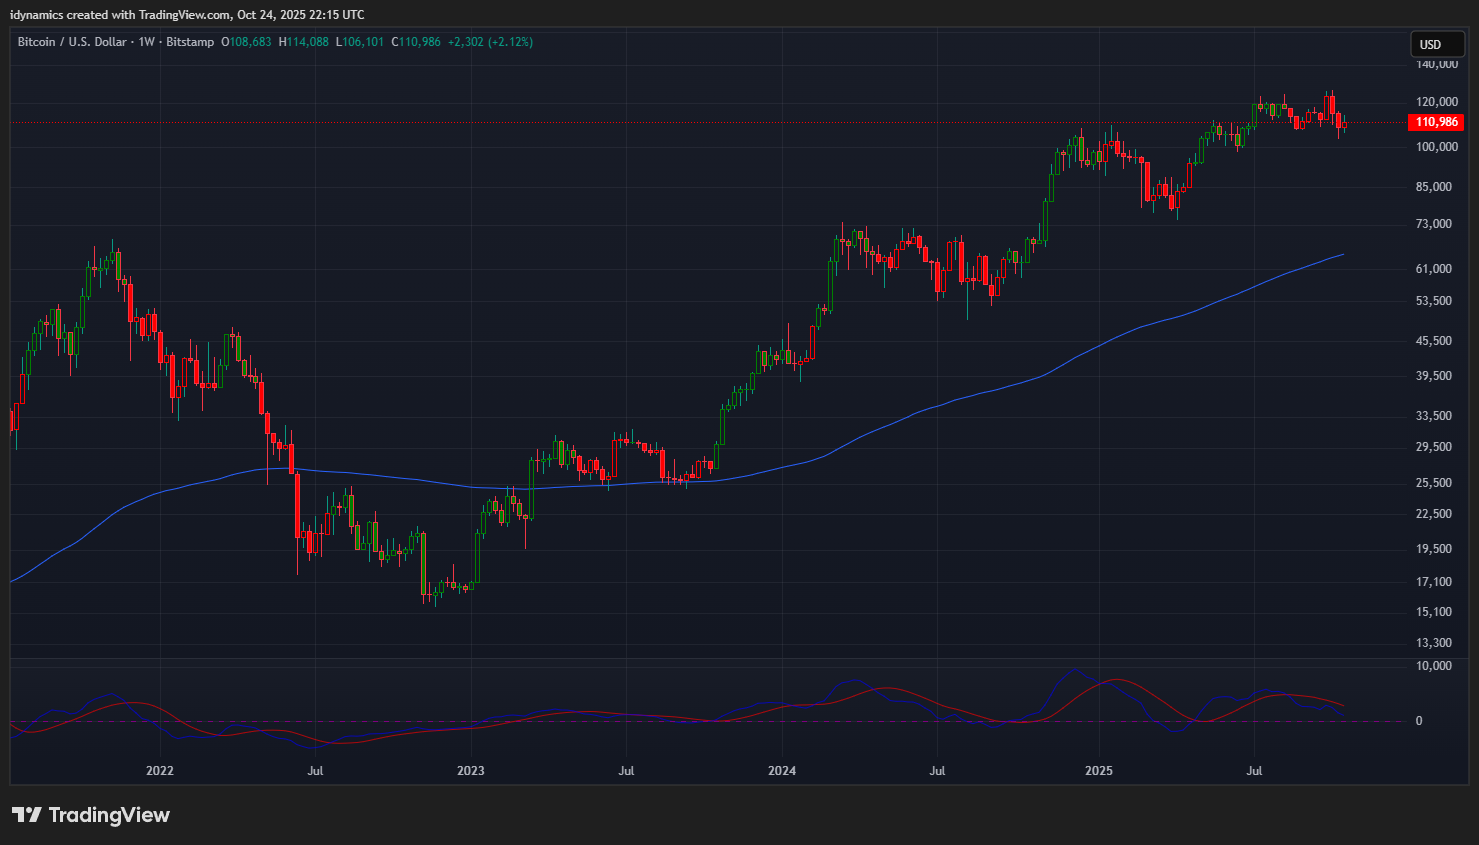
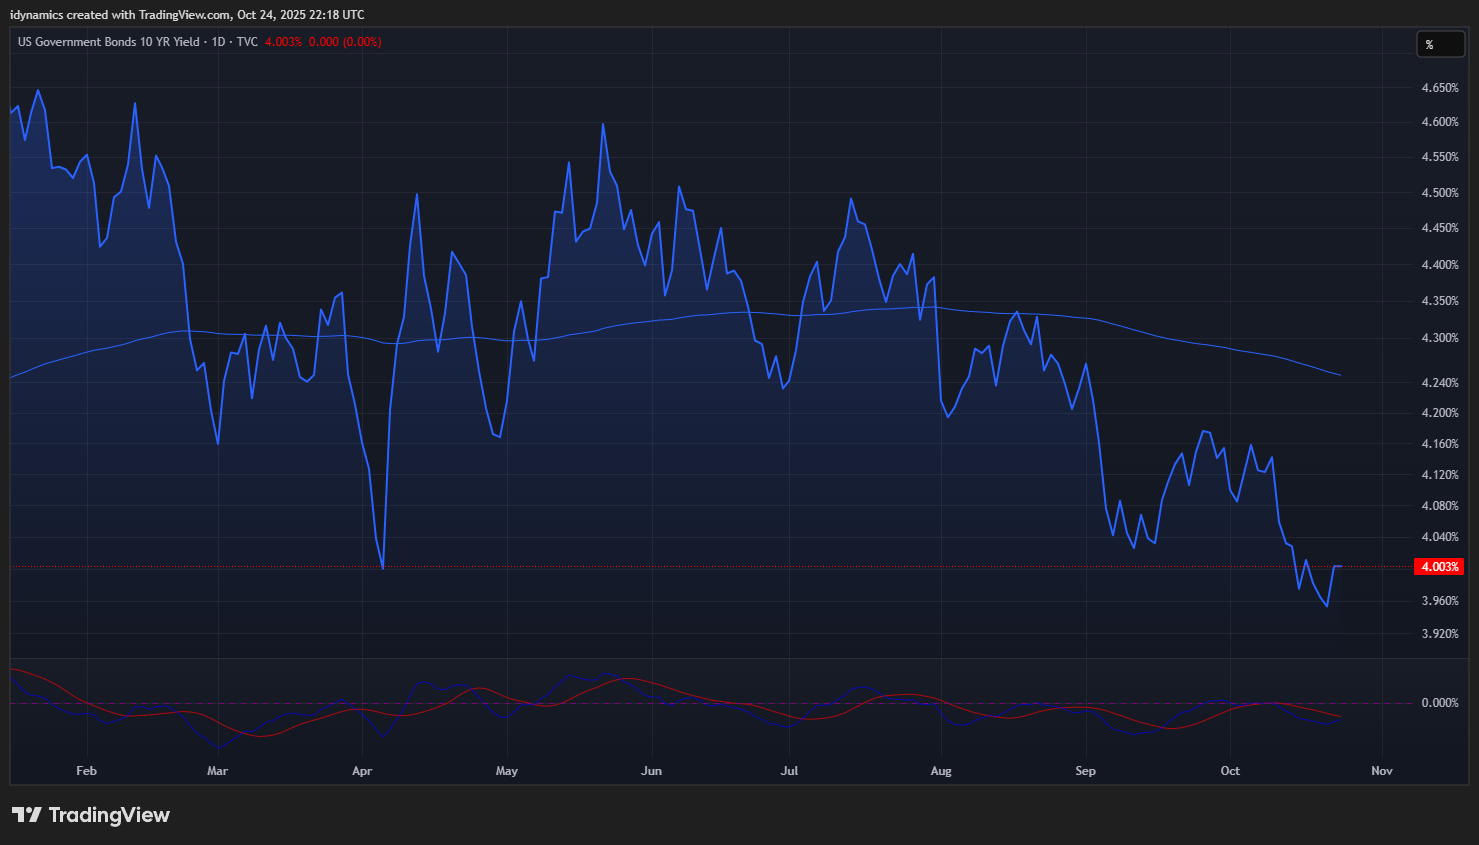
The RSP:SPY remains weak. The weekly is trending lower in an oversold position and the MACD is down. Resistance remains at .294. The IWM traded an inside week and closed on the high, setting a new record close, up +2.47. The RSP matched recent ATH close on the weekly, settling up +1.73% on the top of the range. NVDA traded a reversal and closed on the highs, just under the current ATH weekly close, up +1.66%. Bitcoin traded an inside week and closed above the middle of the range, up +2.03%. Support is pivotal at 100.35 and 94.24/94.00. Resistance is 114.90 and 11760/118. McClellan Oscillators are confirming the record highs for the Dow. The Yield Curve narrowed on the week closing at +0.519%. The 10YR yield was flat, closing at 4.003% after trading under 4% during the week. Truflation increased to 2.30%.
10YR-2YR Yield Curve Daily
 VIX Weekly Candles
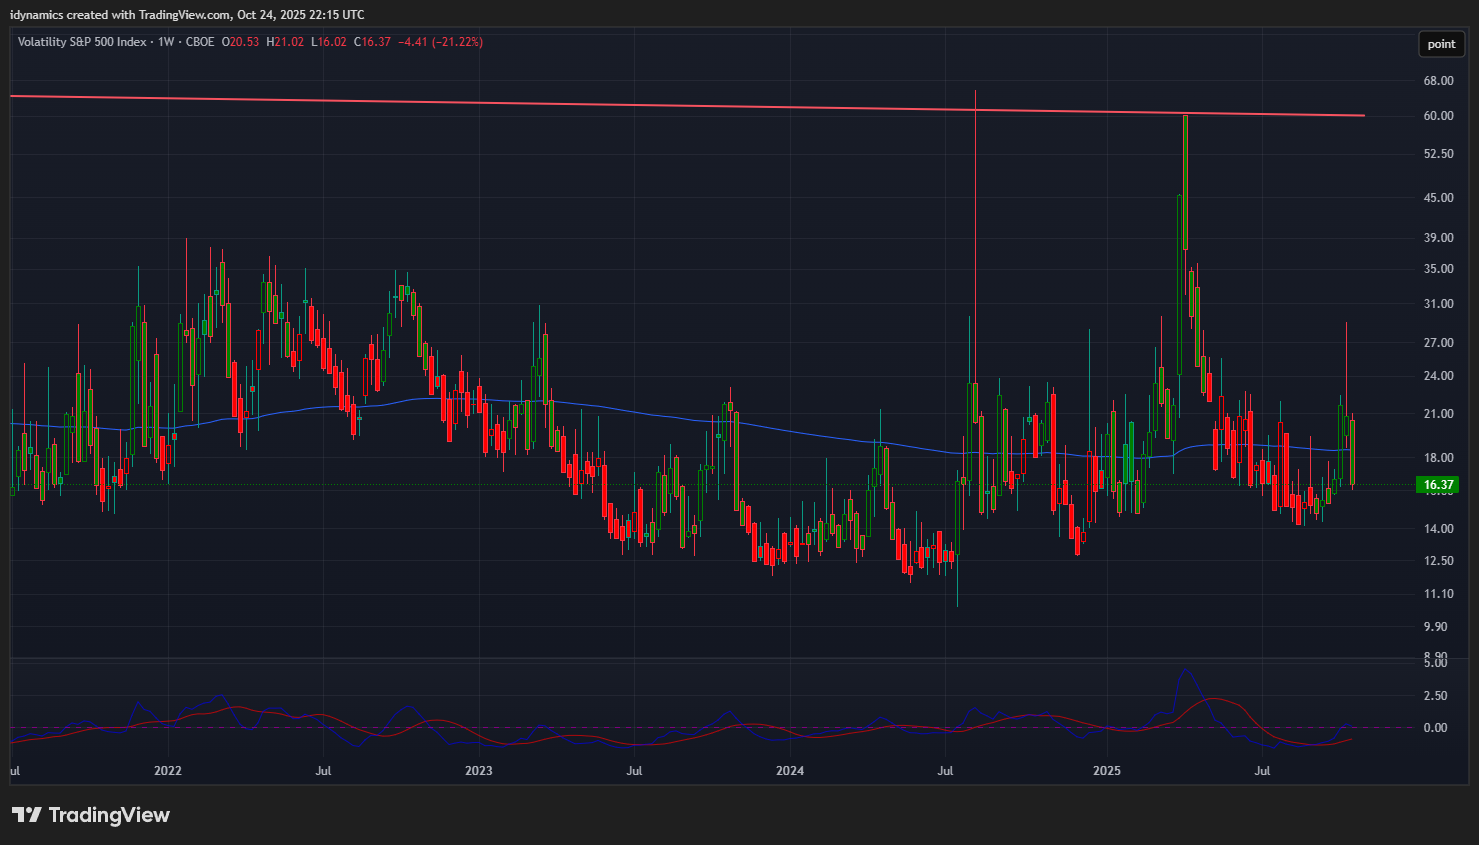
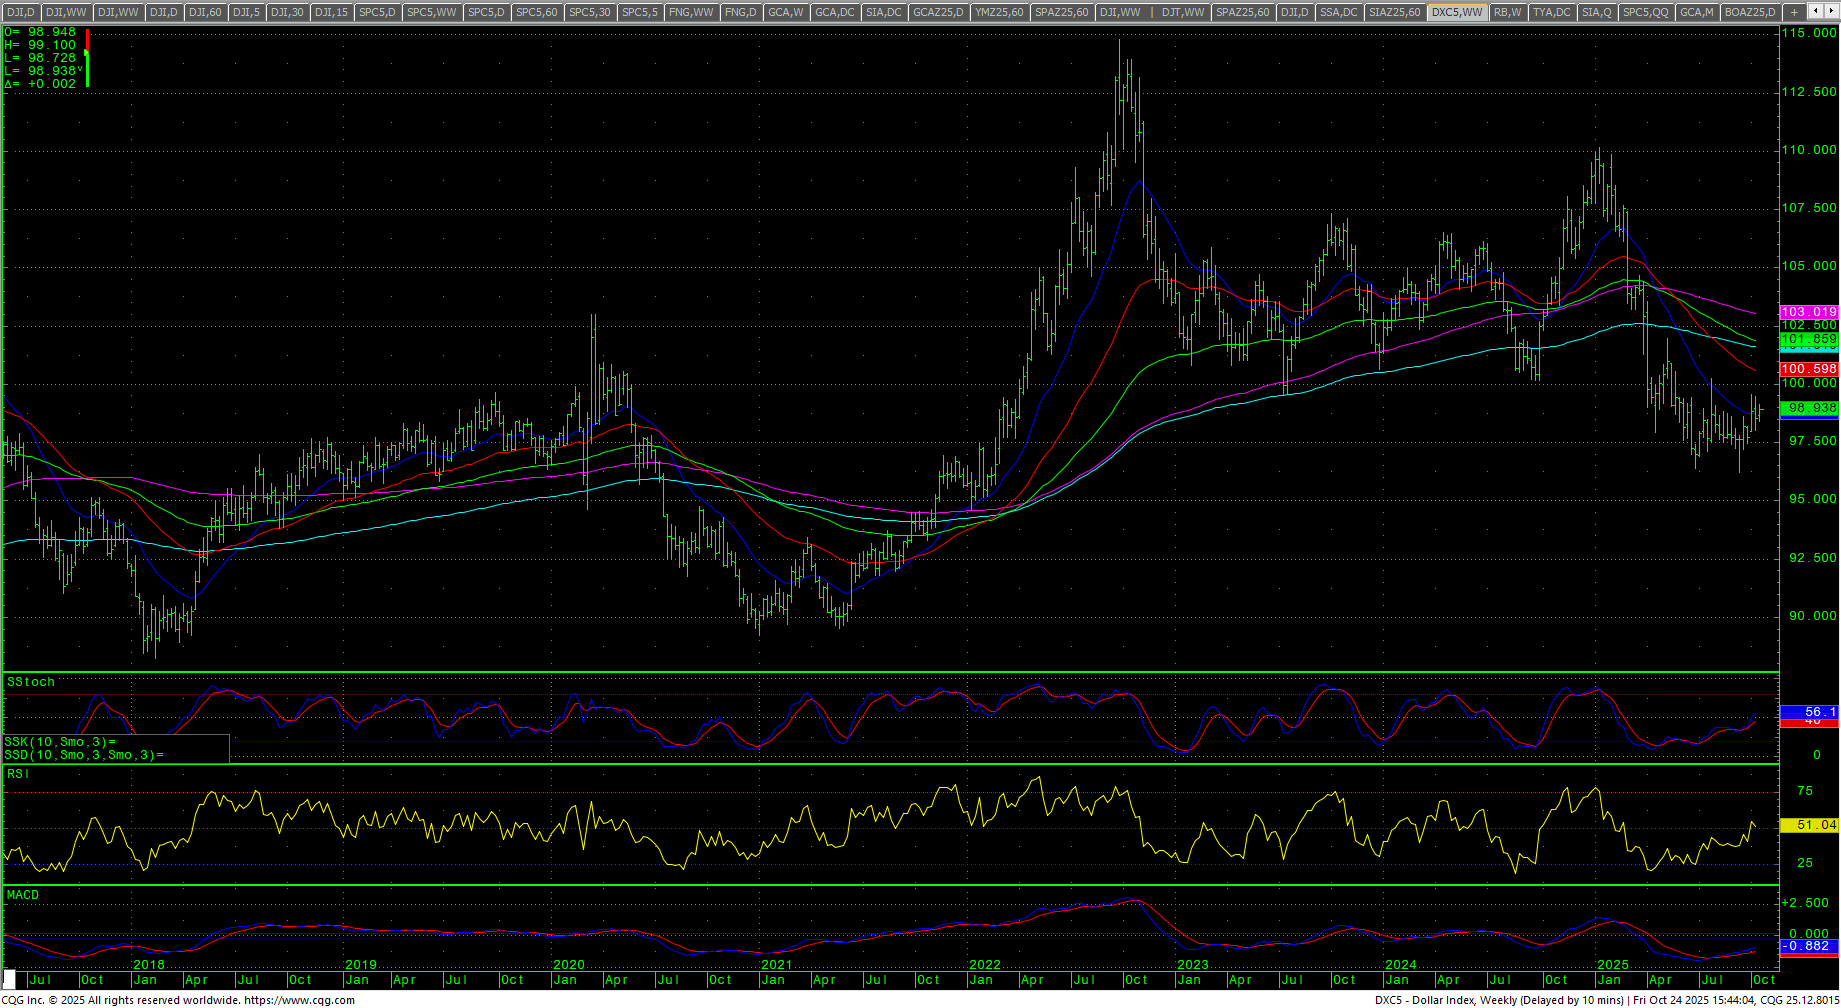
The VIX collapsed sharply on the week, backing off the previous week’s five month highs and closed down -21.22% on the low of the range. The US Dollar traded a tight inside week’s range and closed in the upper half up +0.40%.
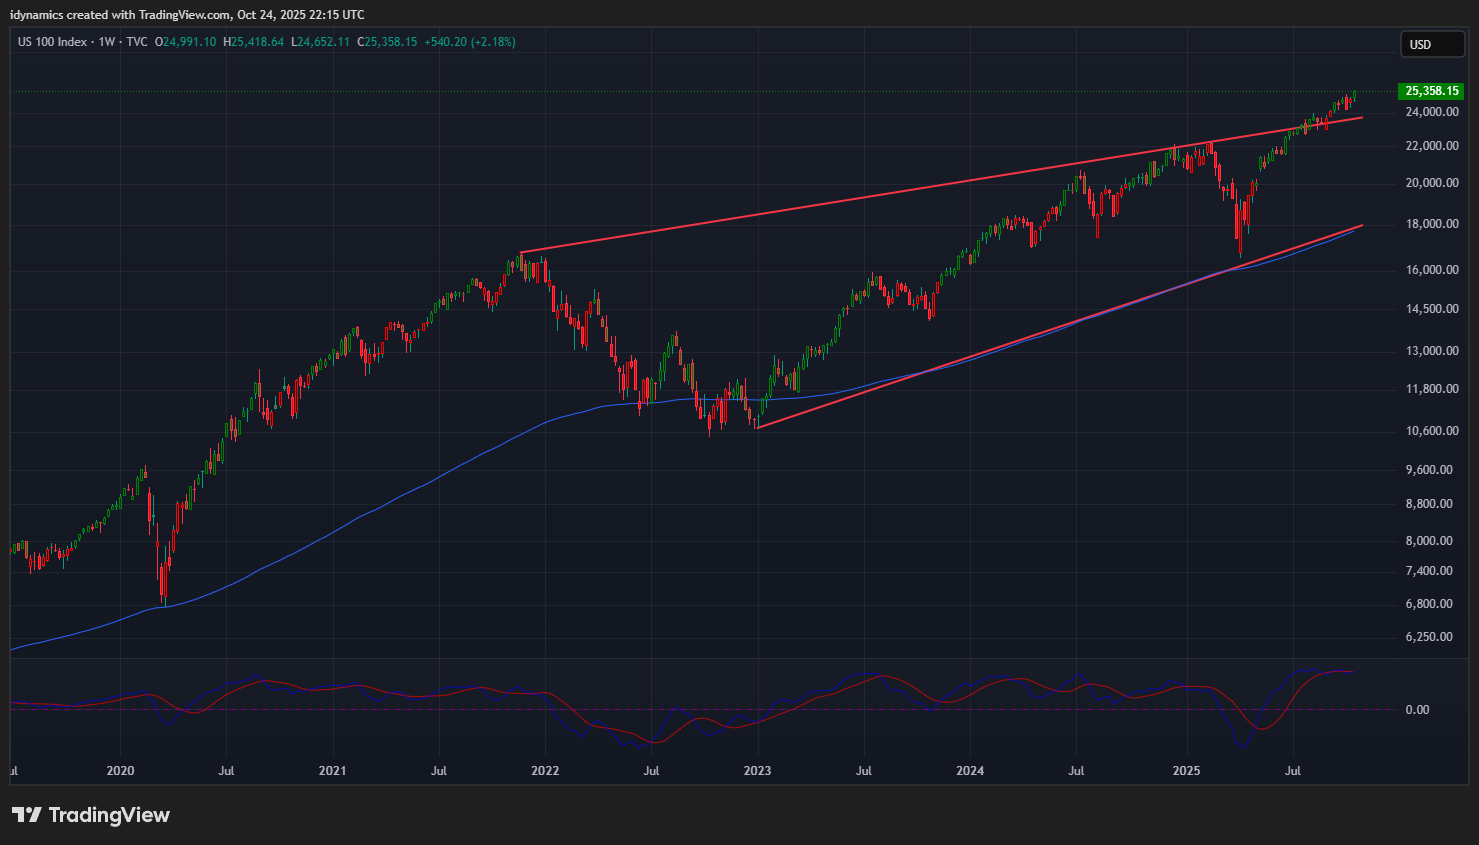
 Nasdaq 100 Weekly Candles
Daily Breadth 
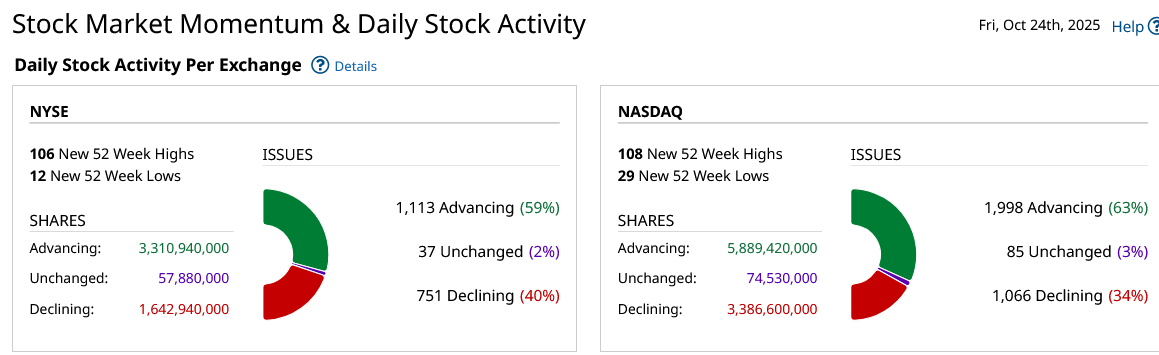
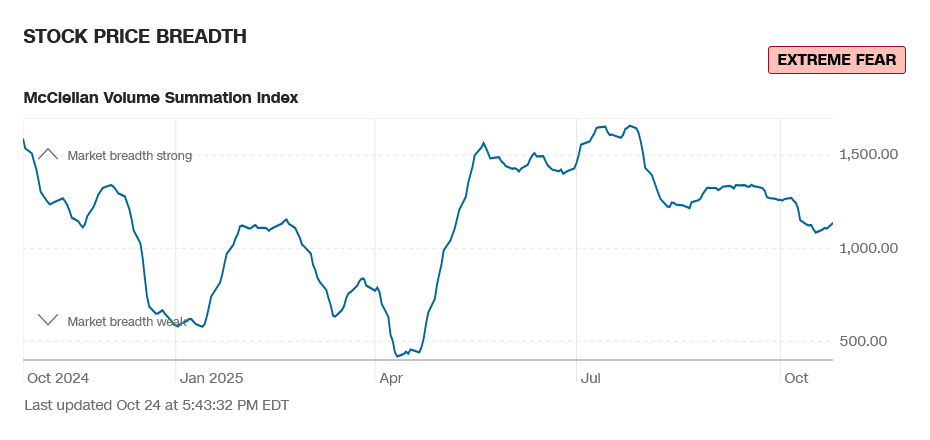
Breadth improved on the week but sentiment still reads extreme fear.
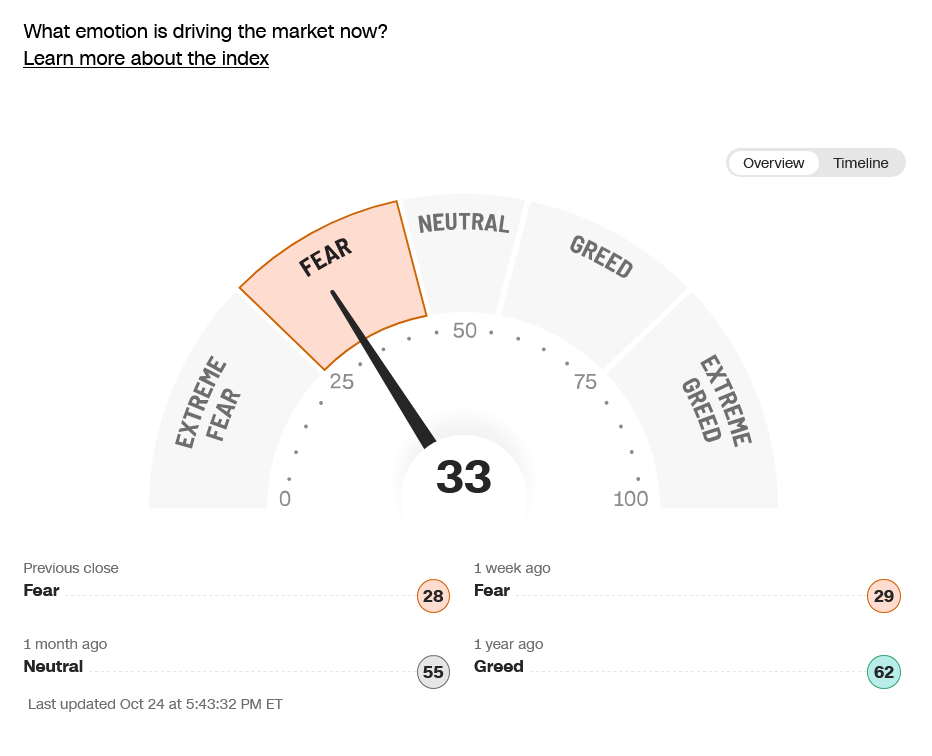
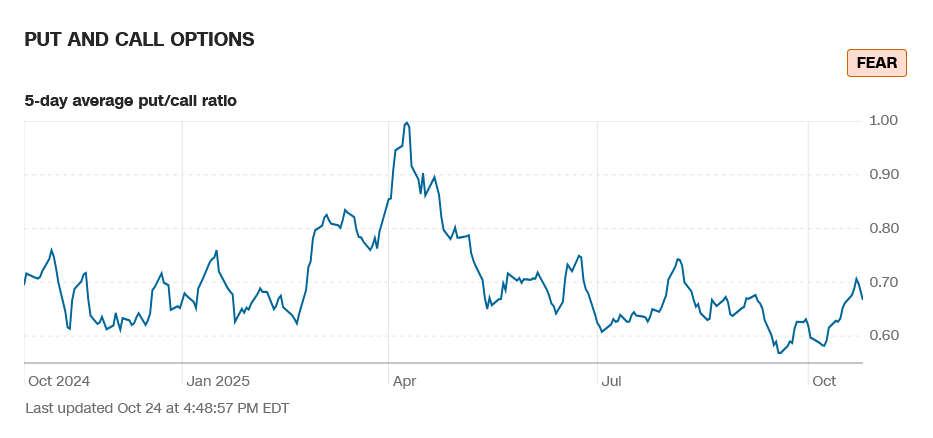
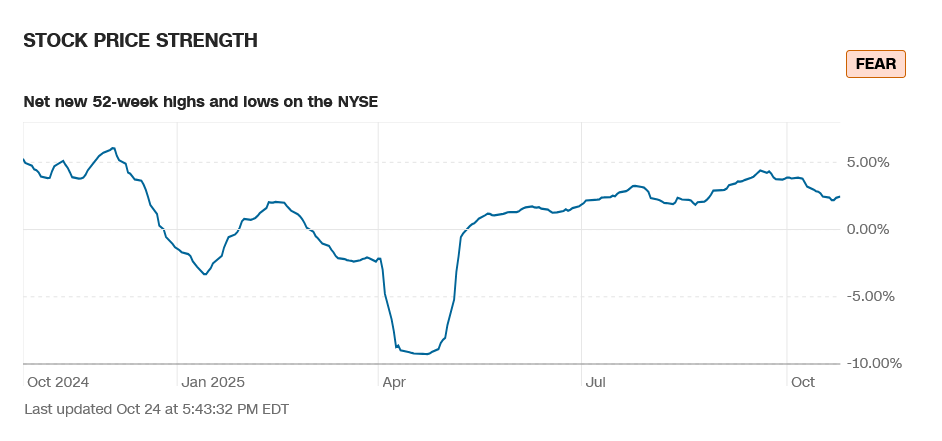
CNN Fear & Greed Index
 AAII Investor Sentiment Survey
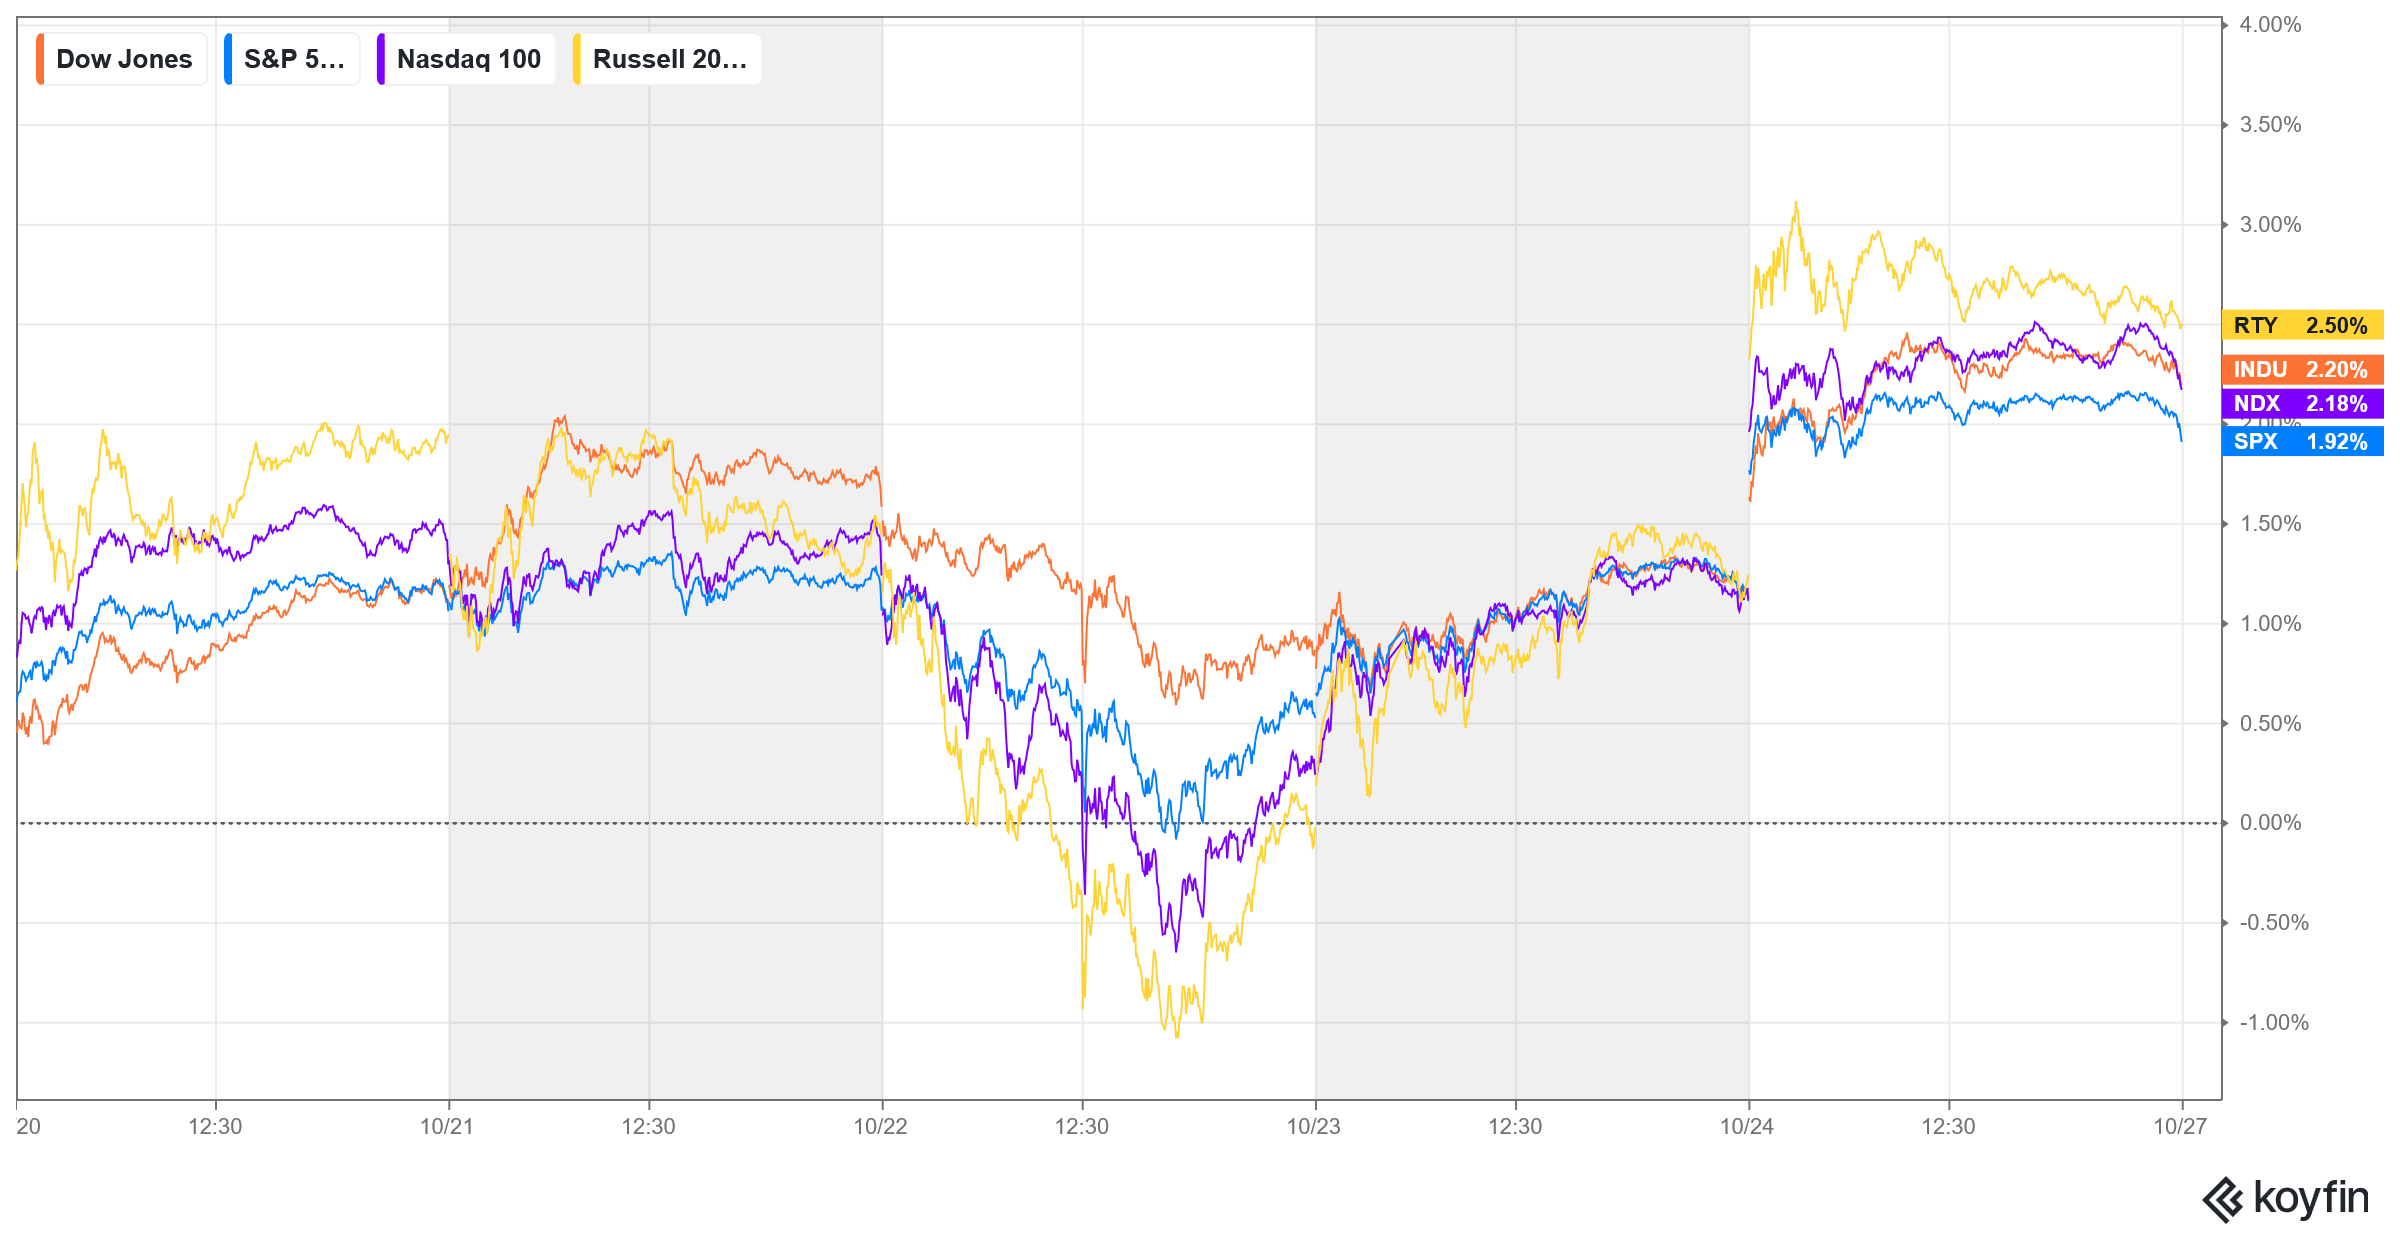
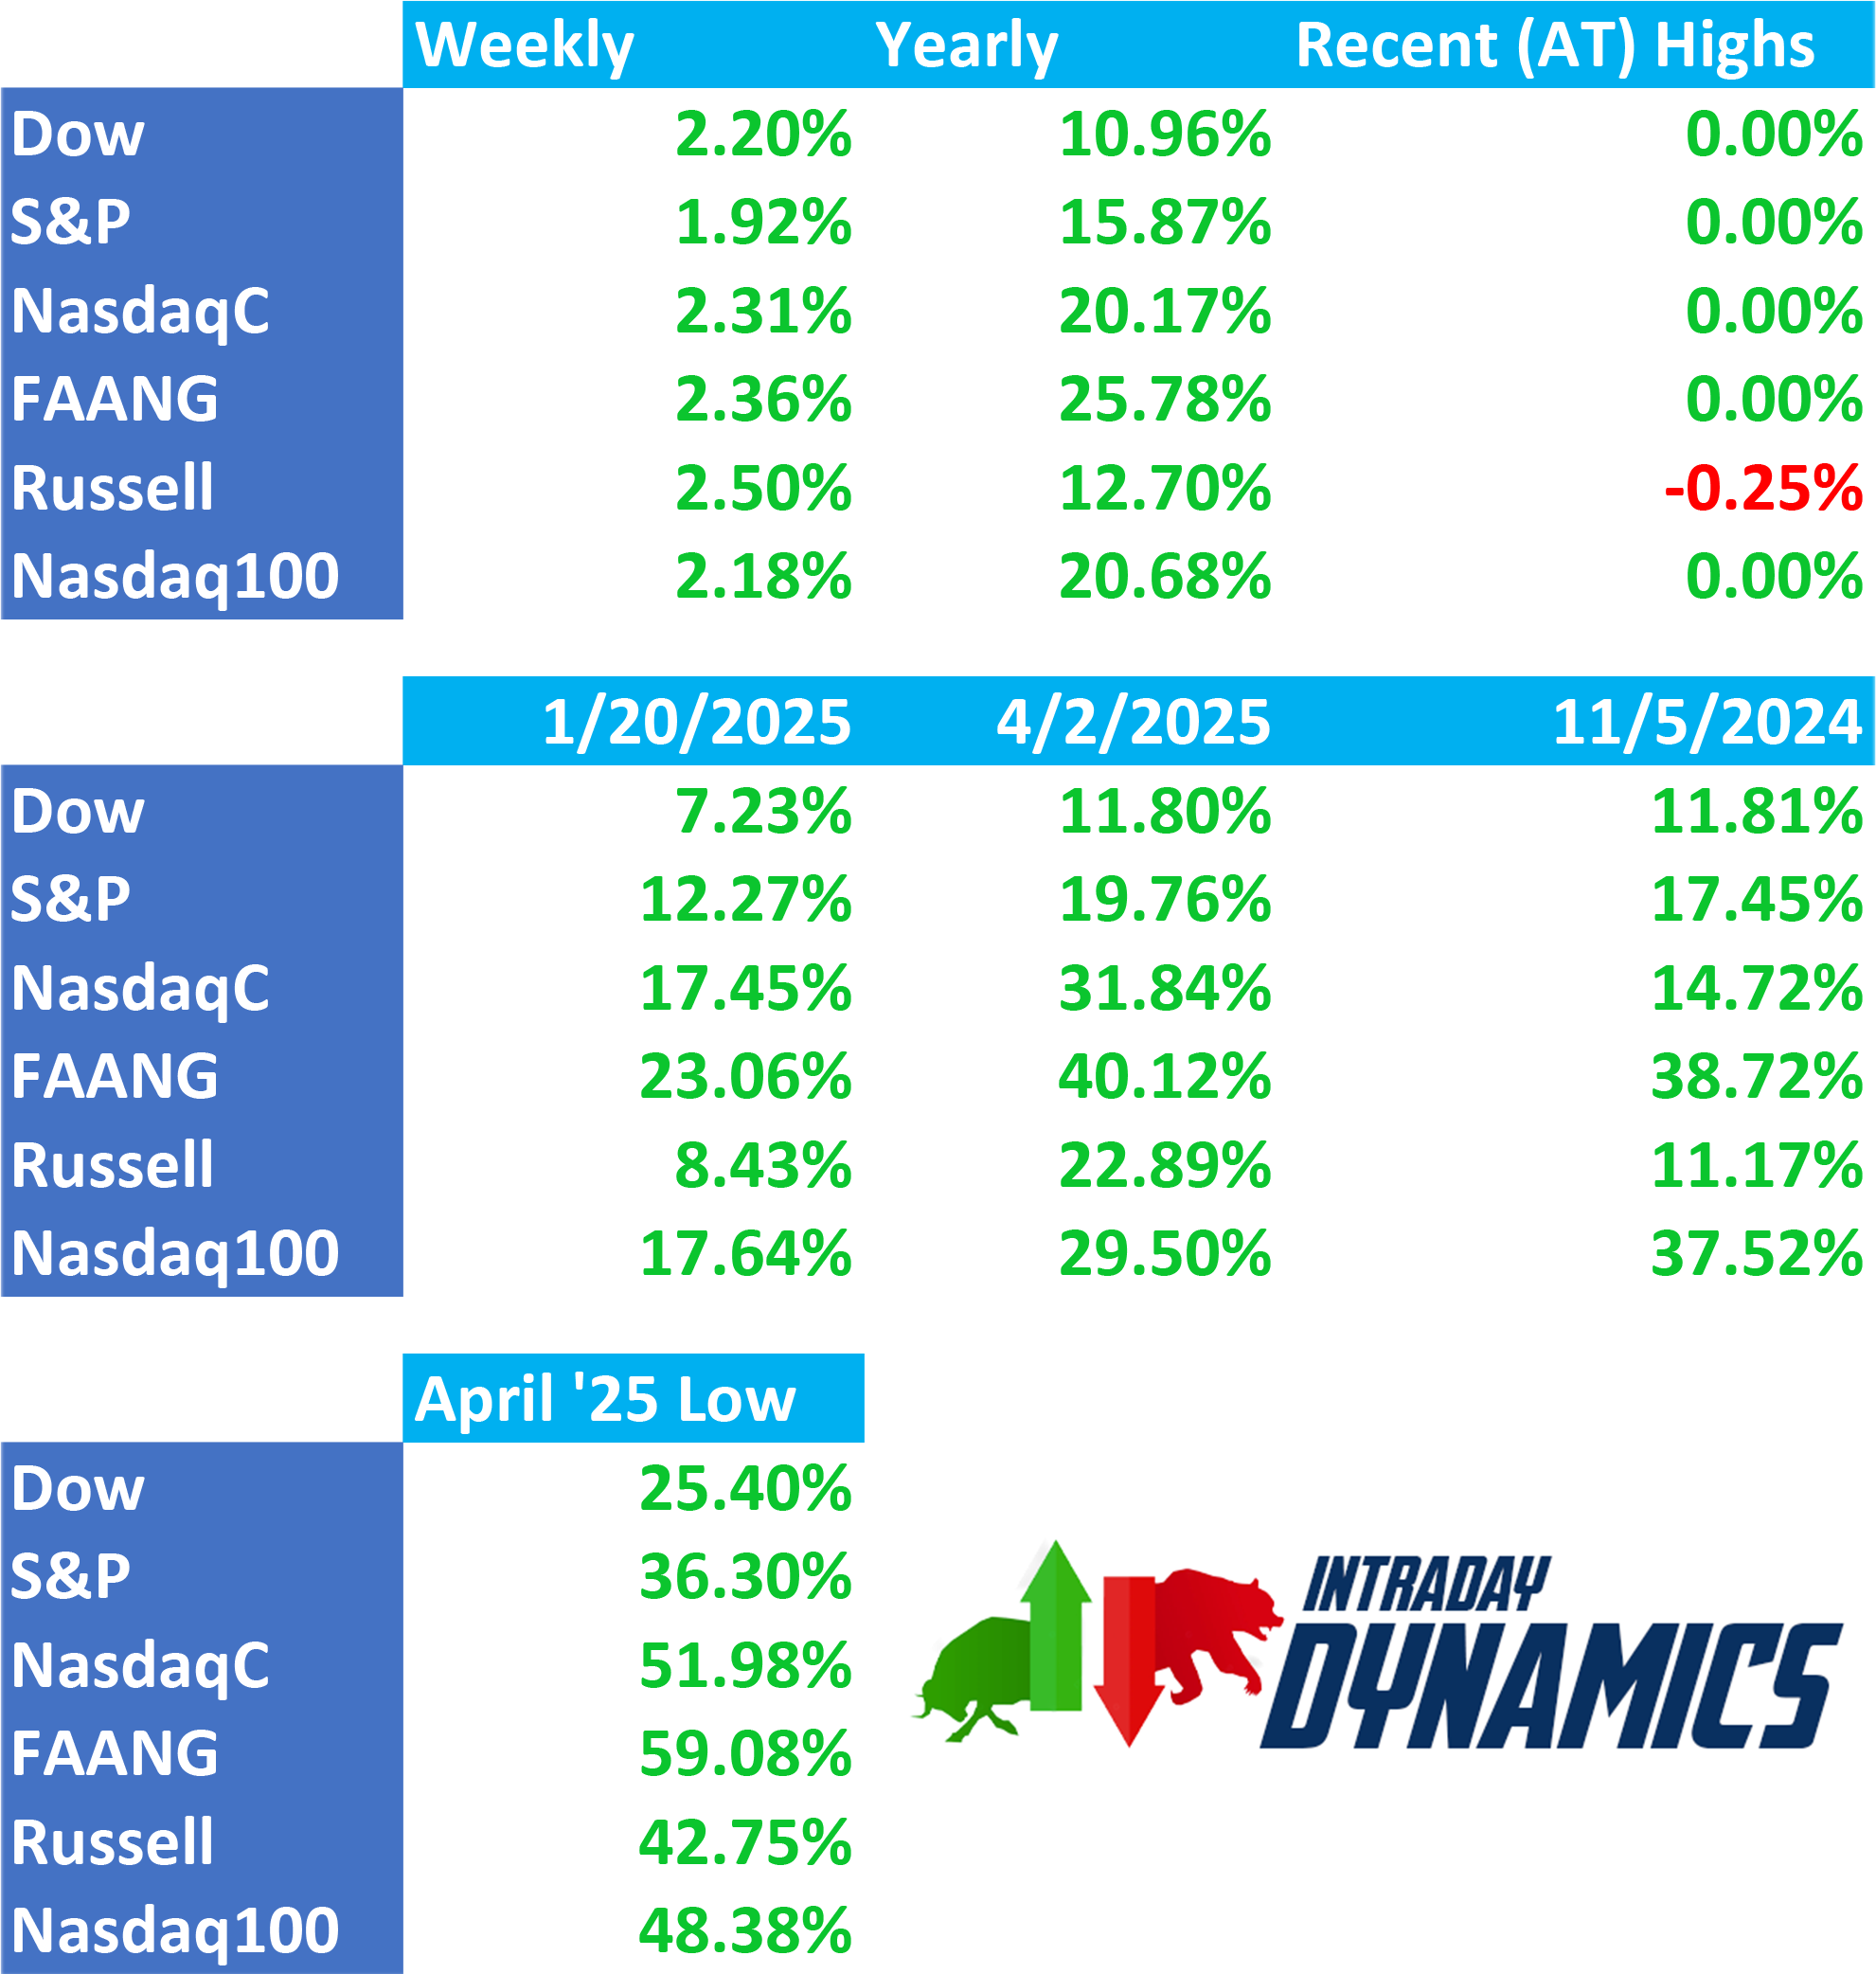
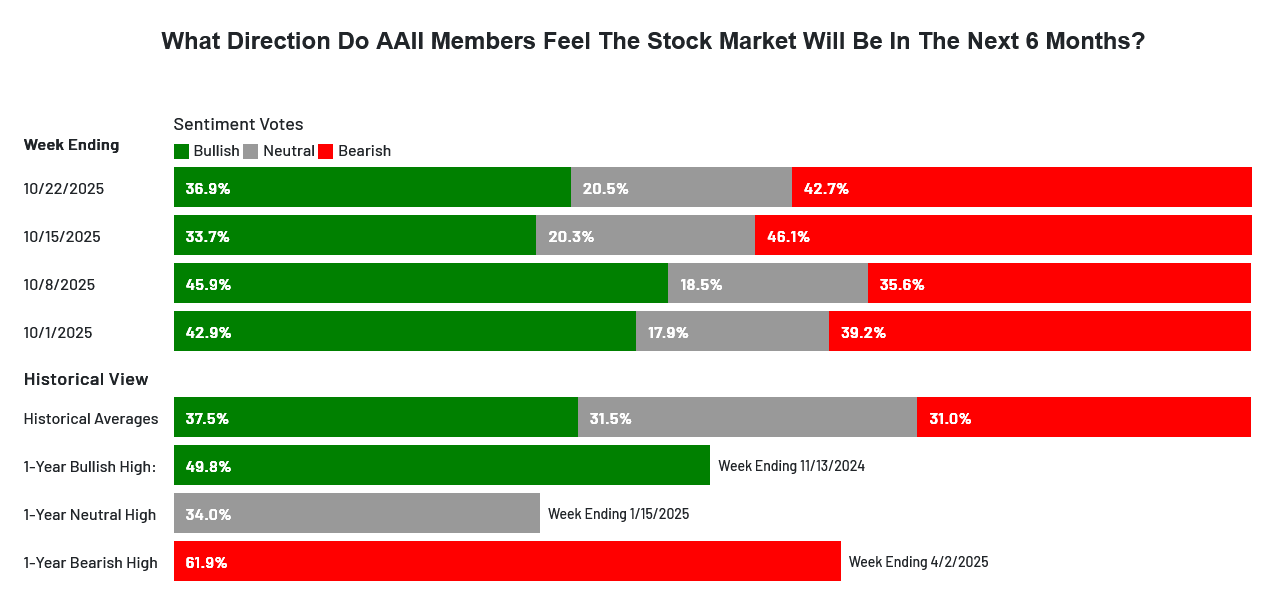 The CNN Fear and Greed Index is 33 and reads fear. Breadth improved on the week but sentiment still reads extreme fear. Latest AAII Sentiment Survey: Pessimism Dips . The Dow A/D improved to 6997. The VIX collapsed sharply on the week, backing off the previous week’s five month highs and closed down -21.22% on the low of the range. The Put/Call closed at 0.67 and reads fear. The 52-week, A/D was flat at +2.46% and reads fear. The Dow closed the week up +2.20%, closing in the top of the range at an ATH. The S&P traded to record high territory and settled up +1.92%. The Nasdaq Composite was up +2.31% and the Nasdaq 100 was up +2.18%. The NYSE FANG closed up +2.36% into record high territory. The Russell was up +2.50% in the top of the range. The 10-year notes closed unchanged on the bottom of a tight inside week’s range. The yield on the 10YR was flat at 4.003%.
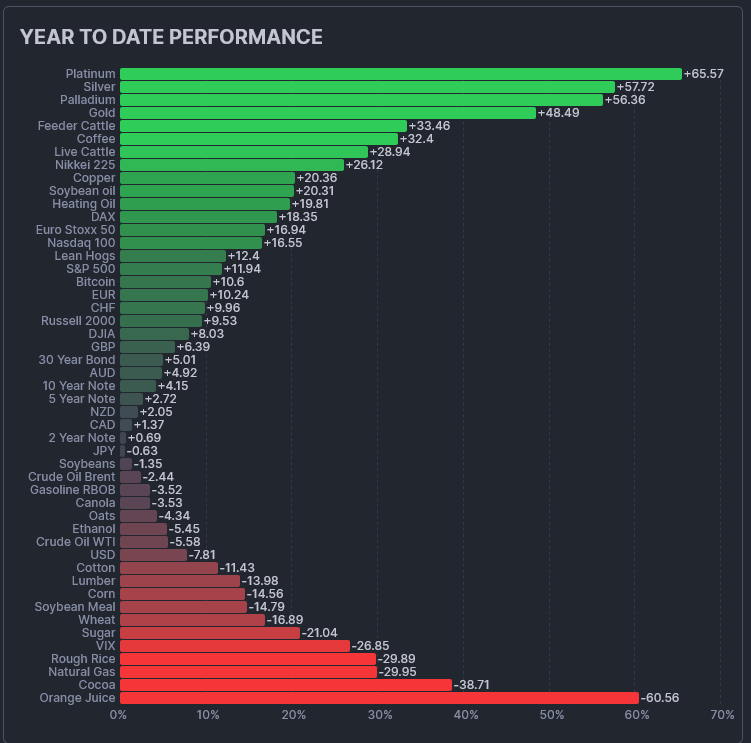
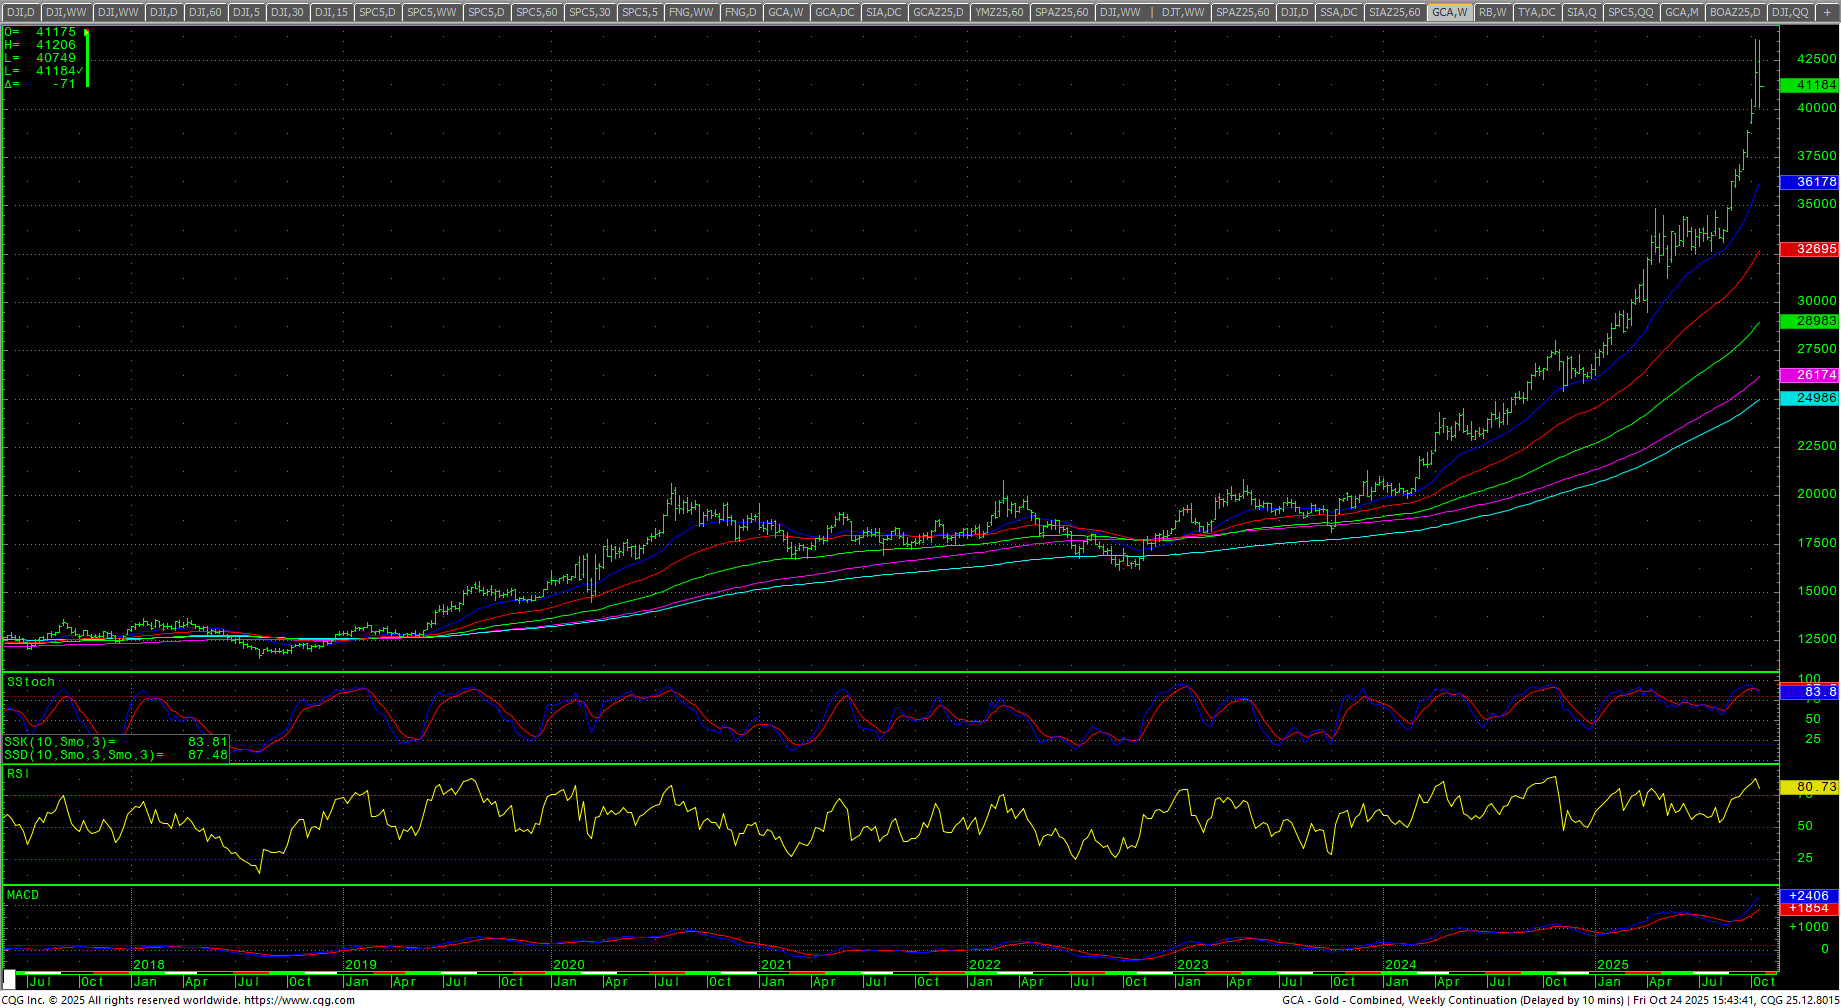
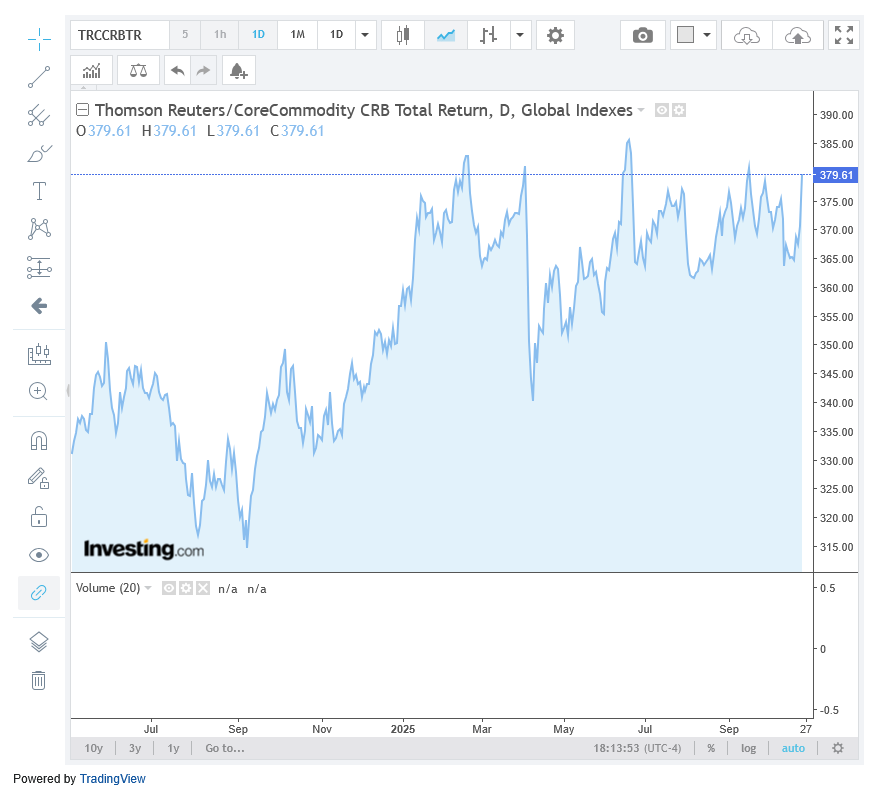 The CRB Index was up sharply as oil rebounded from the artificial floor at $60 with the index up +3.88%.. Gold crashed early in the week with prices plunging nearly 10% off the recent highs. There is no CFTC data with the government shutdown.
Timing Points
Tuesday/Wednesday marks critical timing.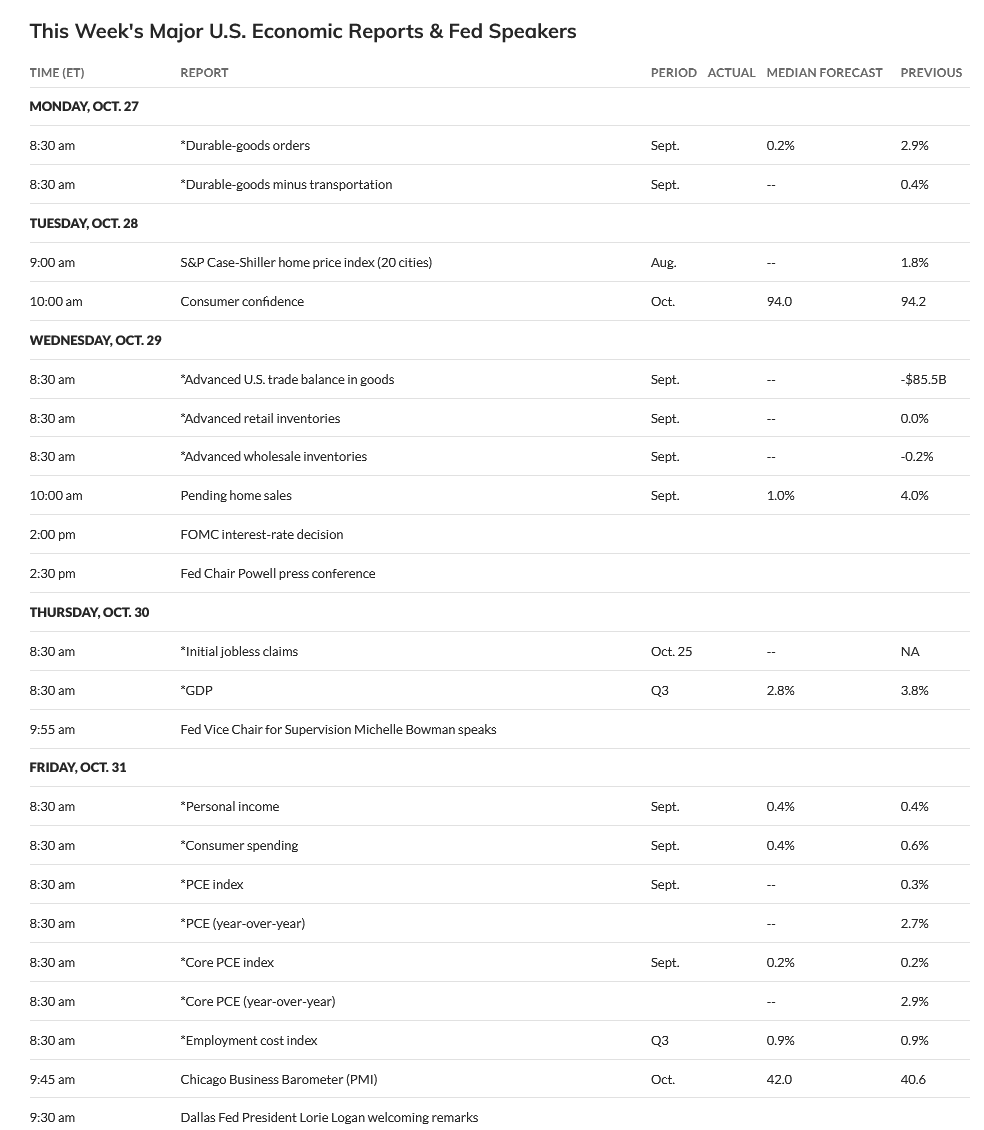
- 10/28-29 *** X
- 11/05-06 *** X
- 11/14 **
- 11/19-20 ***
- 11/25 **
- 12/04 ***
- 12/15 *** X may run through
- 12/17 *** X key to bonds/interest rates
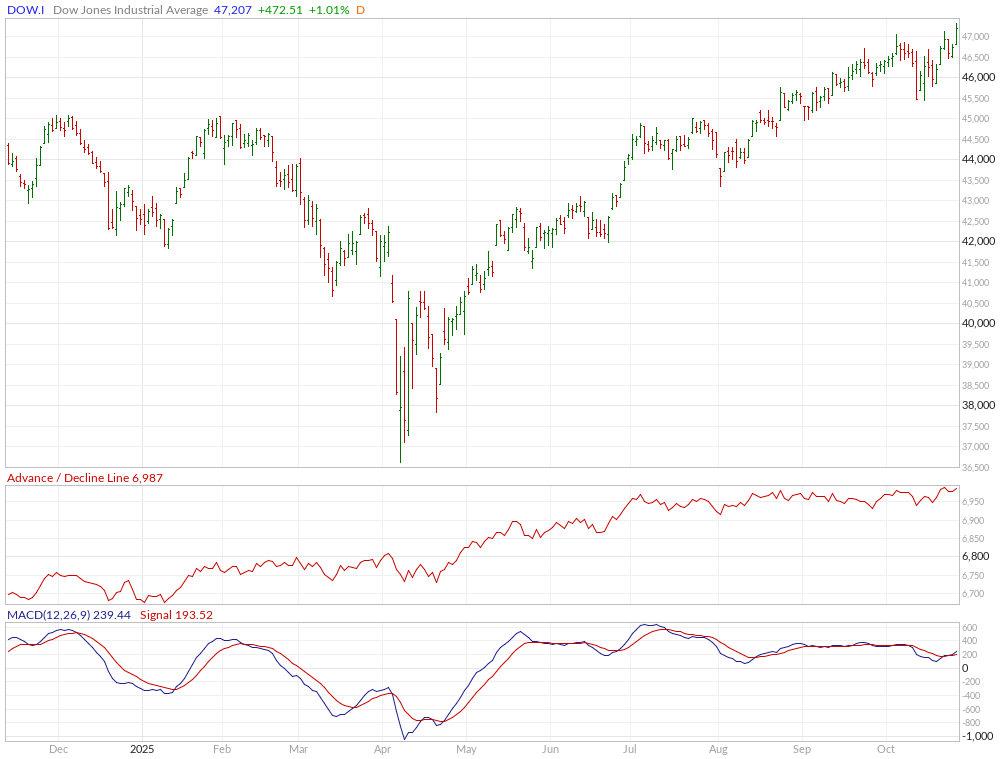
Dow Jones Industrial Average
Dow Jones Industrial Average Weekly H-L-C
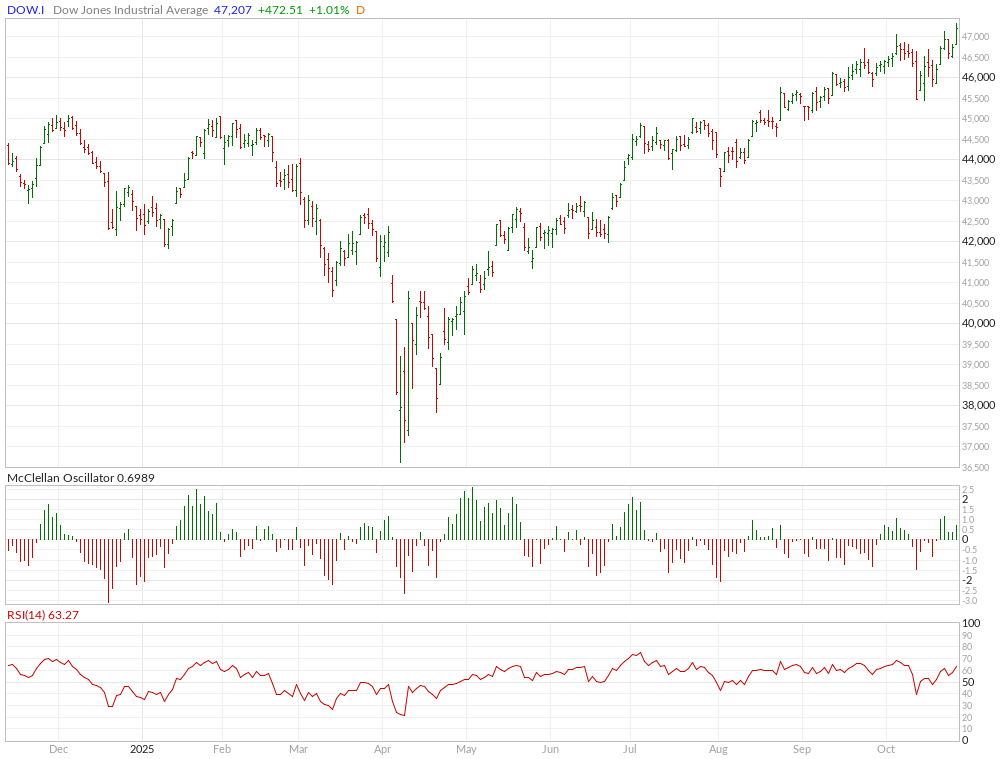
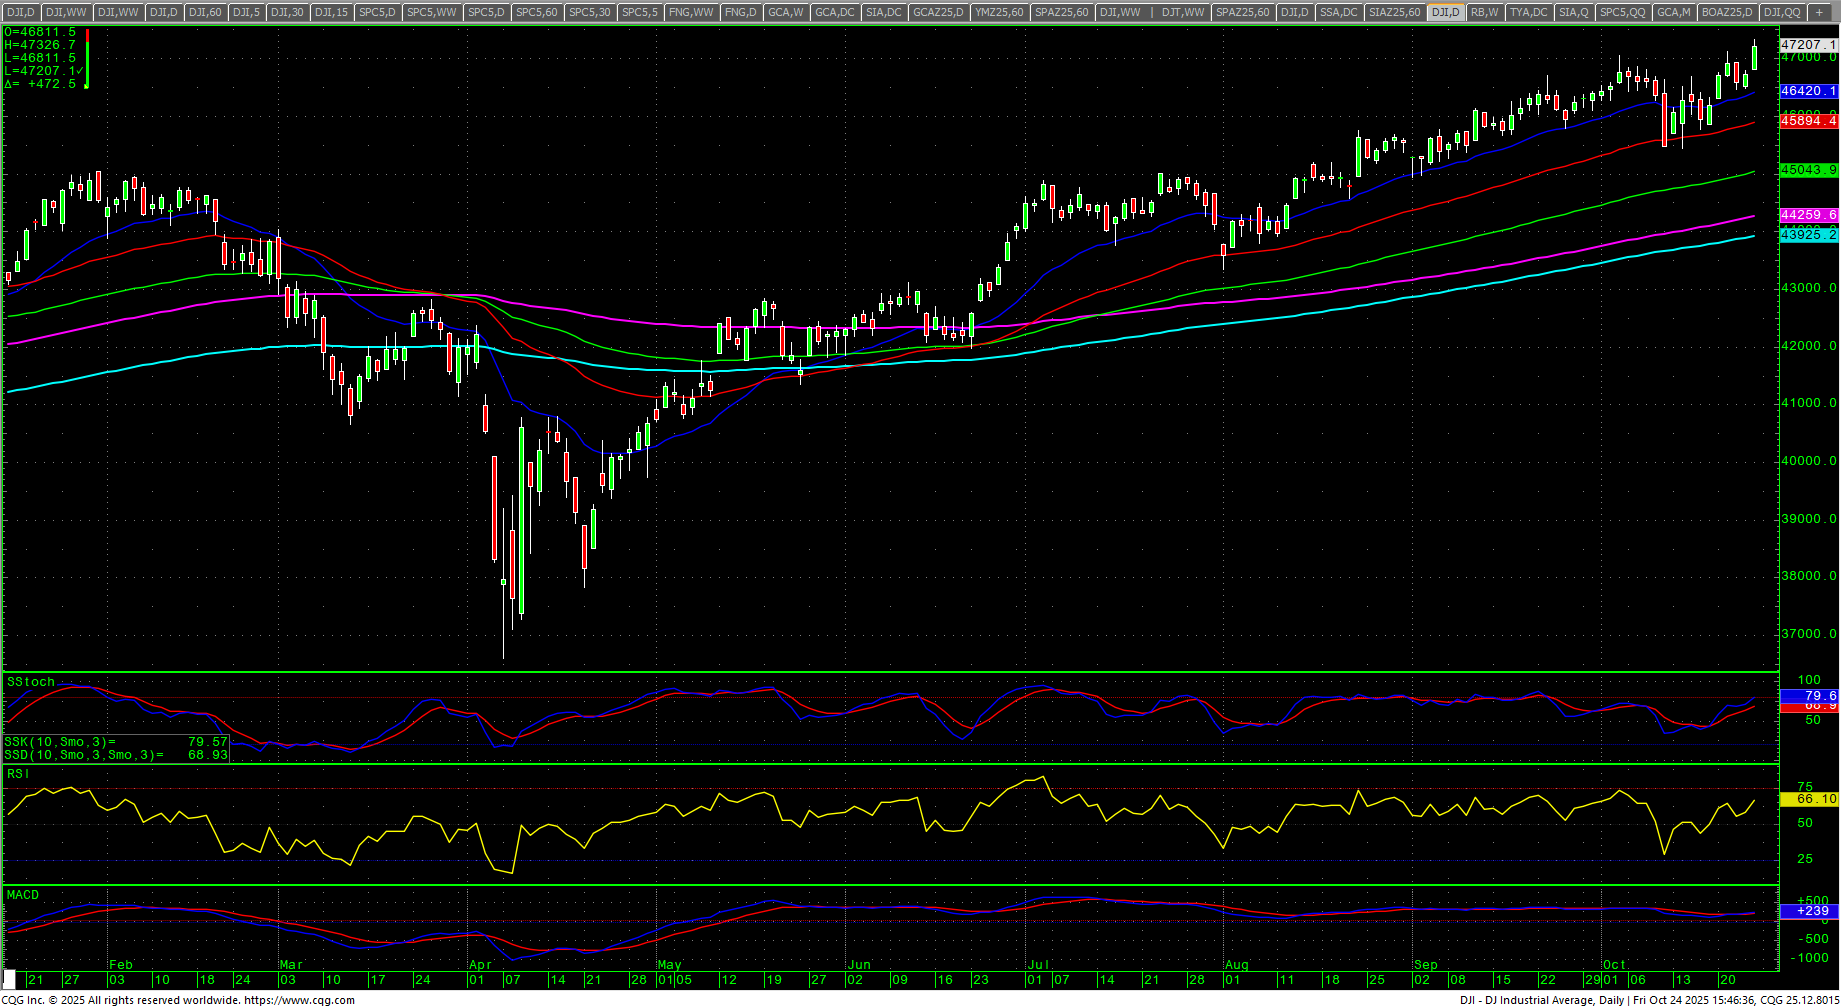
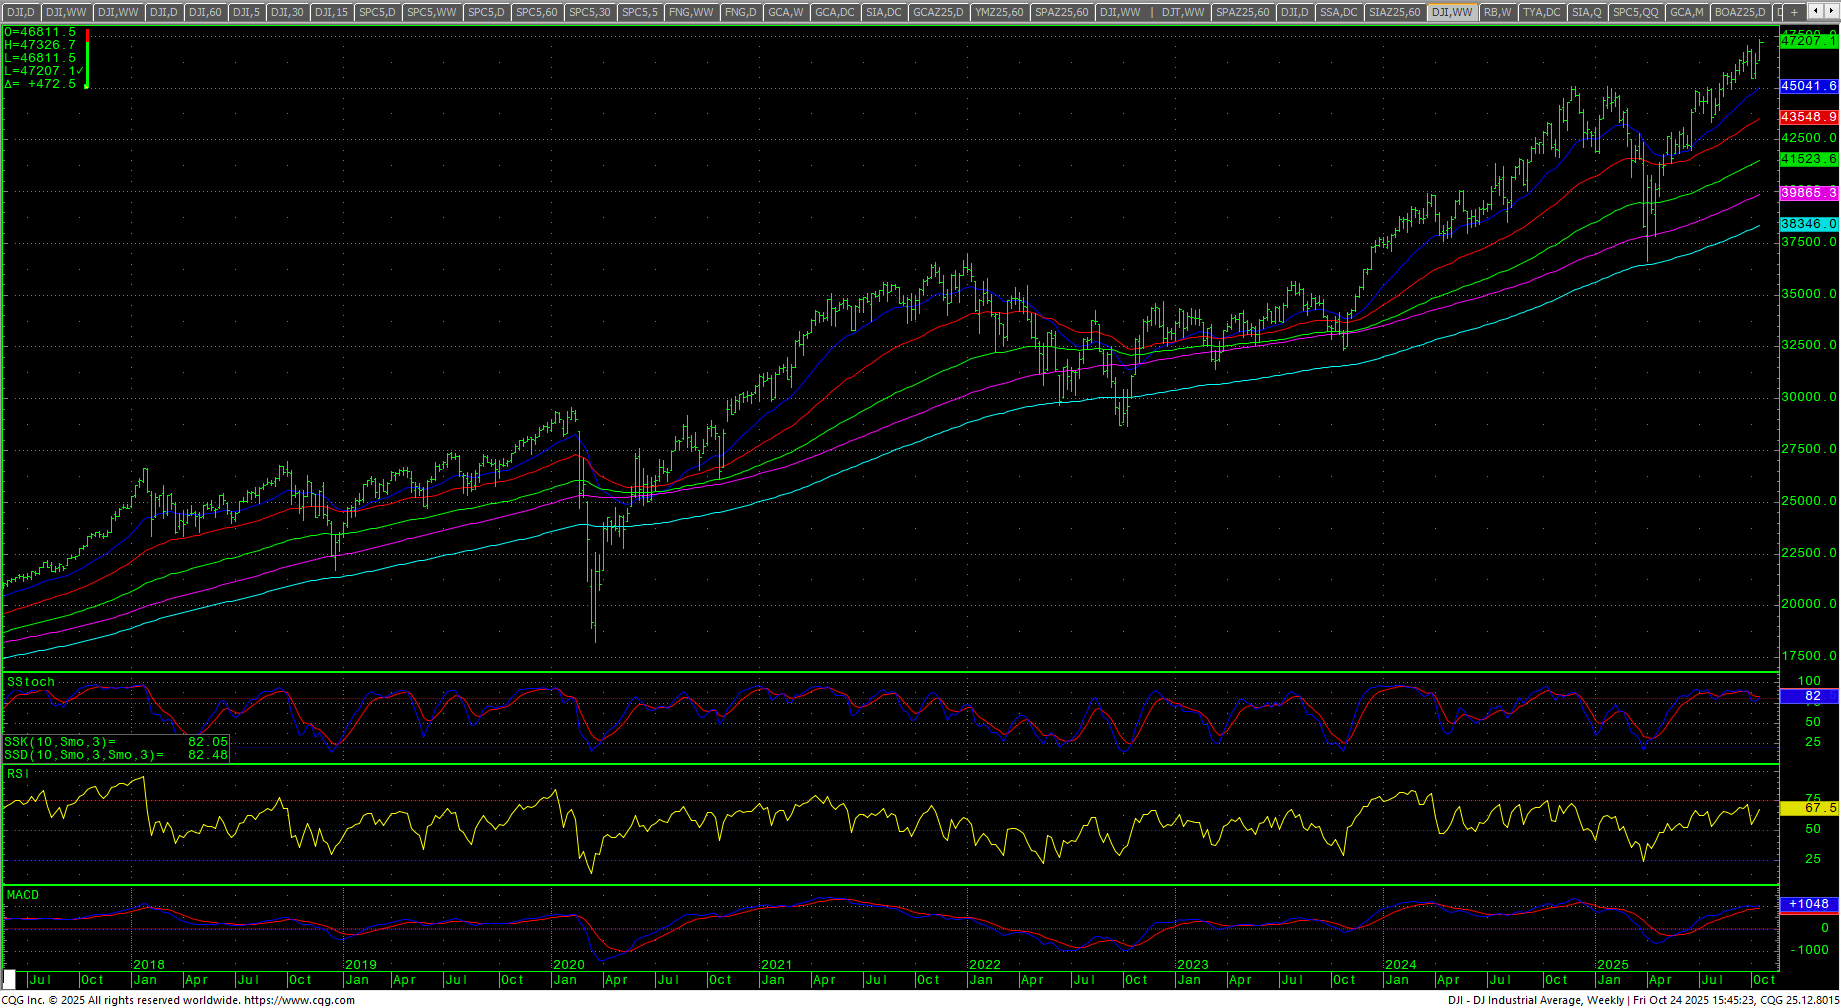 The Dow closed the week up +2.20% on top of the week’s range at record highs. Prices gapped up on Friday and just continue the bullish pattern of shrugging off the bearish divergences in the oscillators. The daily stochastics hooked higher and the MACD crossed up and both remain in preliminary bearish divergences. The daily RSI improves to 66.10. The 200-day MA starts the week at 43925.20 and is at record highs. The weekly is neutral with a bearish divergence.
Dow Jones Industrial Average Weekly Candles
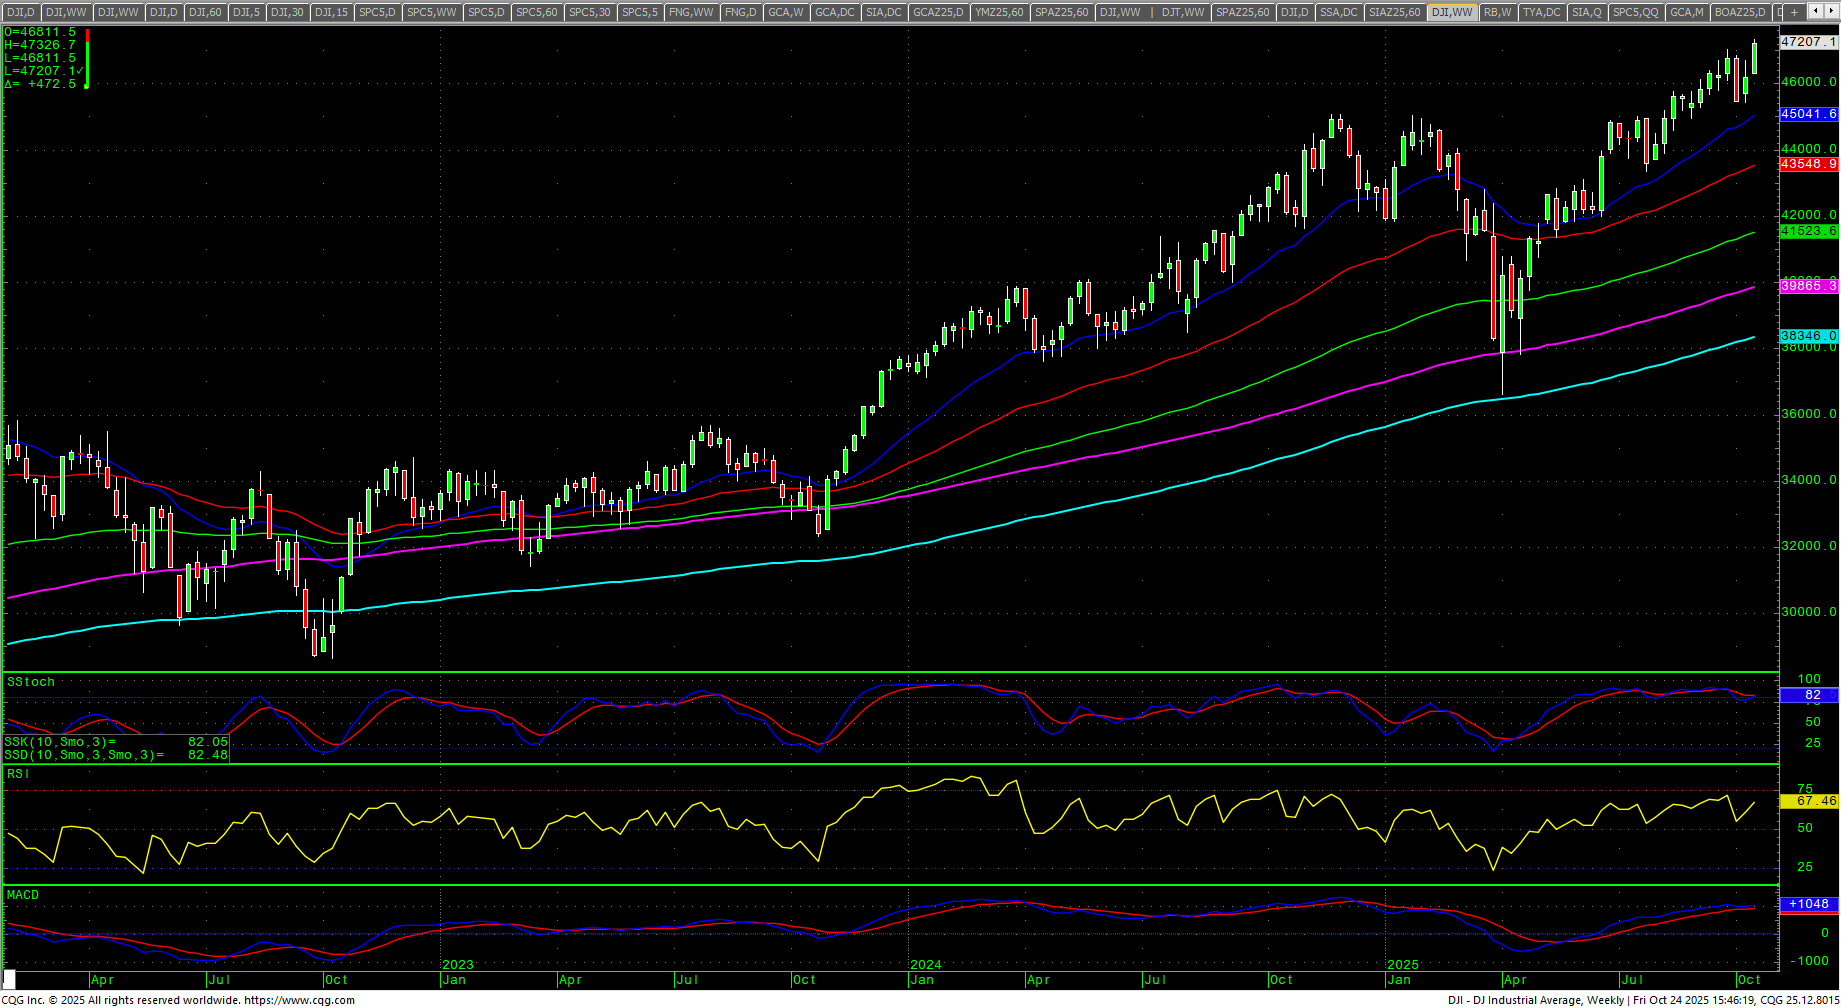 Prices cleared some key resistance levels. Resistance remains at 47286 and further rallies give full counts toward critical resistance of 47400/47430. Closes over 47430 will open counts to 47502 and 47574. Closes over 47574 setup a drive toward 47718 with counts toward 47862. Daily closes above 47862 open counts to 48078 with potential to 48222.
Dow Jones Industrial Average Hourly H-L-C
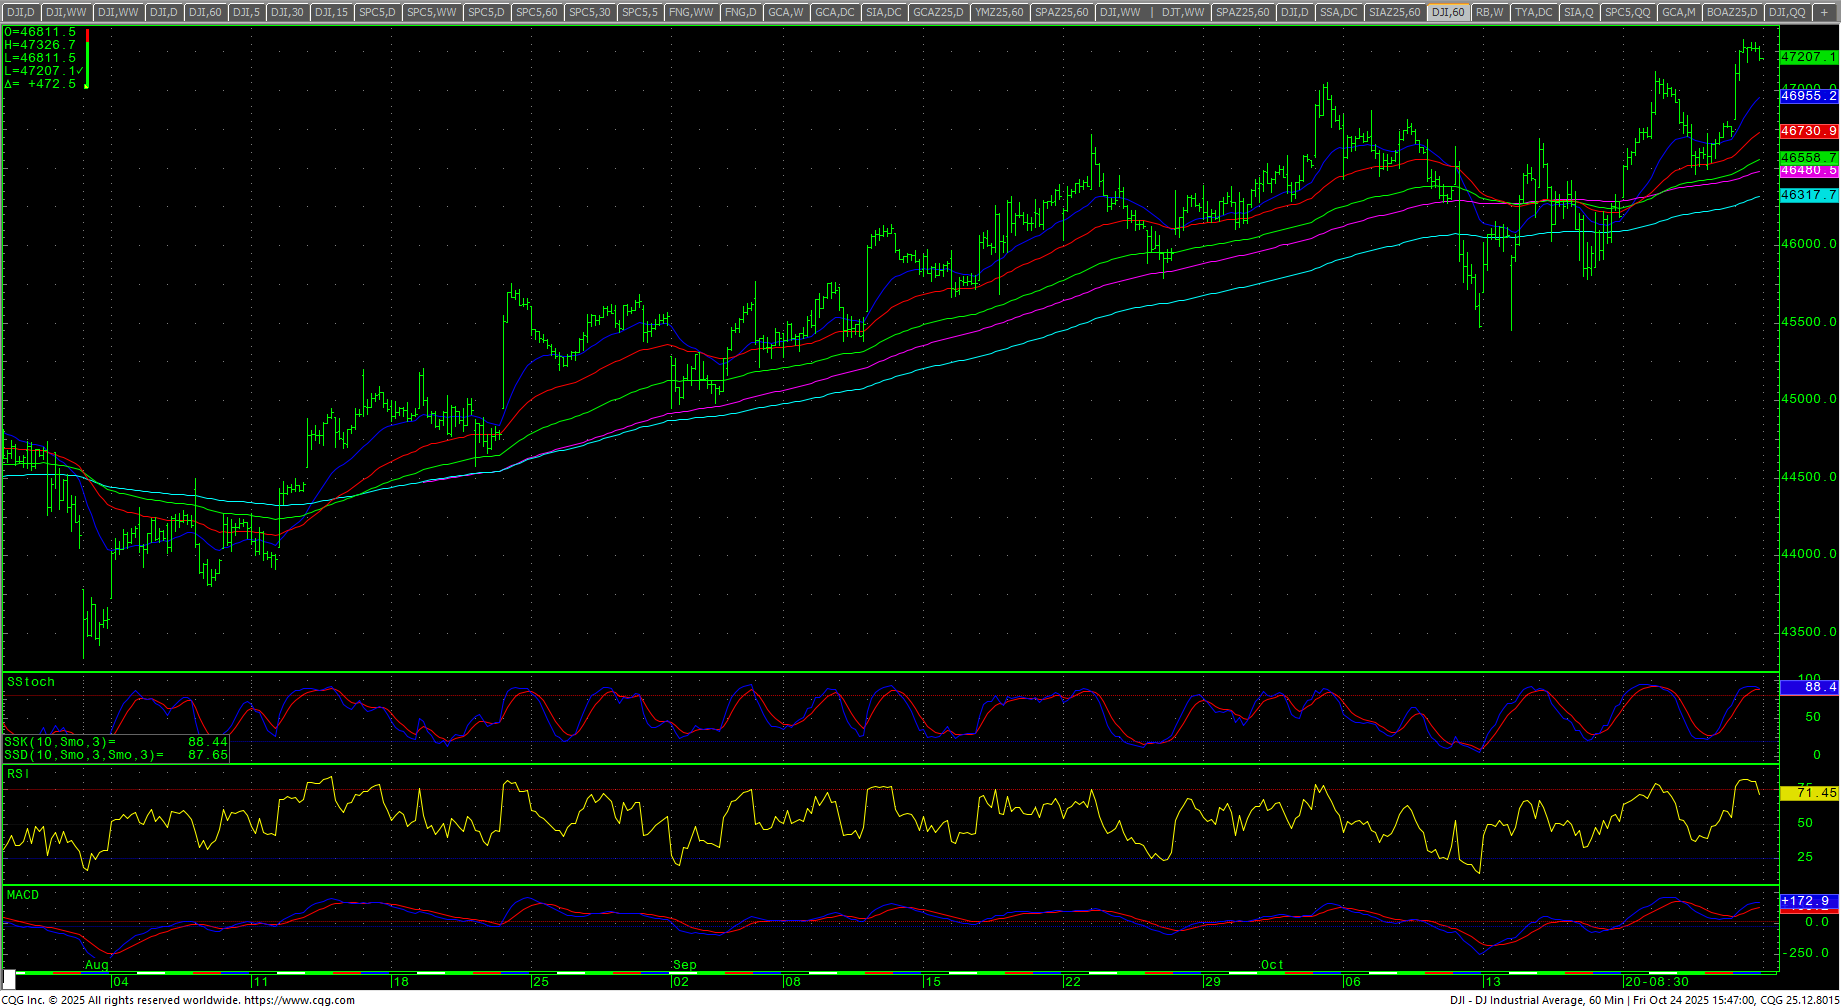 The hourly is overbought on Friday’s close. Support is 46884 and 46610. A breakdown under 46610 sets up 46389 with counts to 46168/46165. Closes under 46165 should test 46385 with full potential to 45804/45800. A breakdown with closes under 45800 sets up 45452 and 45333 with counts to critical short-term support at 44863/44860. Daily closes below 44860 can carry to 44337 and 44281.
Dow Jones Industrial Average Daily Candles
| Resistance | Support |
|
|
S&P 500 Cash Index: SPX
S&P 500 Index Weekly H-L-C
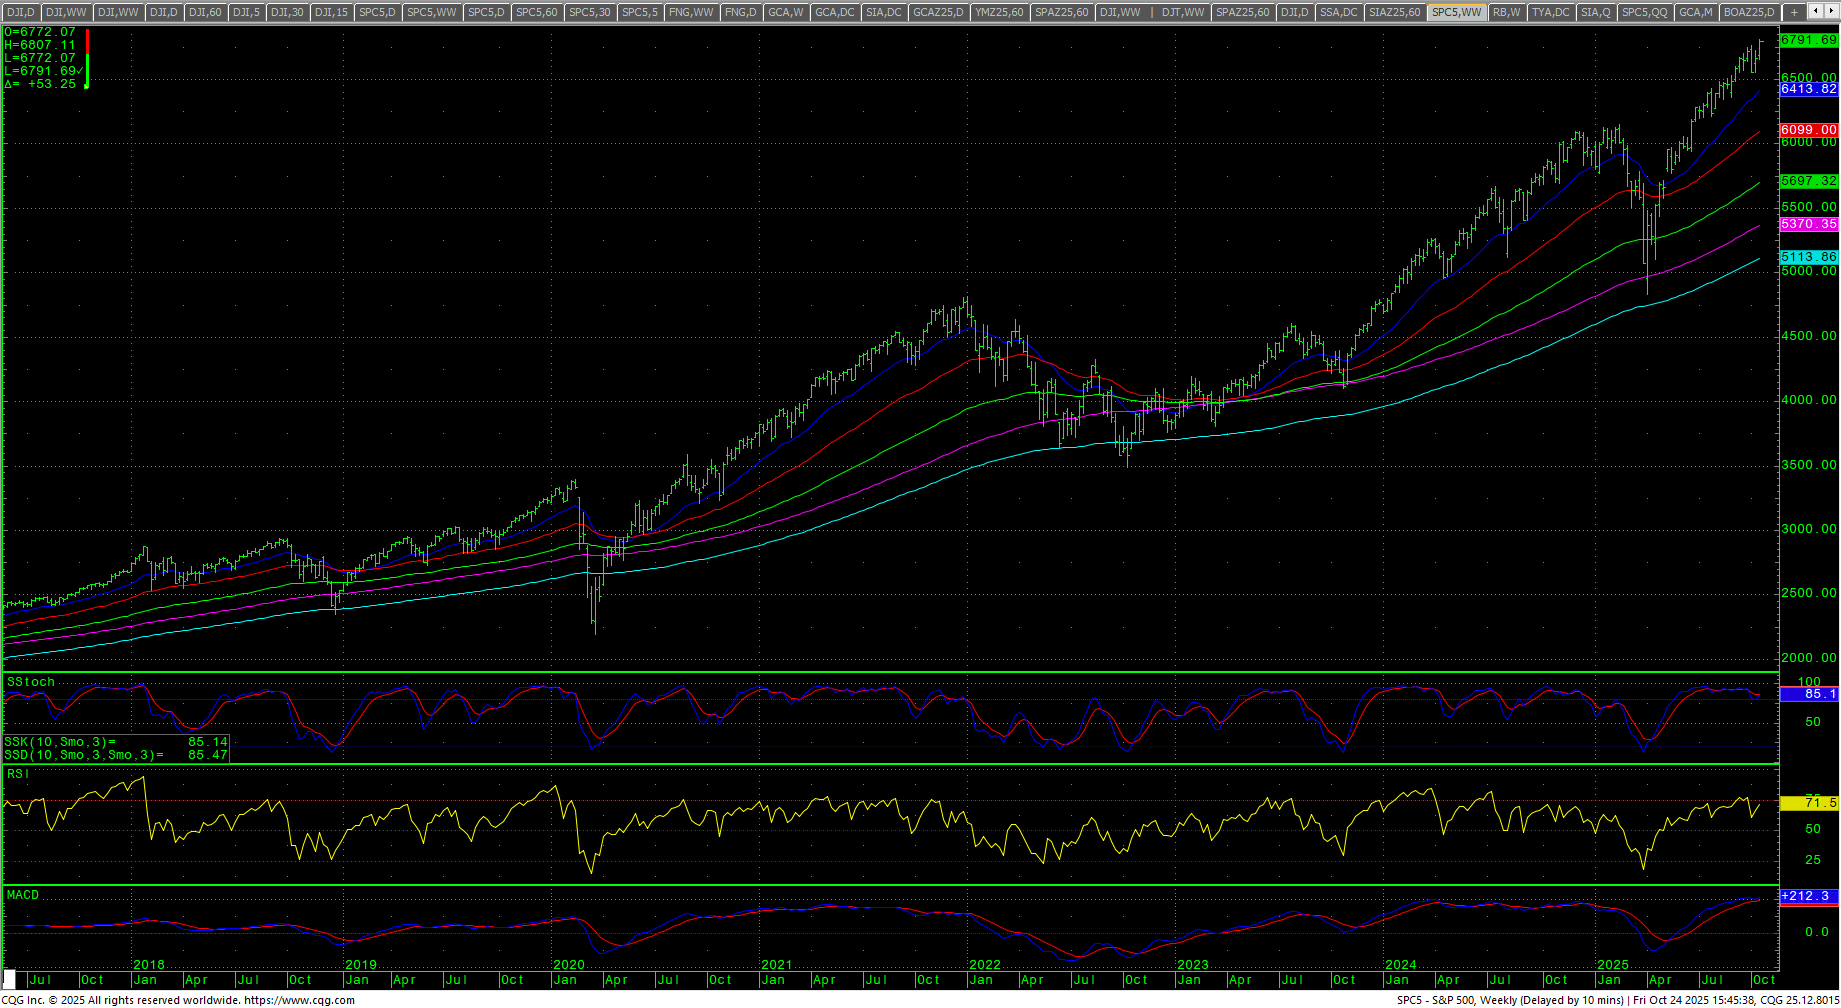 The S&P gapped higher on Friday as prices cleared the 6800 level into record highs. Prices traded higher all week and closed on the top of the weekly range. The weekly is neutral with preliminary bearish divergence. The SPX ended up +1.92% on the week. The daily has hooked higher in the stochastics and MACD crossed up and they both remain in multiple bearish divergences. The daily RSI recovered to 64.68. The hourly is overbought with Friday’s rally. The 200-day MA is 6178.50 and at record highs.
SPY Weekly Candles
 Resistance is 6800 with the swing high at 6807. Closes over 6800 can carry to 6872 and 6908. Closes over 6908 have counts to 6944 and 6980 through 7016. A close over 7016 offers counts to 7088, 7160 and 7214. Closes over 7214 setup a drive to 7250 and 7286 while opening counts as high as 7448. Above 7488 counts to 7520 and 7592.
S&P 500 Index Hourly H-L-C
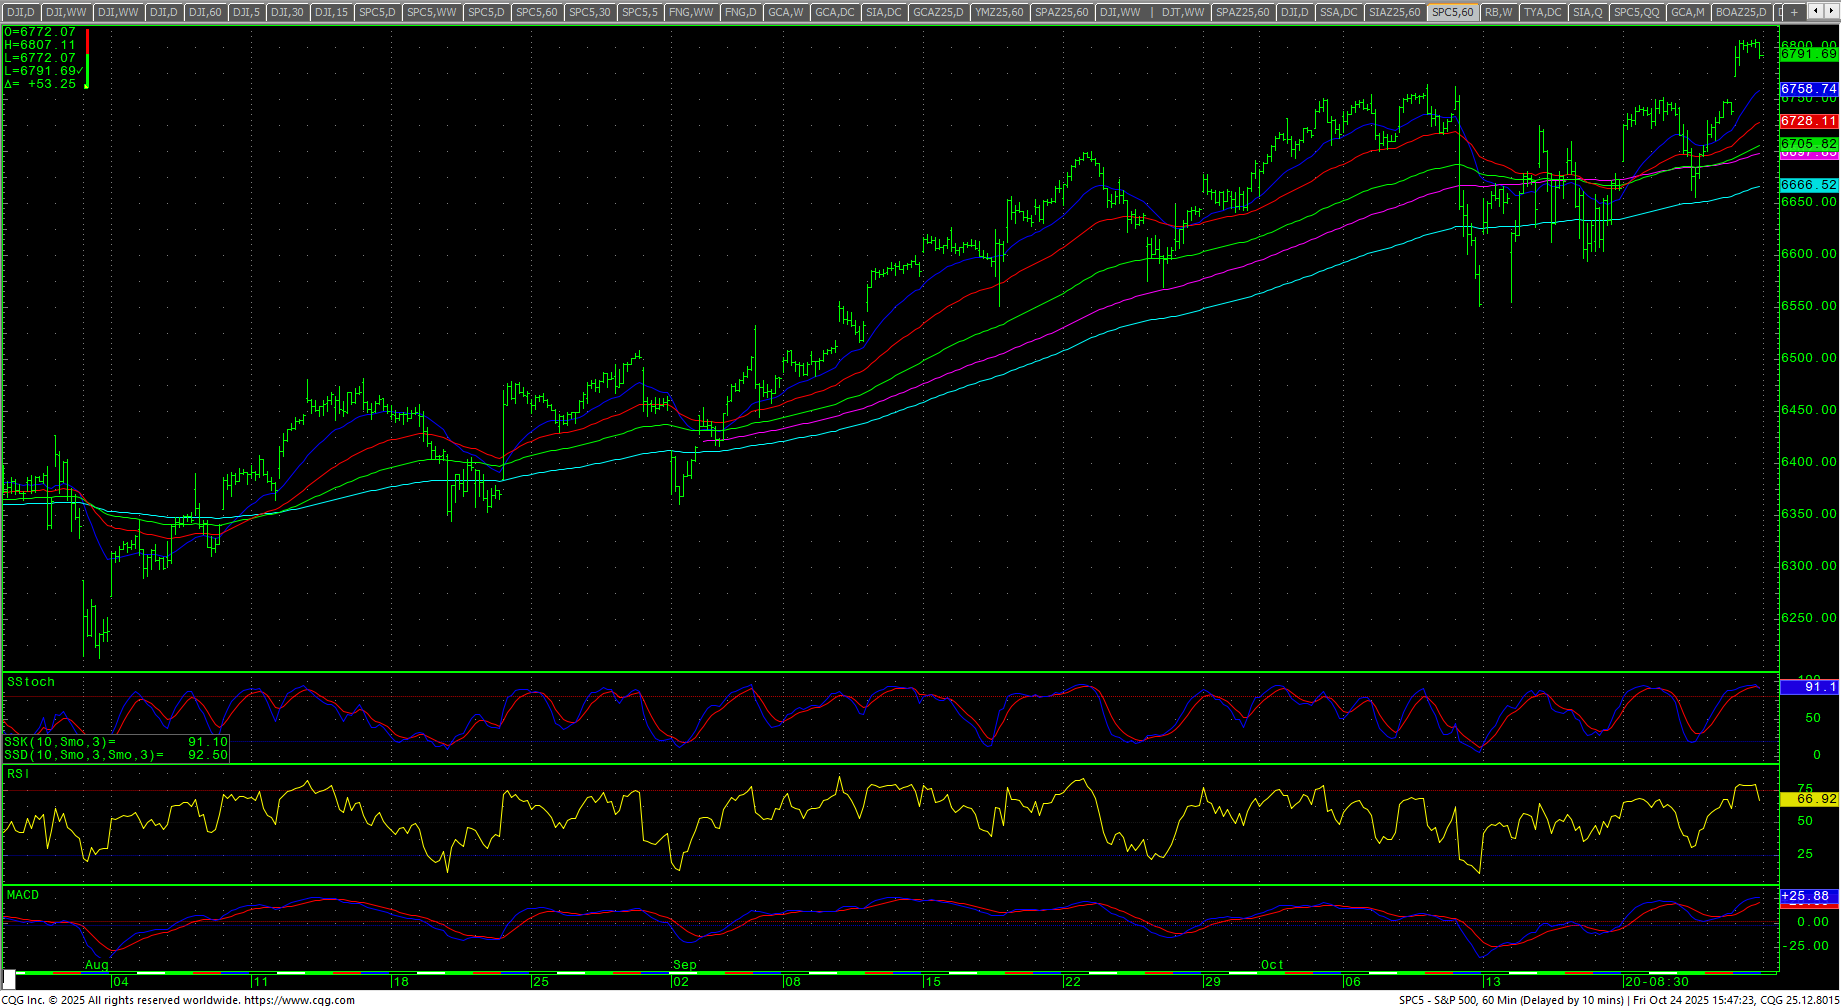 Support is 6637 and 6618/6616. A breakdown under 6616 should test 6594/6591 and retest the swings at 6555/6550. Closes below 6550 suggest a test of pivotal near-term support at 6514/6510. Closes under 6510 open counts to key support at 6361/6360. A breakdown under 6360 should test 6307 with full counts into the 6027/6026 level with critical hourly support at 6212/6201. Daily closes under 6026 should minimally test 5952 and 5799/5798 with counts to 5571/5568.
| Resistance | Support |
|
|
Charts courtesy of CQG, Inc., CNN, Koyfin, Trading View and AAII