
TECHNICAL ANALYSIS (by Intraday Dynamics)
Happy Thanksgiving Week!
 Note: Next week’s update will be support and resistance numbers for DJIA and SPX only. Happy Thanksgiving.
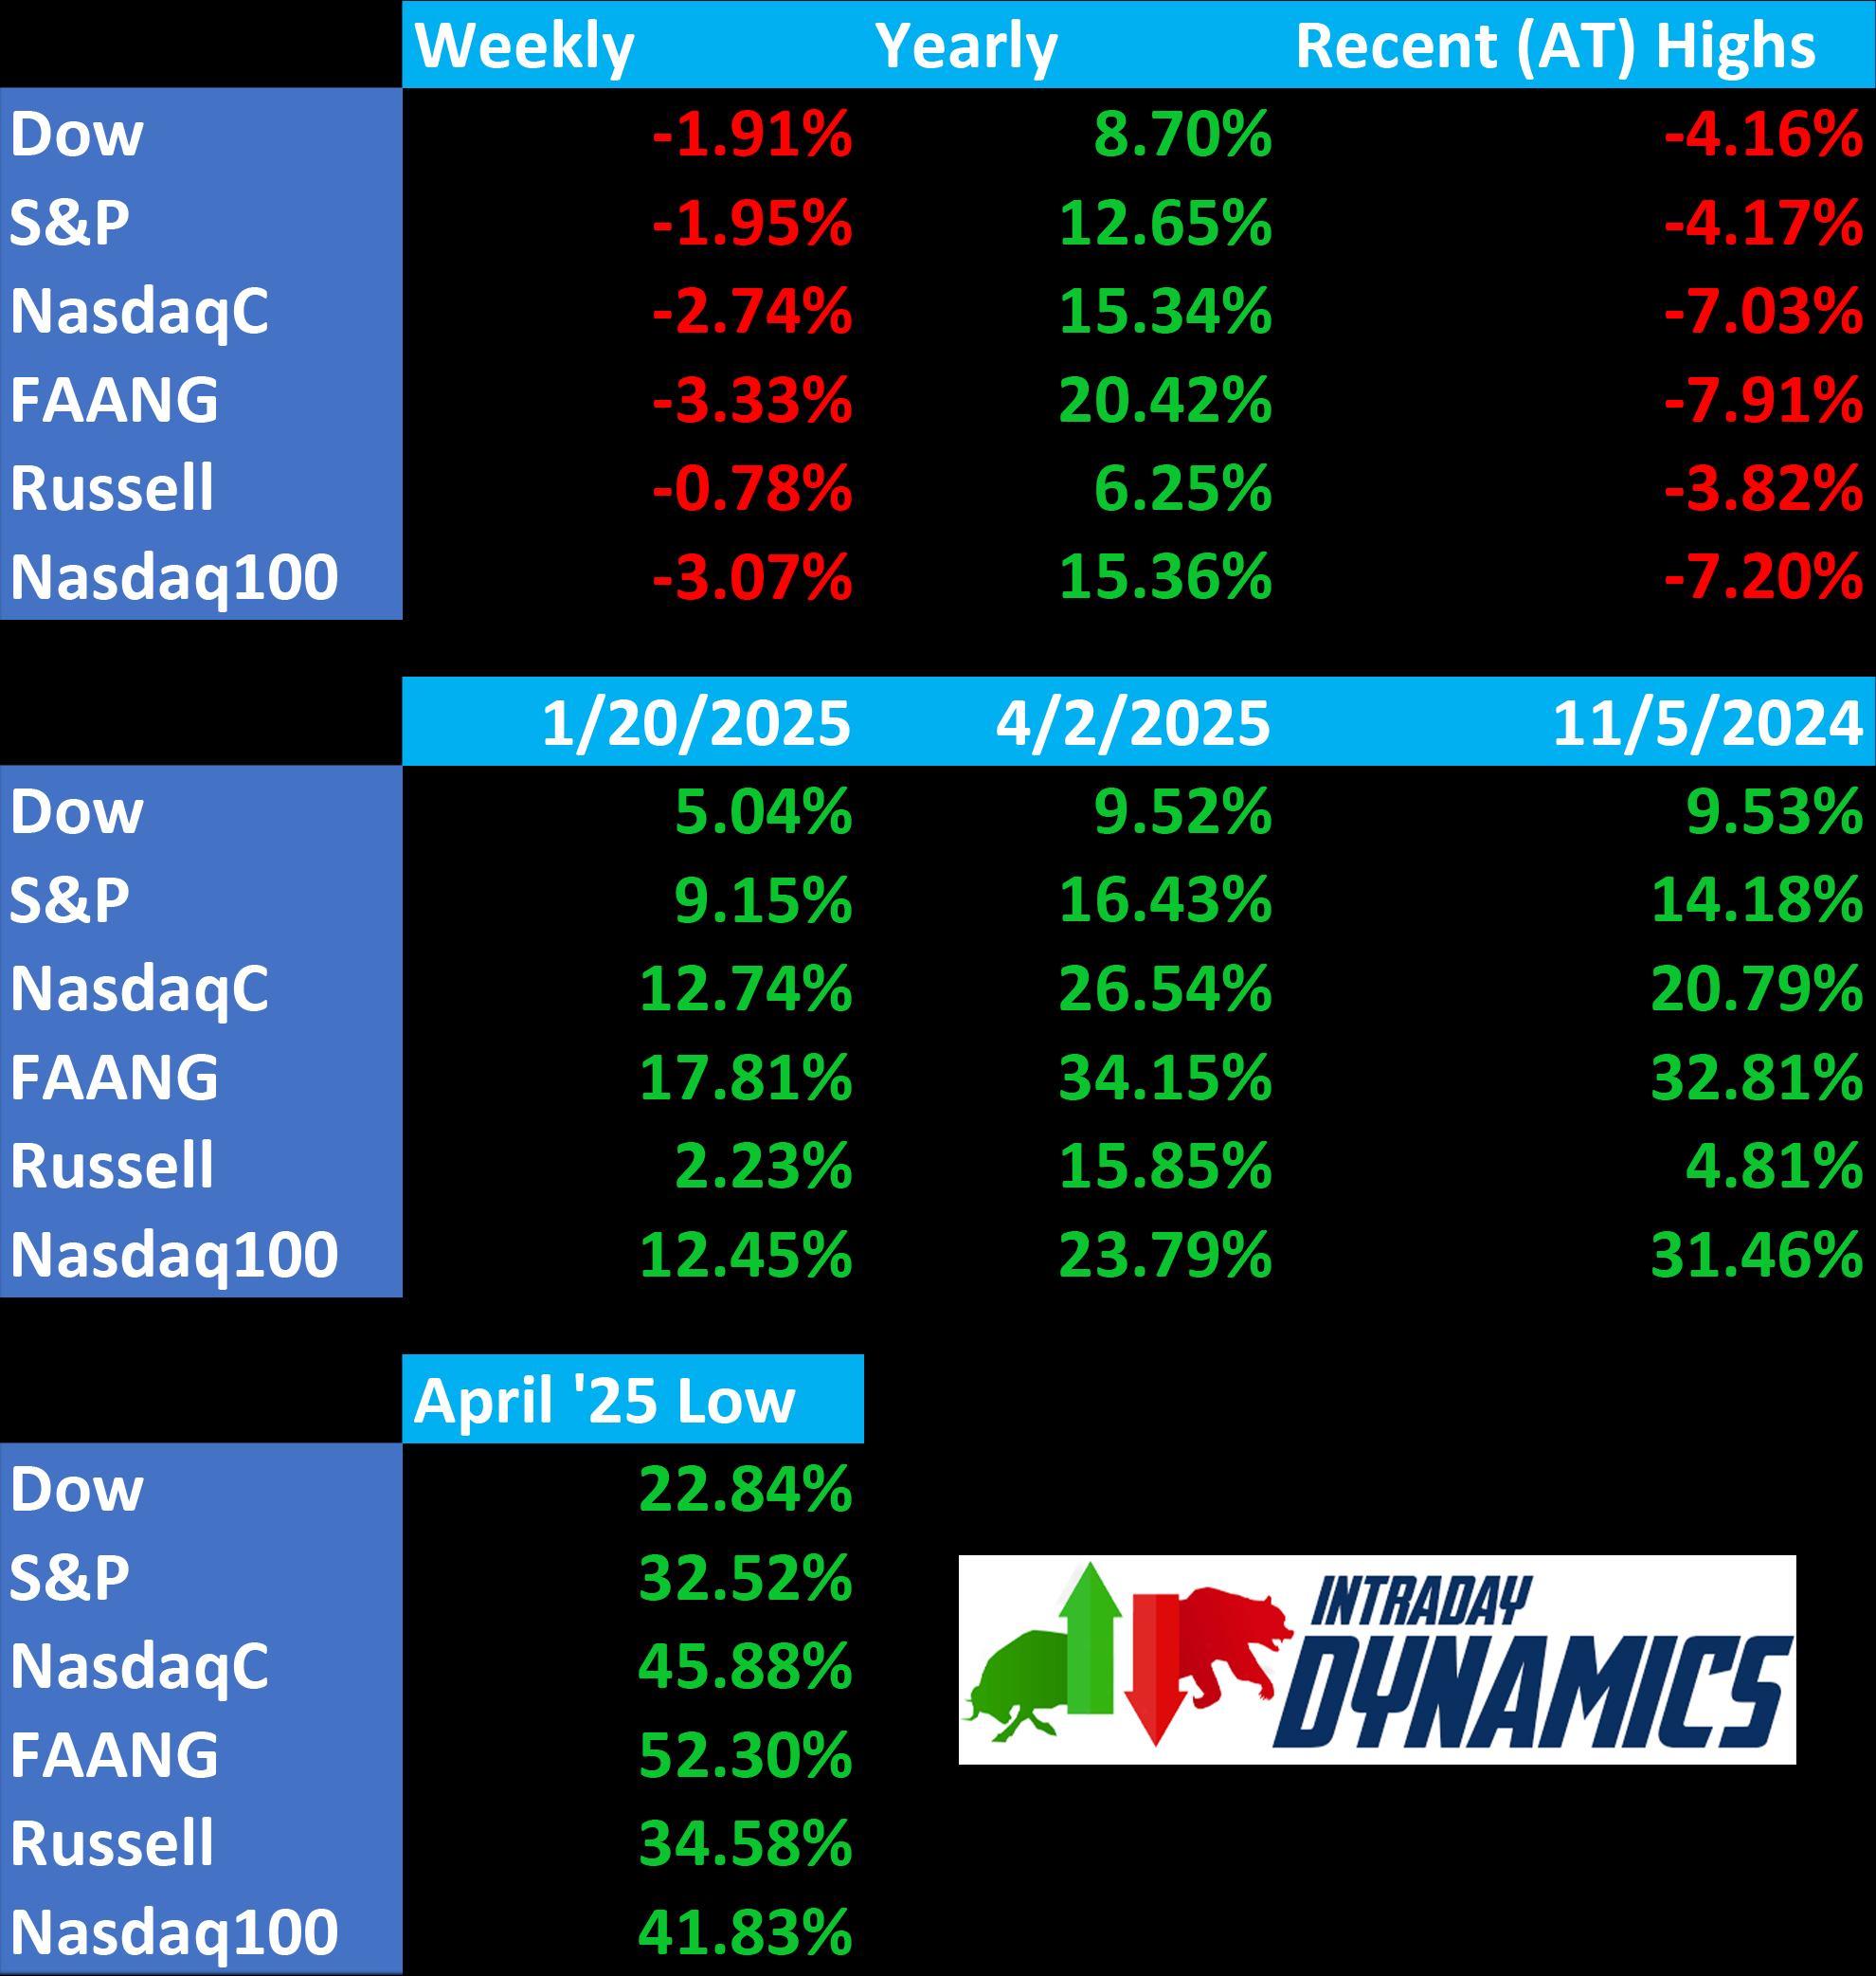
Major Indices Week of November 21, 2025
 NYSE Volume


 As goes tech, so goes the market. Stocks traded down throughout the week with sentiment collapsing into extreme fear while a number of indexes hit some key support levels prior to Friday’s big comeback. For three weeks in a row, Friday has been “Buy Day” for stocks. Secondaries outperformed tech and big caps on the week. Tech is now in that magical -5%/-10% correction area.
Seasonality

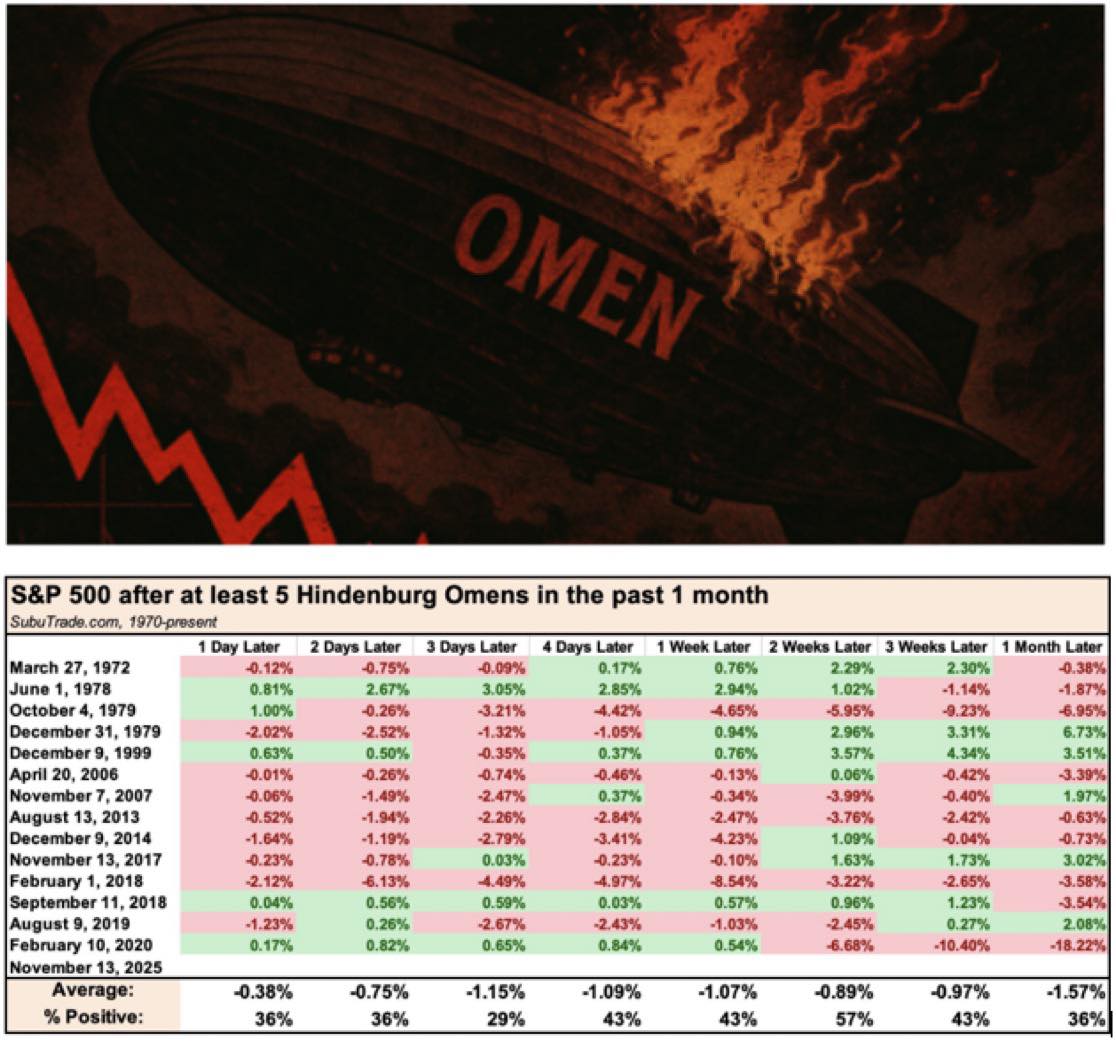 With sentiment hitting extreme fear, prices rocketed higher late in last week’s critical cycle timing. Thursday’s session saw the Nasdaq stage a -4.75% decline from intraday high to intraday low. Volatility is up. Along with five Hindenburg Omens, the stage is set for a December move. The seasonals favor a rally into the end of the year. As the chart above demonstrates, five omens do not guarantee declines. The line on the Street has been that insiders have pressed stocks lower to create value so that fund managers, who remain far behind the major indices, could pad their trading accounts and ensure they see bonuses by year’s end.
AI-Yi Yi Yi Yi
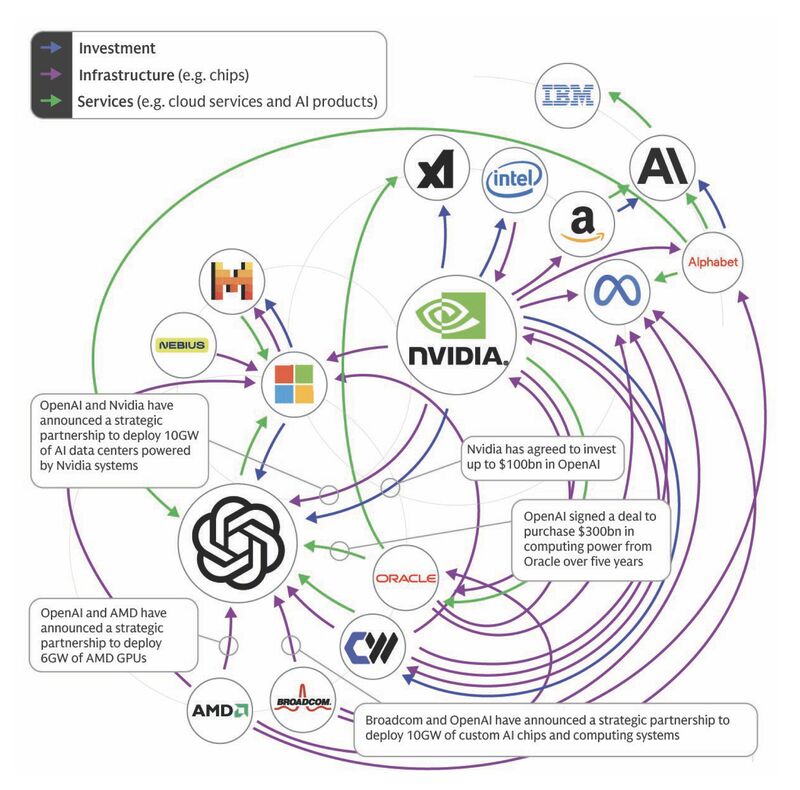
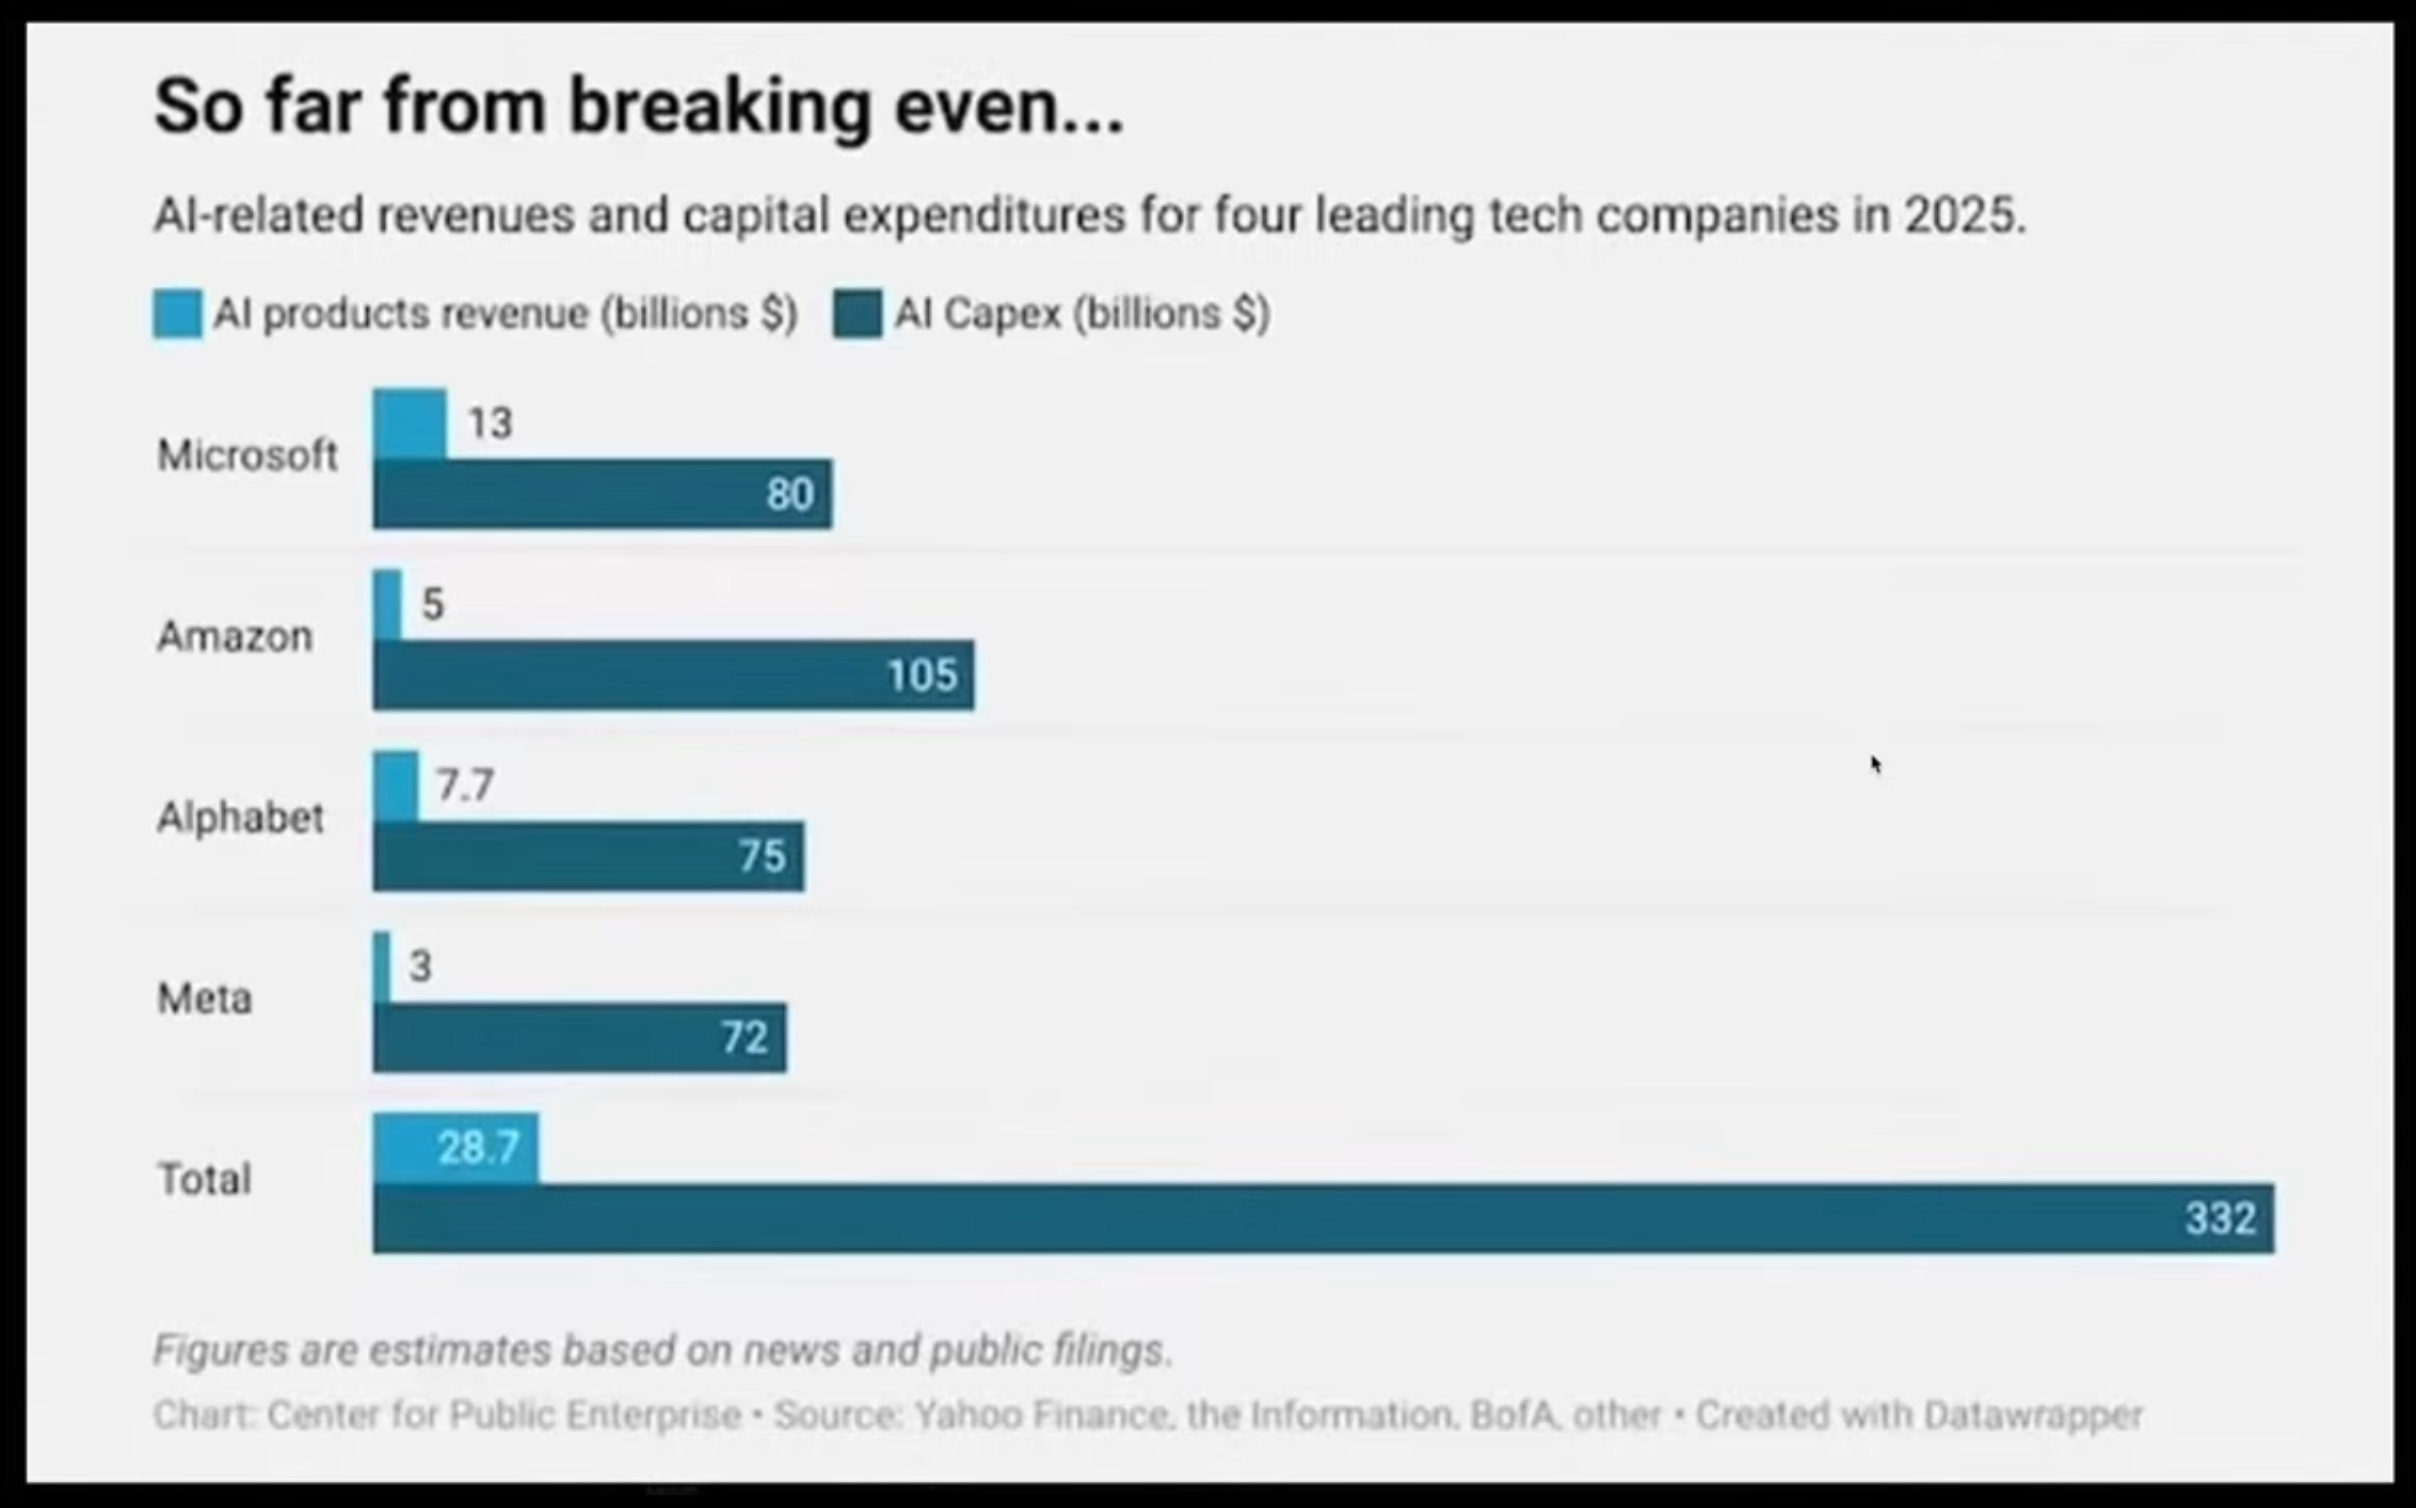 While fear is dominating the pedestrian sentiment readings, it seems that people are catching on to the fact that the “AI Bubble” looks super sketchy. Basically, the top players in AI are handing bags of cash over to each other in circular funding that echoes the 2000 DotCom Bubble. The bulls argue that massive profits are coming (some day) from all the huge data centers. The bearish case is two-fold. One: these companies are not profitable…and, Two: they need to achieve profits of $3/$5 trillion in the coming years to validate this massive debt spree.
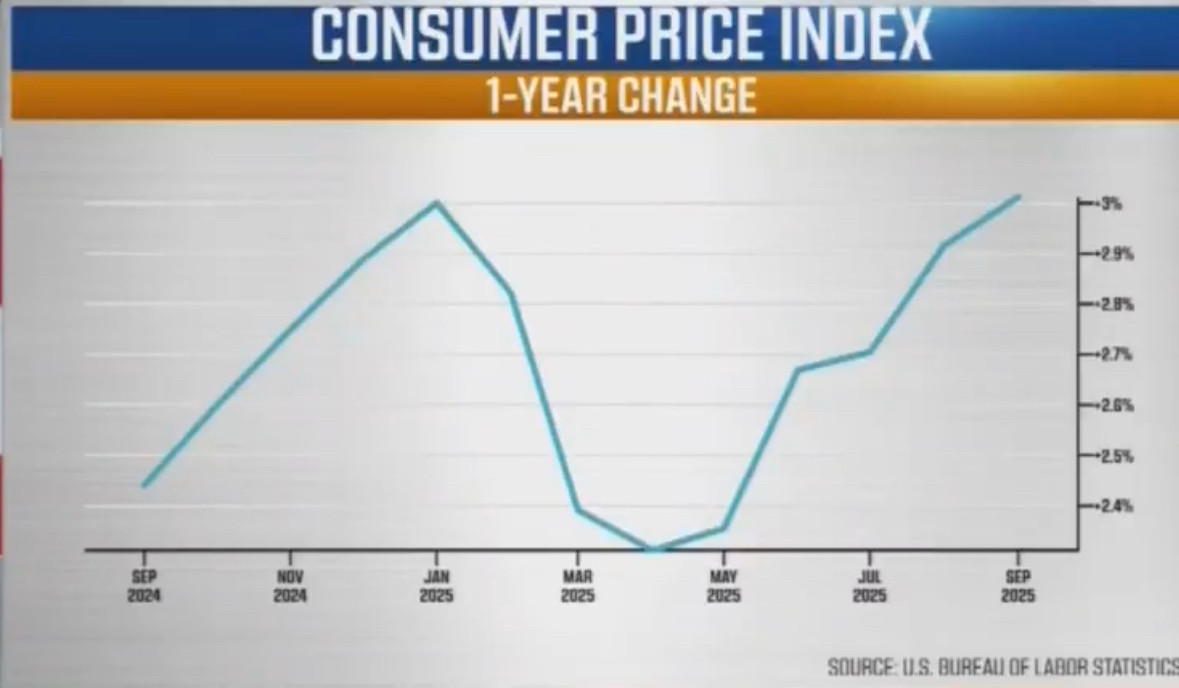
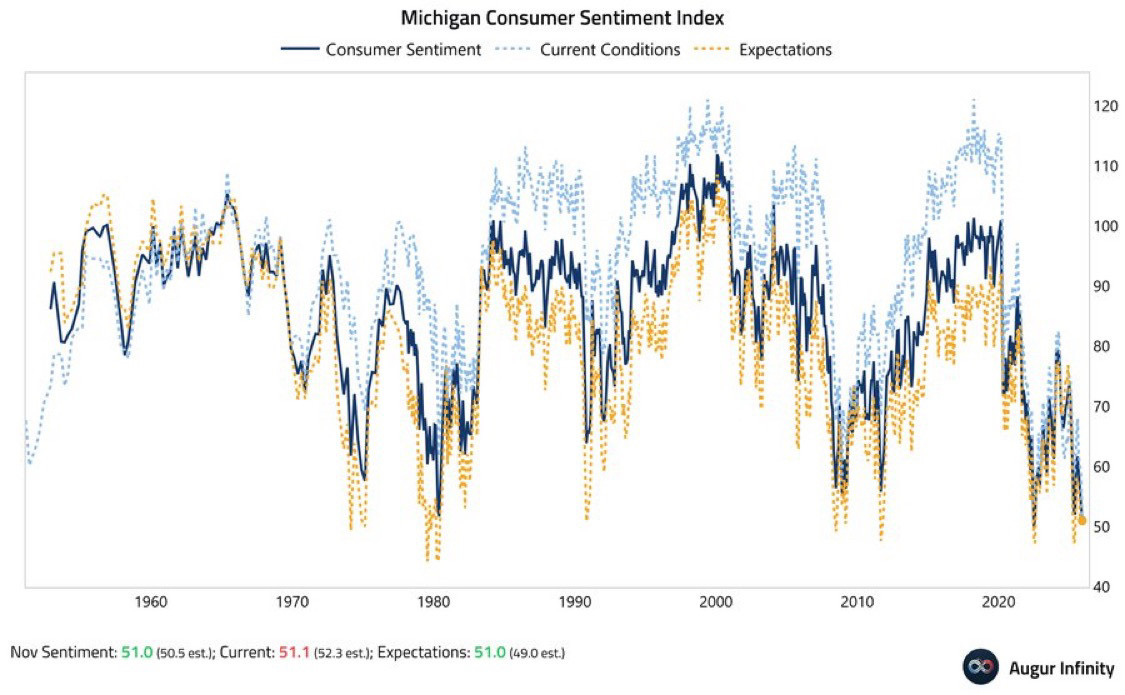
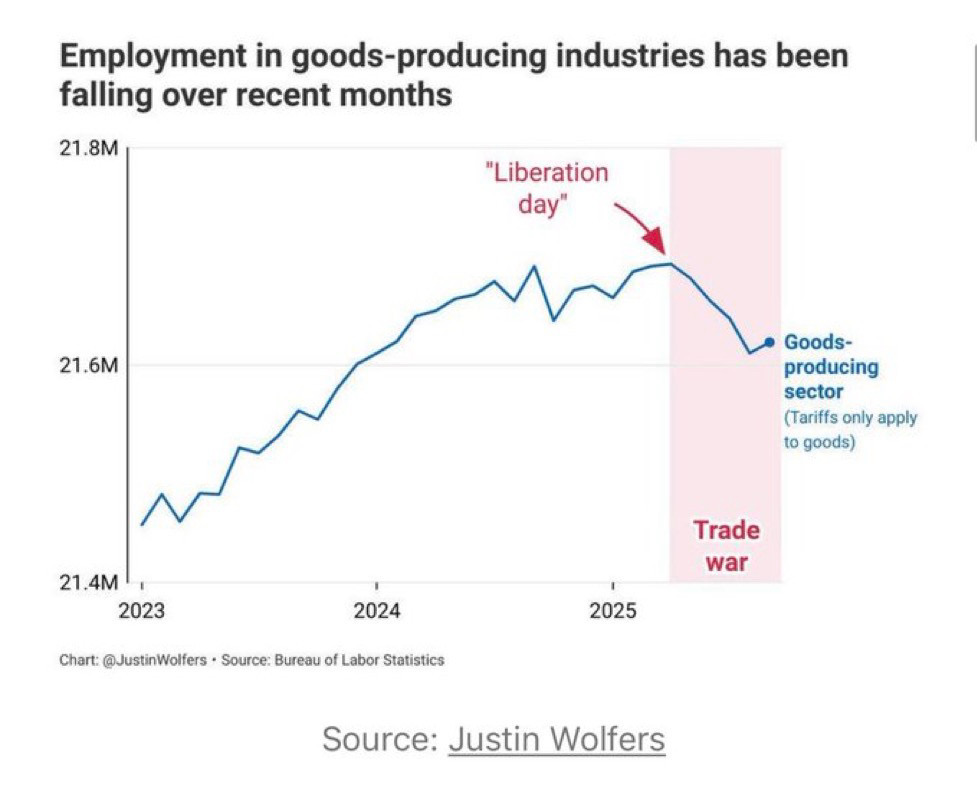 Consumers are not buying in to the narrative that everything is rosy. Inflation remains sticky, jobs are collapsing and Consumer Sentiment has hit an all-time low in the more than 70 years of tracking American consumers. Youth unemployment is sitting near 10% and it appears that we will not be getting any genuine economic data from government resources any time in the near future. Without unbiased CPI and Employment data, the markets are left guessing…while consumers are telling us the real story.
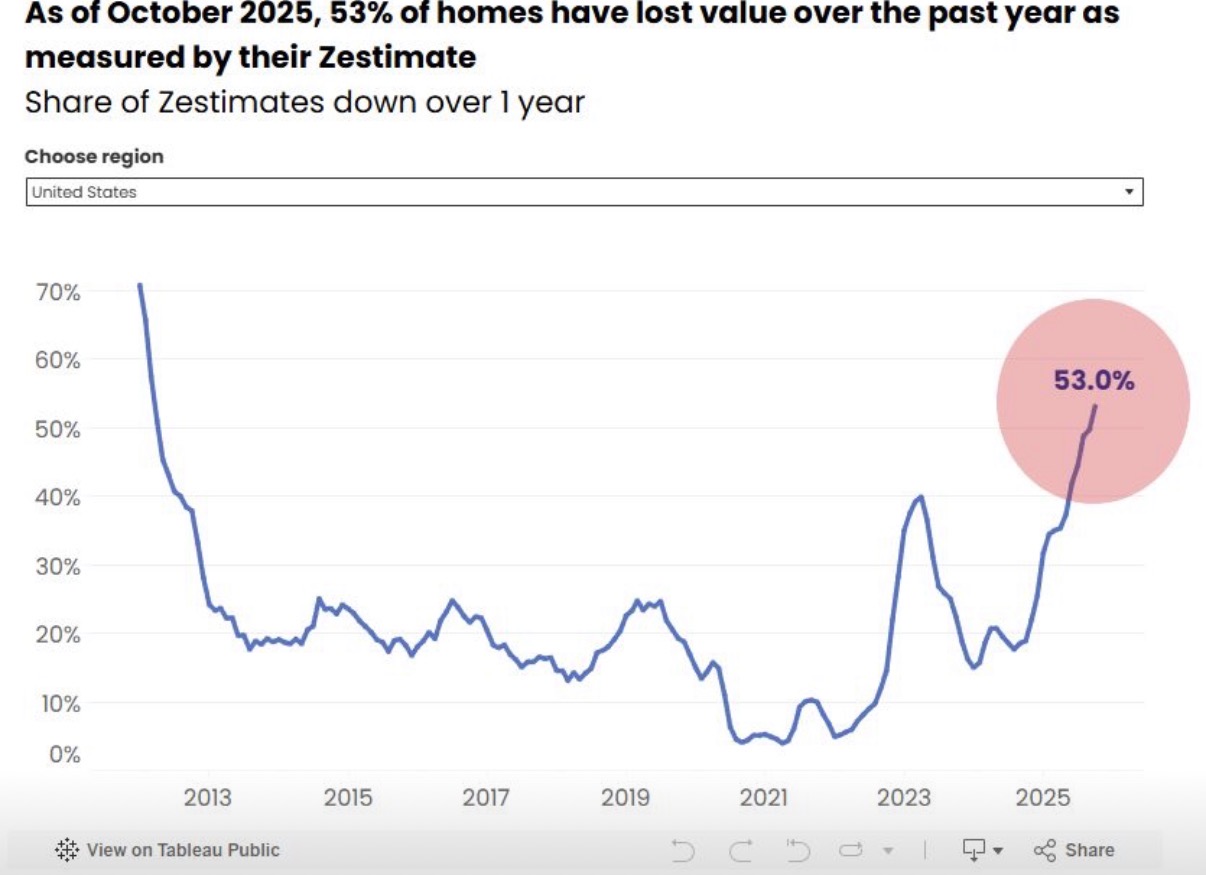
Is the next leg of the stool to shake going to be the housing market? 53% of homes have lost value over the past year. Areas such as Florida and Texas have been hammered since last fall. Down -5.4% and -2.6% respectively, with homes on the market 58 and 50 days in those states.
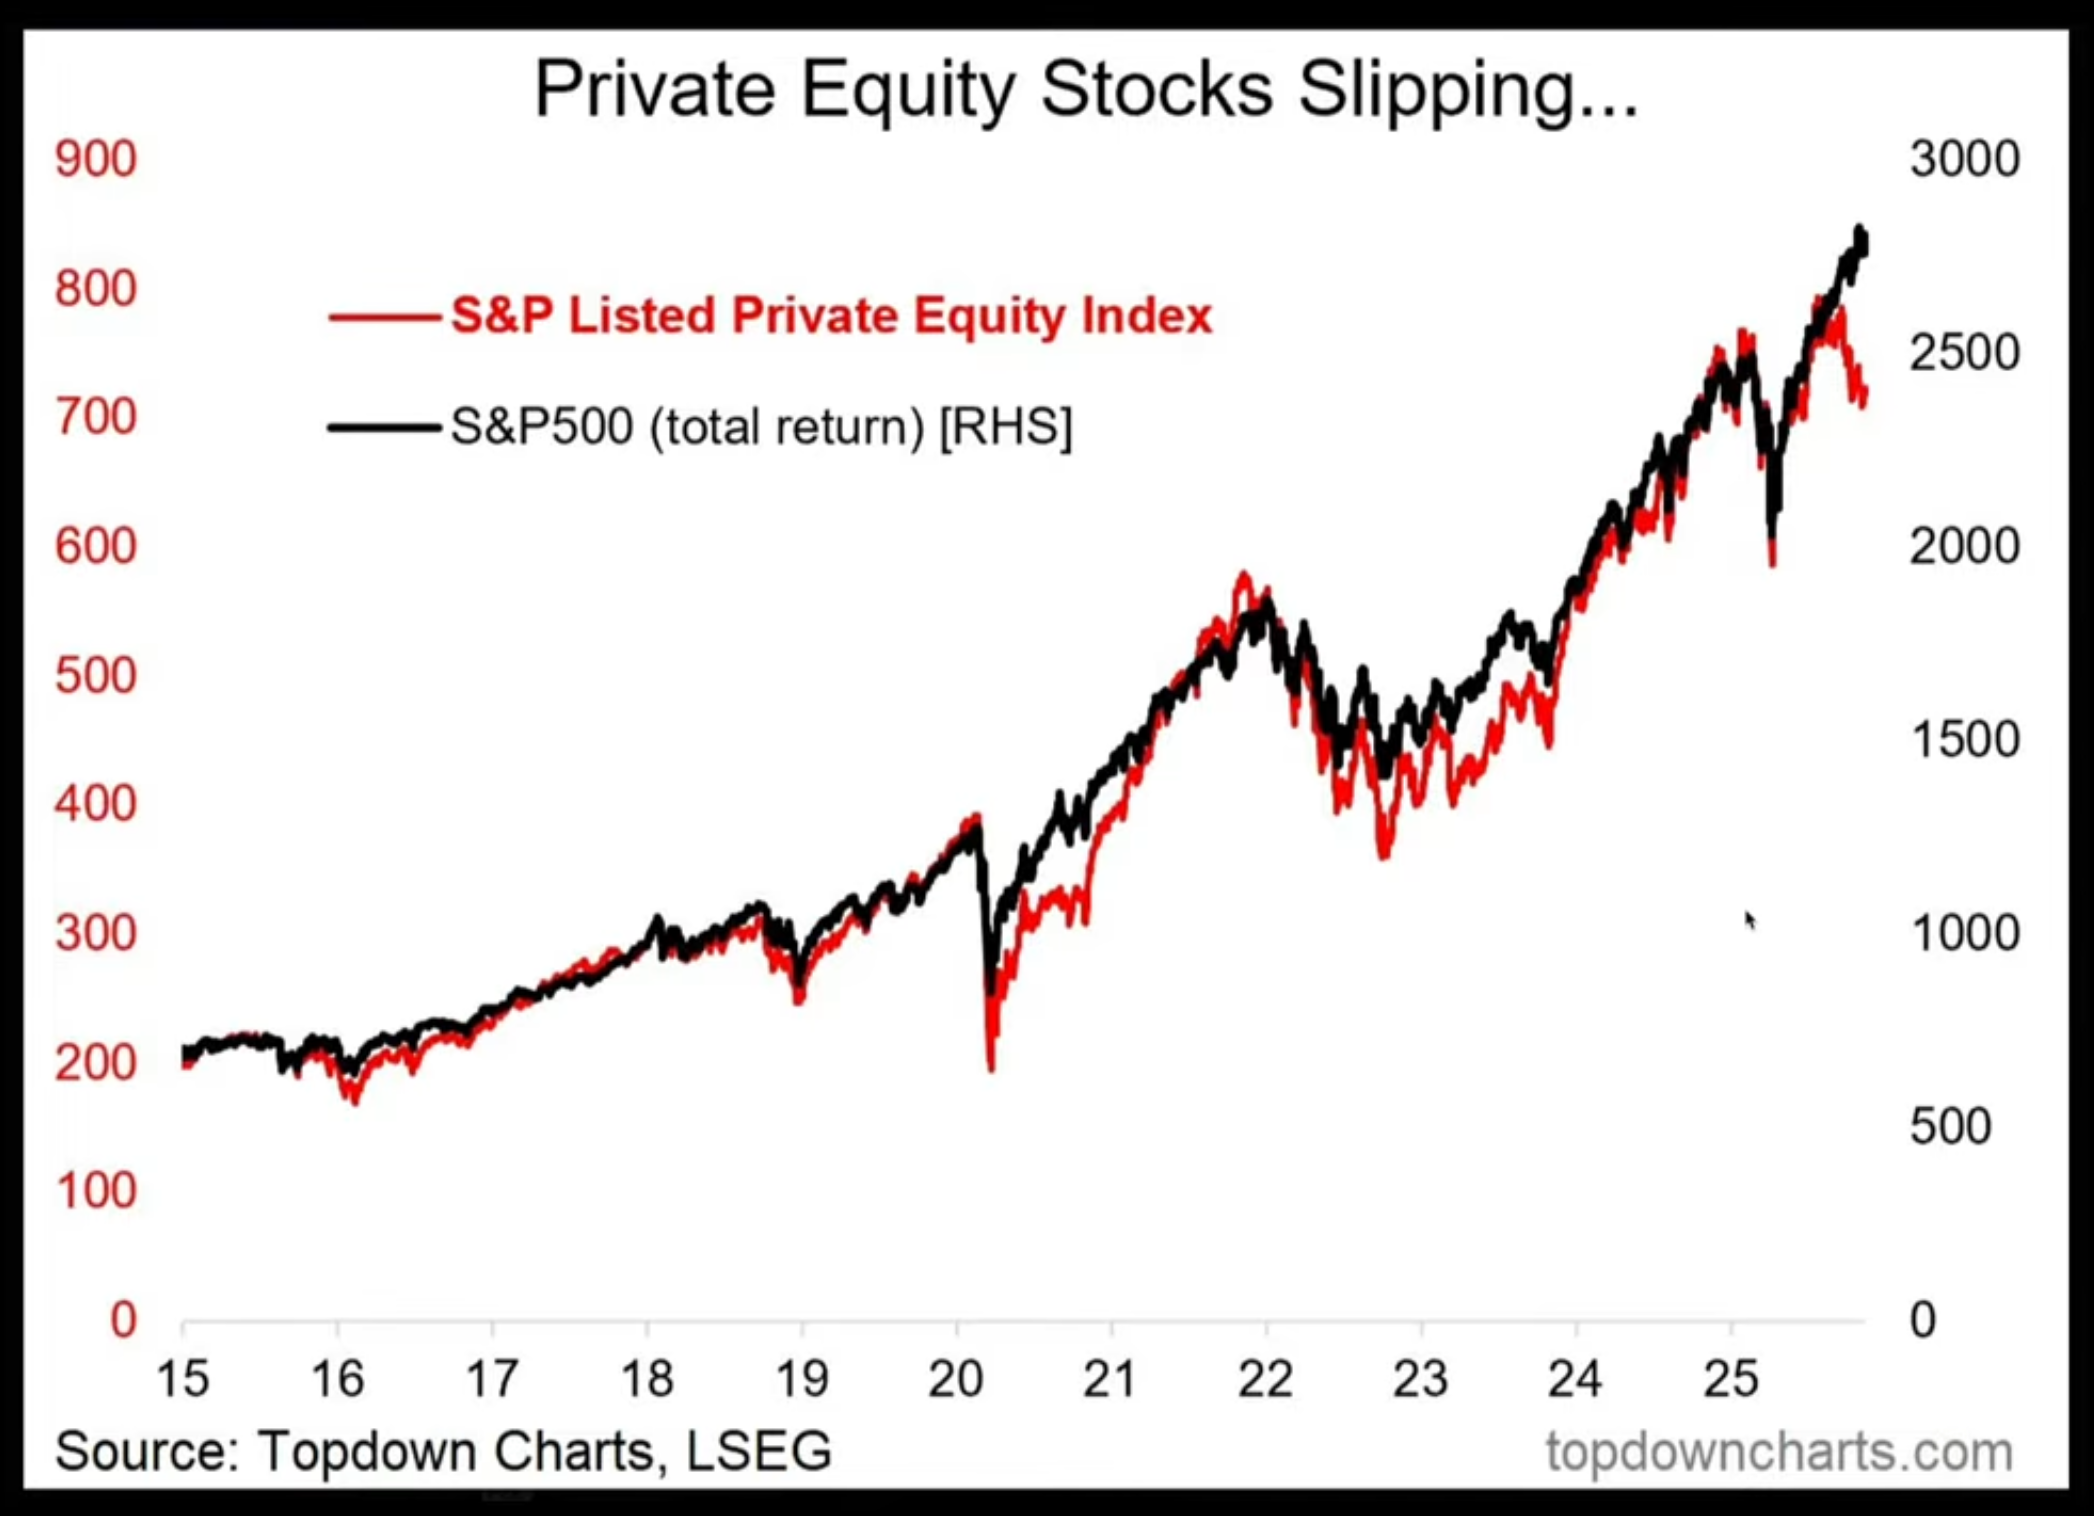 Another leg that is shaky is Private Equity, which shows signs of cracking as the debt burdens continue to mount and, as a leading indicator, has been showing weakness. Chart from: www.topdowncharts.com
“I believe that we are looking at the bottom of the 9th inning now for stocks and that the end of this move will come in this long window we are in…most likely before or by the first month or two of 2026. Certainly, by the 1st quarter. The market has now issued a number of Hindenburg Omens, and a Nasdaq Titanic Syndrome which can be a preliminary red-flag that prices are within a couple months of a major turning point. which fits with the current timing data.”
Dow Jones Quarterly H-L-C
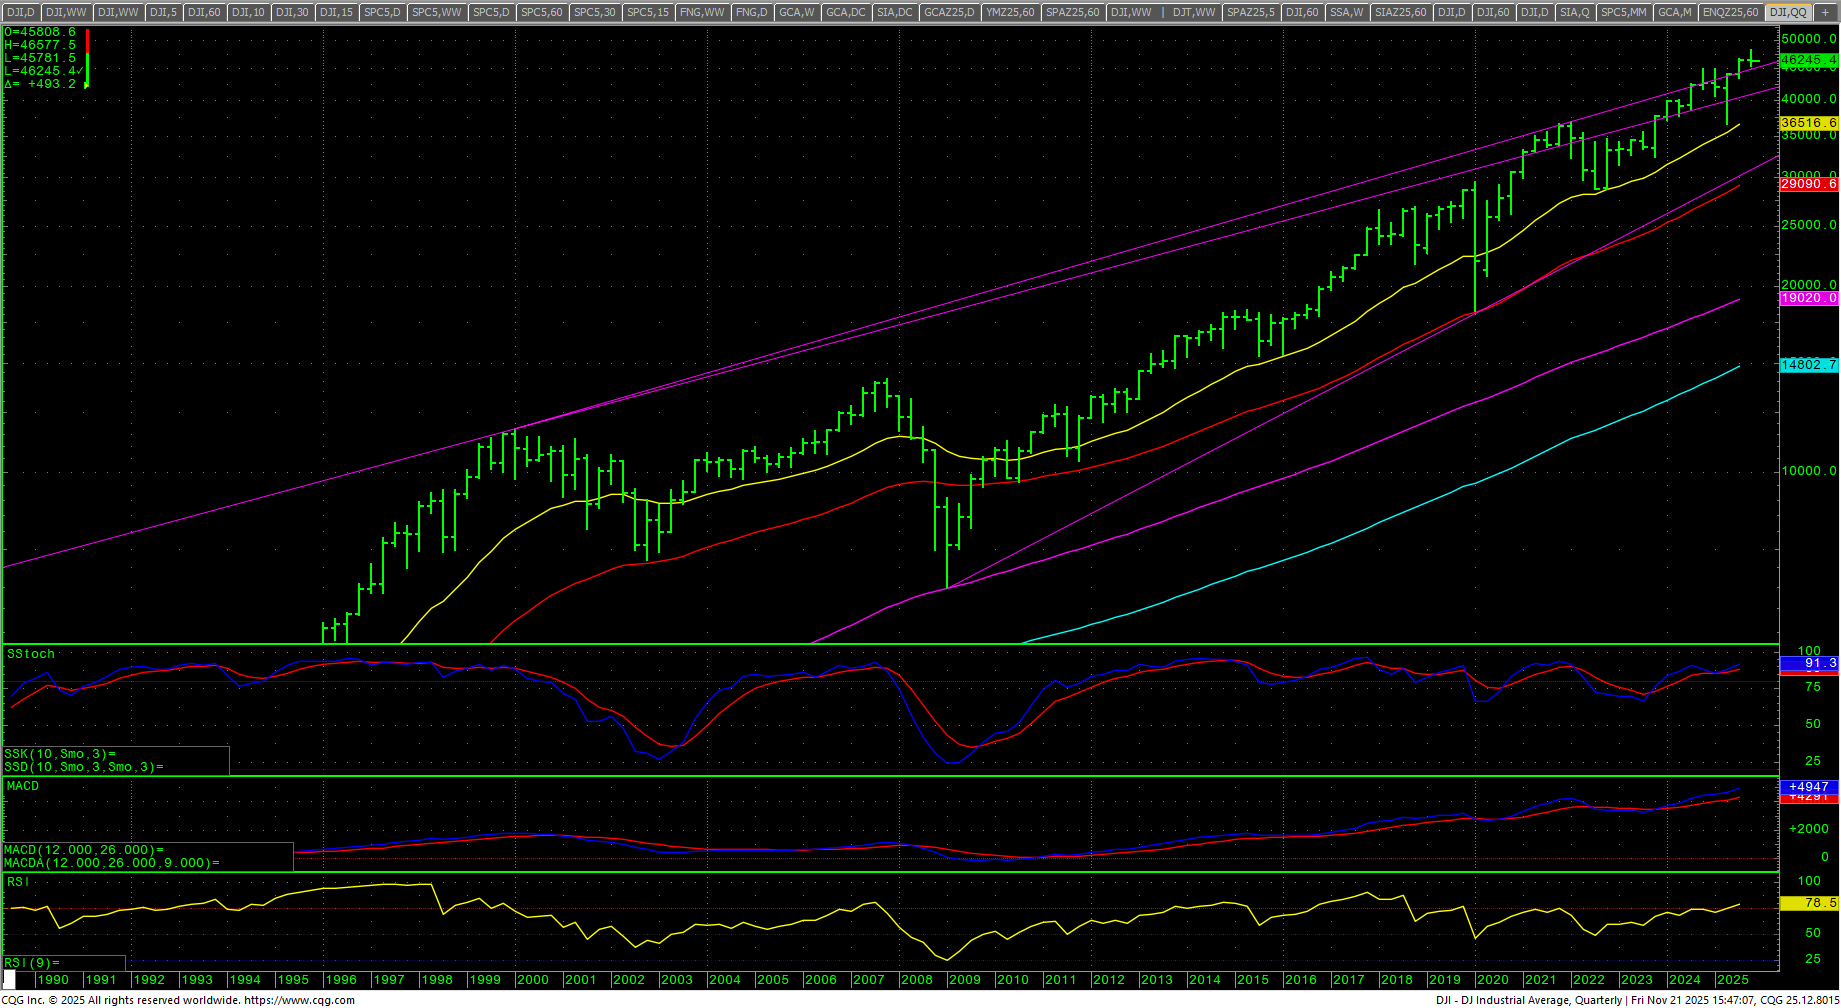 The Dow retested the trendline breakout on the long-term charts and bounced on Friday. On the daily chart, prices hit the 100-day MA with Thursday’s low. On the weekly chart, the Dow nipped the 21-week MA before the bounce. Can the extreme sentiment provide a springboard to send prices out of this volatility to new highs in December? Given the seasonality, this is not out of the question. However, in the cycle timing report this month, I pointed out how there are some critical timing points in December…particularly in the middle of the month. The most critical technical point for the last few weeks of the year is the potential for a decline in December that violates the previous quarterly low. If we end 2025 with a quarterly reversal, that would be a hugely bearish signal for the markets. Those numbers for the main indexes are:
- Dow: 43340.60
- SPX: 6177.97
- NDQ: 22388.09
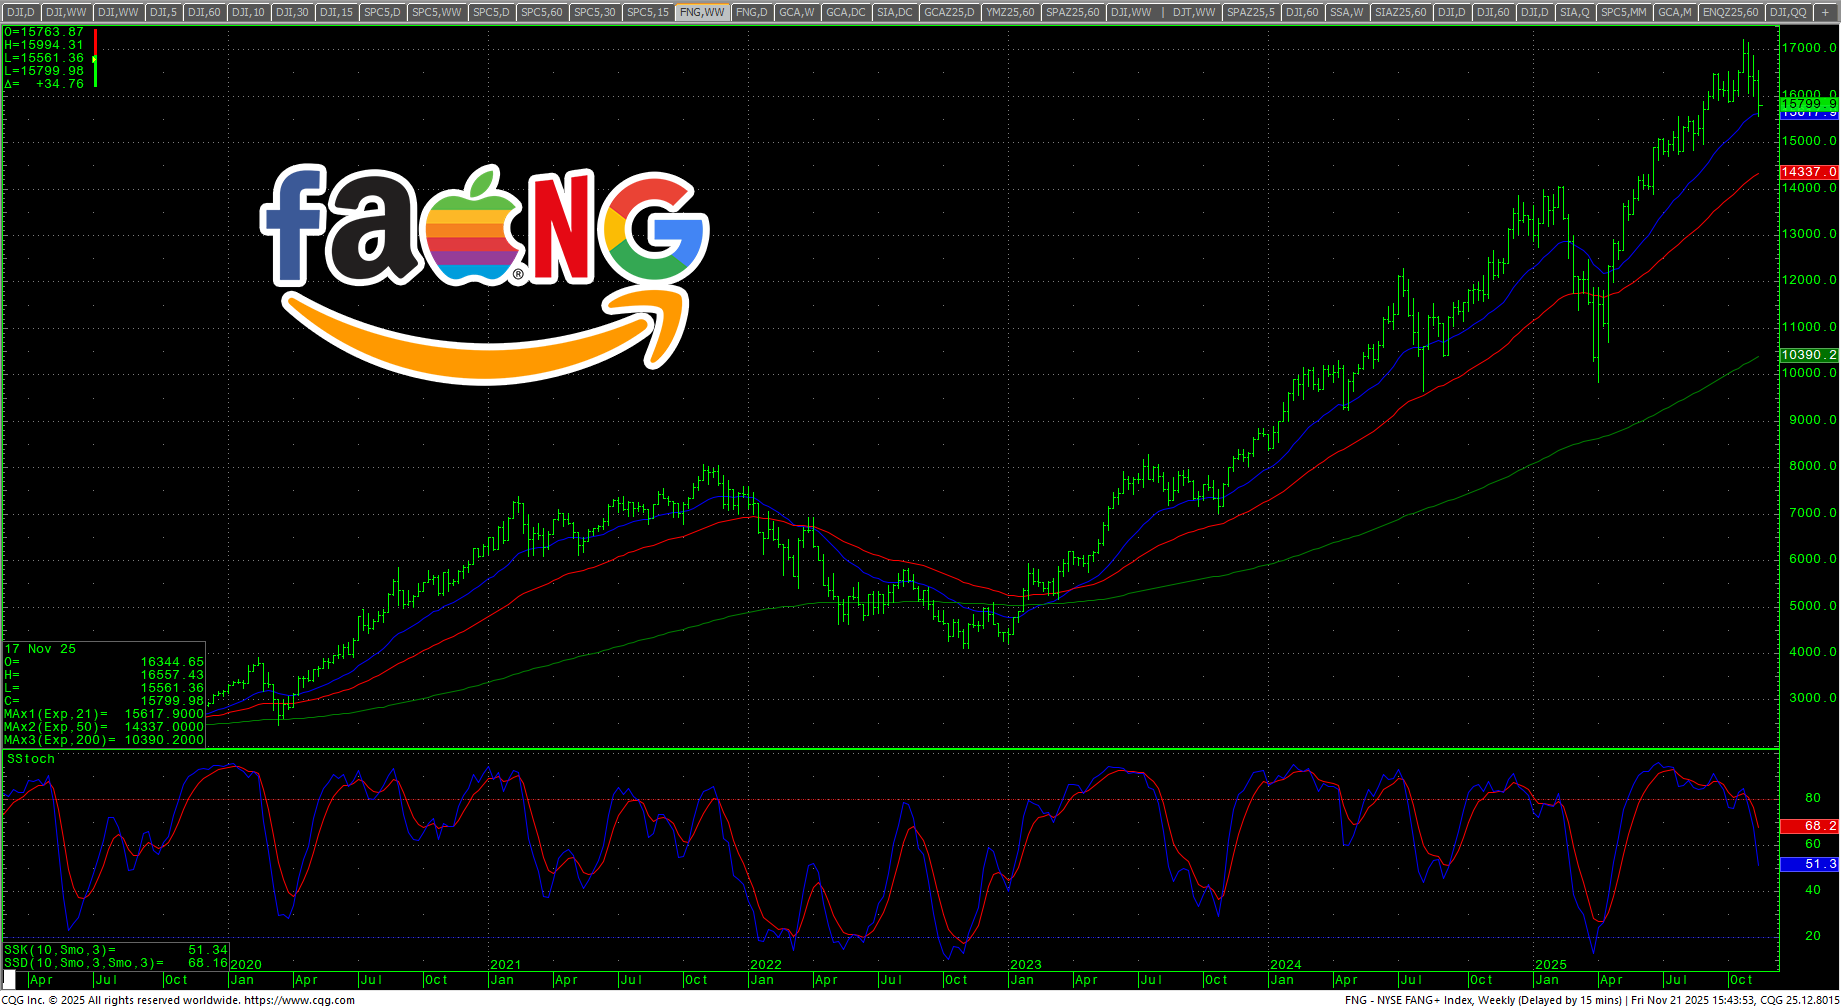
- NYFANG: 14623.75
If prices clear these levels by year’s end, it is Katy bolt the door.
SPX Monthly H-L-C
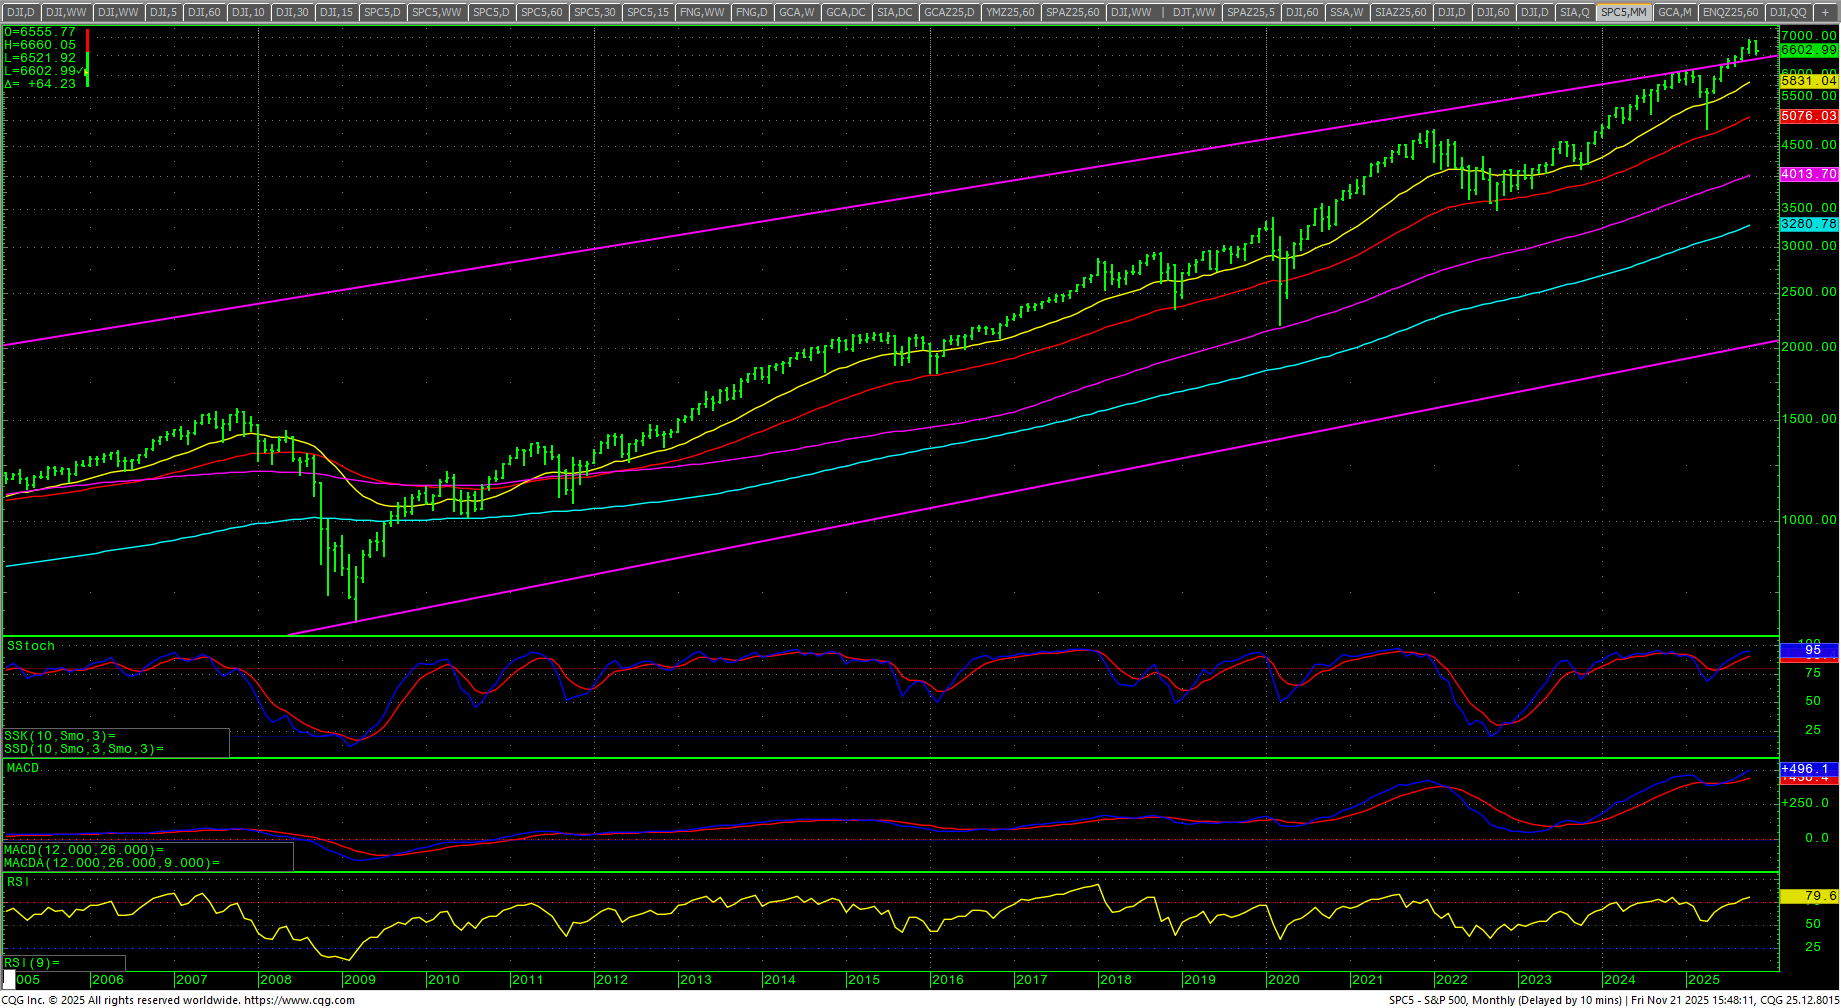 The SPX monthly still offers the super bull scenario as prices trade above the overhead trendline that connects the 1929 tops through the 2000 Dot-Com tops. If prices start to trade back under the trendline, it could signal selling in equities. It still holds potential for a continued blowoff move. Right now, the trendline comes in at: 6392.32.
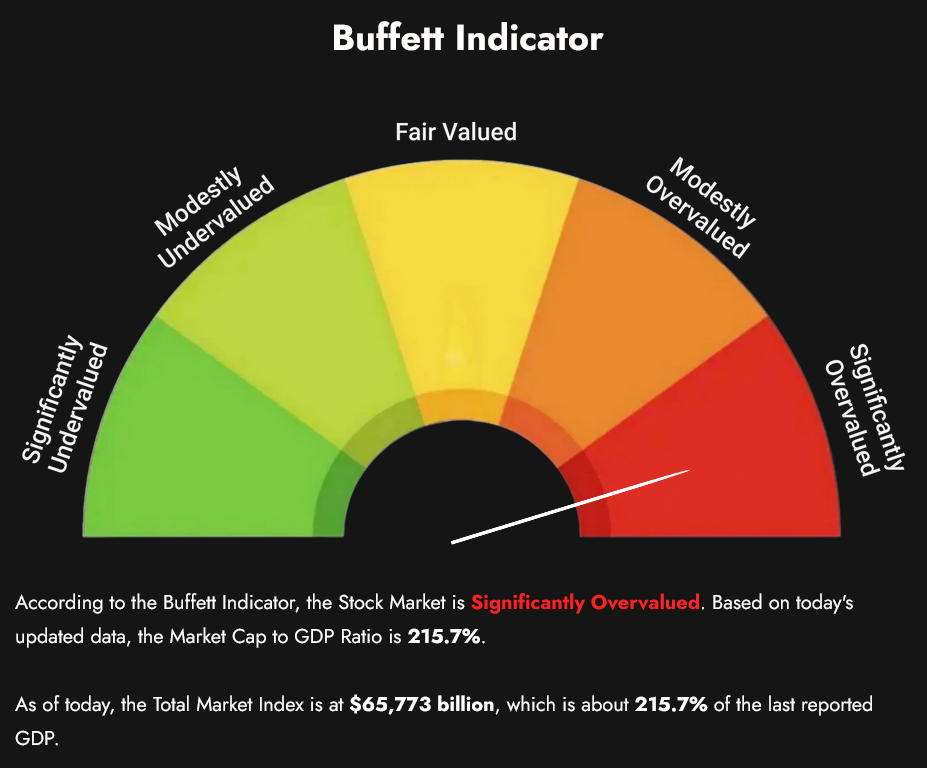 The Buffet Indicator sits near ATHs, now reading at 215.7%.
Dow Theory
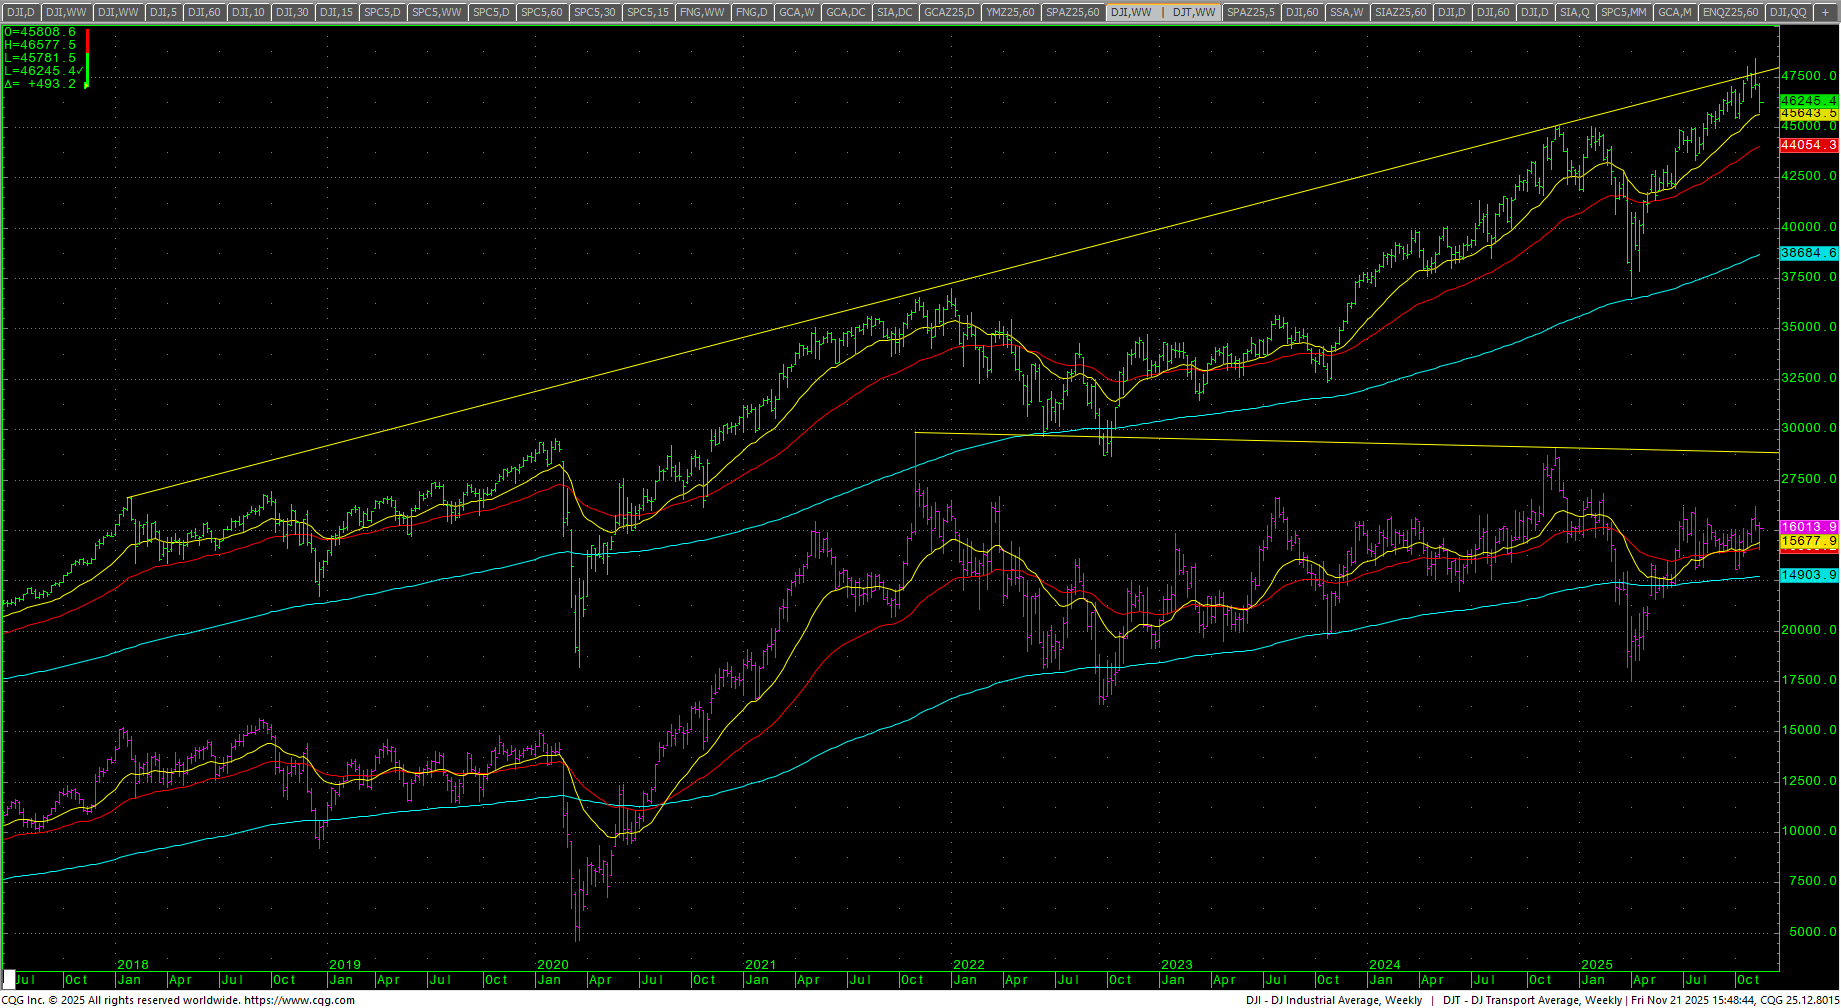 Dow Theory still shows a bearish divergence. Transports have been showing some relative strength and structure as of late.
S&P 500 Stocks Above the 200-day MA
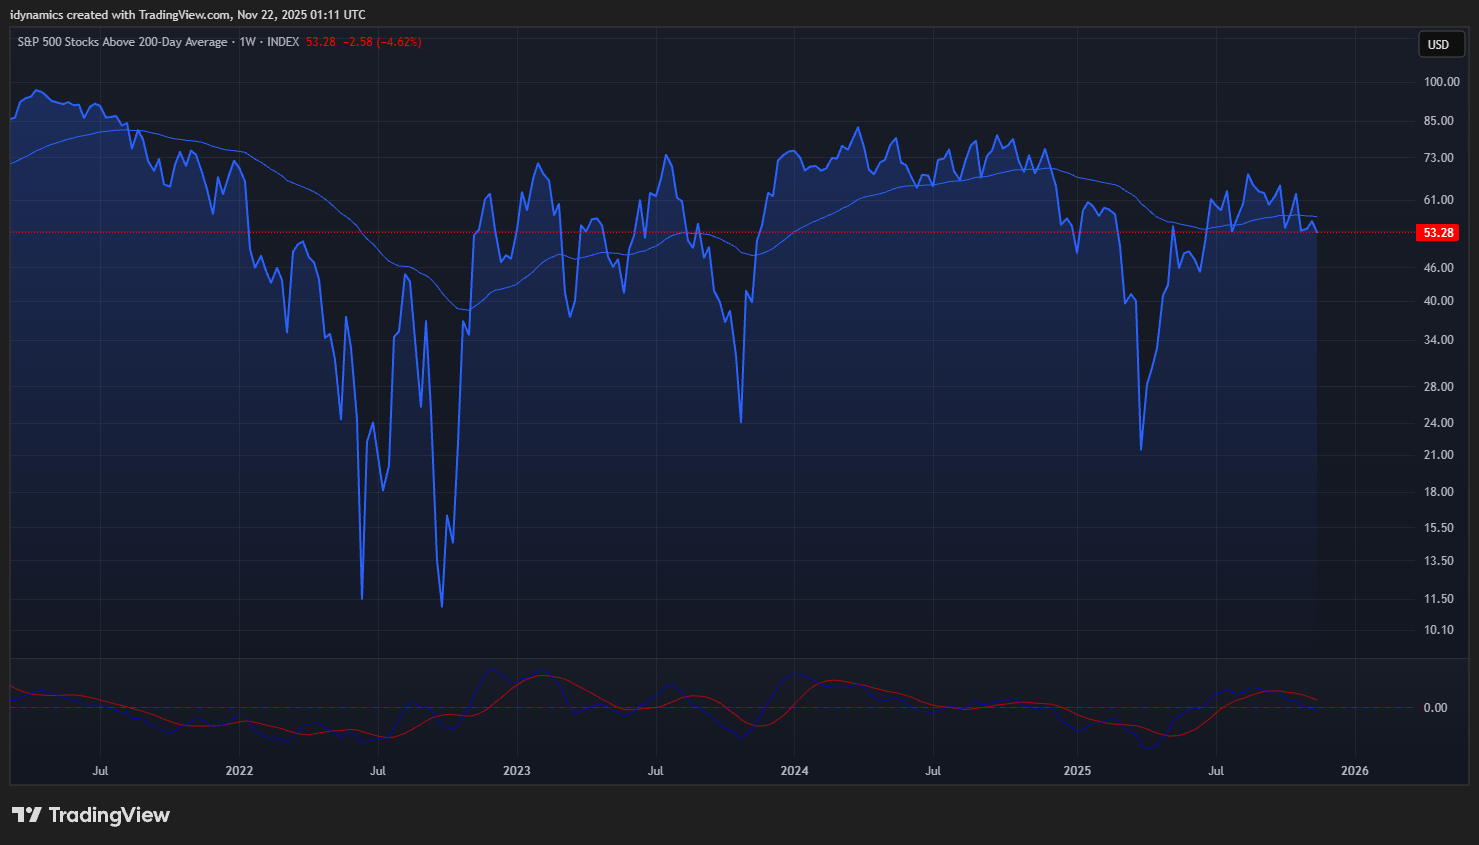 Breadth is still deteriorating (ala the Hindenburg Omen). The share of SPX stocks above the 200-day MA dropped to 53.28%. The high in September 2024 was 72.92% and 82.70% in March of 2024. Divergence remains the name of the game. 10 stocks make up 40% of the SPX.
MAGS (Magnificent 7) Weekly Candles
 The MAGS dropped to a ten-week low and settled in the lower half of the range, down -2.20%. Prices tested the first area of support near 61.99 and the 20-week MA sits just under this support. Resistance is 64.95, 65.75 and 66.55/67.00. Support is 61.99 and 57.60. Under 57.60 can test 54.05 with critical support at 50.49/50.00.
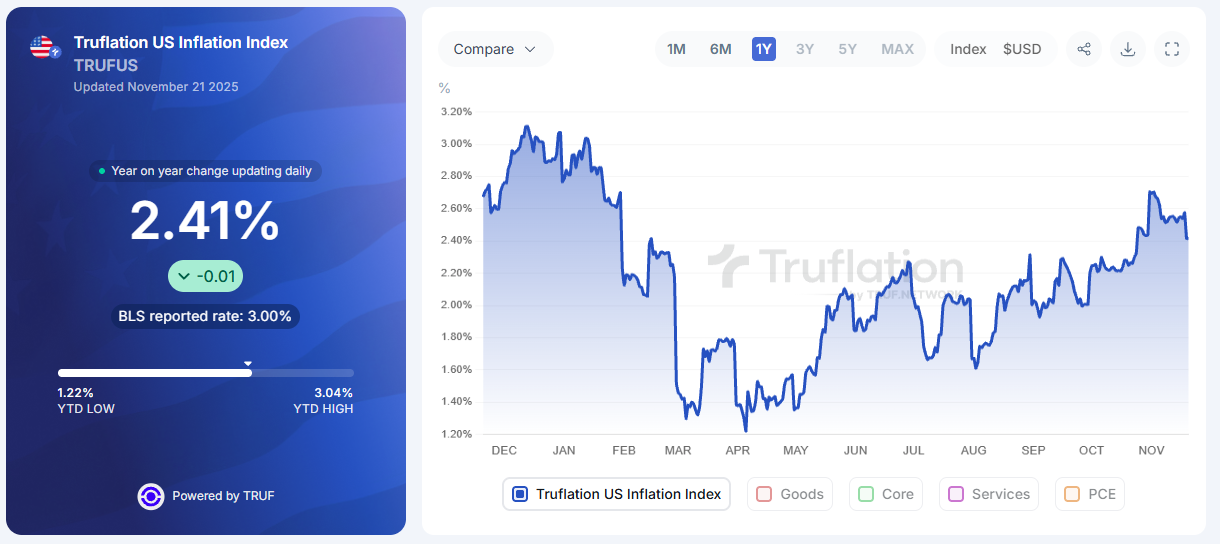
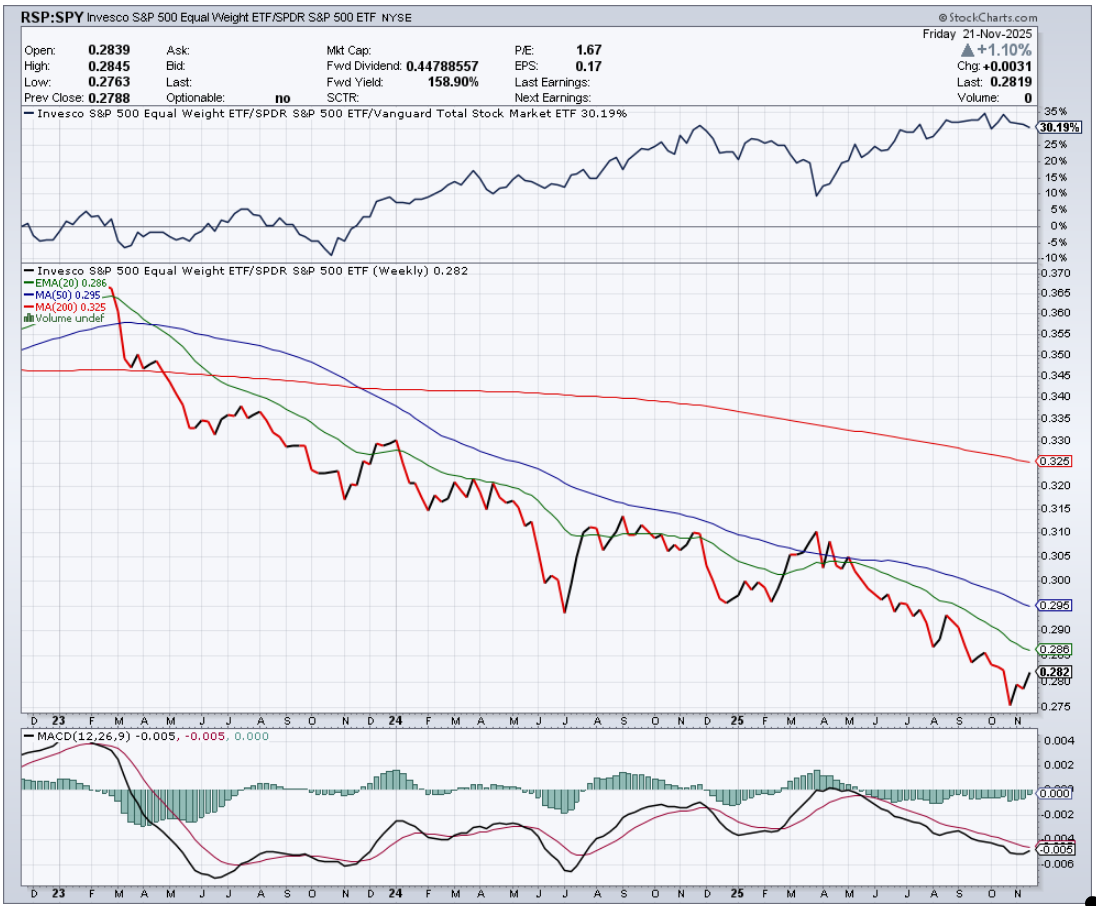
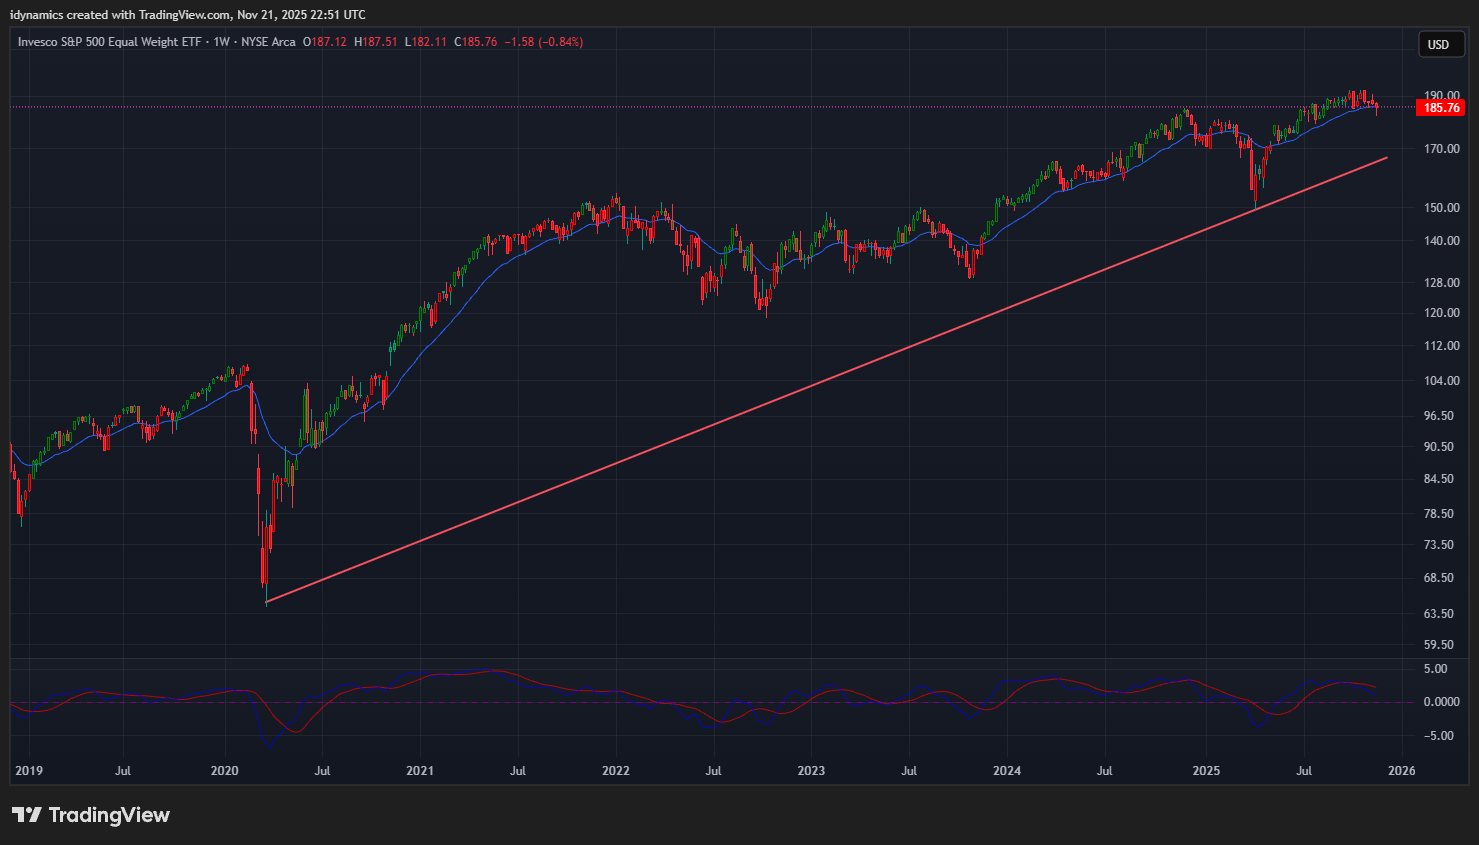
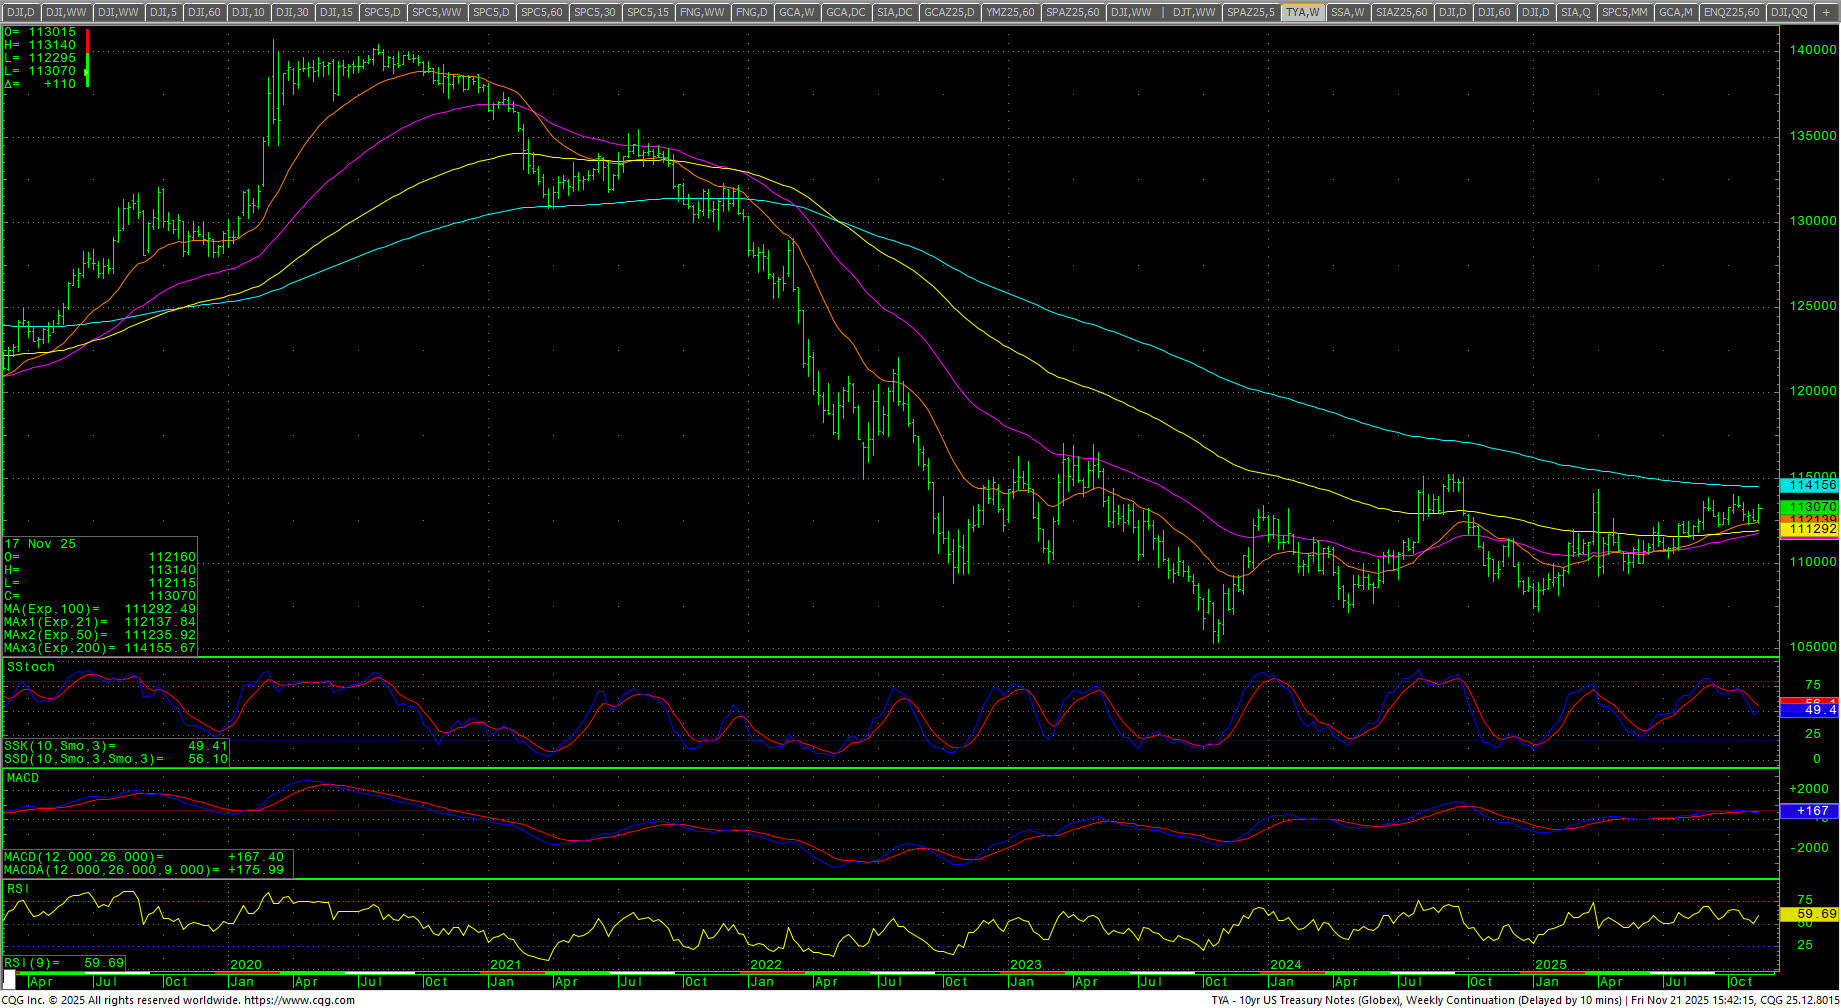
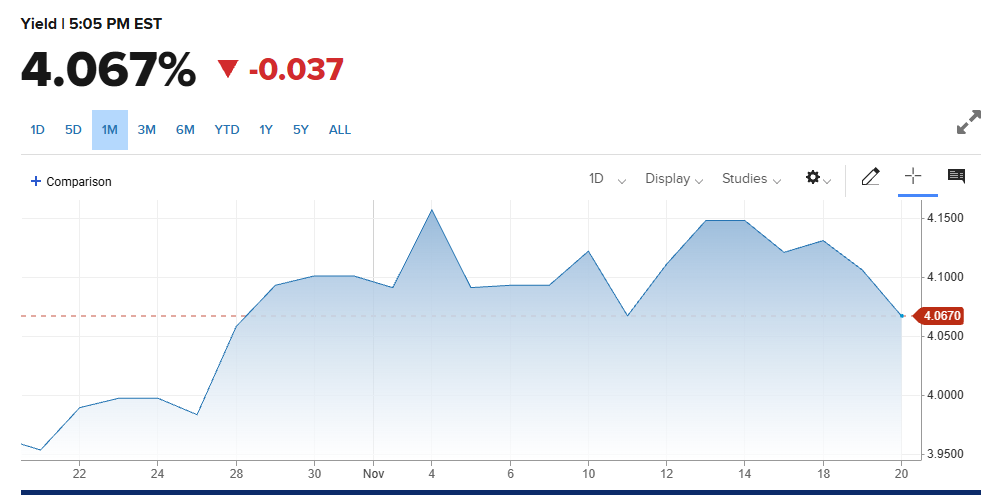
The RSP:SPY saw a slight improvement as the Russell perked up sharply in Friday’s trade. The weekly is still trending lower in an oversold position and the MACD is down. Resistance remains pivotal at .294. The IWM traded a three-month low and bounced to close near the top of the range, down -0.79%. The RSP also hit three-month lows and recovered to close on the top of the week’s range, down -1.58%. NVDA reported earnings beats and could not hold the rally, plunging into the end of the week, closing down -5.94%. Bitcoin plunged to seven-month lows and closed near the low end of the range, down -9.72%. Prices hit support at 83.90 and closed just above that level. Further declines can test 70.85 with critical support at 57.80/57.00. Resistance is 90.40 and 98.00. Above 98.00 can test 103.40 with counts to 108.80/109.00. In sync, Strategy (MSTR) plunged to new lows. McClellan Oscillators support the selloff in the Dow and confirm the Hindenburg Omens. The Yield Curve expanded slightly on the week closing at +0.562%. The 10YR yield decreased to 4.067%. Truflation declined to 2.41%.
10YR-2YR Yield Curve Weekly

 VIX Weekly Candles

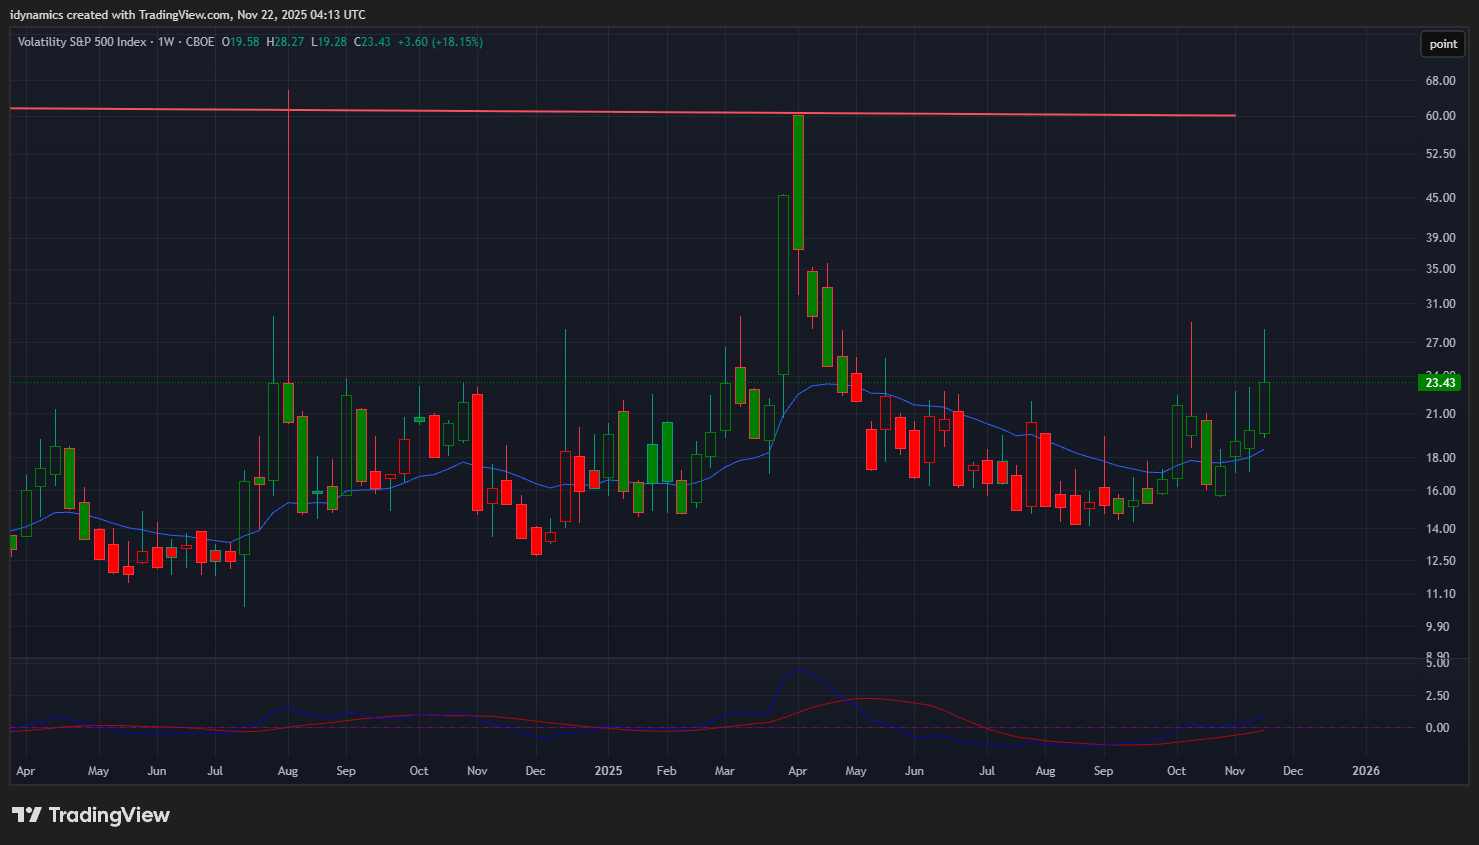
The VIX soared to a two-month high above 28 and settled toward the middle of the weekly range, up +18.15%. The US Dollar rallied, settling at the highest weekly close since late May, closing on the top of the range, up +0.93%.
 Nasdaq 100 Weekly Candles

Daily Breadth 
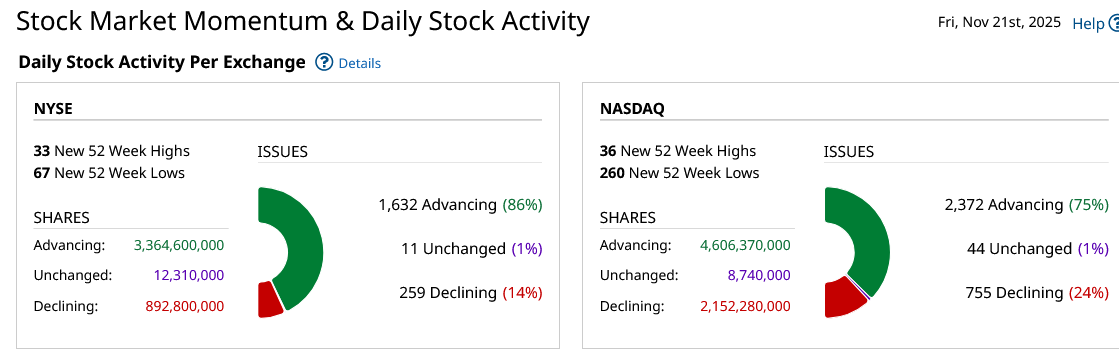
Breadth was strong on Friday but declined on the week, and sentiment still reads extreme fear.
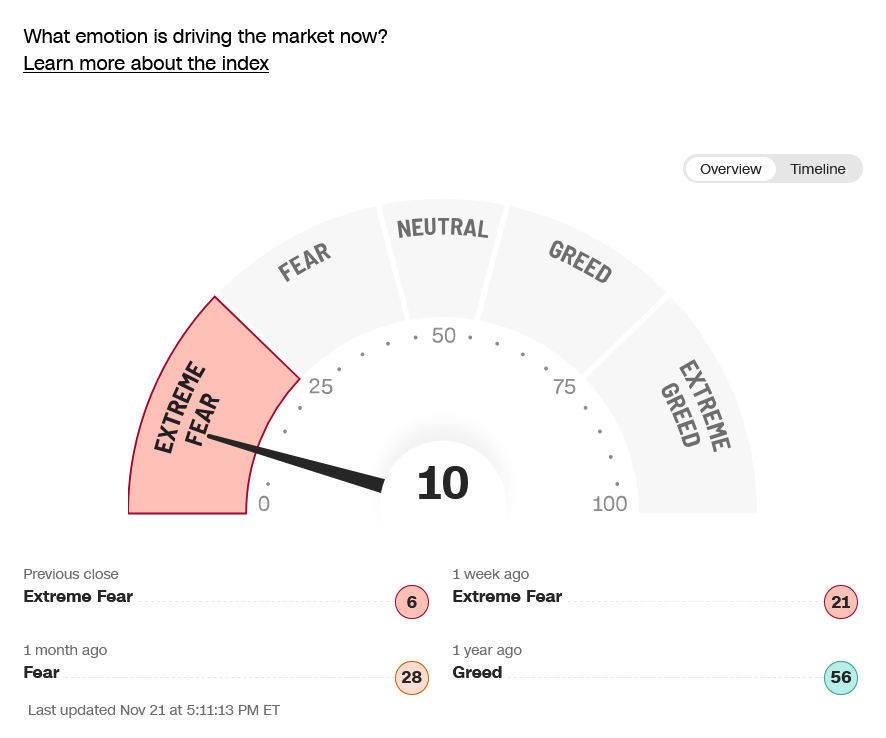
CNN Fear & Greed Index
 AAII Investor Sentiment Survey
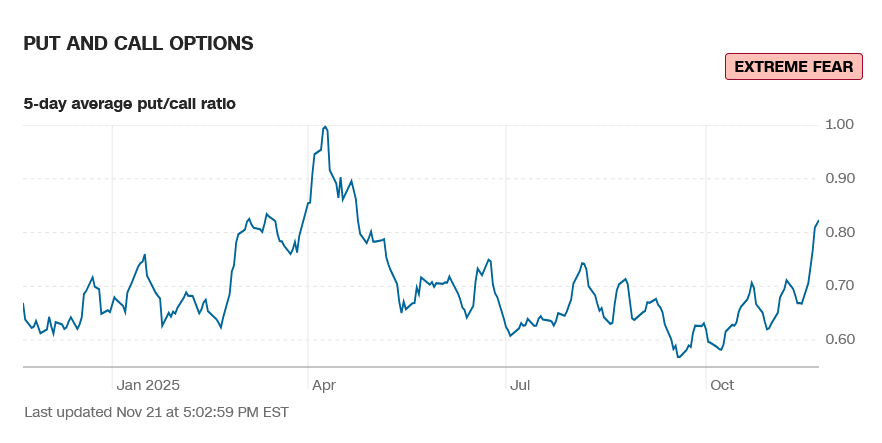
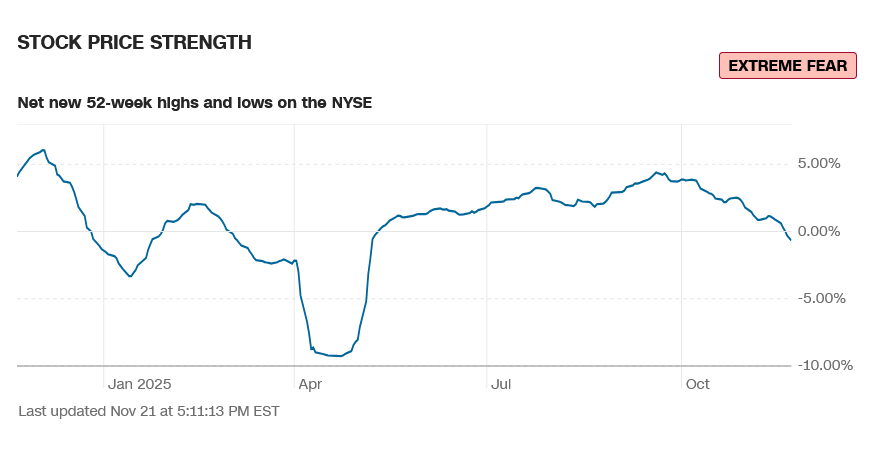
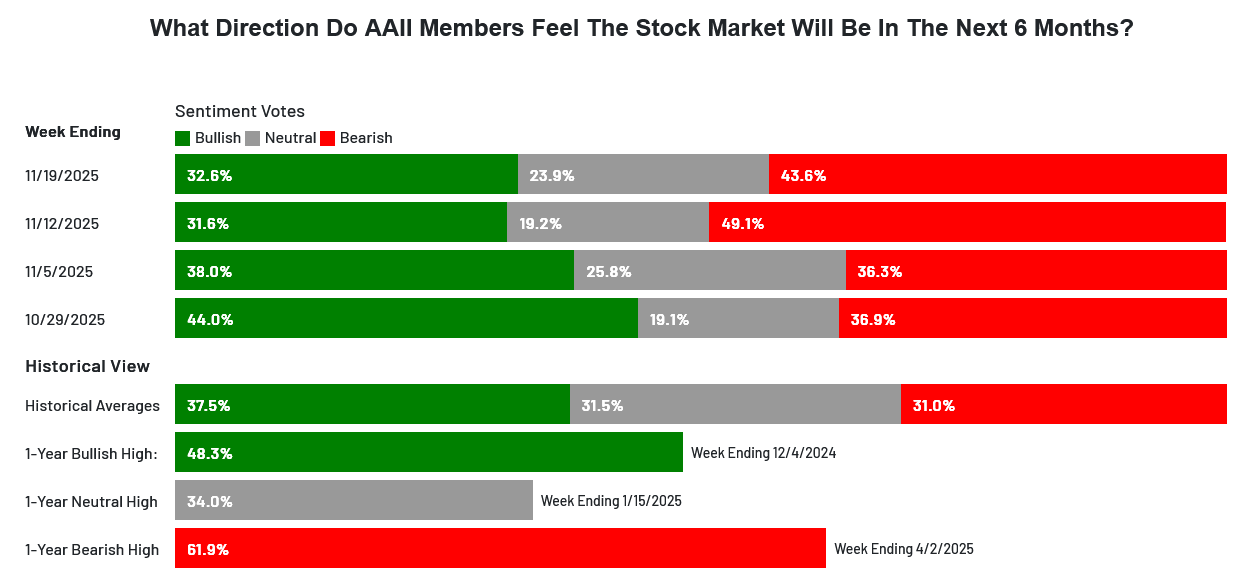 The CNN Fear and Greed Index is 10 (and hit 6 mid-week!) and reads extreme fear. Breadth deteriorated on the week and sentiment still reads extreme fear. Latest AAII Sentiment Survey: Pessimism Draws Back. The Dow A/D ended at 6948 after hitting a record the previous week. The VIX soared to a two-month high above 28 and settled toward the middle of the weekly range, up +18.15%. The Put/Call jumped to 0.82 and reads extreme fear. The 52-week, A/D went negative to -0.67% and reads extreme fear. The Dow closed the week down +1.91%, closing in the bottom of the range. The S&P was down -1.95% closing in the lower half of the range. The Nasdaq Composite was down -2.74% and the Nasdaq 100 was down -3.07%. The NYSE FANG closed down -3.33% near the lower end of the range but off the intraday lows on Friday. The Russell was down -0.78% on the top of the range. The 10-year notes rallied and closed on the high end of the range. The yield on the 10YR decreased to 4.067%.
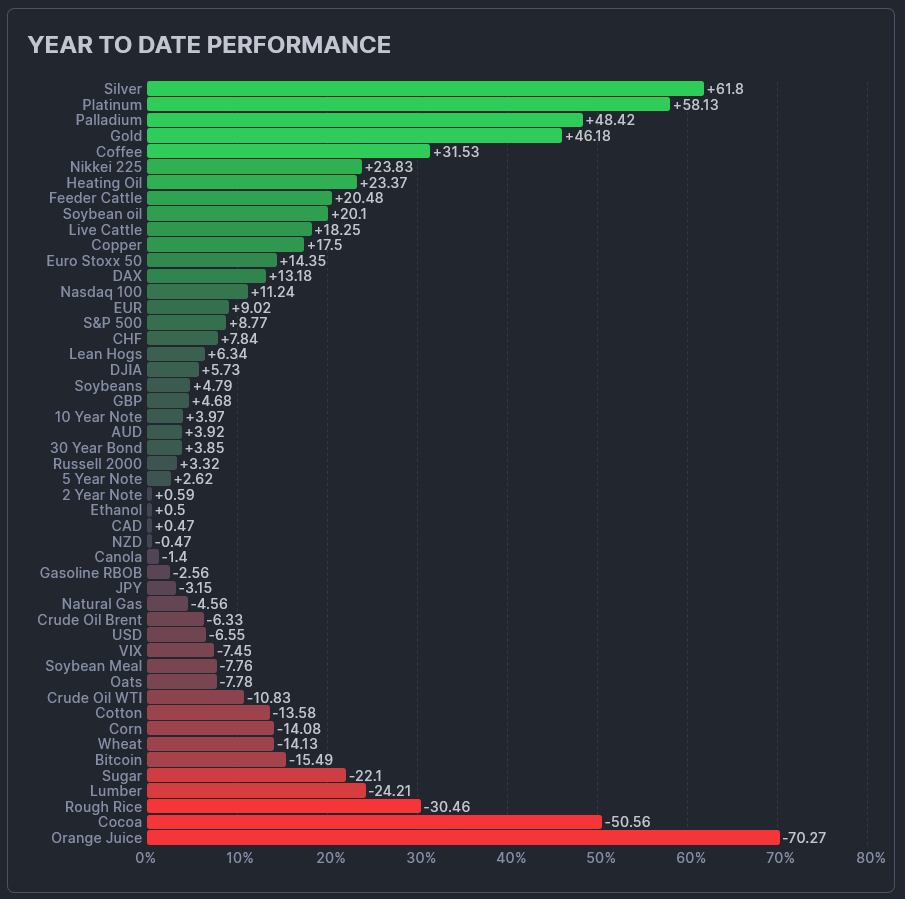
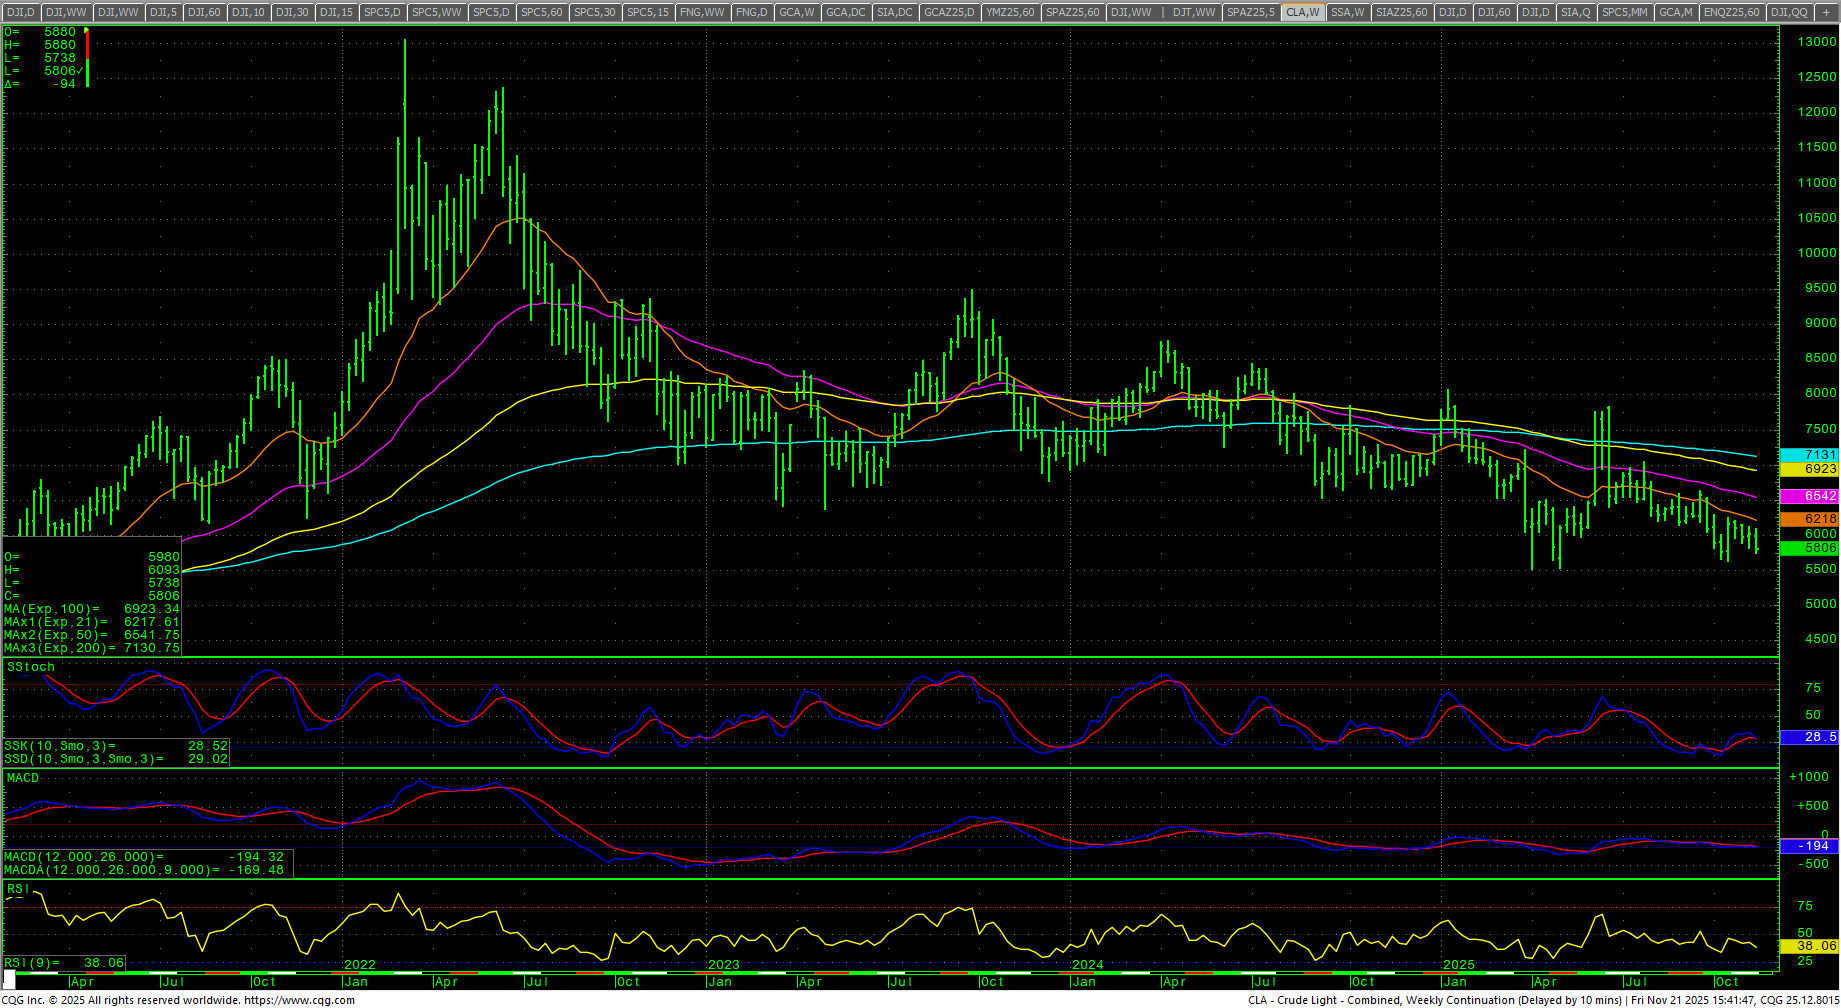
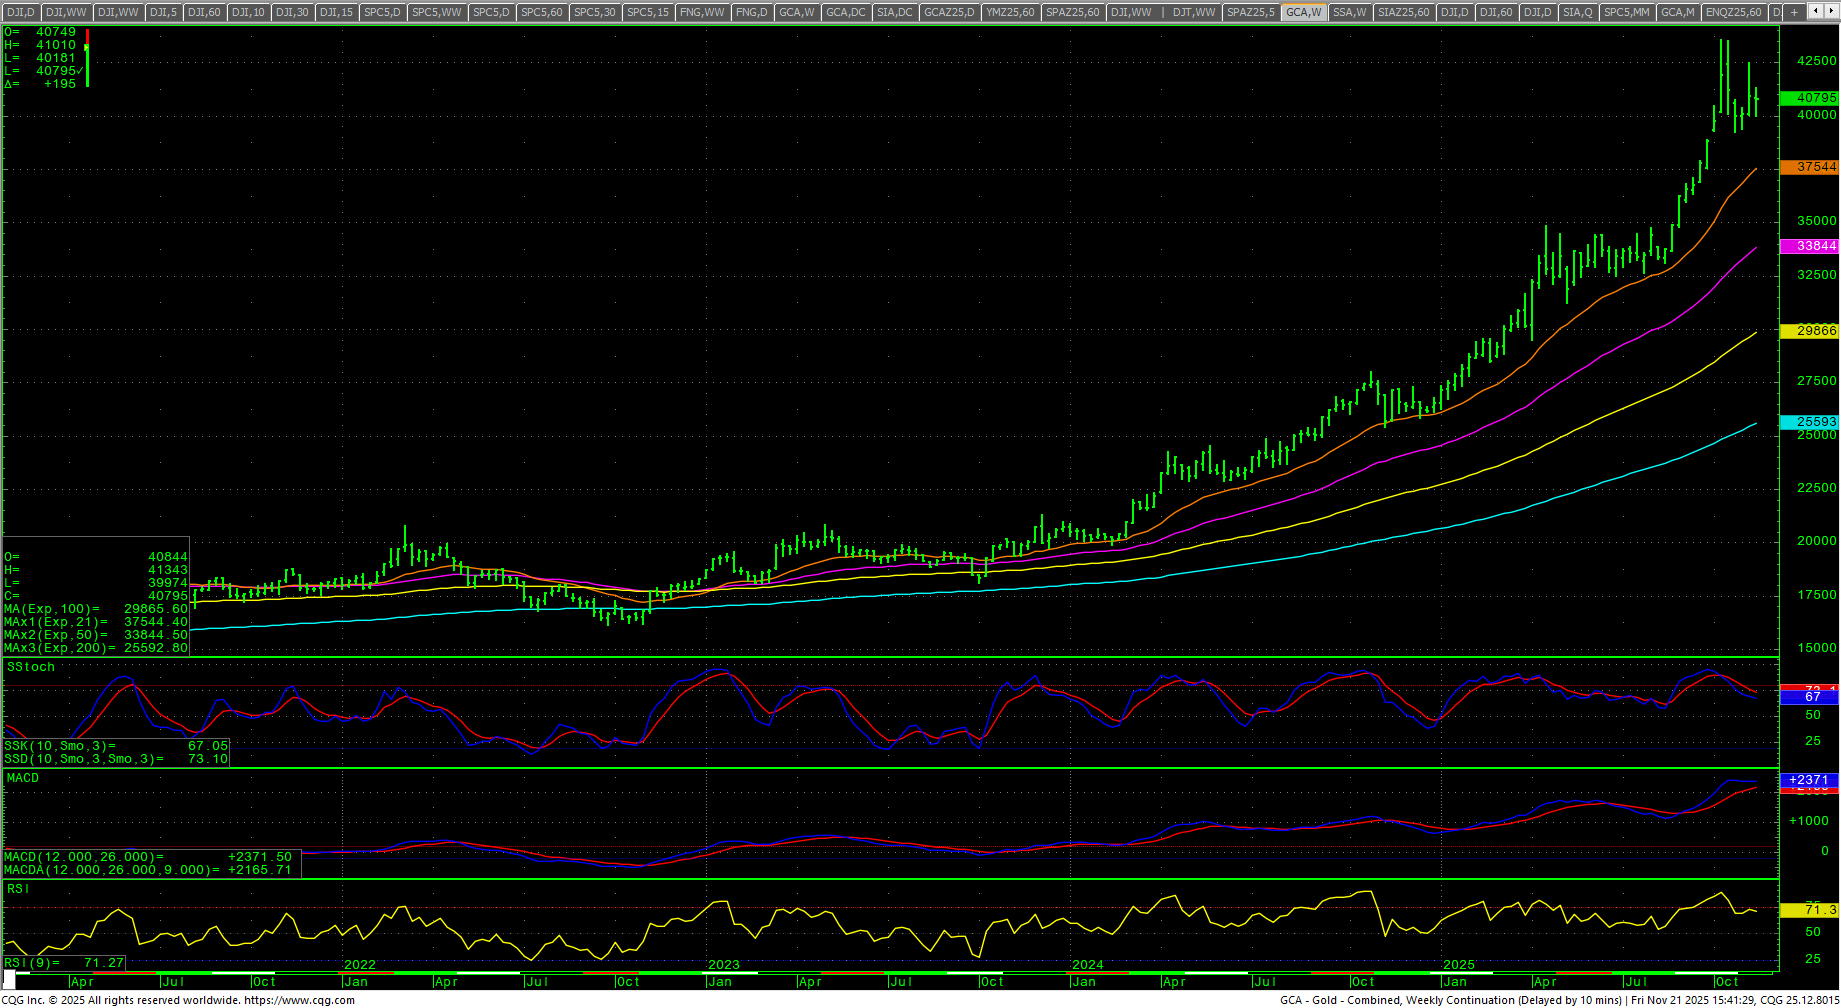
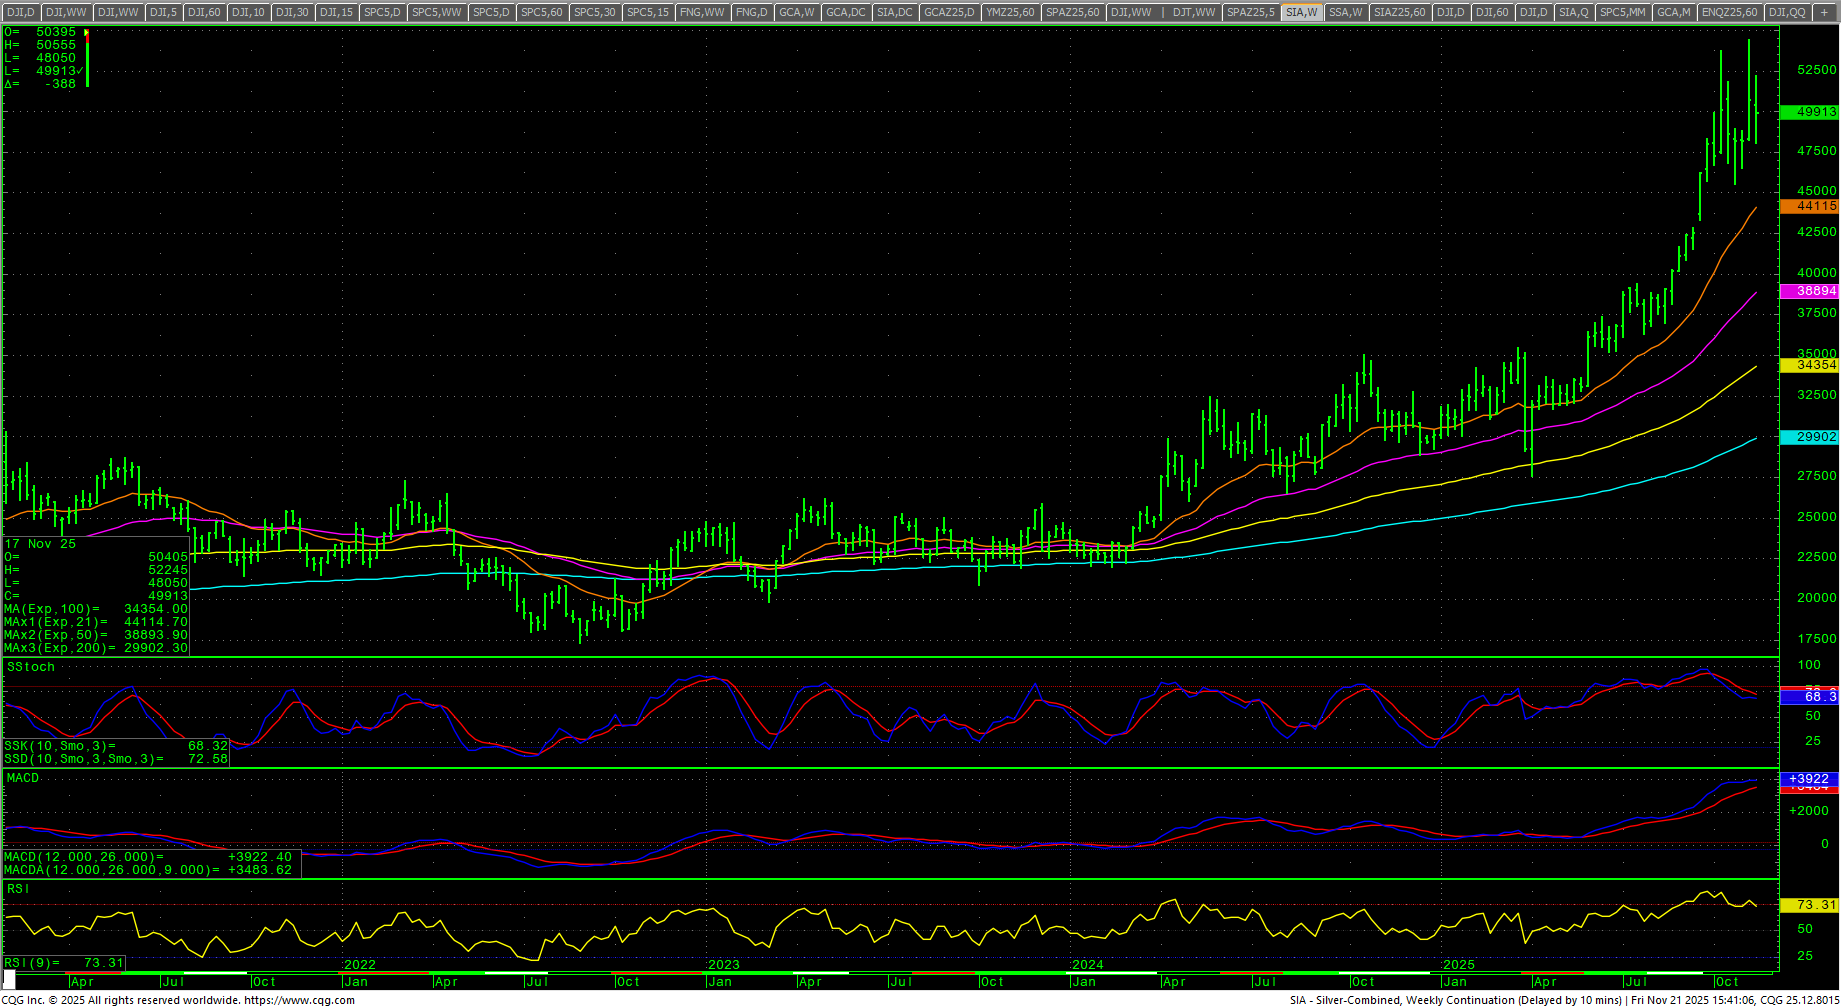
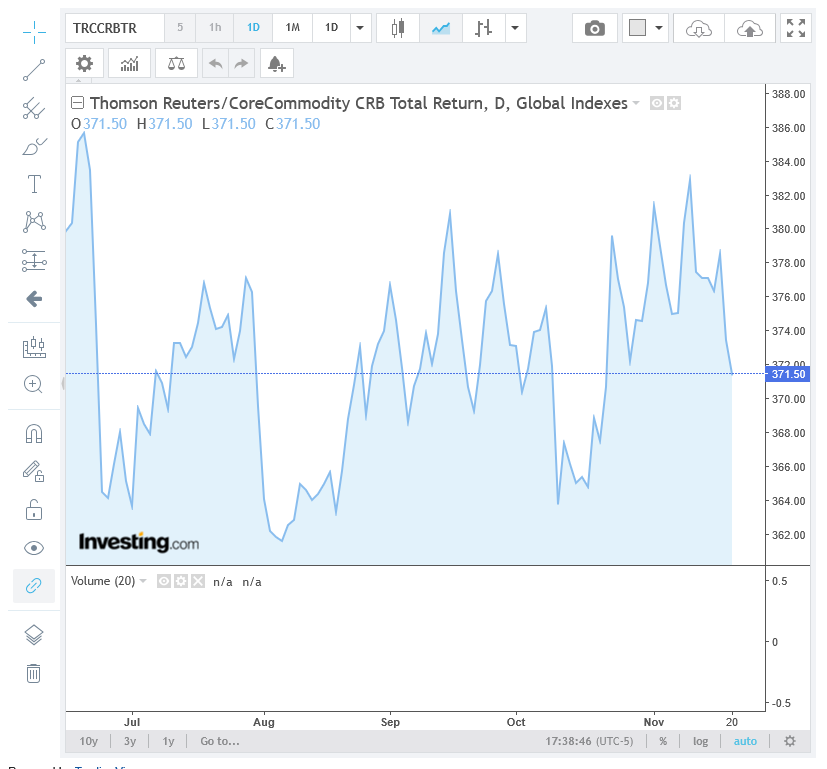 The CRB Index was down -1.49%. Crude Oil dropped back under the artificial floor at the critical $60 level for the second lowest weekly close for this move. Gold chopped around in a tight range and closed basically flat on the week as it holds the $4000 level. Silver traded a volatile week and settled lower in the middle of the week’s range.
Timing Points
Tuesday is minor timing. 12/04 is the next strong timing date. For a longer-term look at the timing, see the Special Report issued on 9 November 2025. 
- 11/25 **
- 12/04 ***
- 12/15 *** X may run through
- 12/17 *** X key to bonds/interest rates
- 12/24 **
- 01/09 *** X critical/fast moves
- 01/19-21 *** X
- 01/29-30 ***
Dow Jones Industrial Average
Dow Jones Industrial Average Weekly H-L-C
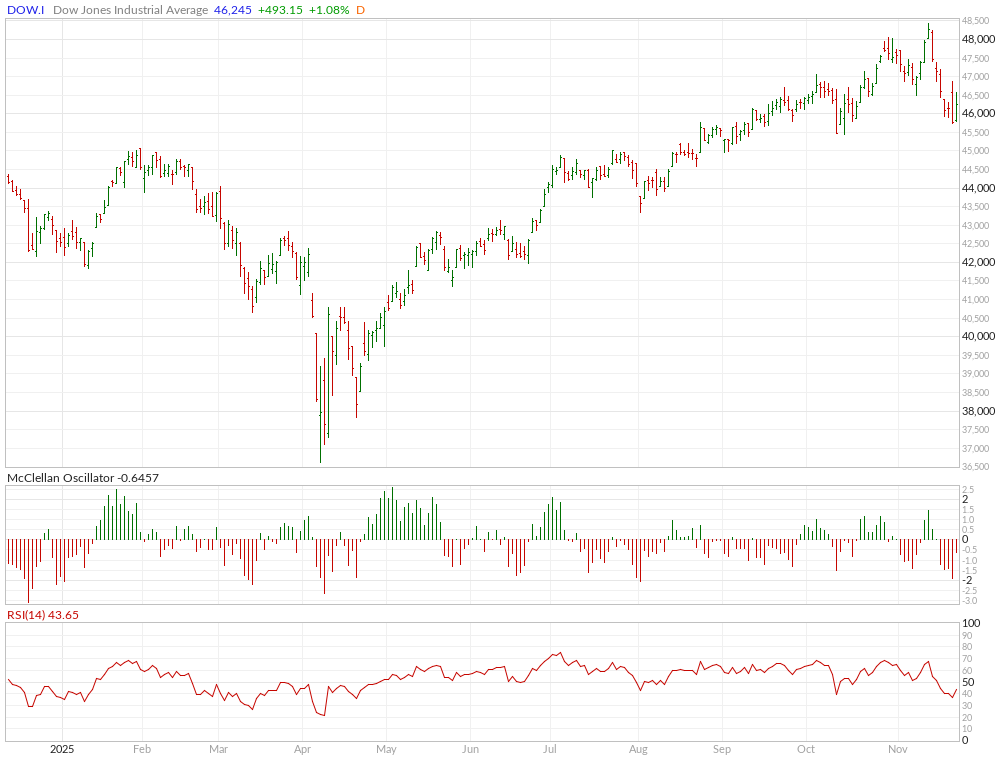
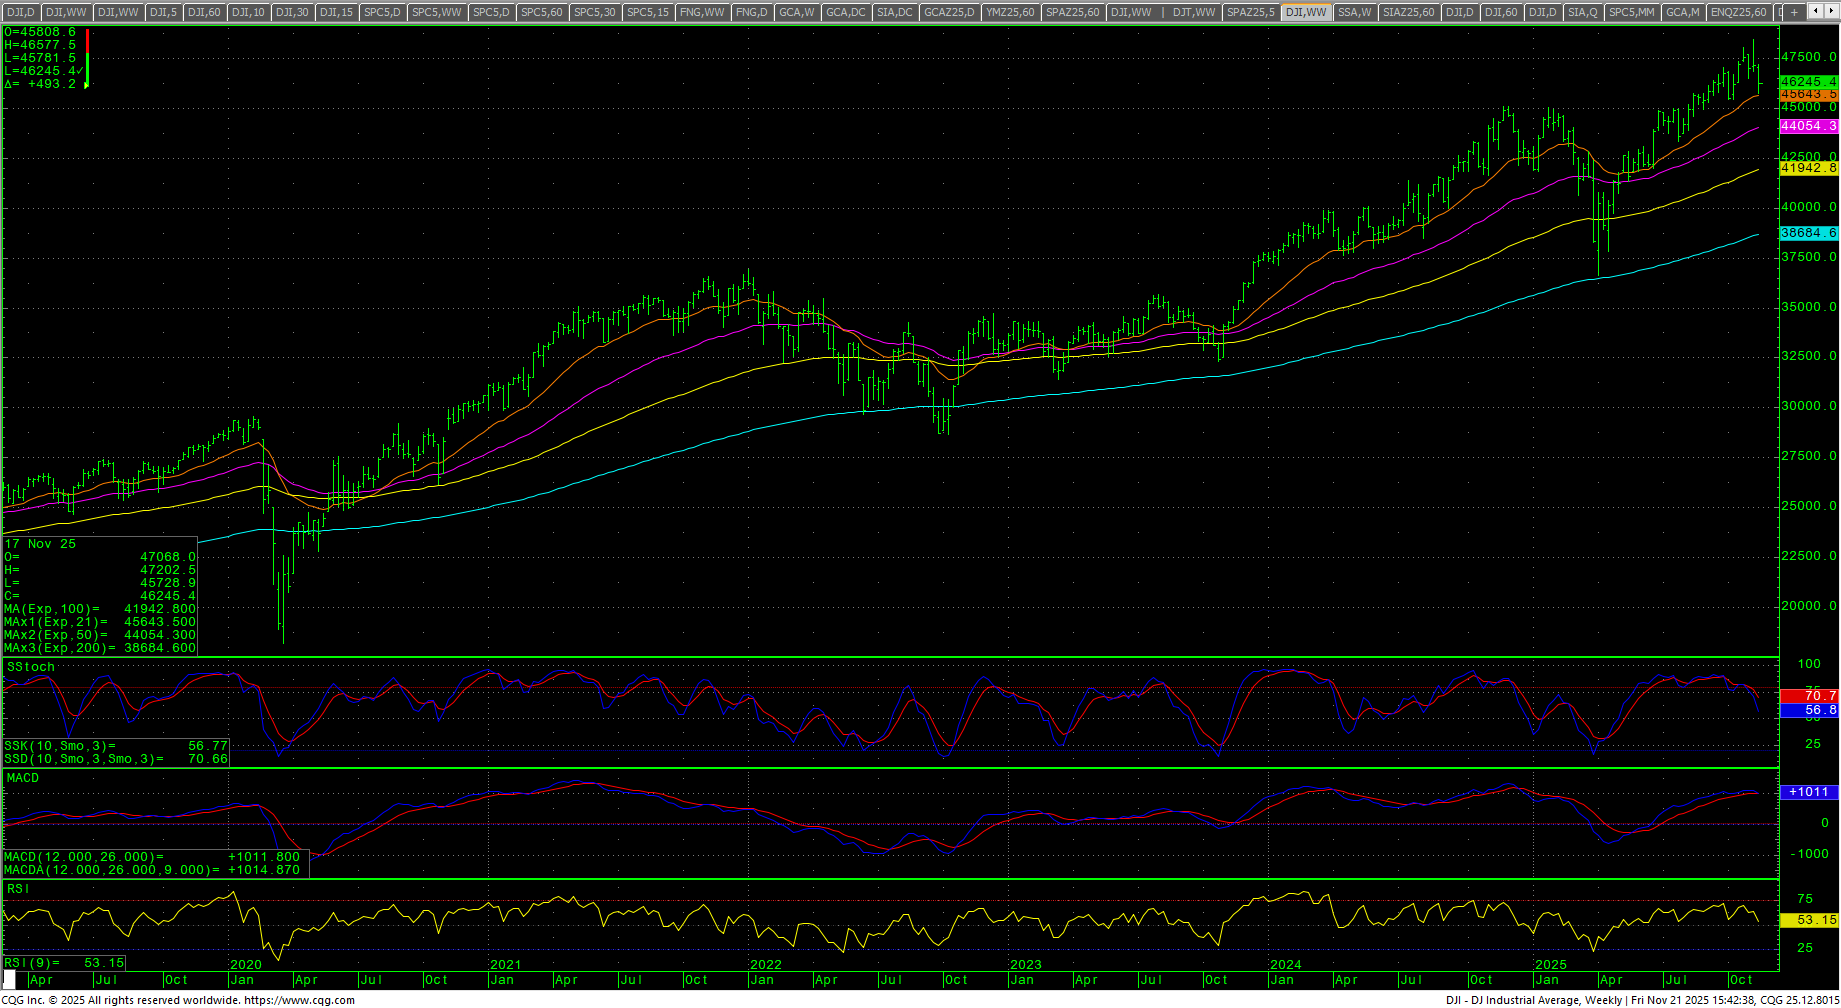 The Dow closed the week down -1.91% and near the lower end of the week’s range. Prices tested the 20-week MA and a trendline on the monthly. The daily stochastics are down. The MACD is down as it reacts to a bearish divergence. The daily RSI is 40.80. The 200-day MA starts the week at 44501.30 and is at record highs. The weekly is down as it reacts to multiple bearish divergences.
Dow Jones Industrial Average Weekly Candles
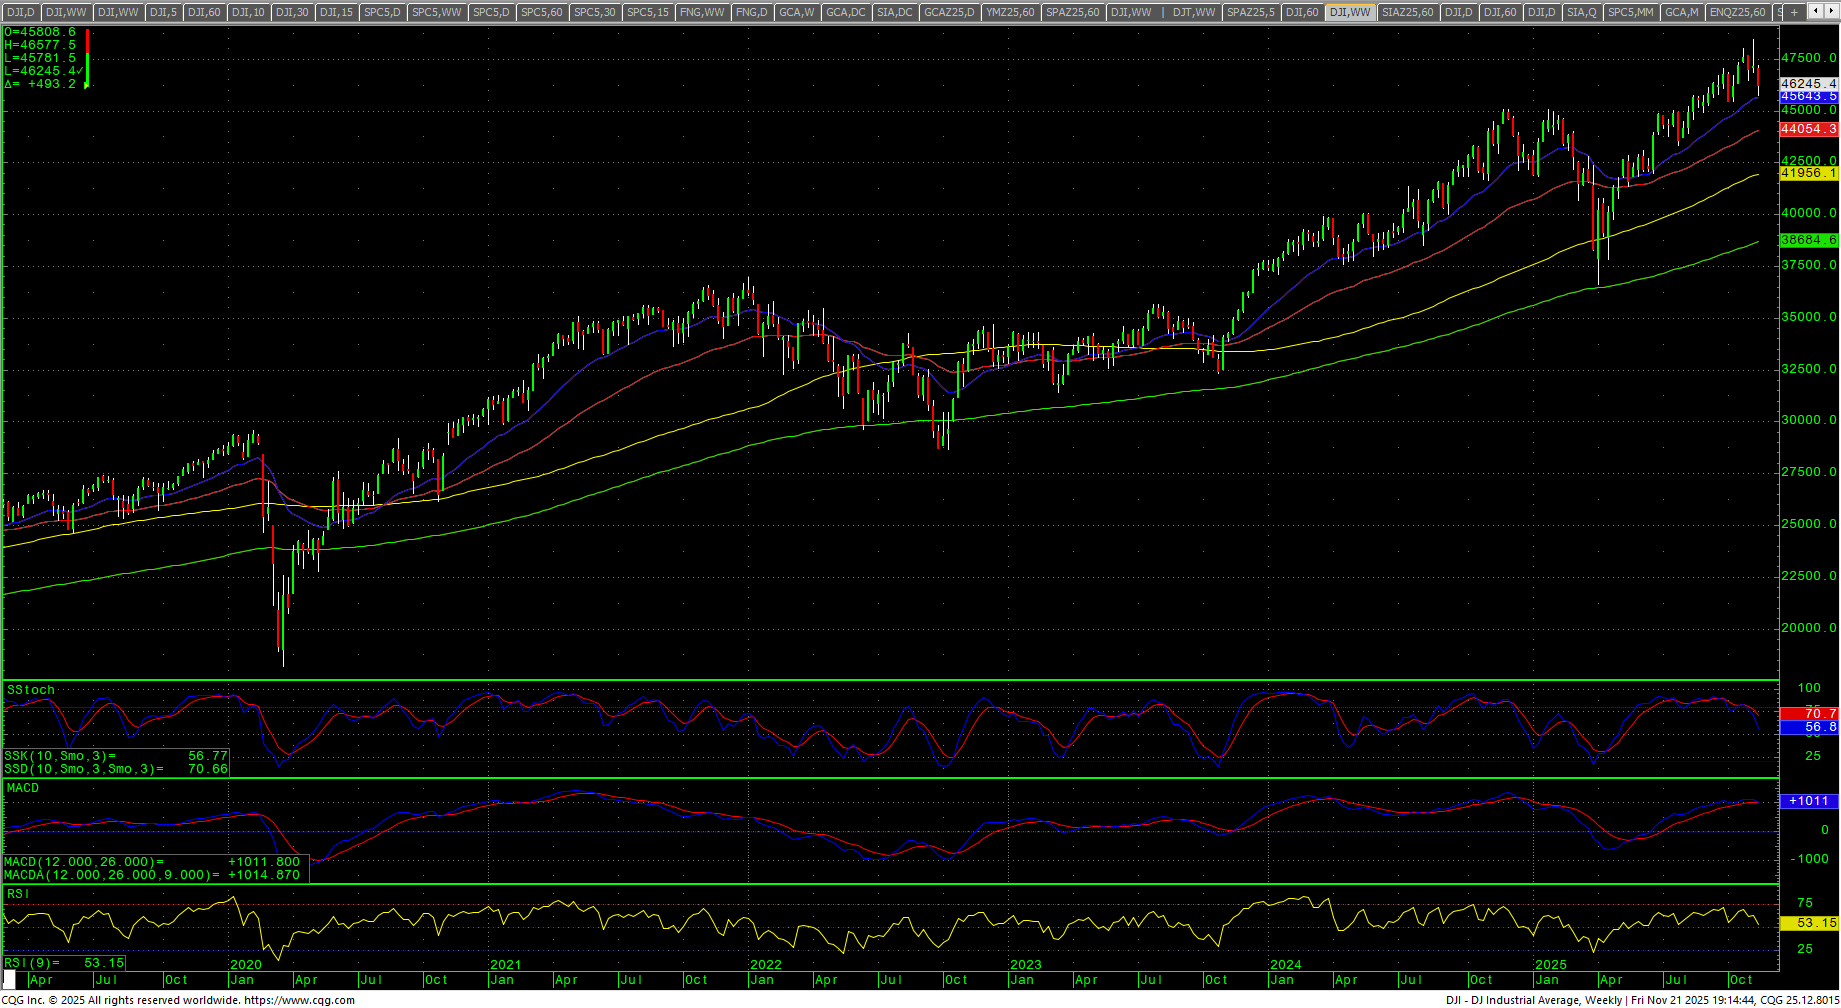 Support is 46151 and 46050/46046. A breakdown under 46046 should minimally test 45938 and sets up a retest of 45728. Closes under 45728 can test 45452/45450 with trading support at 45642. Under 45450 is a bearish signal and opens counts to 43916 with support at 44458/44948. Closes under 44948 should speed declines. Closes under 43916 setup critical support of 43340 with trading support at 43467. Under 43340 (before the end of the quarter) would be an extremely bearish signal and minimally suggest 42521 and would open long-term counts to 41126/41120.
Dow Jones Industrial Average Hourly H-L-C
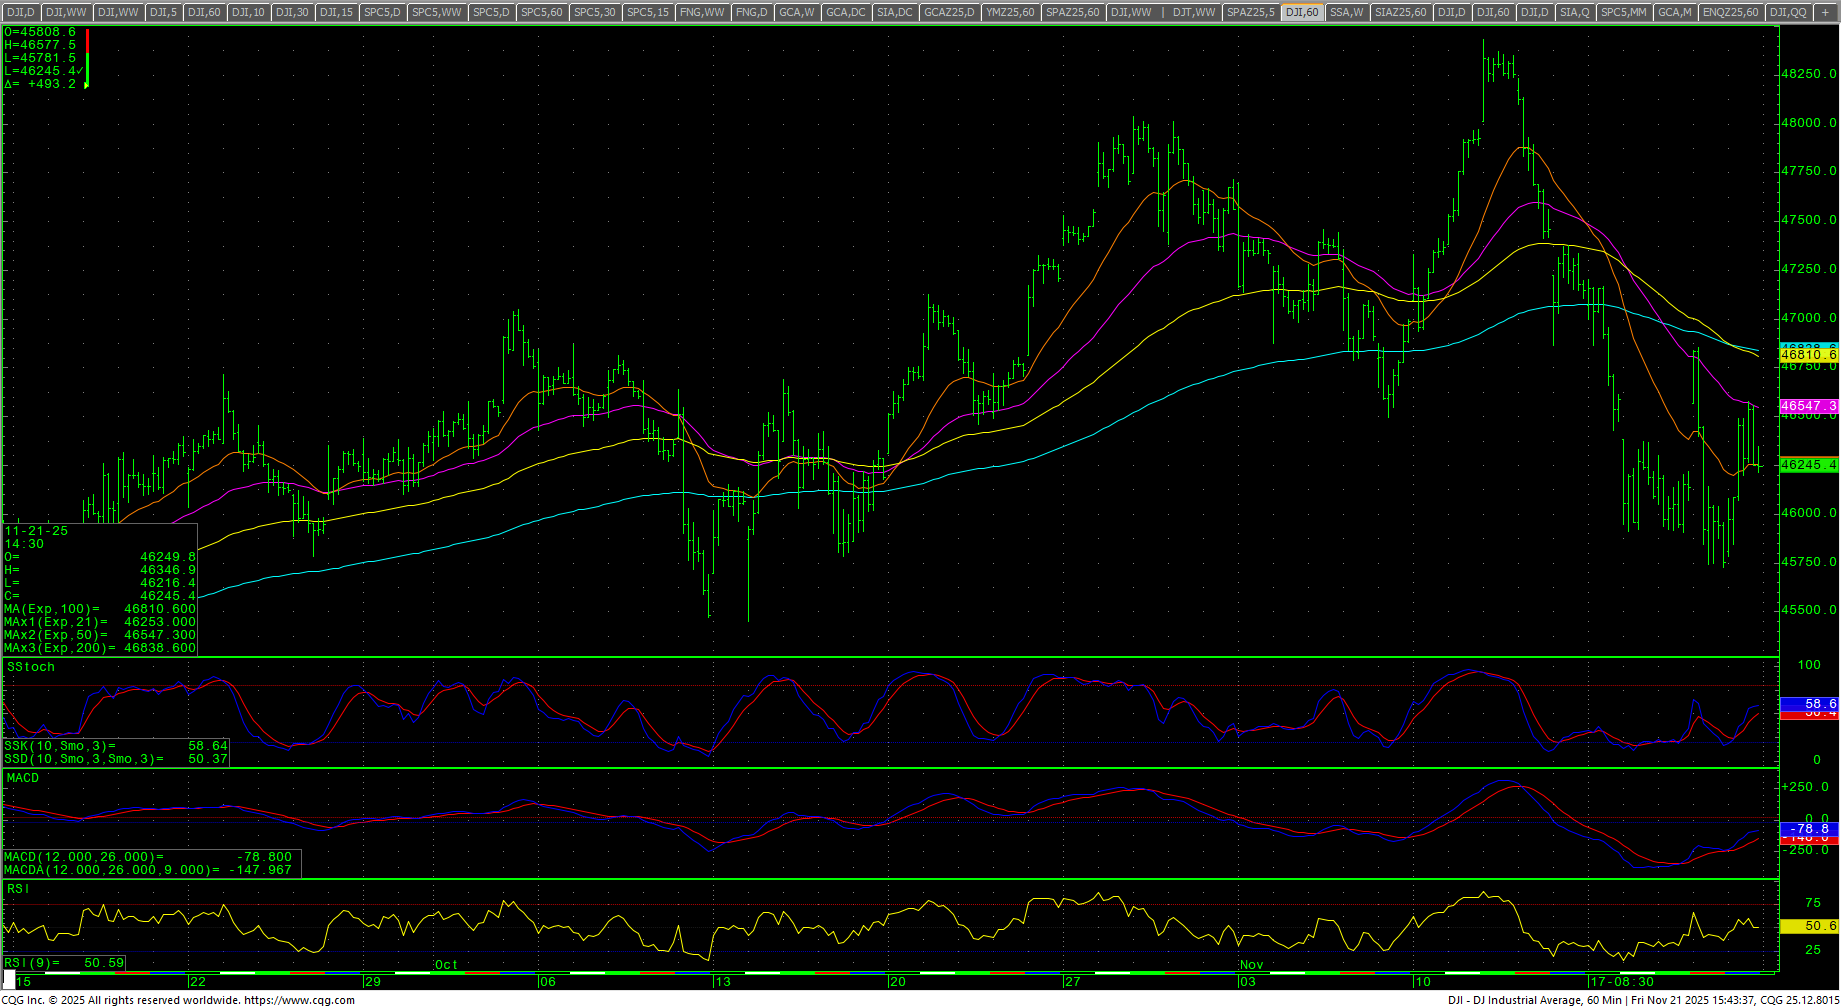 The hourly is neutral on Friday’s close. Resistance is 47233 and 47462. A breakout above 47462 sets up 47647 with full counts to 47832/47835. Closes above 47835 should minimally test 48040/48061 and will open potential for a retest of the record highs at 48430/48431. Daily closes over 48431 have potential to 48510. Closes over 48510 will open counts toward 48654 with potential to 48798. Above 48798 opens counts to 48942 and 49086.
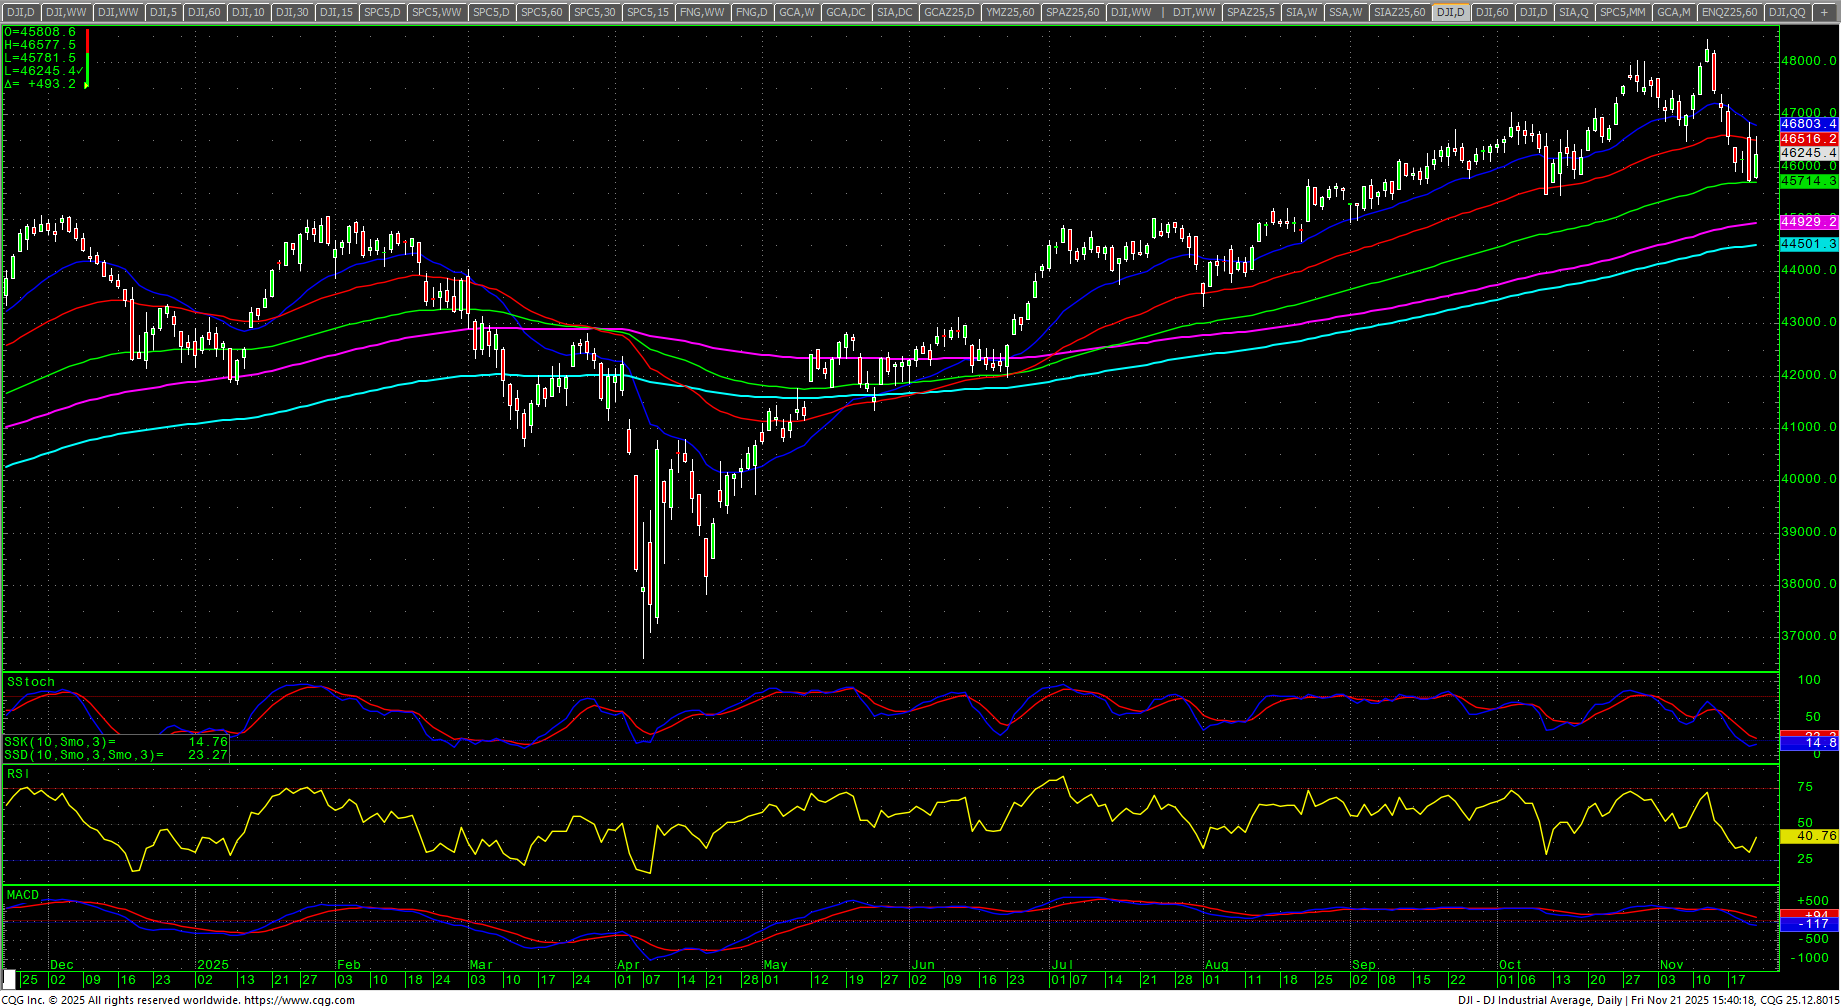
Dow Jones Industrial Average Daily Candles
| Resistance | Support |
|
|
S&P 500 Cash Index: SPX
S&P 500 Index Weekly H-L-C
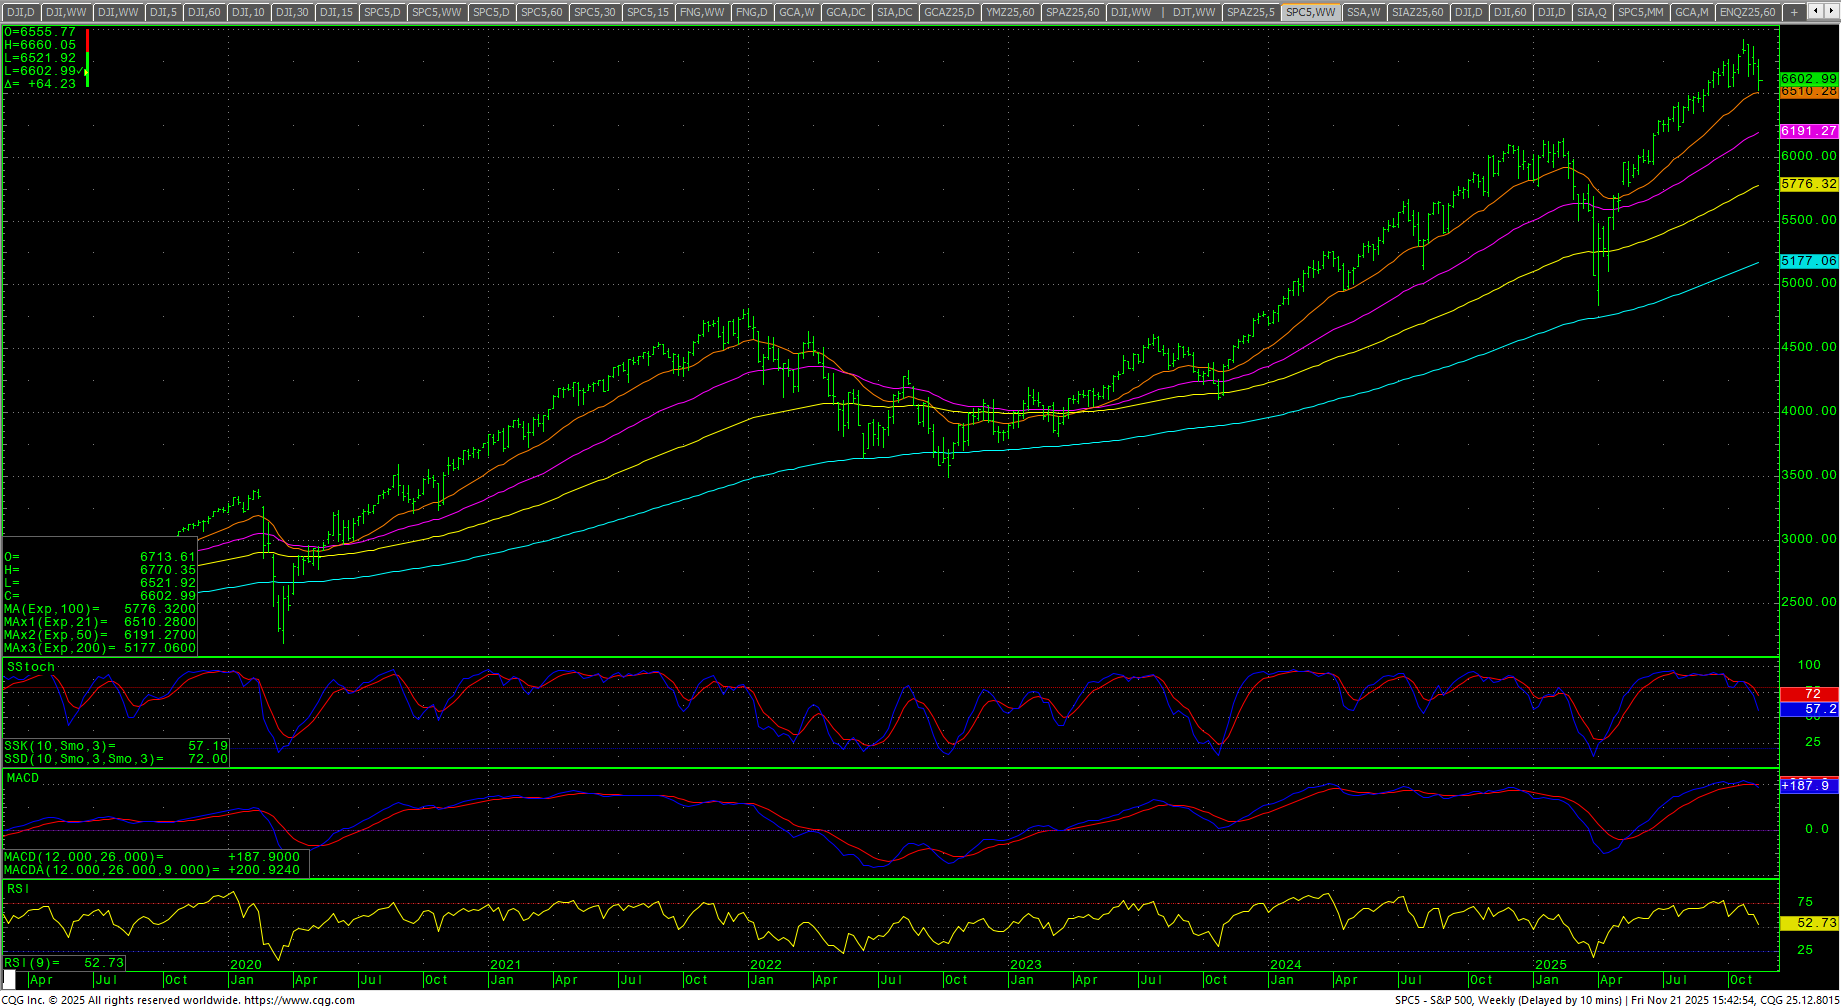 The S&P traded a volatile week with prices taking out the 50-day MA after 128 straight sessions above that average. Prices remain above the trendline breakout and that trendline currently sits at 6382.30. The market closed down -1.95% in the bottom part of the weekly range. The SPY found weekly support against a key trendline breakout level. The daily chart is down in the stochastics and MACD is down and bearish as they both react to recent bearish divergences. The daily RSI closed at 37.73. The weekly is down reacting to a significant bearish divergence. The hourly is neutral with Friday’s close and coming off oversold conditions. The 200-day MA is 6283.57 and at record highs.
SPY Weekly Candles
 Prices took out the key hourly support level at 6555/6550 and settled above that level after a strong rally on Friday. Support is 6590 and 6574/6572 and 6550. Closes below 6550 suggest a retest of 6521 and opens counts to 6361/6360. A breakdown under 6360 should test 6123 with full counts into the 6044 level with critical hourly support at 6212/6201 and 6123. Daily closes under 6044 should minimally test 5877 and 5799/5798 with full counts to 5631/5628.
S&P 500 Index Hourly H-L-C
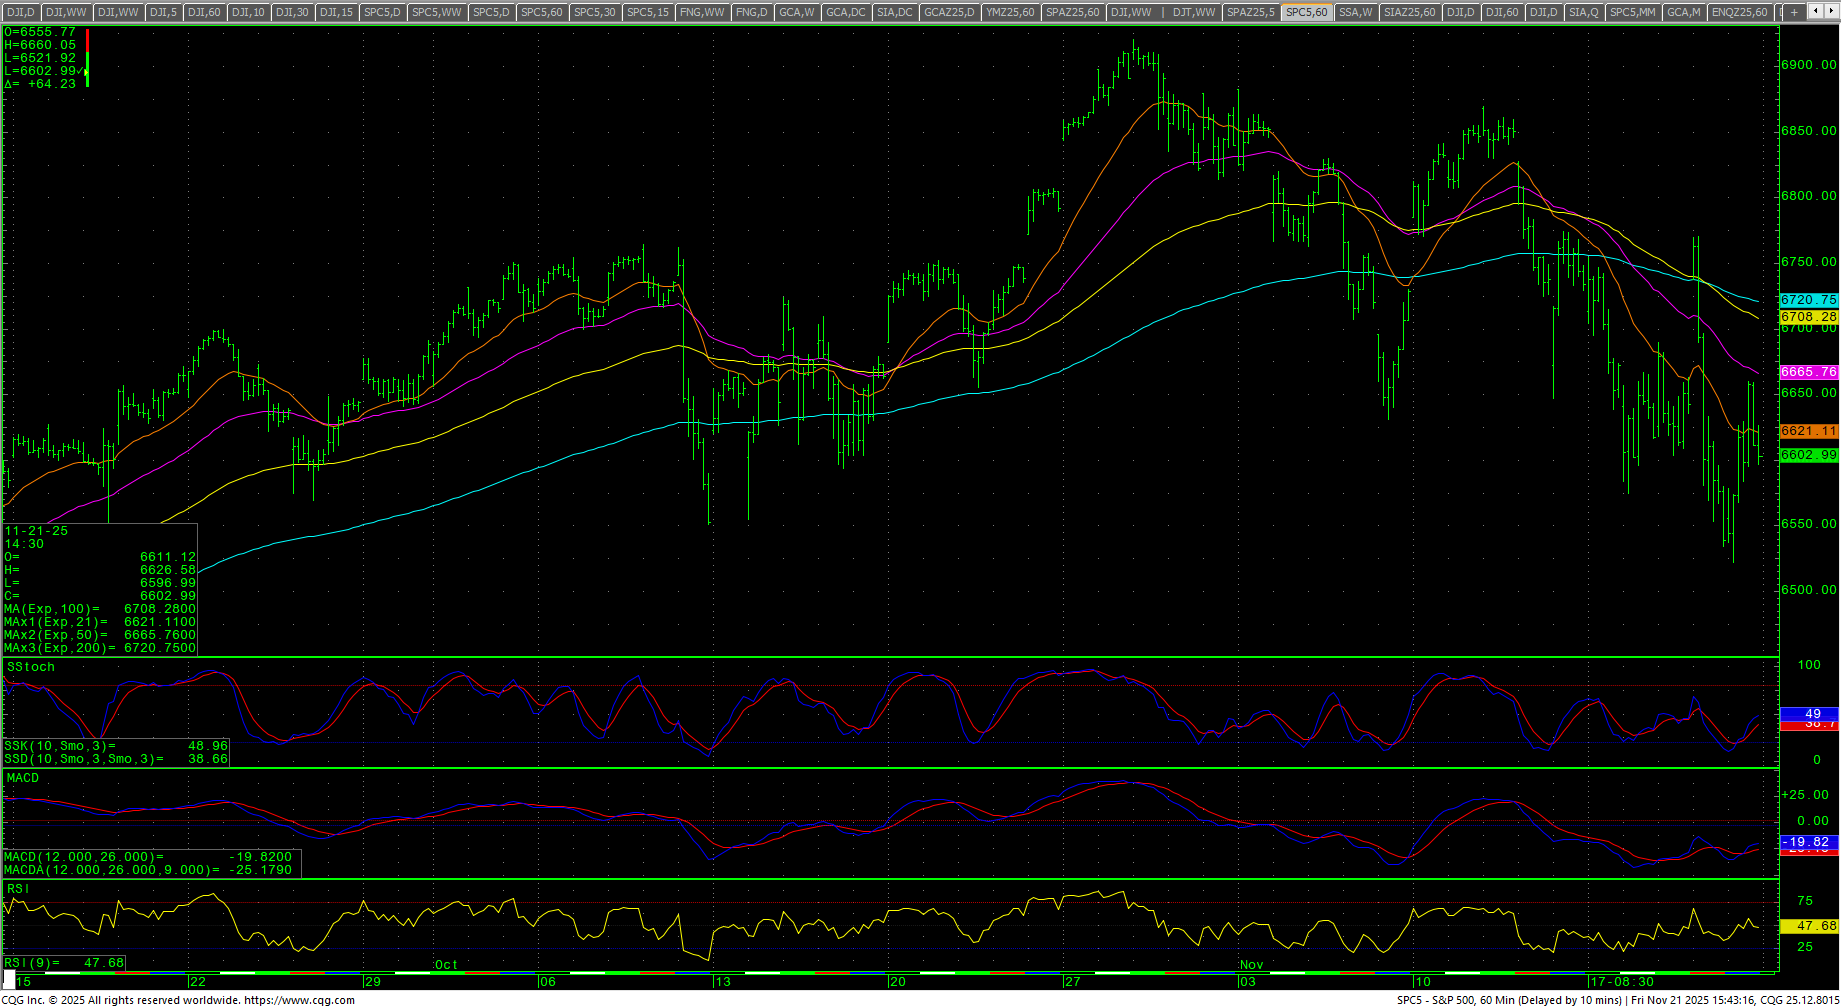 Resistance is 6615, 6660 and 6689/6690. A drive above 6690 can test 6722 with counts to pivotal short-term resistance at 6768/6771. A breakout with closes over 6771 sets up 6820/6826 and opens potential to 6882 and 6908/6920. Closes over 6920 open counts to 6944 and 6980 through 7016. A close over 7016 offers counts to 7088, 7160 and 7214. Closes over 7214 setup a drive to 7250 and 7286 while opening counts as high as 7448. Above 7488 counts to 7520 and 7592. A drive above 7592 can test 7664 with counts to 7736 and as high as 7808.
| Resistance | Support |
|
|
Charts courtesy of CQG, Inc., CNN, Koyfin, Trading View and AAII