
TECHNICAL ANALYSIS (by Intraday Dynamics)
Major Indices Week of December 5, 2025
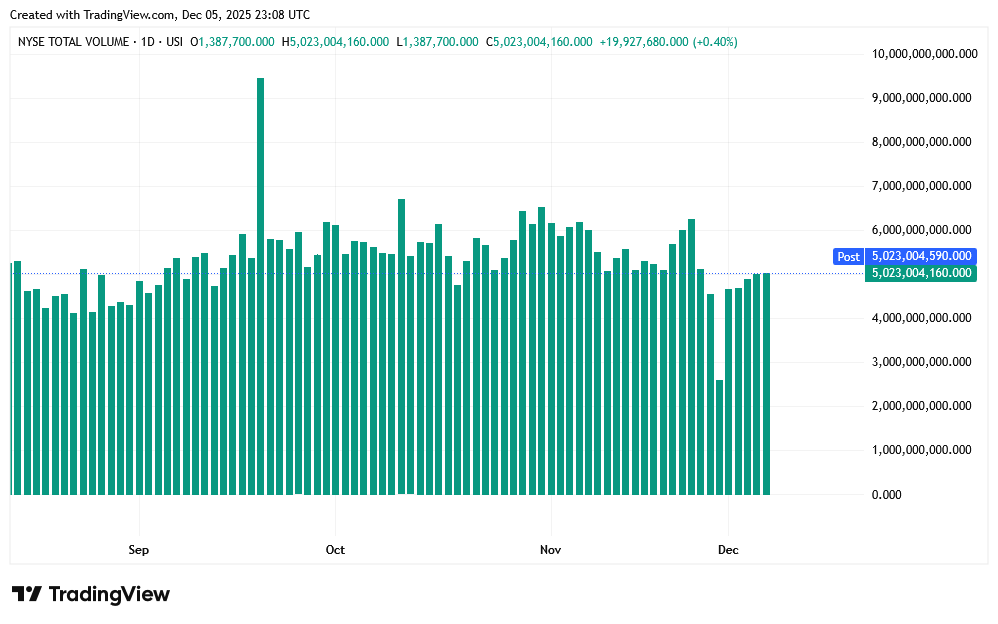
 NYSE Volume
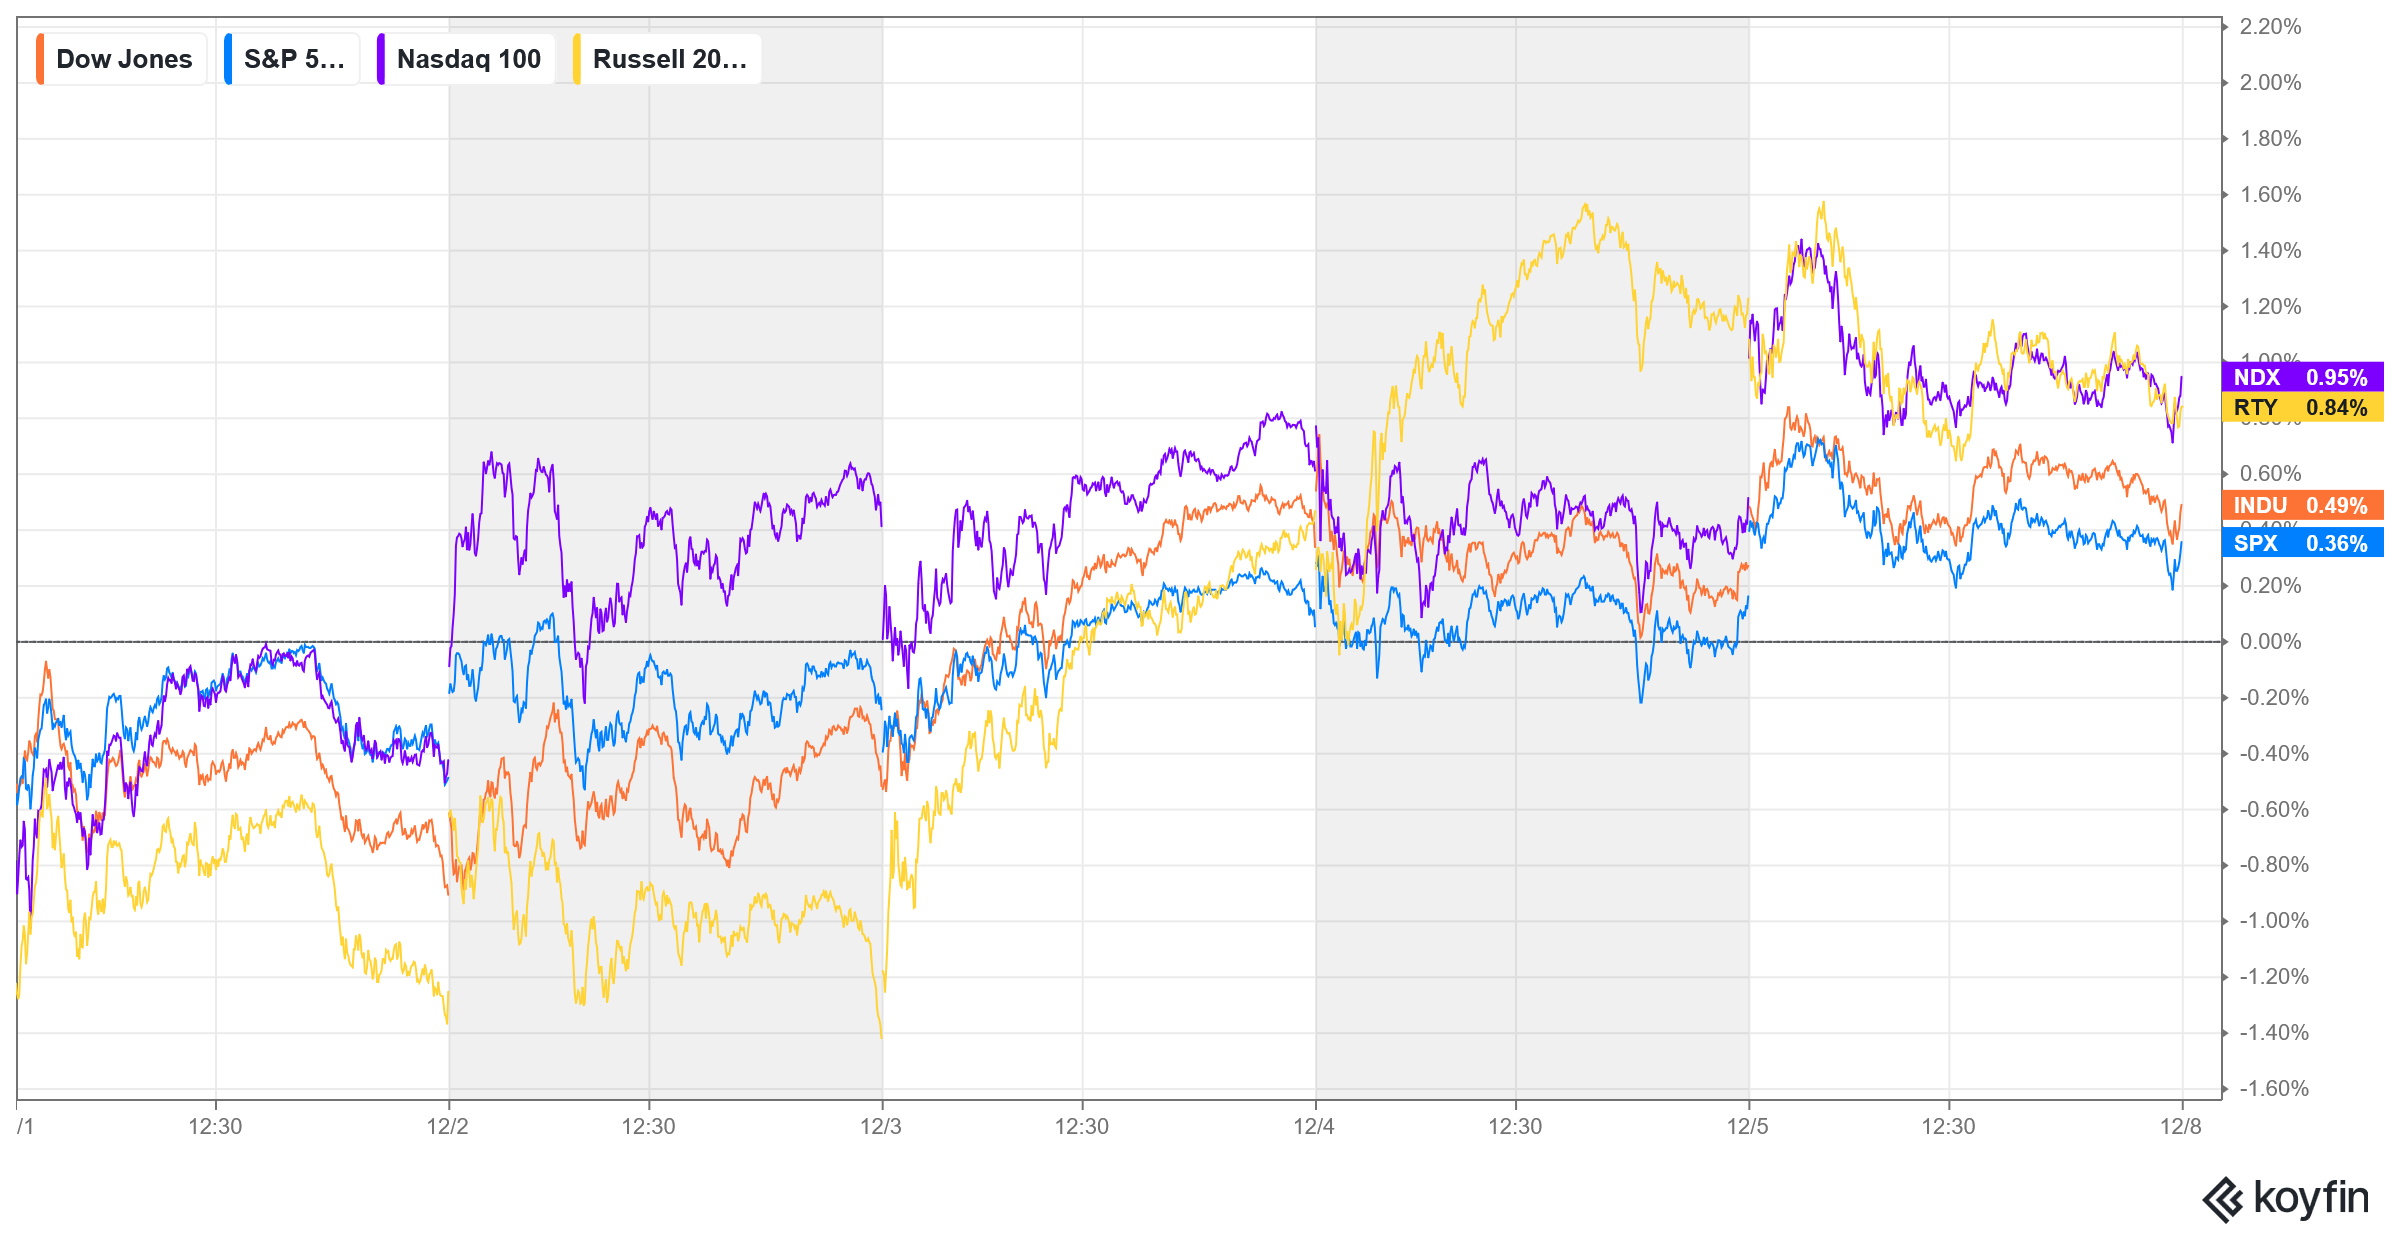
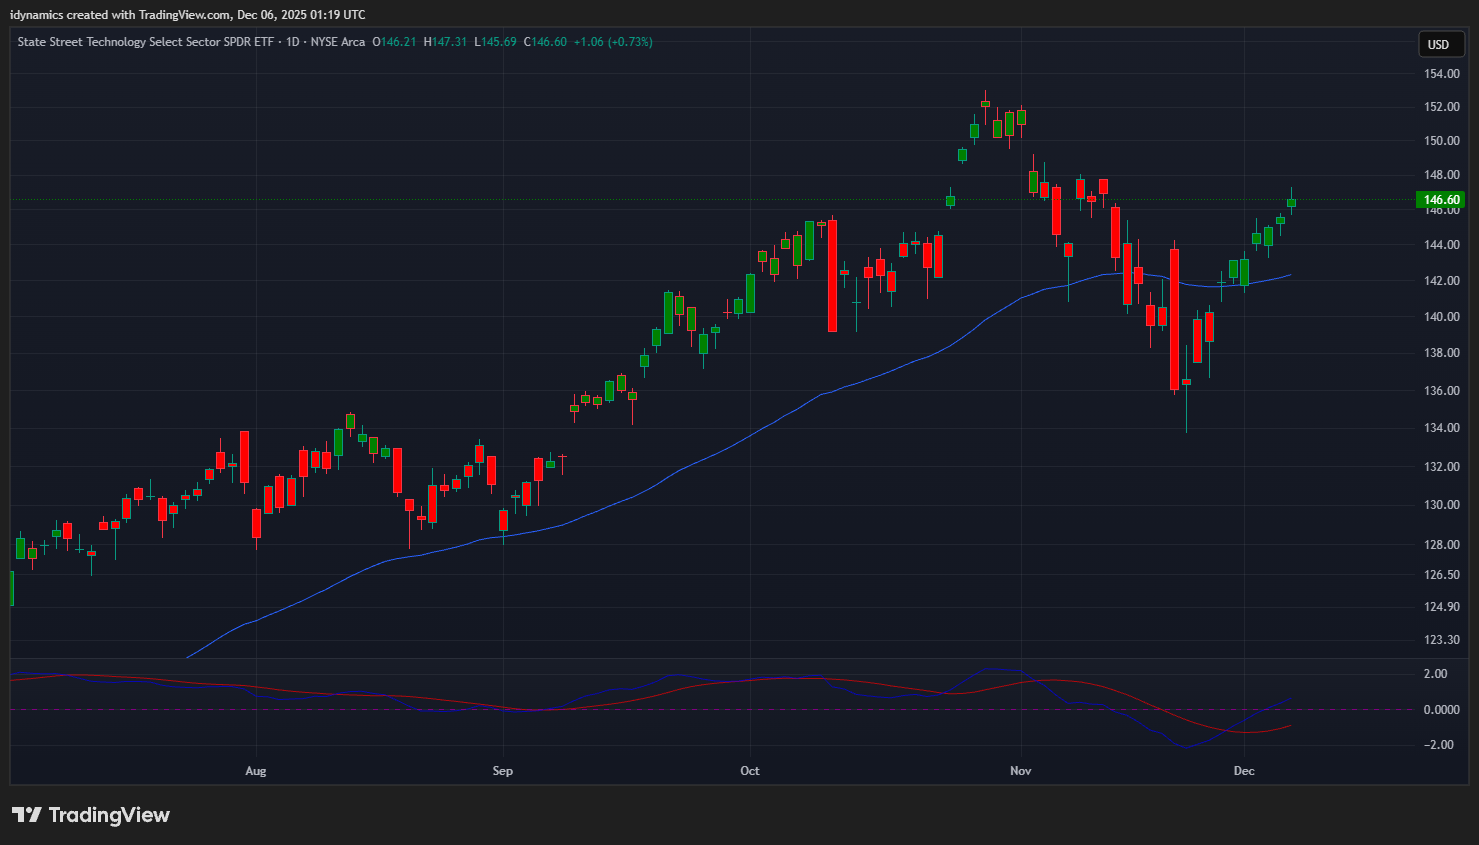
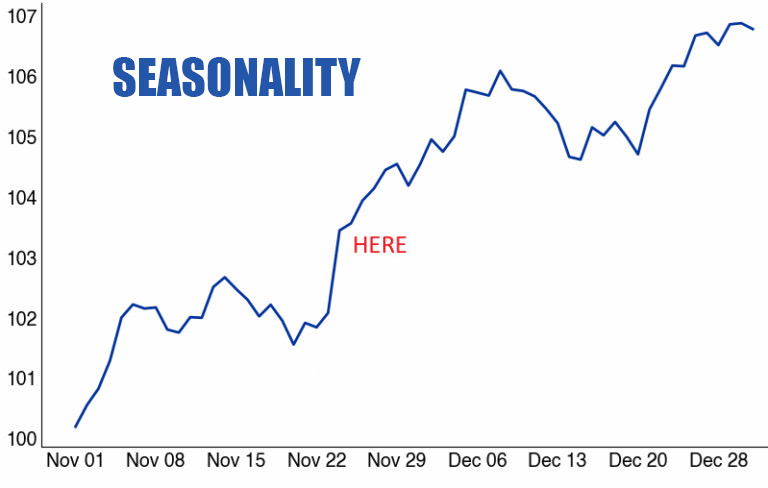
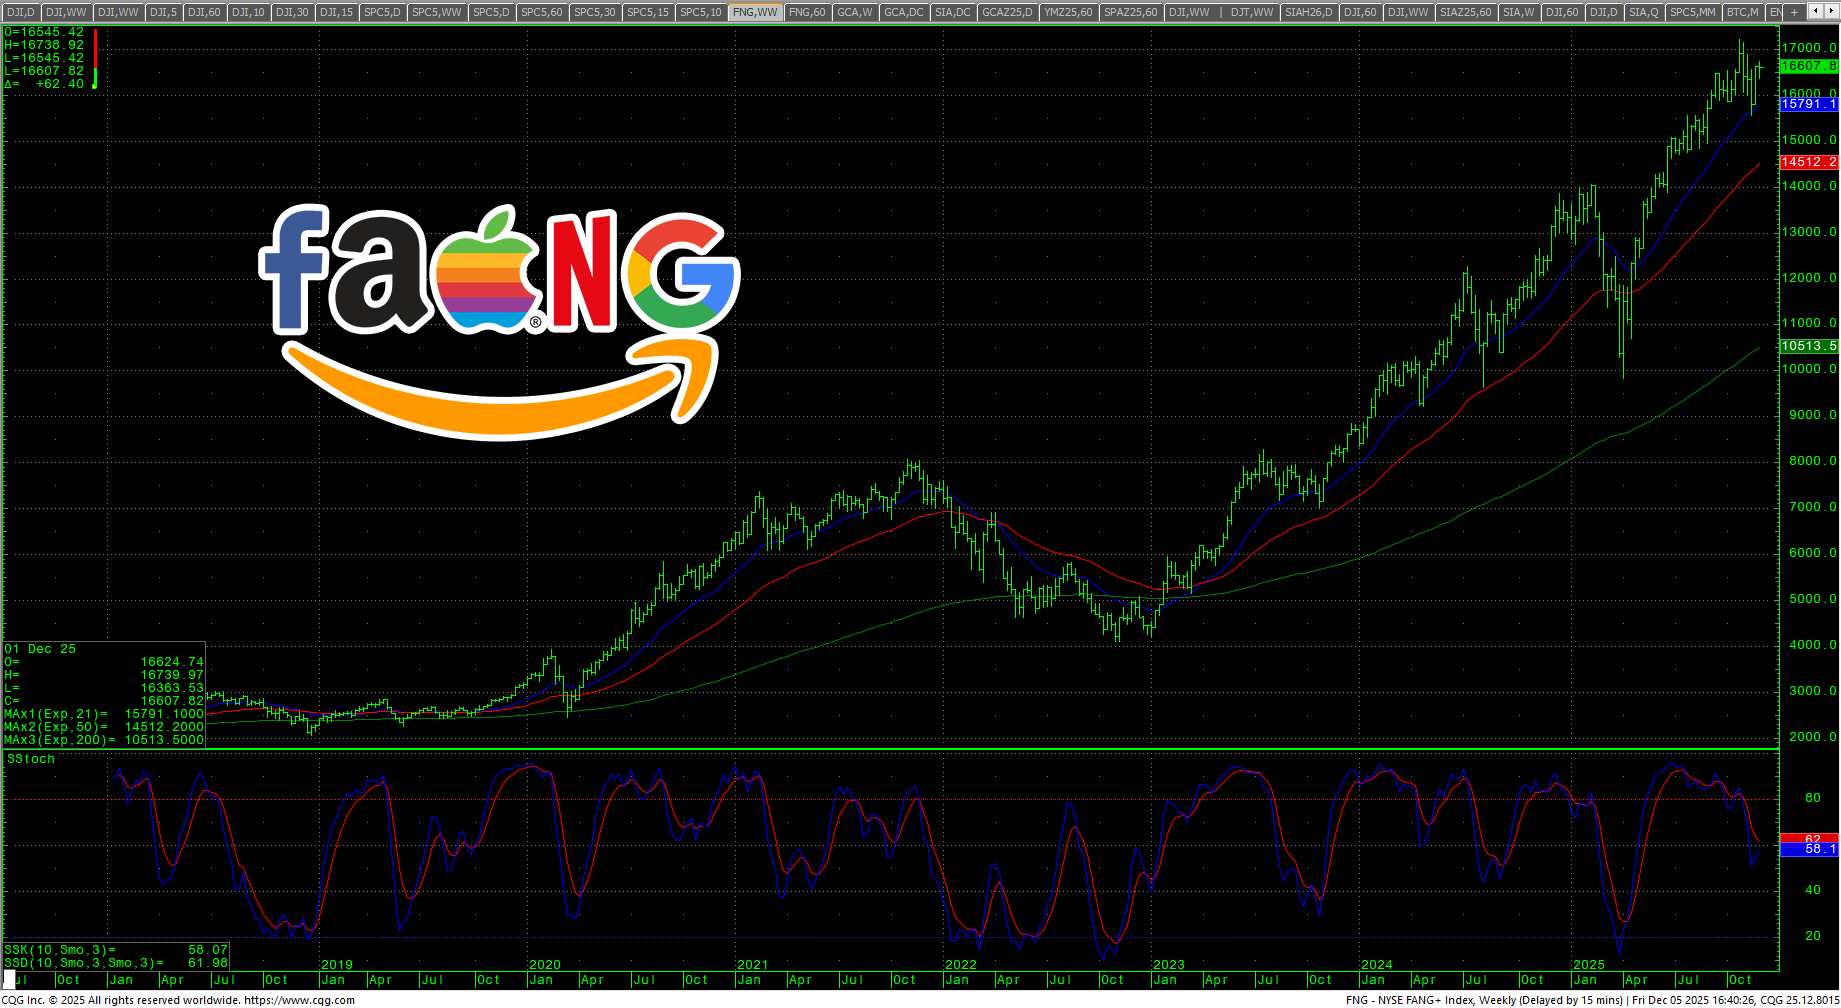
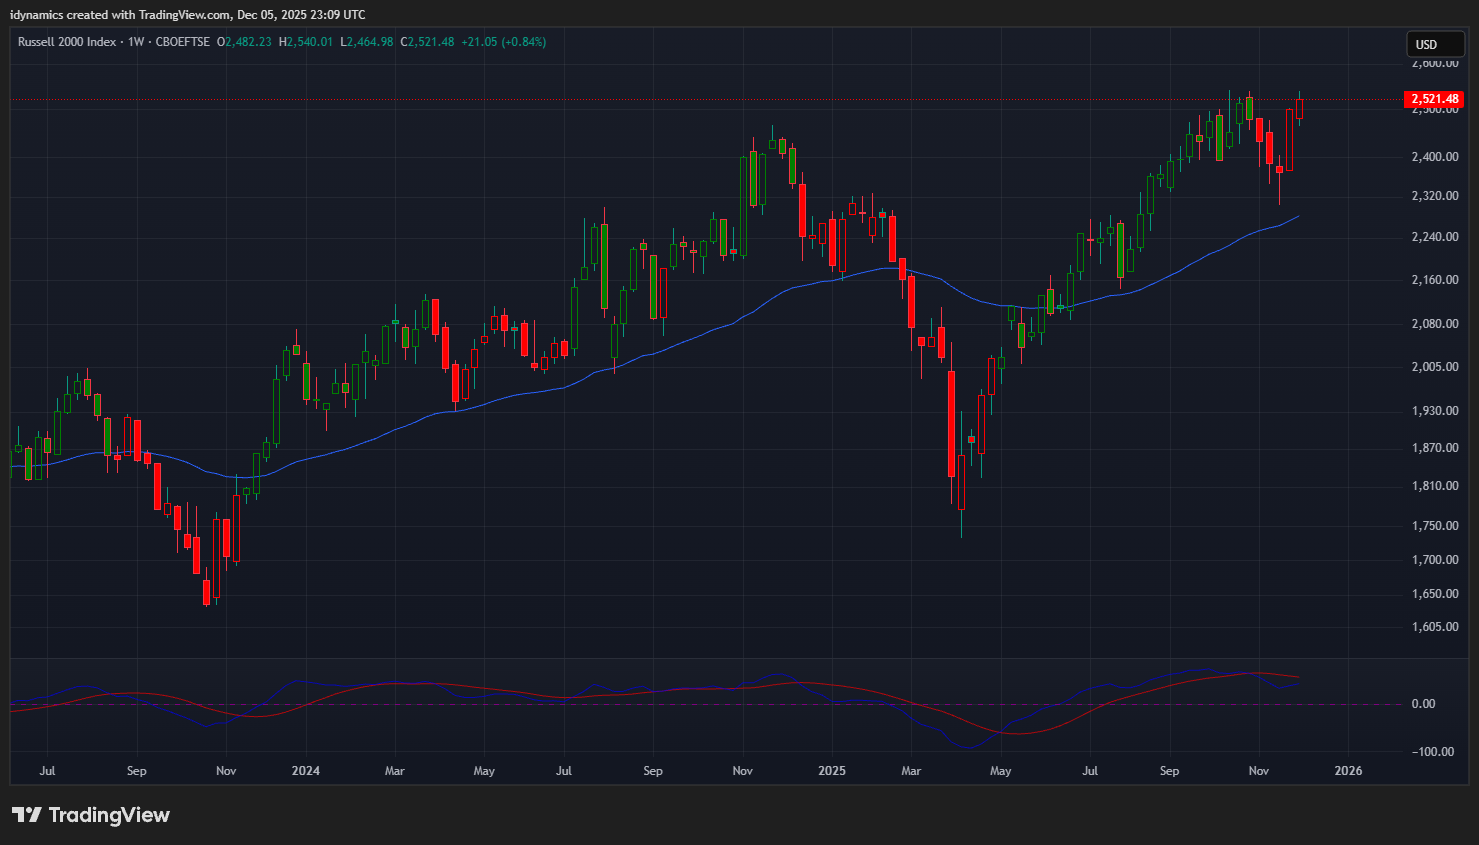
 As goes tech, so goes the market (See: XLK). Stocks traded a bullish structure throughout most of the week with the Dow and SPX both setting record closing highs on the weekly charts as prices respond to the seasonal trends for the month of December. The friendly structure in the technicals has carried the pedestrian sentiment off its extremely oversold readings and some charts are building structure for a potential thrust. The FAANG ended the week lower while the Russell moved to an ATH and the Nasdaq rallied. The XLK has seen nine days up…a very strong run off the swing lows. The other chart that has made a bull run is the Dow Transports…this is sometimes a harbinger of a liquidity infusion on the horizon.
Margin Debt
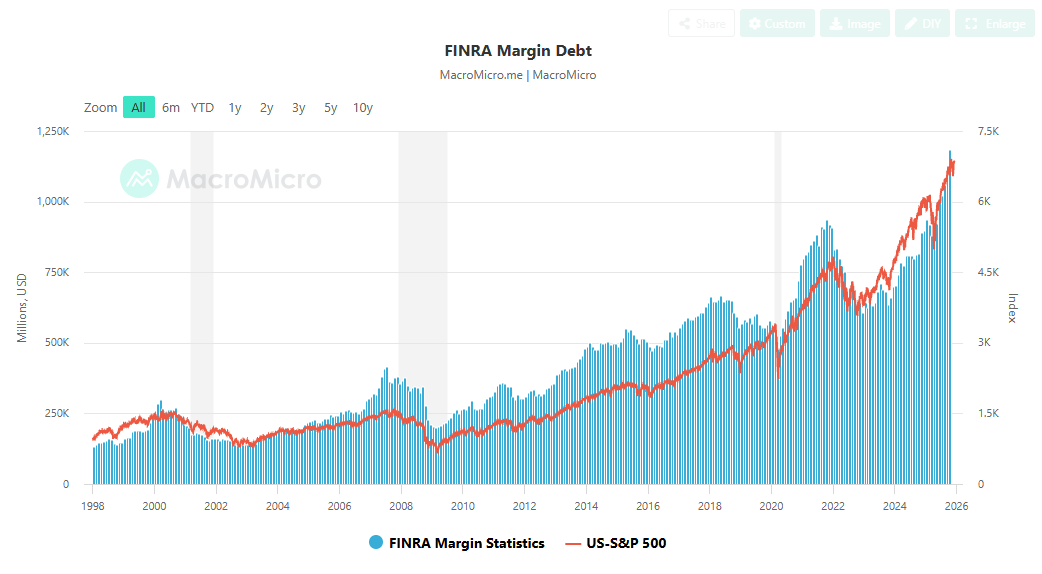 It is important to note that Retail continues to drive the market, with the past 8 days seeing over $2B invested by retail traders as margin debt hits record highs. Buy the Dip remains strong…whether these are salmon that will fatten a coming bear remains to be seen.
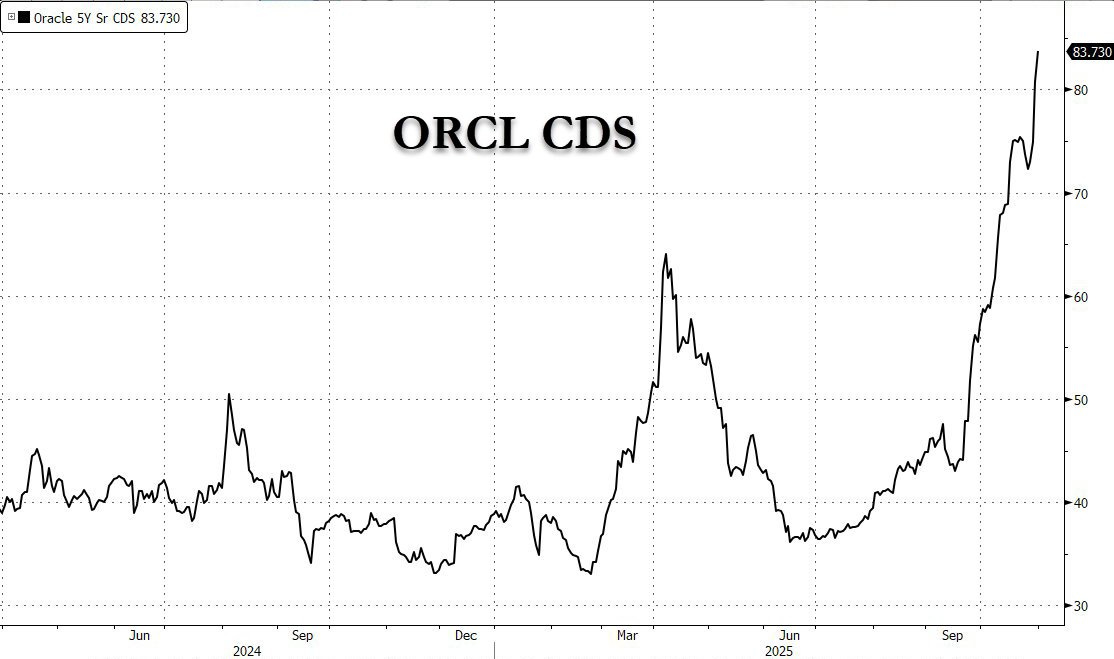
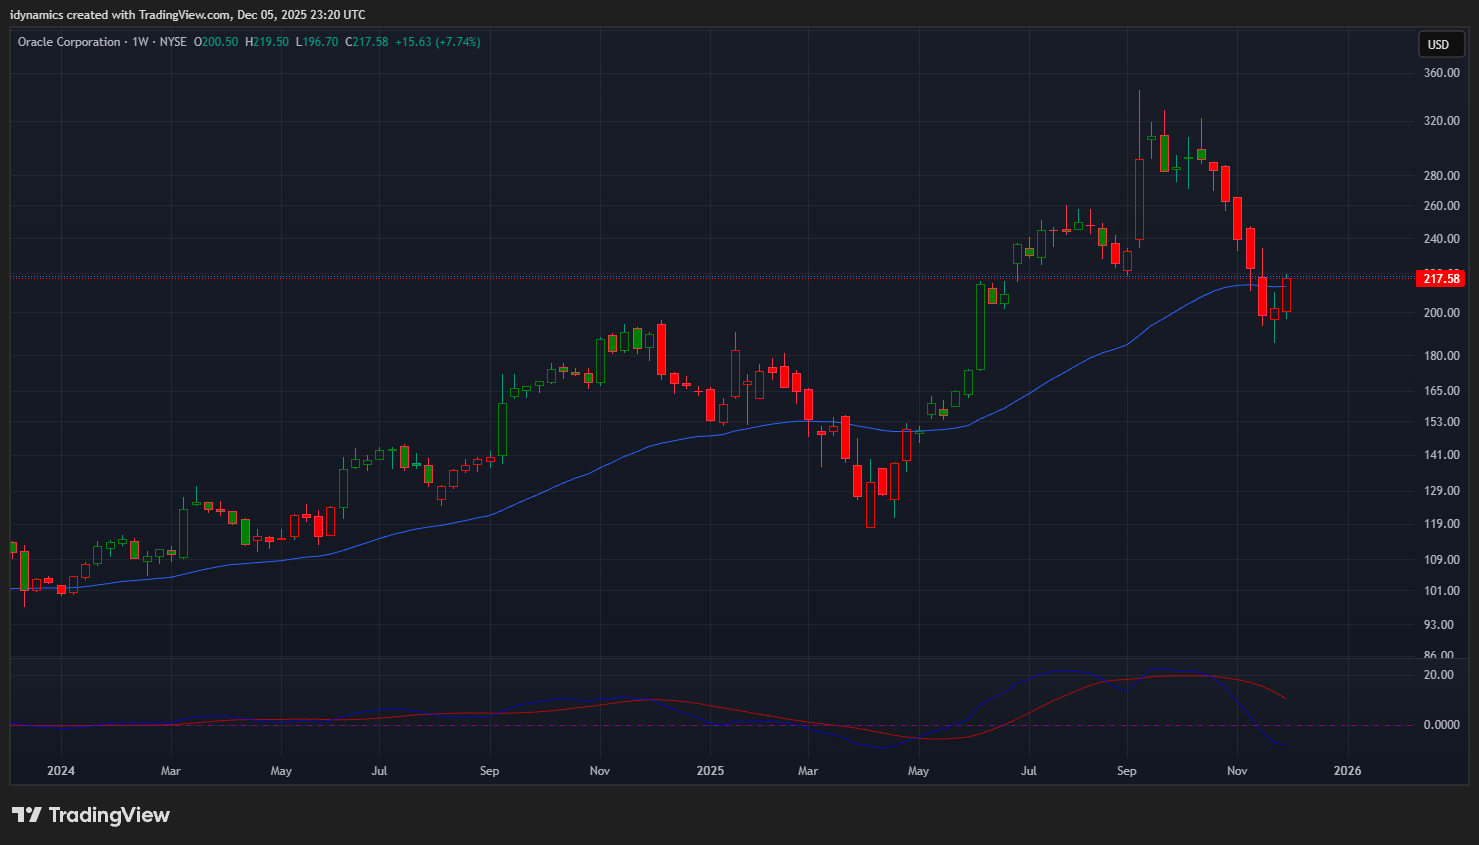
 One chart that has produced some discussions around sketchy financing and the AI Boom/Bubble is Oracle/ORCL. The credit default swaps have gone ballistic, at the same time the Fed injected $13.5 billion into the system…and this has some people looking at the debt bubble that AI and the data centers are creating.
Mixed Messages
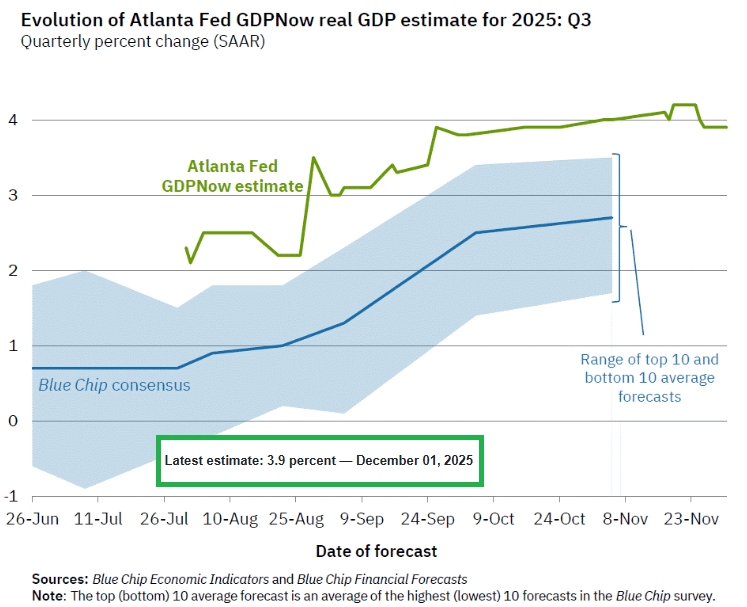
 The reality remains that ten stocks are holding up the entire market and U.S. economy while the macro indicators remain extremely mixed if not outright infirm. Inflation is sticky and employment is sketchy with the economy losing 1,170,821 jobs so far in 2025. At the same time, Q3 GDP is expected to come in strong at 3.9%…all based on CAPEX spending on data centers, while mom and pop businesses are being crushed.
Dow Transports Daily H-L-C
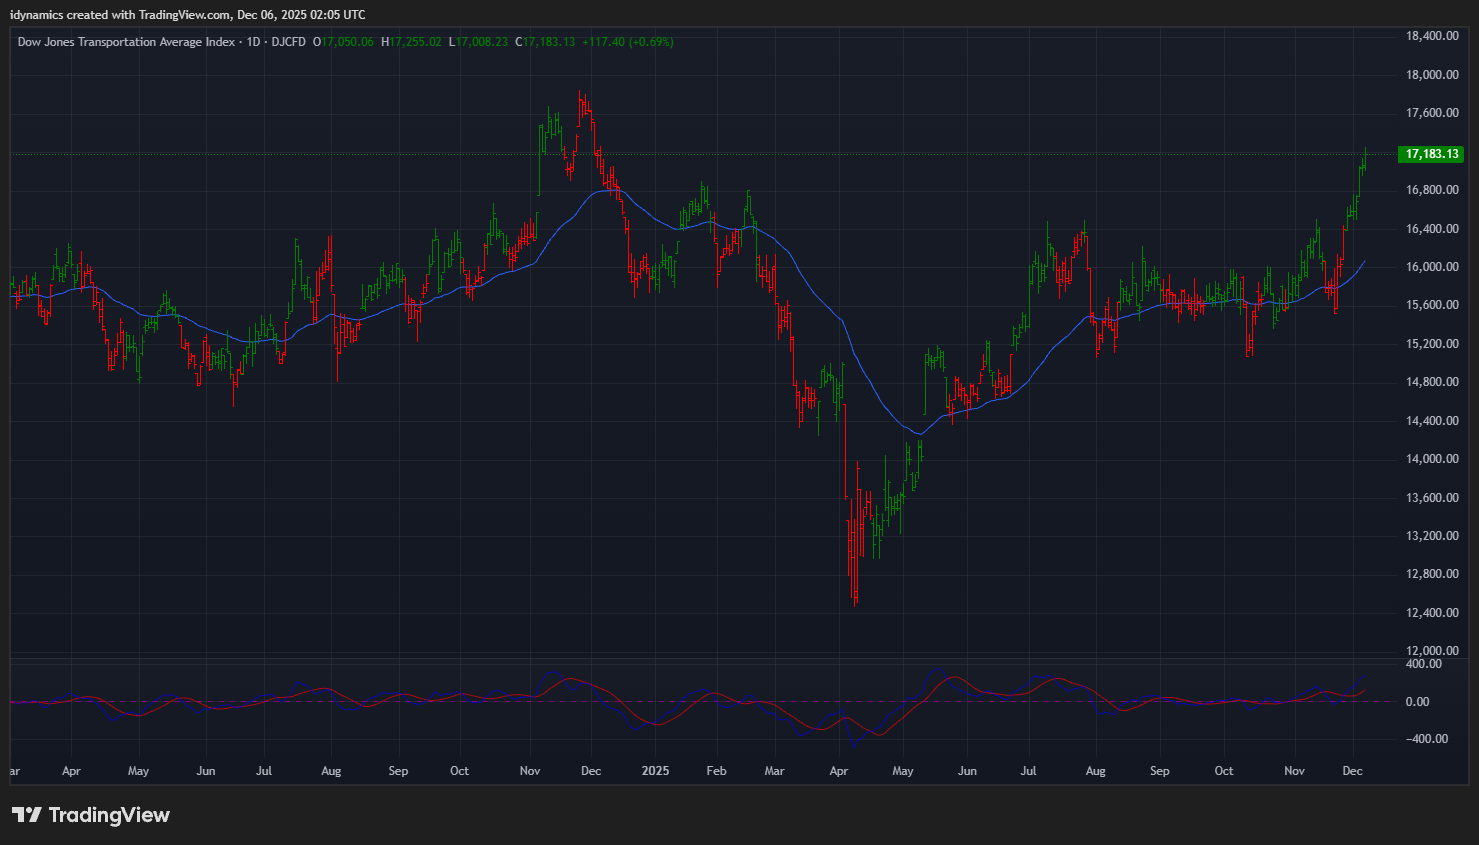
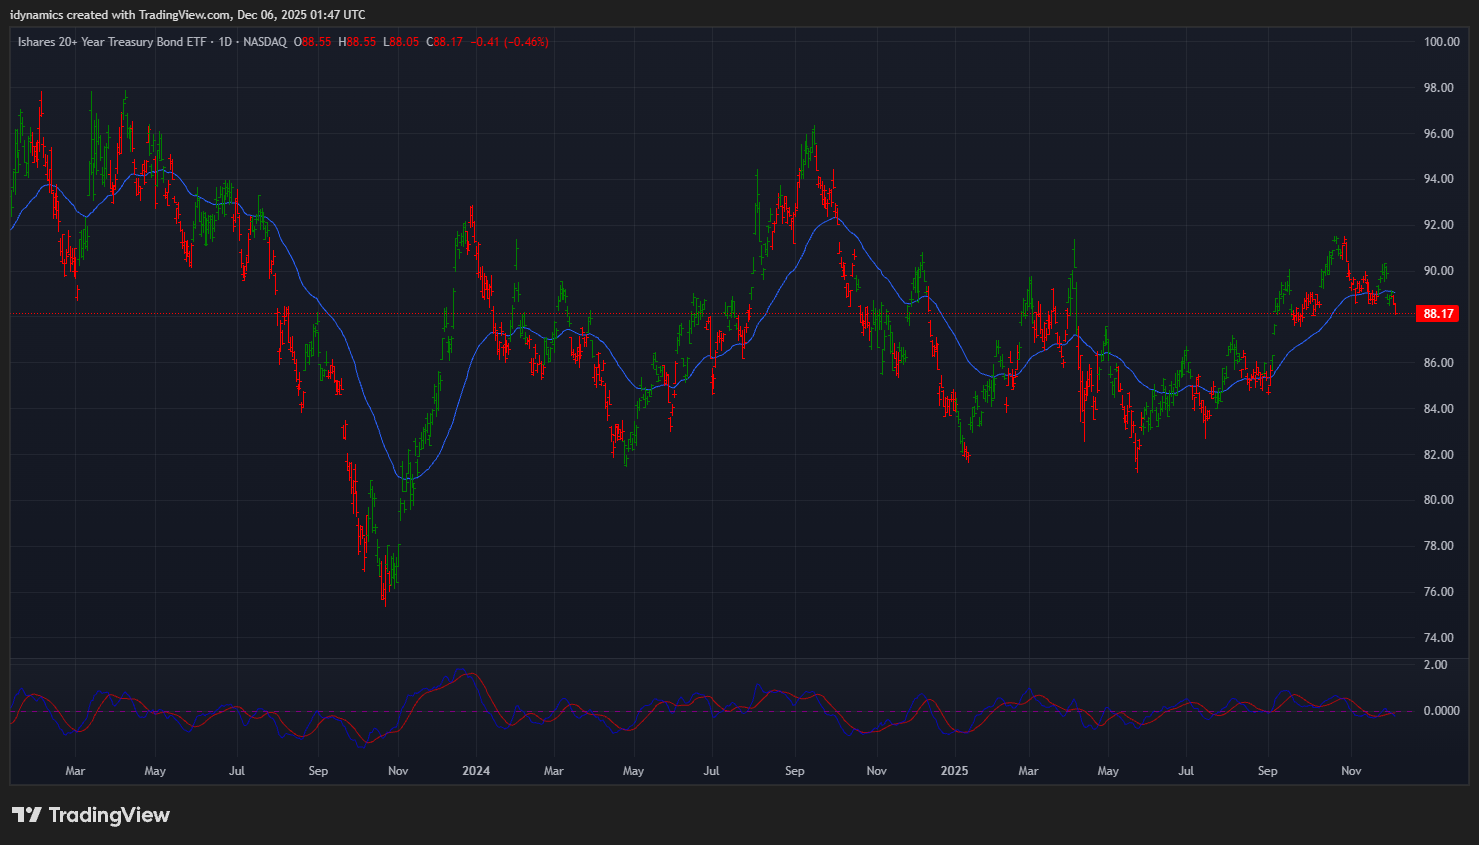
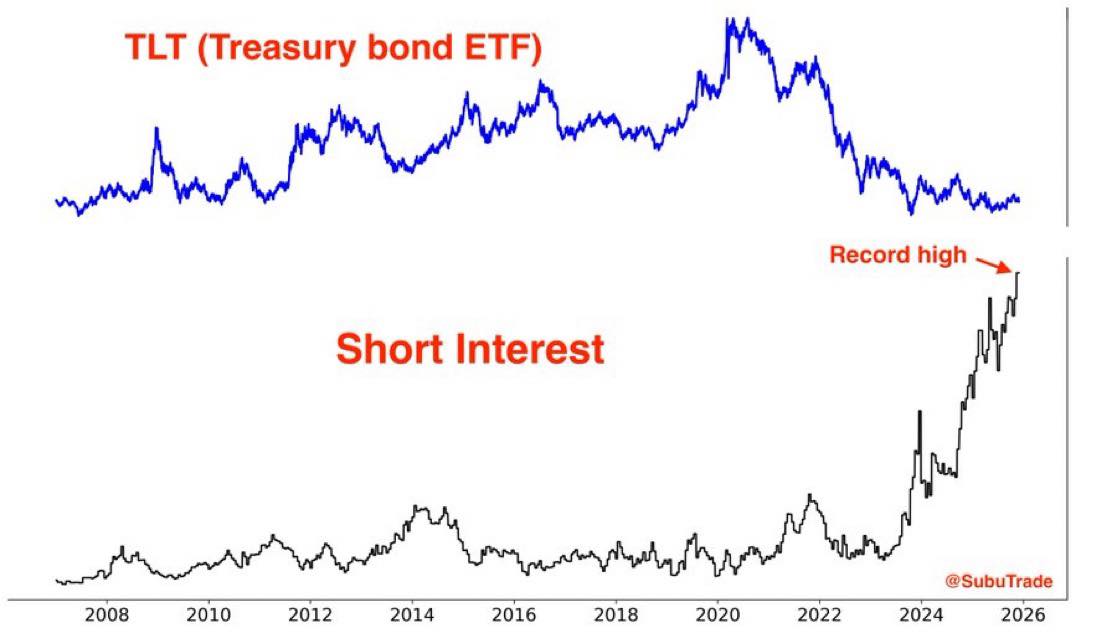
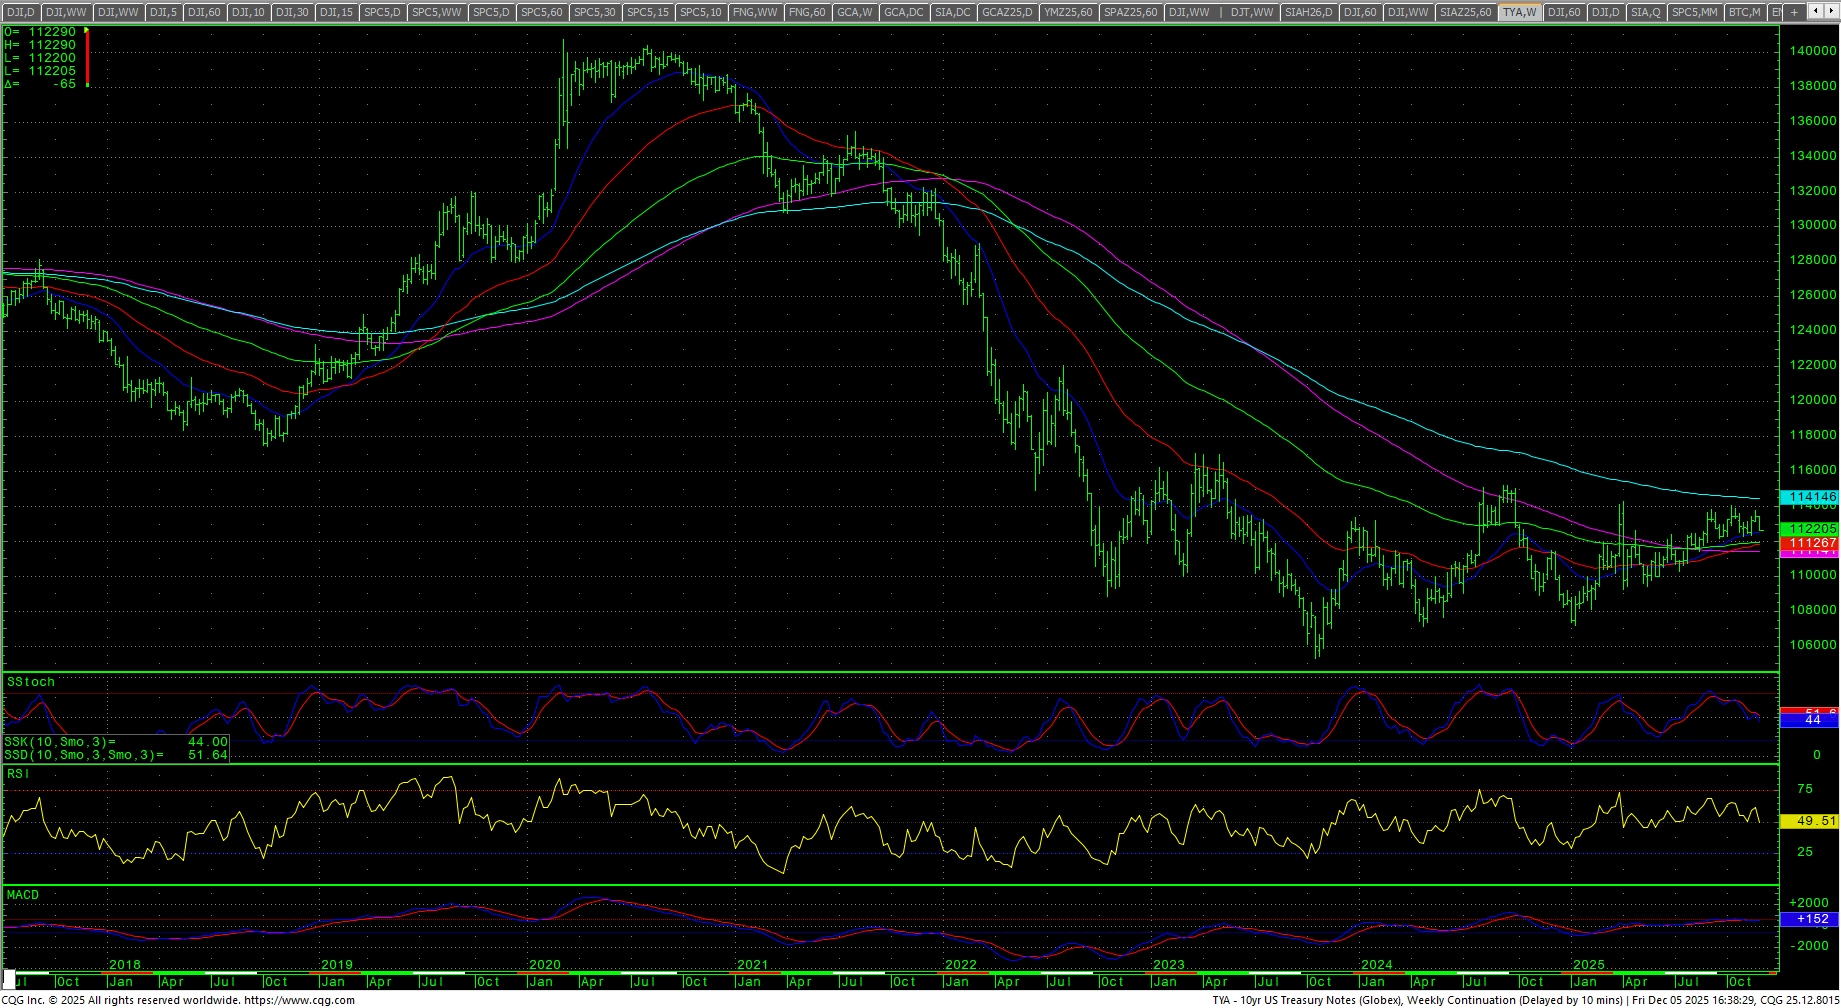
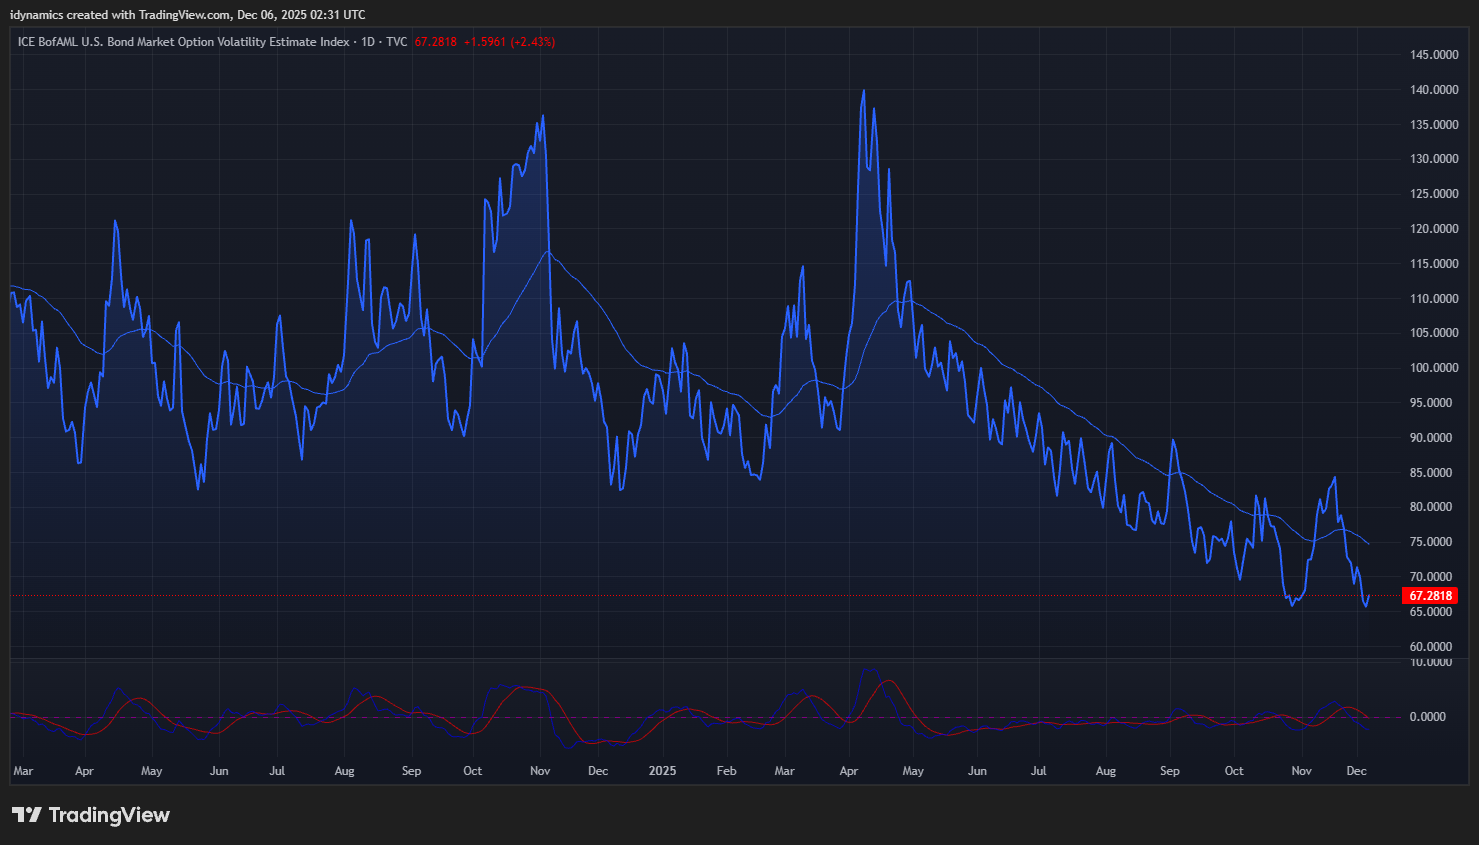 Do the Transports indicate a new QE coming? The odds of the Fed cutting rates this week are at 70%. The TLT chart has formed a distinct H&S top pattern, while the indicators are saying that there are record shorts on the TLT. The MOVE is sitting at a near a four-year low. If the Fed cuts again, and the 20YR breaks down from this H&S top pattern, yields will rise and the MOVE would take off and corporate spreads will move off their multi-decade lows.
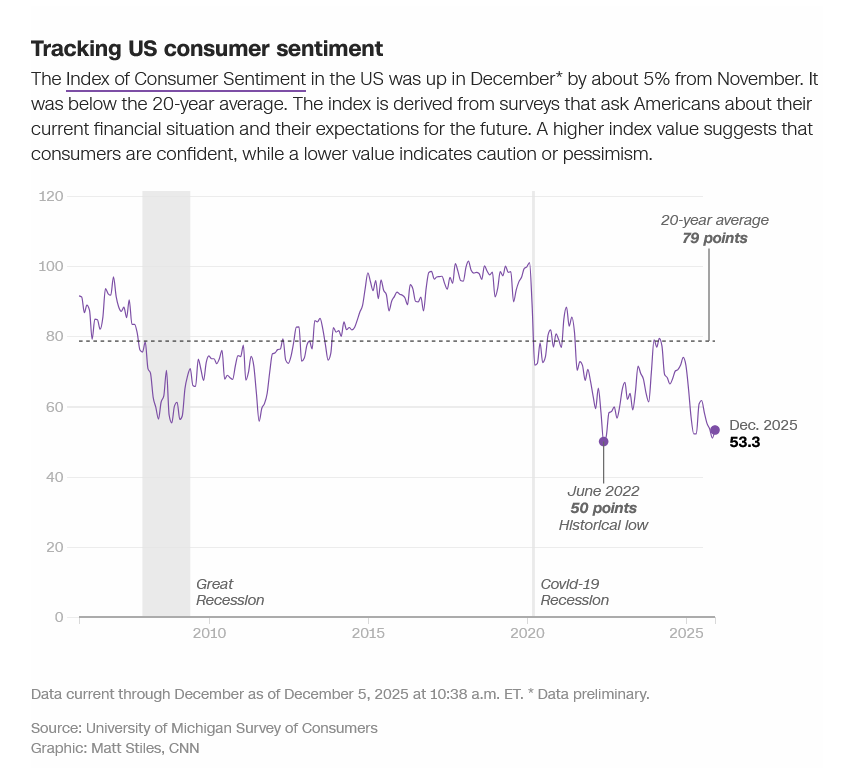
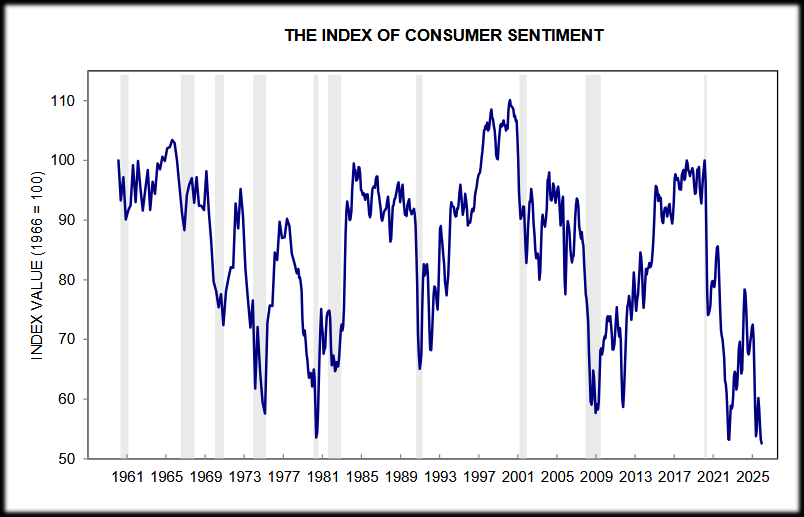 Consumer Sentiment ticked up slightly in December, though it sits at multi-decade lows.
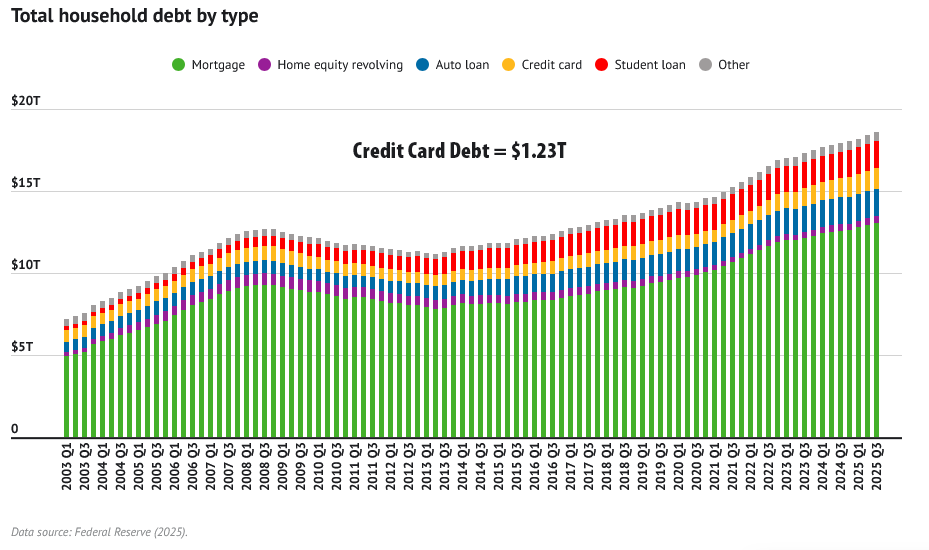 Black Friday saw record sales; however, the bulk of the activity was on credit or “buy now, pay later.” This comes as consumer debt is hitting over $1.23 trillion for U.S. consumers.
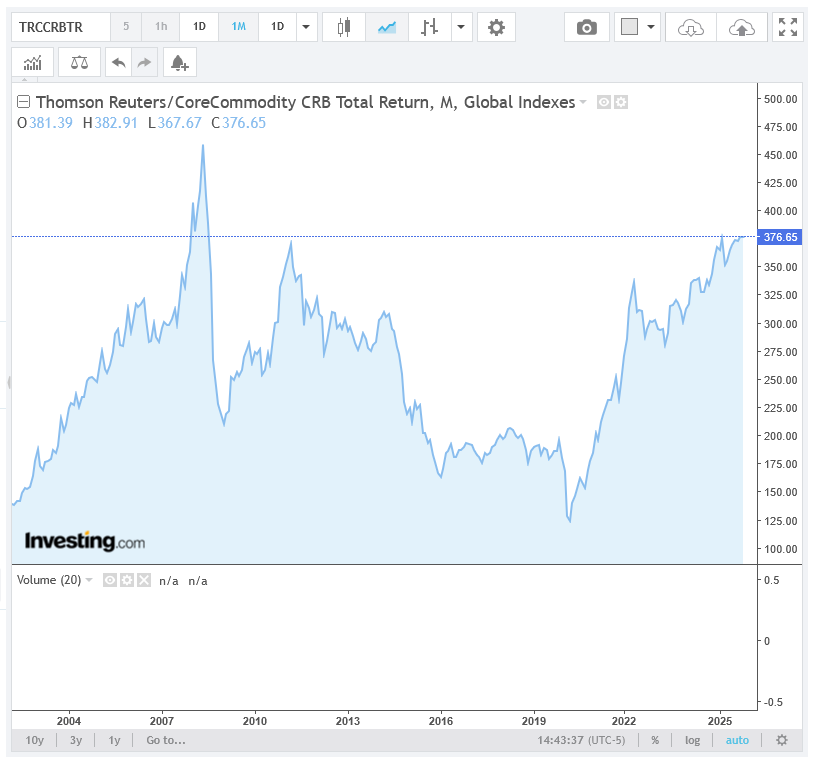
The “official” government numbers for inflation came in at 2.8%. Inflation readings continue to flatten while the CRB is trading toward levels not seen since 2008. Last week, Bravos Research published an analysis of this discrepancy: The Cost Of Living Gap Nobody’s Talking About.
“I believe that we are looking at the bottom of the 9th inning now for stocks and that the end of this move will come in this long window we are in…most likely before or by the first month or two of 2026. Certainly, by the 1st quarter. The market has now issued a number of Hindenburg Omens, and a Nasdaq Titanic Syndrome which can be a preliminary red-flag that prices are within a couple months of a major turning point. which fits with the current timing data.”
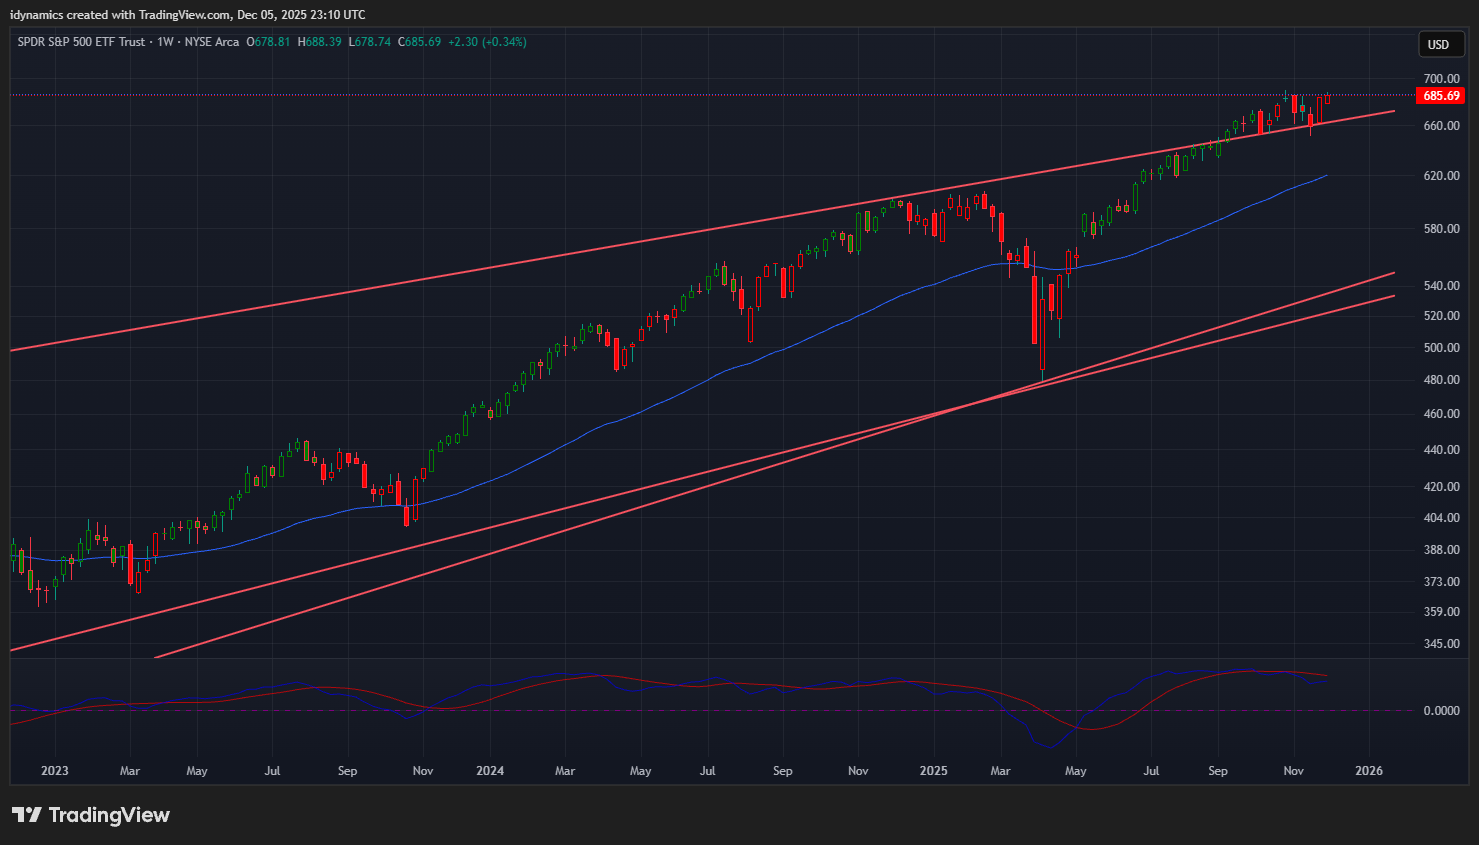
SPX Monthly H-L-C
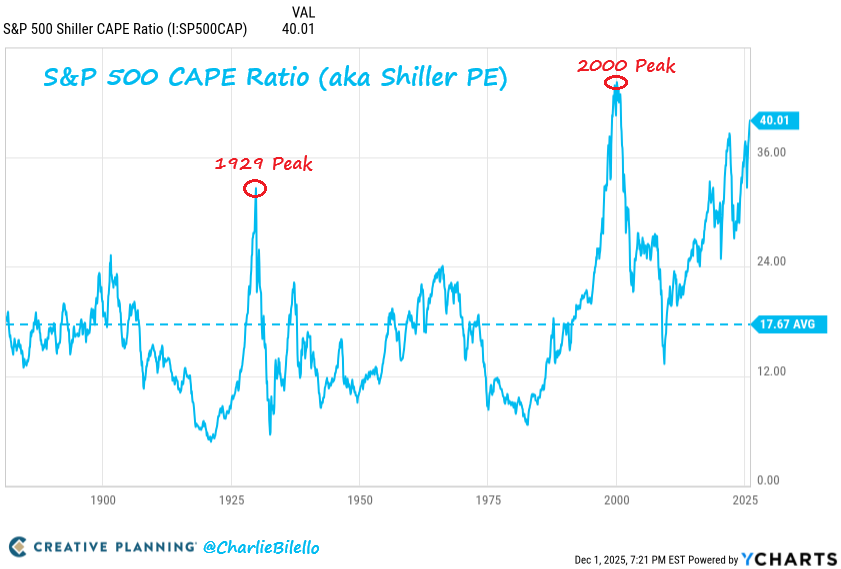
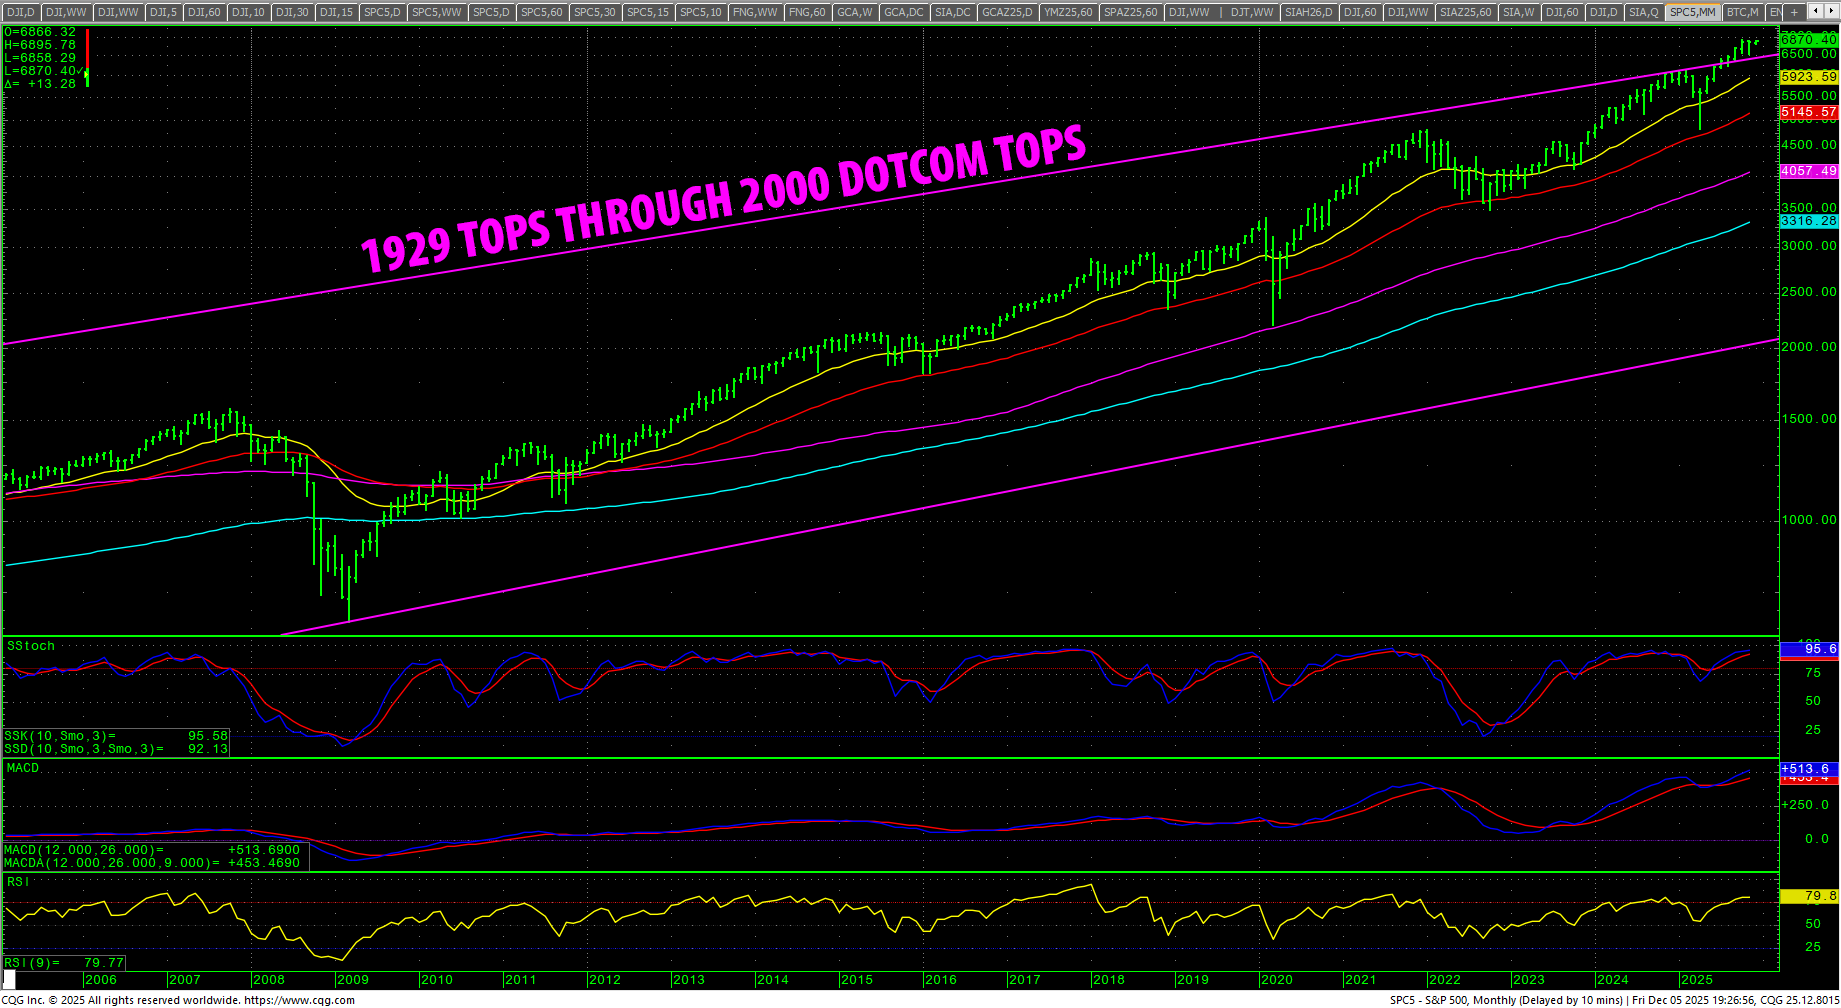 The SPX monthly still offers the super bull scenario as prices trade above the overhead trendline that connects the 1929 tops through the 2000 Dot-Com tops. If prices start to trade back under the trendline, it could signal selling in equities. It still holds potential for a continued blowoff move. Right now, the trendline comes in at: 6421.75.
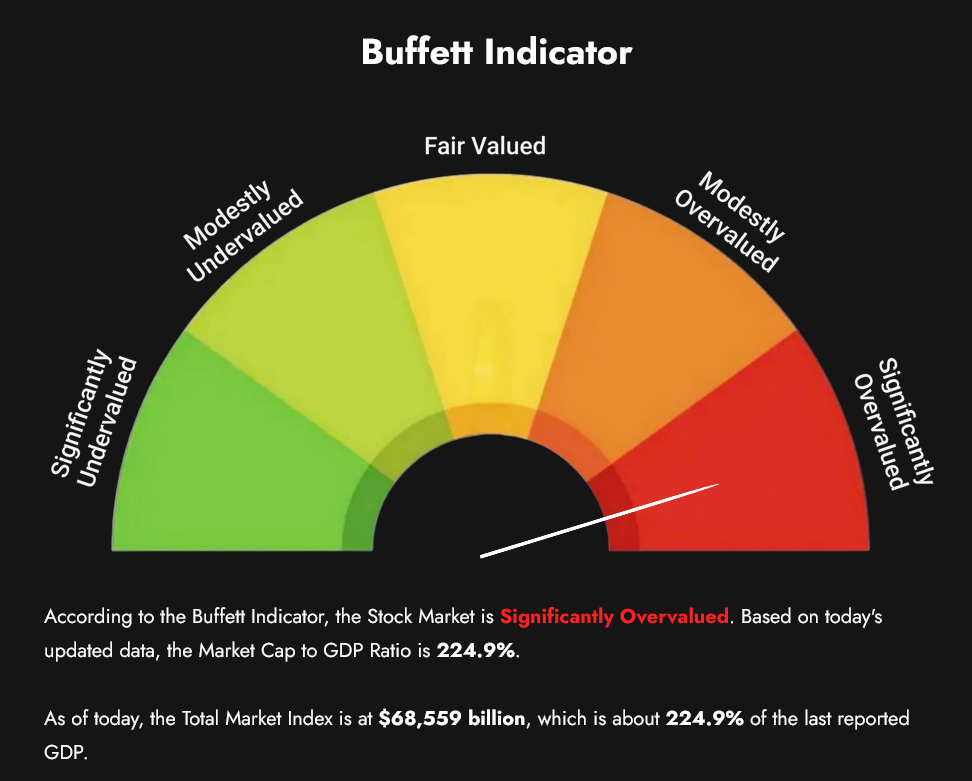
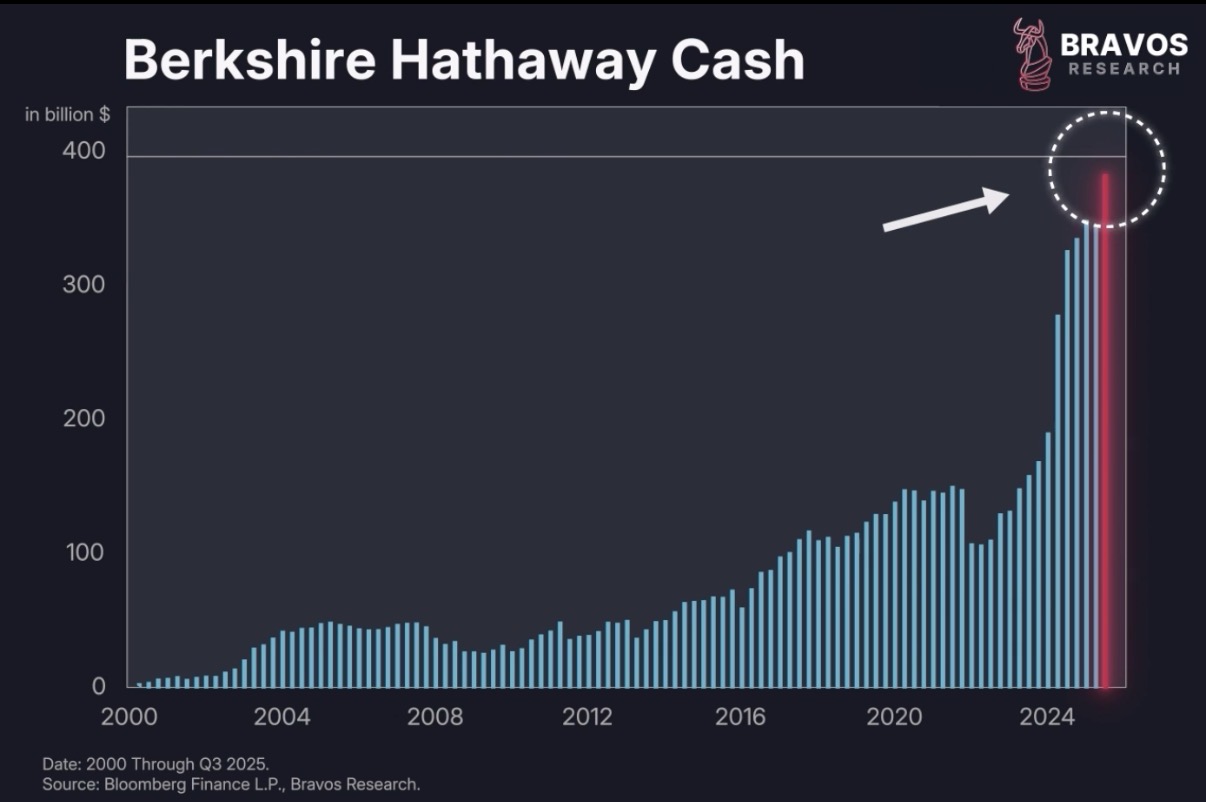
The Buffet Indicator set a new ATH, now reading at 224.9%. Berkshire has raised its cash levels to an ATH…nearing $400 billion.
Dow Theory
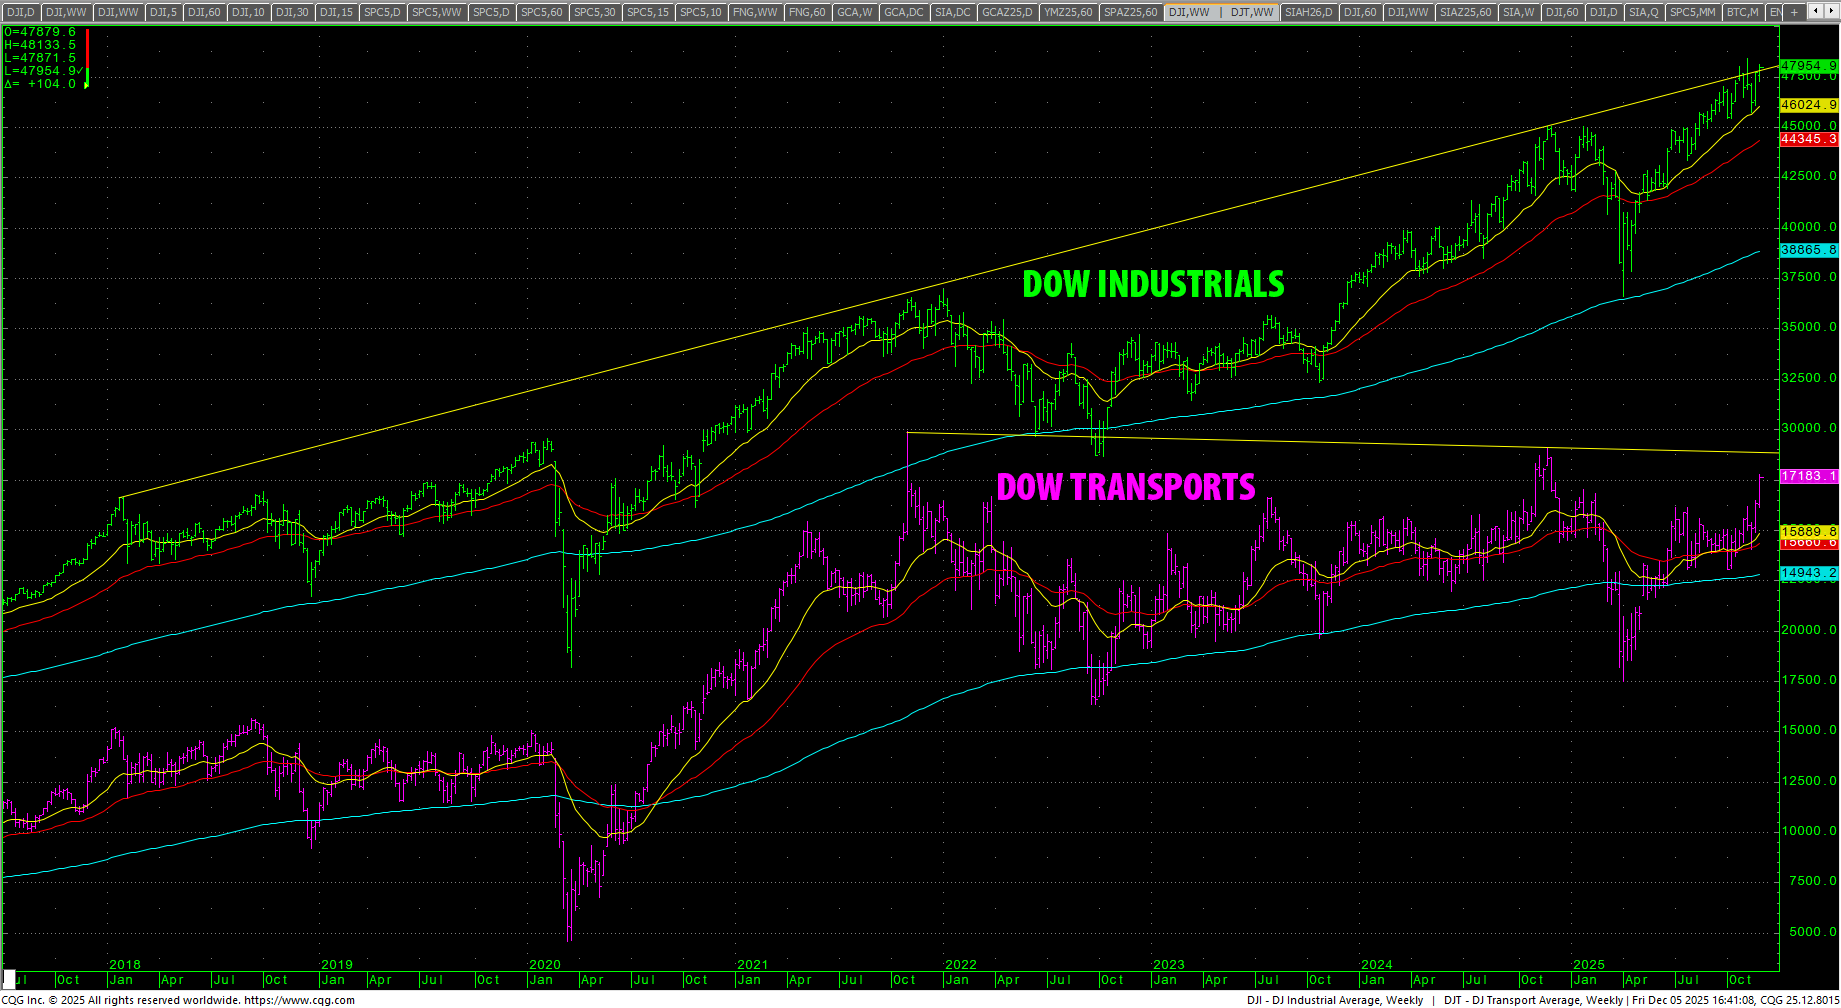 Dow Theory still shows a bearish divergence. As noted above, the Transports have been on a tear in the past two weeks showing strength and bullish structure.
S&P 500 Stocks Above the 200-day MA
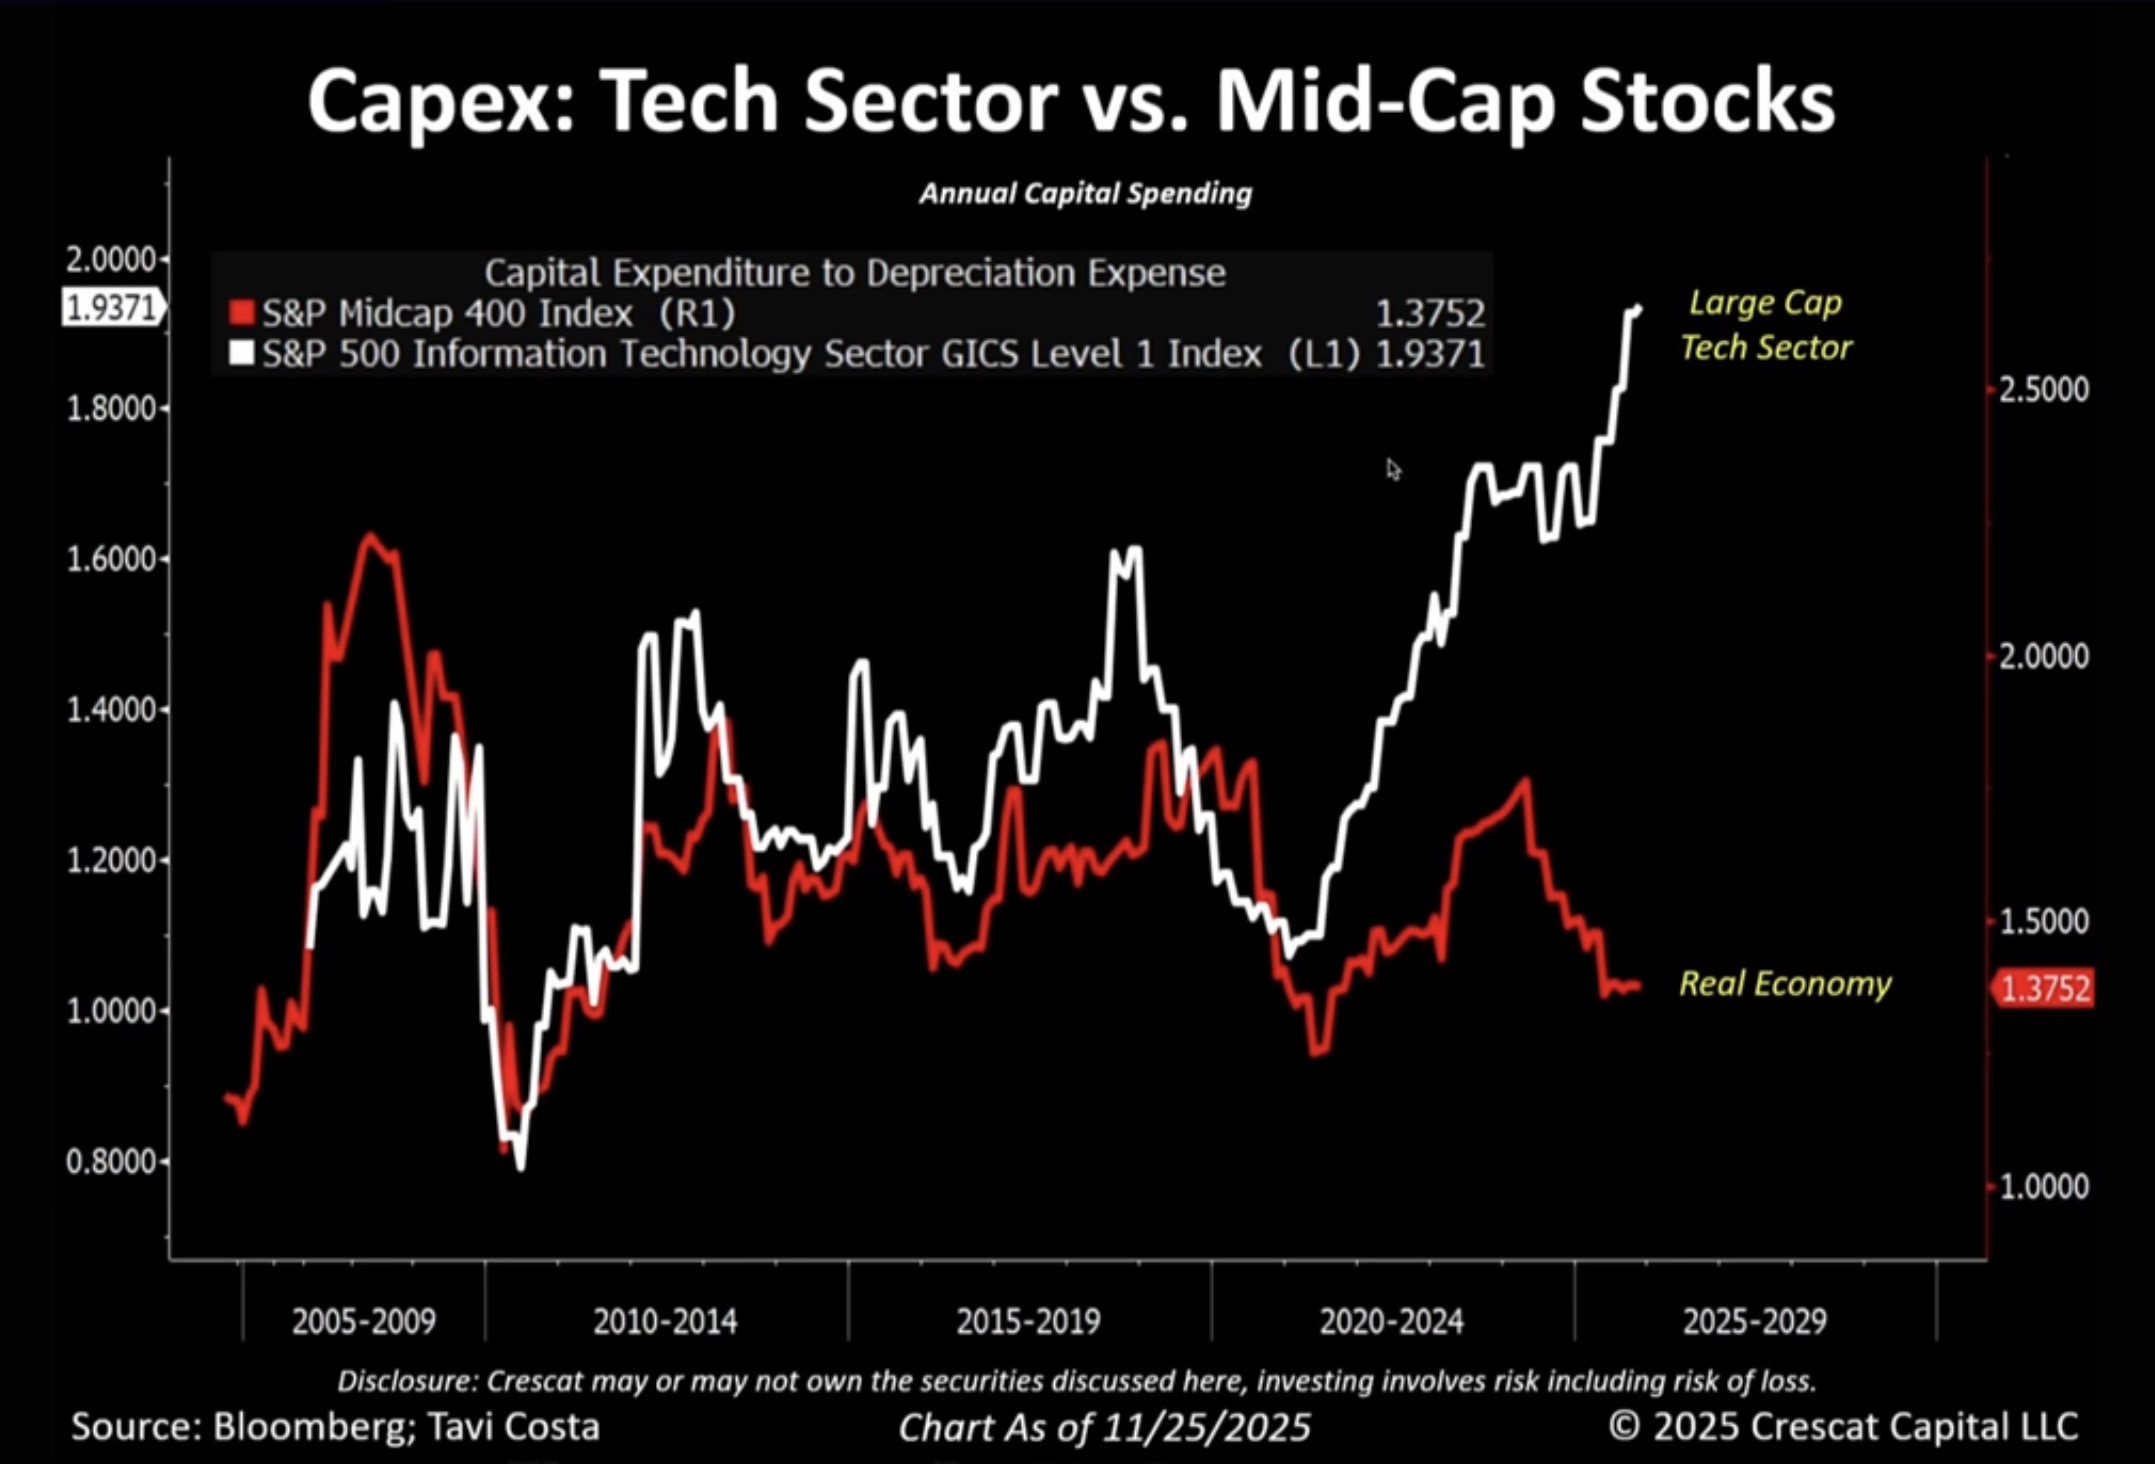
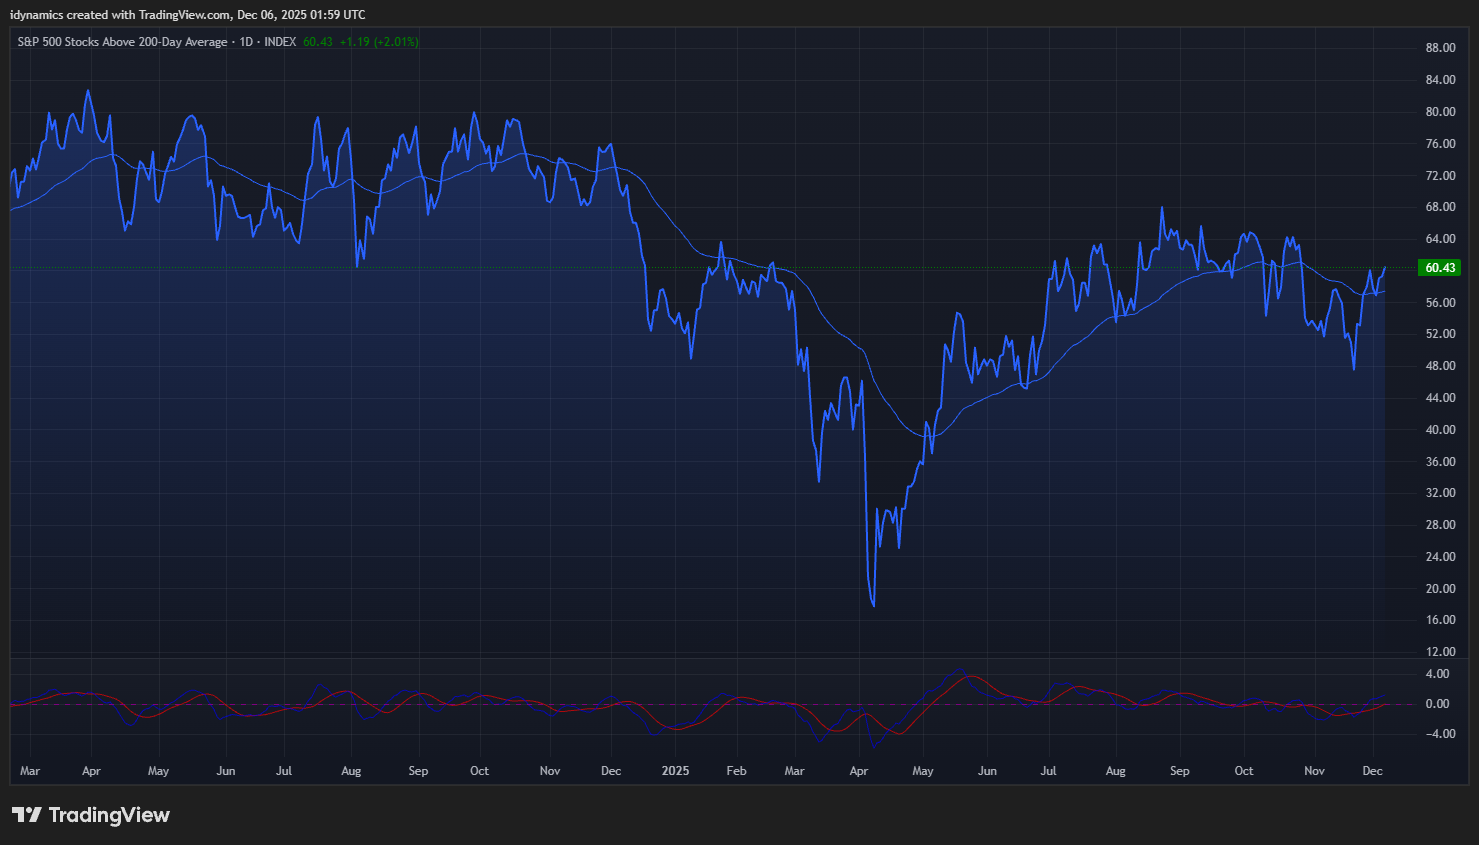 Breadth is still best defined as “meh.” The share of SPX stocks above the 200-day MA rose to 60.43%. The high in September 2024 was 72.92% and 82.70% in March of 2024. Divergence remains the name of the game. 10 stocks make up 40% of the SPX. As the chart from Tavi Costa shows, the “real Economy” is anemic, while the “AI economy” (fueled by debt) hits ATHs.
MAGS (Magnificent 7) Weekly Candles
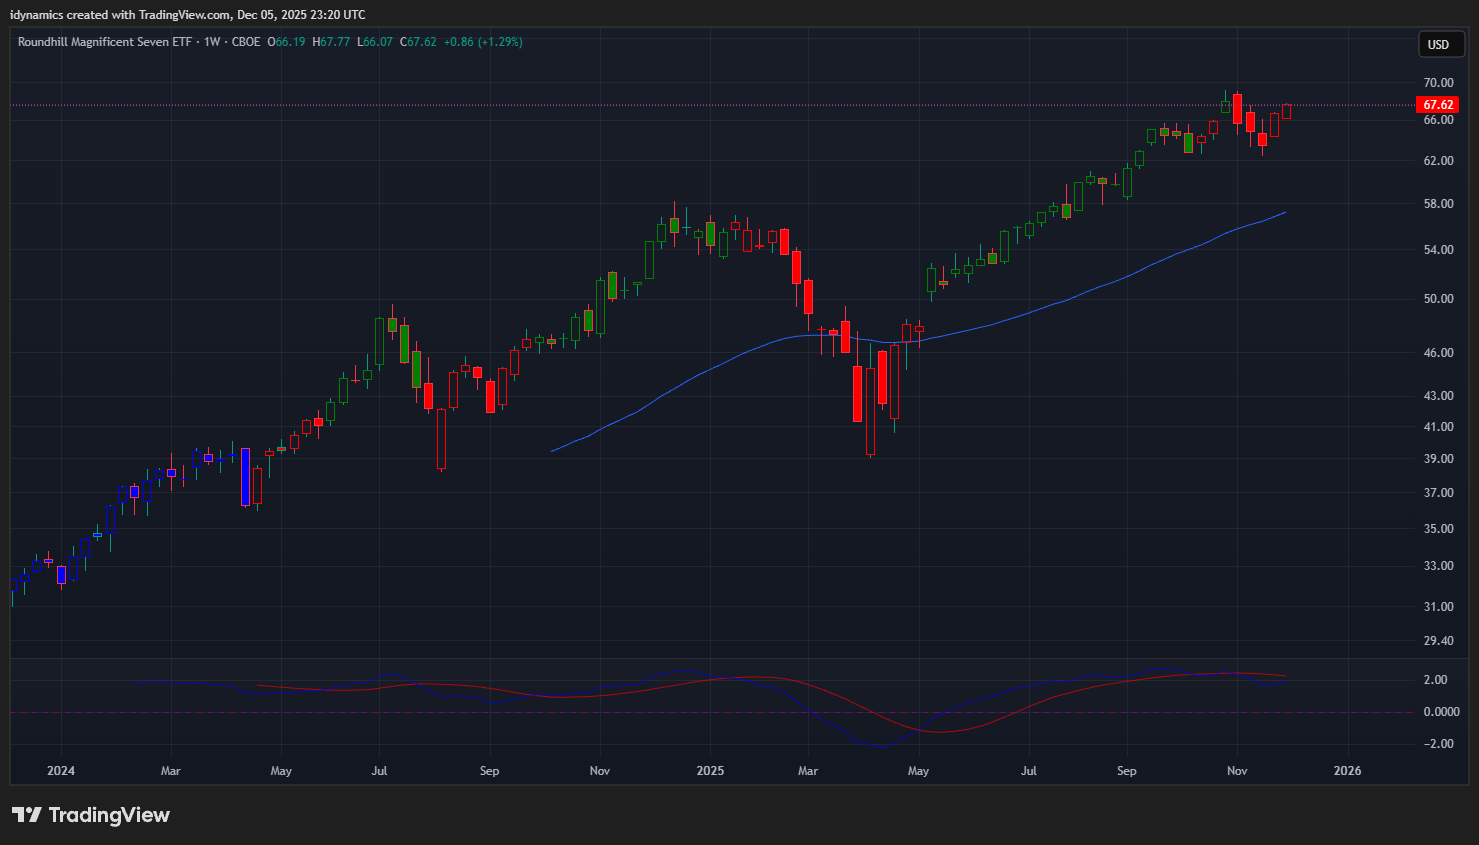 The MAGS rallied to test the current ATH weekly close, ending on the top of the range, up + 1.29%. Prices closed above resistance at 66.55/67.00. Further rallies can carry toward the 73/74 level. Support is 61.99 and 57.60. Under 57.60 can test 54.05 with critical support at 50.49/50.00.
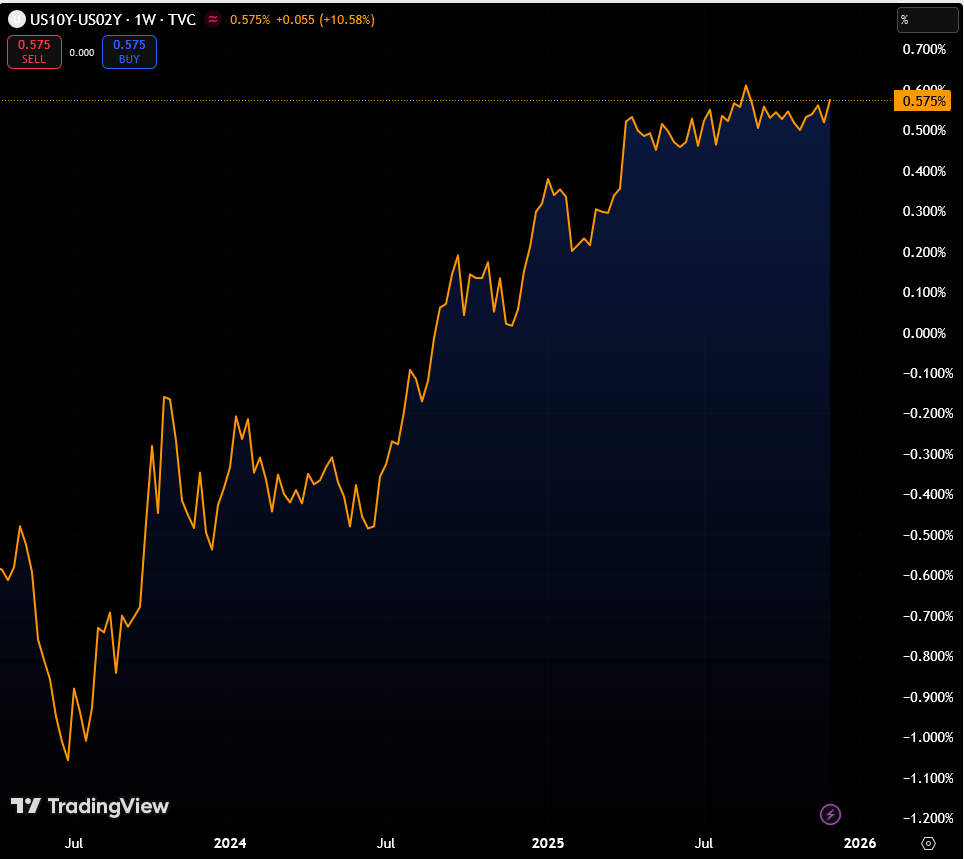
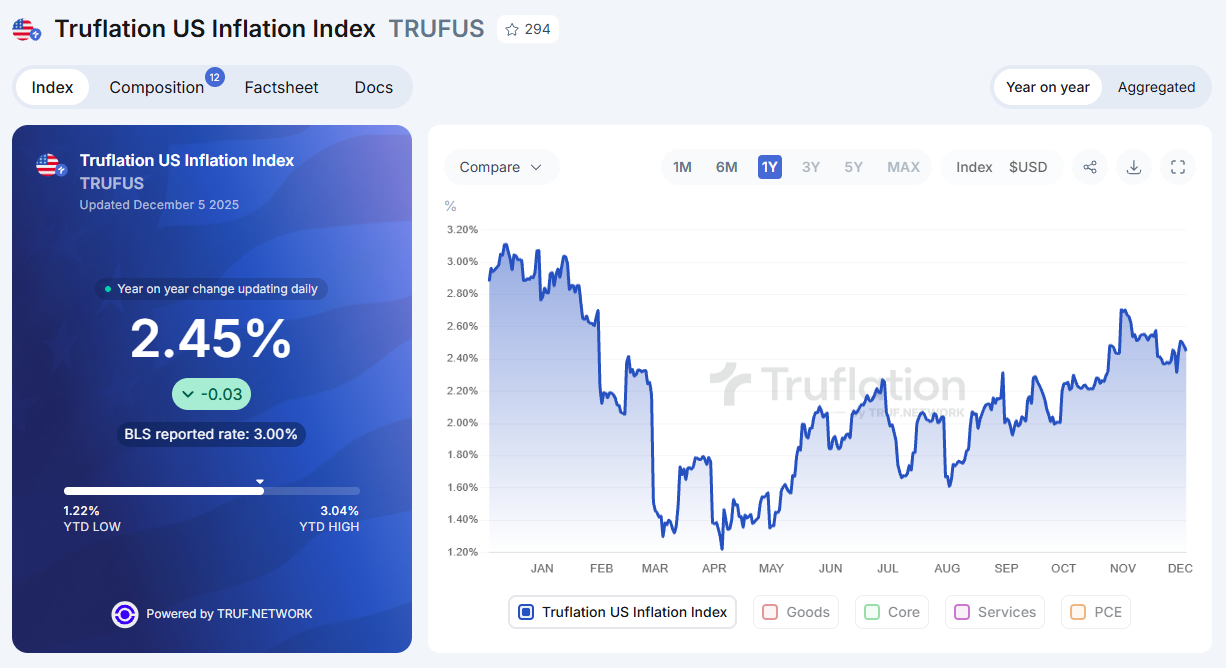
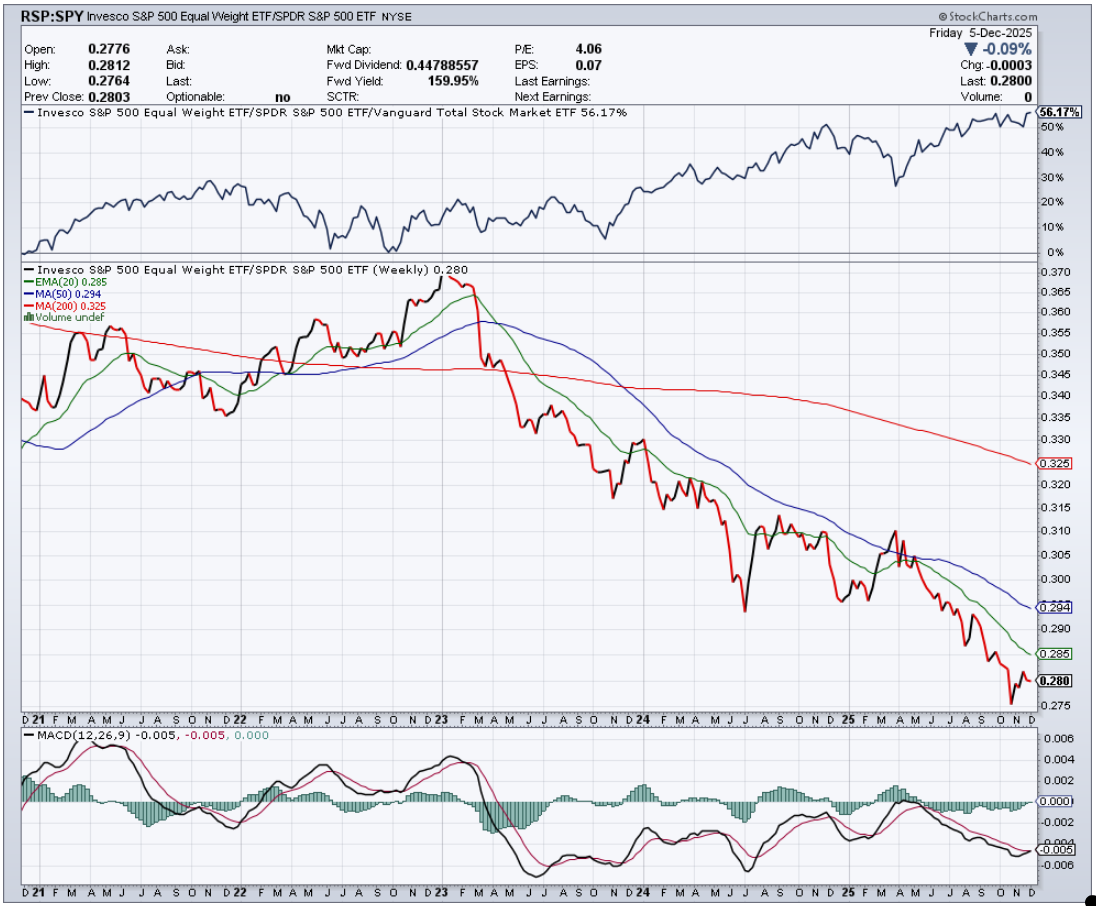
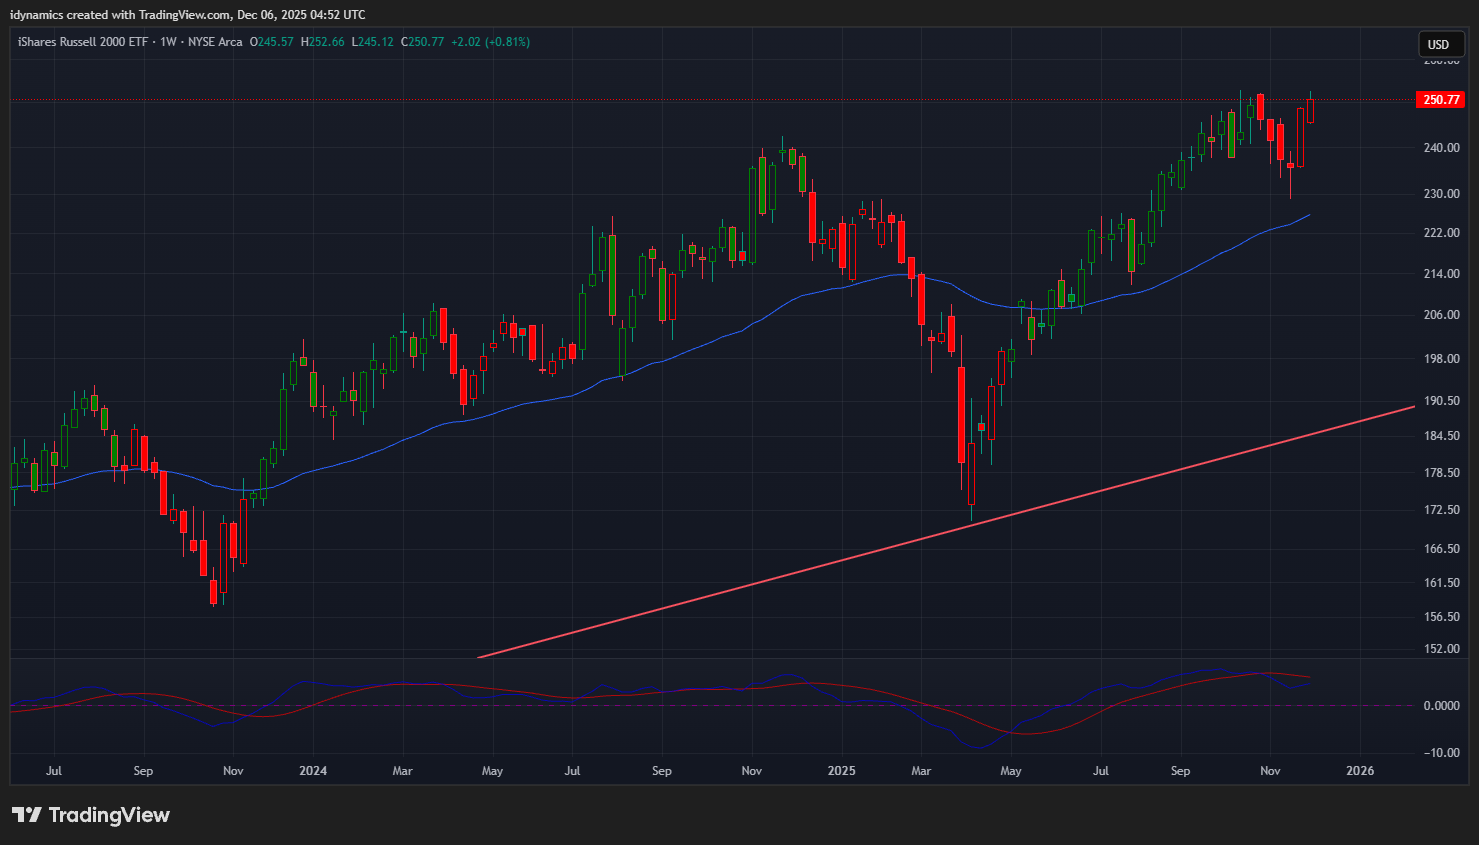
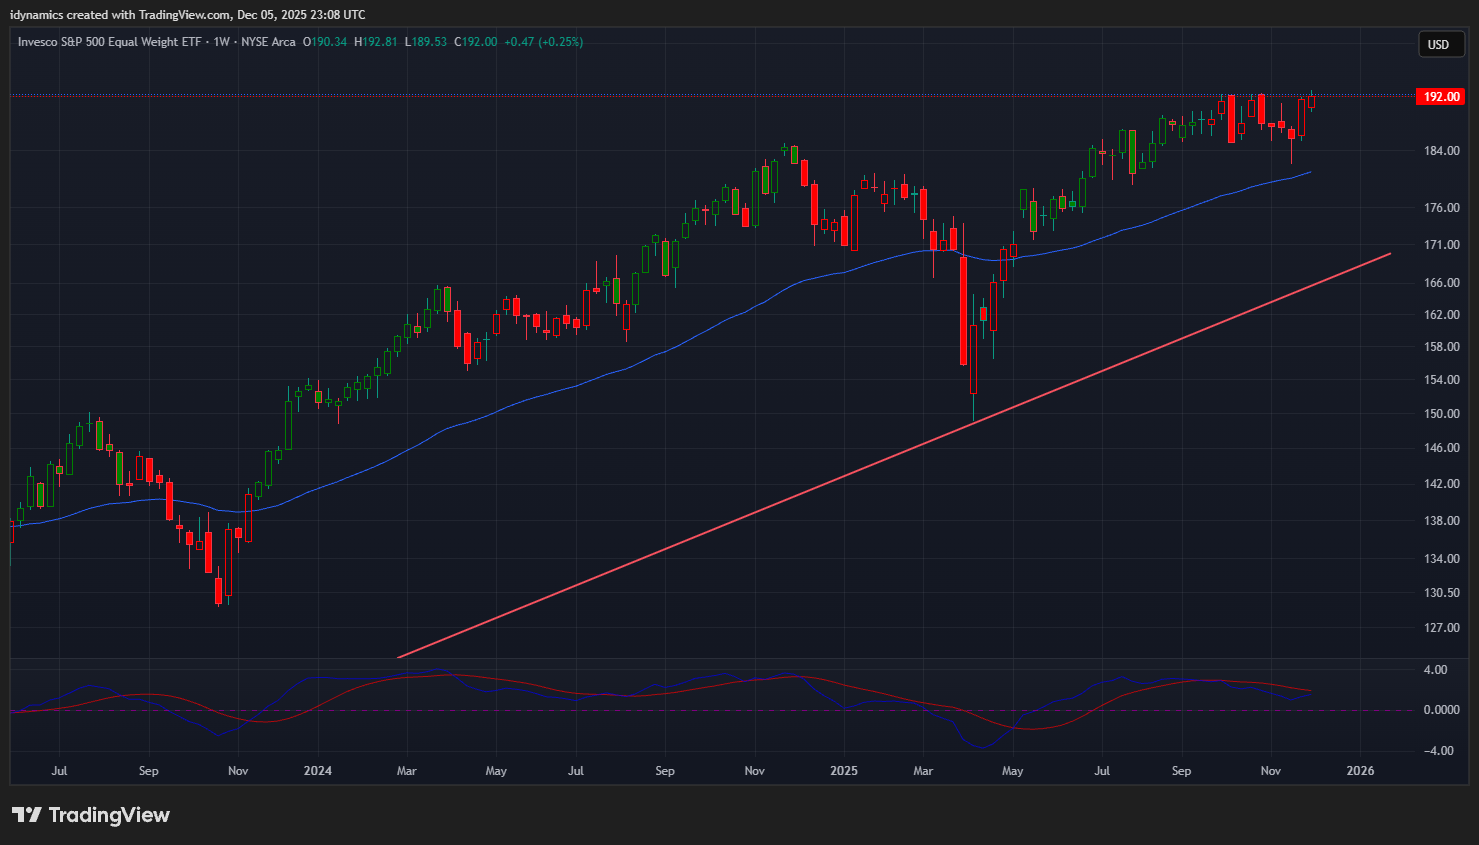
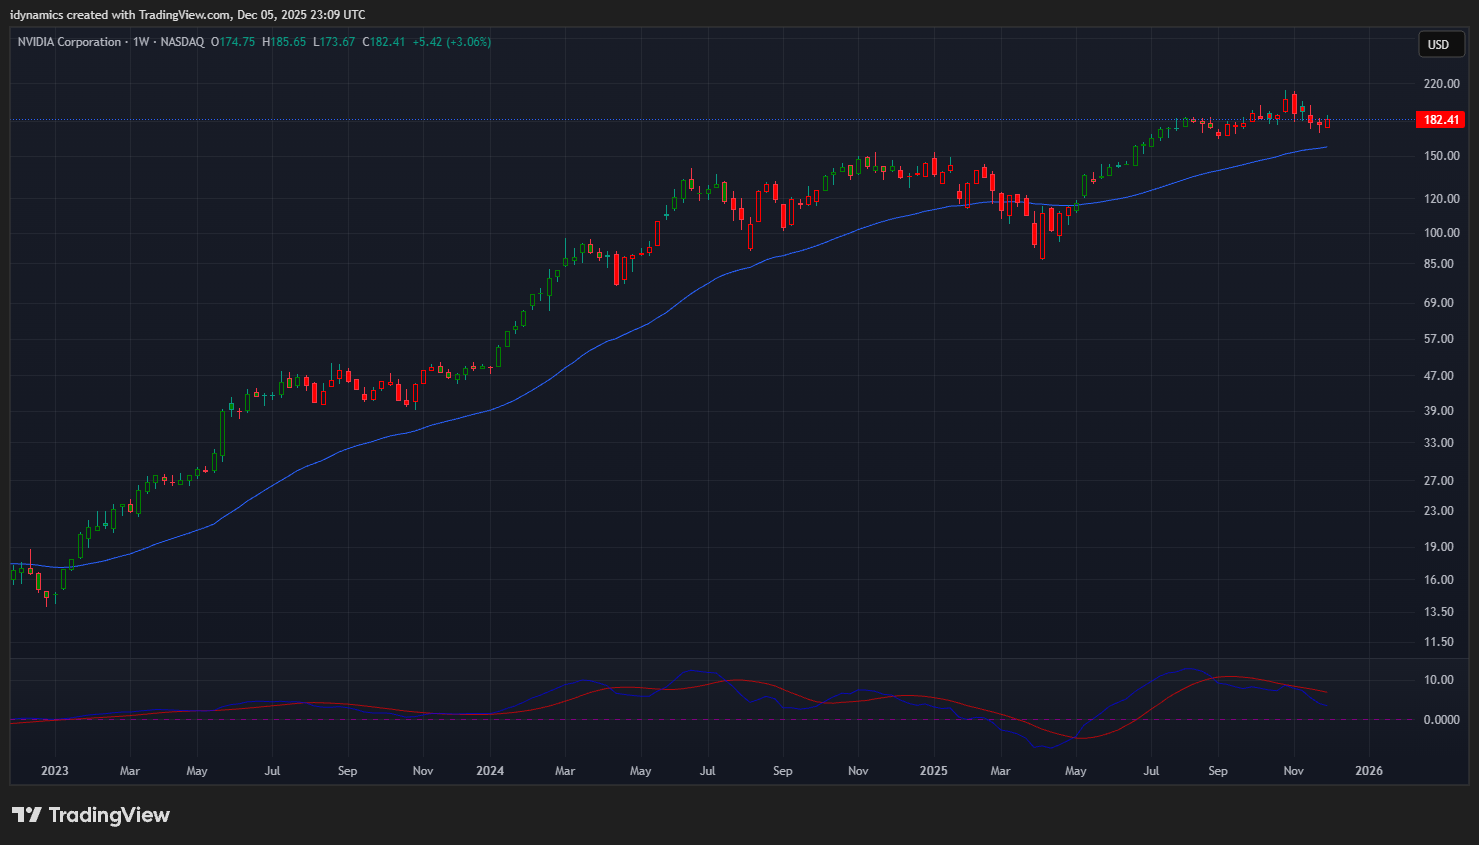
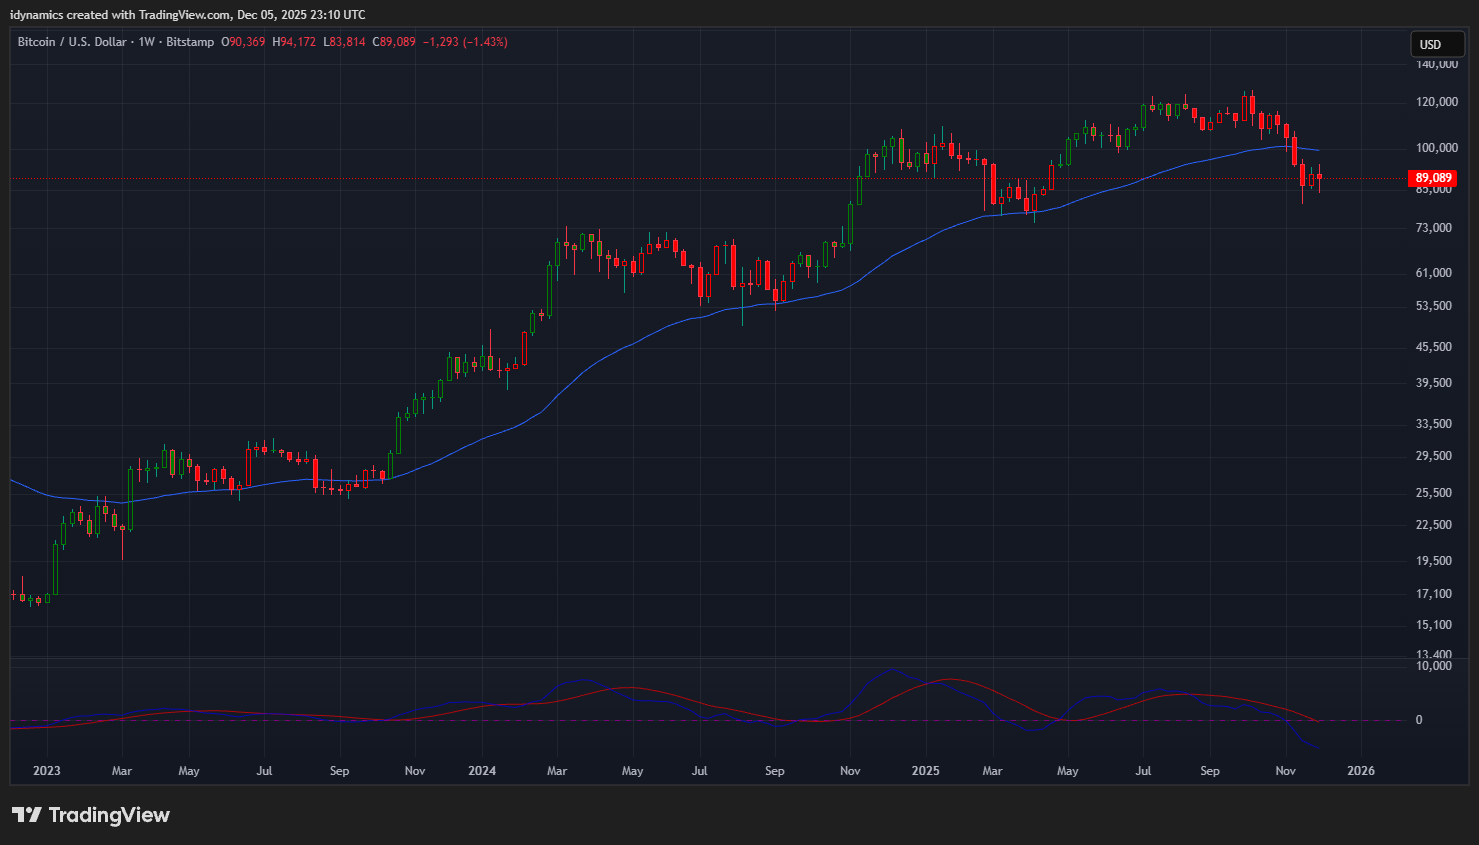
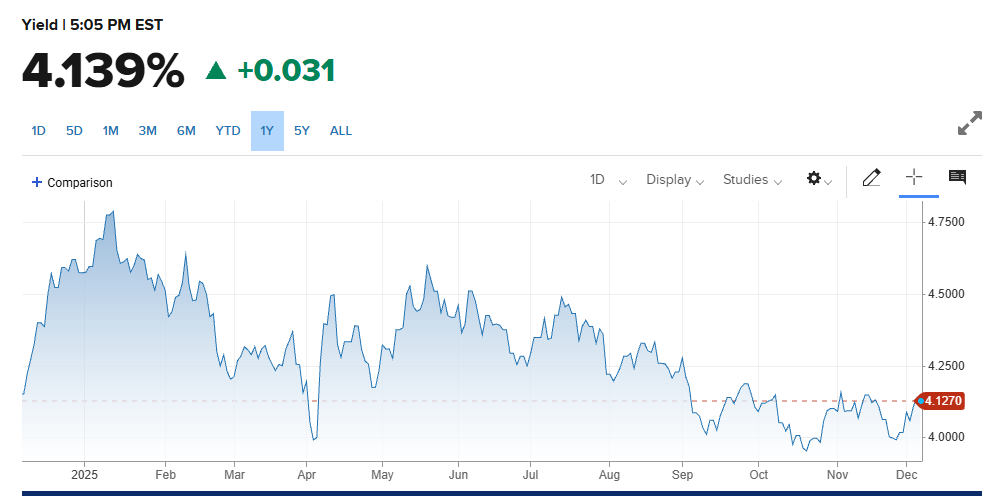
The RSP:SPY continues to languish at multi-year lows. The weekly is still trending lower in an oversold position and the MACD is down but trying to turn up. Resistance remains pivotal at .294. The IWM tested the ATH and set a new weekly closing high, ending in the top of the range, up +0.81%. The RSP set an ATH and closed in the top of the range, up +0.25%. NVDA staged a recovery rally and regained the 180 level, closing in the top of the range, up +3.06%. Bitcoin traded an outside week and closed flat, down -1.24%. Support is 83.90 and 80.50 and further declines can test 70.85 with critical support at 57.80/57.00. Resistance is 91.30 and 98.10. Above 98.10 can test 103.40 with counts to 108.80/109.00. McClellan Oscillators support the new high close on the weekly Dow chart. The Yield Curve was flat on the week closing at +0.575%. The 10YR yield increased to 4.139%. Truflation ended at 2.45%.
10YR-2YR Yield Curve Weekly

 VIX Weekly Candles
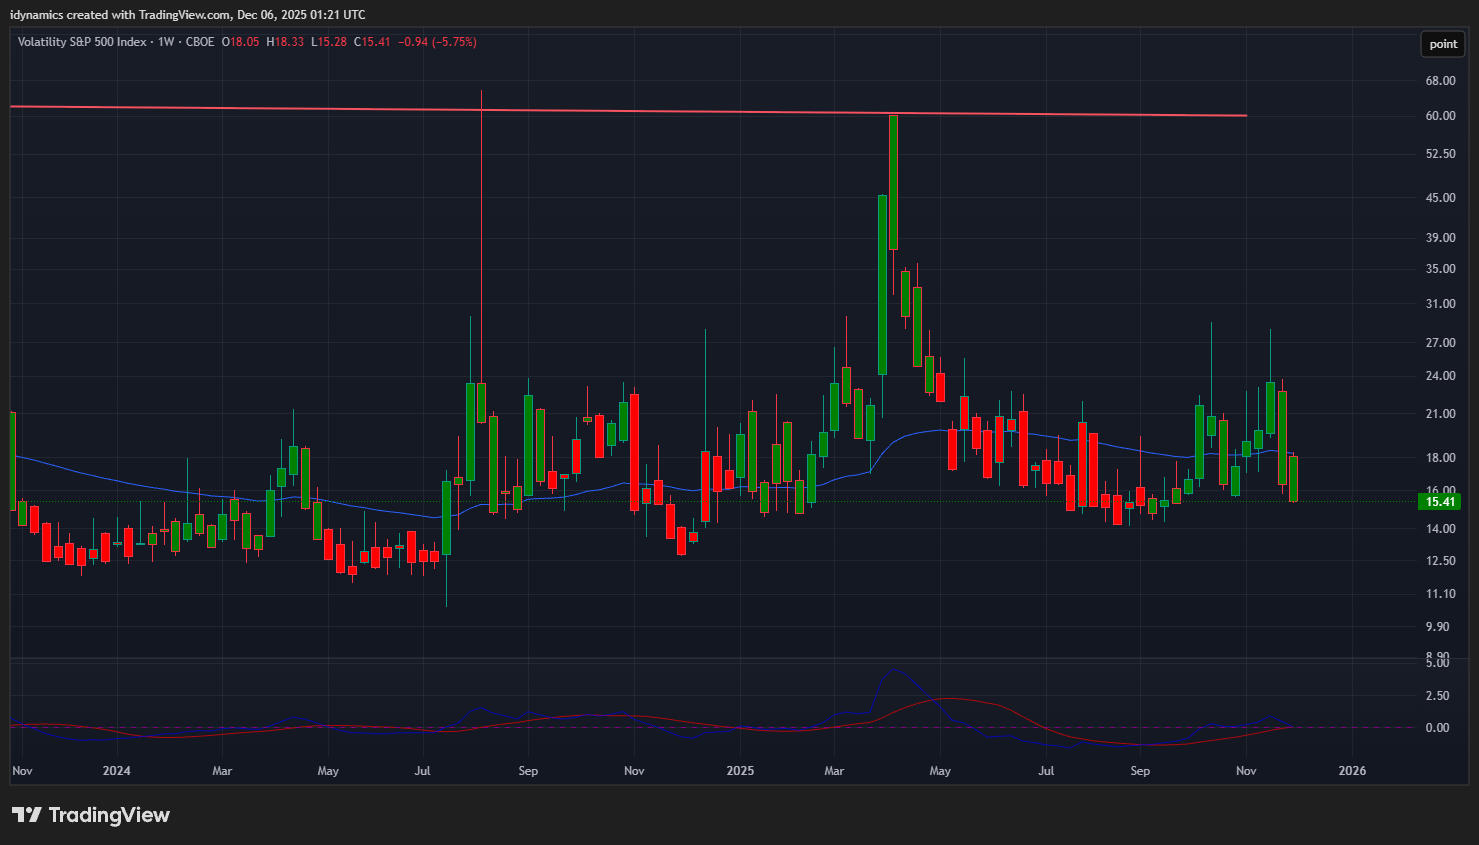
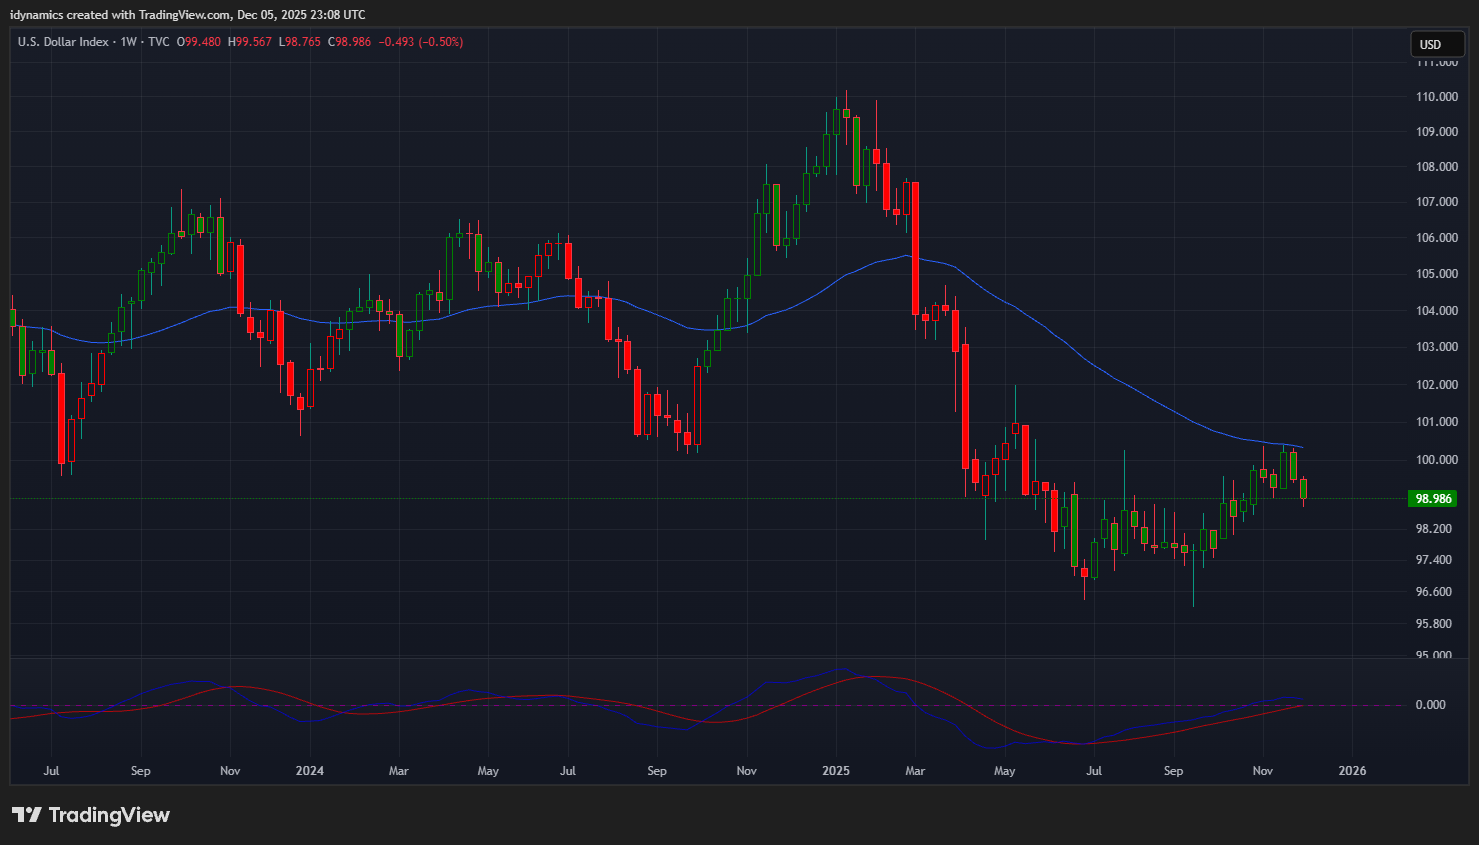
The VIX has plunged back toward the lows of 2025, closing on the low of the range down -5.75%. The US Dollar sold off all week and closed on the lows, down -0.50%.
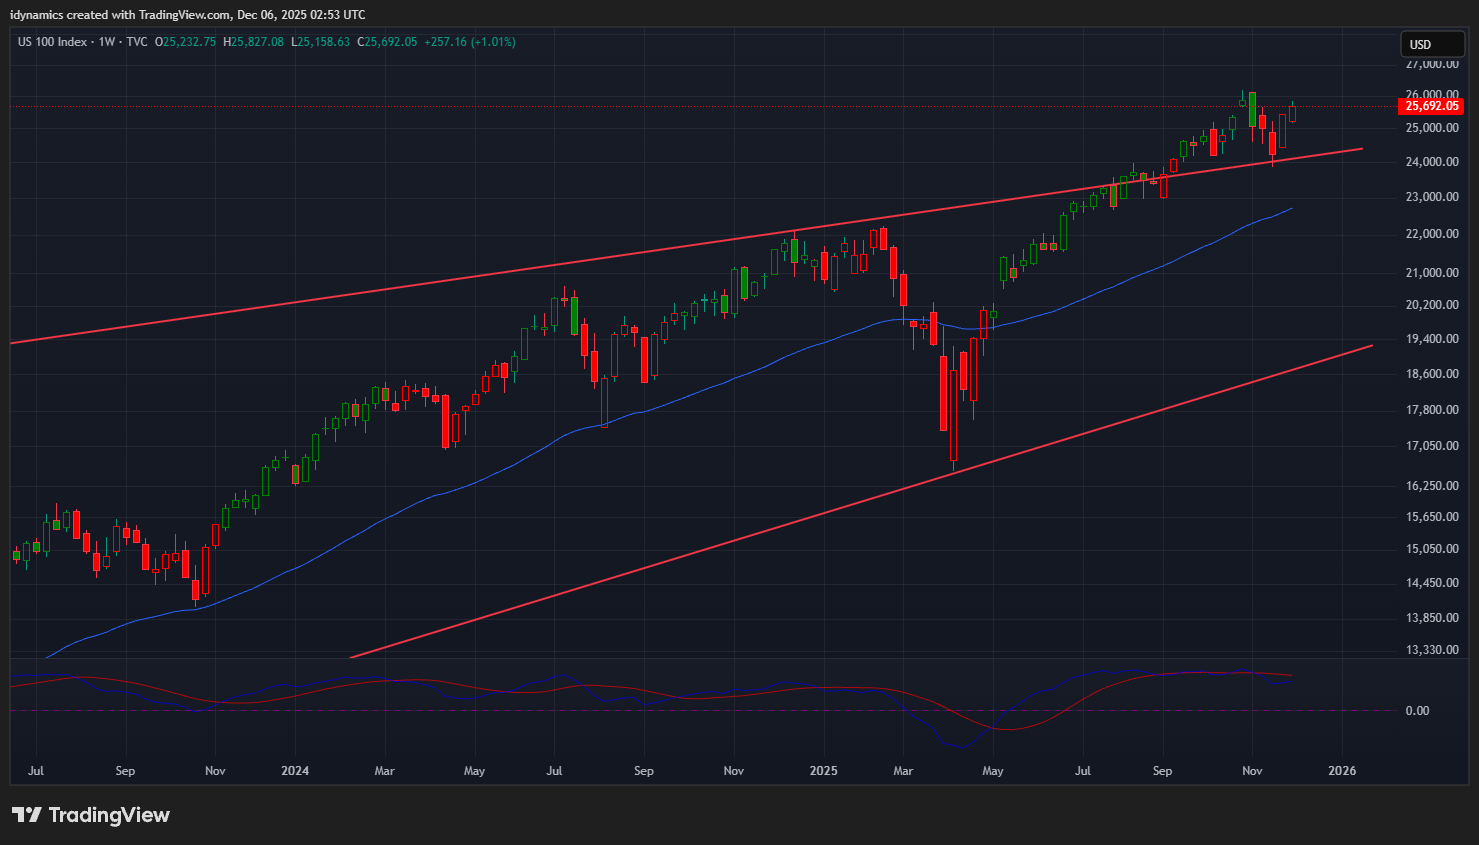
 Nasdaq 100 Weekly Candles
Daily Breadth 
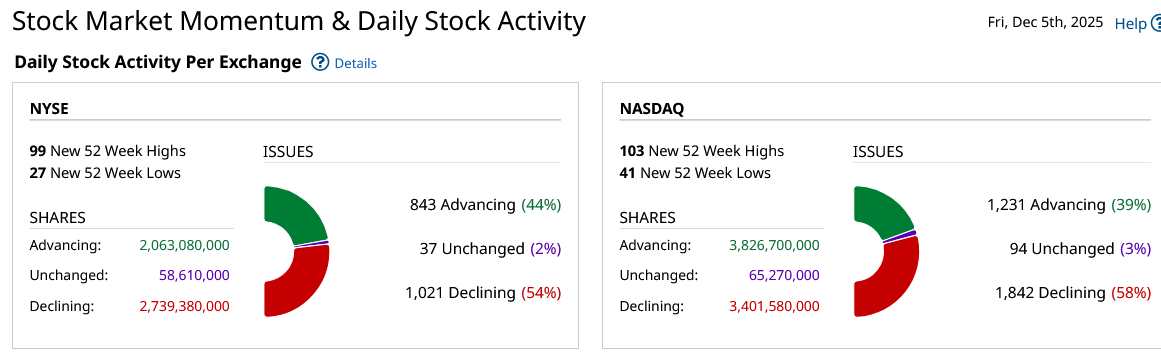
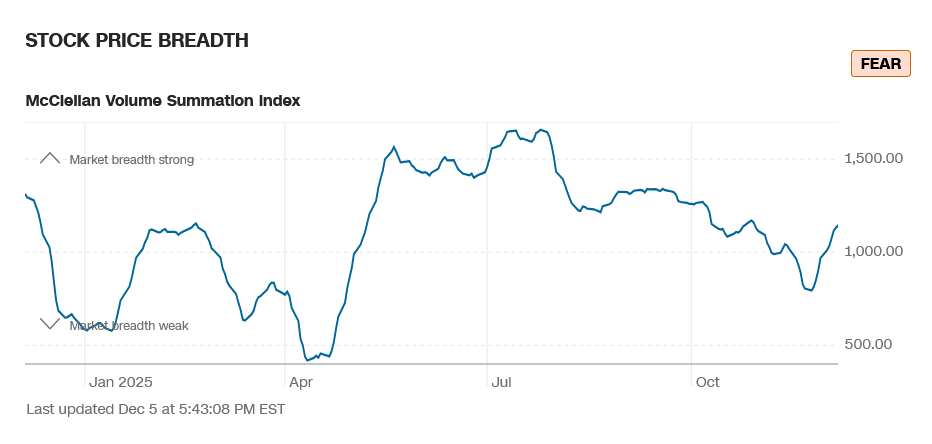
Breadth was mixed on Friday and rose on the week with the strength in the small caps, and sentiment reads fear.
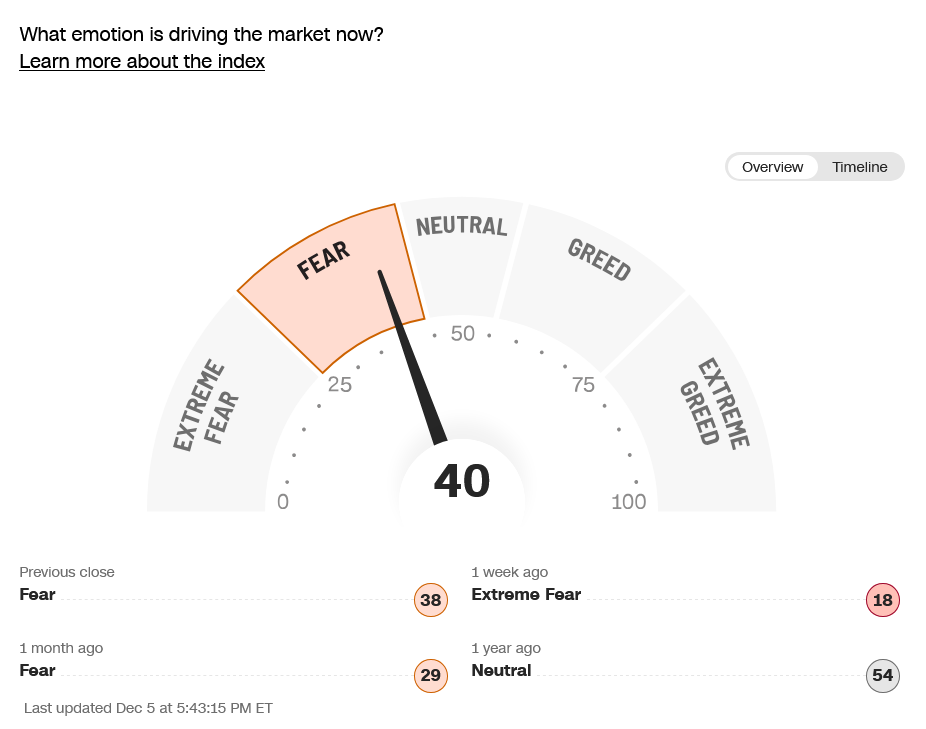
CNN Fear & Greed Index
 AAII Investor Sentiment Survey
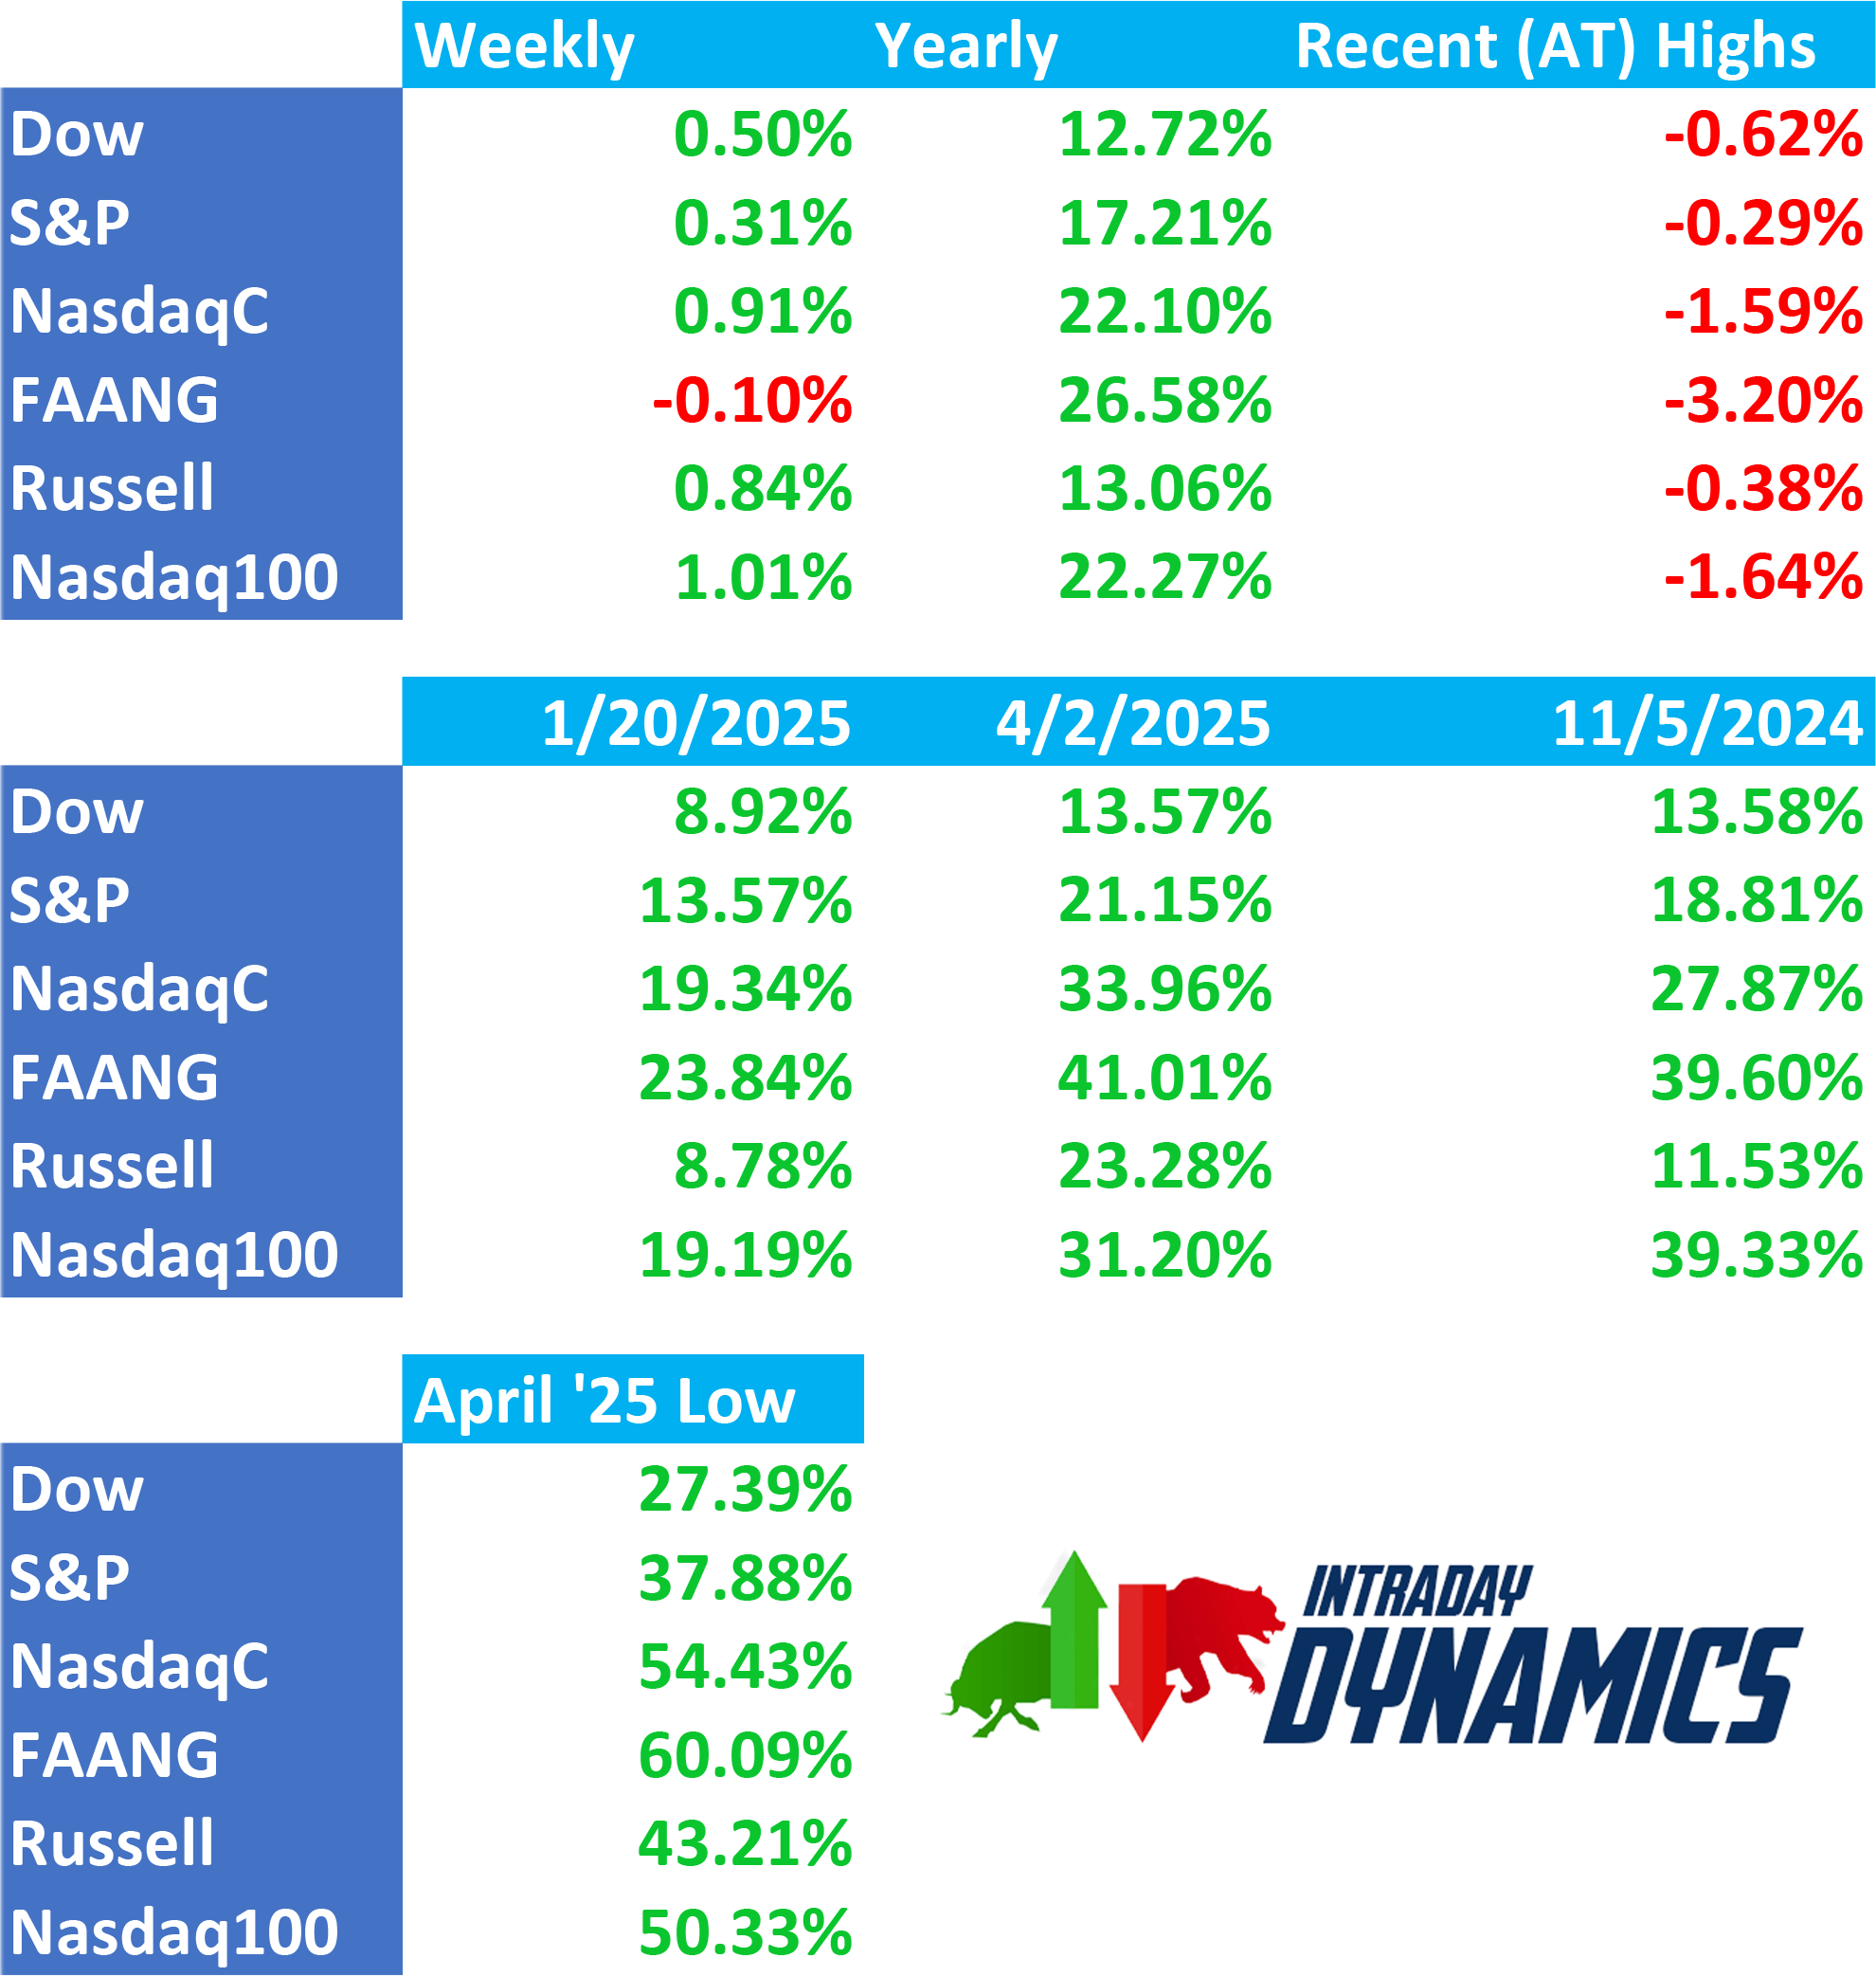
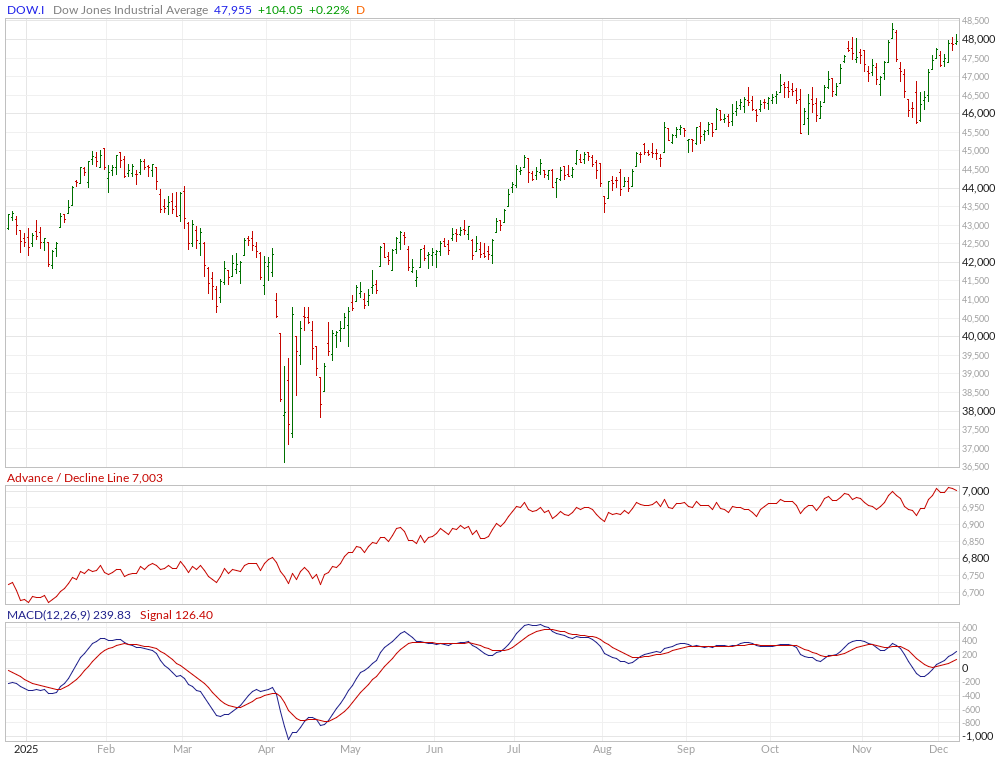
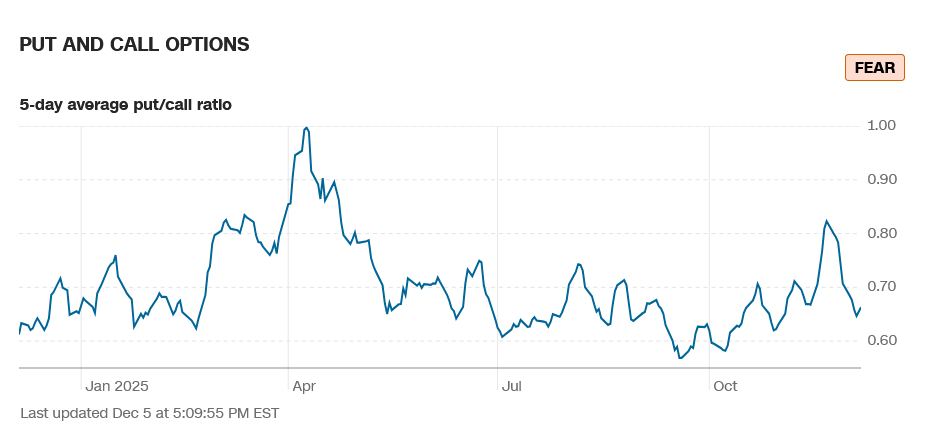
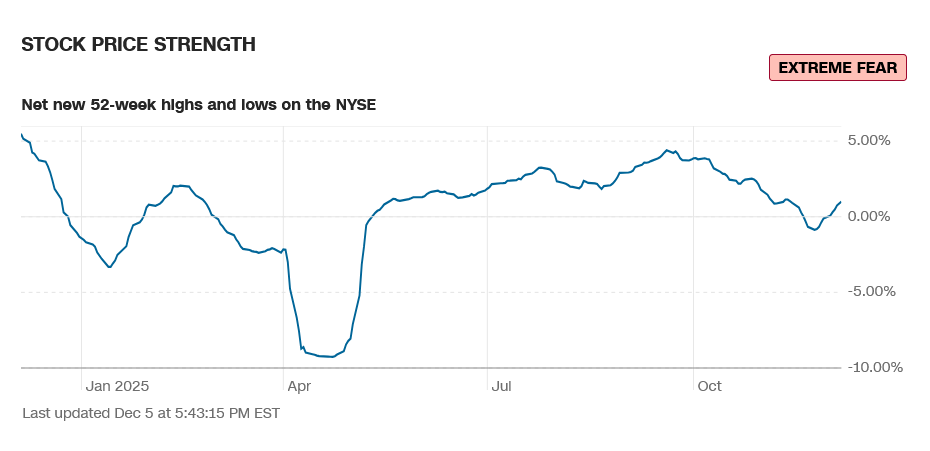
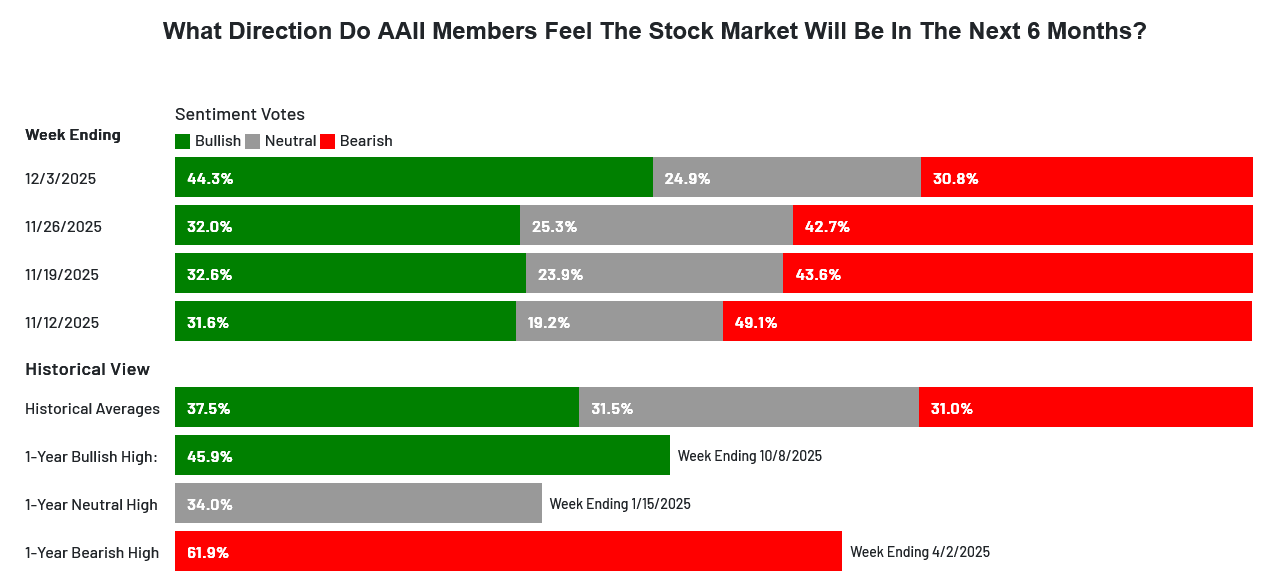 The CNN Fear and Greed Index is 40 and reads fear. Breadth rose on the week with the strength in the small caps, and sentiment reads fear. Latest AAII Sentiment Survey: Optimism Spikes. The Dow A/D ended at 7003 and sits at record highs. The VIX plunged back toward the lows of 2025, closing on the low of the range down -5.75%. The Put/Call ended at 0.66 and reads fear. The 52-week, A/D went positive to +1.01% and reads extreme fear. The Dow closed the week up +0.50%, closing in the top of the range at a new weekly closing high. The S&P was up +0.31% closing in the top of the range at a new weekly high close. The Nasdaq Composite was up +1.01% and the Nasdaq 100 was up +0.91%. The NYSE FANG closed down -0.10% near the lower end of the range. The RSP was up +0.25% on the top of the range at a new weekly closing high. The 10-year notes sold off and closed on the low of the range. The yield on the 10YR increased to 4.139%.
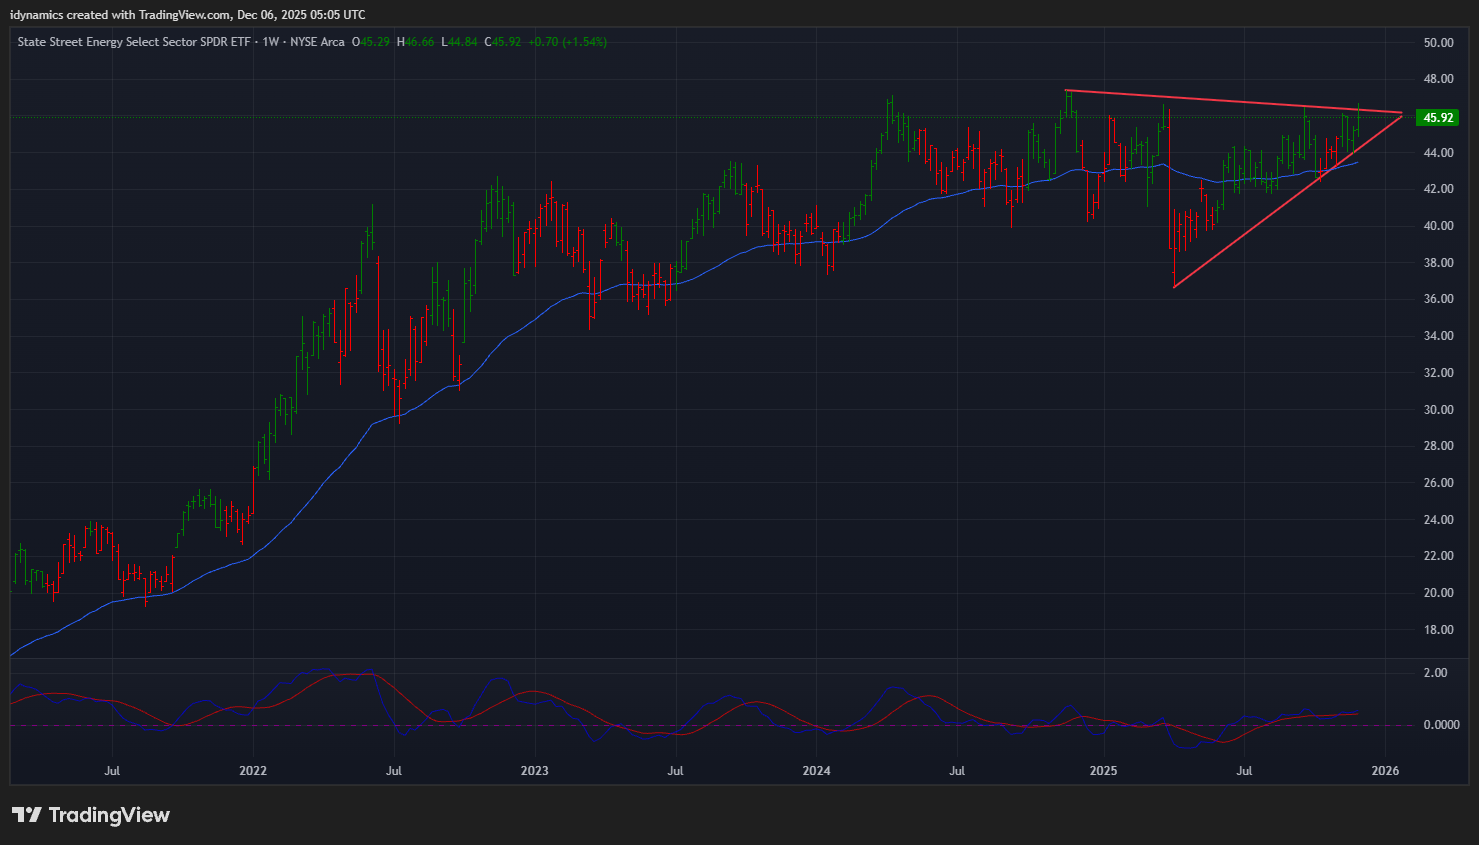
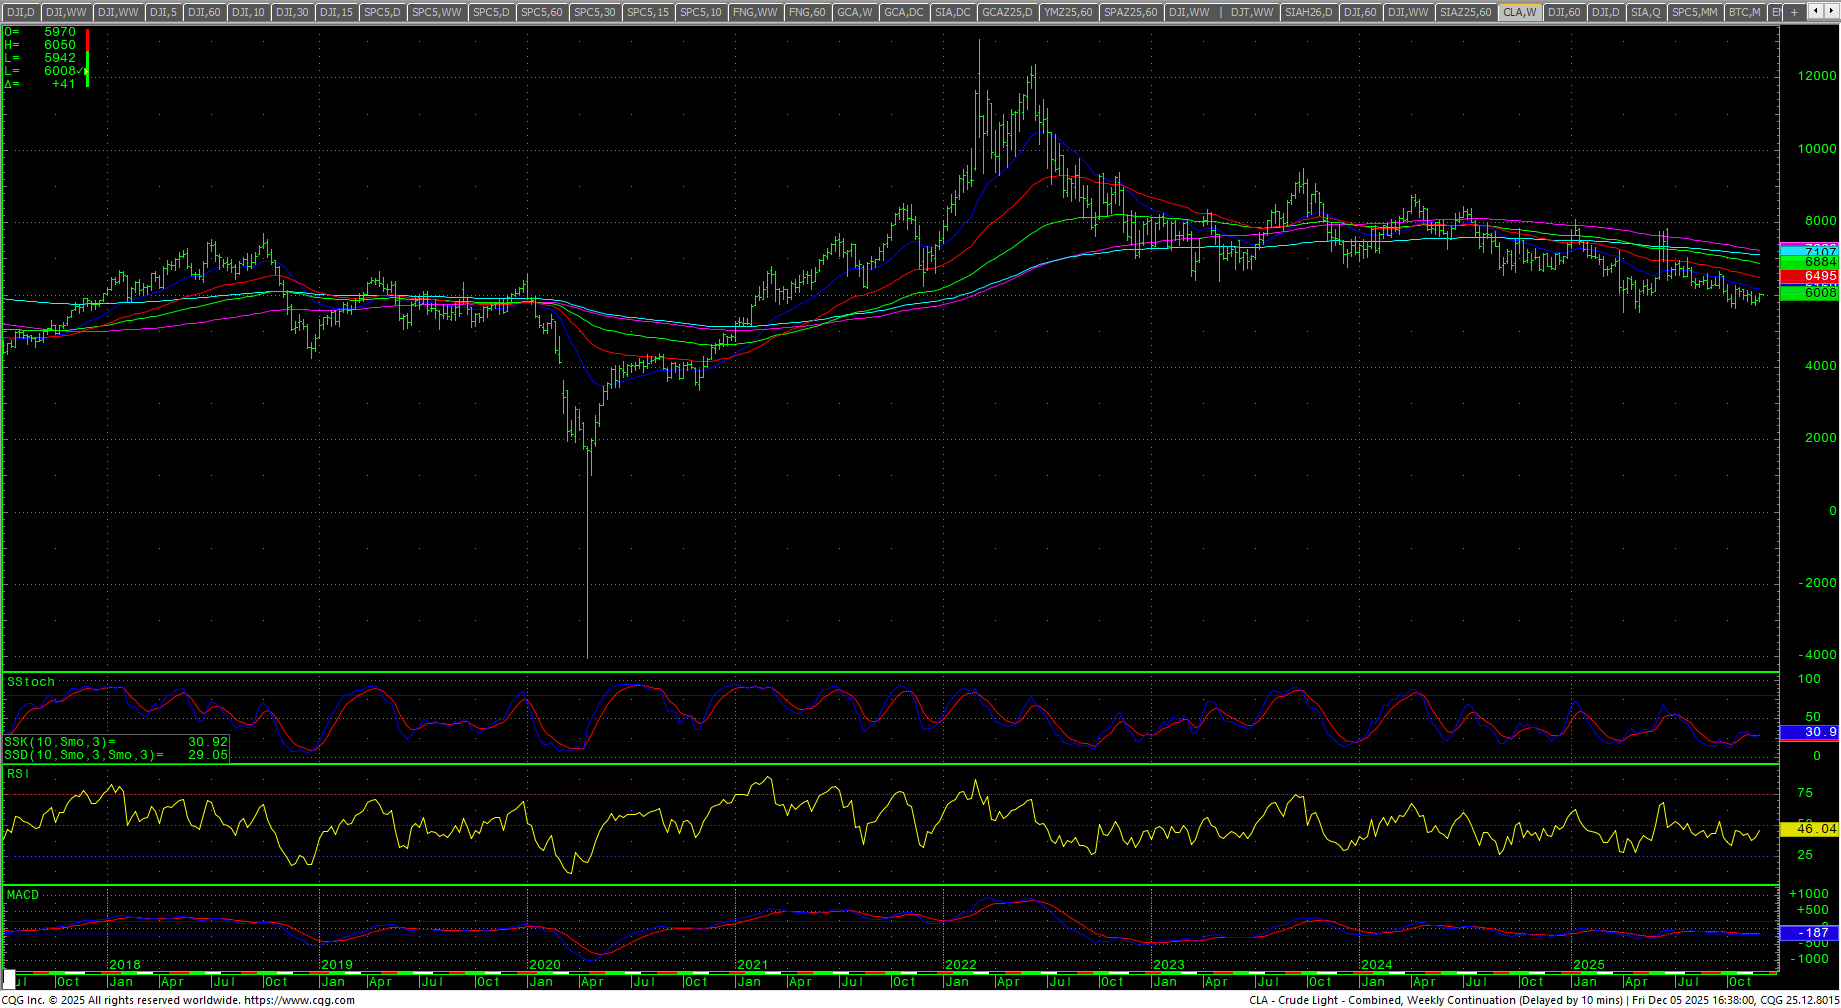
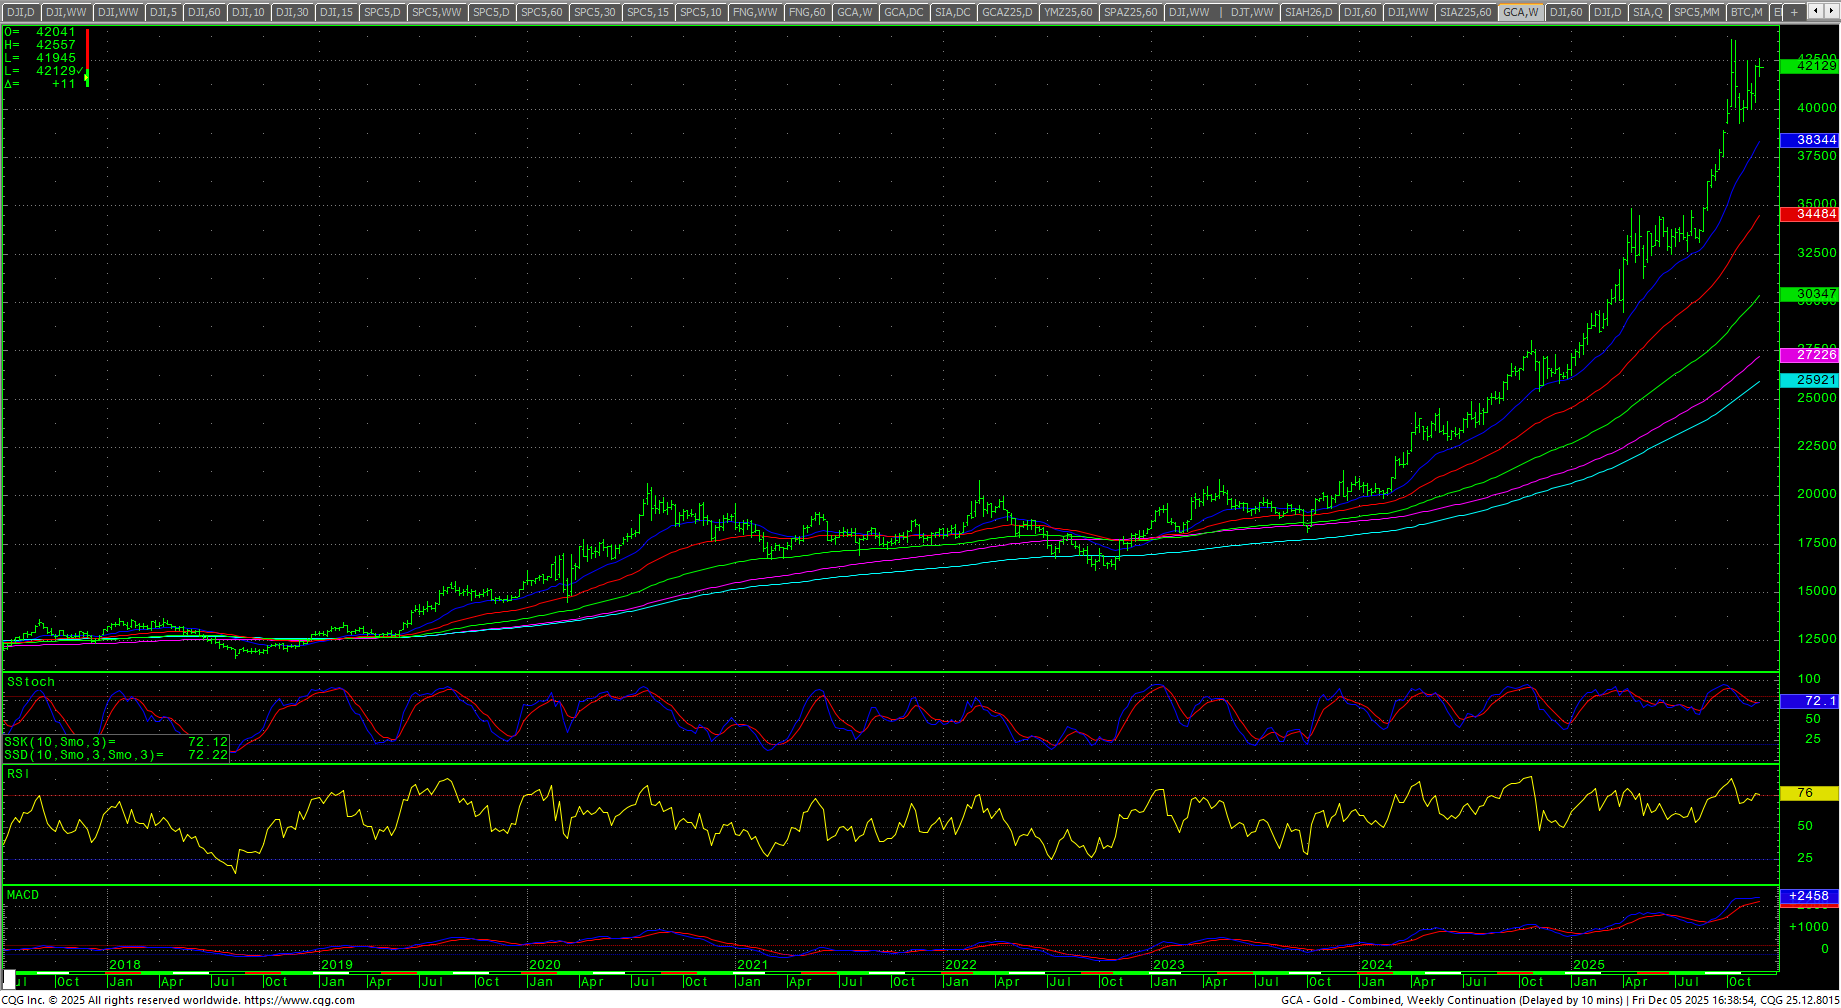
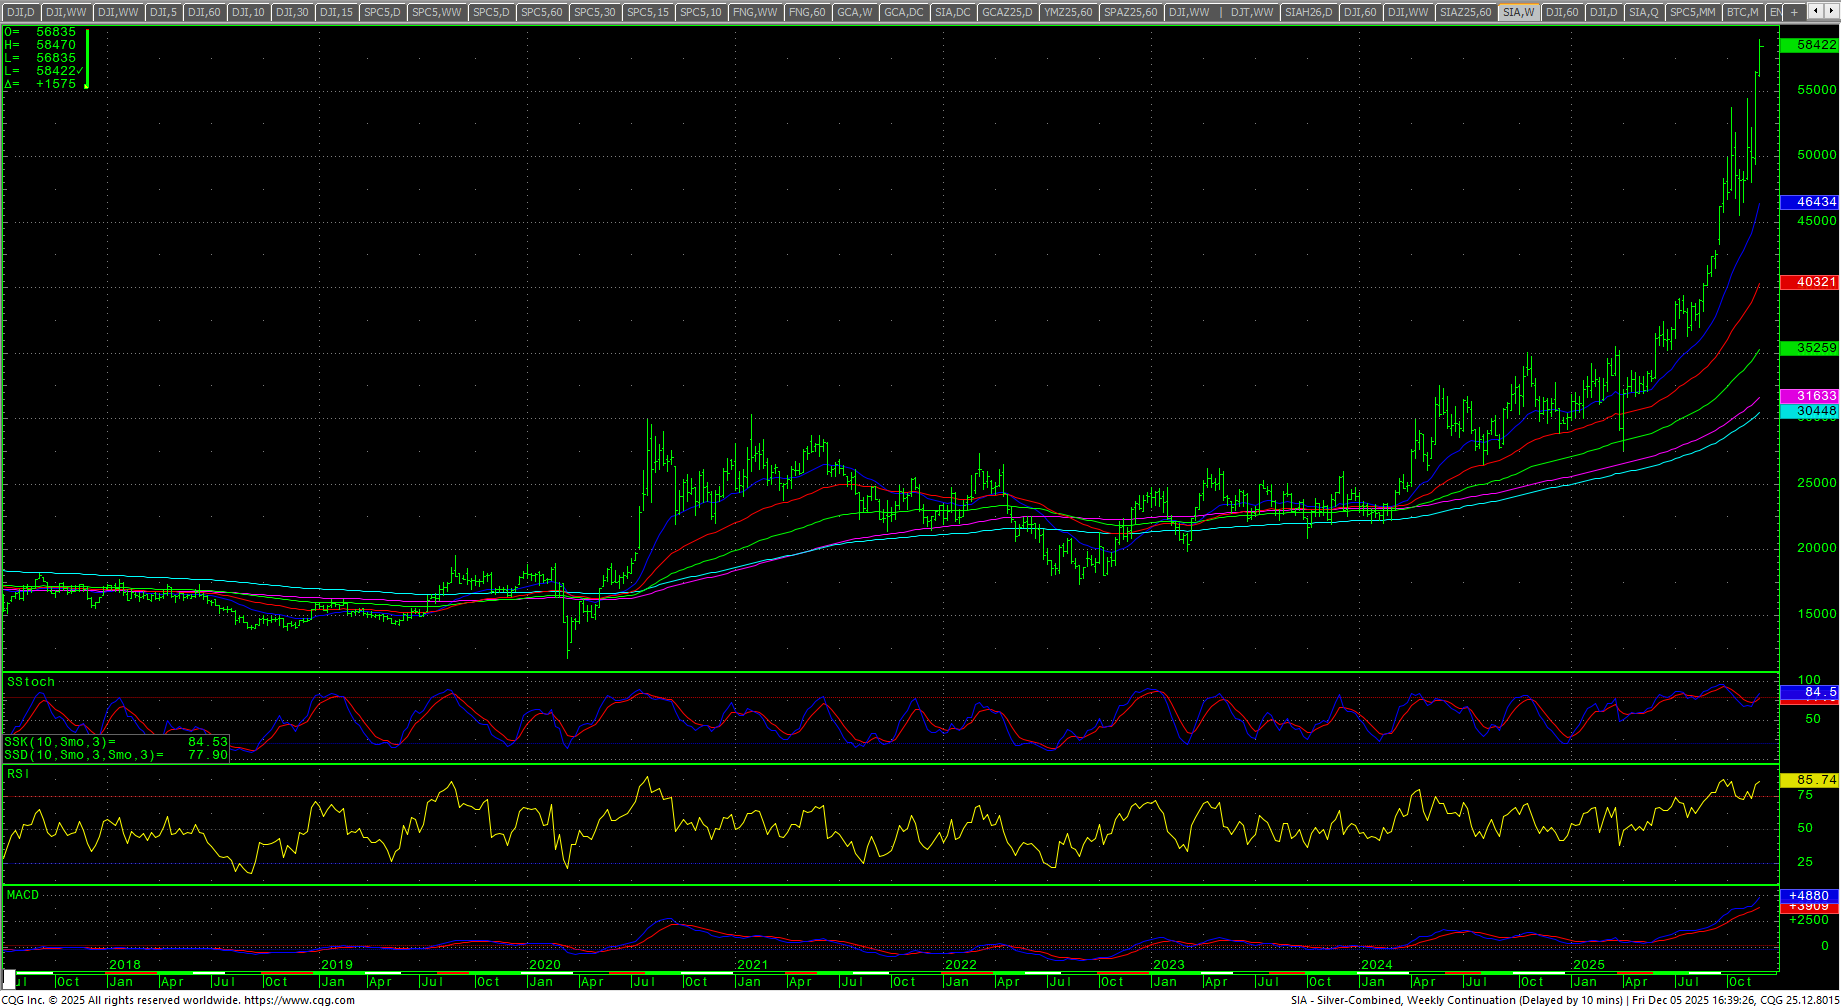
The CRB Index was up sharply +2.27% as crude recovered and silver exploded. Crude Oil regained the artificial floor at the critical $60 level and closed right at that level. The XLE (above) appears poised for a potential breakout to the upside which may portend higher energy prices in general. Gold was flat in the middle of the range closing above the $4200 level. Silver exploded to record highs with Comex prices trading over $58 and CFDs trading above $59.
Timing Points
There are no key dates for this week, even with the FOMC. Next week kicks off critical cycle timing that starts on the 15th and runs through the 17th with the focus on interest rates. For a longer-term look at the timing, see the Special Report issued on 9 November 2025.
- 12/15 *** X may run through
- 12/17 *** X key to bonds/interest rates
- 12/24 **
- 01/09 *** X critical/fast moves
- 01/19-21 *** X
- 01/29-30 ***
Dow Jones Industrial Average
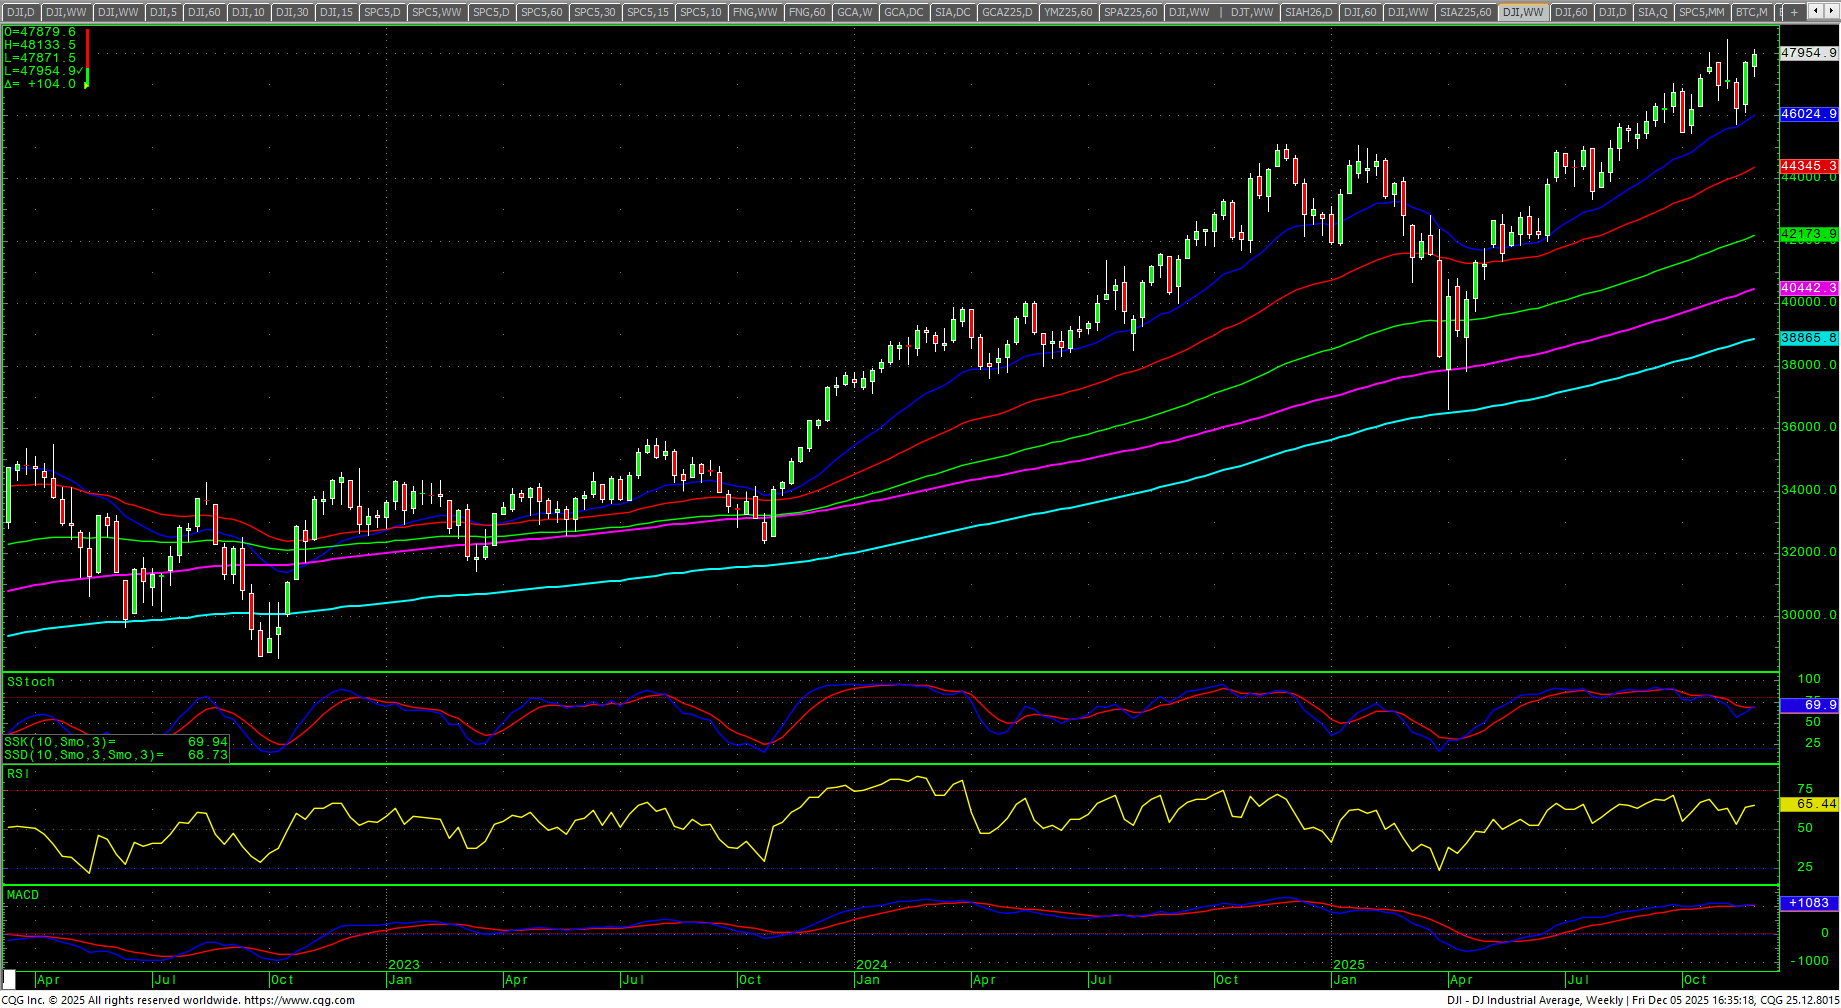
Dow Jones Industrial Average Weekly H-L-C
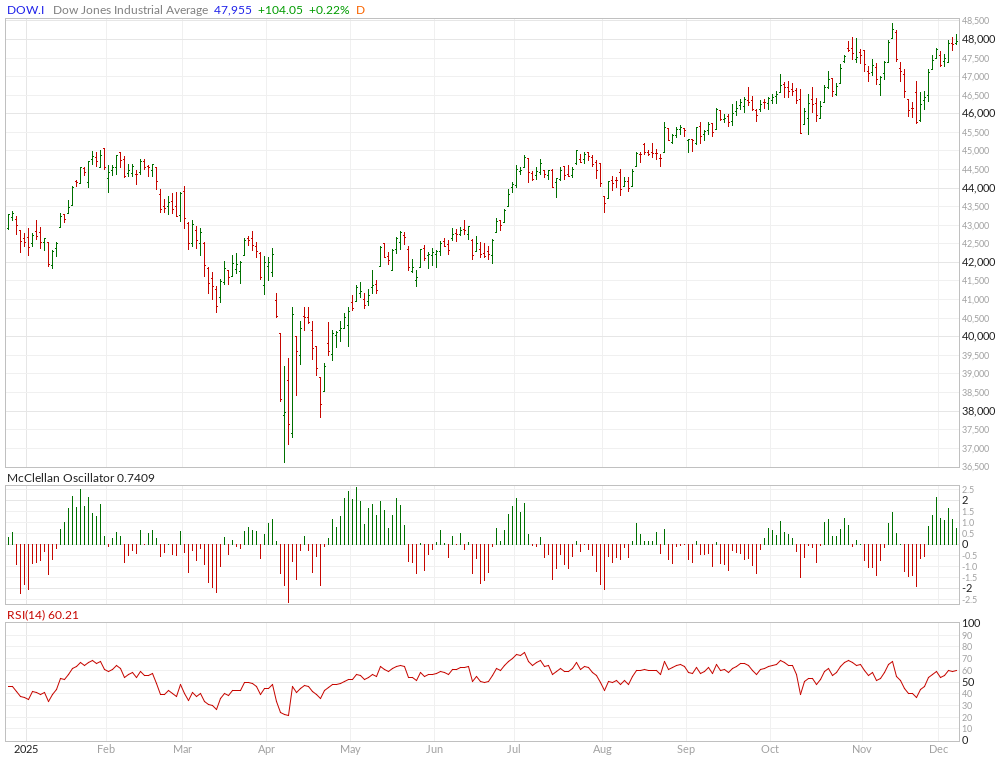
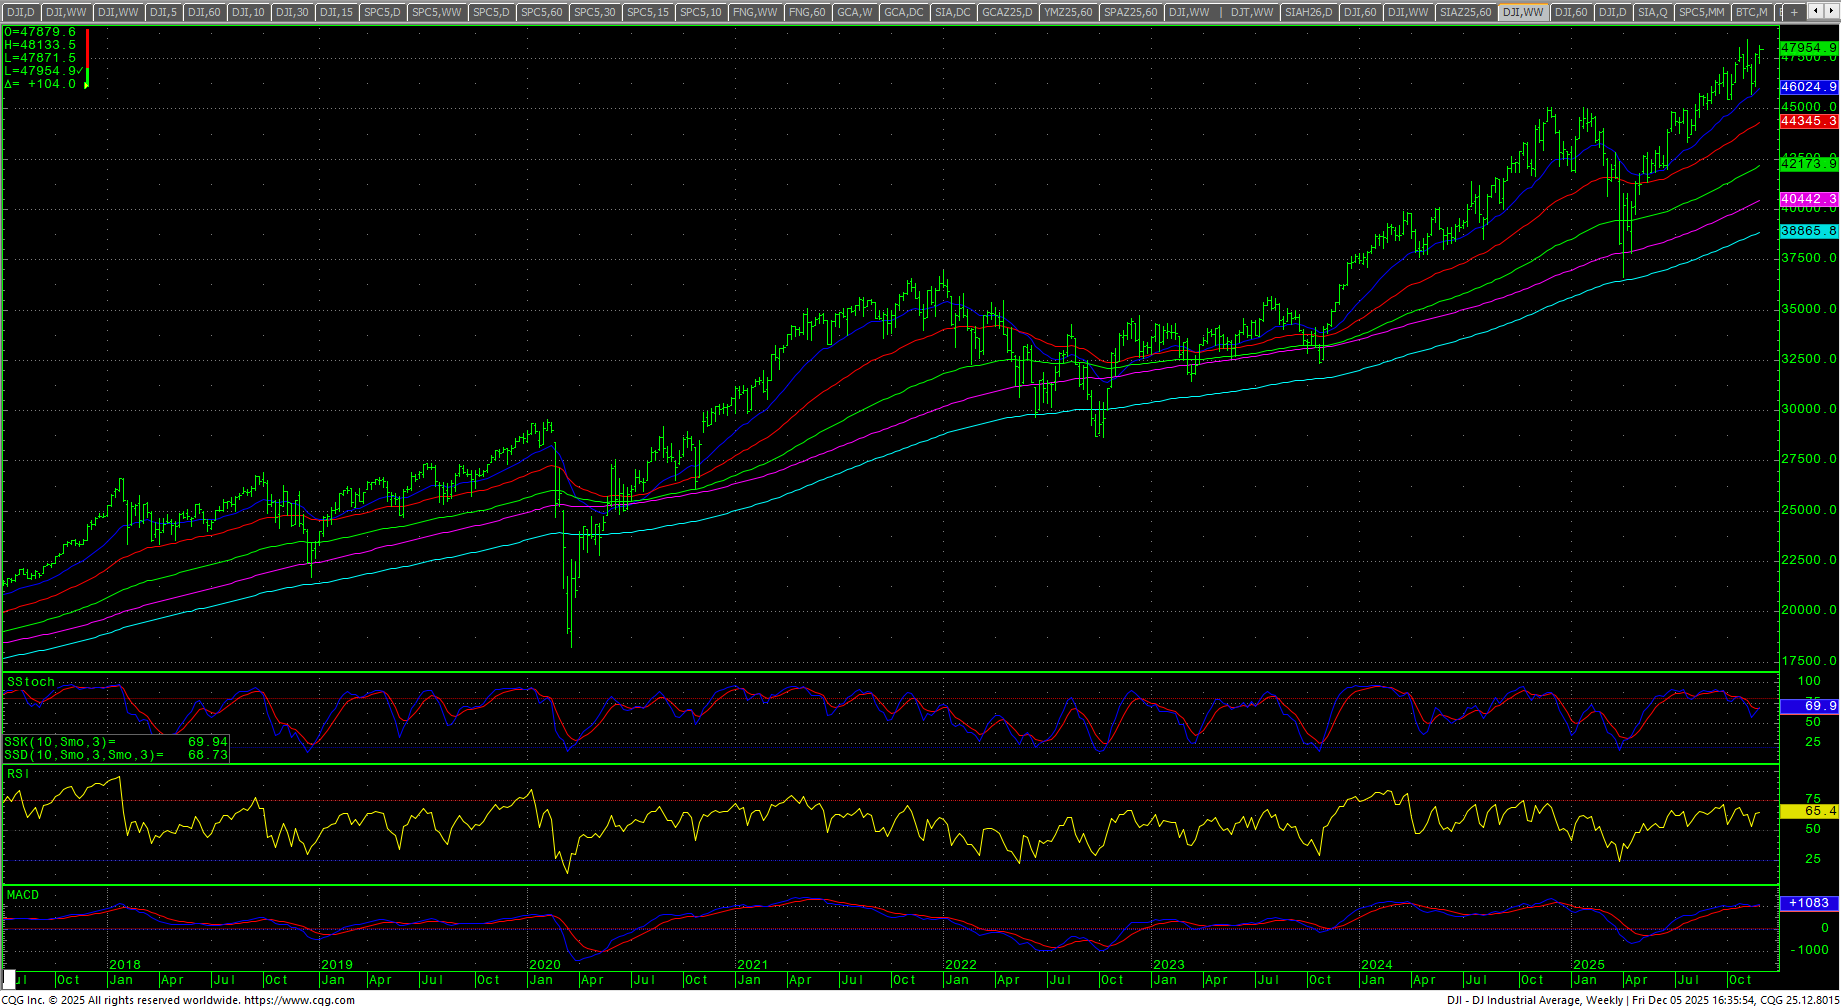 The Dow closed the week up +0.50% at the top of the week’s range, setting a new record high weekly close. The daily stochastics are up. The MACD is up as it reacts to a bearish divergence. The daily RSI is 63.90. The 200-day MA starts the week at 44757.00 and is at record highs. The weekly is hooking higher in the stochastics.
Dow Jones Industrial Average Weekly Candles
 Prices cleared the “death zone” on the hourly at 47755/47793 and closed above this level. Resistance remains at 48040/48061 and further rallies open potential for a retest of the record highs at 48430/48431 with trading resistance at 48134/48137. Daily closes over 48431 have potential to 48510. Closes over 48510 will open counts toward 48654 with potential to 48798. Above 48798 opens counts to 48942 and 49086. Closes over 49086 will open counts to 49230 and 49374.
Dow Jones Industrial Average Hourly H-L-C
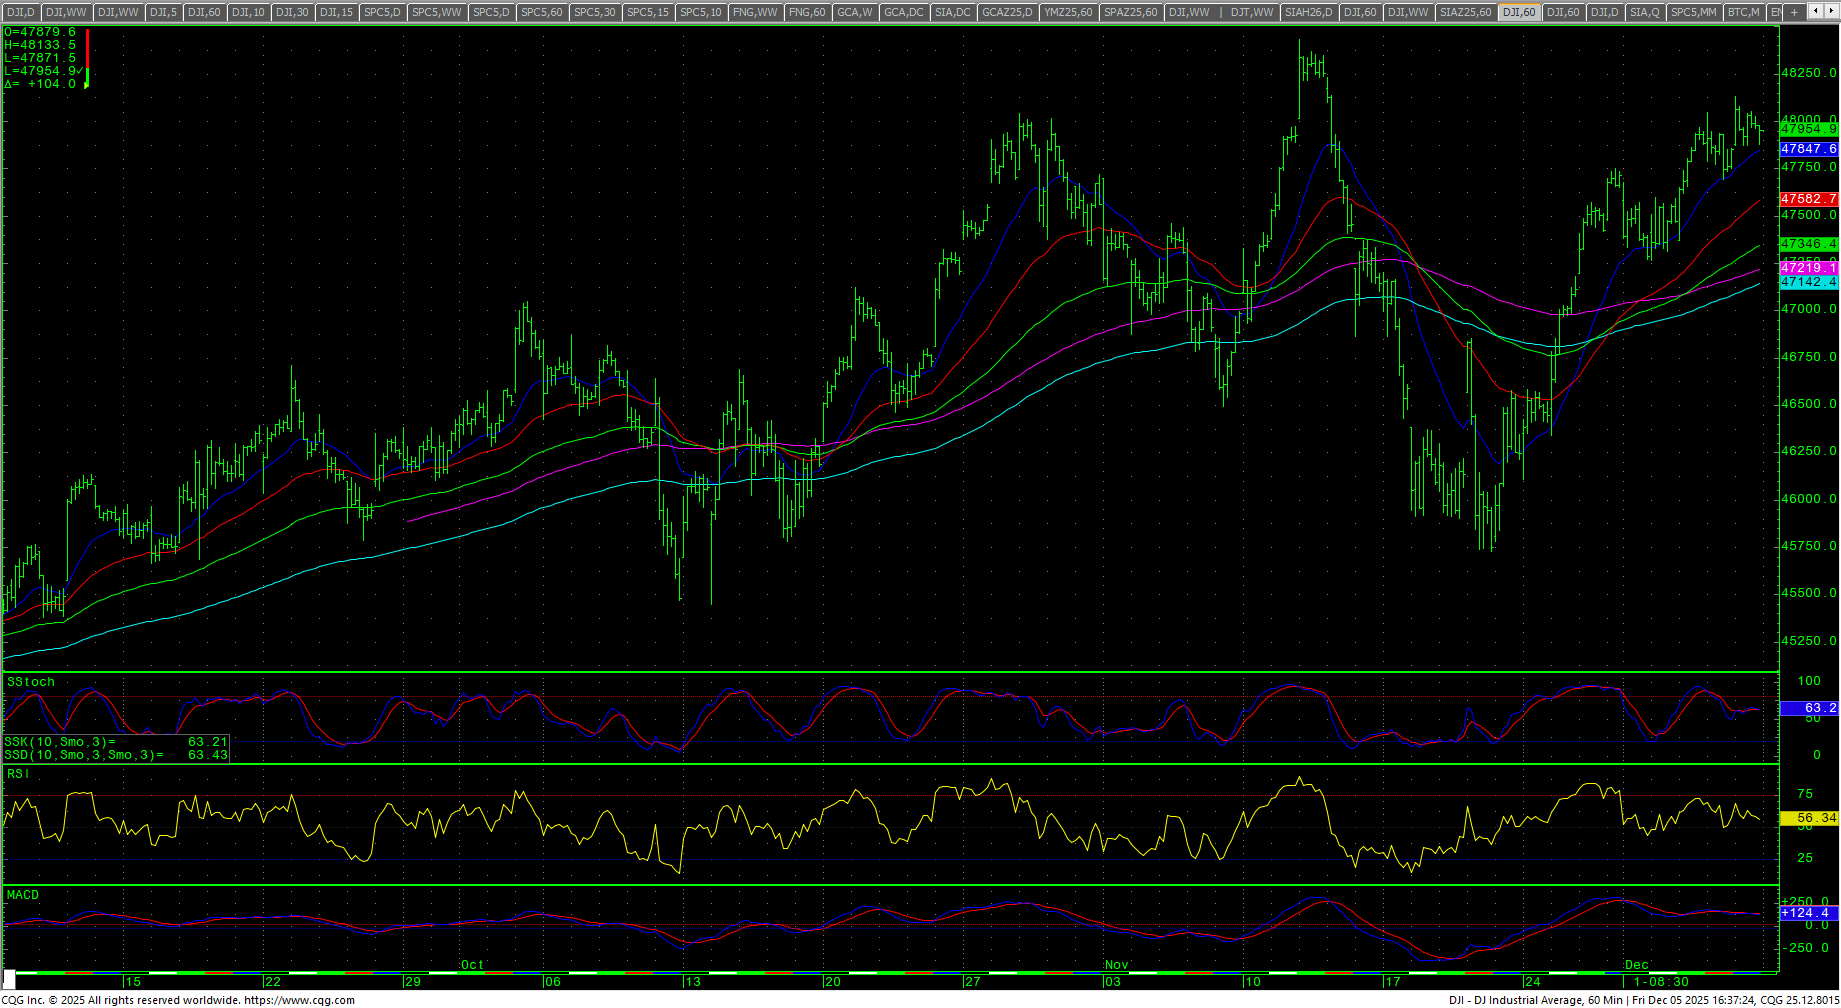 The hourly is neutral on Friday’s close. Support is 47710, 47566 and 47448. A breakdown under 47448 should test 47237/47214. Closes below 47214 will open counts to 47025/47020 and 46931. A breakdown under 46931 should minimally test pivotal support at 46647/46644. Daily closes under 46644 should minimally test 46330 through 46296 and opens full counts into the 45728 area with counts to 45452/45450 and support of 46220/46216 and 46050/46046. Closes under 45450 are a bearish signal and opens counts to 43916 with support at 44458/44948. Closes under 44948 should speed declines. Closes under 43916 setup critical support of 43340 with trading support at 43467.
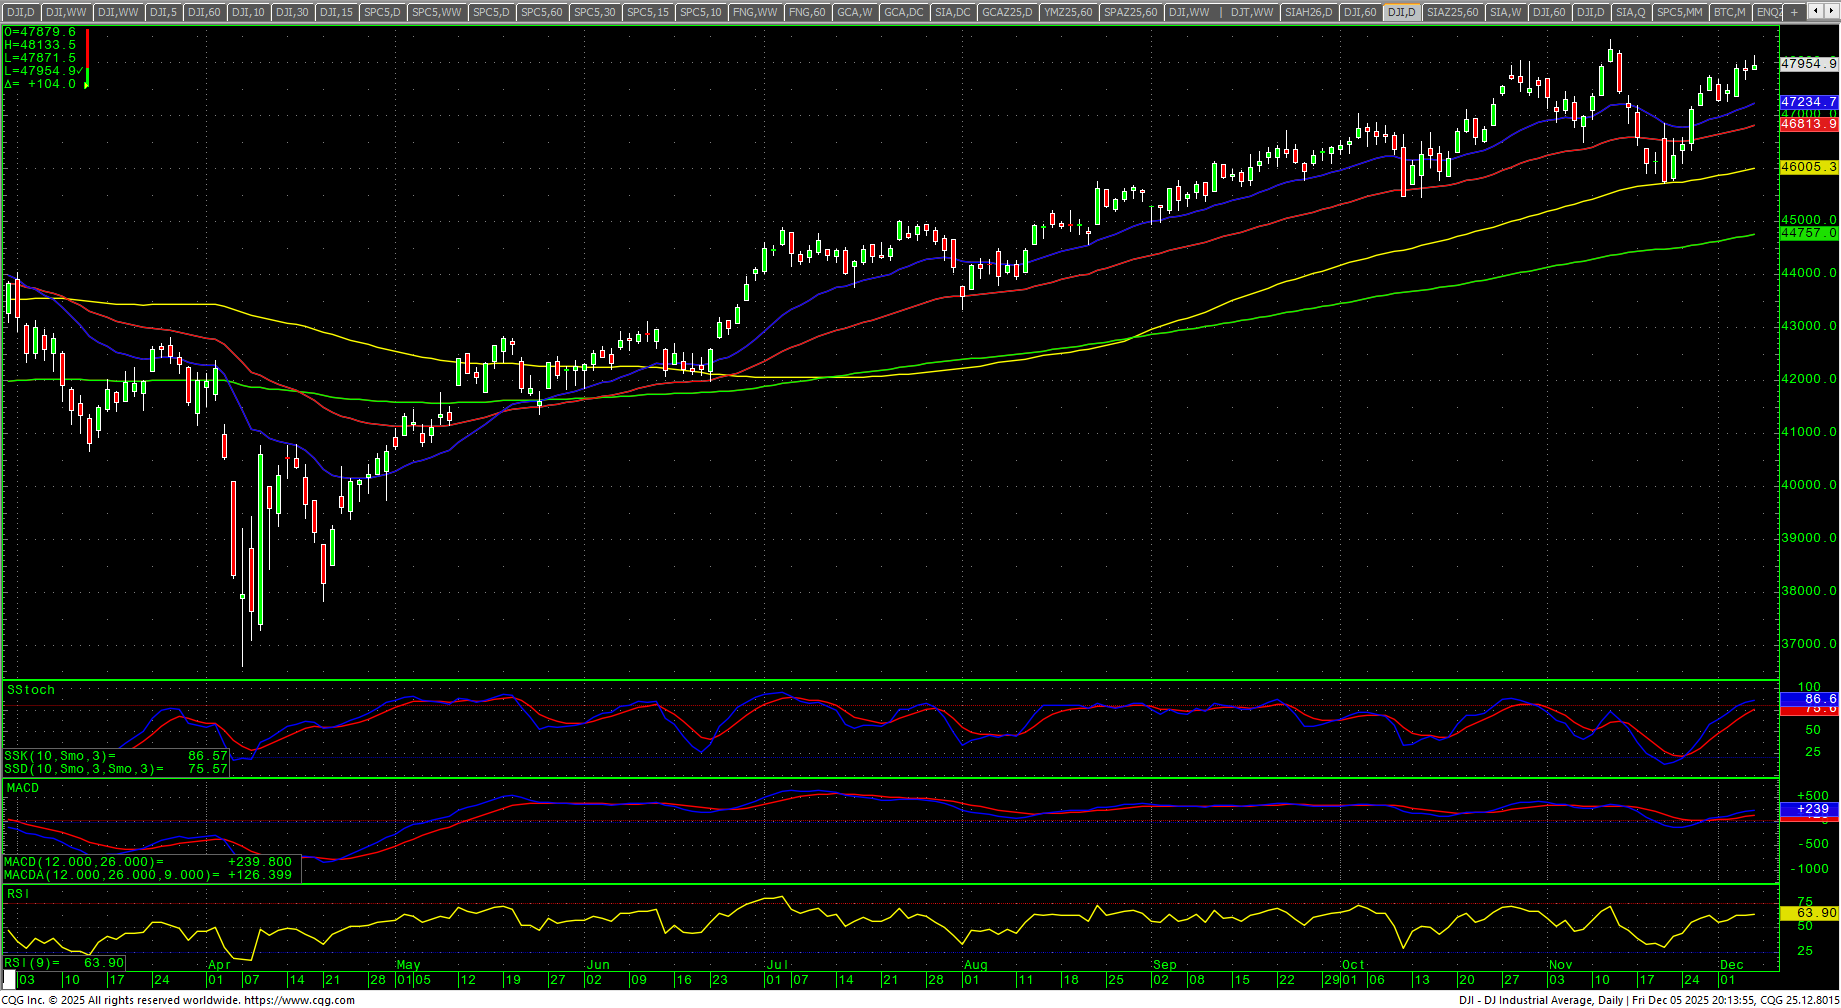
Dow Jones Industrial Average Daily Candles
| Resistance | Support |
|
|
S&P 500 Cash Index: SPX
S&P 500 Index Weekly H-L-C
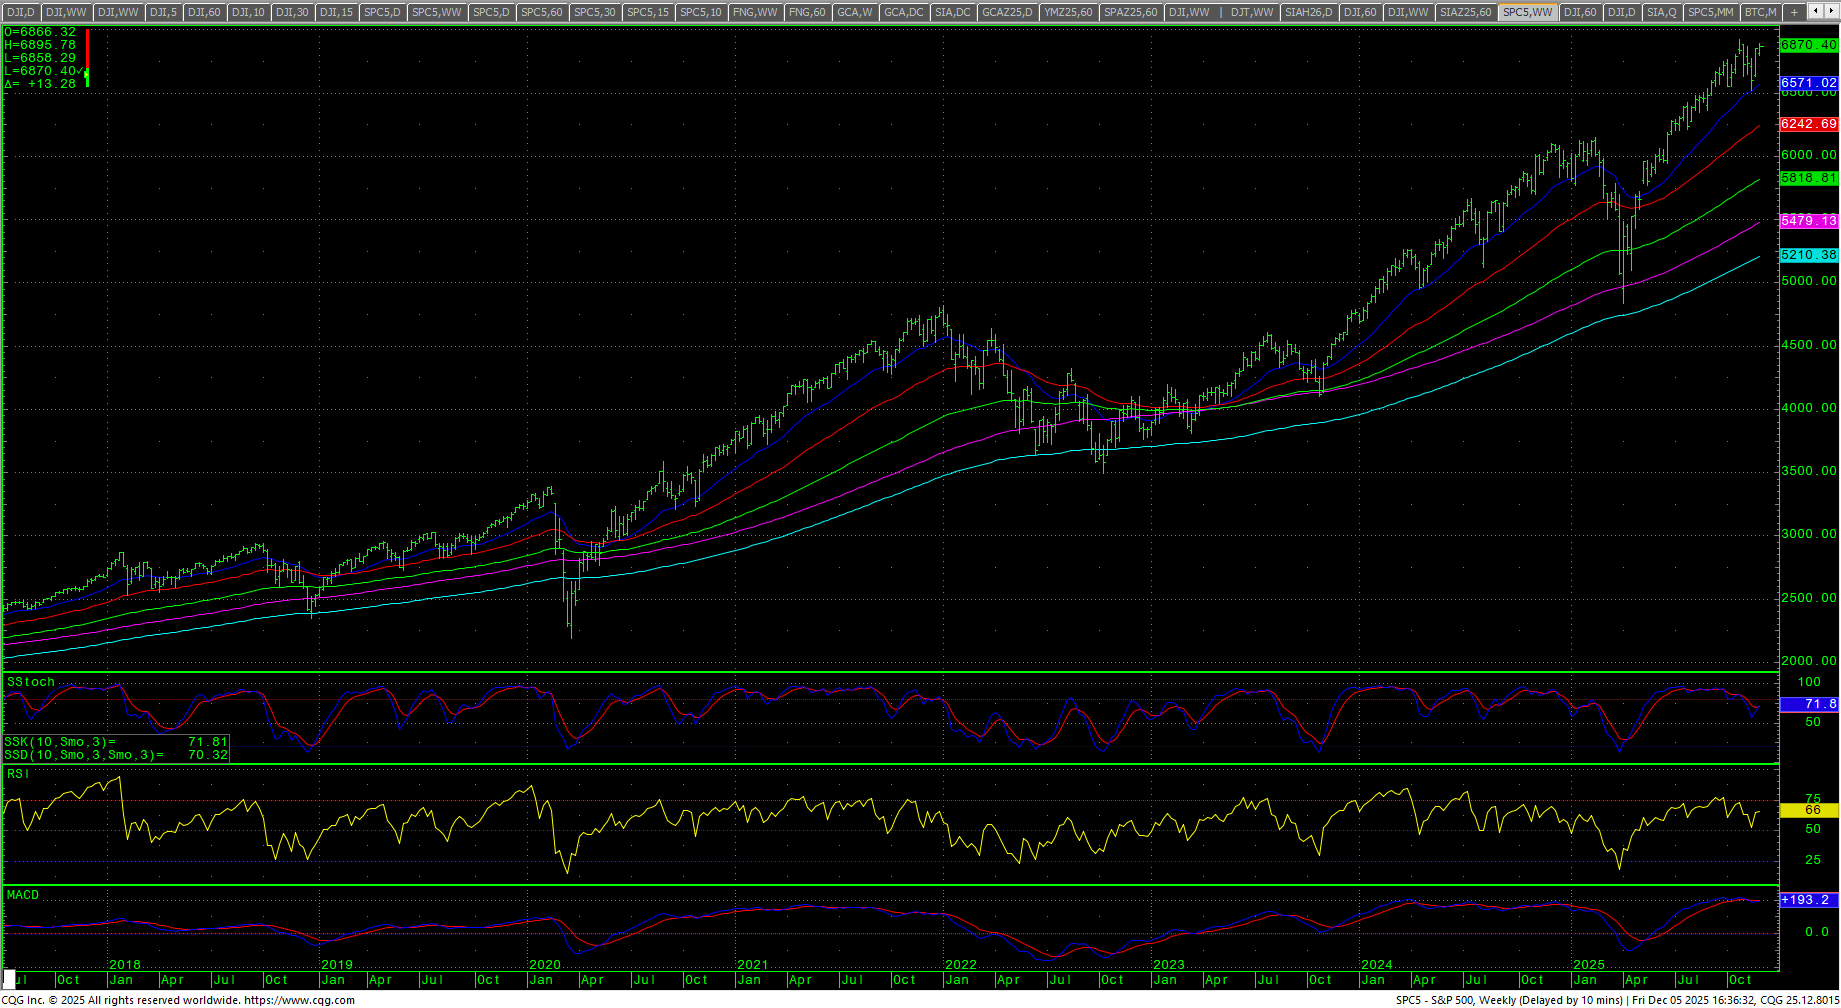 The S&P traded toward the all time highs and set a new weekly closing high, ending up +0.30% on the top end of the week’s range but off Friday’s intraday highs. Prices remain above the trendline breakout and that trendline currently sits at 6421.75. The SPY also set a new weekly closing high. The daily chart is up in the stochastics and MACD is up and flat. The daily RSI closed at 64.01. The weekly is down and trying to hook higher. The hourly is neutral with Friday’s close. The 200-day MA is 6329.57 and at record highs.
SPY Weekly Candles
 Prices tested and closed just under resistance at 6882 and further rallies should test 6908/6920. Closes over 6920 open counts to 6944 and 6980 through 7016. A close over 7016 offers counts to 7088, 7160 and 7214. Closes over 7214 setup a drive to 7250 and 7286 while opening counts as high as 7448. Above 7488 counts to 7520 and 7592. A drive above 7592 can test 7664 with counts to 7736 and as high as 7808. Above 7808 can carry to 7862 with potential to 7916.
S&P 500 Index Hourly H-L-C
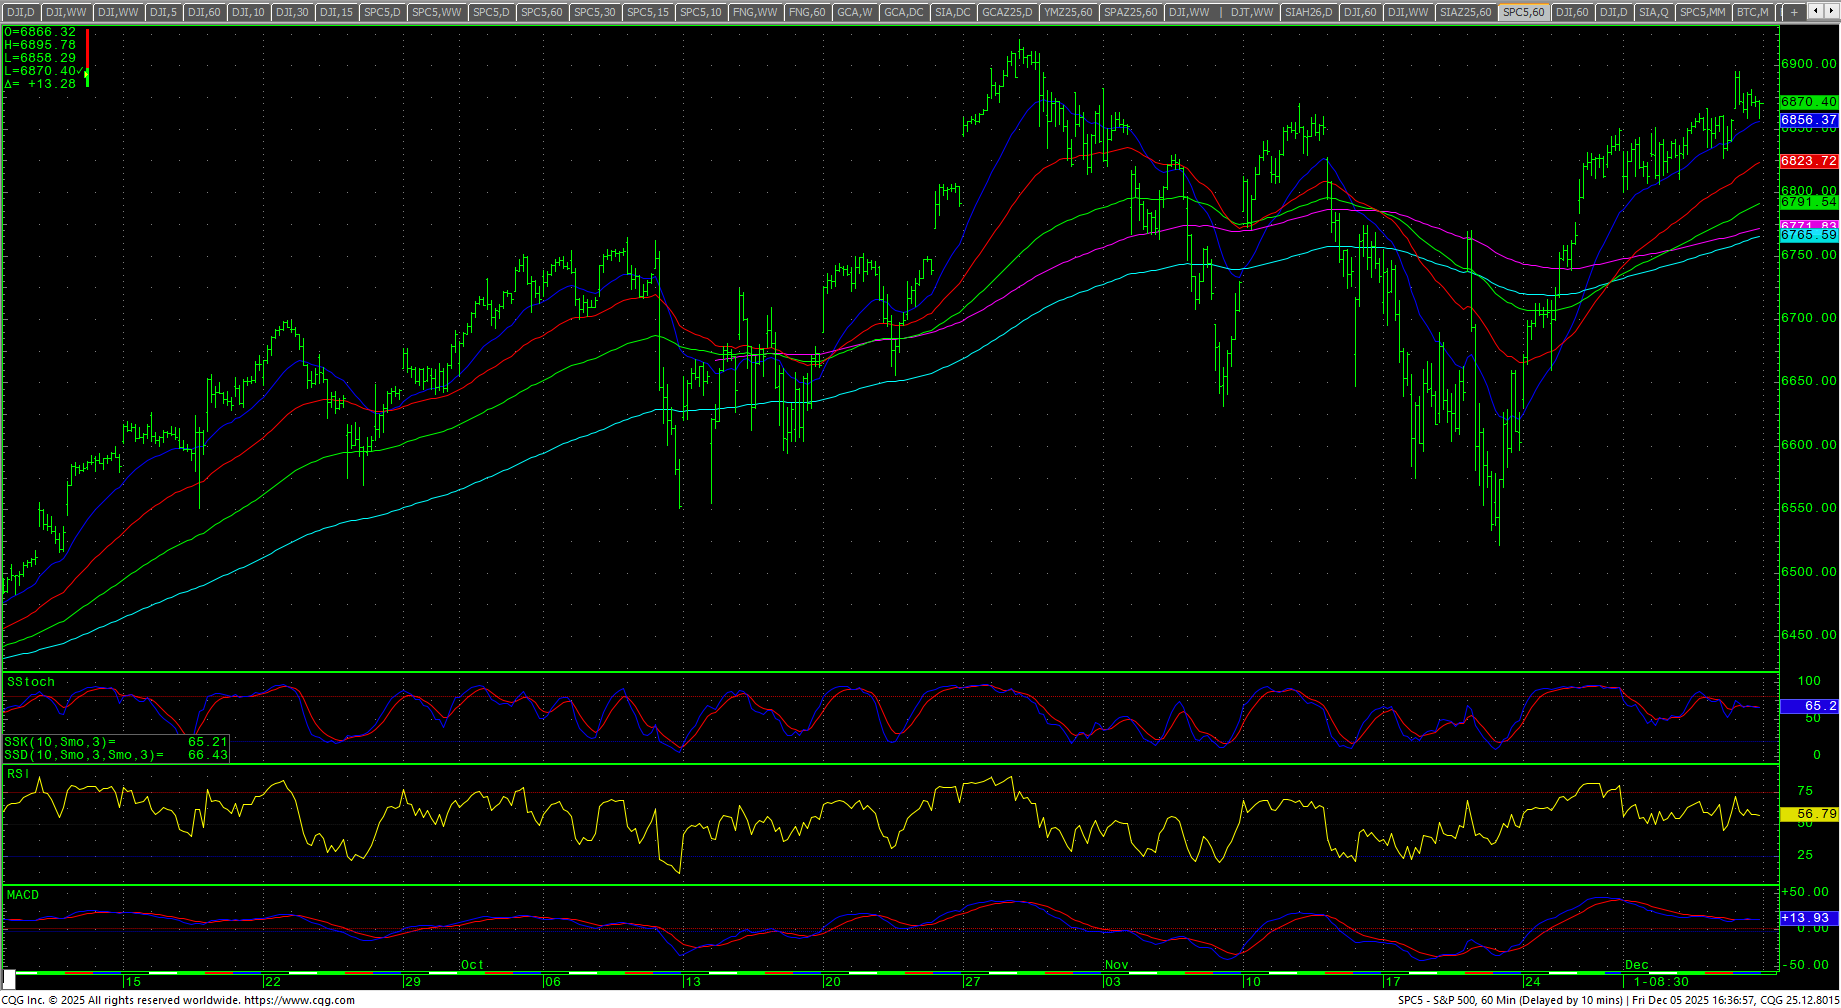 Support is 6840 and pivotal in a band from 6807 through 6797. A breakdown under 6797 should test 6777 with counts to 6750/6747. Closes under 6747 set up 6718 through 6708 with counts to critical short-term support at 6664/6660. Closes under 6660 set up a move to 6615/6610 and opens counts to a retest of 6521. Closes below 6521 open counts to 6361/6360. A breakdown under 6360 should test 6123 with full counts into the 6044 level with critical hourly support at 6212/6201 and 6123. Daily closes under 6044 should minimally test 5877 and 5799/5798 with full counts to 5631/5628.
| Resistance | Support |
|
|
Charts courtesy of CQG, Inc., CNN, Koyfin, Trading View and AAII