
TECHNICAL ANALYSIS (by Intraday Dynamics)
Note: There will be no update next week. Depending on how this week’s critical cycle timing plays out, I may do a short update before Christmas Day.
Major Indices Week of December 12, 2025
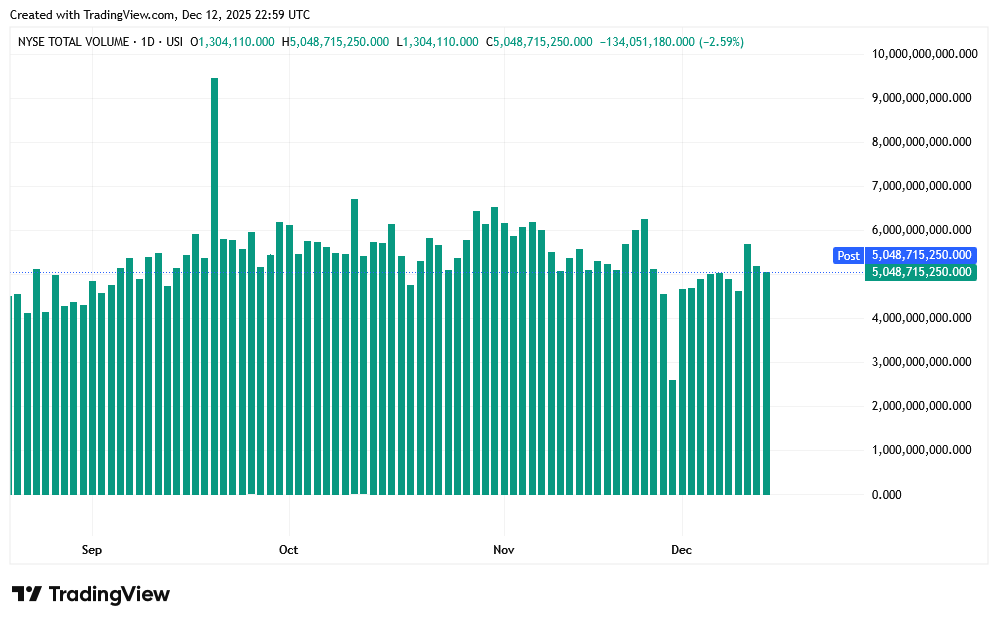
 NYSE Volume
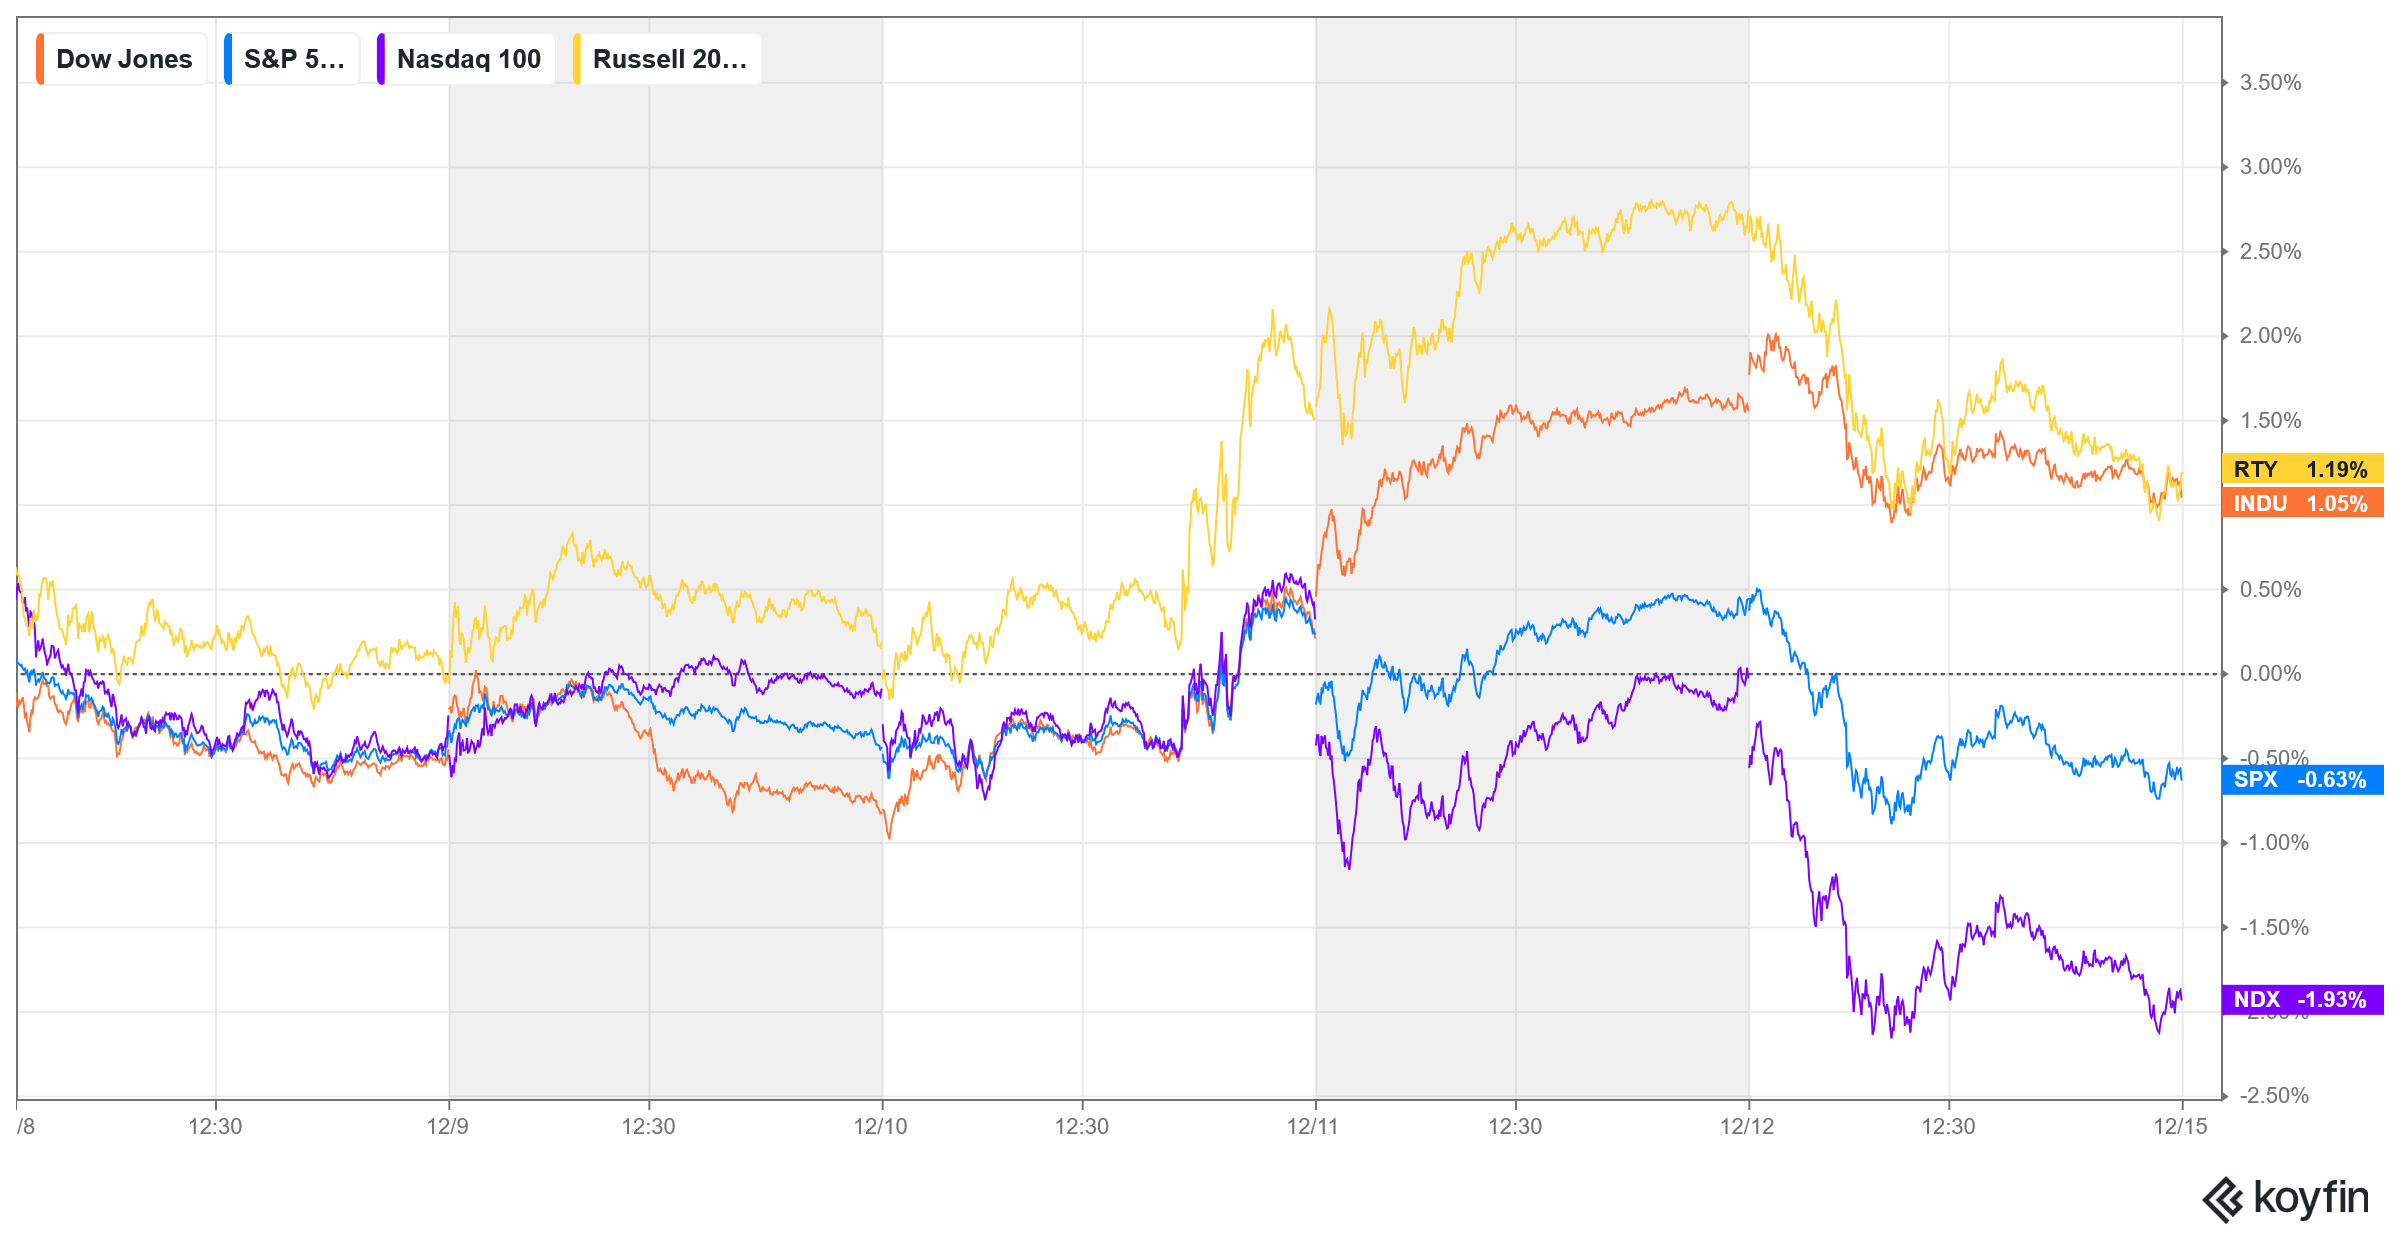
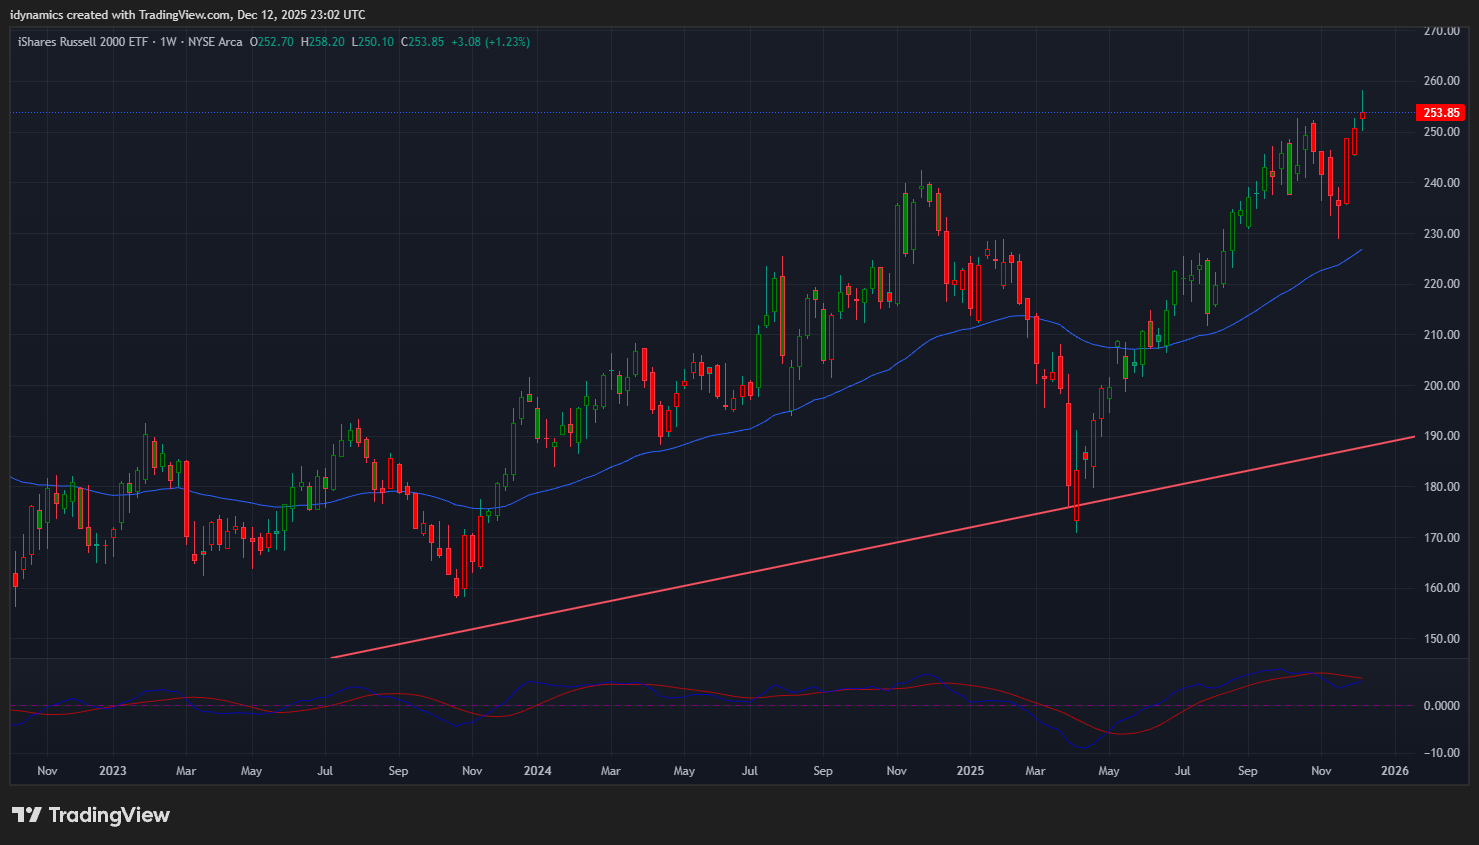
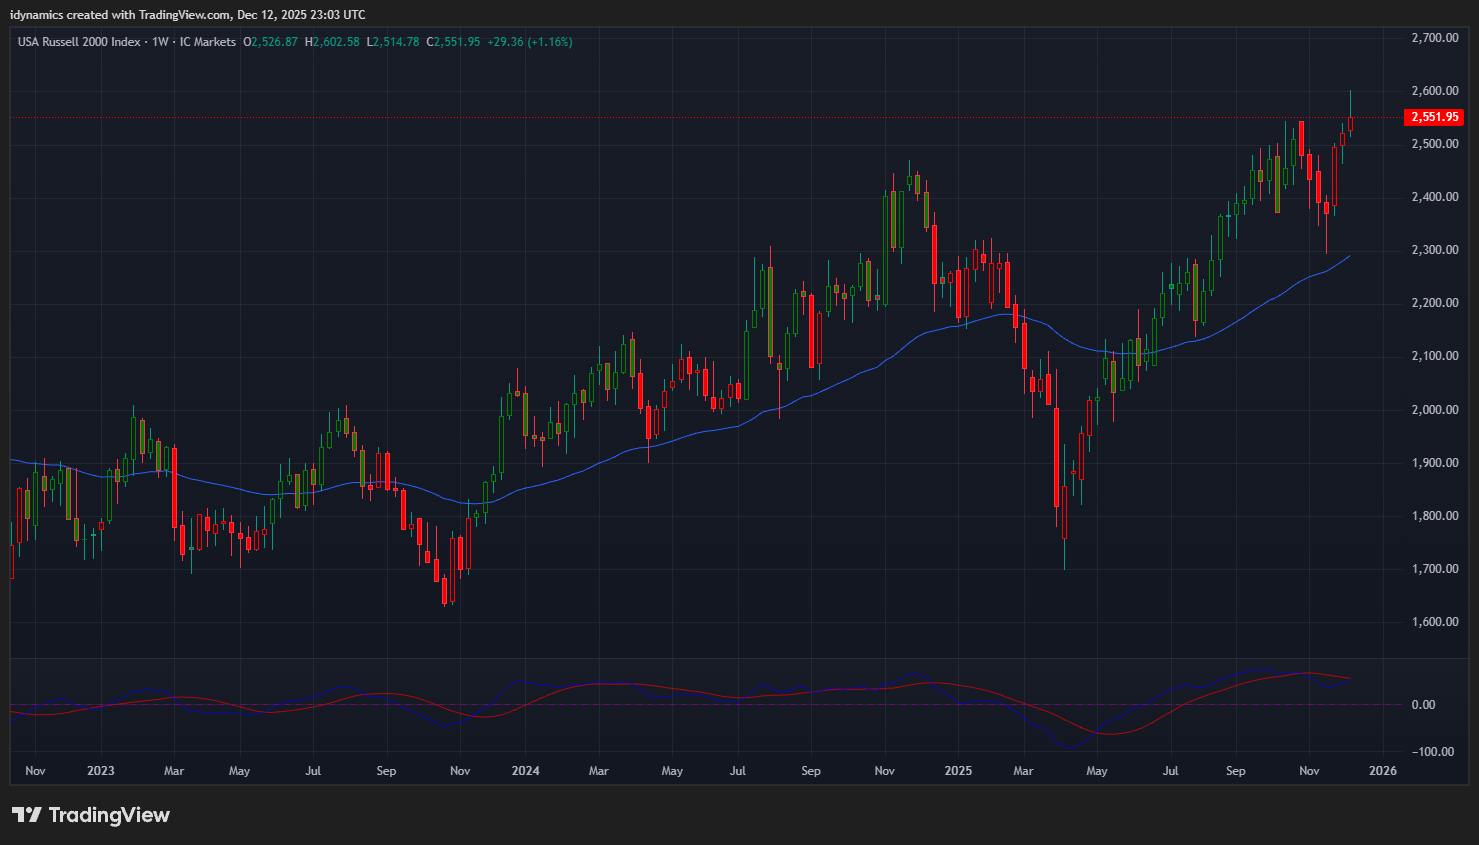
 As goes tech, so goes the market (Sometimes?). Stocks traded a mixed week with tech weakening and a “rotation” into small caps, marking a year end portfolio polishing move, as small caps moved to record high territory. The “Street” remains focused on the big benchmarks, those being 50K Dow and 7K SPX.
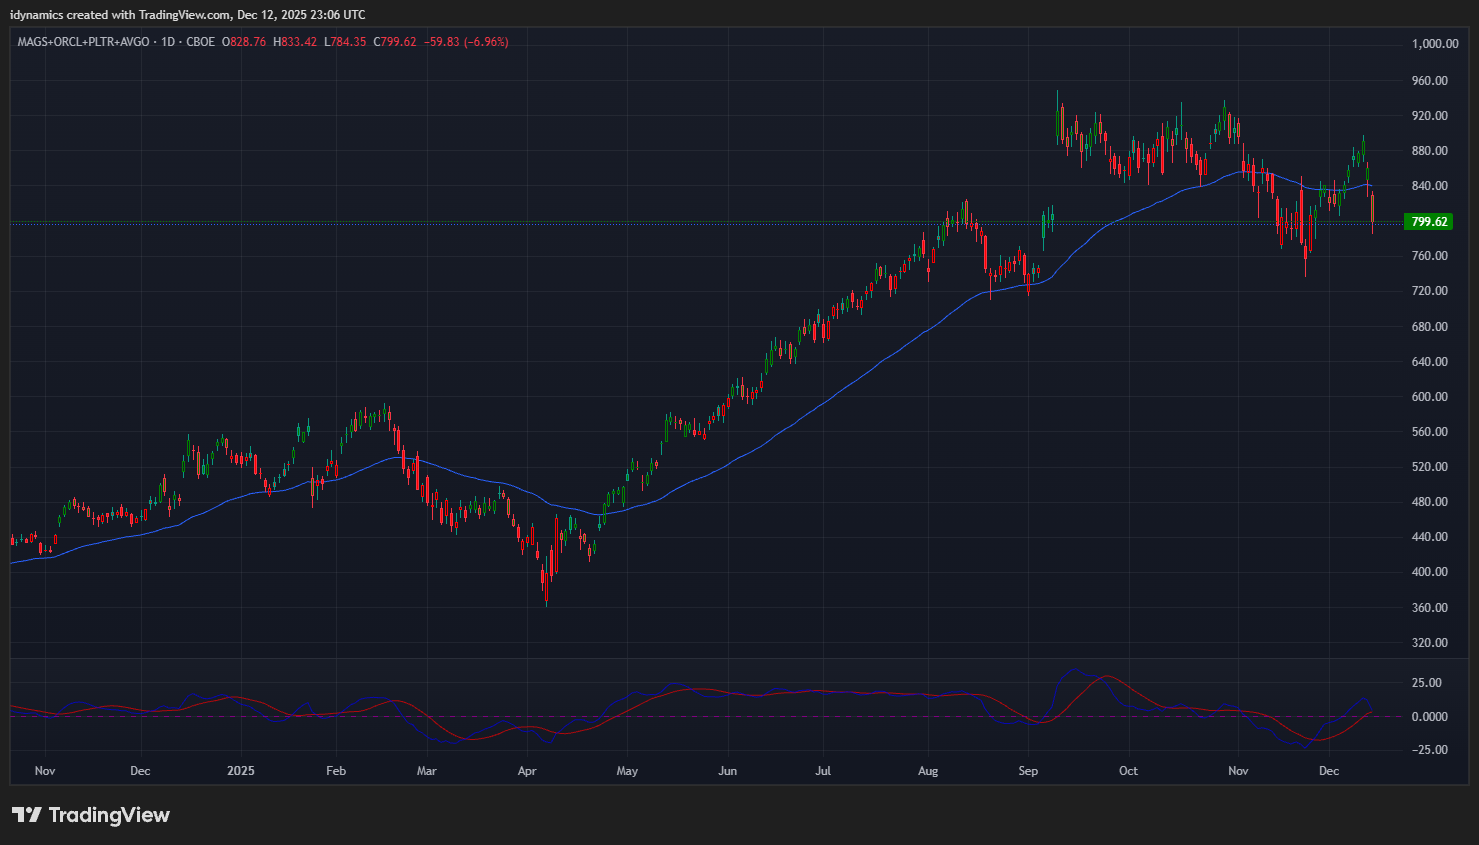
MAGS+ORCL+PLTR+AVGO Daily Candles
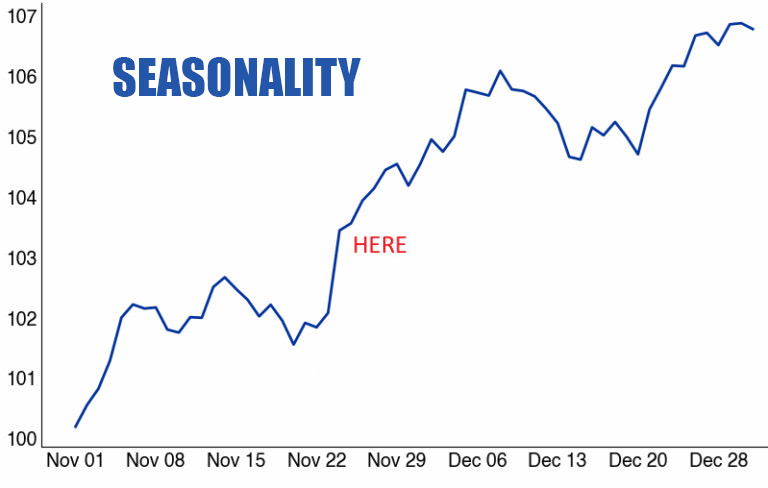
 We head into the end of 2025 with seasonal trends for the month of December favoring the “Santa Rally.” Pedestrian sentiment has improved while the VIX has plunged back into extreme complacency. I pointed out last week, the Dow Transports have been in a sharp upmove, one that took the DJT to kiss the overhead trendline off the 2021 tops. With the Fed leaning toward “the QE that is not QE”, …this makes sense as it is often a harbinger of a liquidity infusion.
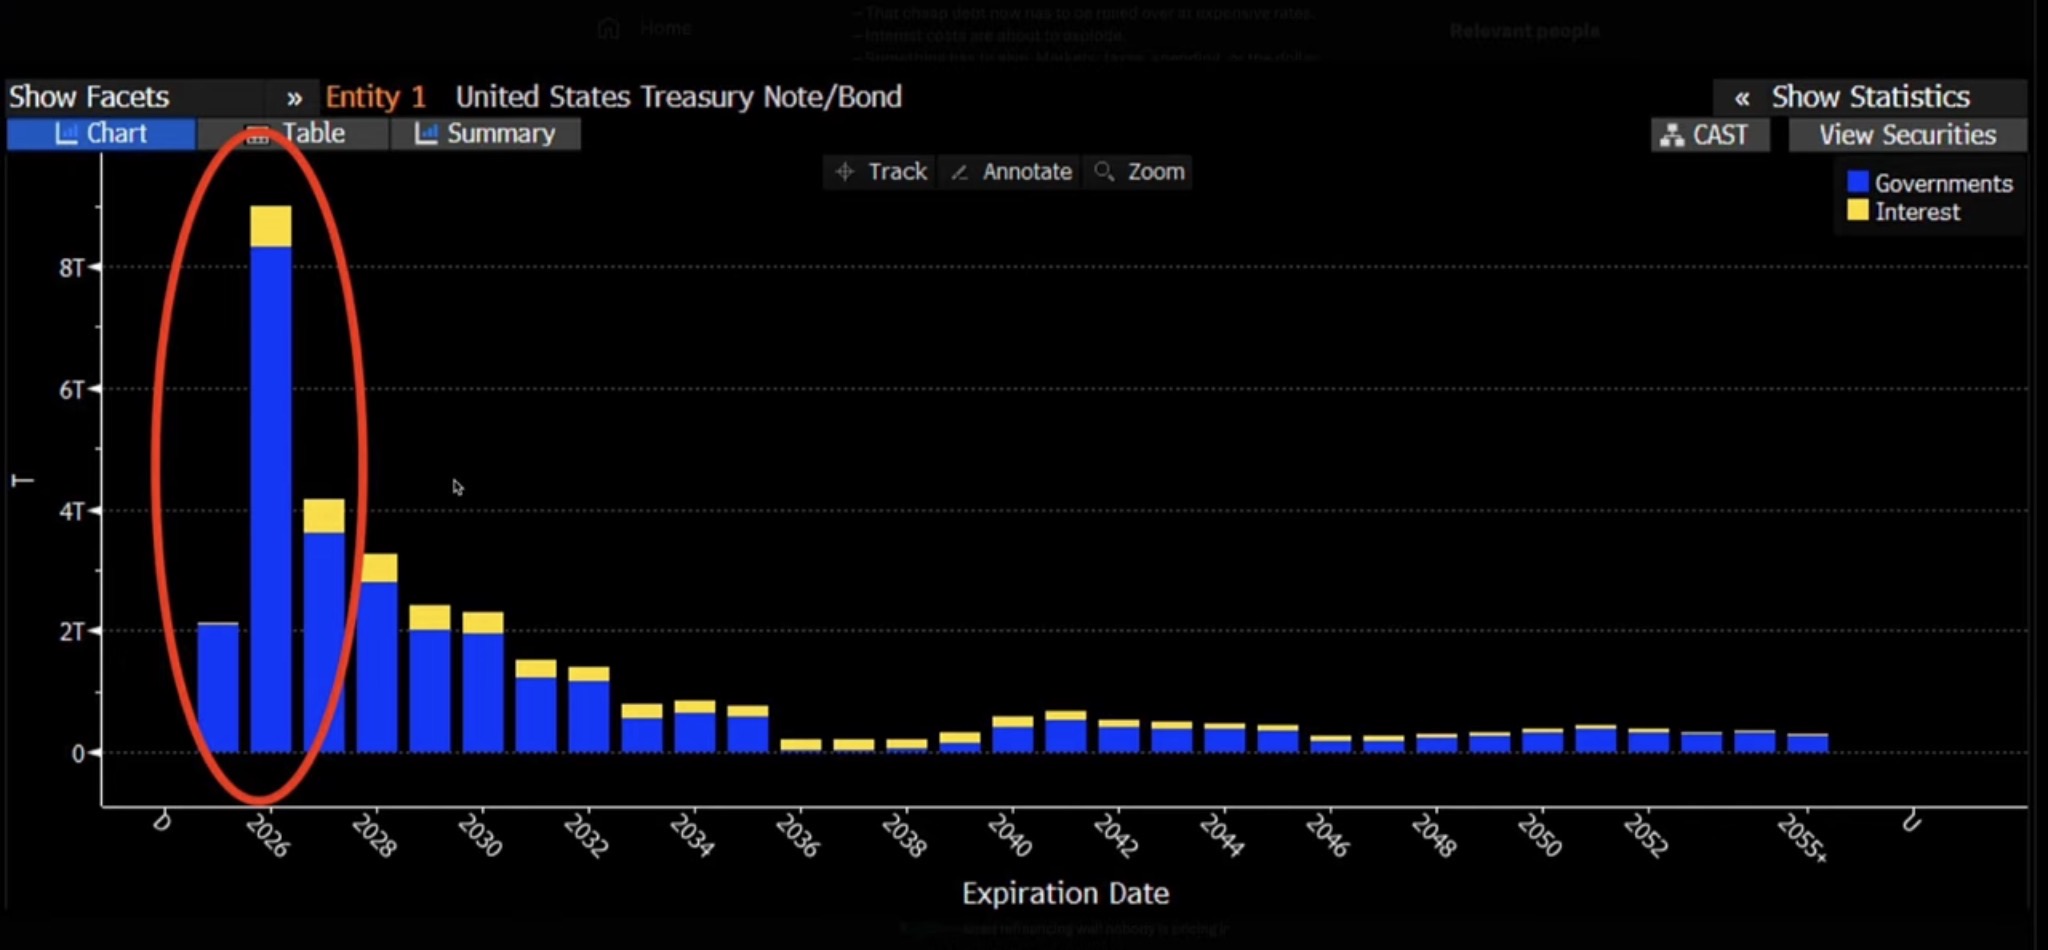 The biggest thing about the Fed doing QE (while also NOT doing QE?) is the massive amount of debt rolling over in 2026. The Fed just stepped in at the last auctions and bought $13.5 billion in debt, the largest purchase ever…and it looks like the Fed will need to step in next year with basically $8 trillion in U.S. debt coming due and needing buyers.
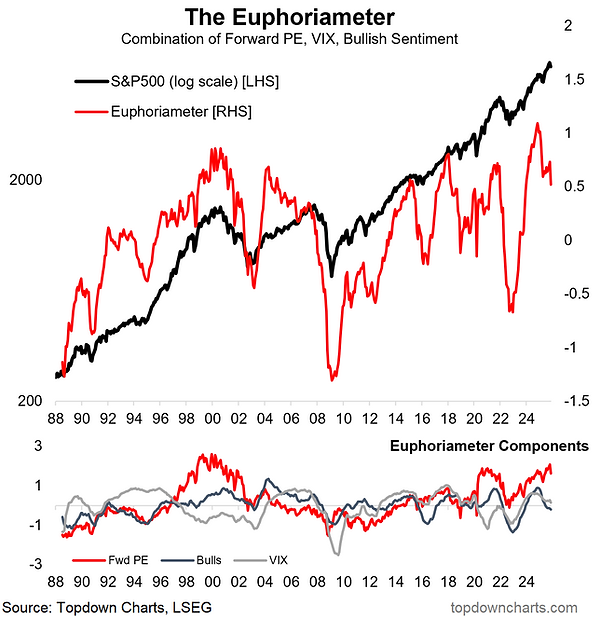
The Euphoriameter has backed off slightly as tech stages a correction or PIT (pullback in time). Again, consumers are stressed out. We are supposed to see CPI data this week, but who knows if any data can be trusted at this juncture? Inlfation remains sticky and consumers are sitting on a massive pile of $1.23 trillion in credit card debt. That is $3500 per citizen.
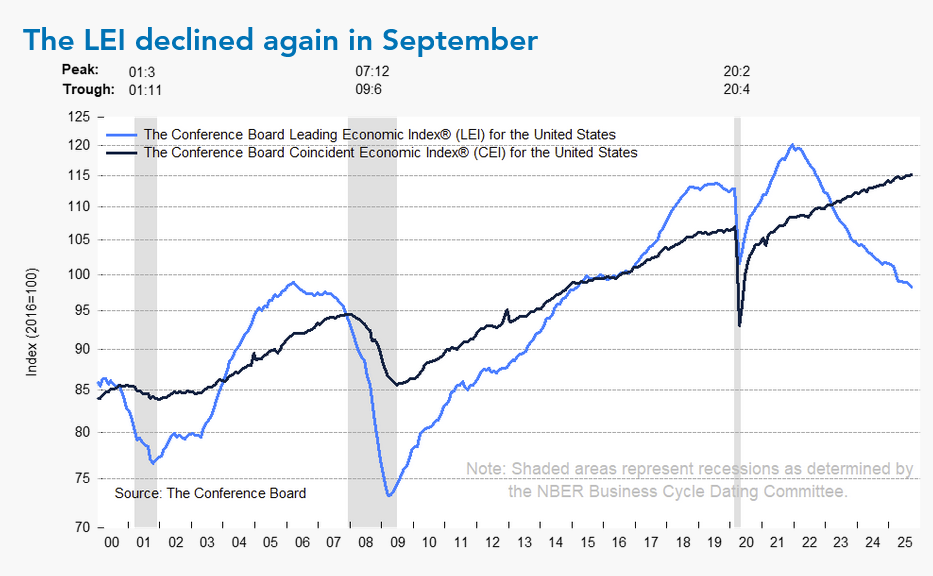 The delayed LEI readings show an economy that is already in recession.
“I believe that we are looking at the bottom of the 9th inning now for stocks and that the end of this move will come in this long window we are in…most likely before or by the first month or two of 2026. Certainly, by the 1st quarter. The market has now issued a number of Hindenburg Omens, and a Nasdaq Titanic Syndrome which can be a preliminary red-flag that prices are within a couple months of a major turning point. which fits with the current timing data.”
SPX Monthly H-L-C
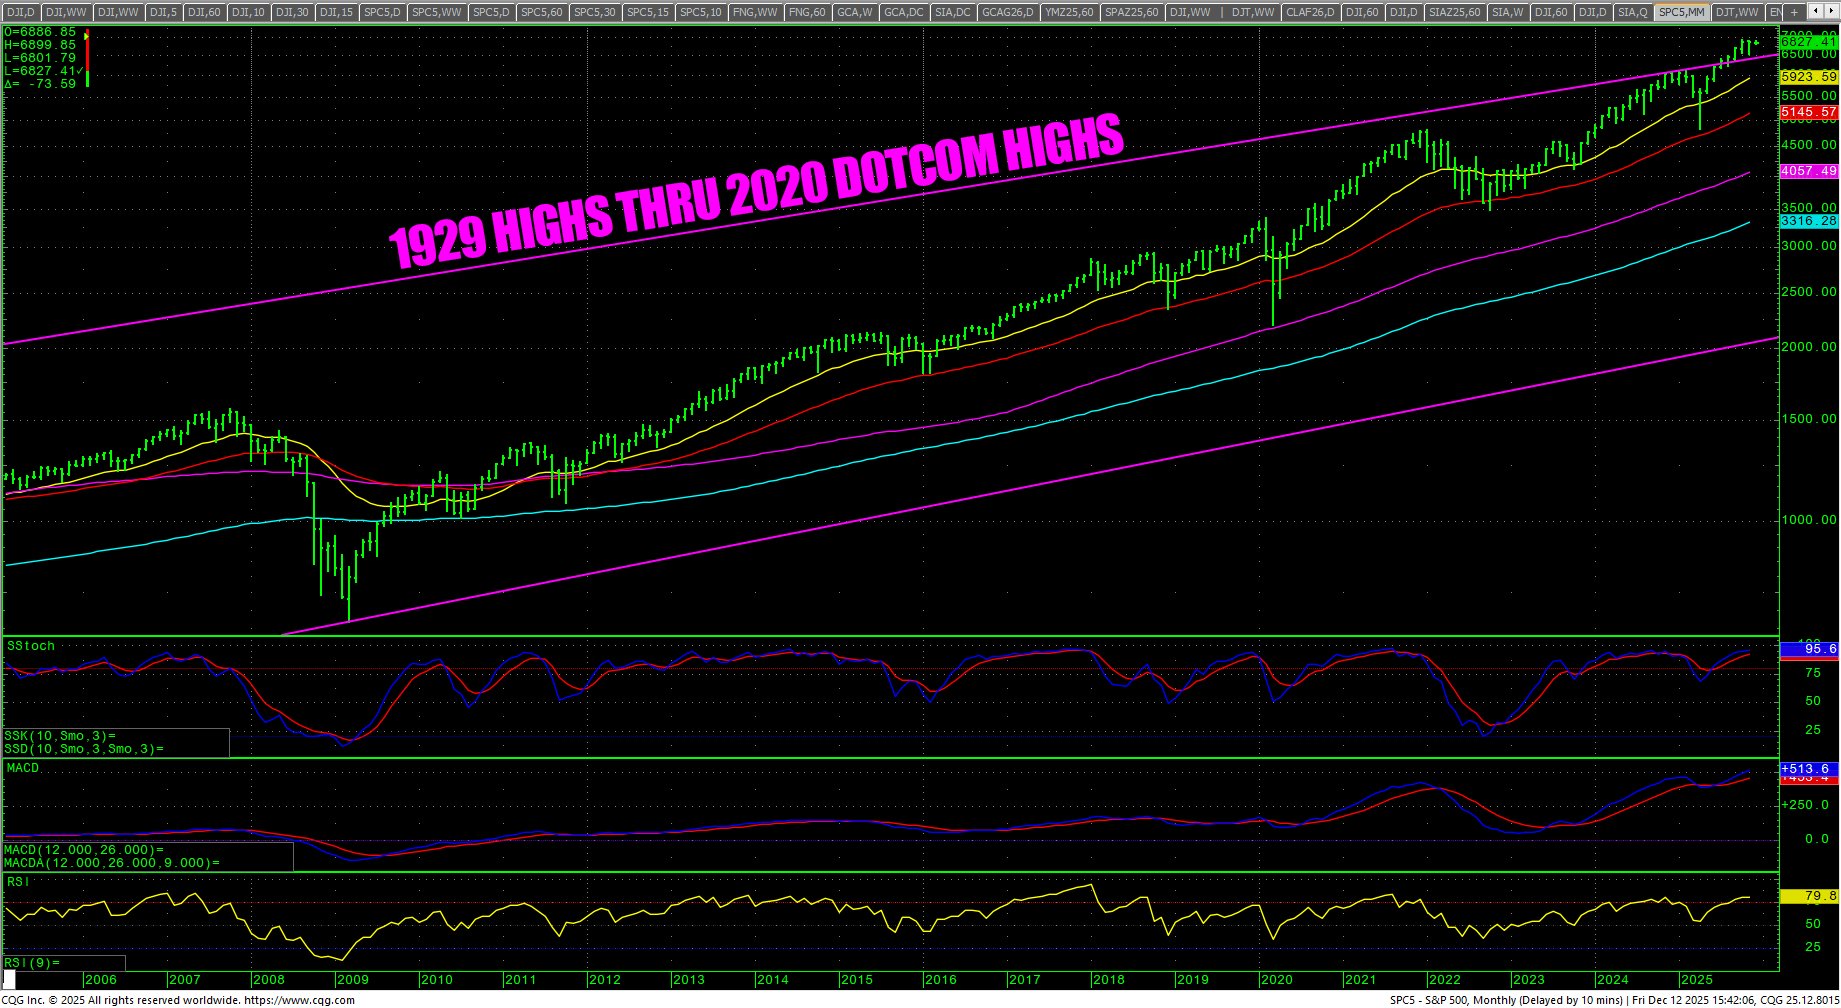 The SPX monthly still offers the super bull scenario as prices trade above the overhead trendline that connects the 1929 tops through the 2000 Dot-Com tops. If prices start to trade back under the trendline, it could signal selling in equities. It still holds potential for a continued blowoff move. Right now, the trendline comes in at: 6421.75.
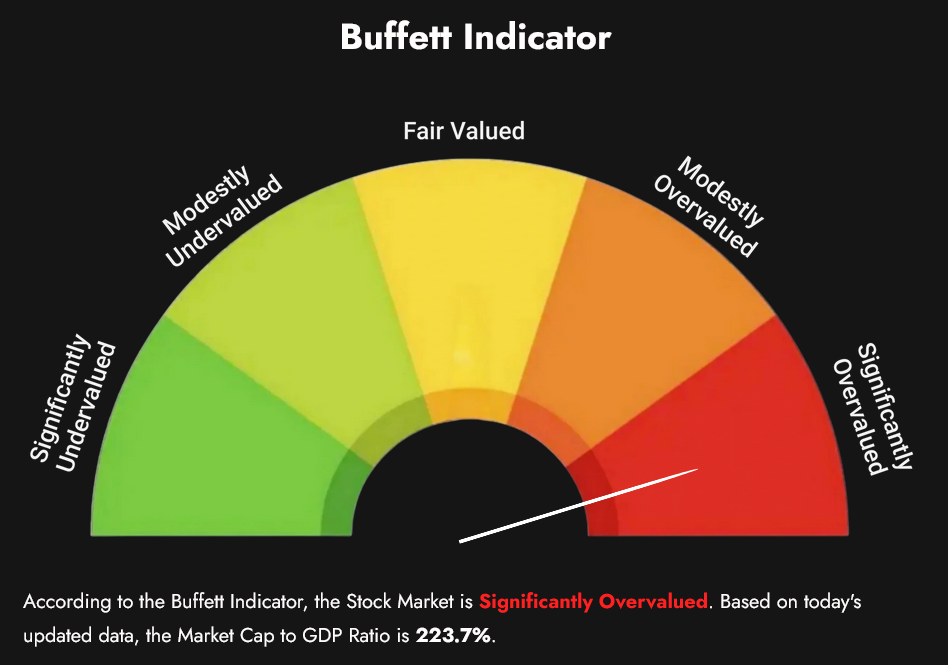 The Buffet Indicator sits near ATH, now reading at 223.7%.
Dow Theory
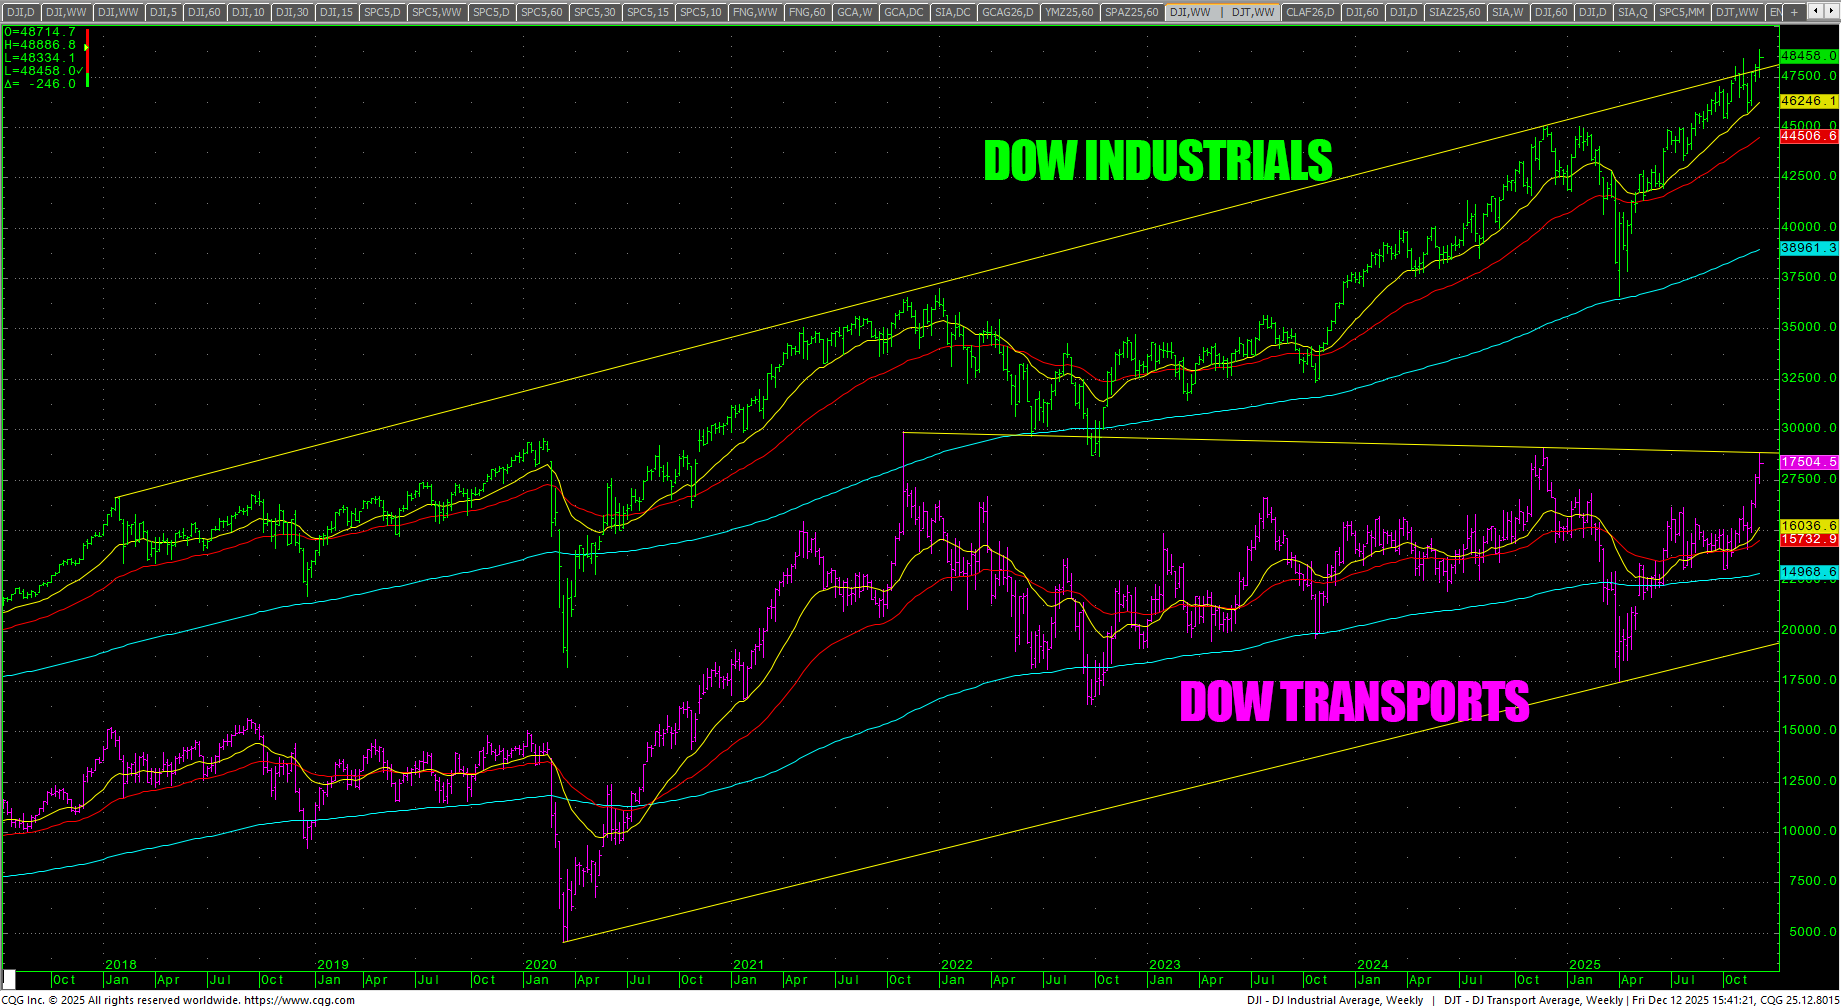 Dow Theory still shows a bearish divergence. As noted above, the Transports have rallied sharply and last week’s highs tagged the trendline off the 2021 highs.
S&P 500 Stocks Above the 200-day MA
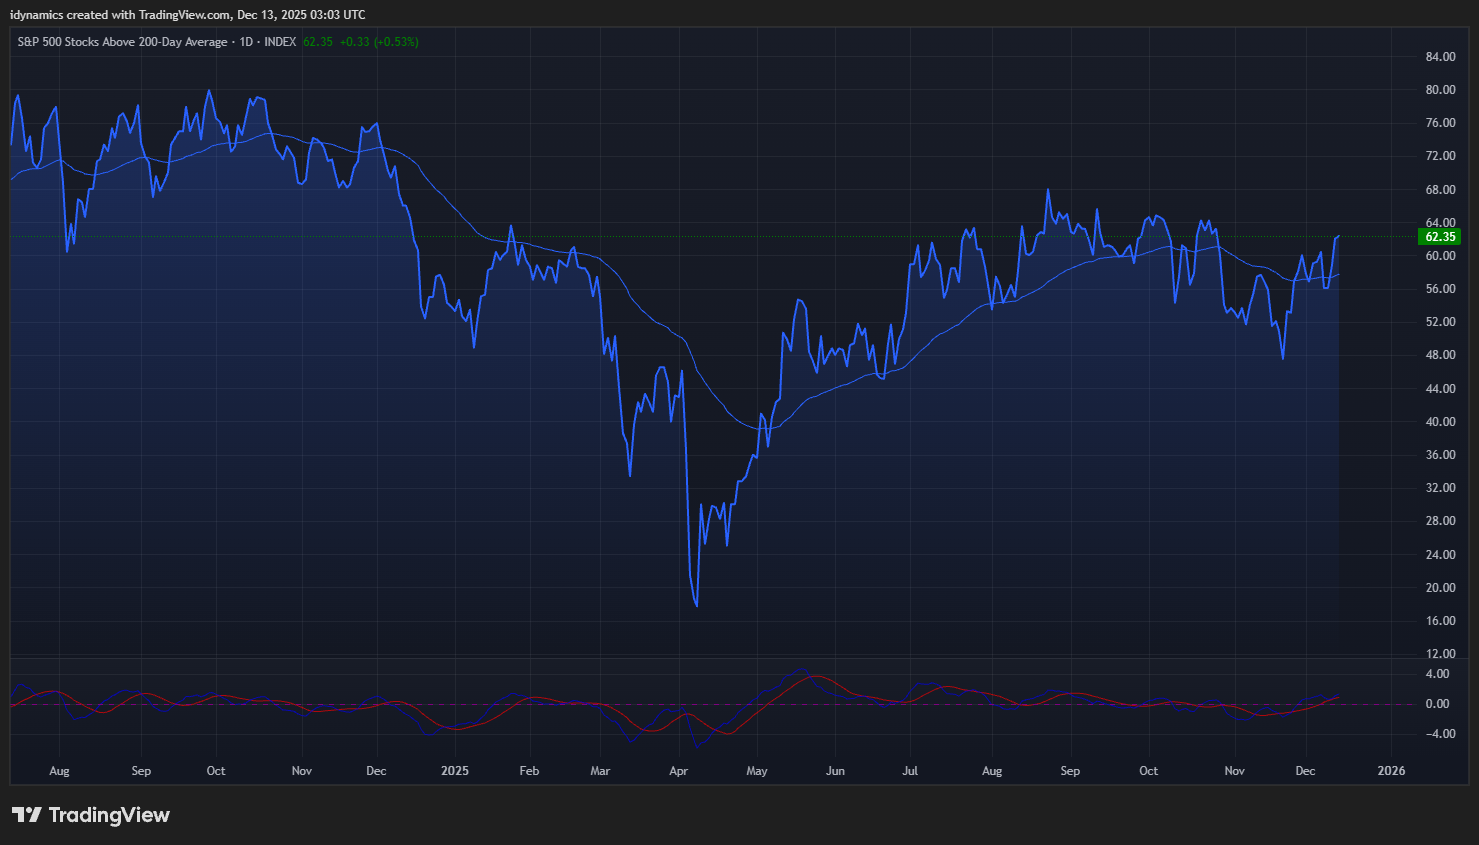 Breadth is still best defined as “blah.” The share of SPX stocks above the 200-day MA rose to 62.35%. The high in September 2024 was 72.92% and 82.70% in March of 2024. Divergence remains the name of the game. 10 stocks make up OVER 40% of the SPX.
MAGS (Magnificent 7) Weekly Candles
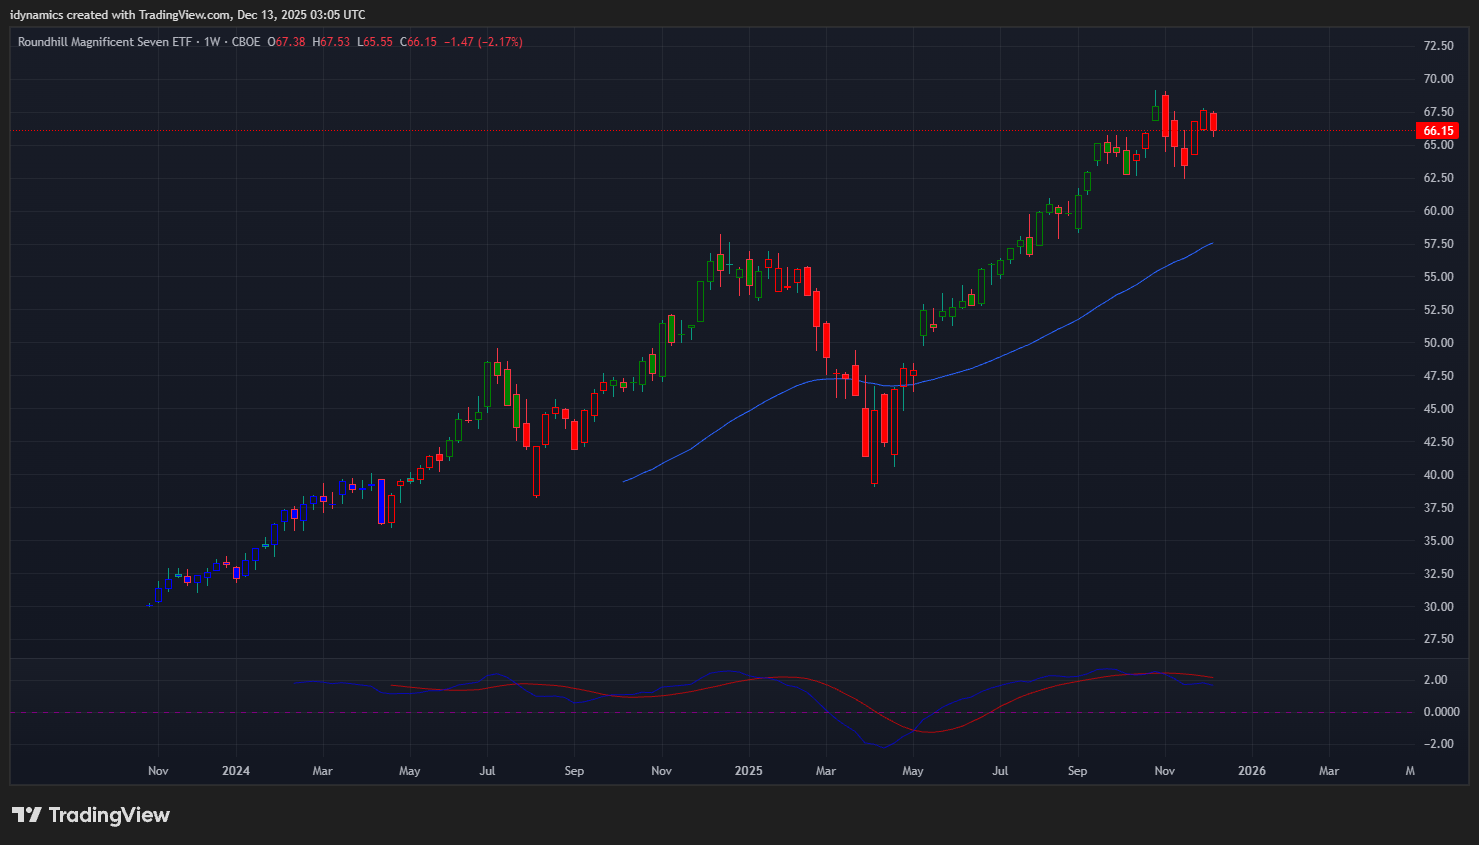 The MAGS sold off all week and closed on the low end of the range, down -2.17%. Prices closed just under resistance at 66.55/67.00. Further rallies through 67.00 can carry toward the 73/74 level. Support is 61.99 and 57.60. Under 57.60 can test 54.05 with critical support at 50.49/50.00.
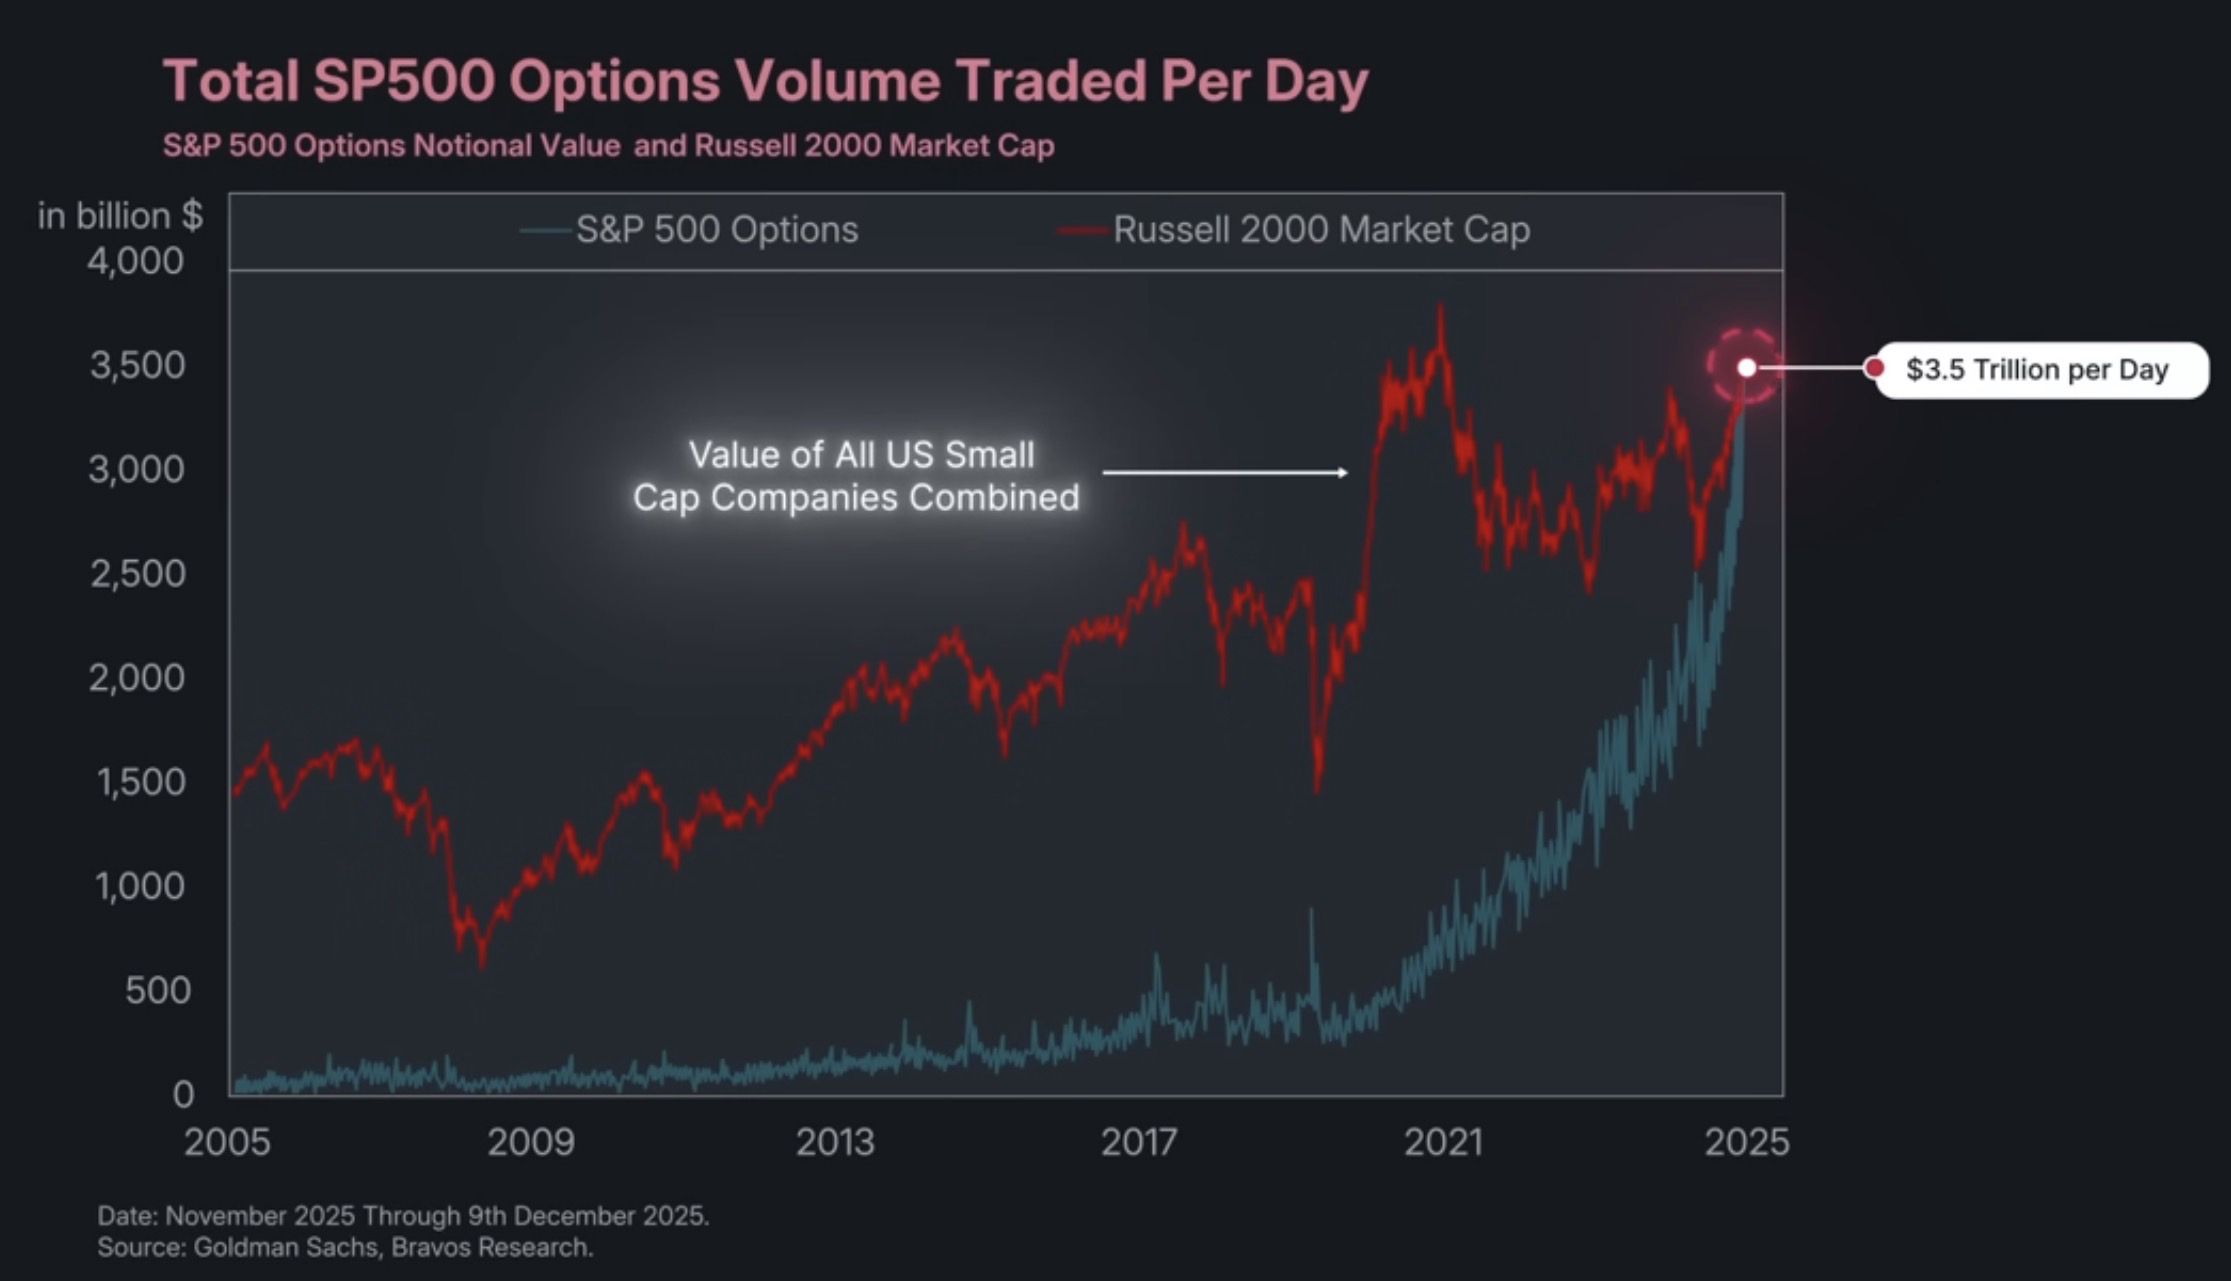 As the chart above from Bravos Research shows, options volume has reached $3.5 trillion per day…which now equates to the total value of all small cap stocks COMBINED. CFTC S&P 500 speculative net positions ended at -147.4K. The CoT, commitment of traders show commercials selling slightly while speculators continue to add to positions.
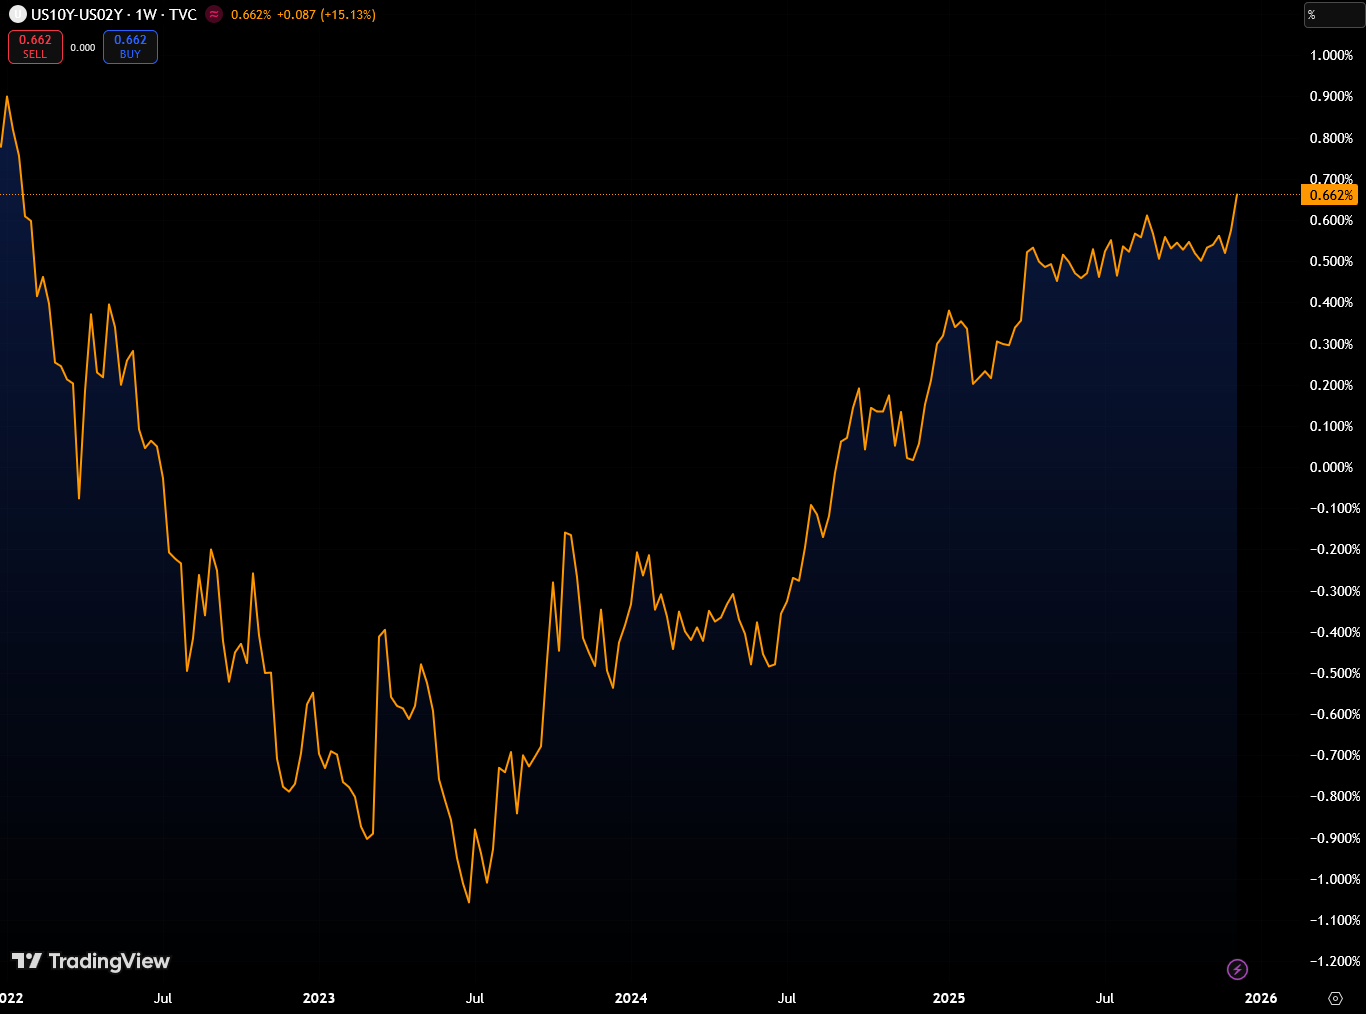
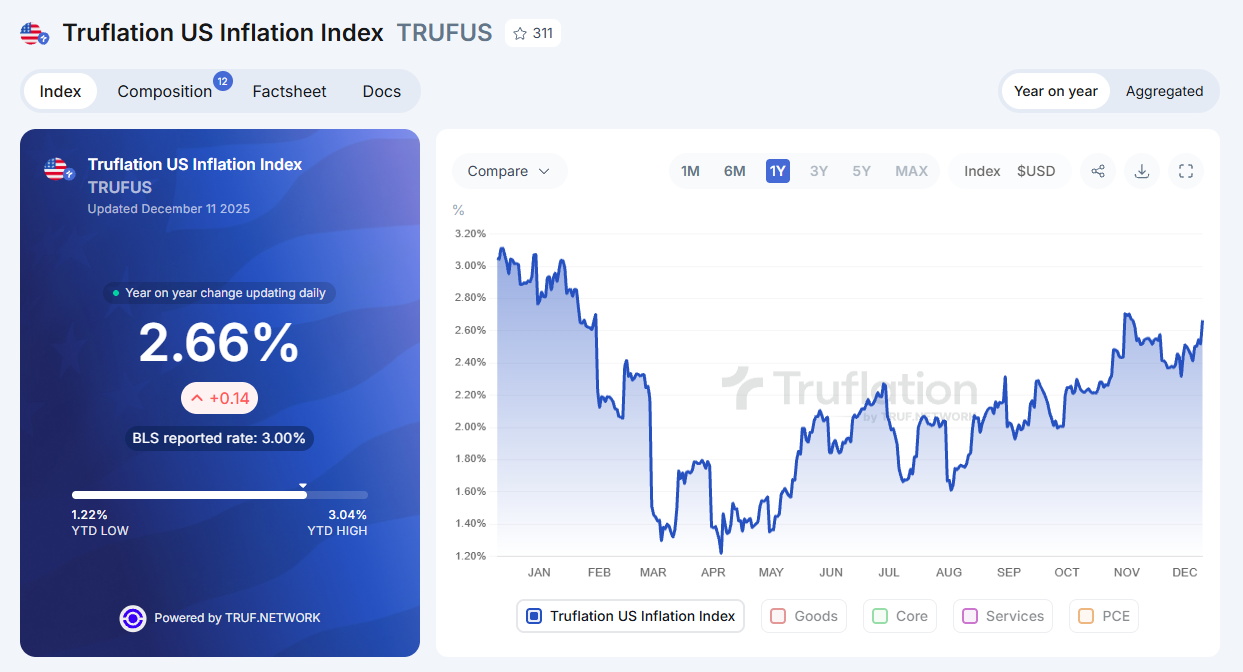
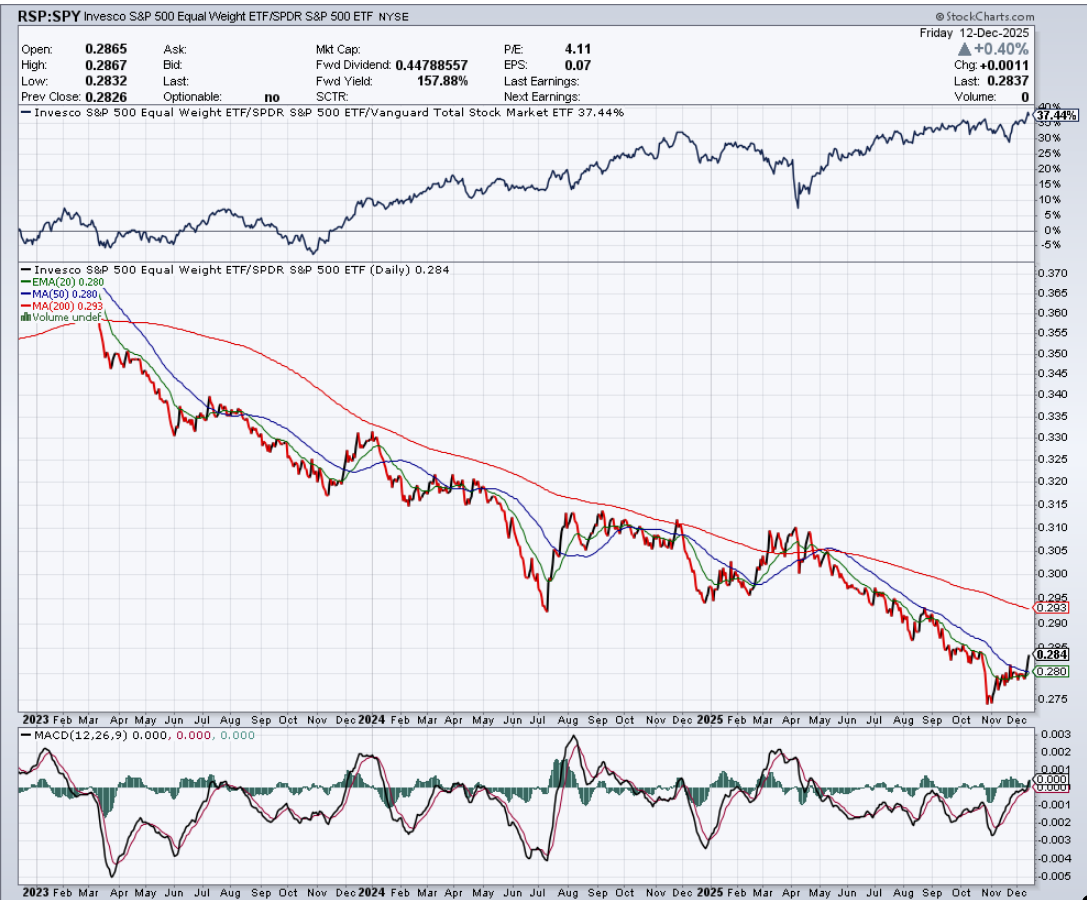
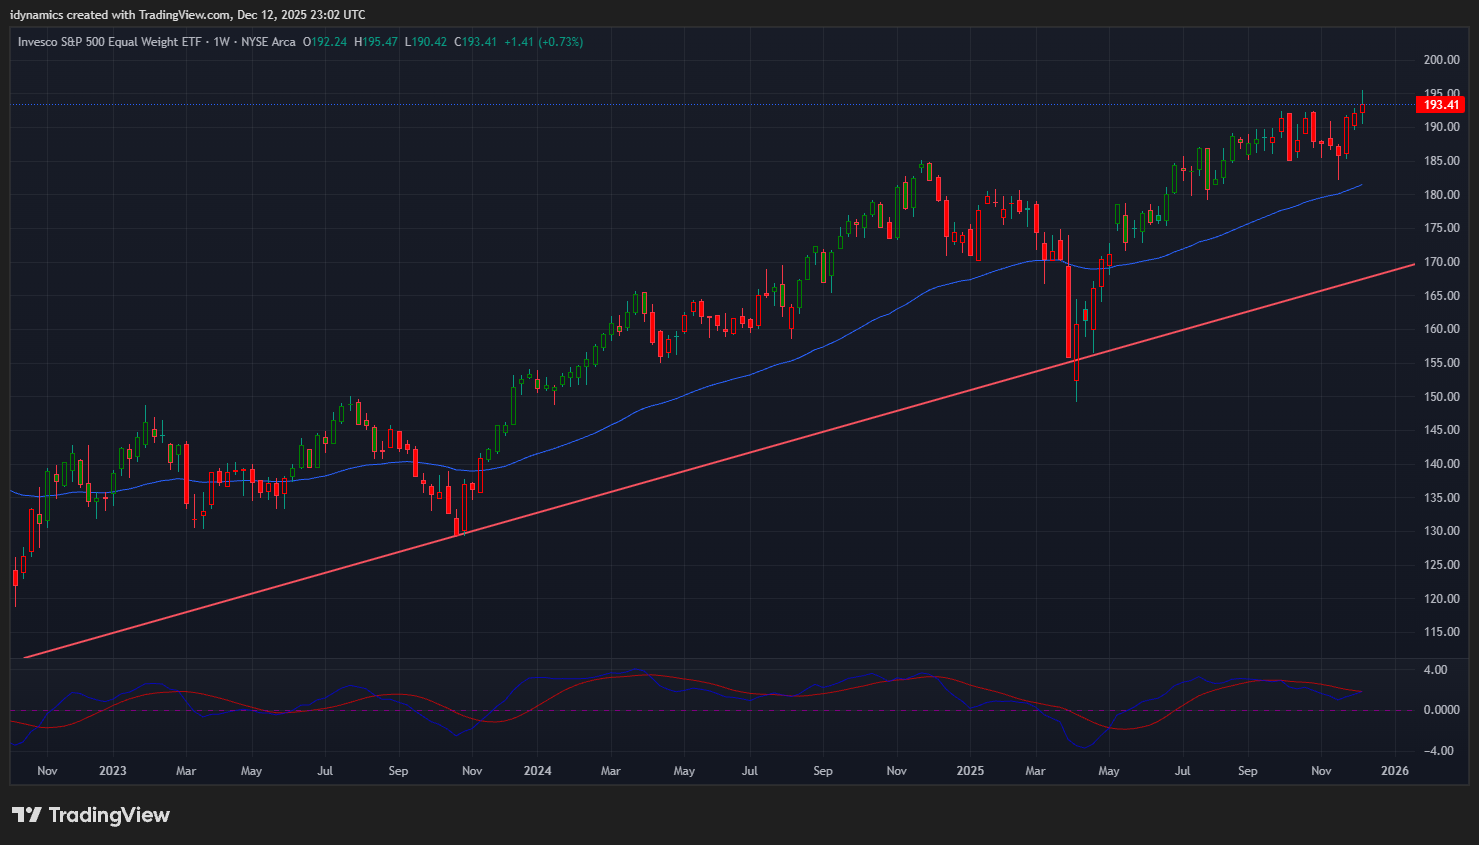
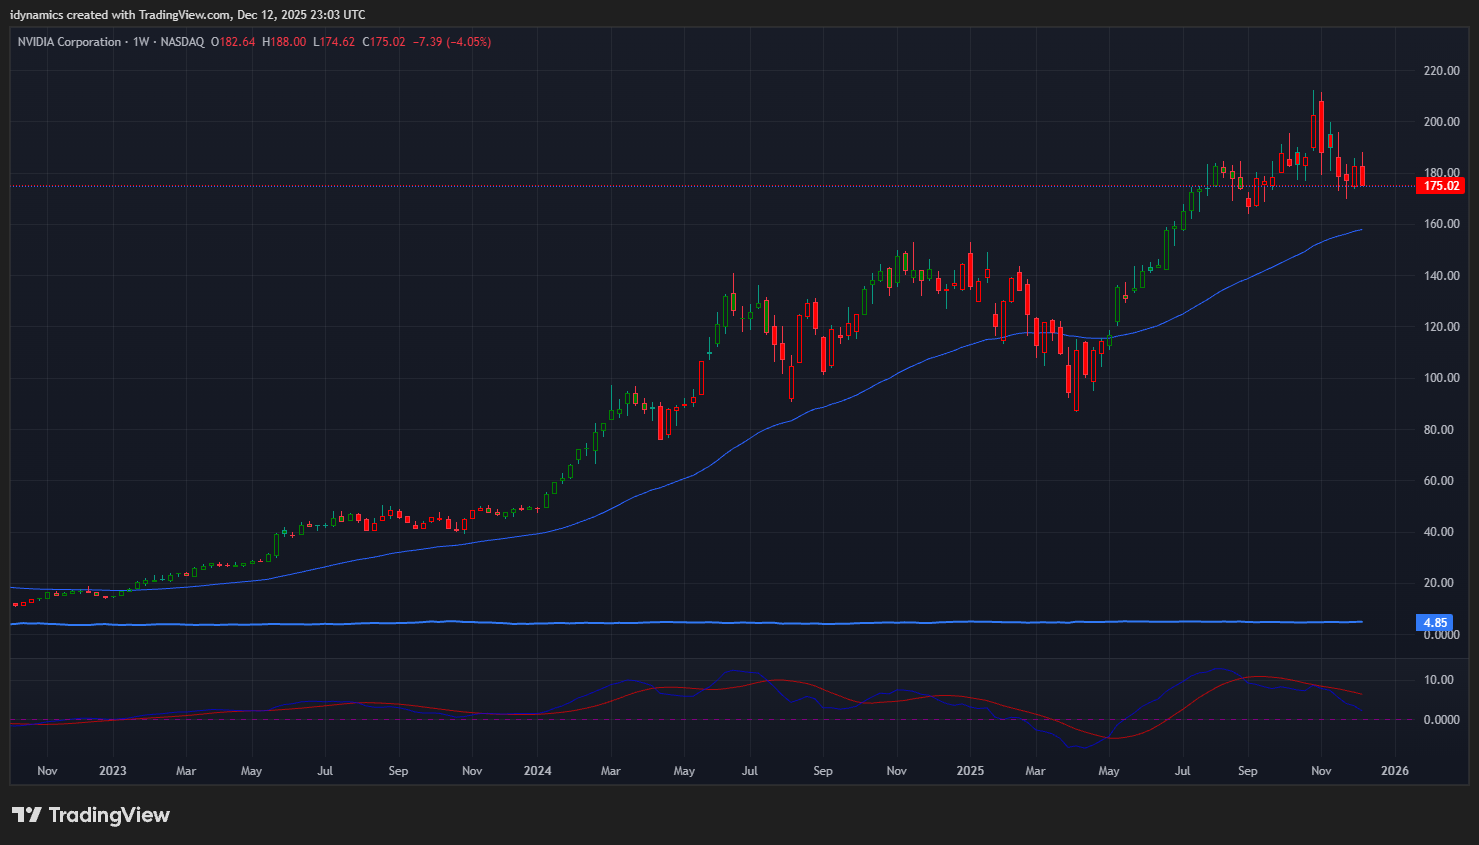
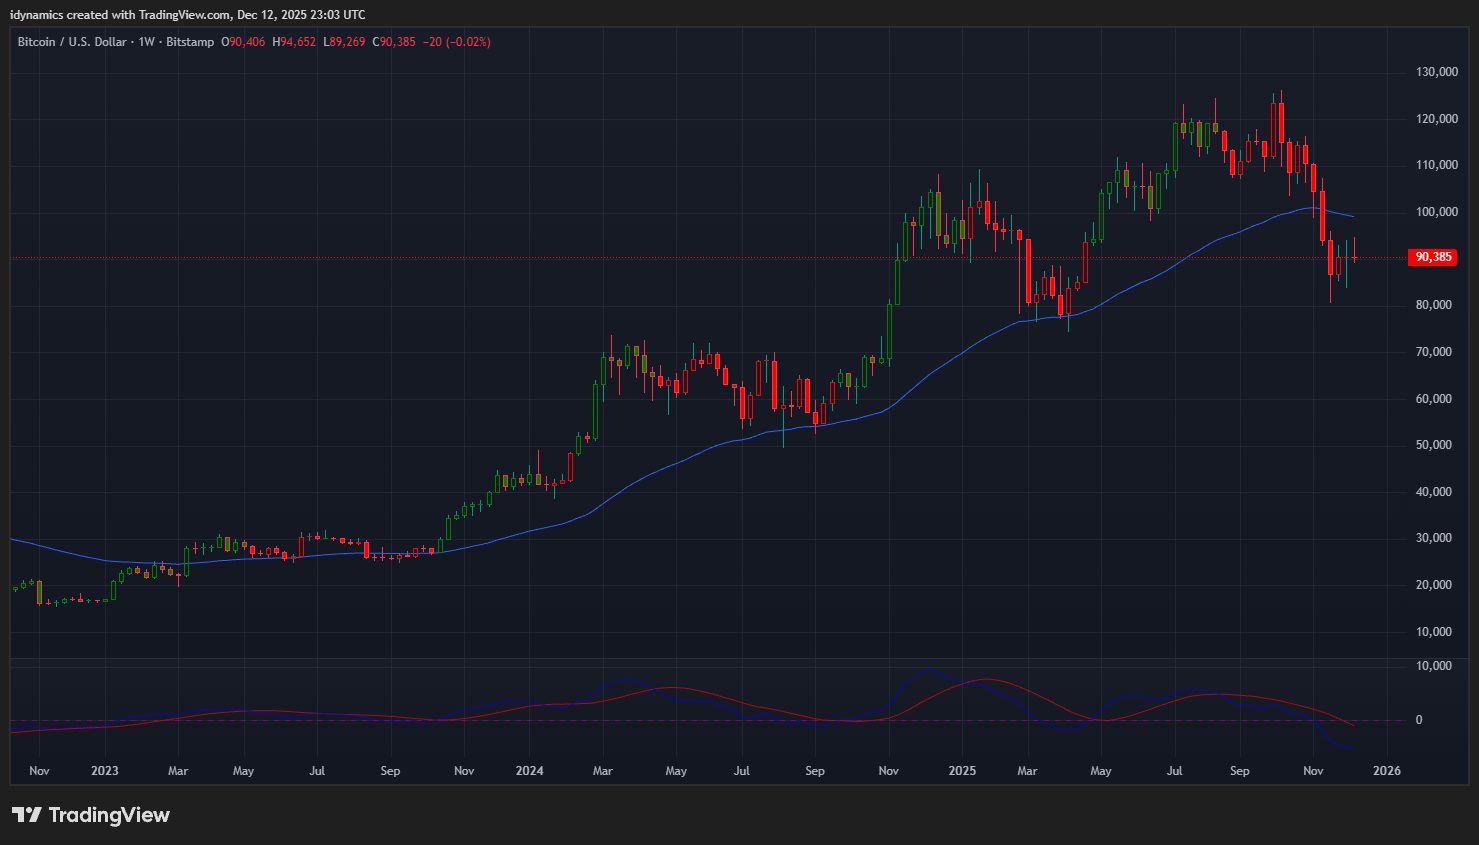
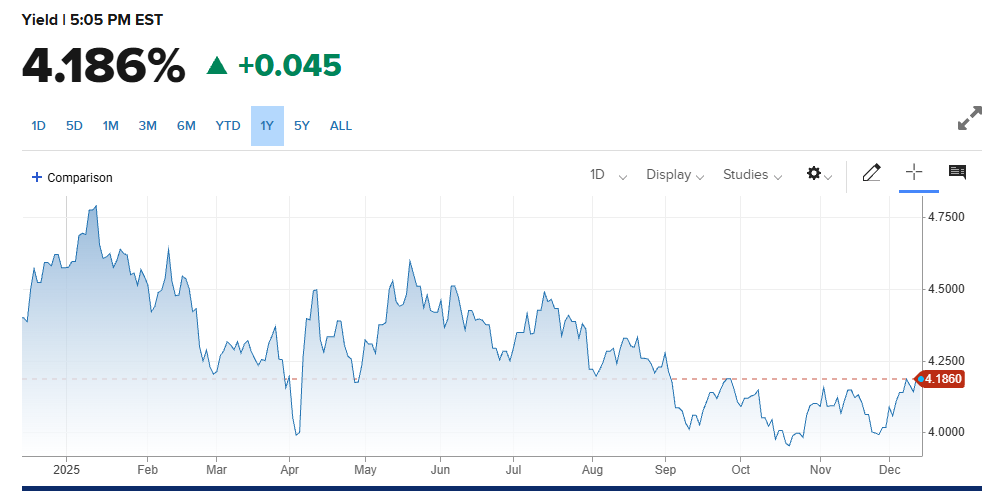
The RSP:SPY saw an uptick last week as trade rotated out of big caps and into small caps. The weekly is down and oversold and the MACD is trying to turn up. Resistance remains pivotal at .294. The IWM moved to an ATH and set a new weekly closing high, ending in the lower 50% of the range, up +1.23%. The RSP rallied to ATH and closed in the upper half of the range, up +0.73%. NVDA staged a downside reversal and closed on the lows at a new weekly closing low for this decline, down -4.05%. Bitcoin closed flat, down -0.05% on the bottom of the weekly range. Support is 83.90 and 80.50 and further declines can test 70.85 with critical support at 57.80/57.00. Resistance is 91.30 and 98.10. Above 98.10 can test 103.40 with counts to 108.80/109.00. McClellan Oscillators support the rally in the Dow chart. The Yield Curve expanded to a new high for this move closing at +0.662%. The 10YR yield increased to 4.186%. Truflation jumped to 2.66%.
10YR-2YR Yield Curve Weekly

 VIX Weekly Candles
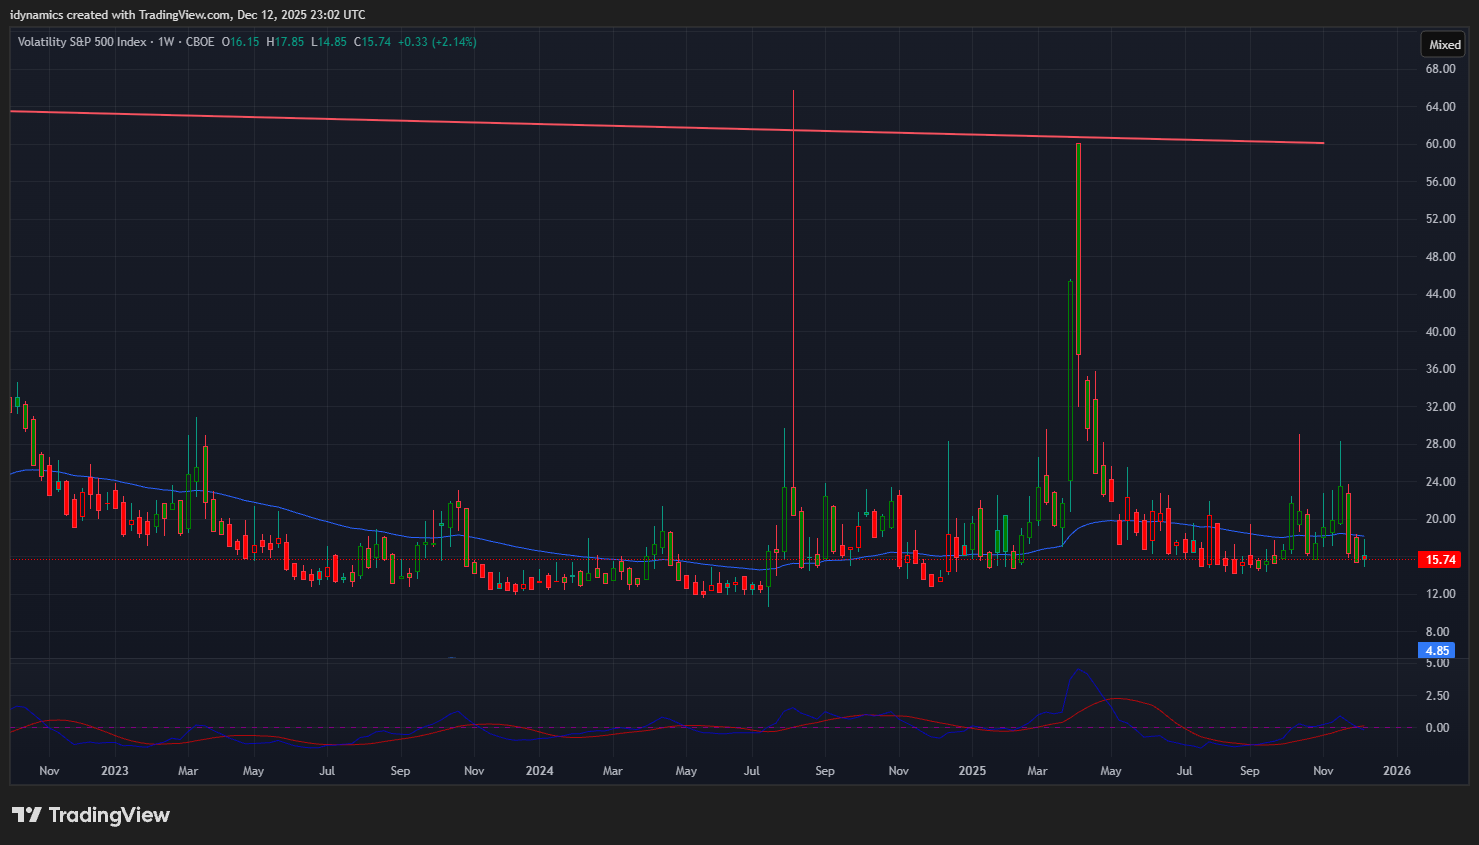
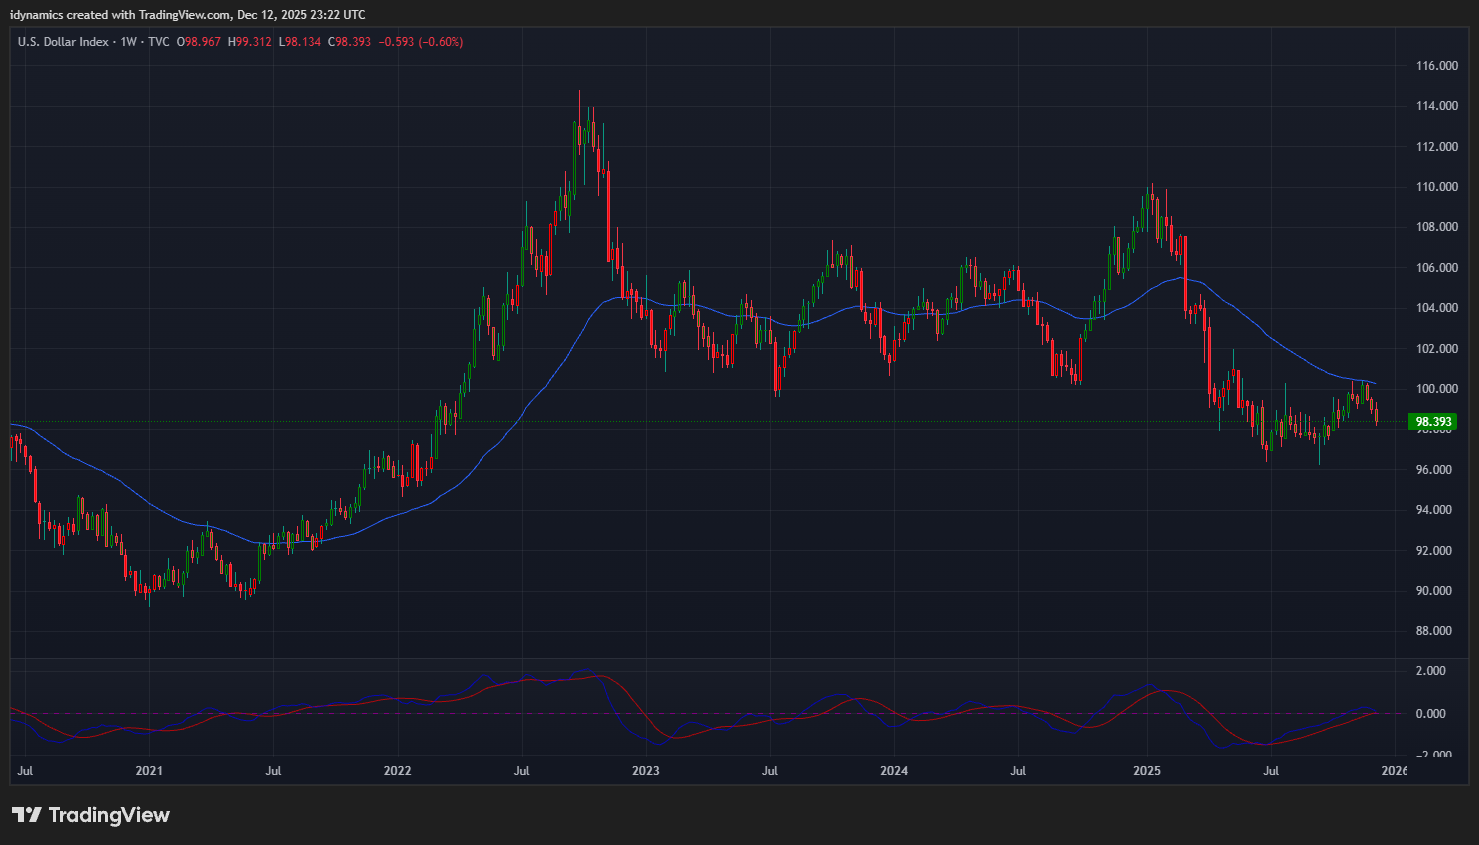
The VIX ended the week up +2.14% after trading to the lowest level since September 2025. The US Dollar sold off most of the week and closed on the lows, down -0.60%.
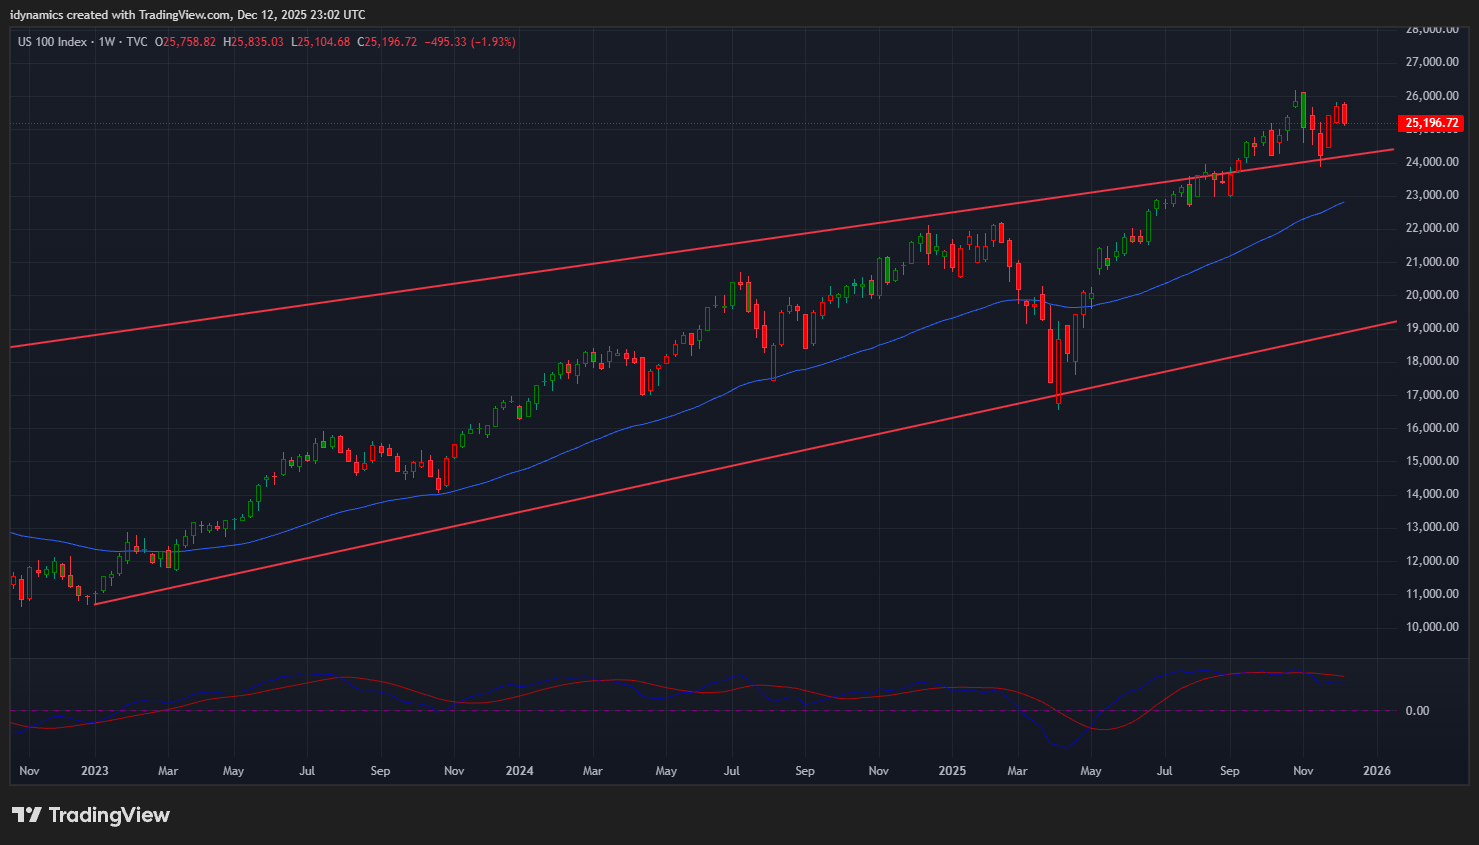
 Nasdaq 100 Weekly Candles
Daily Breadth 
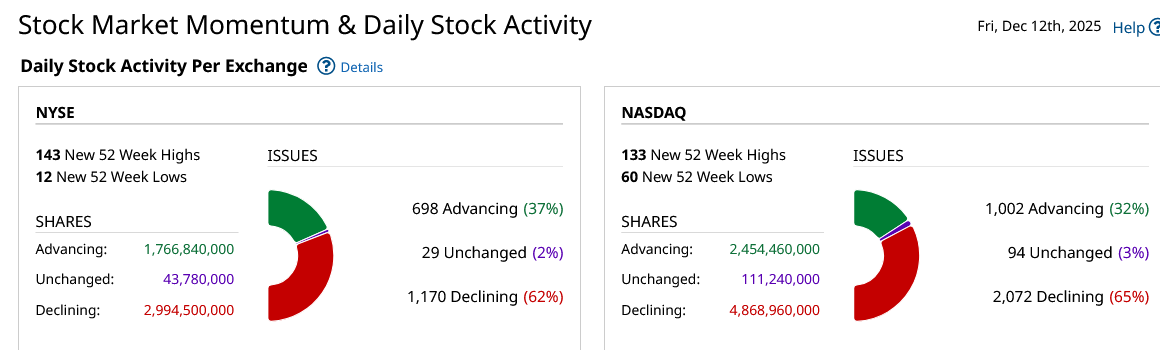
Breadth was mixed on Friday and rose on the week with the strength in the small caps, and sentiment still reads fear.
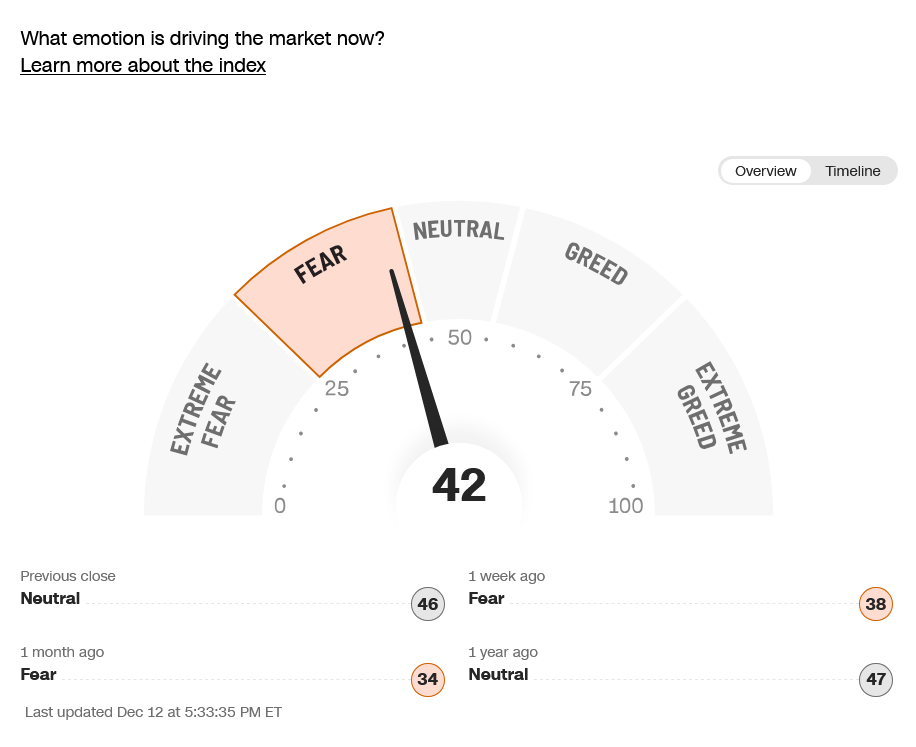
CNN Fear & Greed Index
 AAII Investor Sentiment Survey
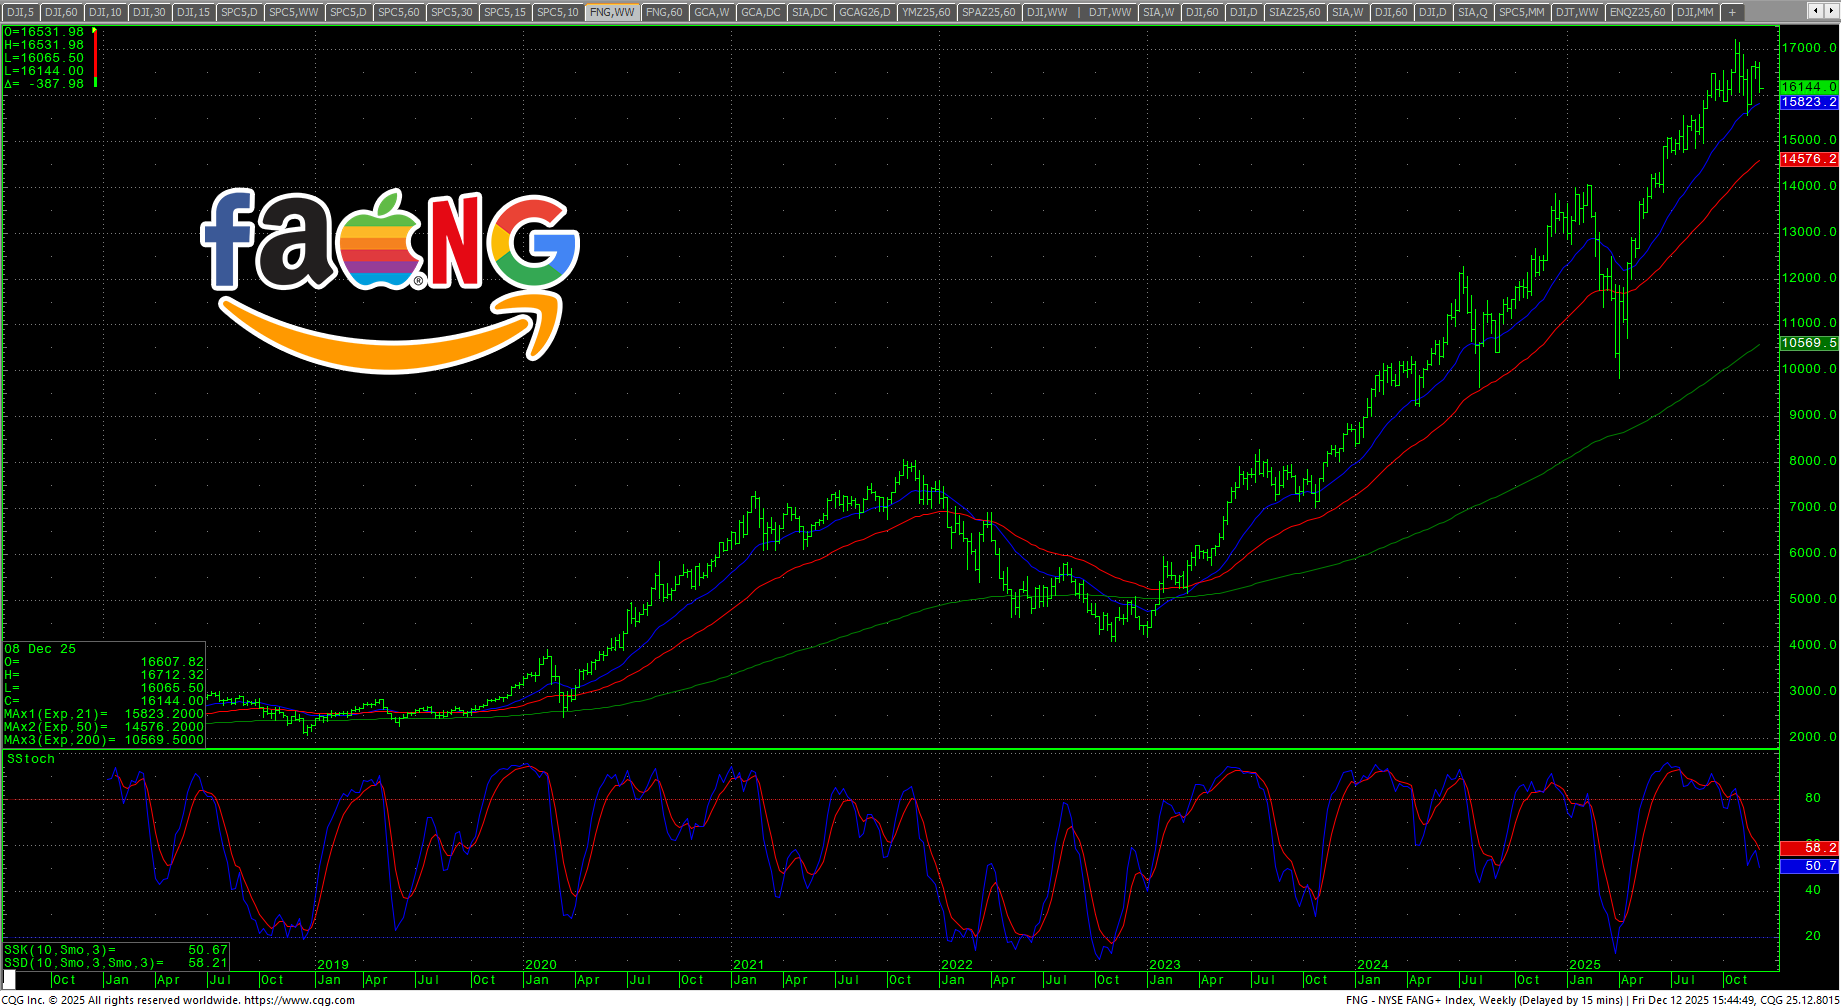
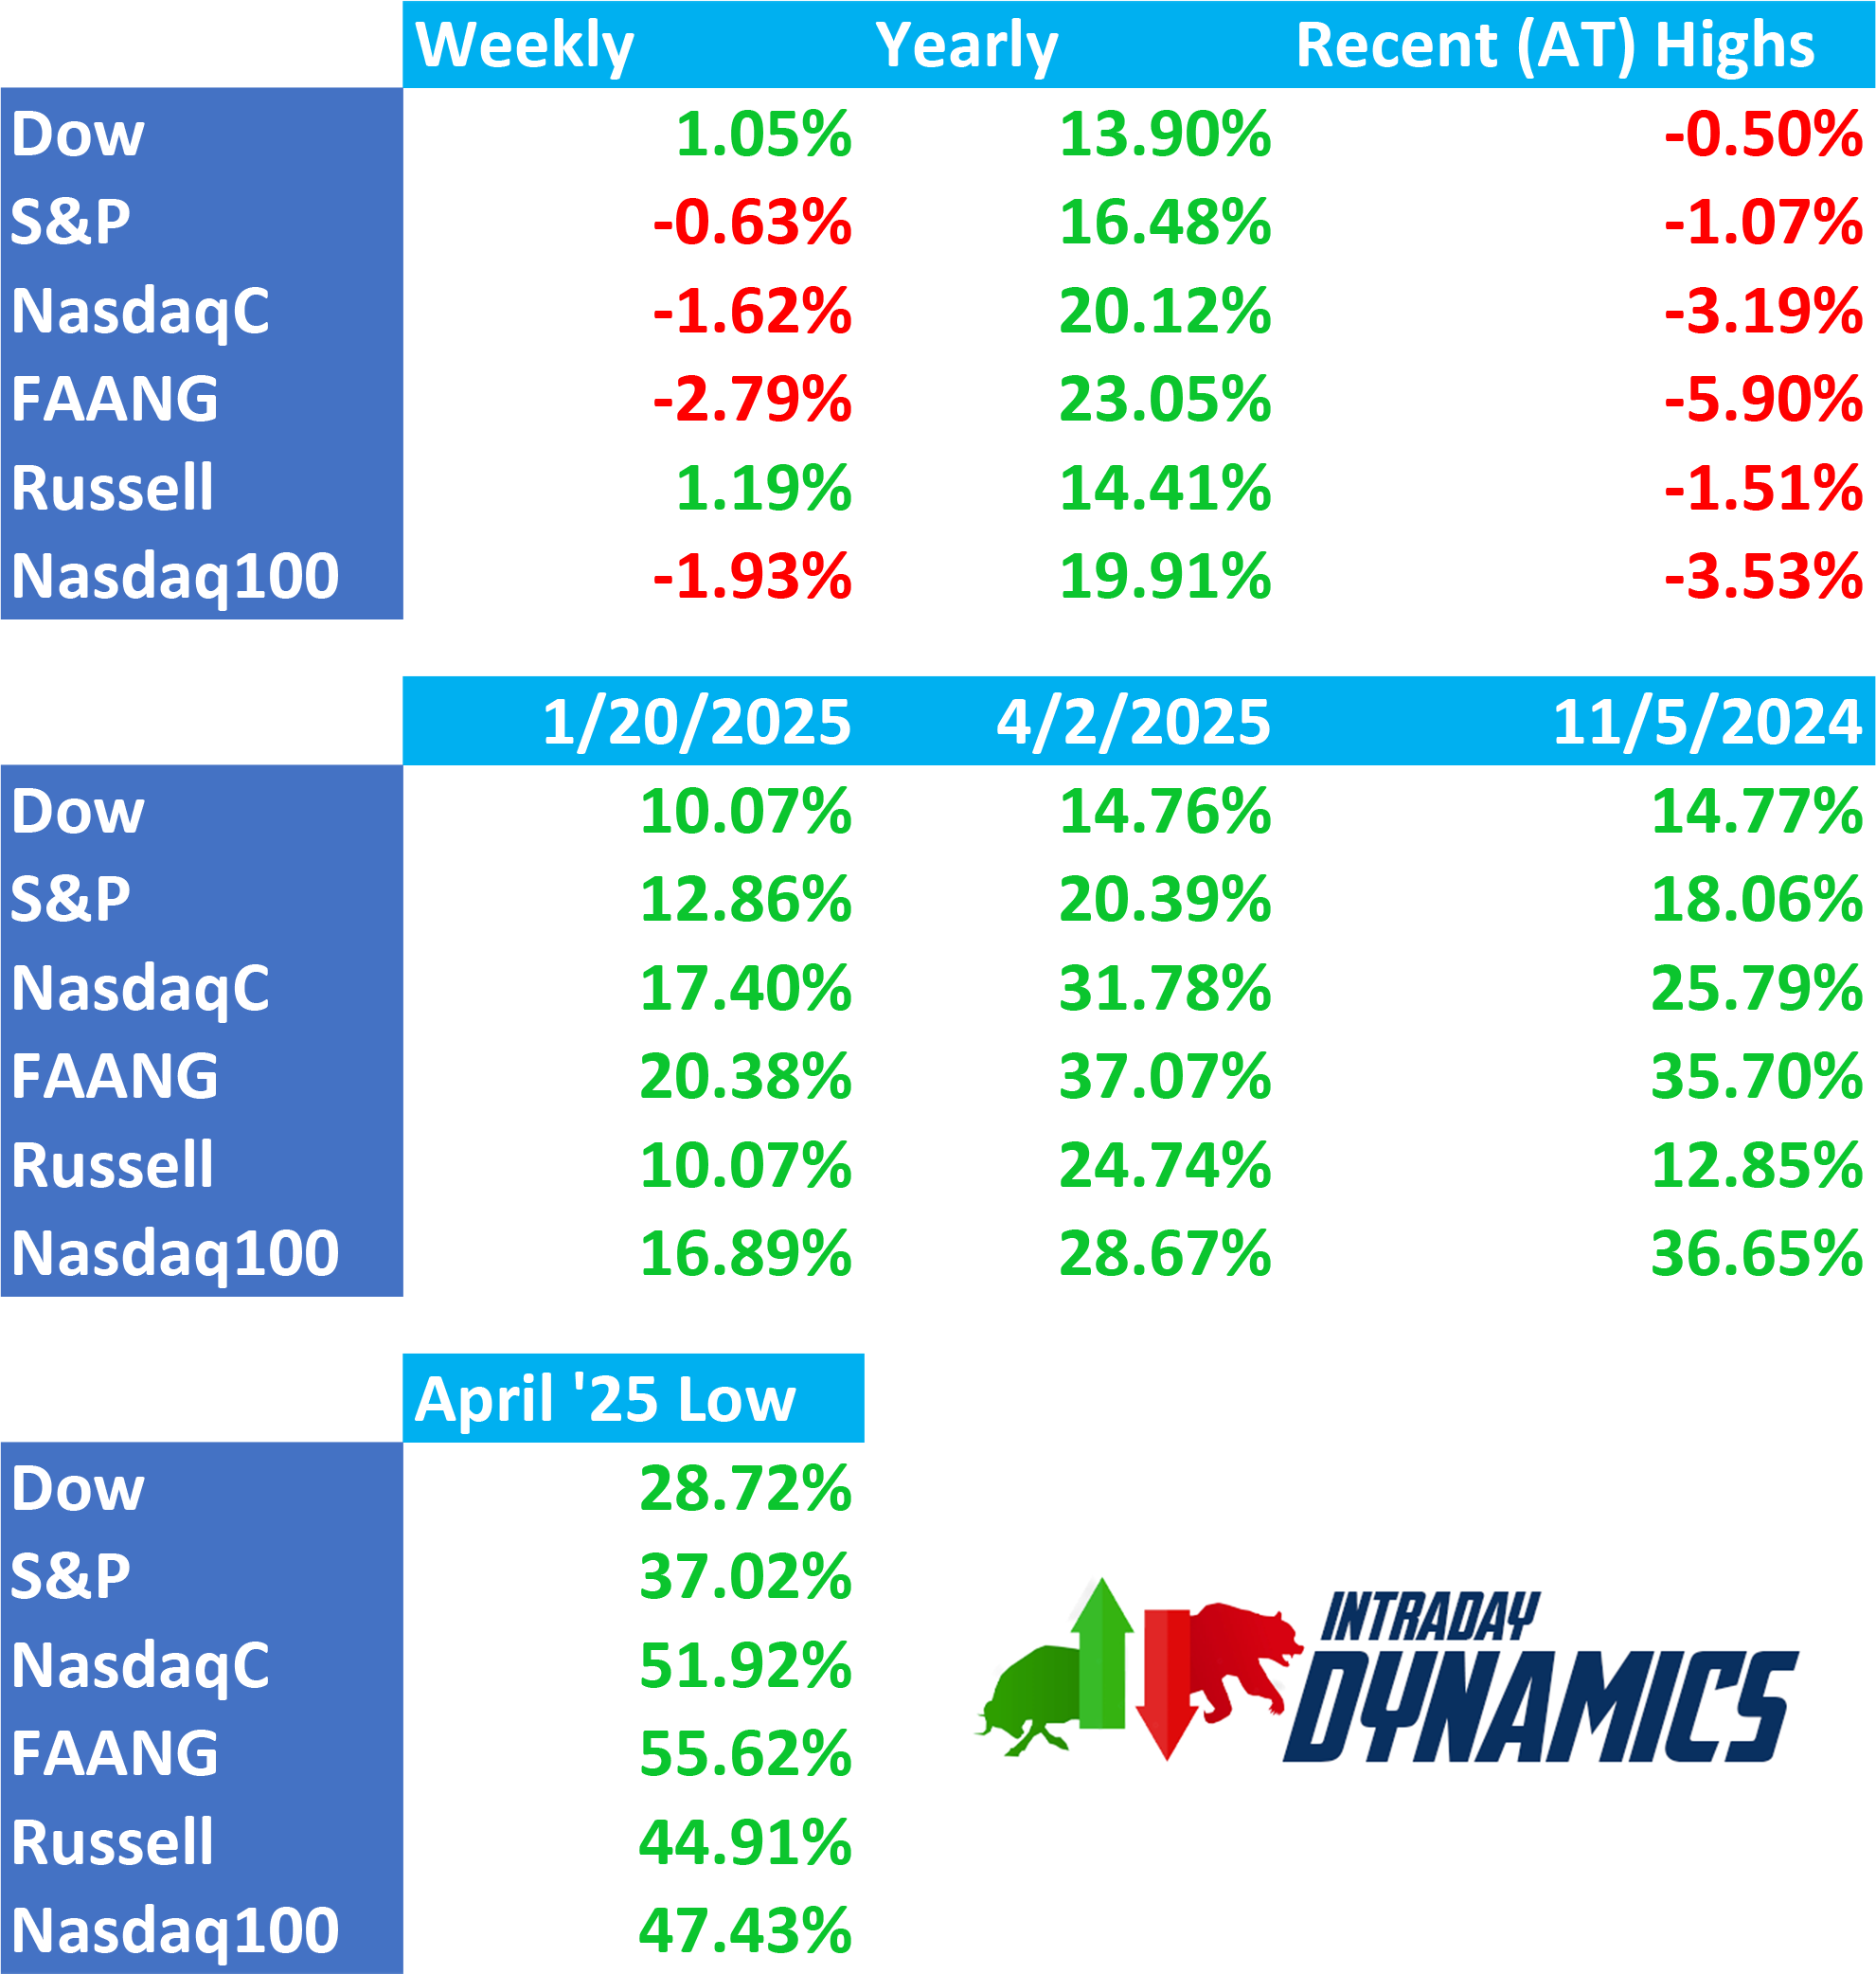
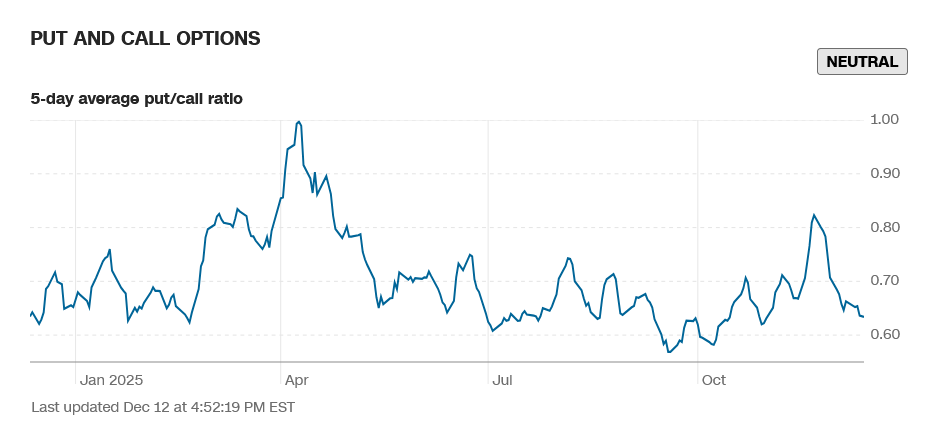
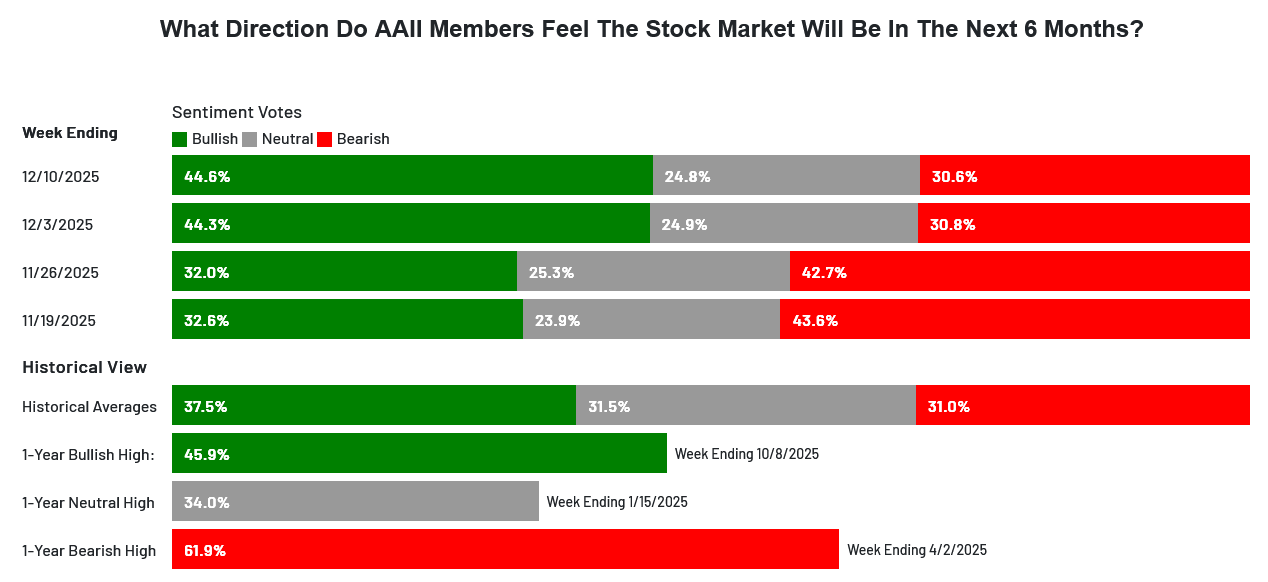 The CNN Fear and Greed Index is 42 and reads fear. Breadth rose on the week with the strength in the small caps, and sentiment reads fear. Latest AAII Sentiment Survey: Bullish Sentiment Increases Modestly. The Dow A/D ended at 7009 and sits at record highs. The VIX ended the week up +2.14% after trading to the lowest level since September 2025. The Put/Call ended at 0.63 and reads neutral. The 52-week, A/D moved up to +1.38% and reads fear. The Dow closed the week up +1.05%, closing in the top of the range at a new weekly closing high. The S&P was down -0.63% closing in the bottom of a reversal range after setting a record high daily close on Thursday. The Nasdaq Composite was down -1.62% and the Nasdaq 100 was down -1.93%. The NYSE FANG closed down -2.79% near the bottom of the range. The Russell 2000 was up +1.19% in the middle of the range at a new weekly closing high. The 10-year notes closed lower in the middle of the range. The yield on the 10YR increased to 4.186%.
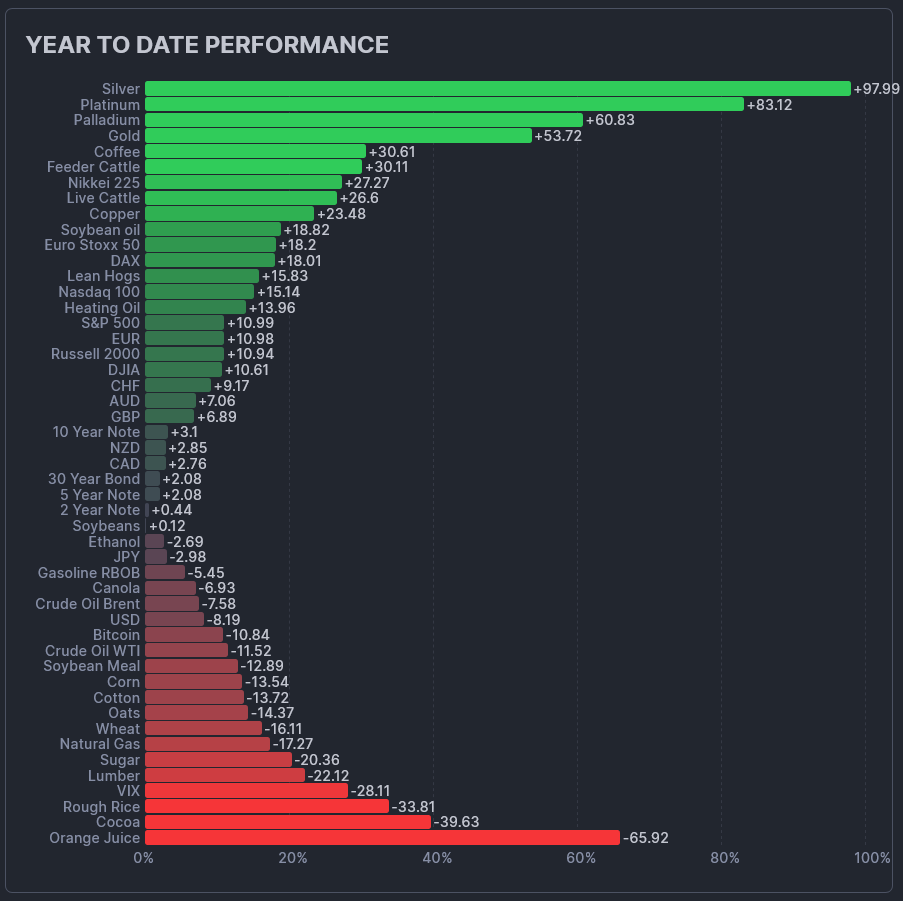
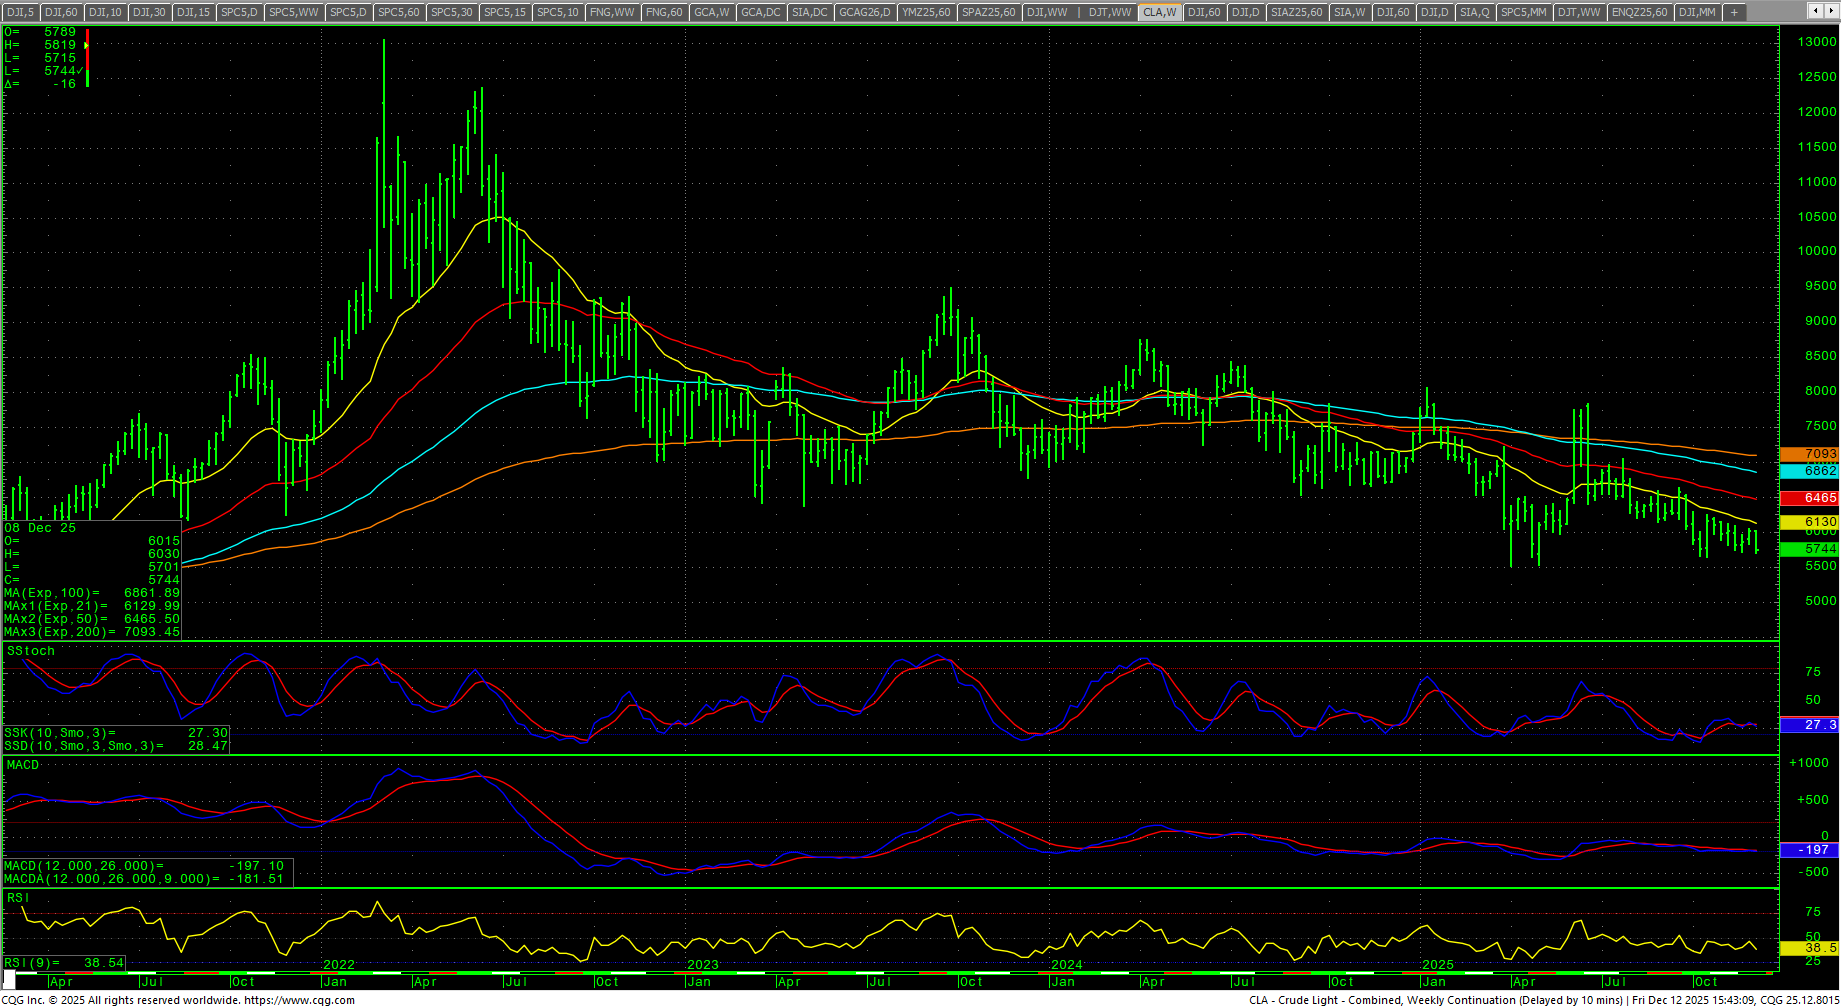
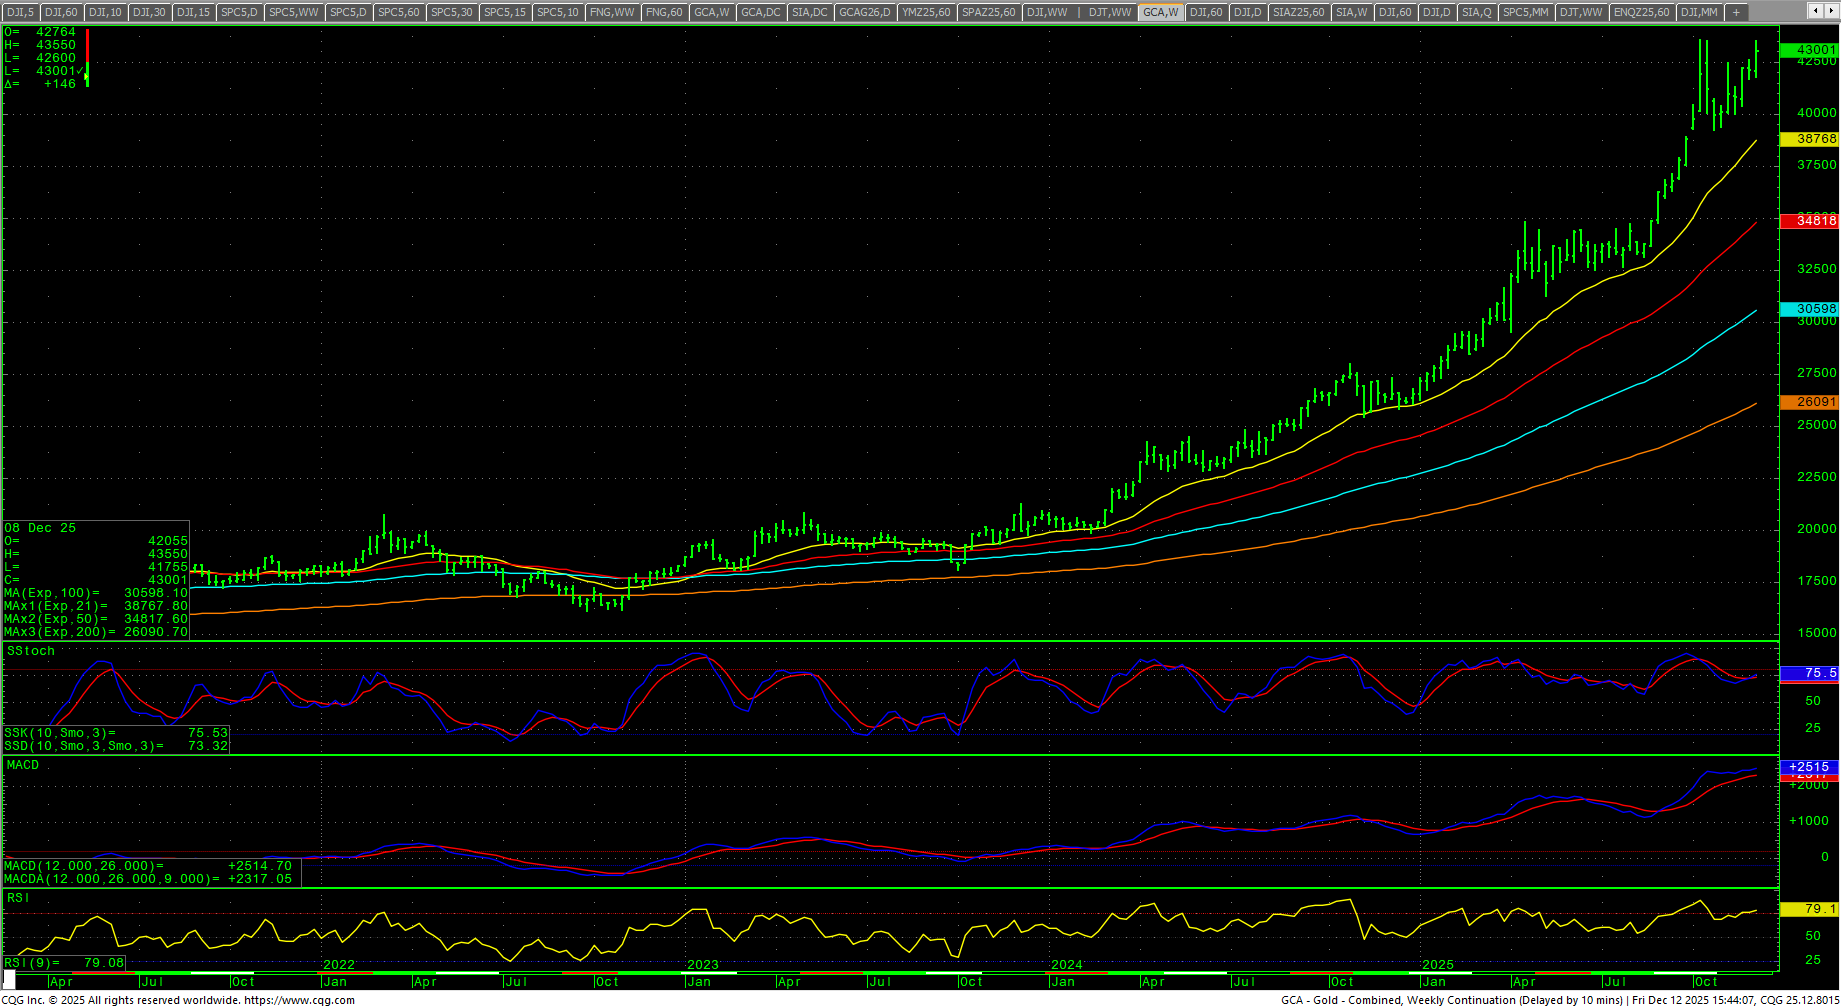
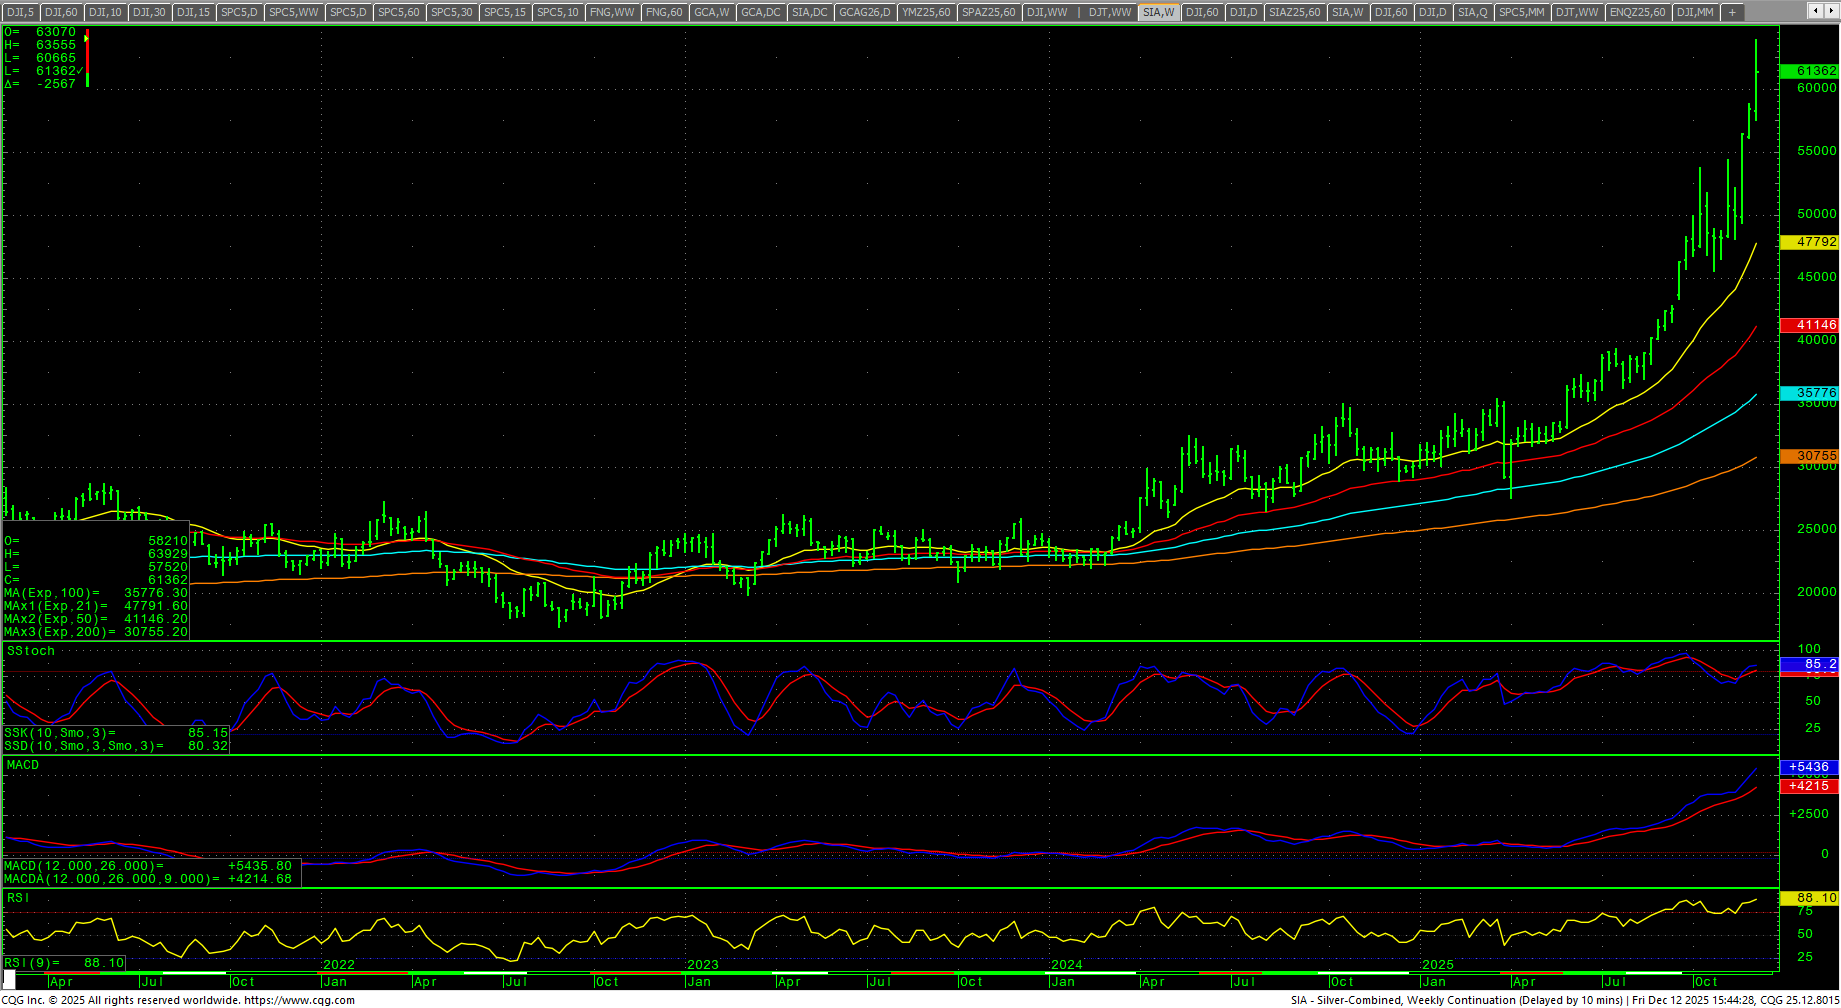
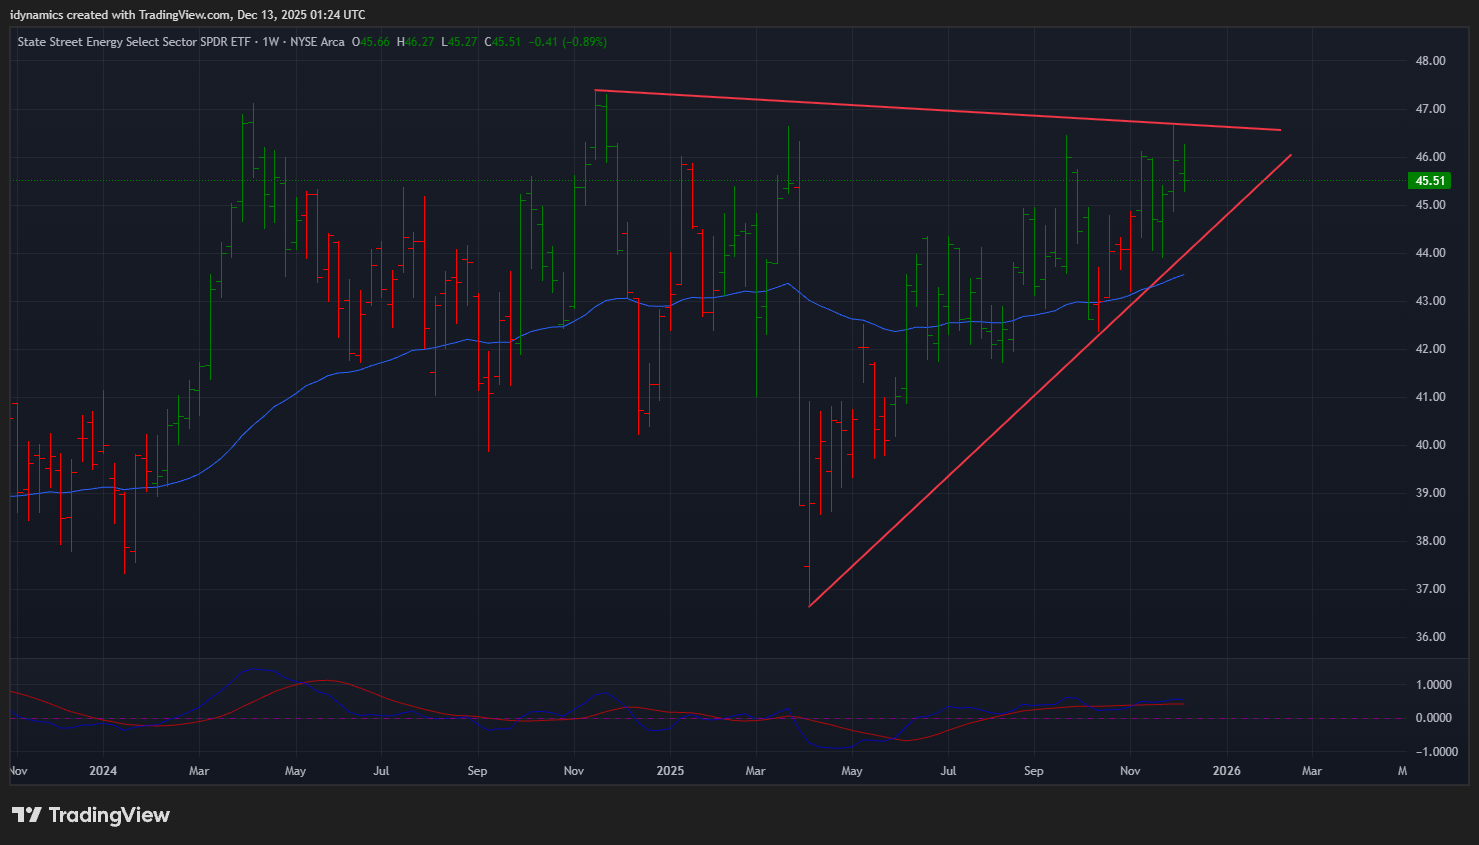 The CRB Index was down -0.96% as crude moved back under the $60 level. Crude Oil sold off and set a new weekly closing low for the decline with prices back under the critical $60 level. The XLE is resistance the overhead trendline of the massive pennant pattern on the weekly chart (above). Gold rallied and set a new ATH weekly close at the $4300 level. Silver rocketed higher on news that JP Morgan has exited their paper shorts and accumulated a record amount of bullion, carrying the metal to ATH with Comex prices trading almost $64 and CFDs trading almost $65.
Timing Points
We have cycle timing that starts on the 15th and runs through the 17th with the focus on interest rates, There is strong possibility for fast moves and/or wide ranges this week. For a longer-term look at the timing, see the Special Report issued on 9 November 2025. 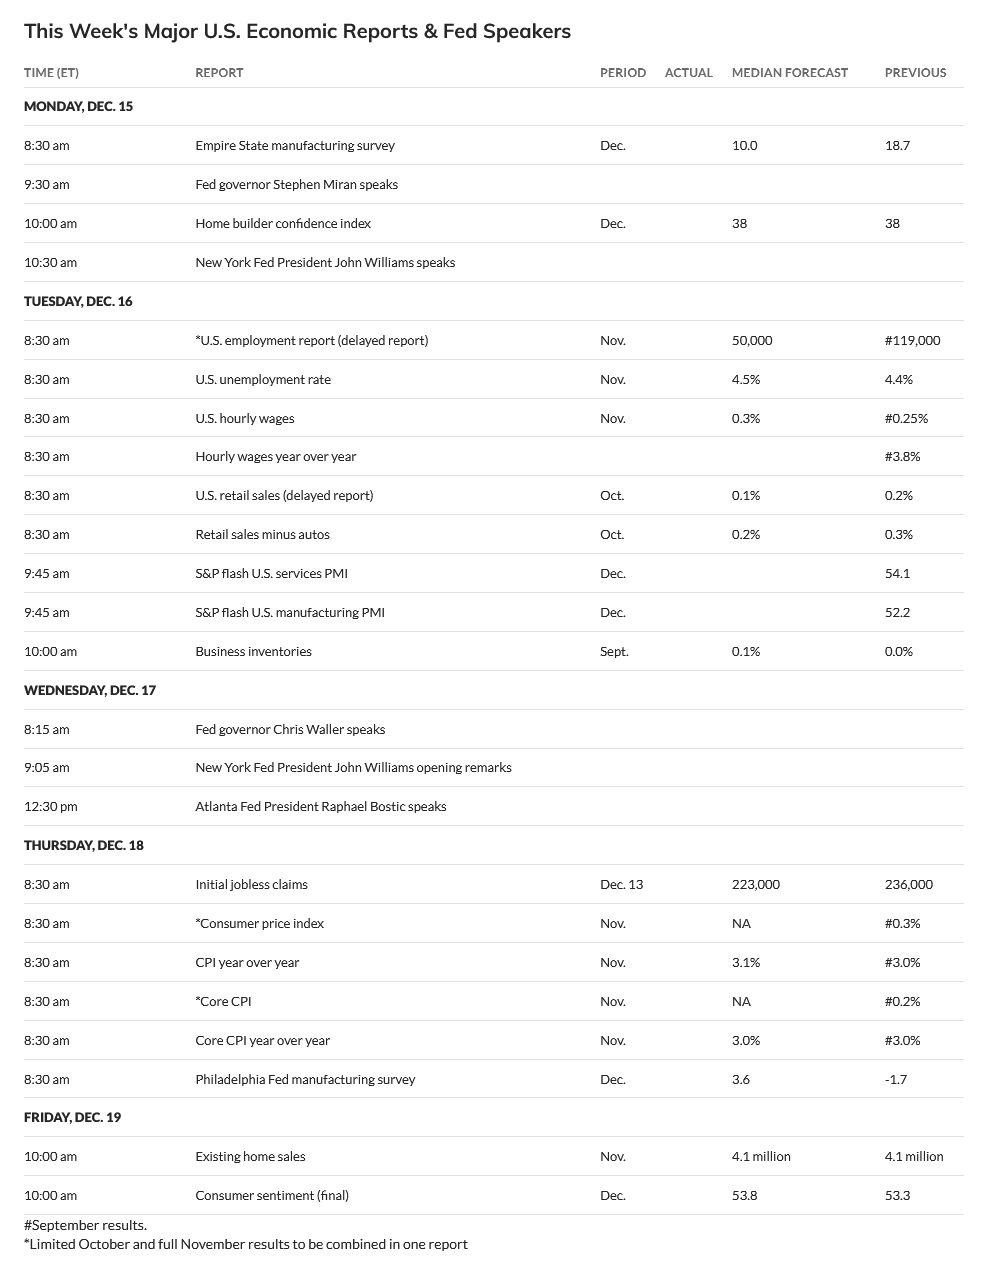
- 12/15 *** X may run through
- 12/17 *** X key to bonds/interest rates
- 12/24 **
- 01/09 *** X critical/fast moves
- 01/19-21 *** X
- 01/29-30 ***
Dow Jones Industrial Average
Dow Jones Industrial Average Weekly H-L-C
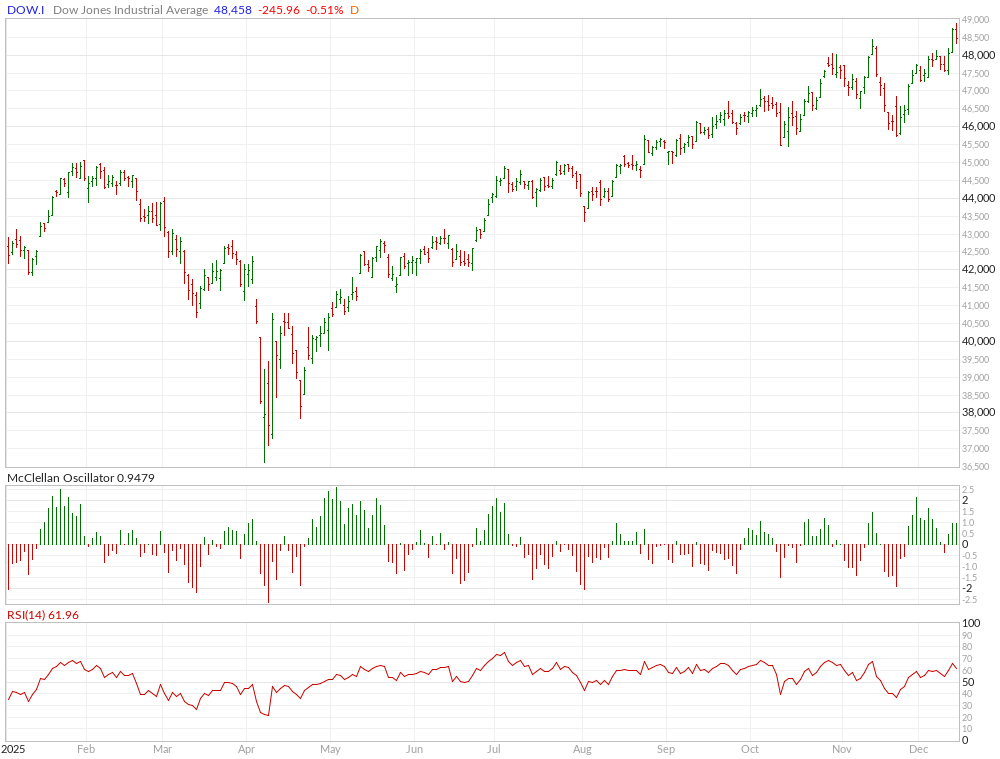
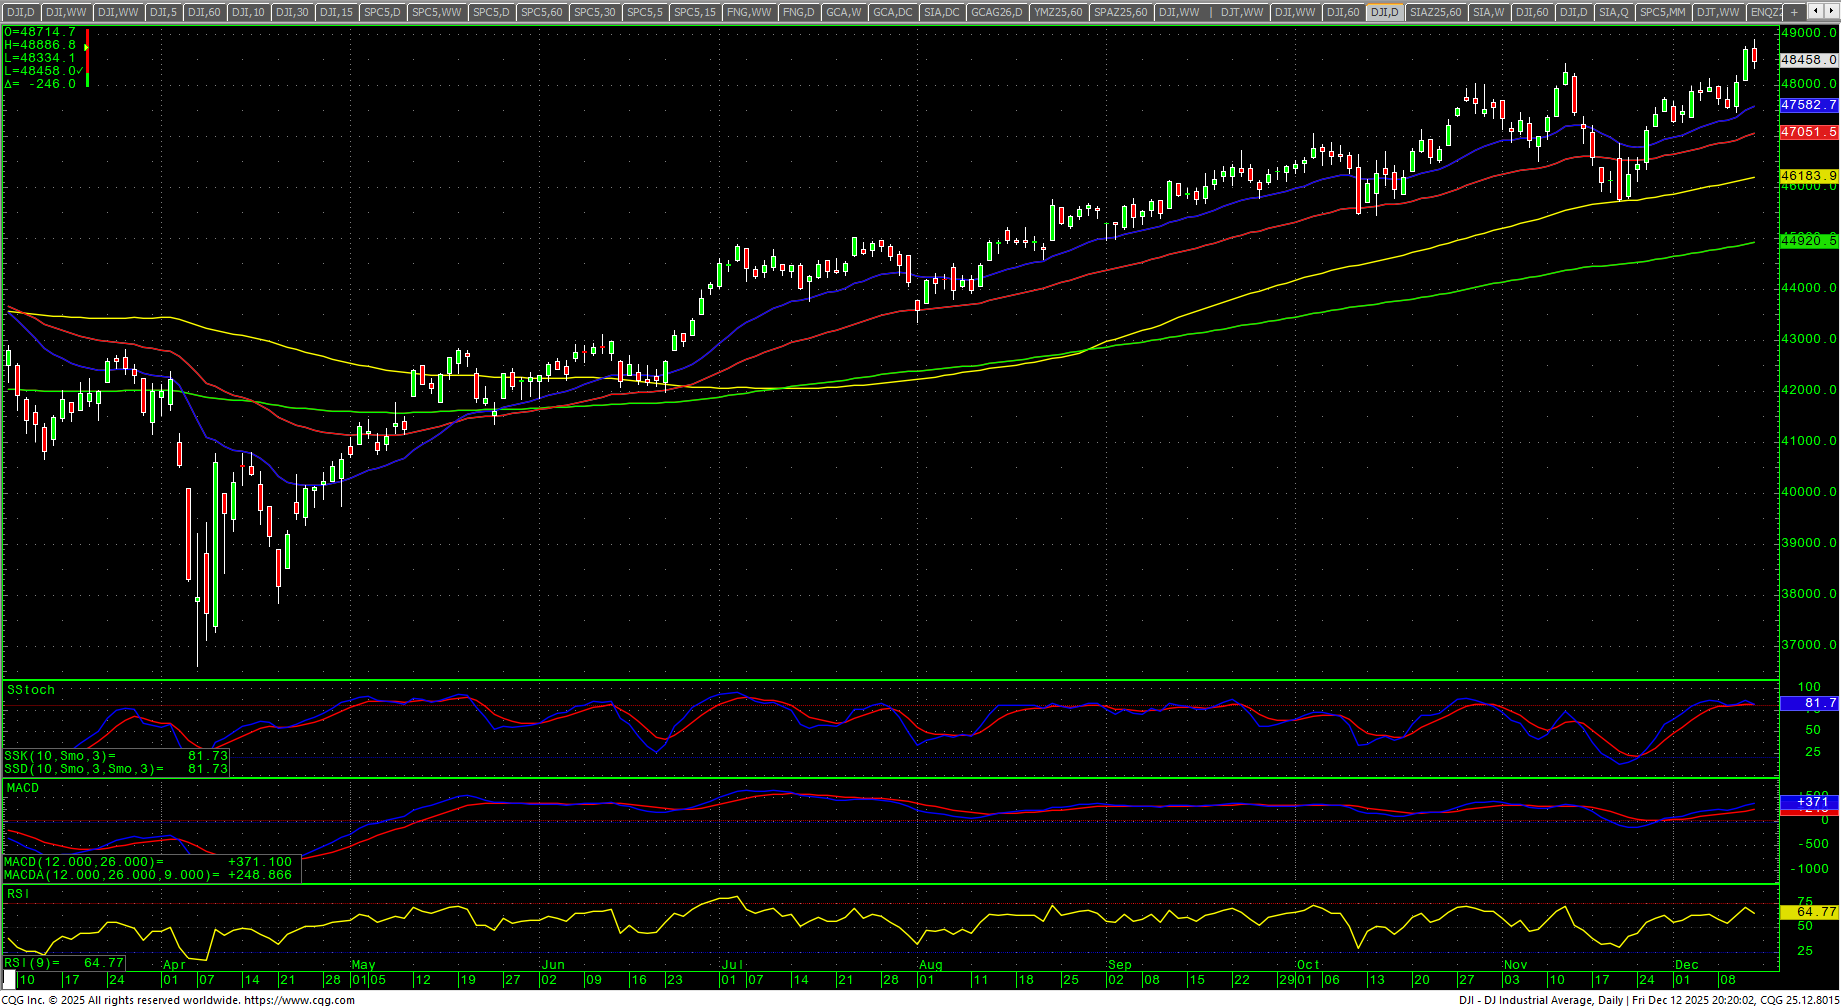
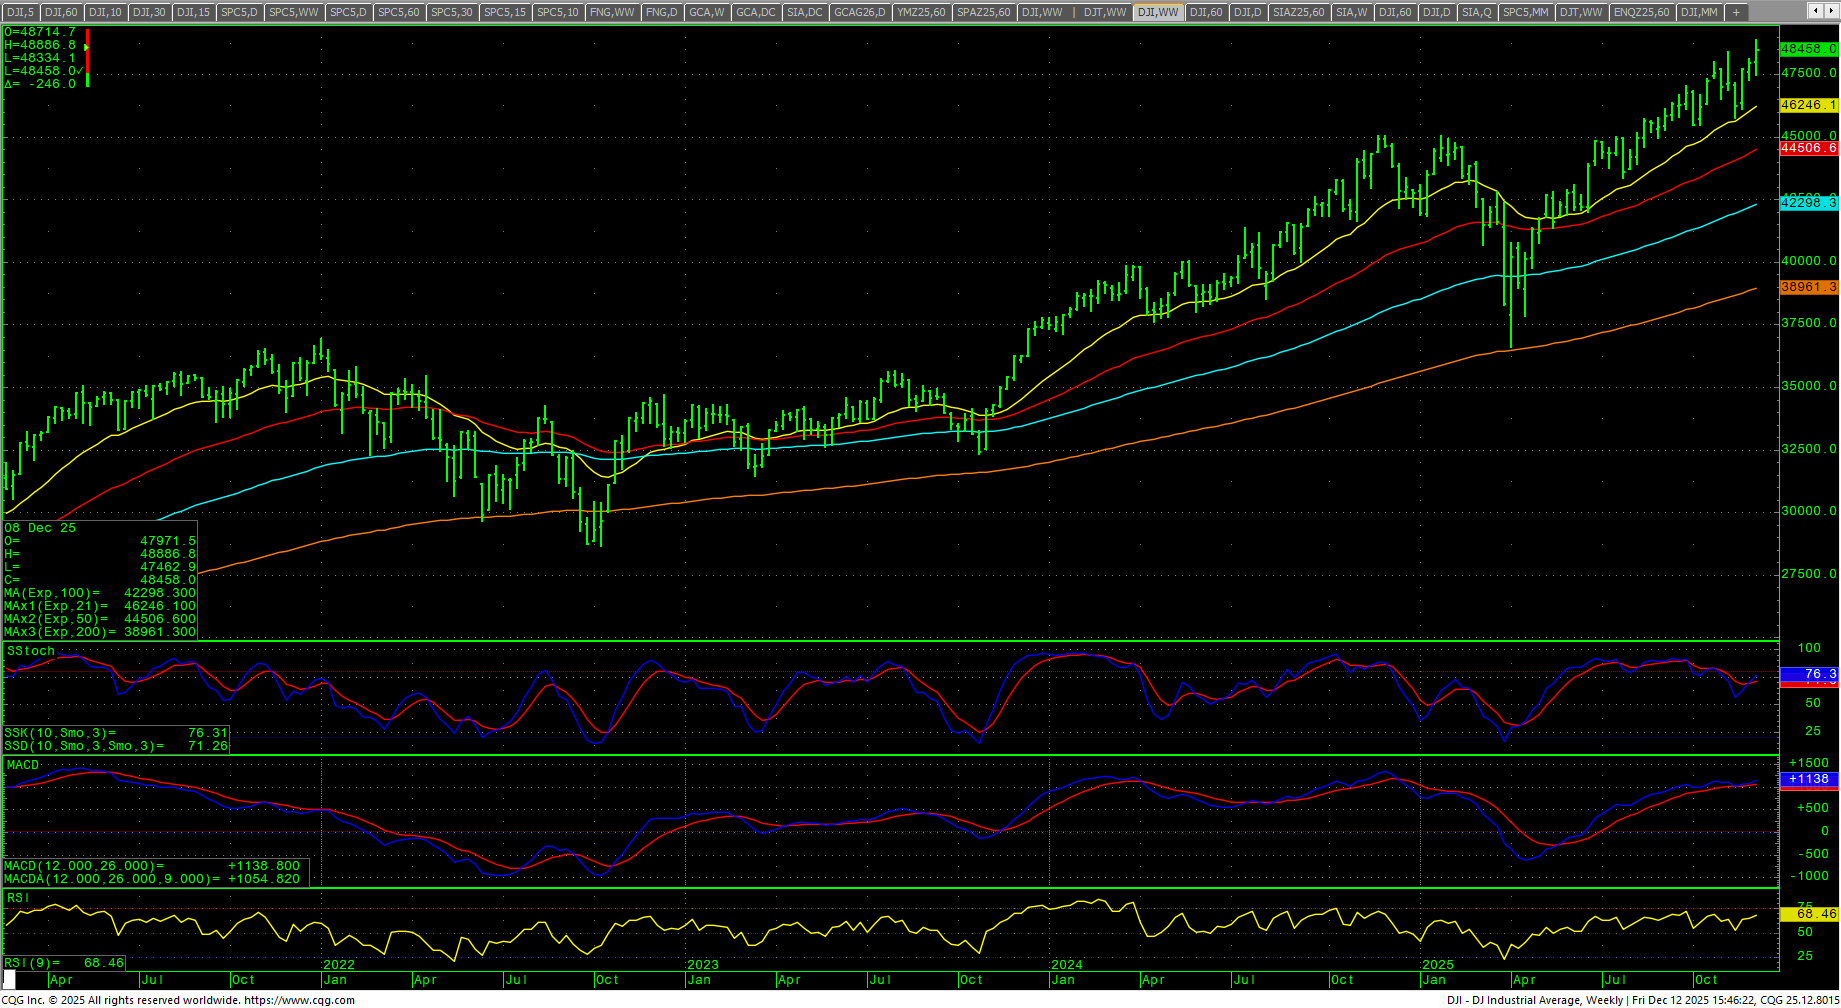 The Dow closed the week up +1.05% at the top of the week’s range, setting a new record high weekly close. The daily stochastics are up and slightly overbought. The MACD is up and still showing a bearish divergence. The daily RSI is 64.80 and got above 70 on Thursday. The 200-day MA starts the week at 44920.60 and is at record highs. The weekly has hooked higher in the stochastics.
Dow Jones Industrial Average Weekly Candles
 Prices traded to record highs last week with the Dow clearing one objective at 48798. Resistance is 48545, 48610 and 48675/48678. A drive back over 48678 should minimally test 48748/48756 and 48798. Closes above 48798 opens counts to 48942 and 49086. Closes over 49086 will open counts to 49230 and 49374.
Dow Jones Industrial Average Hourly H-L-C
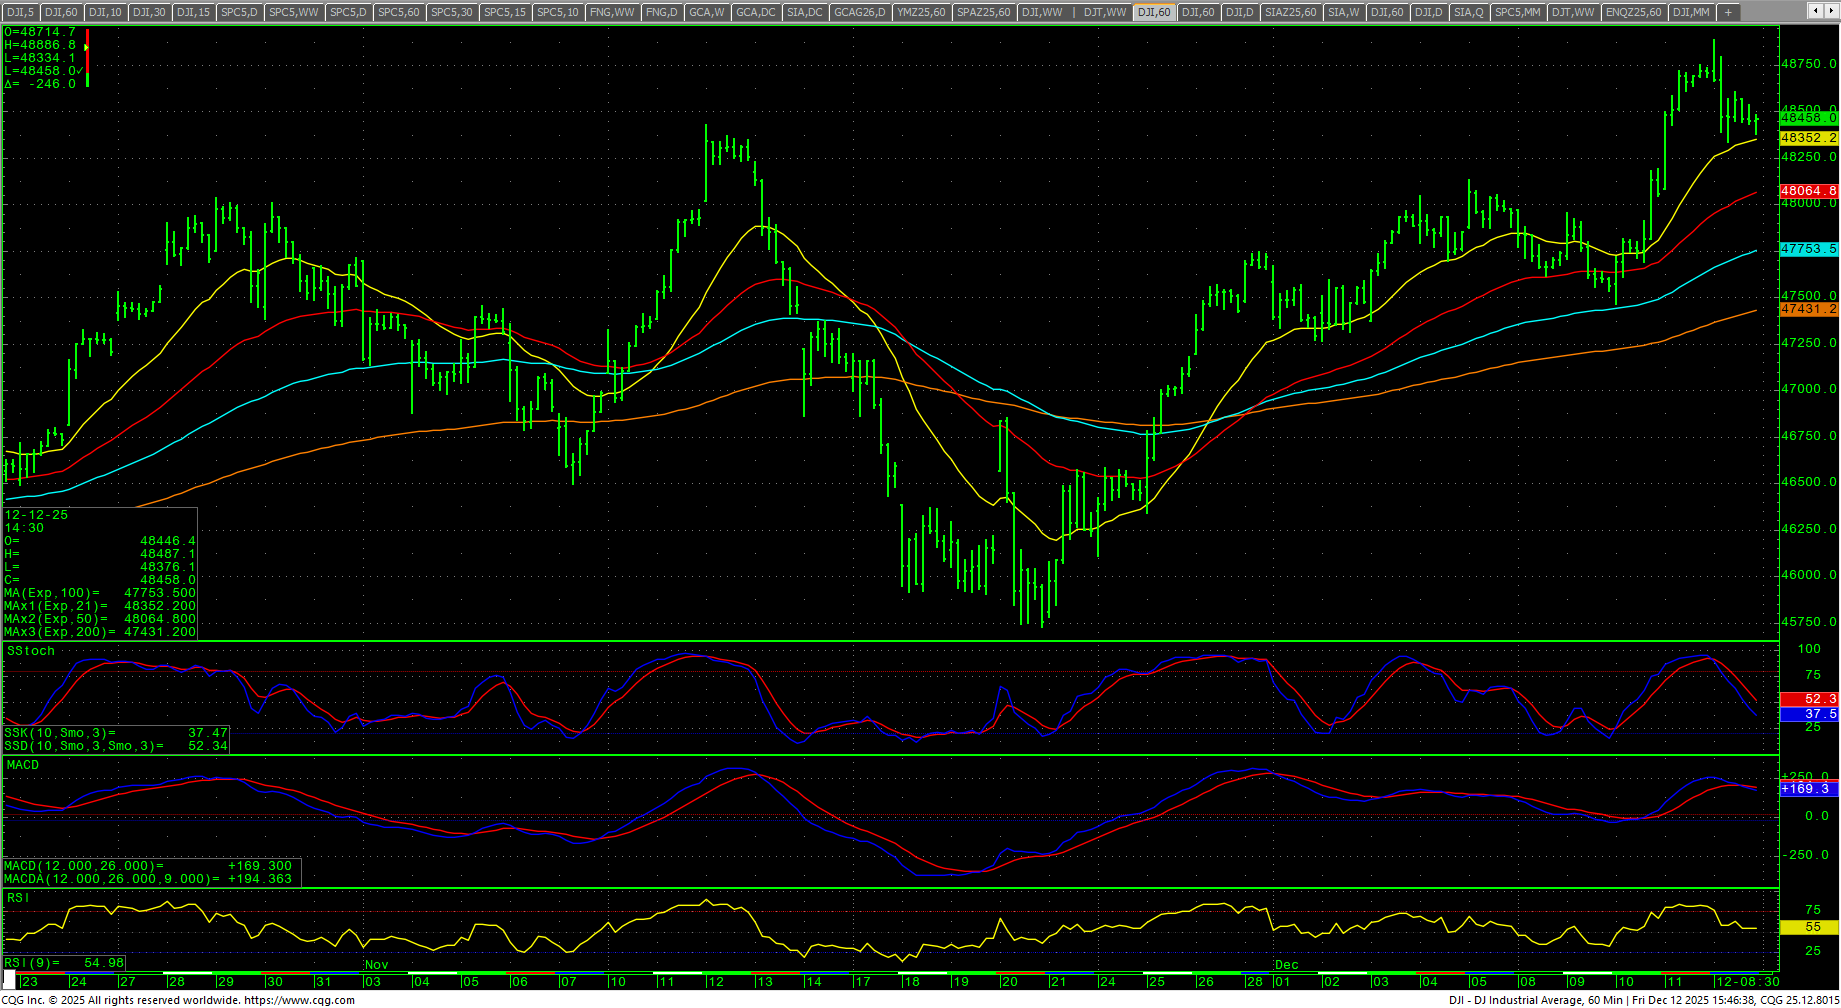 The hourly is neutral on Friday’s close. Support is 48141 and 47680. A breakdown under 47680 should test 47307 and pivotal near-term support at 46935/46930. Closes below 46930 will open counts to 45989. A breakdown under 45989 should minimally test 45727. Daily closes under 45727 will open counts into 44522 with full counts into the 44197/44149 level.
Dow Jones Industrial Average Daily Candles
| Resistance | Support |
|
|
S&P 500 Cash Index: SPX
S&P 500 Index Weekly H-L-C
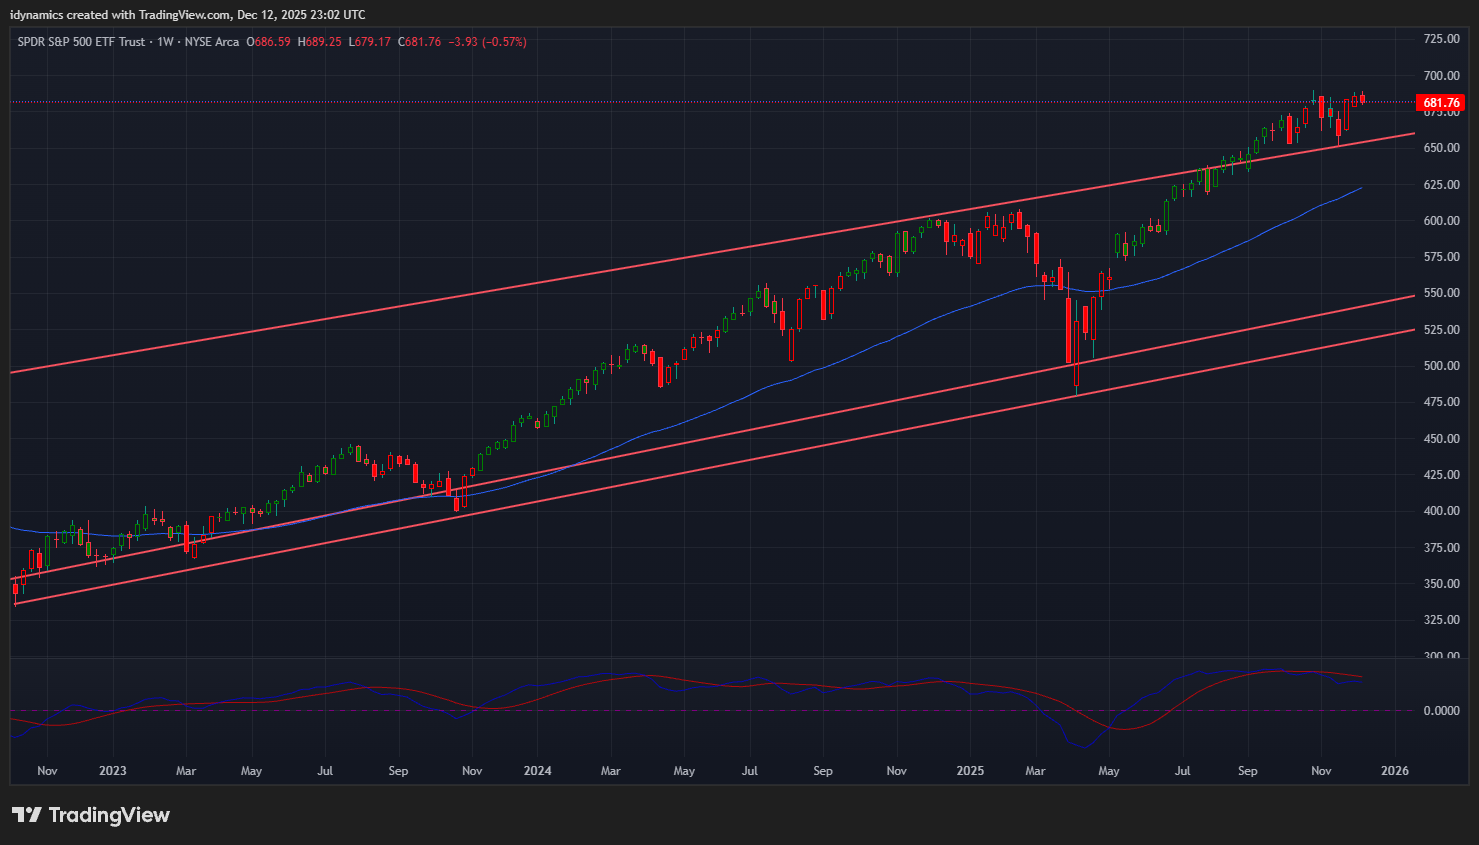
 The S&P traded to a retest of the all-time intraday highs of 6920 and set a new daily closing high on Thursday before selling off Friday and closing out the week down -0.63% on the bottom end of a weekly reversal range. Prices remain above the trendline breakout and that trendline currently sits at 6421.75. The SPY also set a new daily closing high before breaking. The daily chart is up in the stochastics but threatening to hook lower from overbought conditions. The MACD is up and flat and in bearish divergence. The daily RSI closed at 51.42. The weekly stochastics hooked higher abut are also in a bearish divergence. The hourly is neutral with Friday’s close. The 200-day MA is 6355.46 and at record highs.
SPY Weekly Candles
 Resistance is 6840, 6852 and 6864/6866. A drive above 6866 sets up 6878/6879 and a retest of 6903 through 6920. Closes over 6920 open counts to 6944 and 6980 through 7016. A close over 7016 offers counts to 7088, 7160 and 7214. Closes over 7214 setup a drive to 7250 and 7286 while opening counts as high as 7448. Above 7488 counts to 7520 and 7592. A drive above 7592 can test 7664 with counts to 7736 and as high as 7808. Above 7808 can carry to 7862 with potential to 7916.
S&P 500 Index Hourly H-L-C
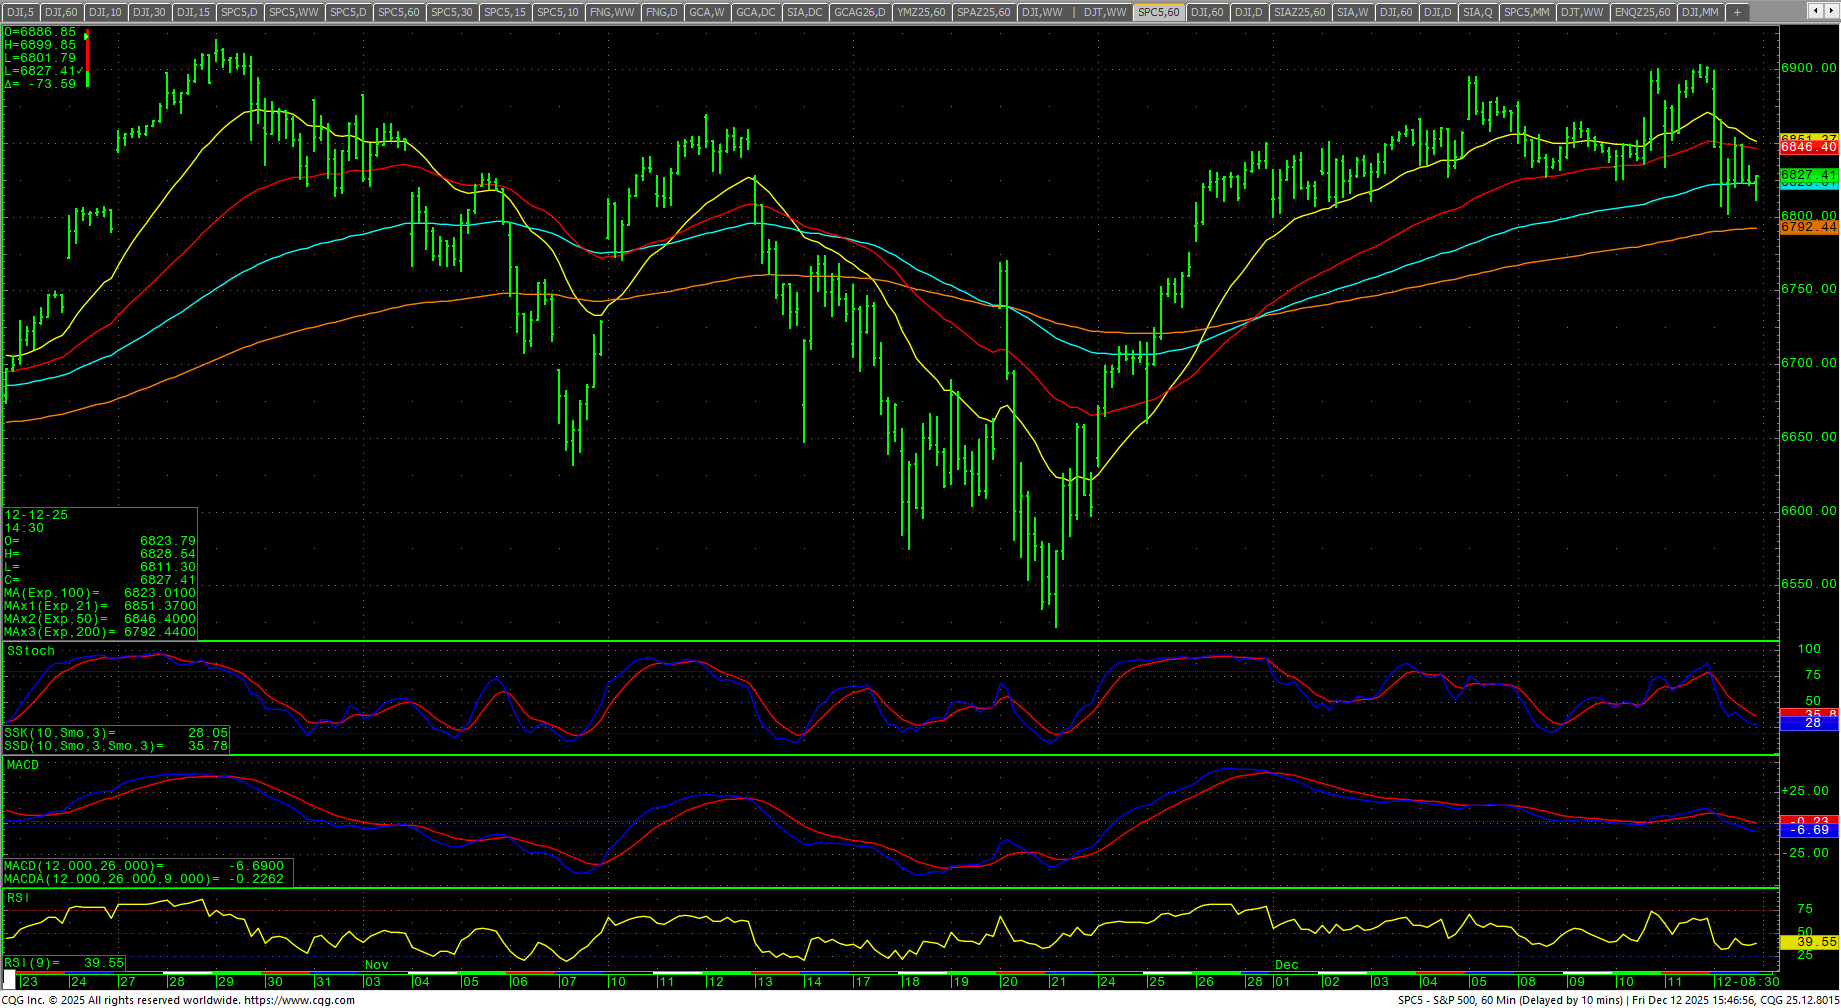 Support remains key in this band at 6807/6797. A breakdown under 6797 should test 6777 with counts to 6750/6747. Closes under 6747 set up 6718 through 6708 with counts to critical short-term support at 6664/6660. Closes under 6660 set up a move to 6615/6610 and opens counts to a retest of 6521. Closes below 6521 open counts to 6361/6360. A breakdown under 6360 should test 6123 with full counts into the 6044 level with critical hourly support at 6212/6201 and 6123. Daily closes under 6044 should minimally test 5877 and 5799/5798 with full counts to 5631/5628.
| Resistance | Support |
|
|
Charts courtesy of CQG, Inc., CNN, Koyfin, Trading View and AAII