
TECHNICAL ANALYSIS (by Intraday Dynamics)
THIS WEEK’S POST IS A FREEMIUM POST
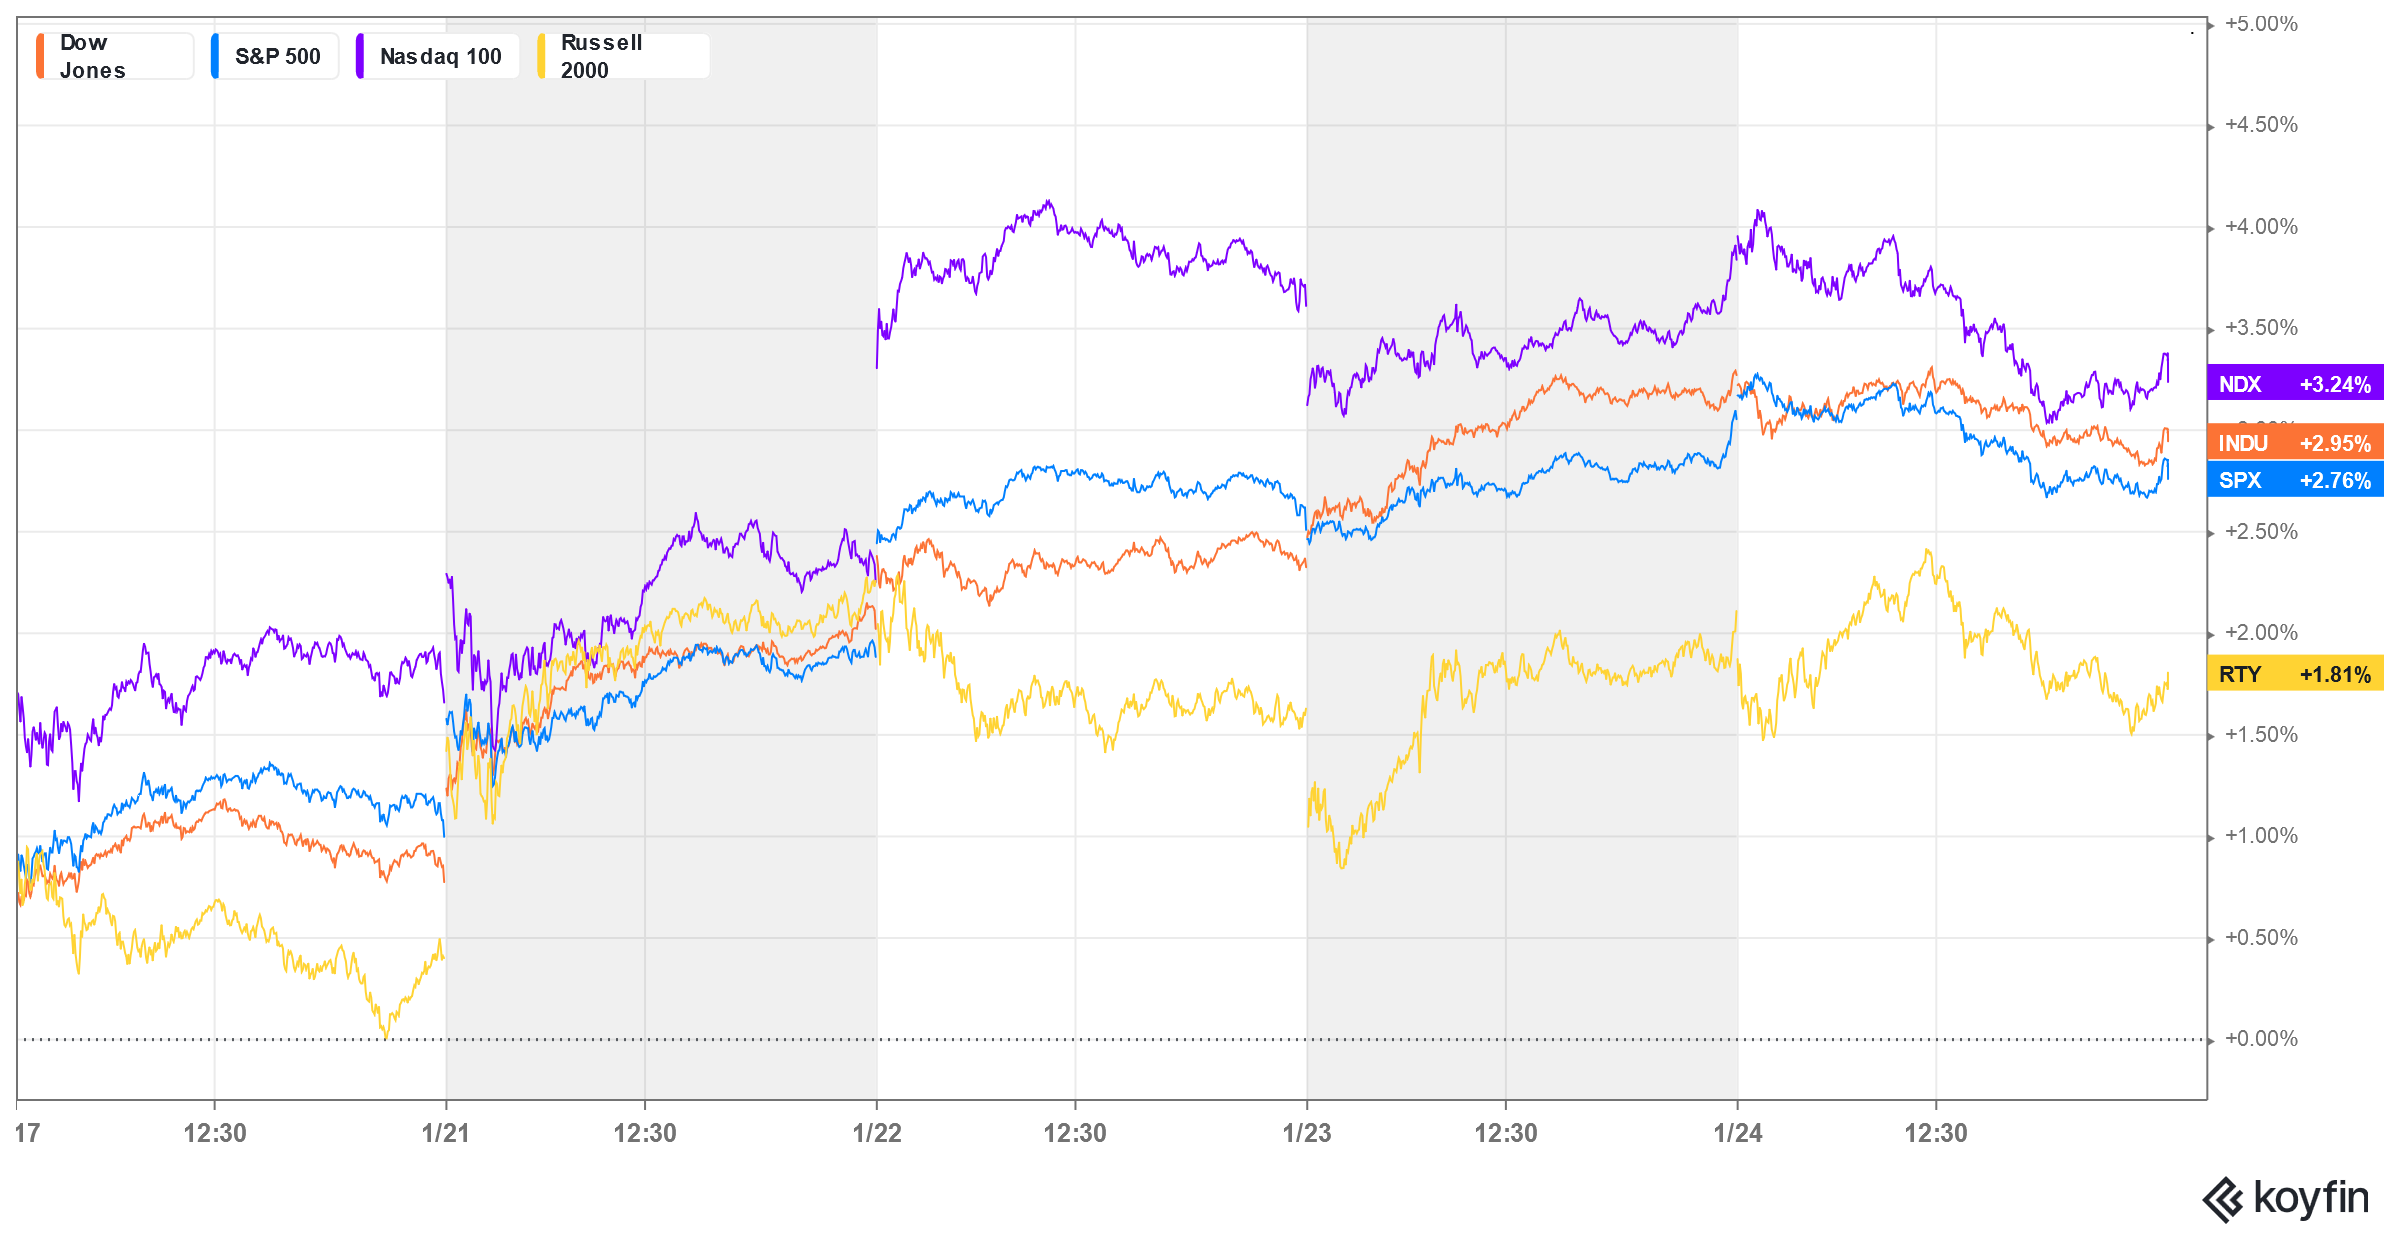
Major Indices Week of January 24, 2025
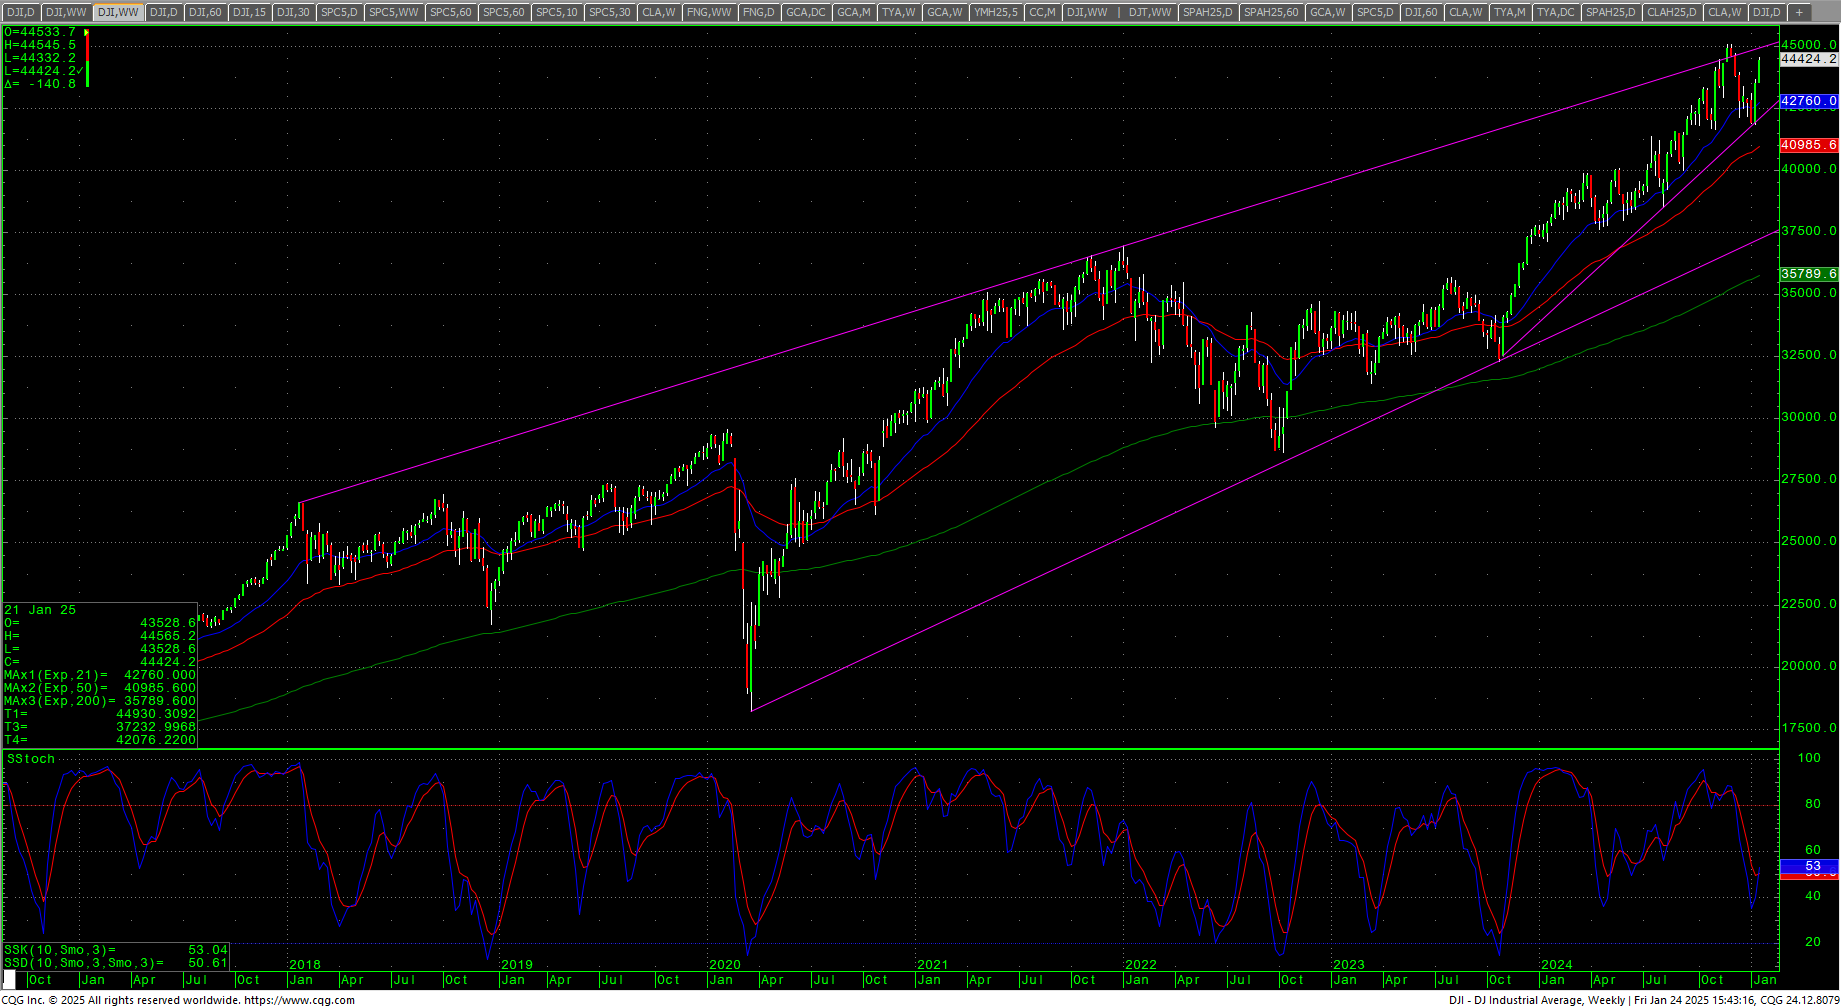
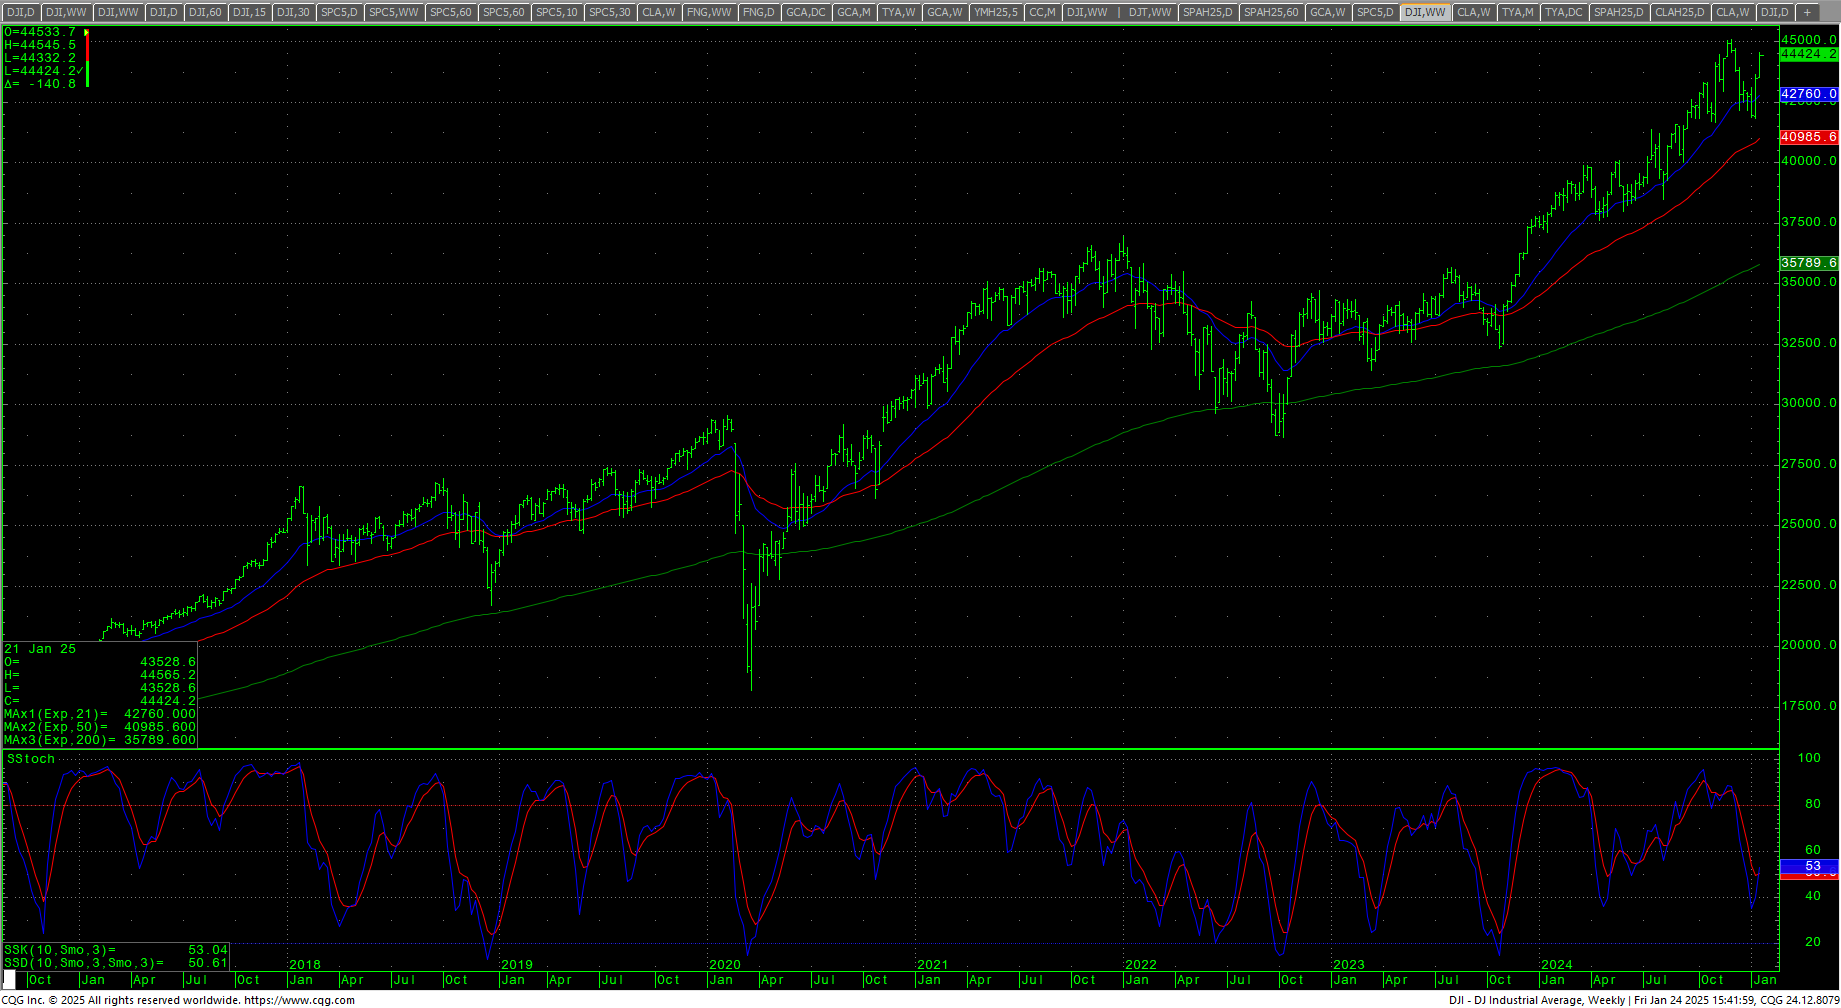
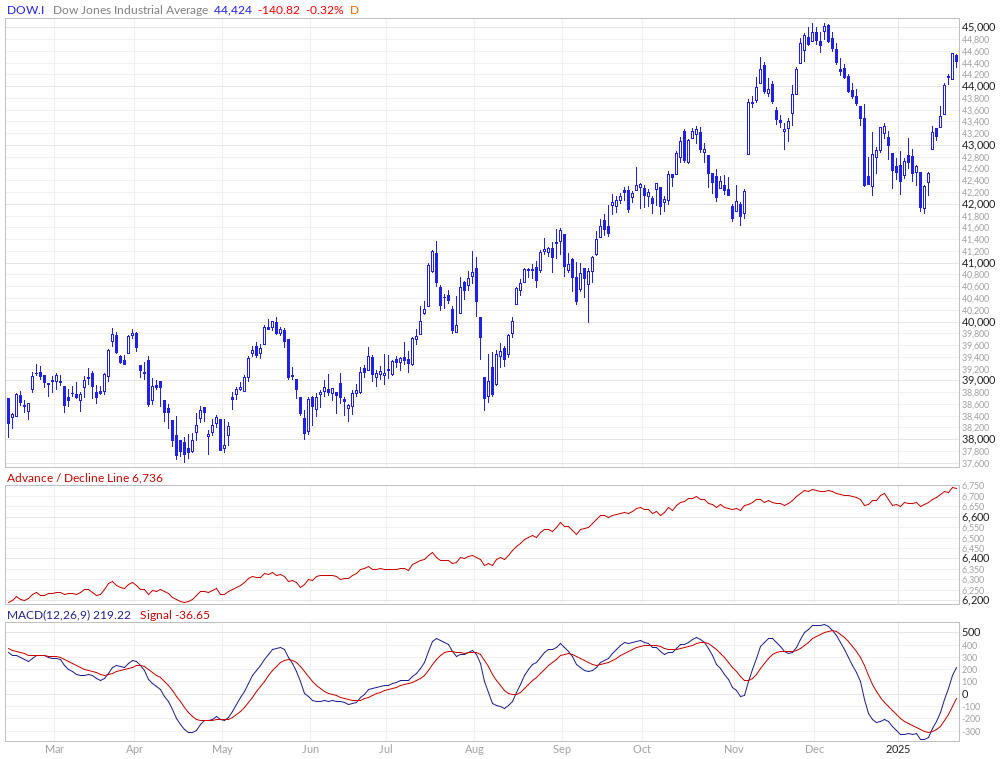
 Dow Jones Industrial Average Weekly Candles
 Stocks spent a shortened trading week on the upside with the FANG leading the way as both the FANG and the S&P/SPY moved into record high territory while the Dow and the Russell remain off their respective ATHs. The market saw timing on Thursday that caused a small setback in Friday’s trade with prices reacting to some extreme overbought conditions on the short-term charts.
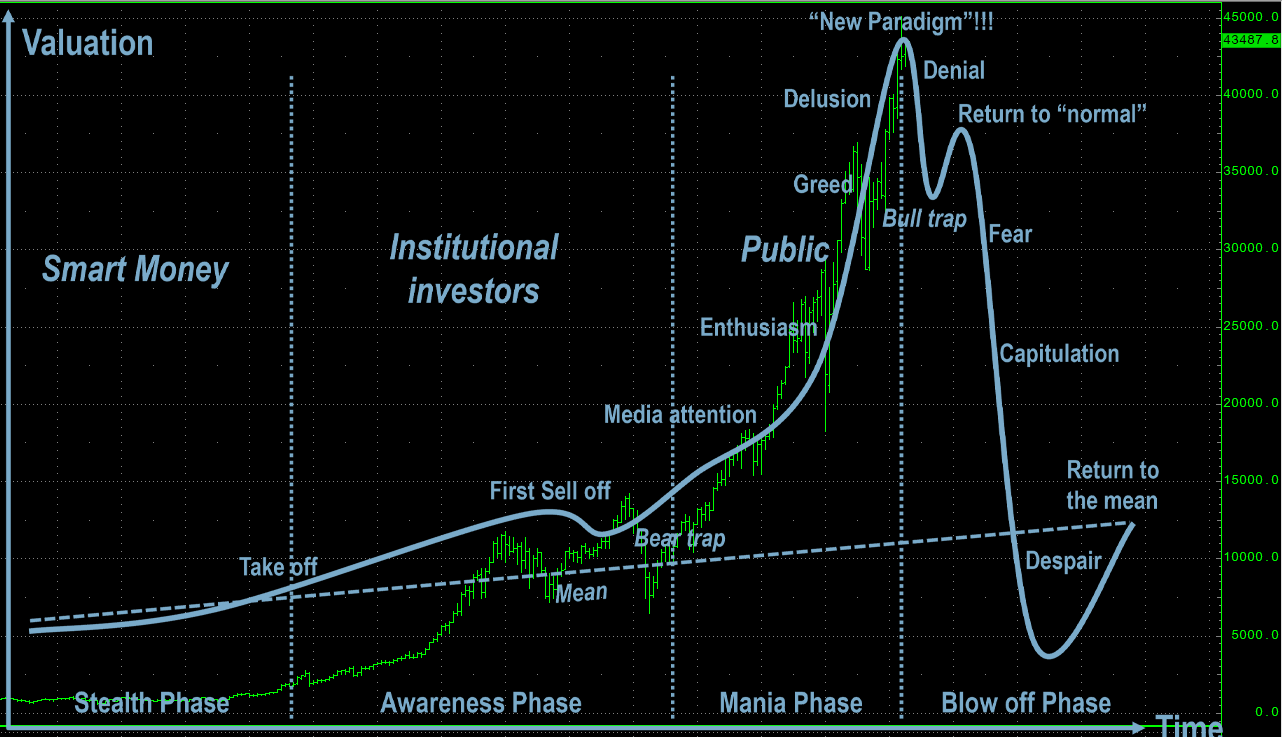
The action removed some of the over-done sentiment on the negative side, although breadth remains mixed. That said, sentiment still does not show signs of a mania, but some of the chatter in the analyst class definitely is leaning into manic projections for everything from equities to crypto and tech stocks. In other words, we have started to see the “New Paradigm” (Golden Age) logic being espoused.
 Fund managers have continued to sell into this rally which likely means that weaker hands are the ones doing the buying. This also could explain why sentiment data has remained in fear while prices go up. The S&P has traded in a classic rounded top pattern with the move to new highs last week reflecting a traditional A-B-C count. All the major indices are green for 2025. Old School Dow Theory still has not confirmed any of the post-election rally. Coupled with fund managers selling, does this mean we are looking at a “pump and dump?”
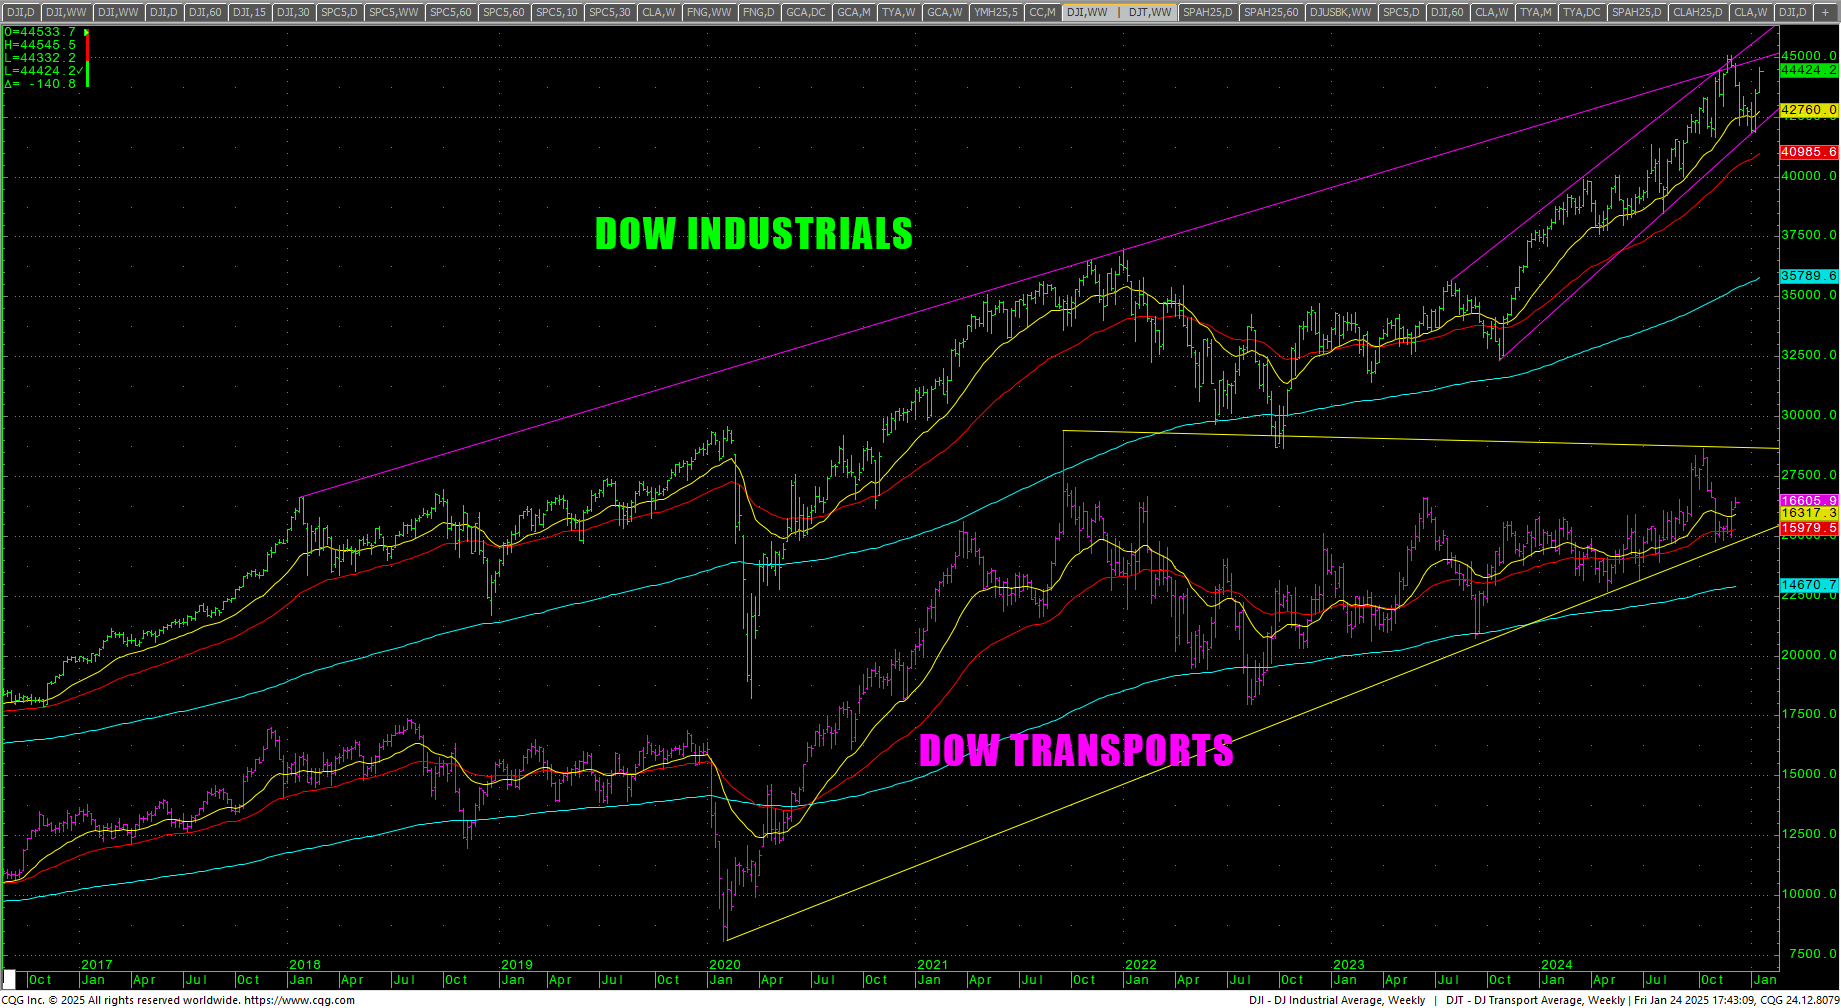
Dow Theory
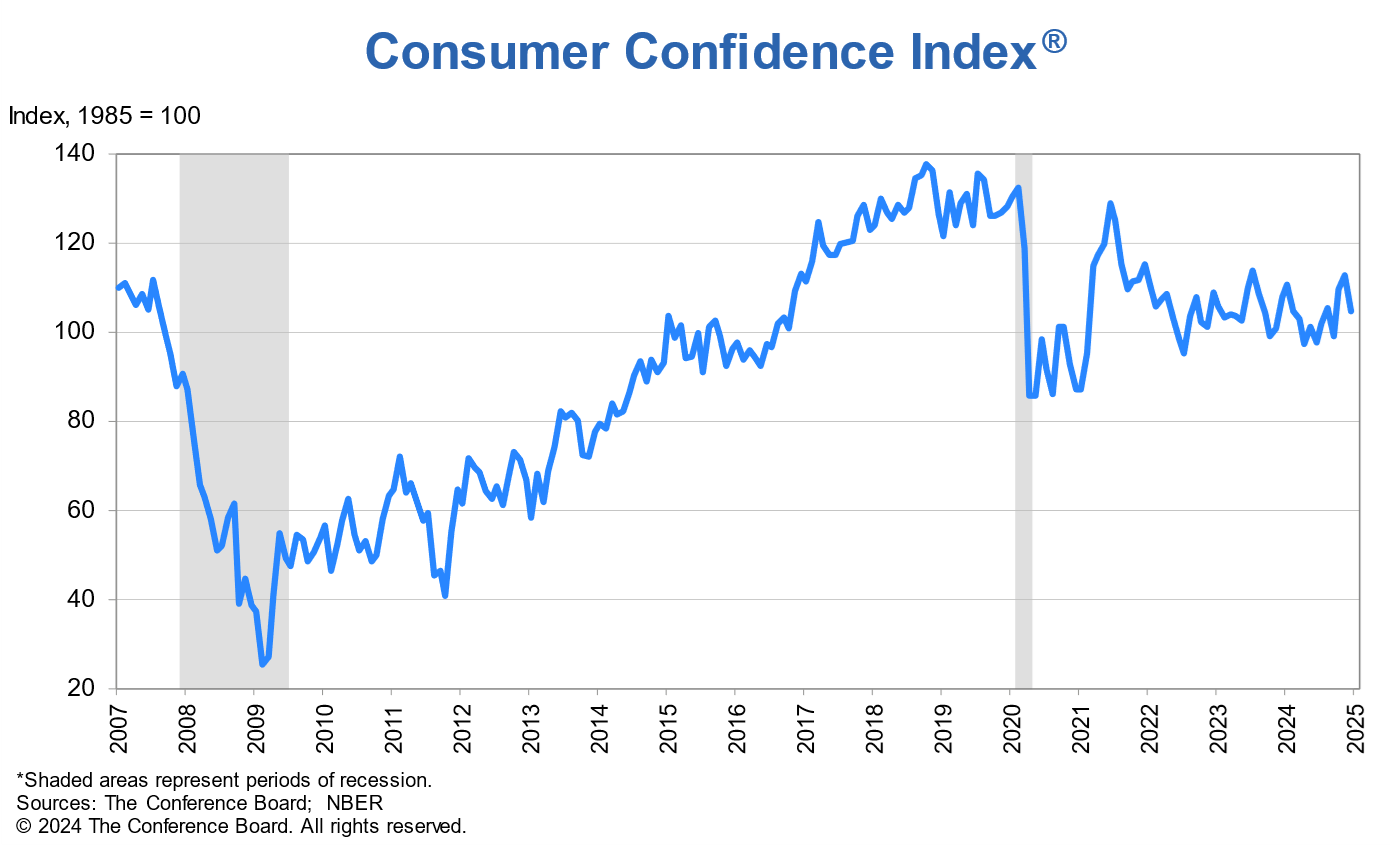
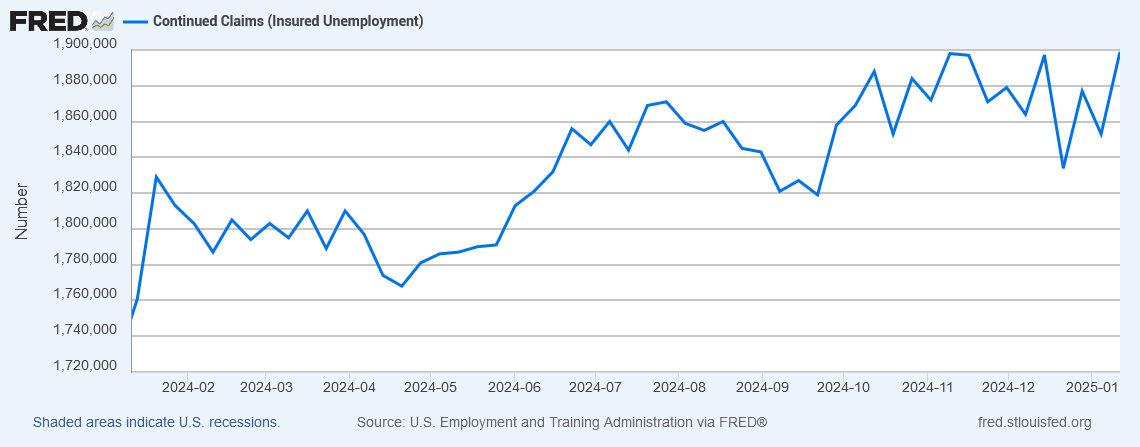
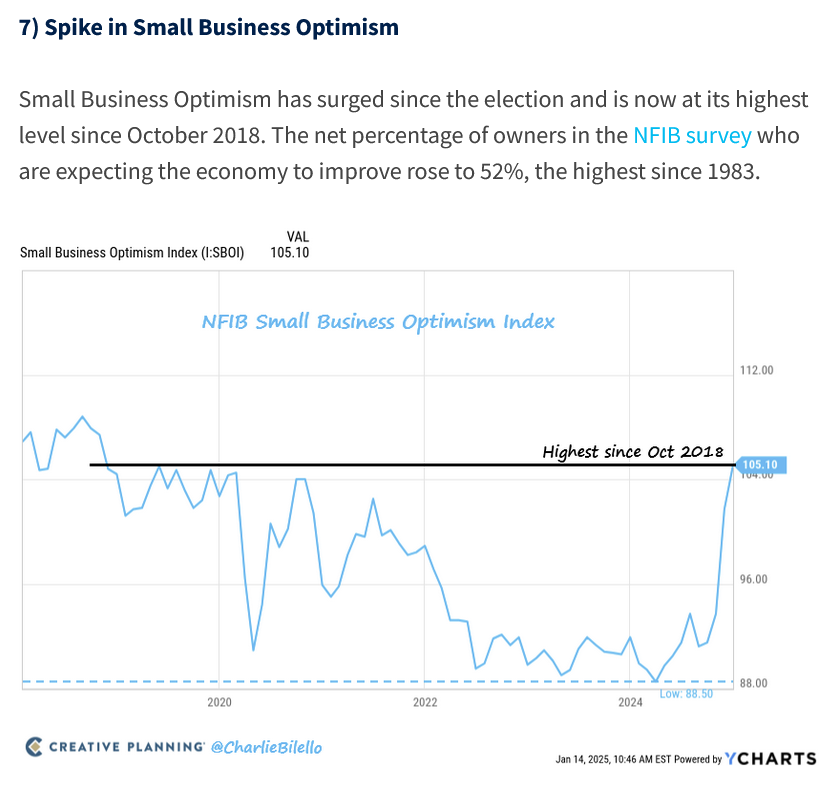
 As for the Dow, the market retraced about 80%+ of the entire decline from the top in early December. The daily chart is now overbought again. Likewise, the S&P is overbought and flashing a bearish divergence on the daily. There are still any number of significant underlying warning signs about the overall health of the market and, regardless of sentiment, they need to be considered intermediate-term signals. On Friday, Consumer Sentiment numbers showed an erosion in confidence. The only improvement was sentiment toward labor, which is interesting because continued unemployment claims have been steadily rising over the past six months. This is happening while small business sentiment has hit the highest levels since 2018 (source: Charlie Bilello).
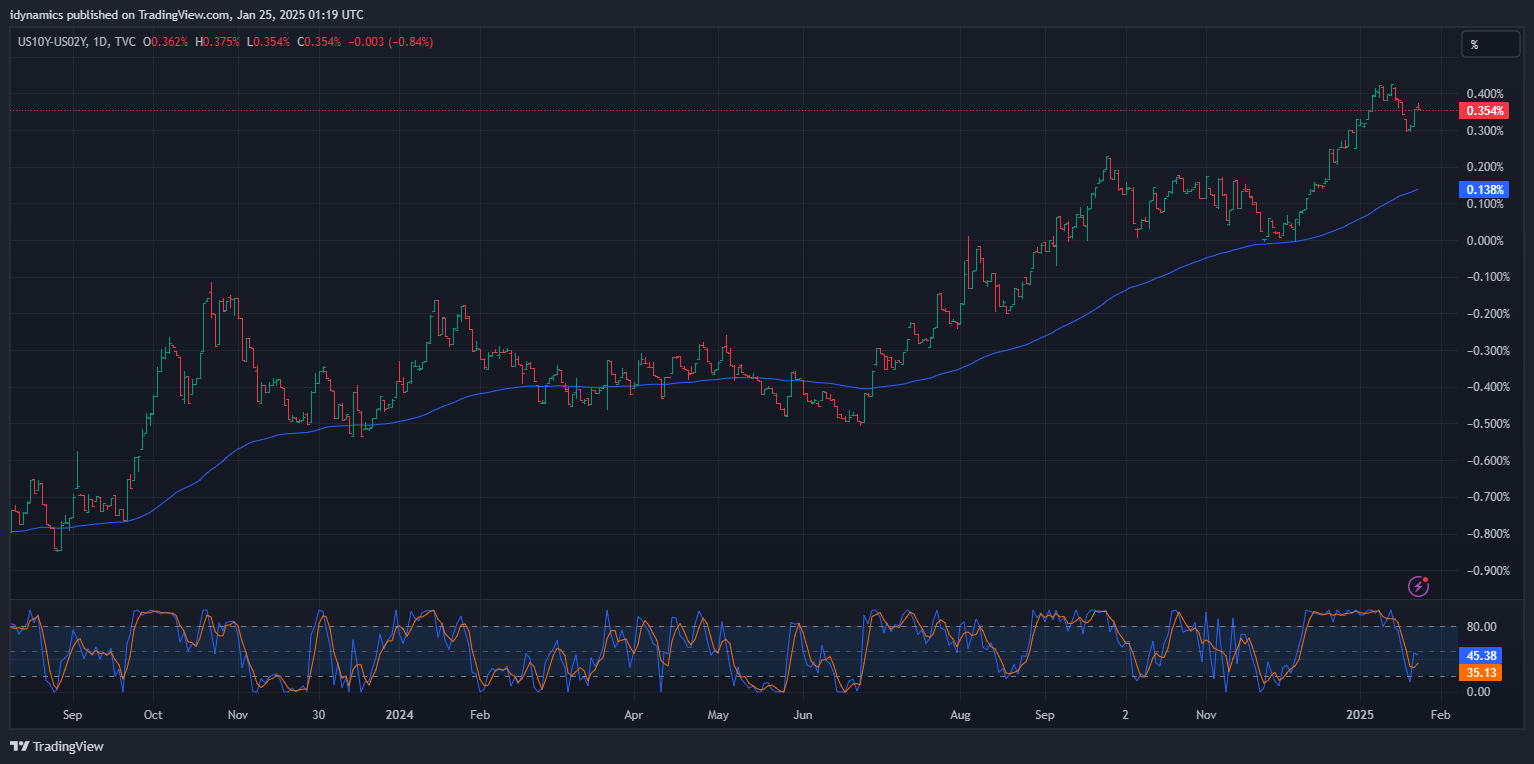
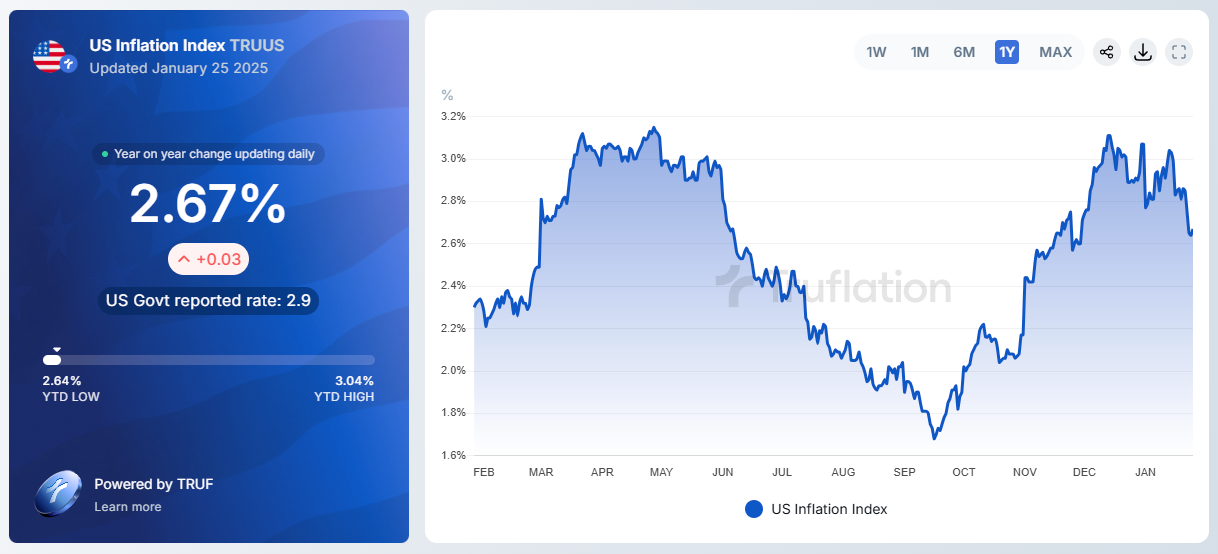
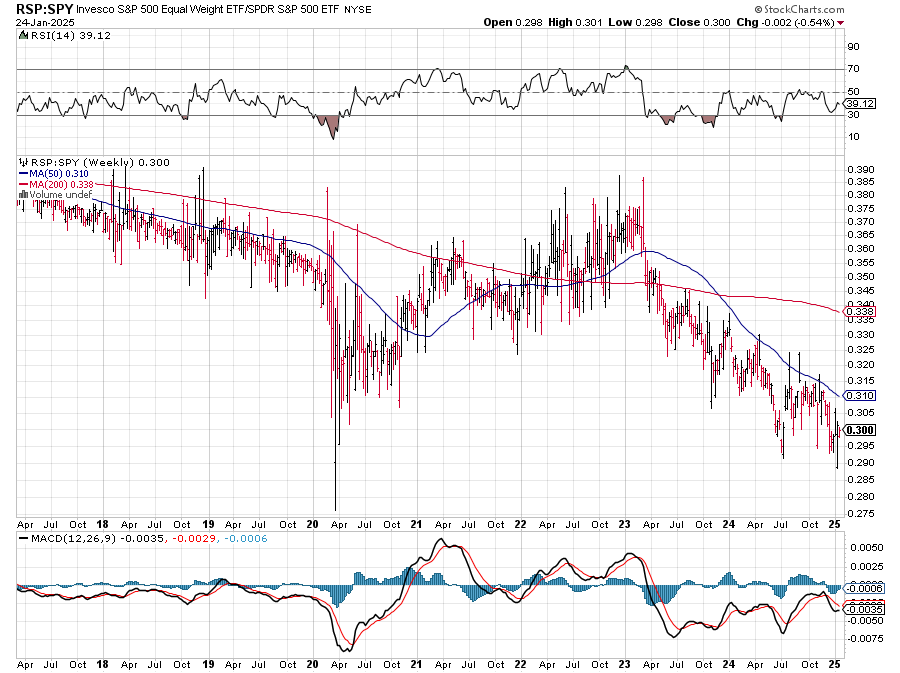
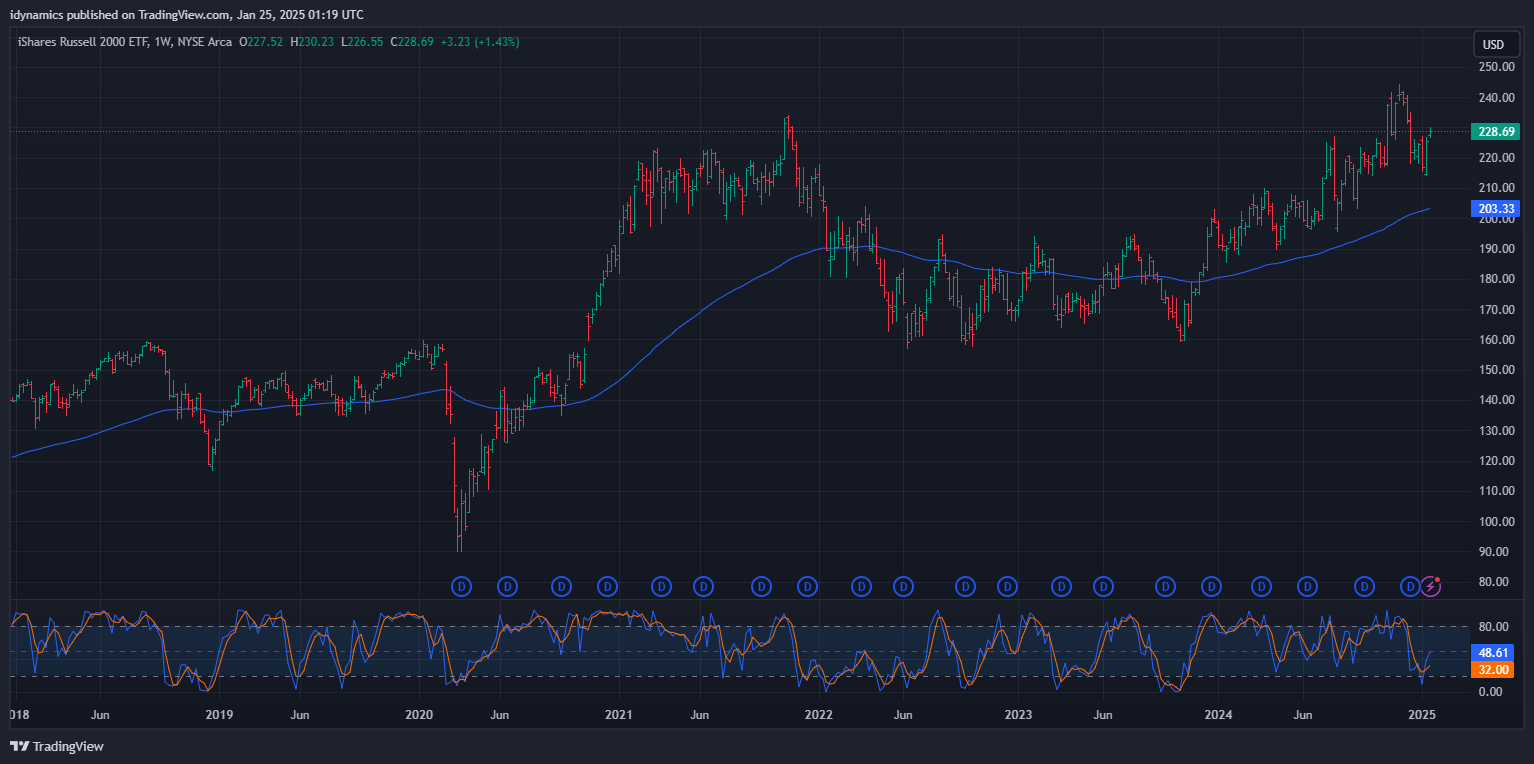
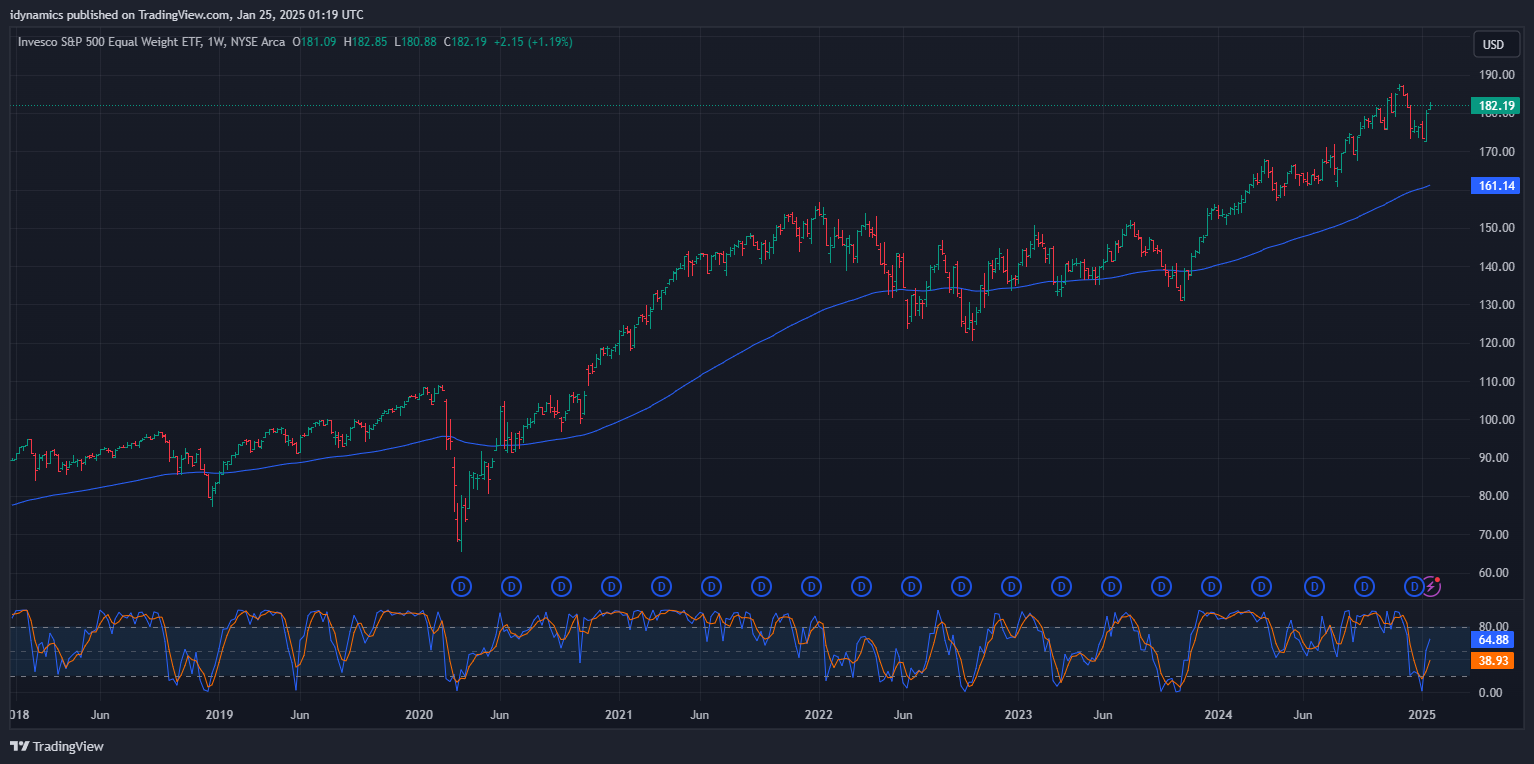
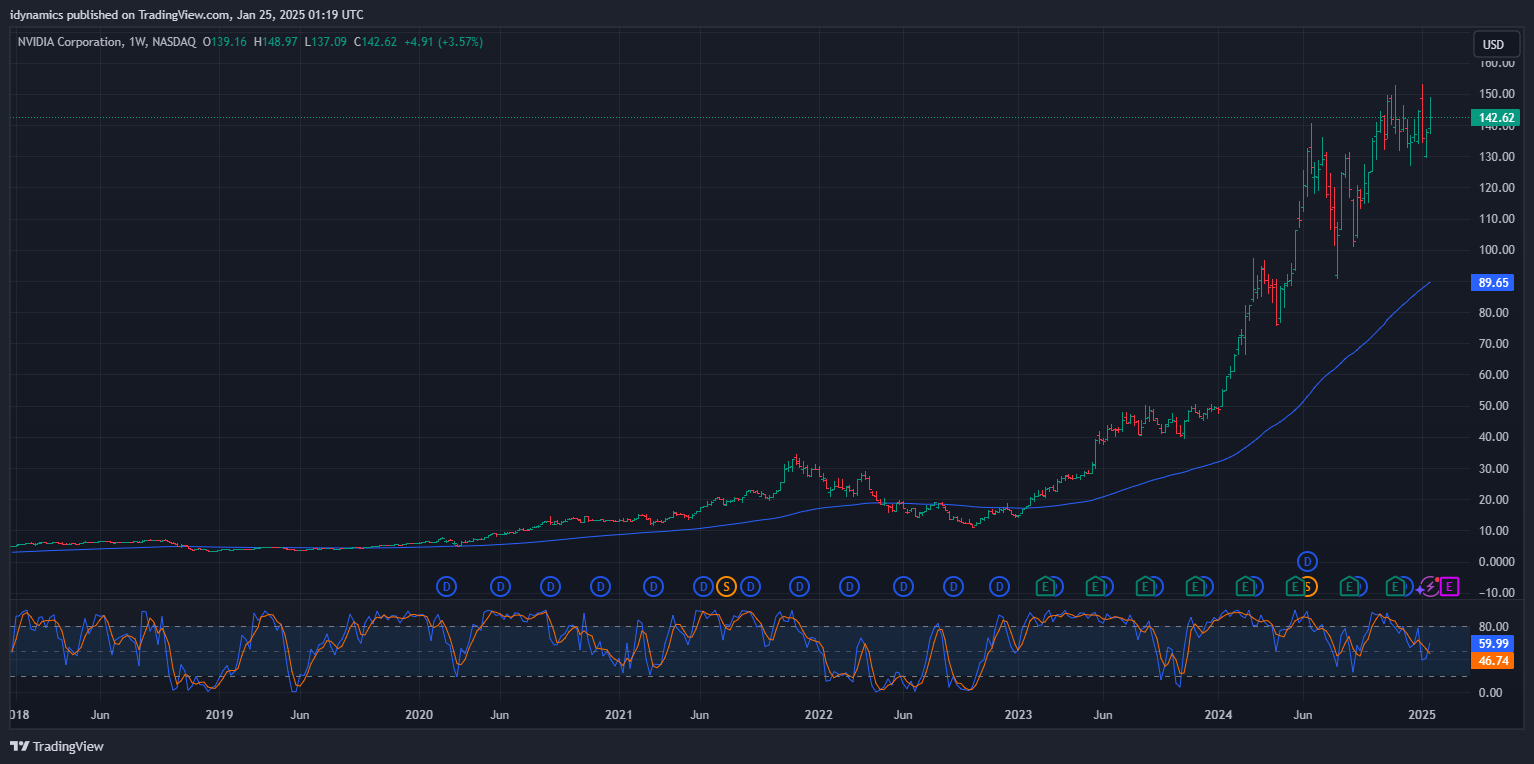
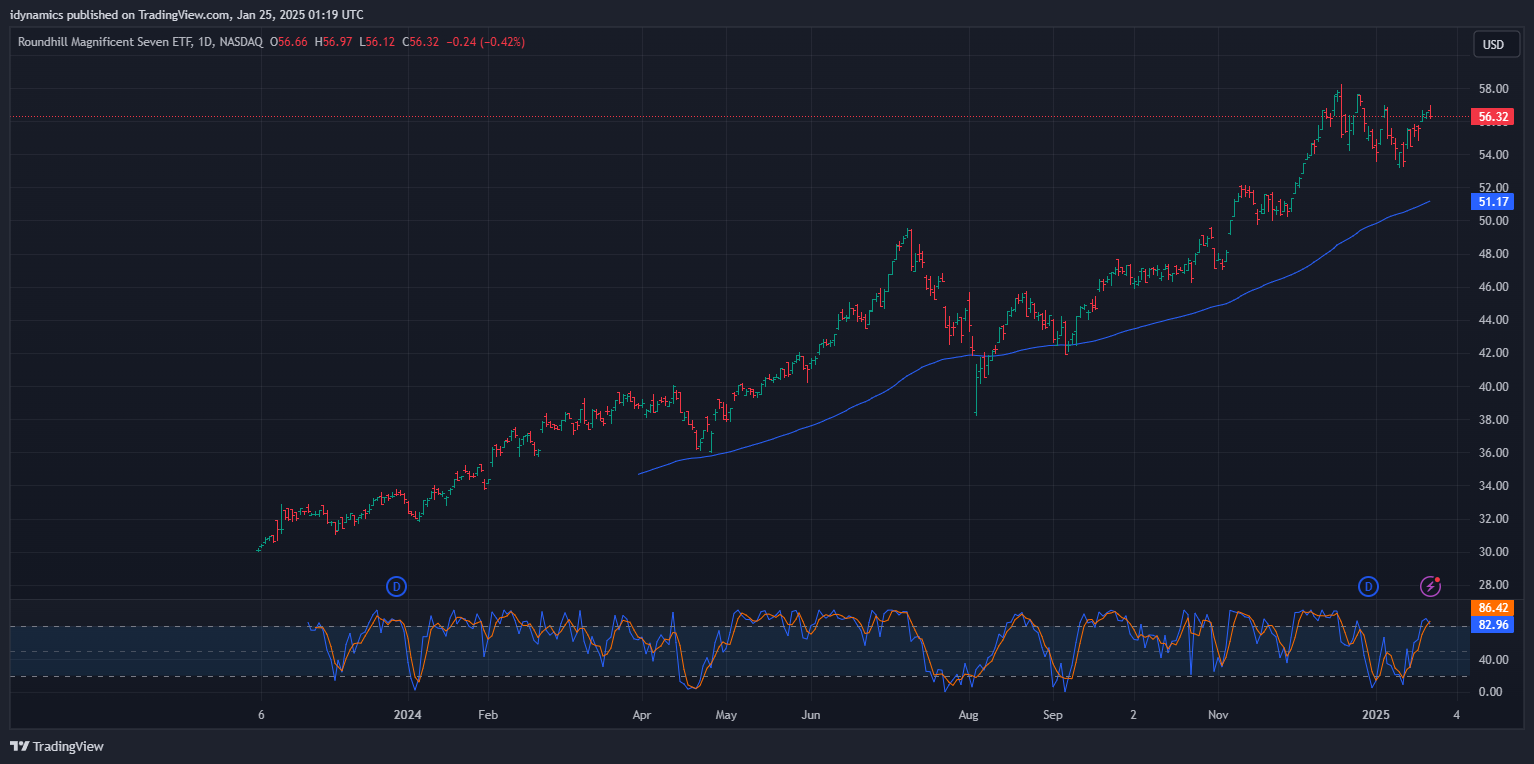
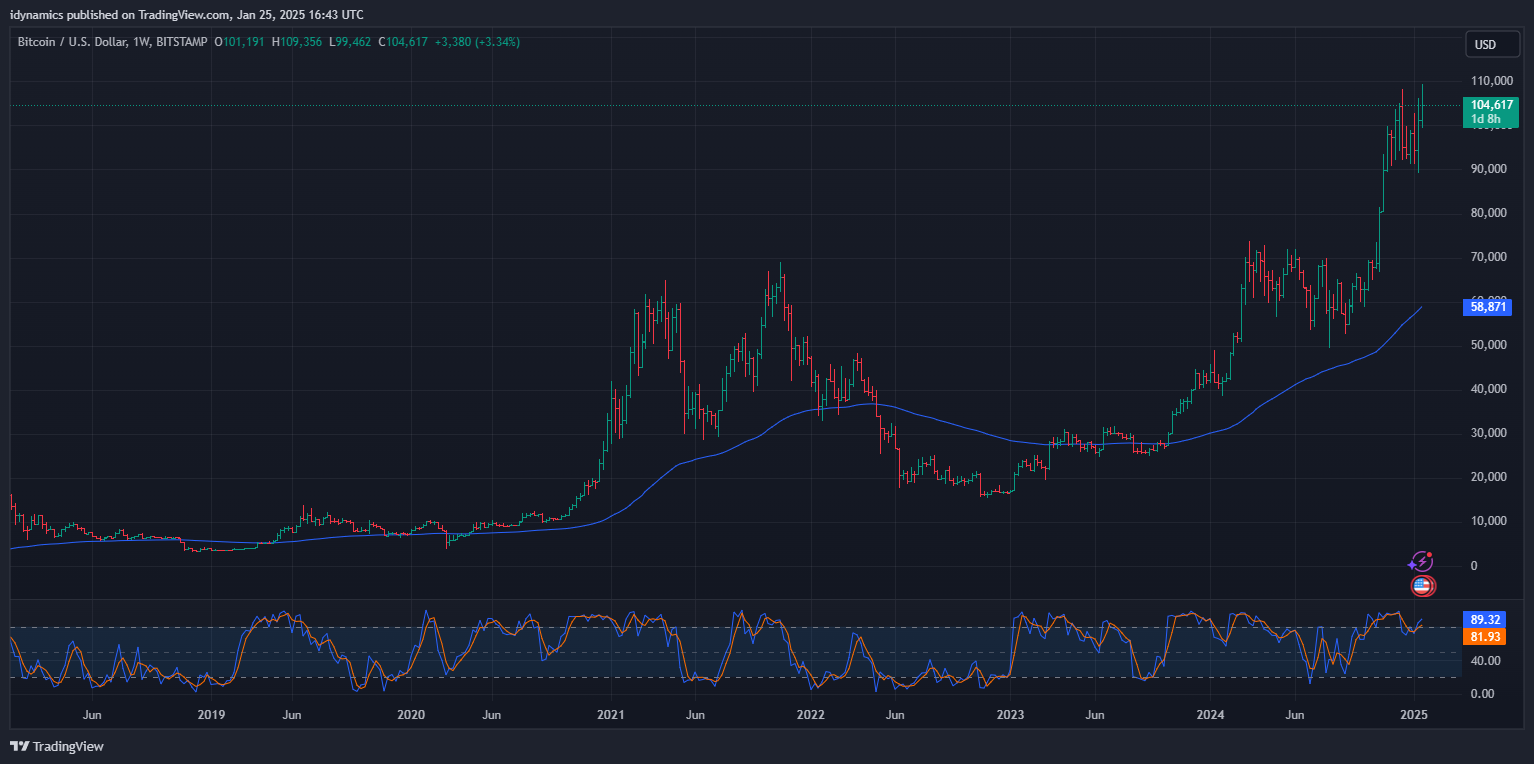
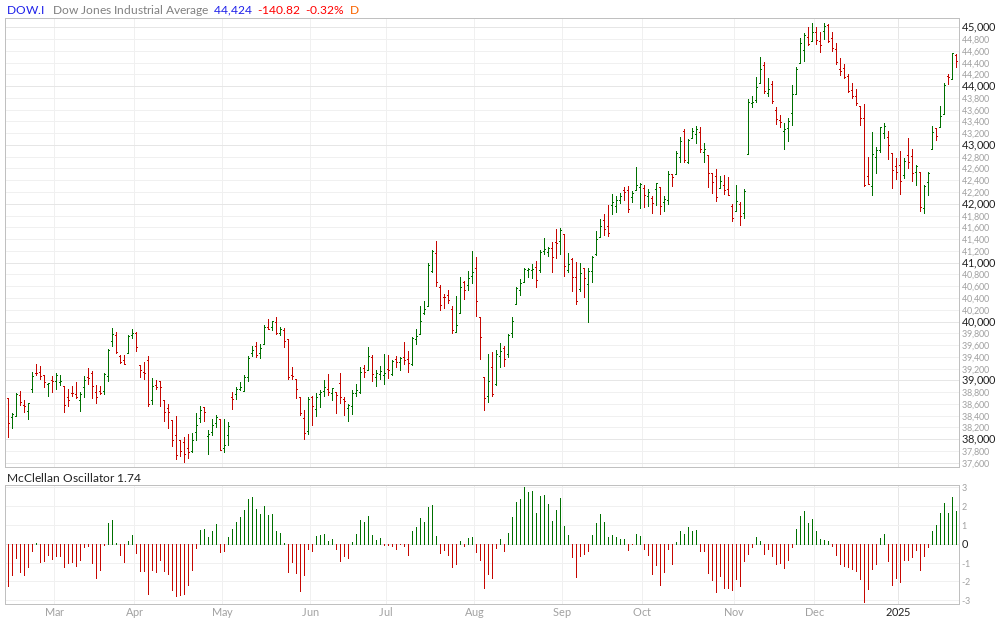
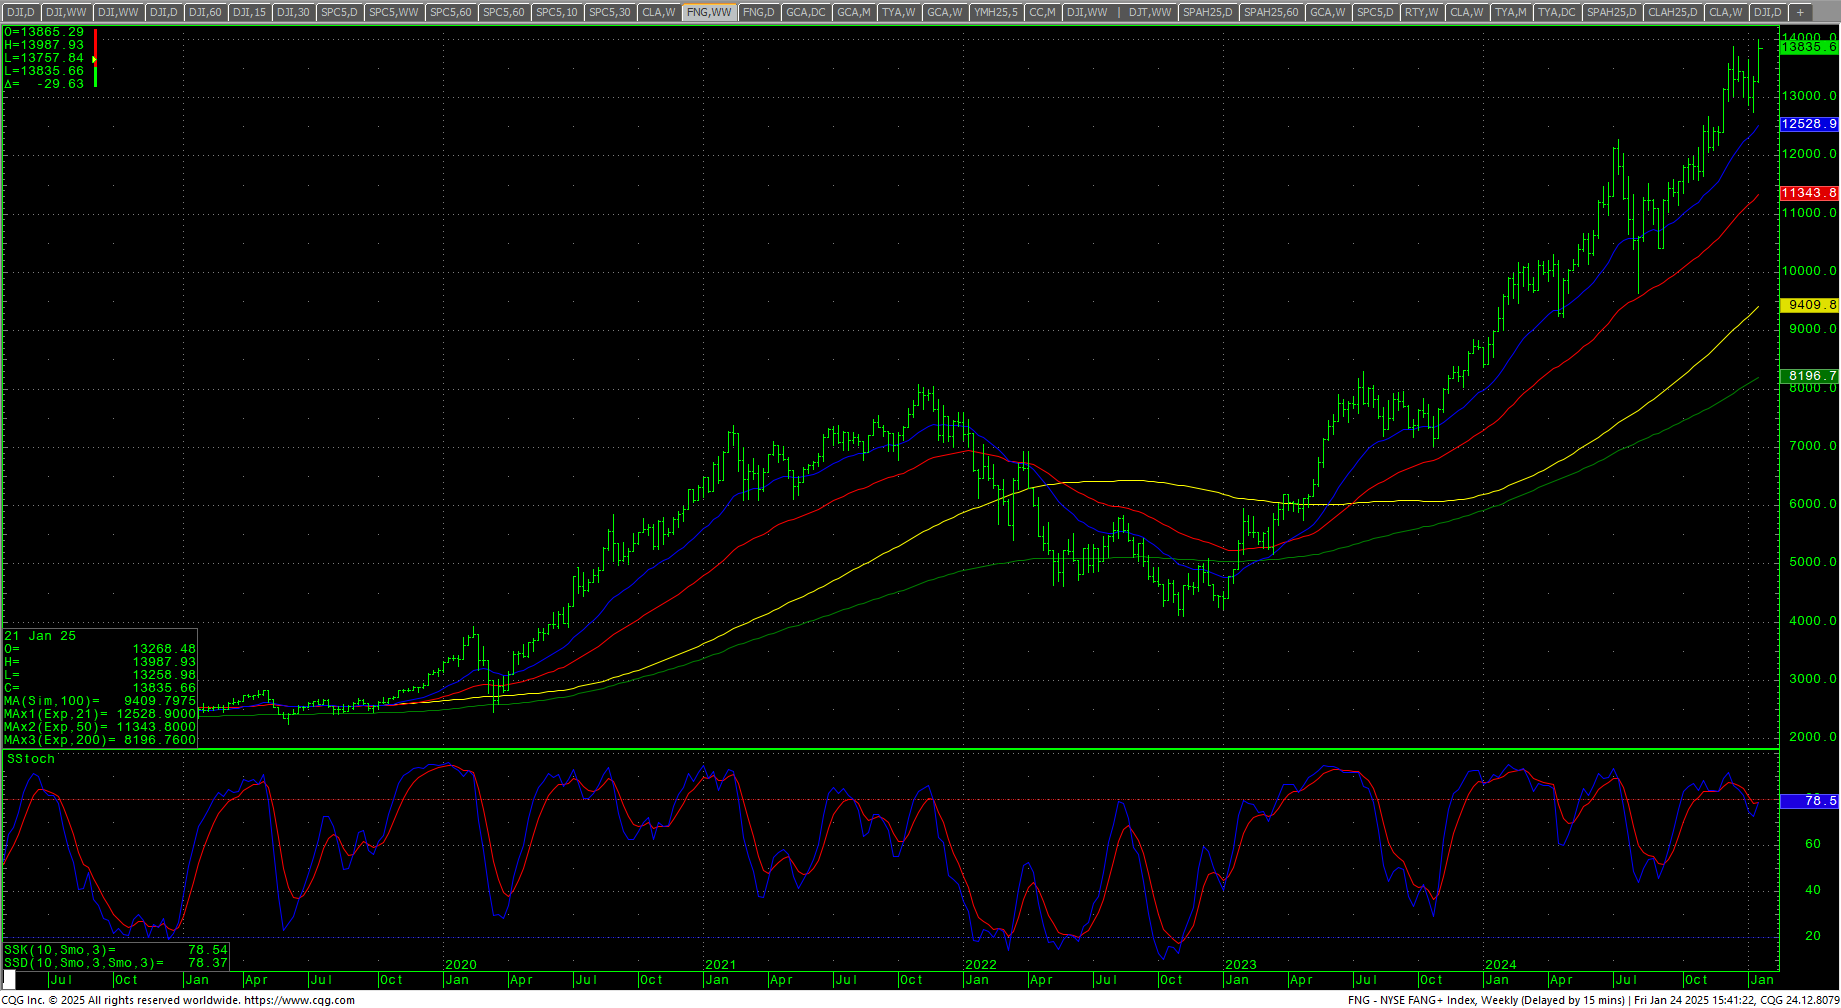
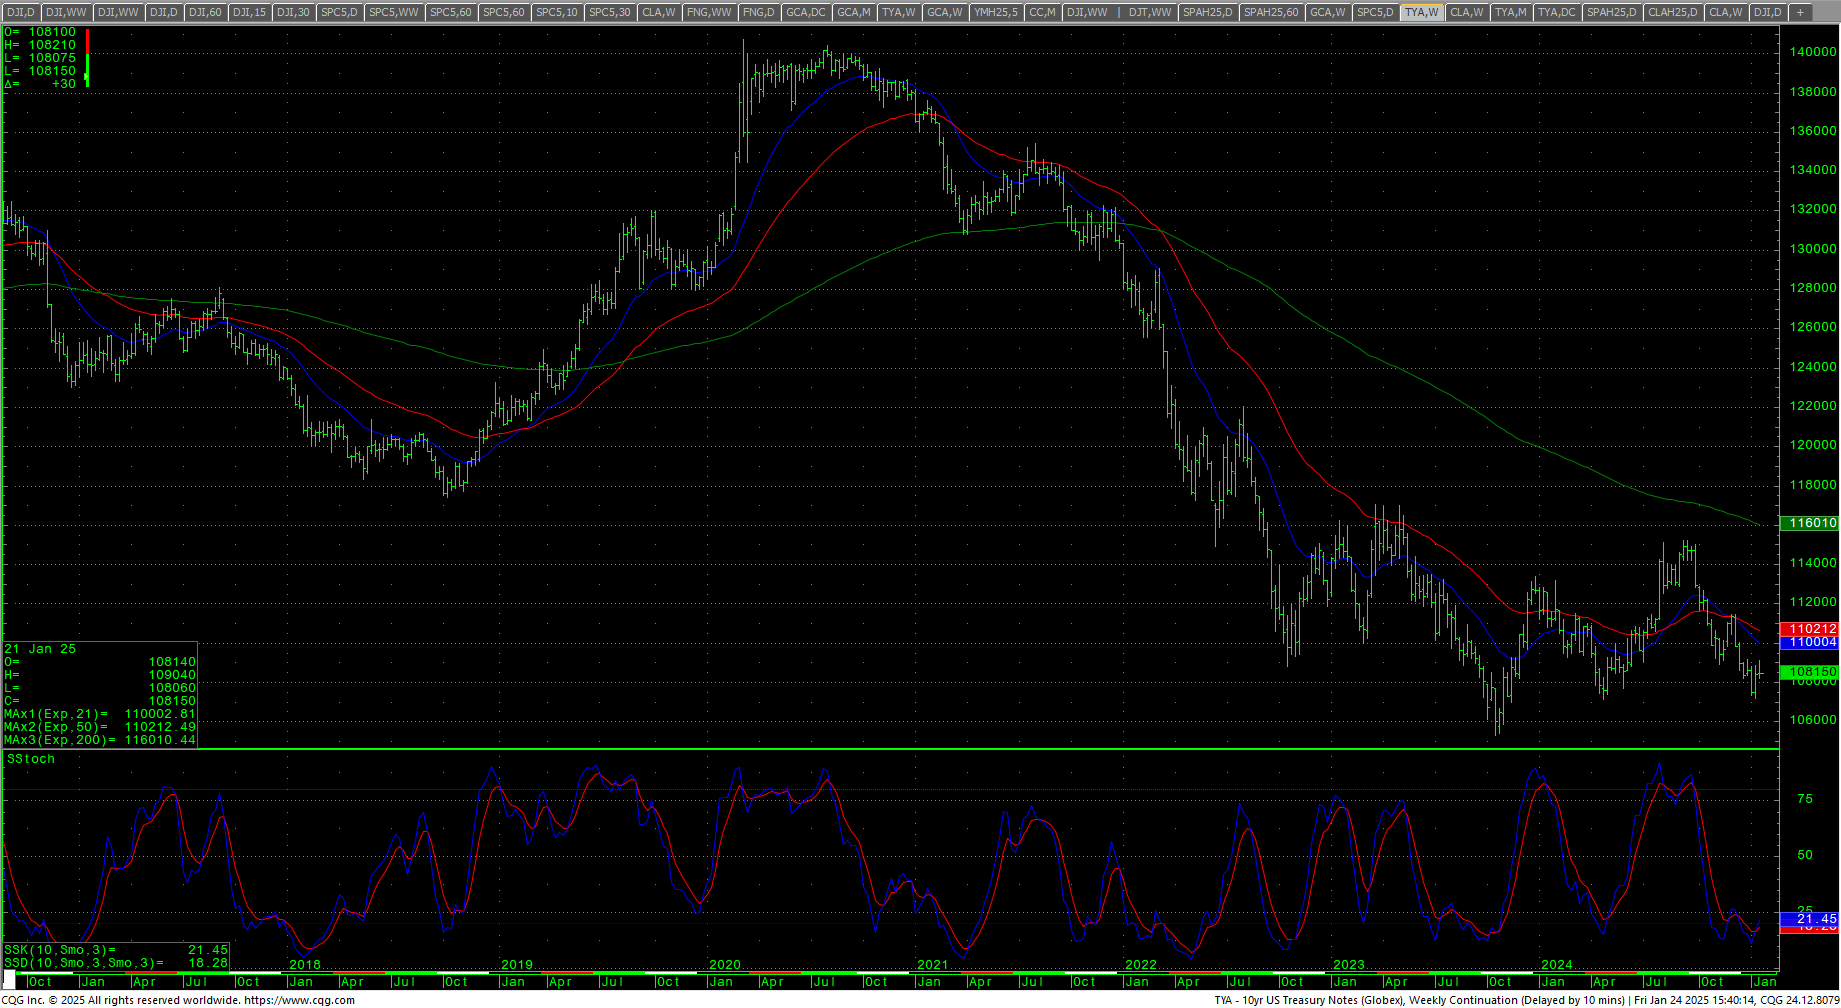
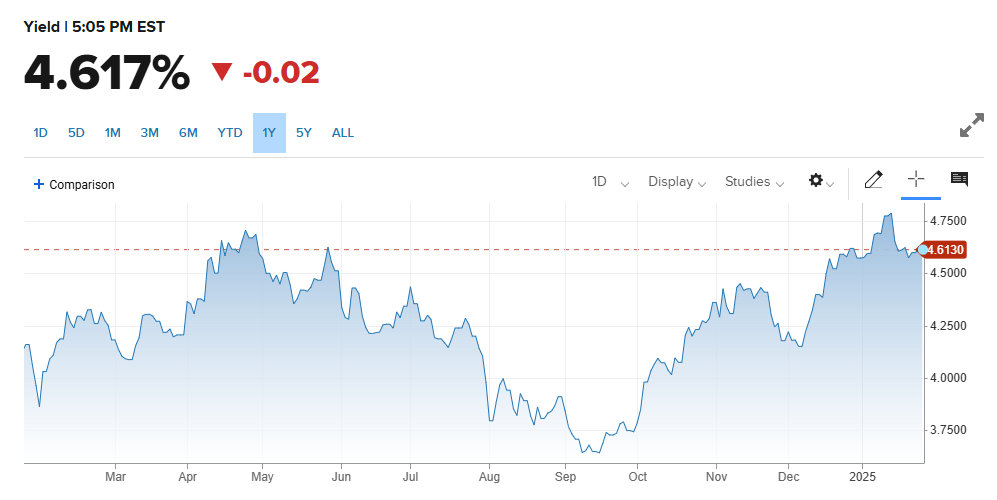
The RSP:SPY closed lower on the week as that chart is testing multi-year lows. The IWM and RSP both traded in very small weekly ranges. Volume was average throughout the week. NVDA traded a wide outside day down on Friday after being juiced mid-week by the “New Paradigm” logic surrounding the so-called “Stargate” initiative which, so far, has only produced the meme coin $Stargate while lacking funds, power for compute and water. But heck, it’s a “New Paradigm?” This meme coin ridiculousness prompted David Einhorn to say we have reached the ‘Fartcoin’ stage of the market cycle. The MAG7 fell short of the highs and also reversed on Friday. Bitcoin is building a flag off its recent surge to a record as this is another market where the “hype” is off the chart. McClellan Oscillators are confirming the recent strength in the Dow and MACD has turned up. The Yield Curve moved slightly higher, ending the week at +0.354% while the 10YR yield closed flat at 4.617%. Truflation dropped sharply to 2.67%.
10YR-2YR Yield Curve Daily

 Warning Signs?
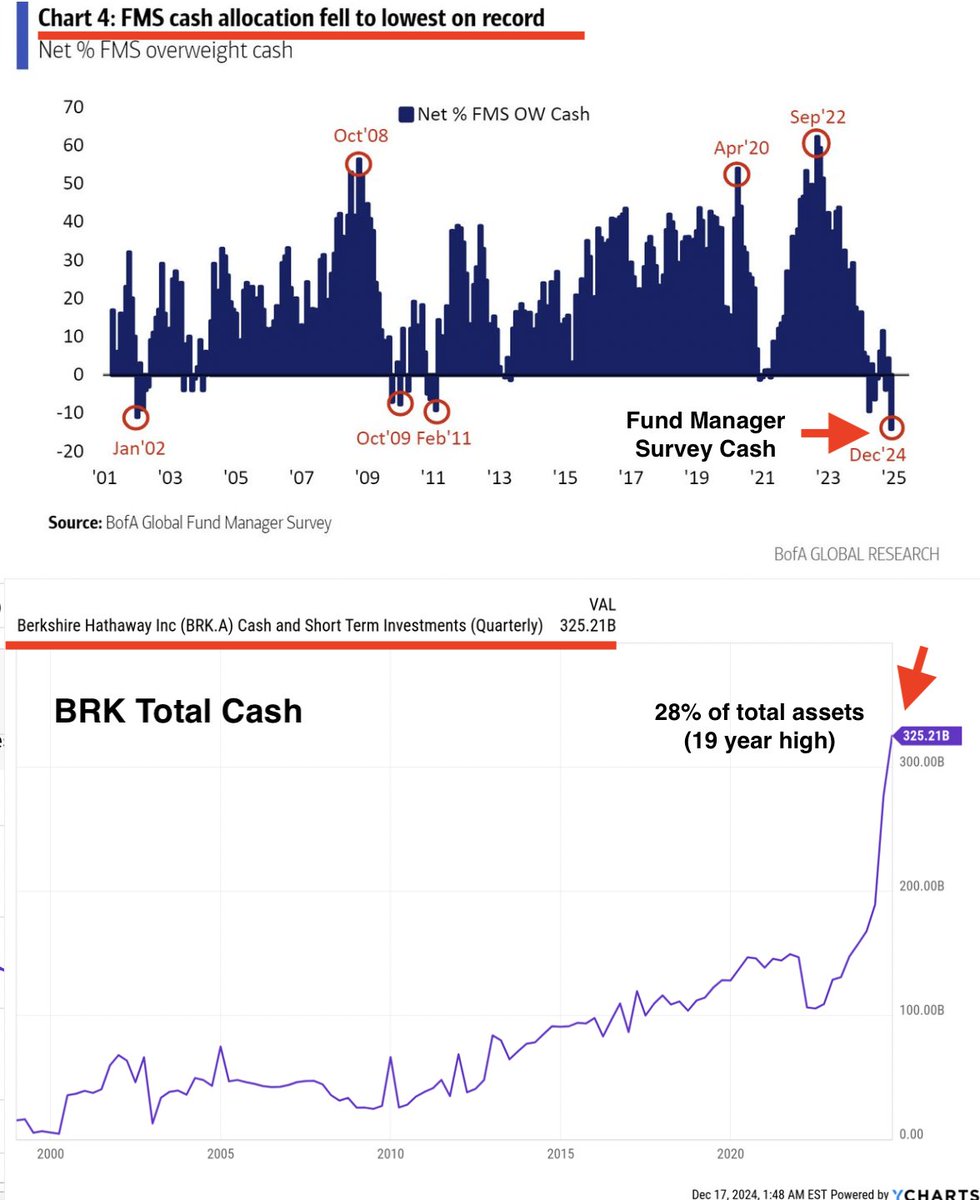
The “Buffet Indicator” climbed to a record high of +209%+ of GDP. Previously, we talked about Berkshire having the largest cash reserves on record. At the same time FMS cash allocation has hit record lows.
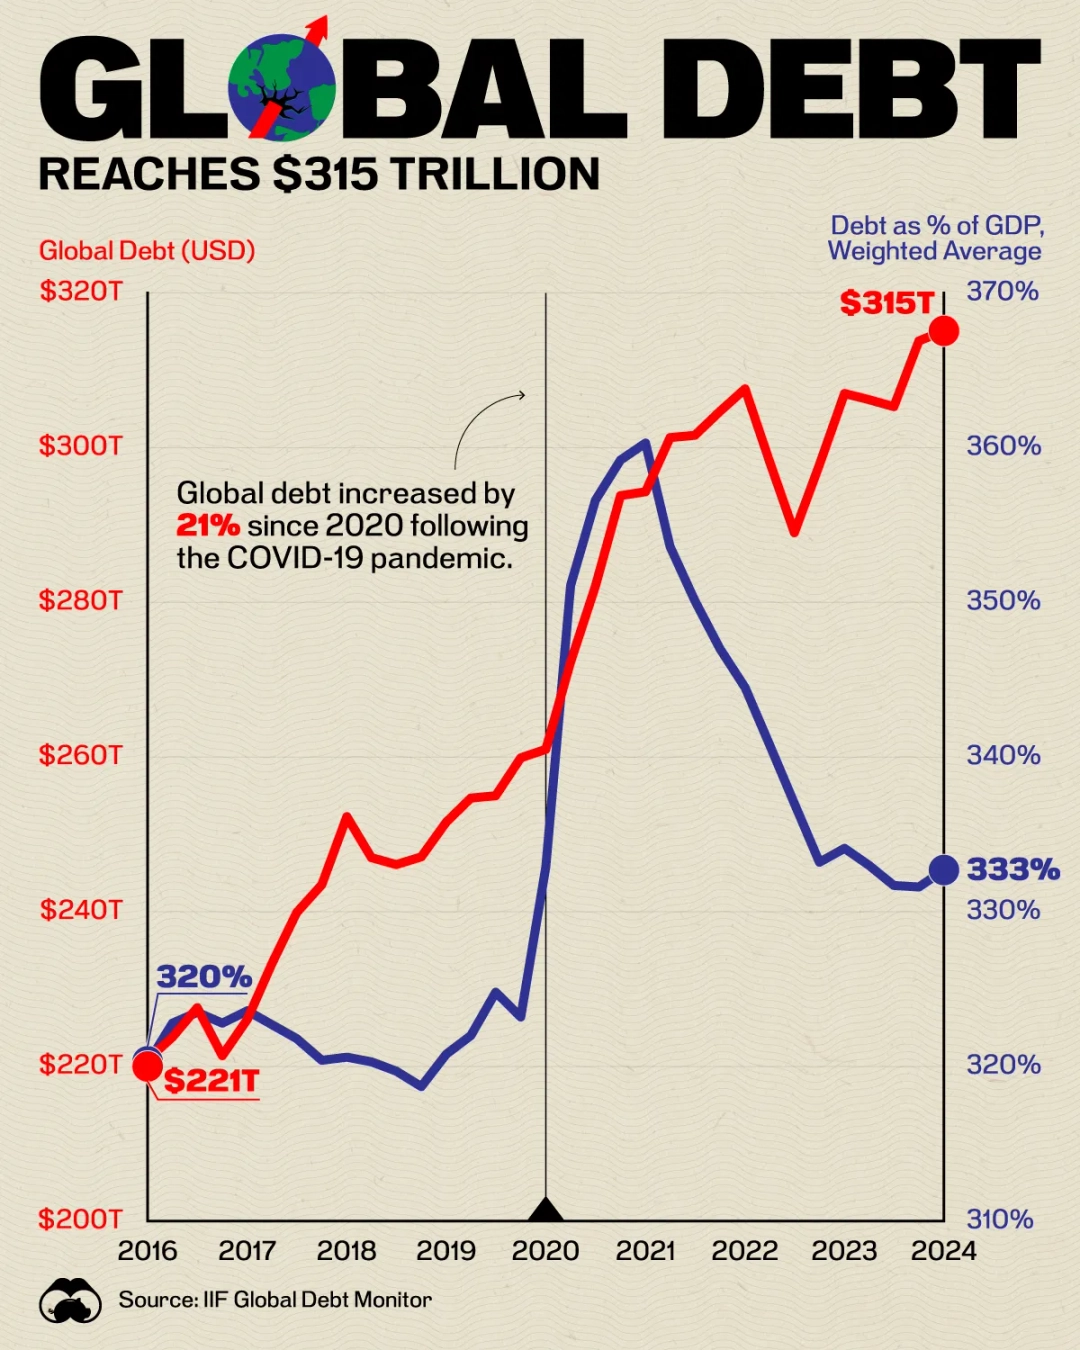
 This is happening as global debt has crossed the +$320 trillion level.
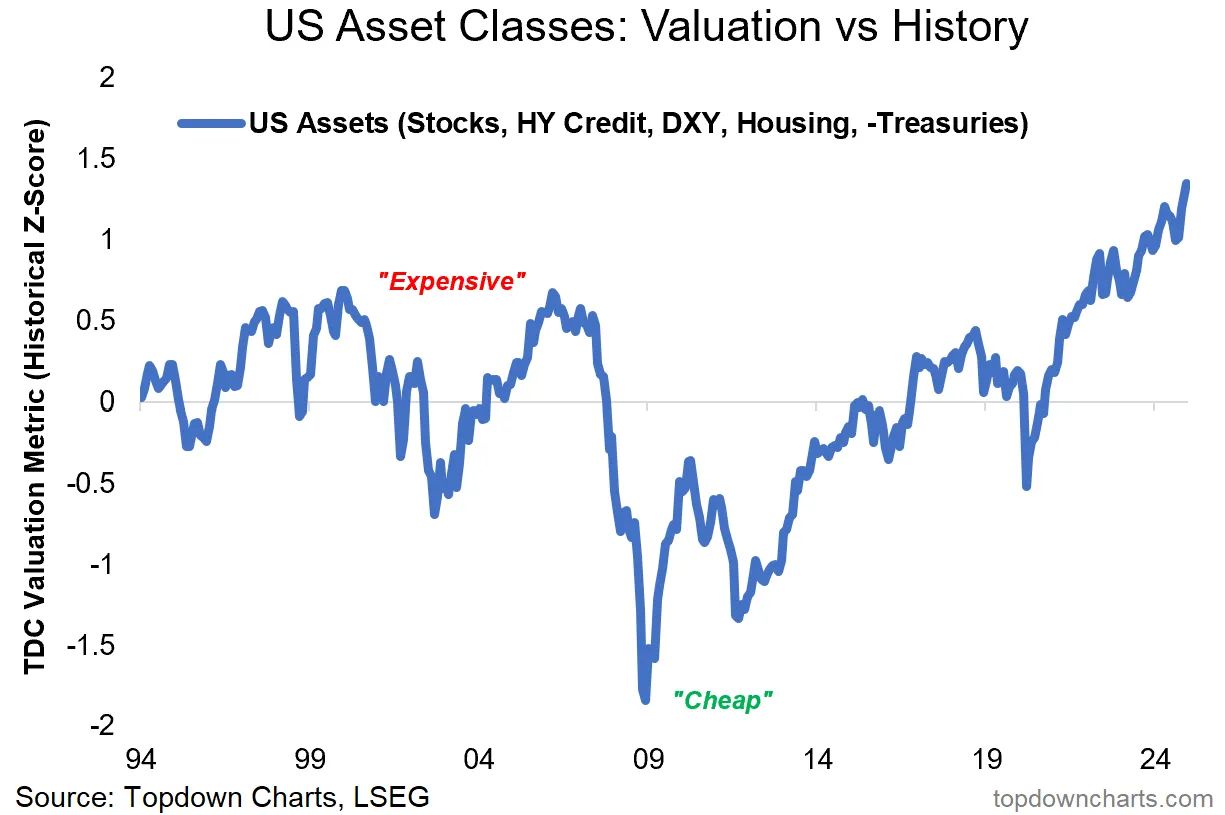
 U.S. Valuations have hit all-time highs.
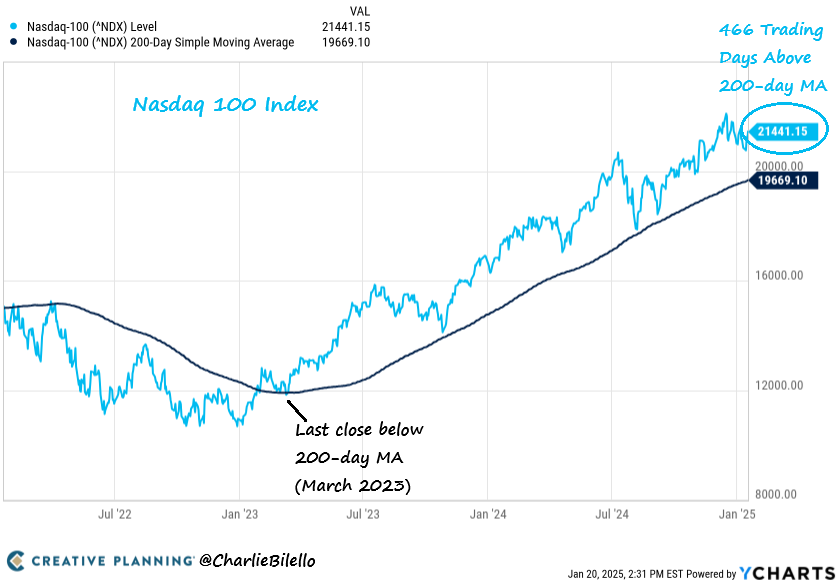
 The Nasdaq is in one of the longest uninterrupted trends above the 200-day MA. (Bilello)
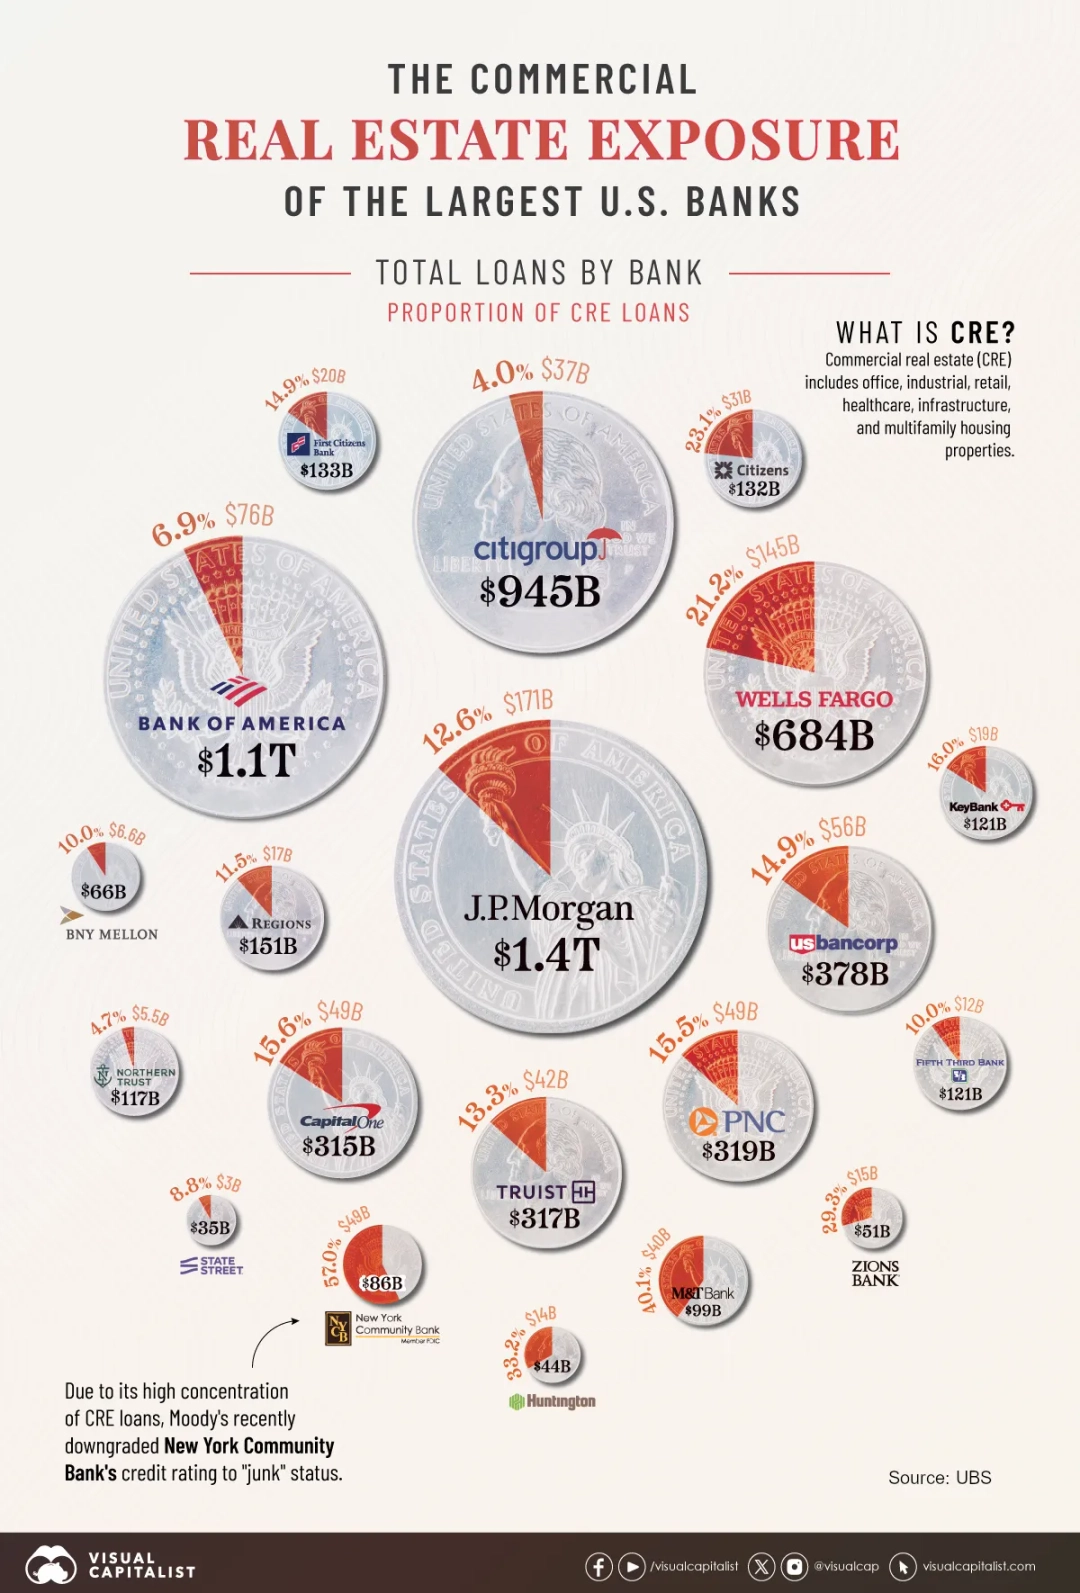
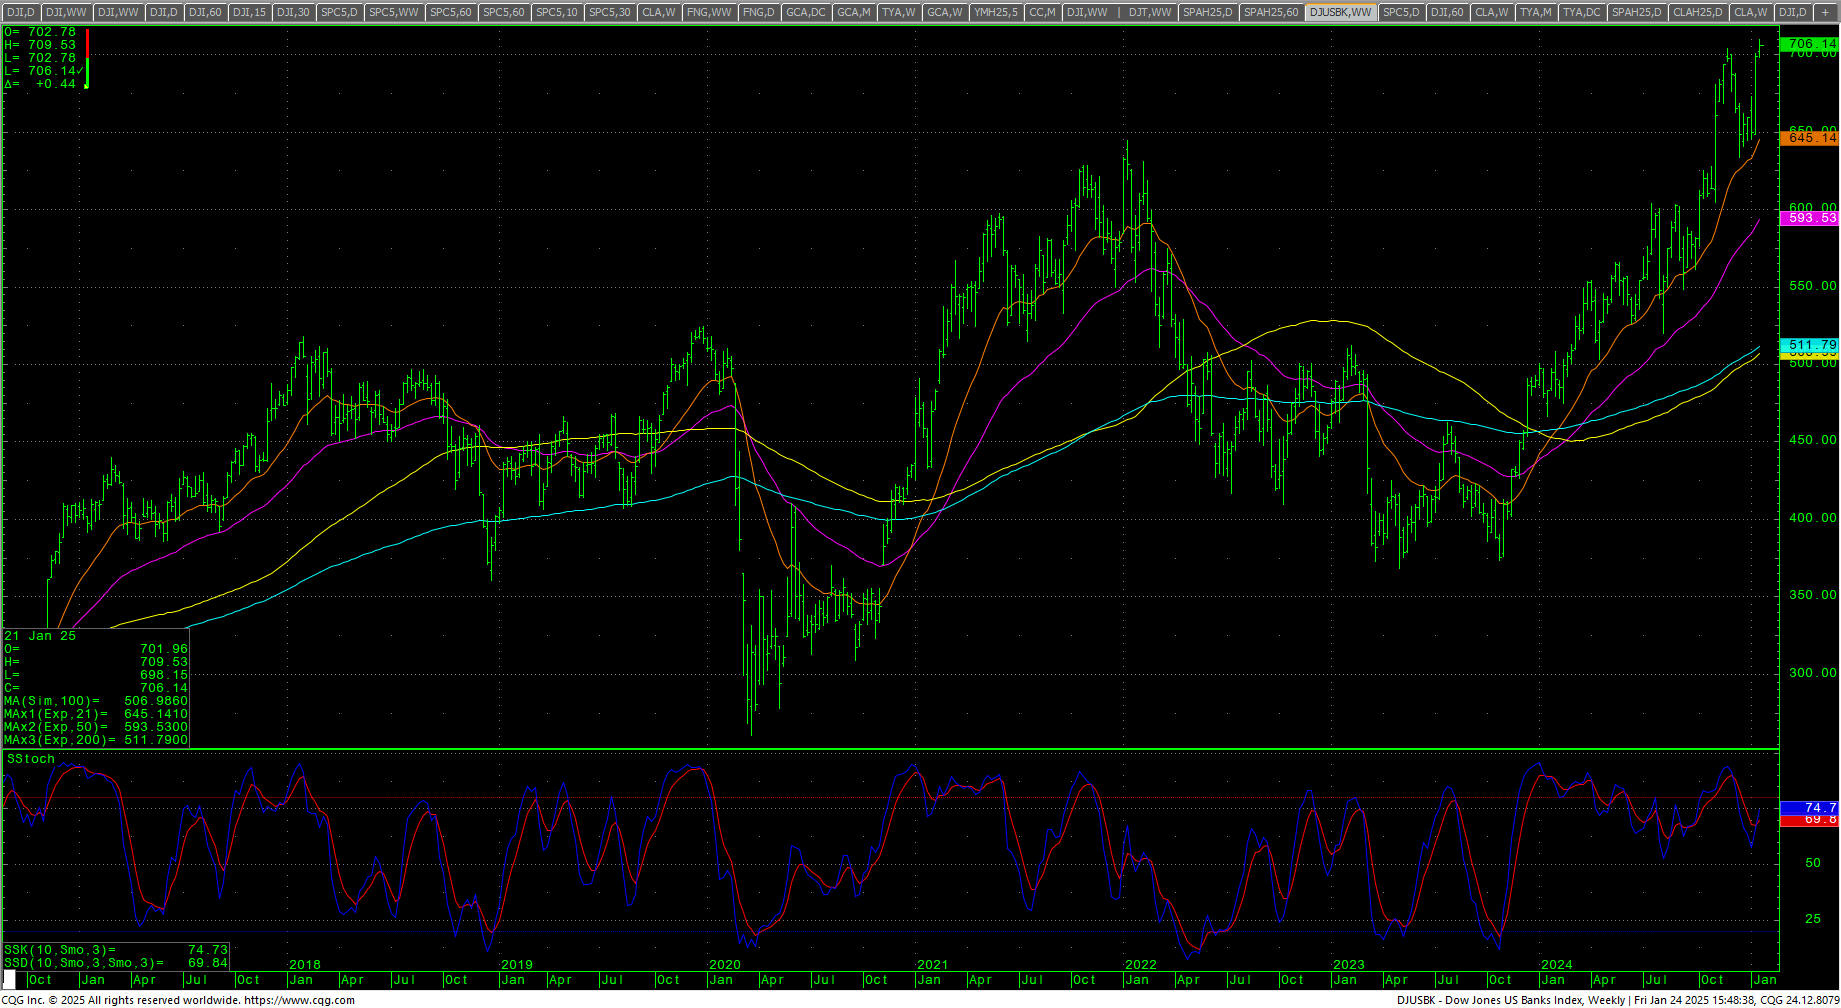
 U.S. banks hit record highs last week while they remain exposed to Commercial Real Estate.
 VIX Weekly H-L-C
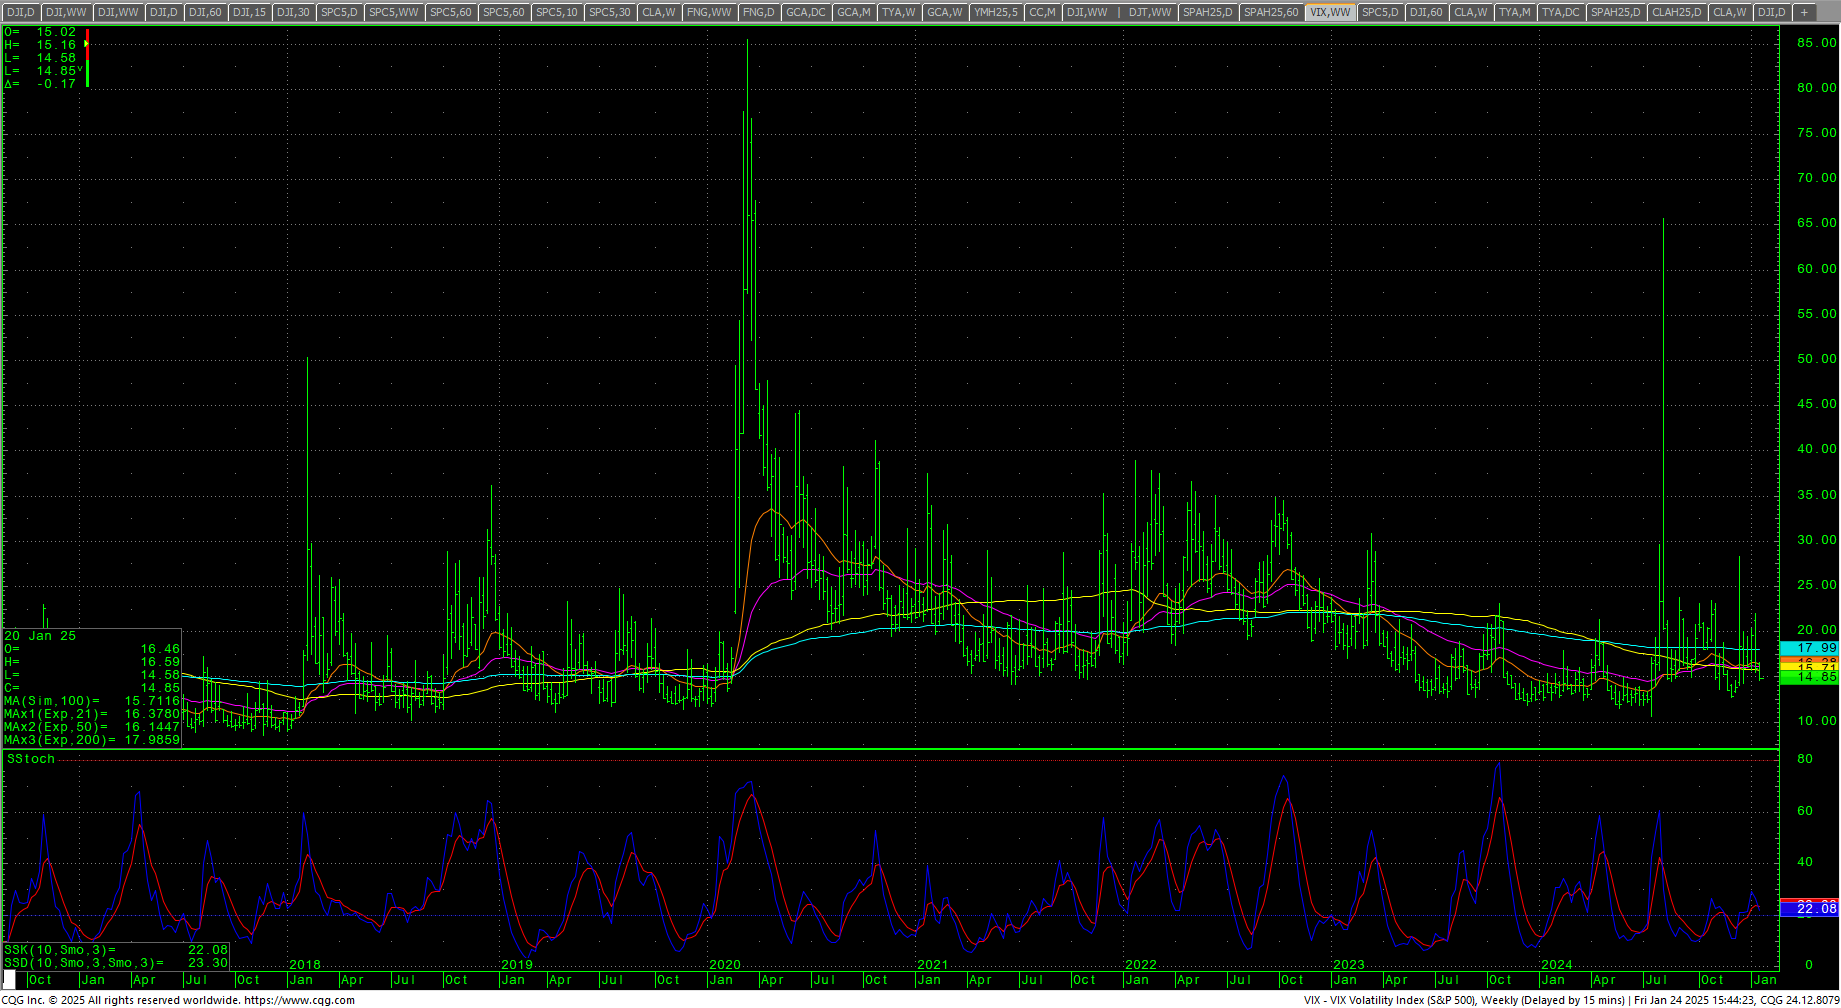
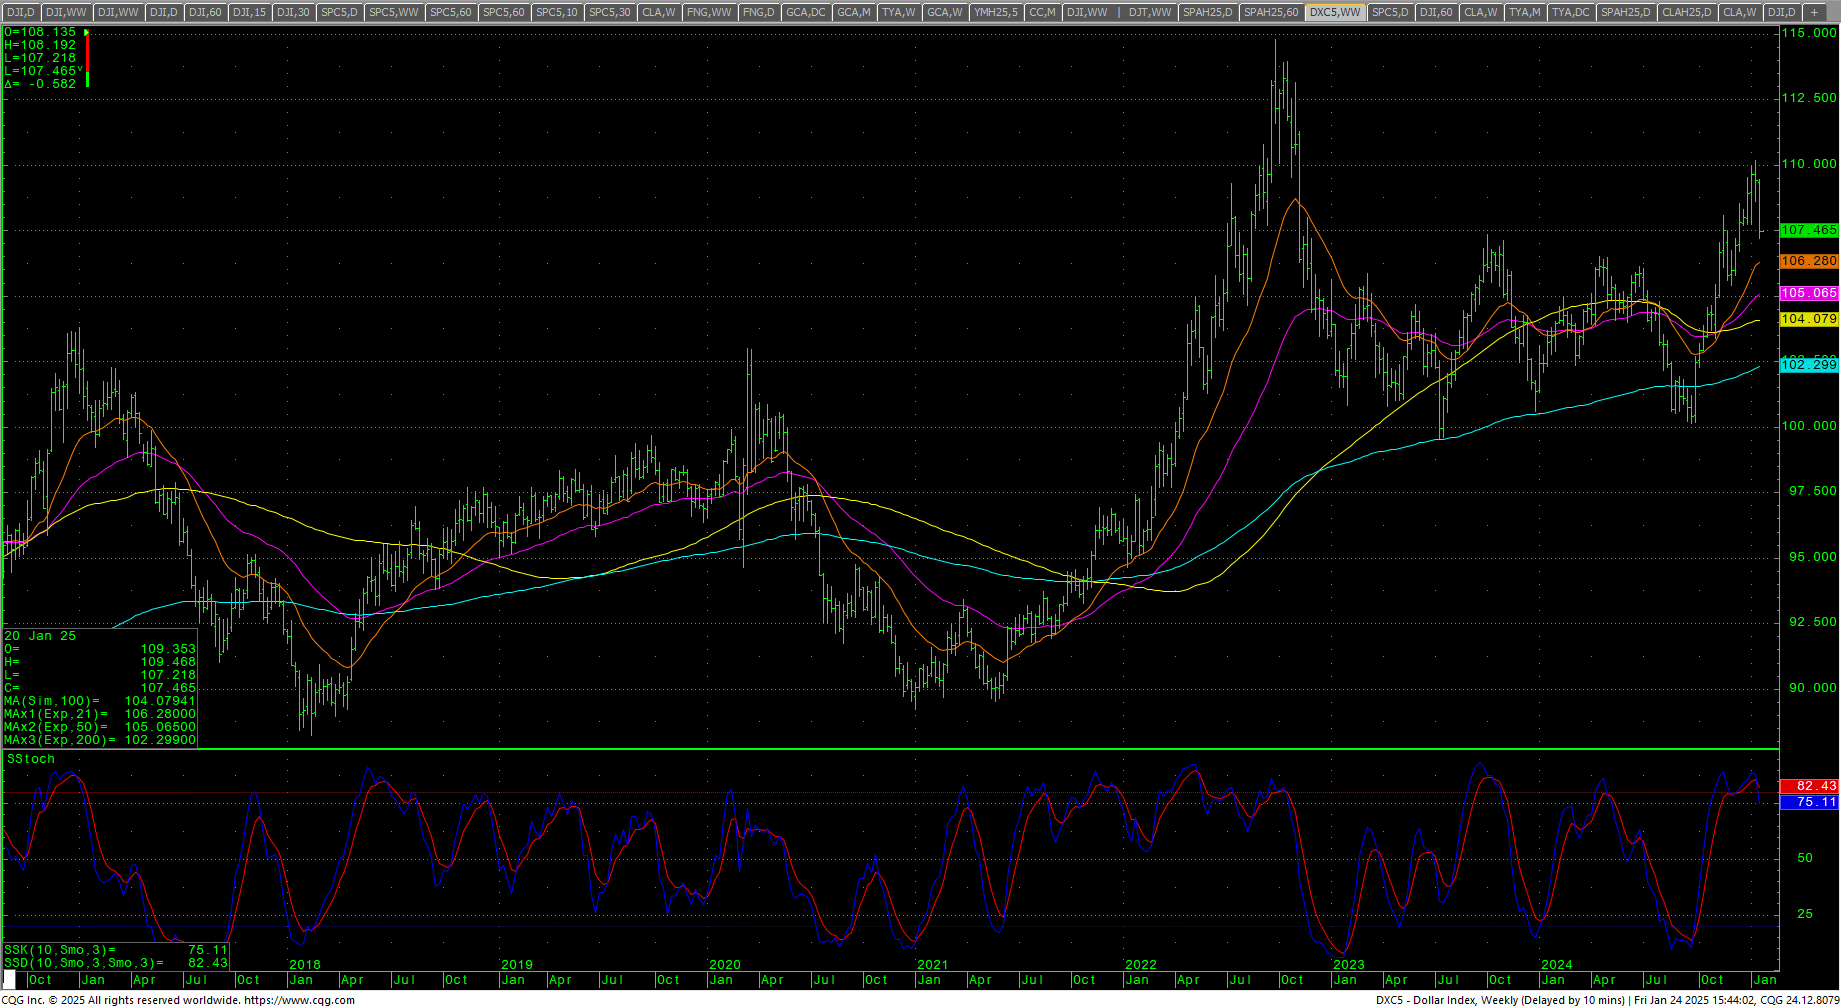
The VIX was lower all week and closed on the lows, moving to a 5 week lows. The US Dollar sold off sharply and closed on the low end of the week’s range.
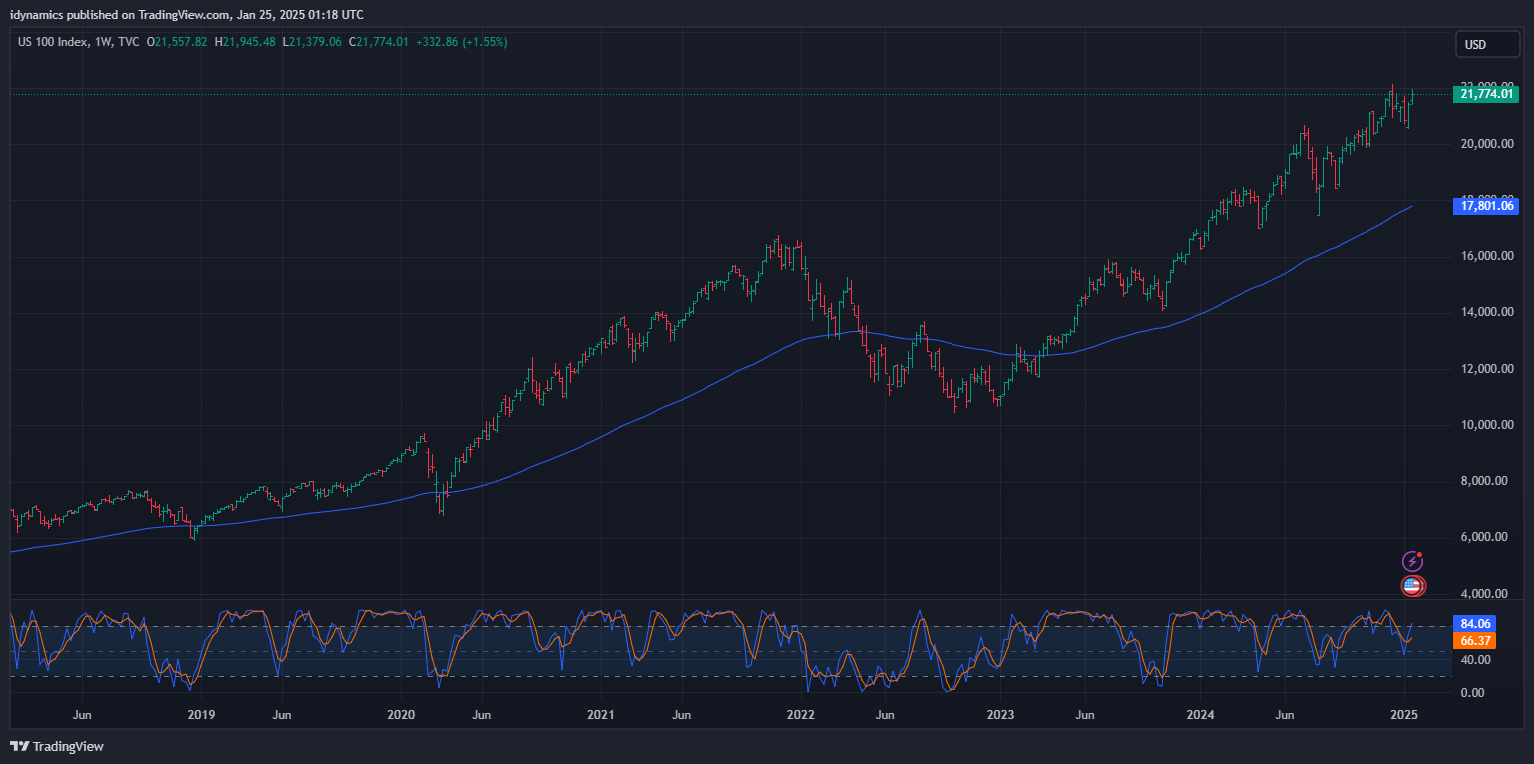
 Nasdaq 100 Weekly H-L-C
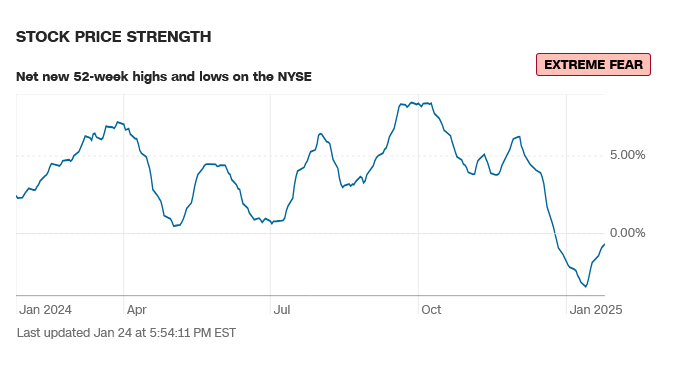
52-Week A/D Line

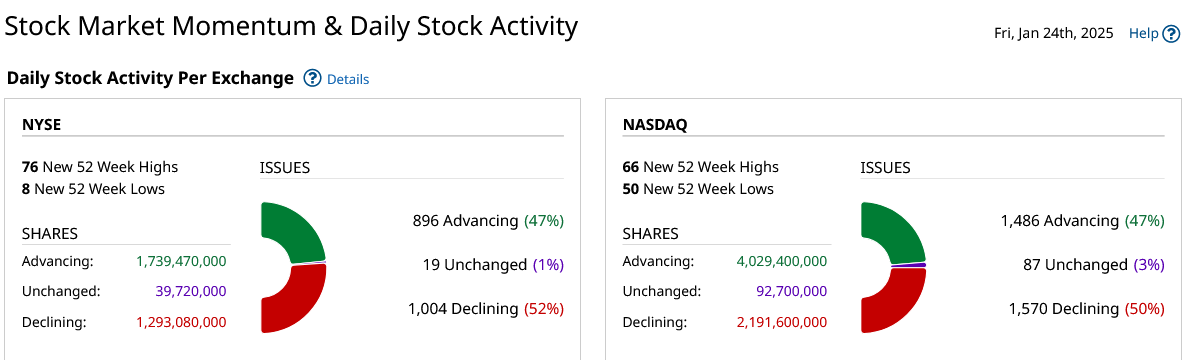
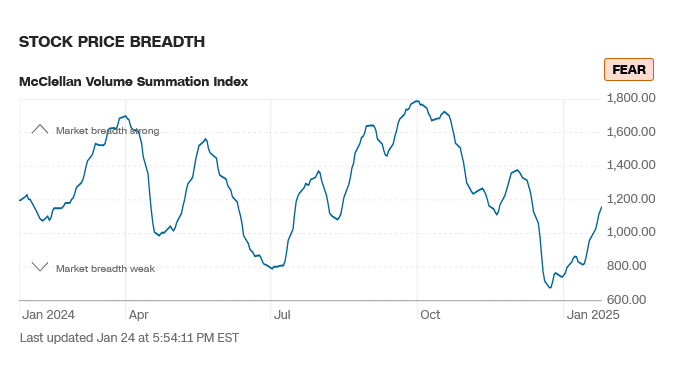
Breadth is mixed. Sentiment has moved to fear.
CNN Fear & Greed Index
 AAII Investor Sentiment Survey
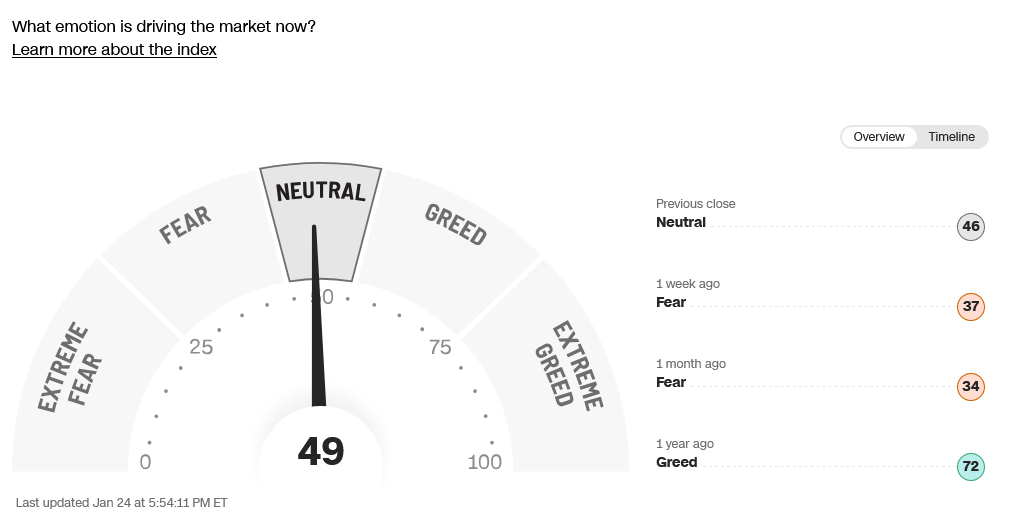
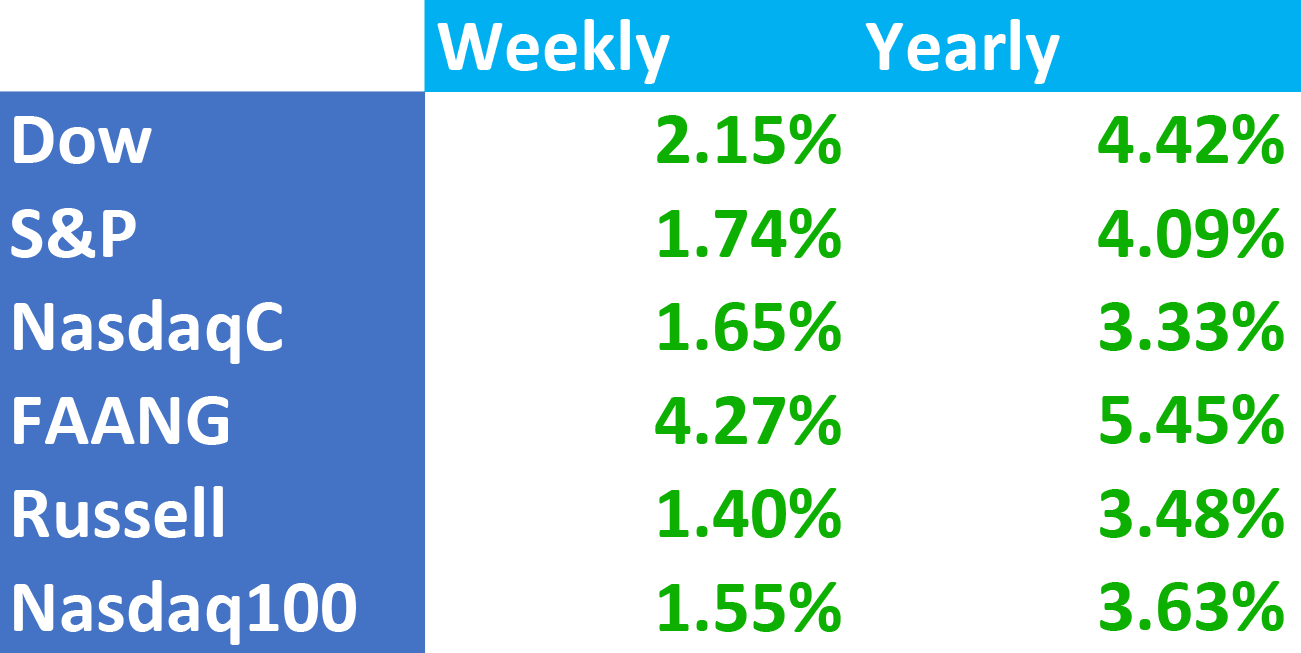
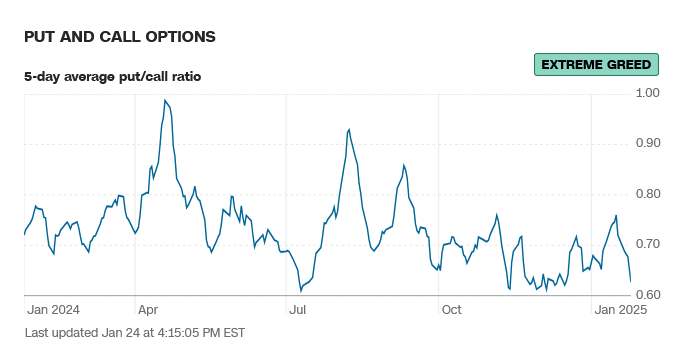
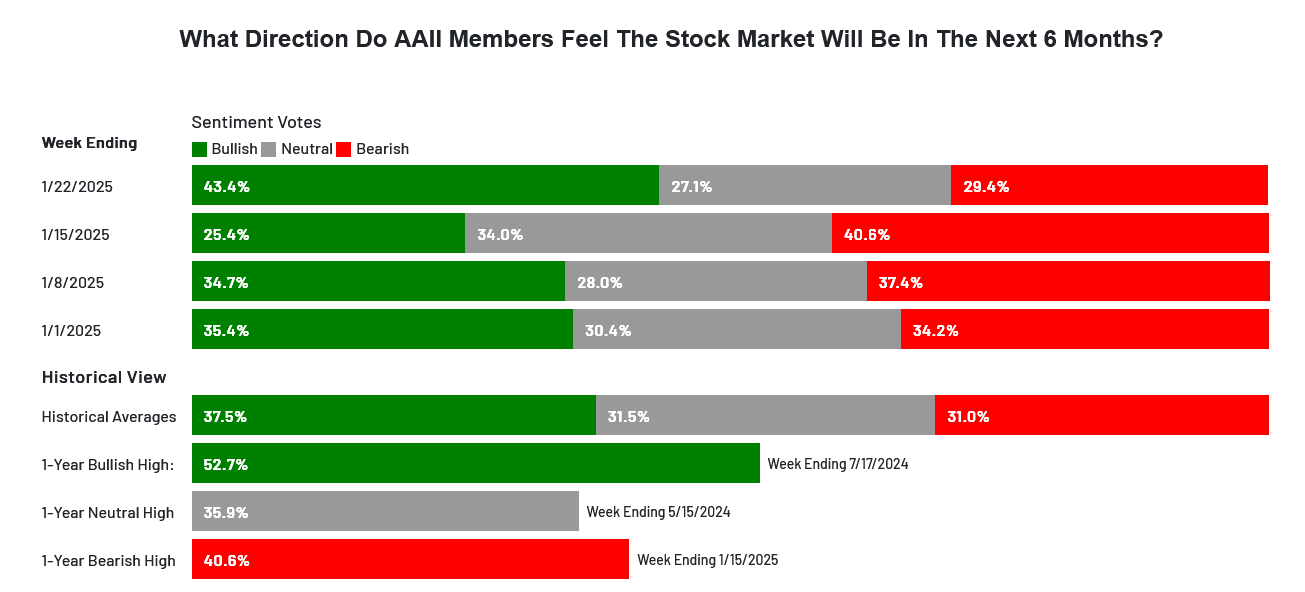 Sentiment has improved and moved away from fear and extreme fear. The CNN Fear and Greed Index moved to dead neutral. Breadth improved and remains weak but off the late 2024 lows and now shows fear. Latest AAII Sentiment Survey: Optimism Skyrockets. The Dow A/D ended at 6736 which is a new high and the MACD is up. The VIX ended lower and closed on the bottom of the range. The Put/Call is at 0.63 and now reads extreme greed. The 52-week, A/D is still moving off one-year lows and is negative at -0.68% and still reads extreme fear. The Dow closed the week up +2.15%, closing on the top of the weeks range. The S&P was up +1.74% on the high end of the weekly range at a new record high close. The Nasdaq Composite was up +1.65% and the Nasdaq 100 was up +1.55%. The FANG was up +4.27% on upper end of the weekly range at a new record high close. The Russell closed higher, up +1.40% on the top of the range. The 10-year notes closed flat, on the lower end of the range. The yield on the 10YR was flat at 4.617%.
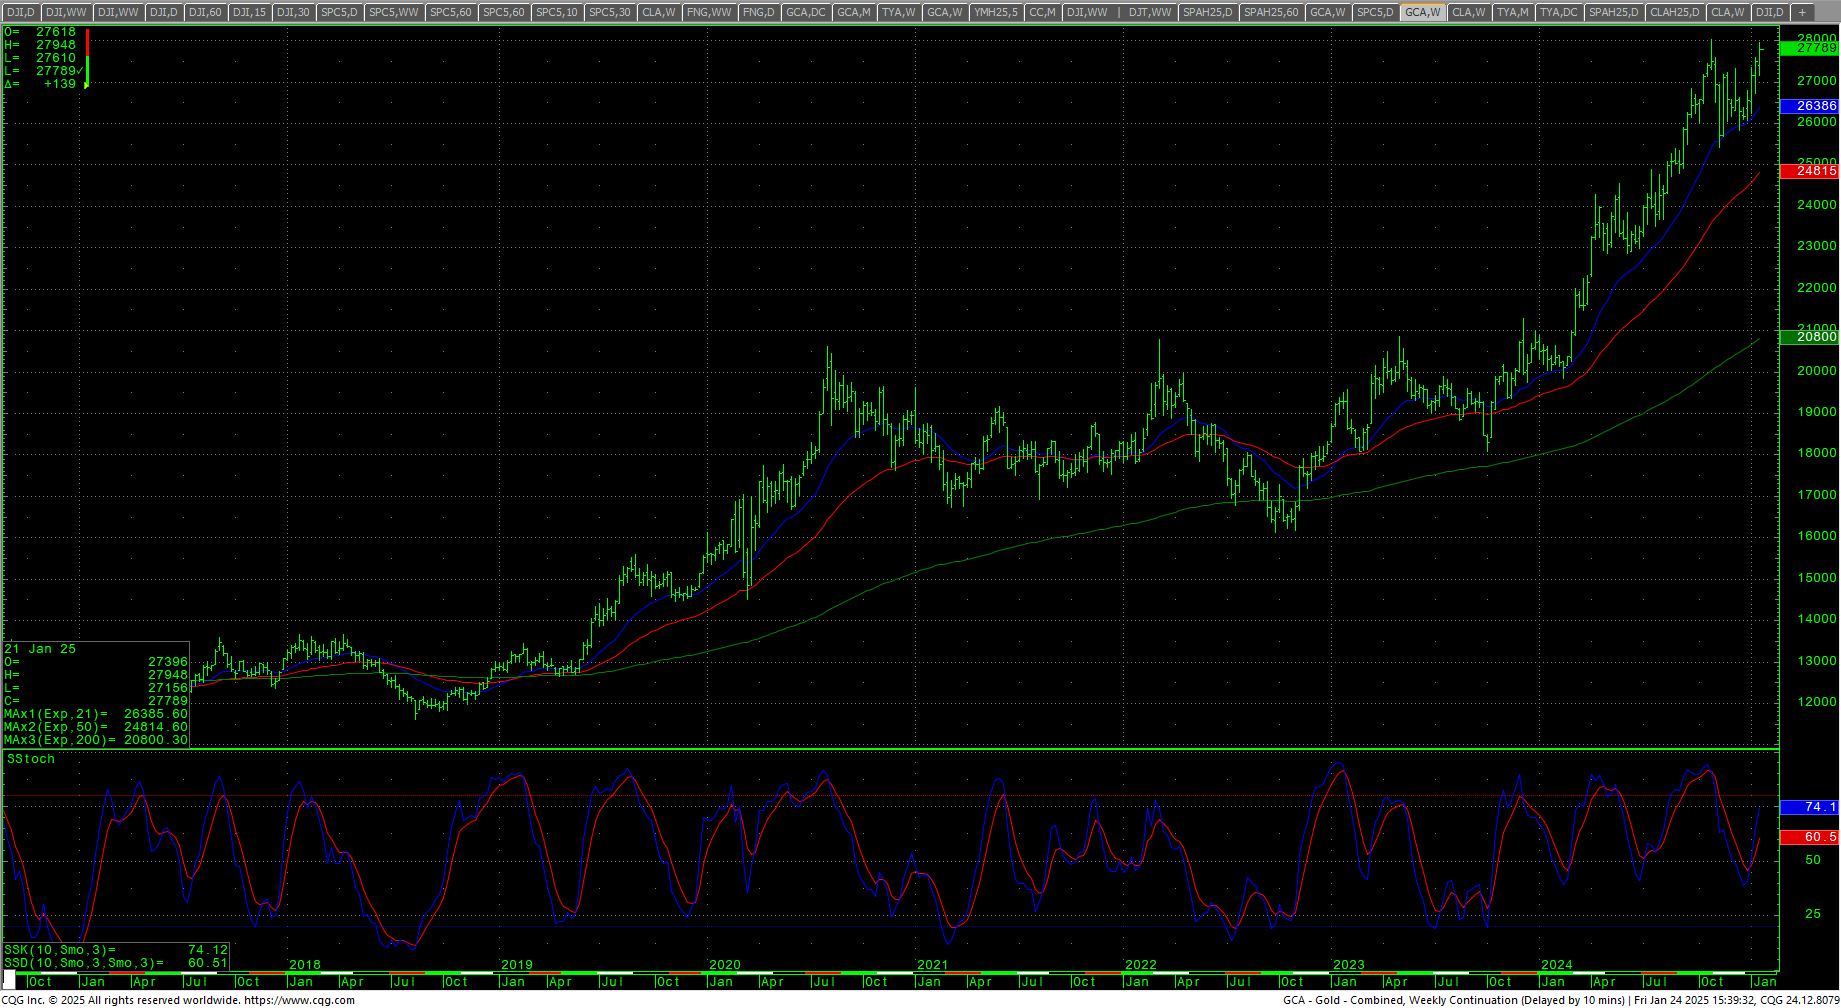
 Gold Inflation-Adjusted Closes Monthly
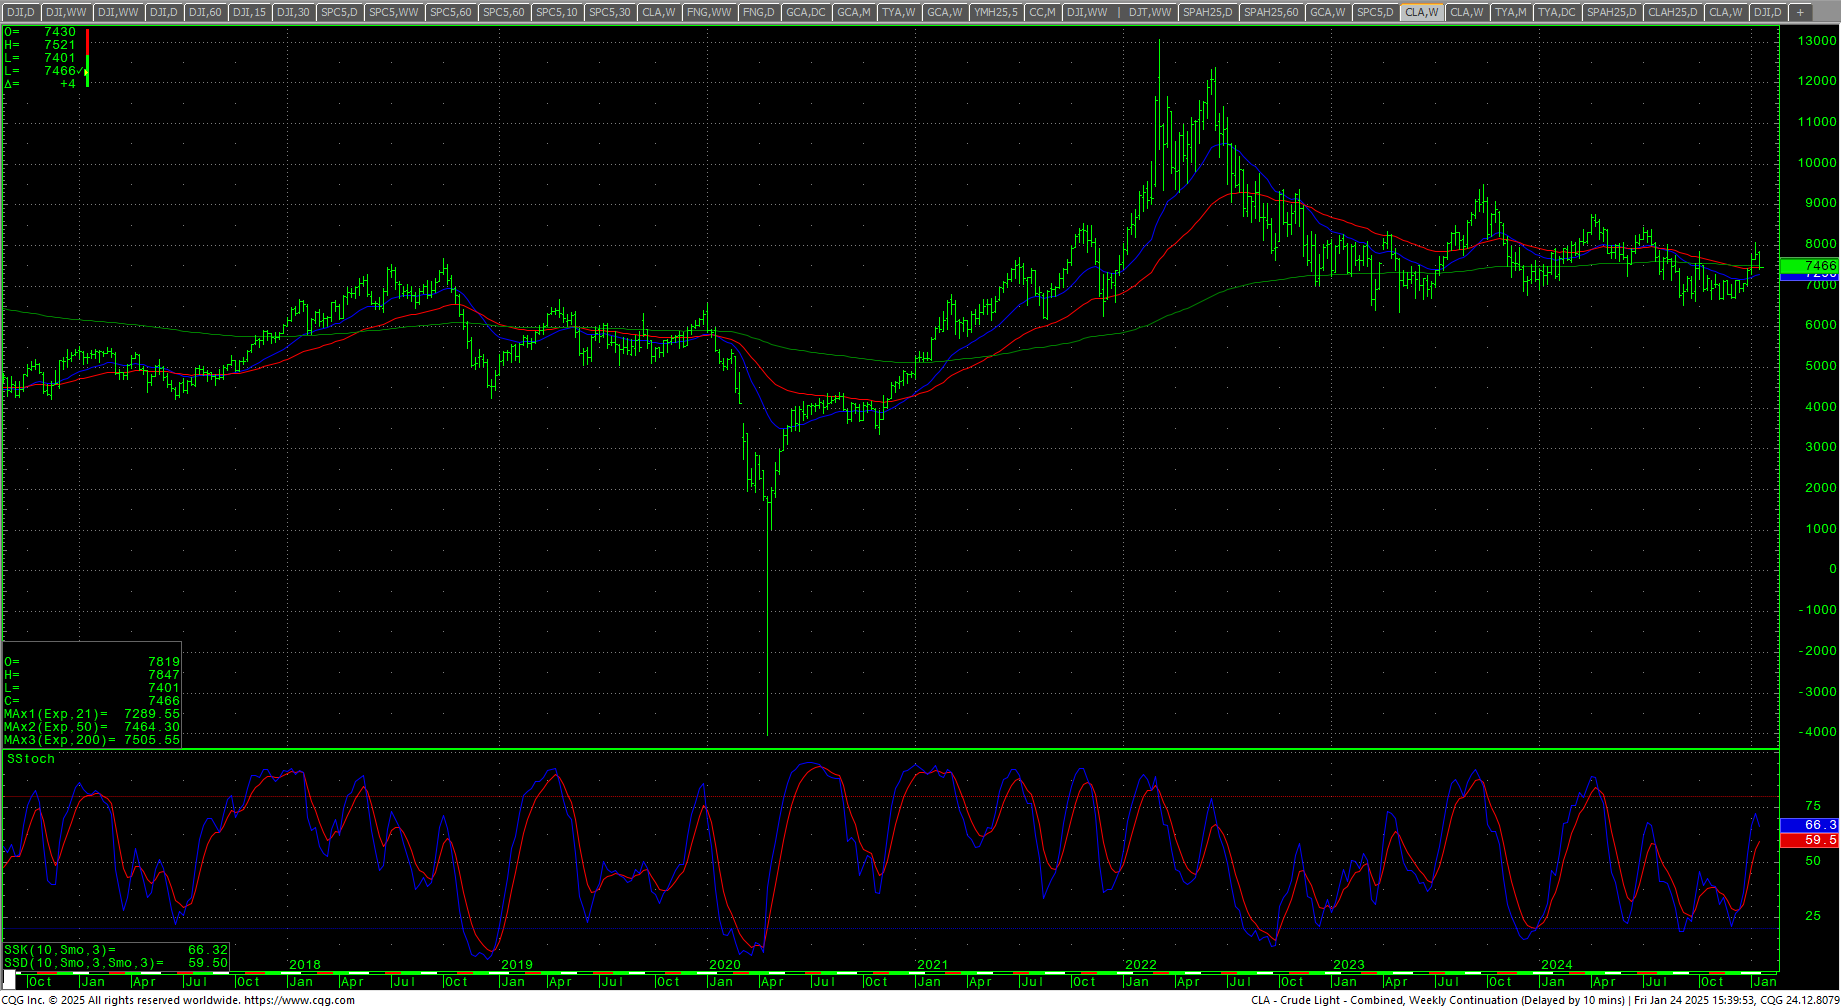
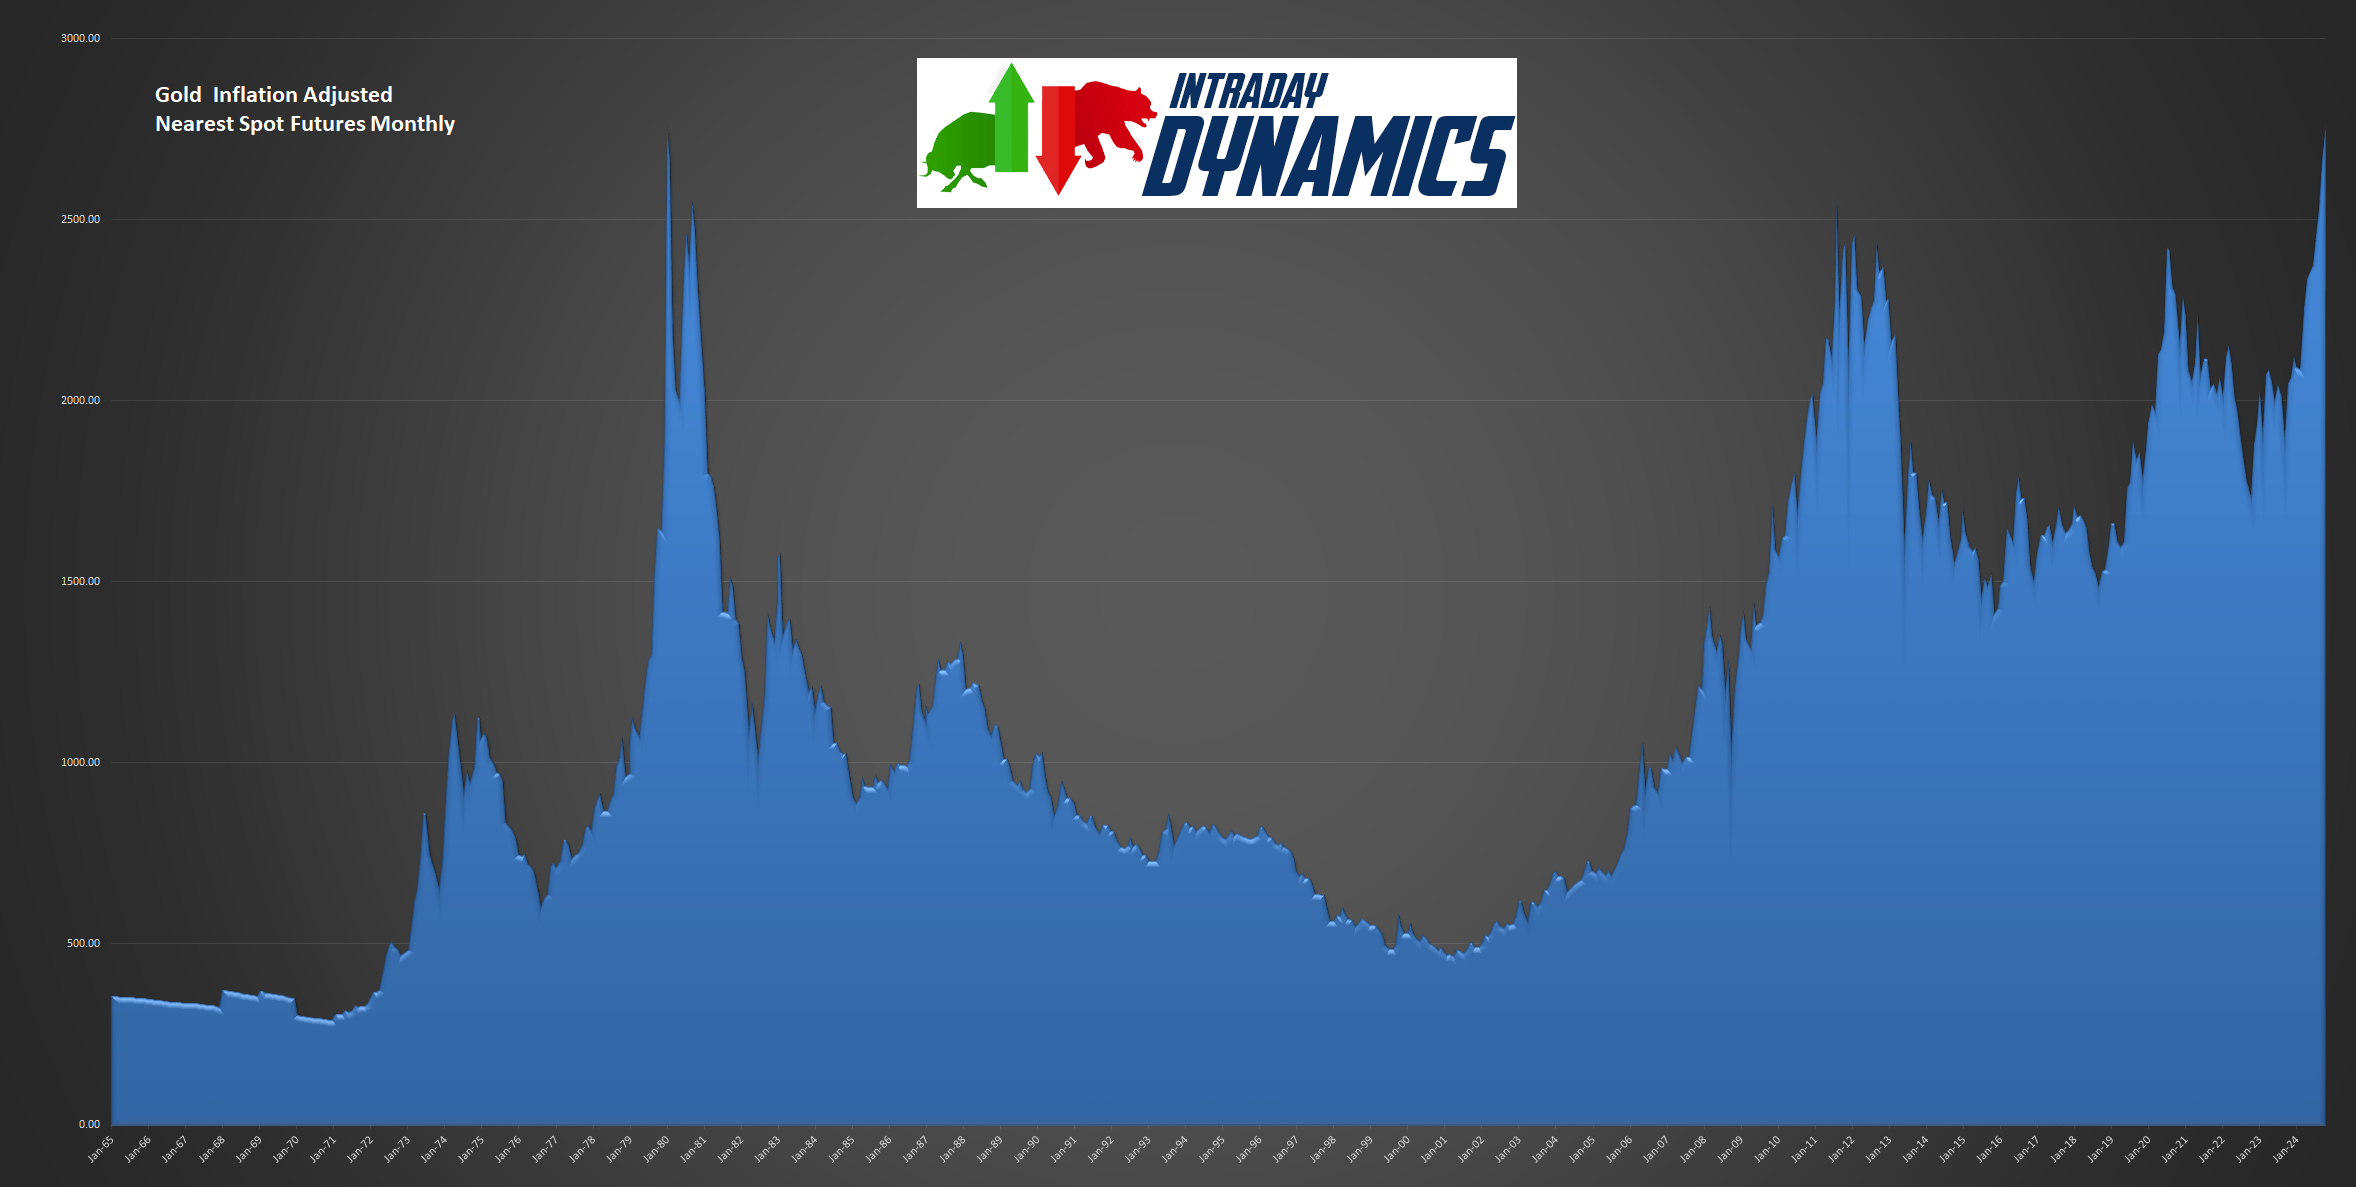 The CRB Index edged lower as crude declined, settling down -0.56. Crude oil declined most of the week and closed on the low end of the range, back under $75. Gold rallied and closed at a new record high weekly close. In addition, spot gold has now taken out the 1980 inflation adjusted highs with last weeks trade. The CoT for the S&P 500 shows asset managers continuing to sell with dealers still buying. The CFTC S&P 500 Non-Commercial Net Positions ended at -75.7K which reflects short selling. Sellers have a 6-day window right now.
Timing Points
This Thursday/Friday marks critical timing and has the potential to see high volume and/or wider ranges and volatility.
- 01/30-31 *** X critical
- 02/06 **
- 02/12 **
- 02/19 ***
- 03/03-05 *** X critical
Dow Jones Industrial Average
Dow Jones Industrial Average Daily Candles
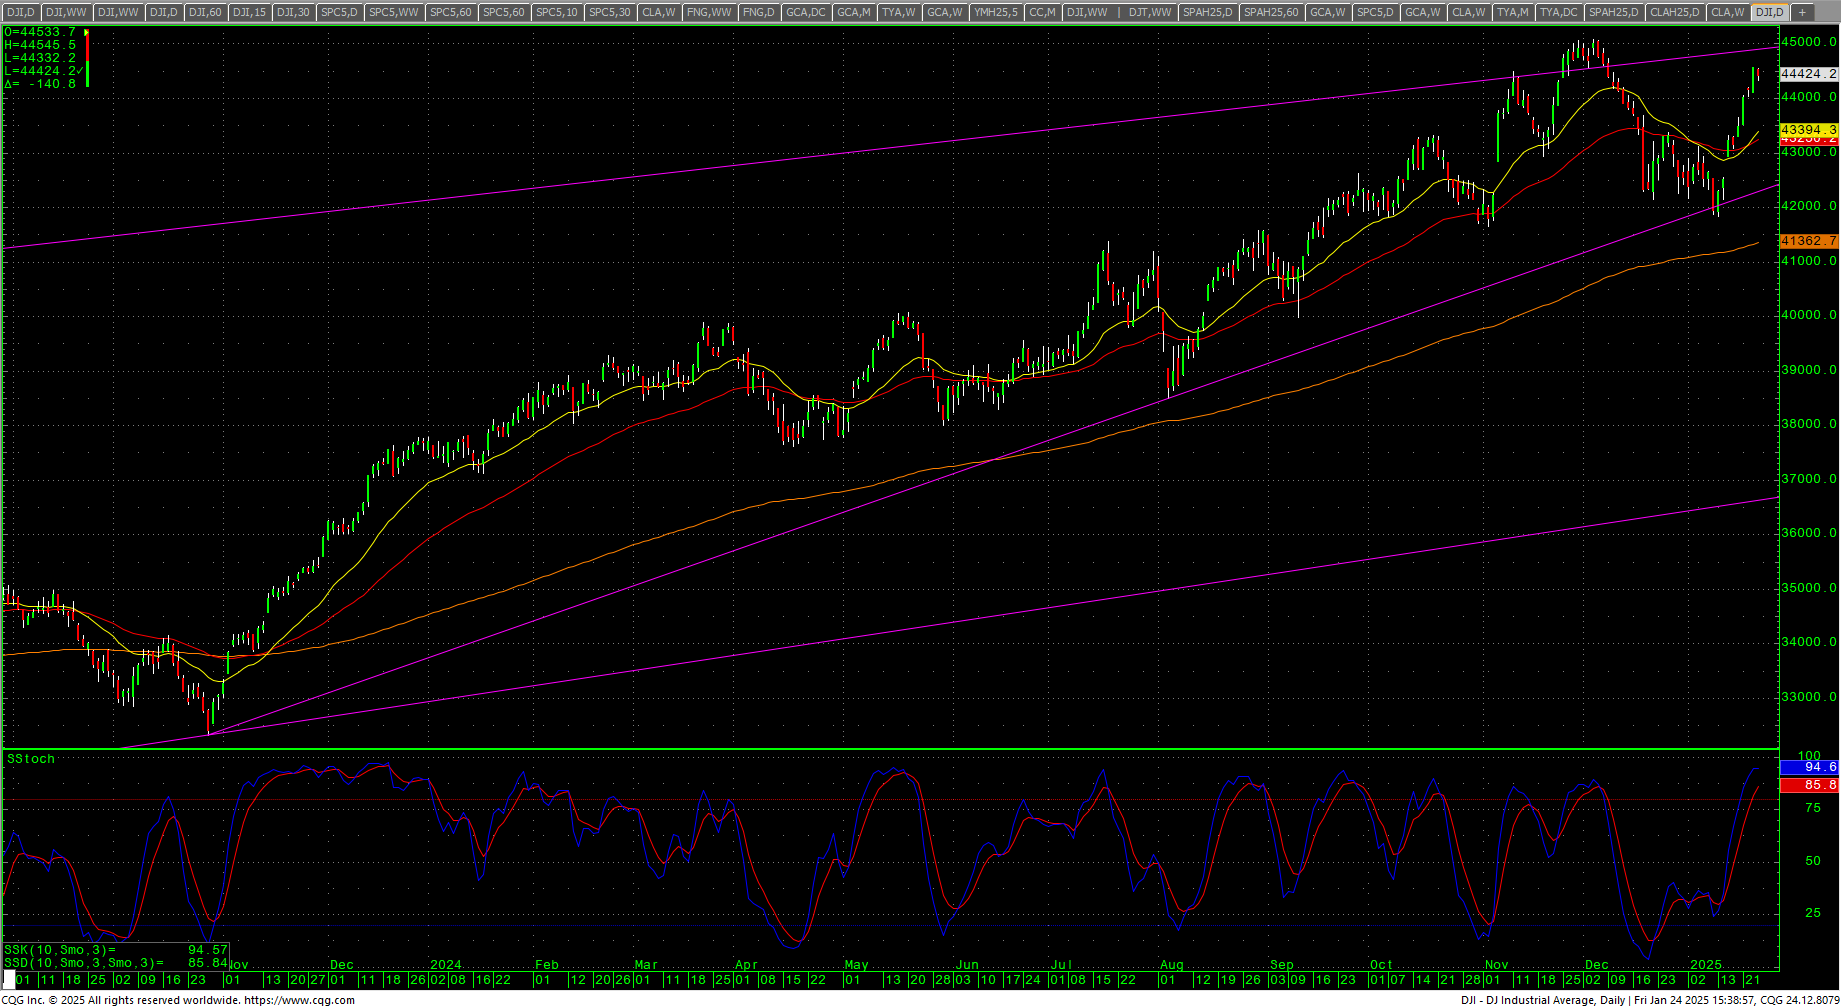 The Dow traded higher all week with Thursday’s minor timing creating a pause to relieve some of the overbought conditions. The 21-day MA crossed back above the 50-day MA. The weekly remains in a sell signal but has reached a neutral reading. The hourly ended the week overbought but relieving overbought conditions. The 200-day MA starts the week at 41363.
Dow Jones Industrial Average Weekly H-L-C
 Prices took out a key band of resistance at 44274 through 44320 and closed just above that area. Continued rallies have full potential to carry to the intraday trading highs against the 45073/45074 level. Closes over 45074 opens counts toward 45244 and 45426 (Fibonacci target). Rallies with closes over 45426 will reopen longer-term monthly targets in the 47400 level with targets of 46568 and 46954.
Dow Jones Industrial Average Hourly H-L-C
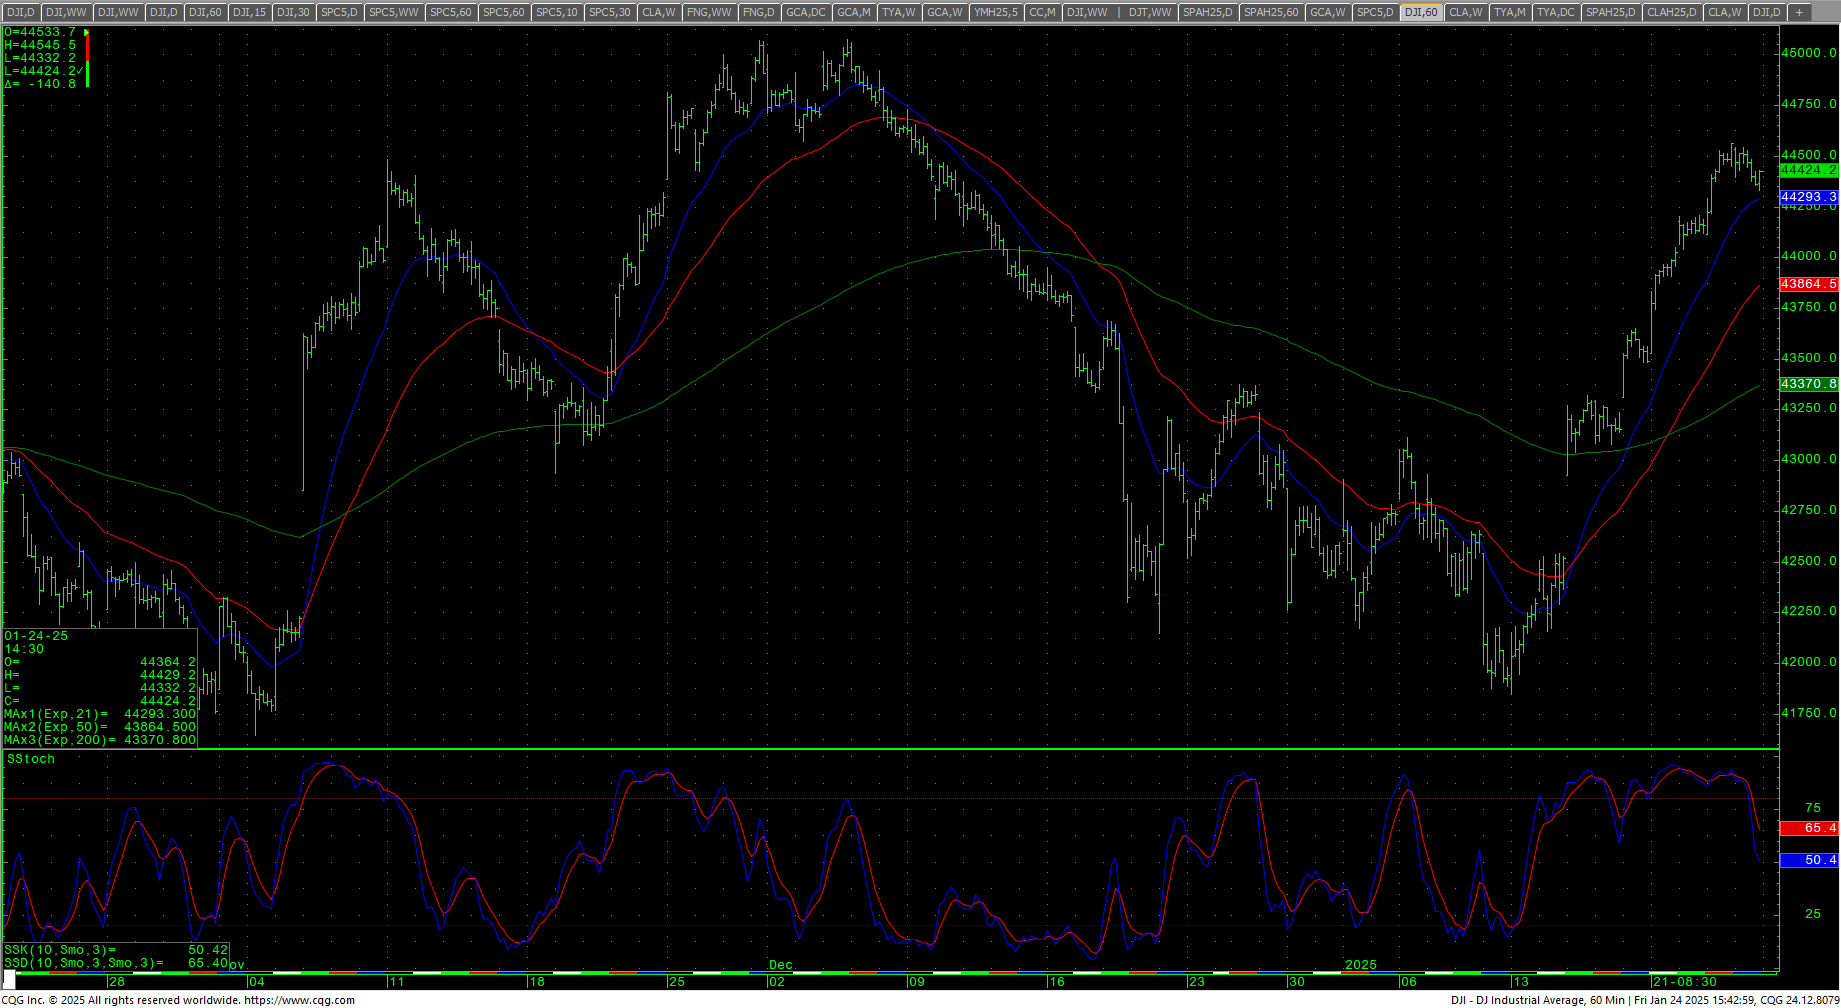 Support is at 44320 and 44170/44168. A breakdown under 44168 should test 44046 with counts to short-term pivotal support at 43924/43920. Closes under 43920 open counts to 43422 and 43205 with full counts into critical near-term support of 42883/42875 with support of 42524 through 42486. Closes under 42486 should fuel downside movement to 41850/41844 level with critical closing support in the 41933/41925 level. A breakdown with closes under 41925 should test 41844 and 41647 (November low) with potential to 41263 through 41192. Taking out the November low of 41647 would be a bearish signal. Closes under 41192 opens counts toward the 40008/39993 area with key support at 40665, 40338 and 40204/40200. A breakdown under 39993 sets up a decline to 38734.
| Resistance | Support |
|
|
S&P 500 Cash Index
S&P 500 Index Weekly H-L-C
 S&P 500 Index Daily Candles
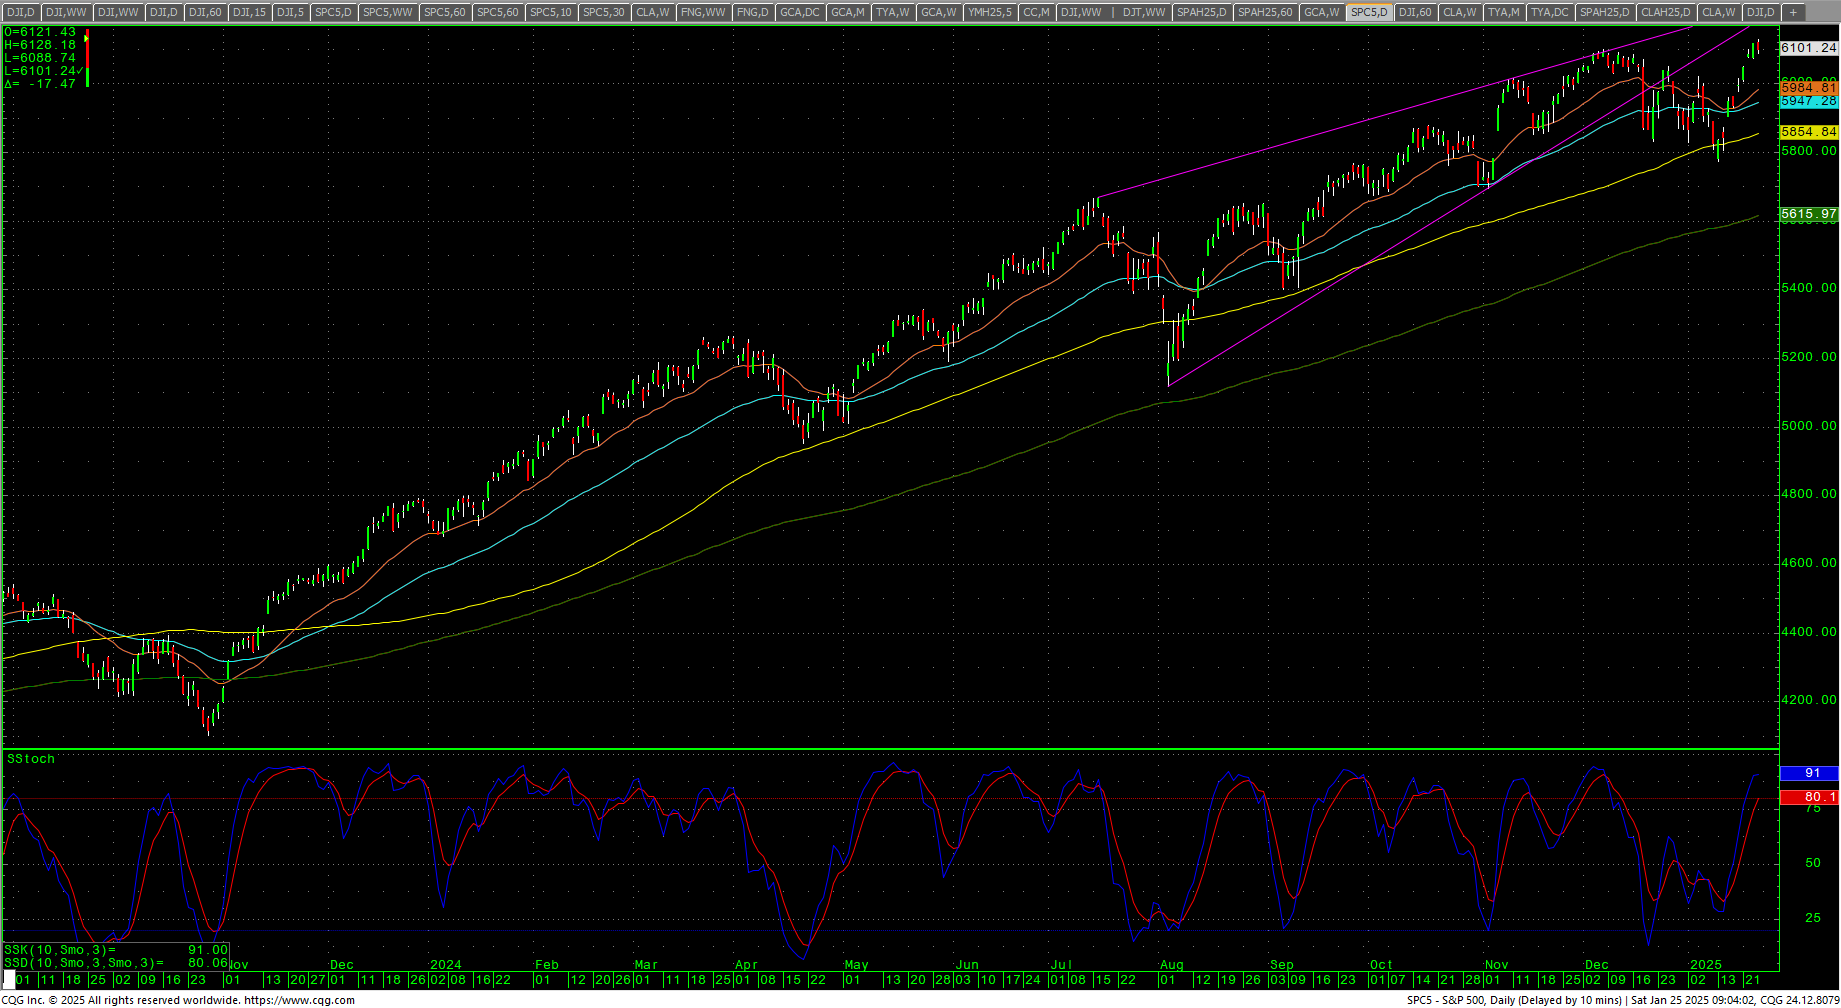 The S&P traded higher all week with the index moving to a record high. The daily is overbought with a preliminary bearish divergence and there are now three gaps over the past seven sessions. Are those; Breakaway, Runaway, Exhaustion? Time will tell. There is critical timing coming up at the end of this week. The market ended near the upper end of the week’s range, closing up +1.74%. The weekly remains in a sell signal with another preliminary bearish divergence. The 200-day MA is 5616. The November low of 5696 remains critical intermediate-term.
S&P 500 Index Hourly H-L-C
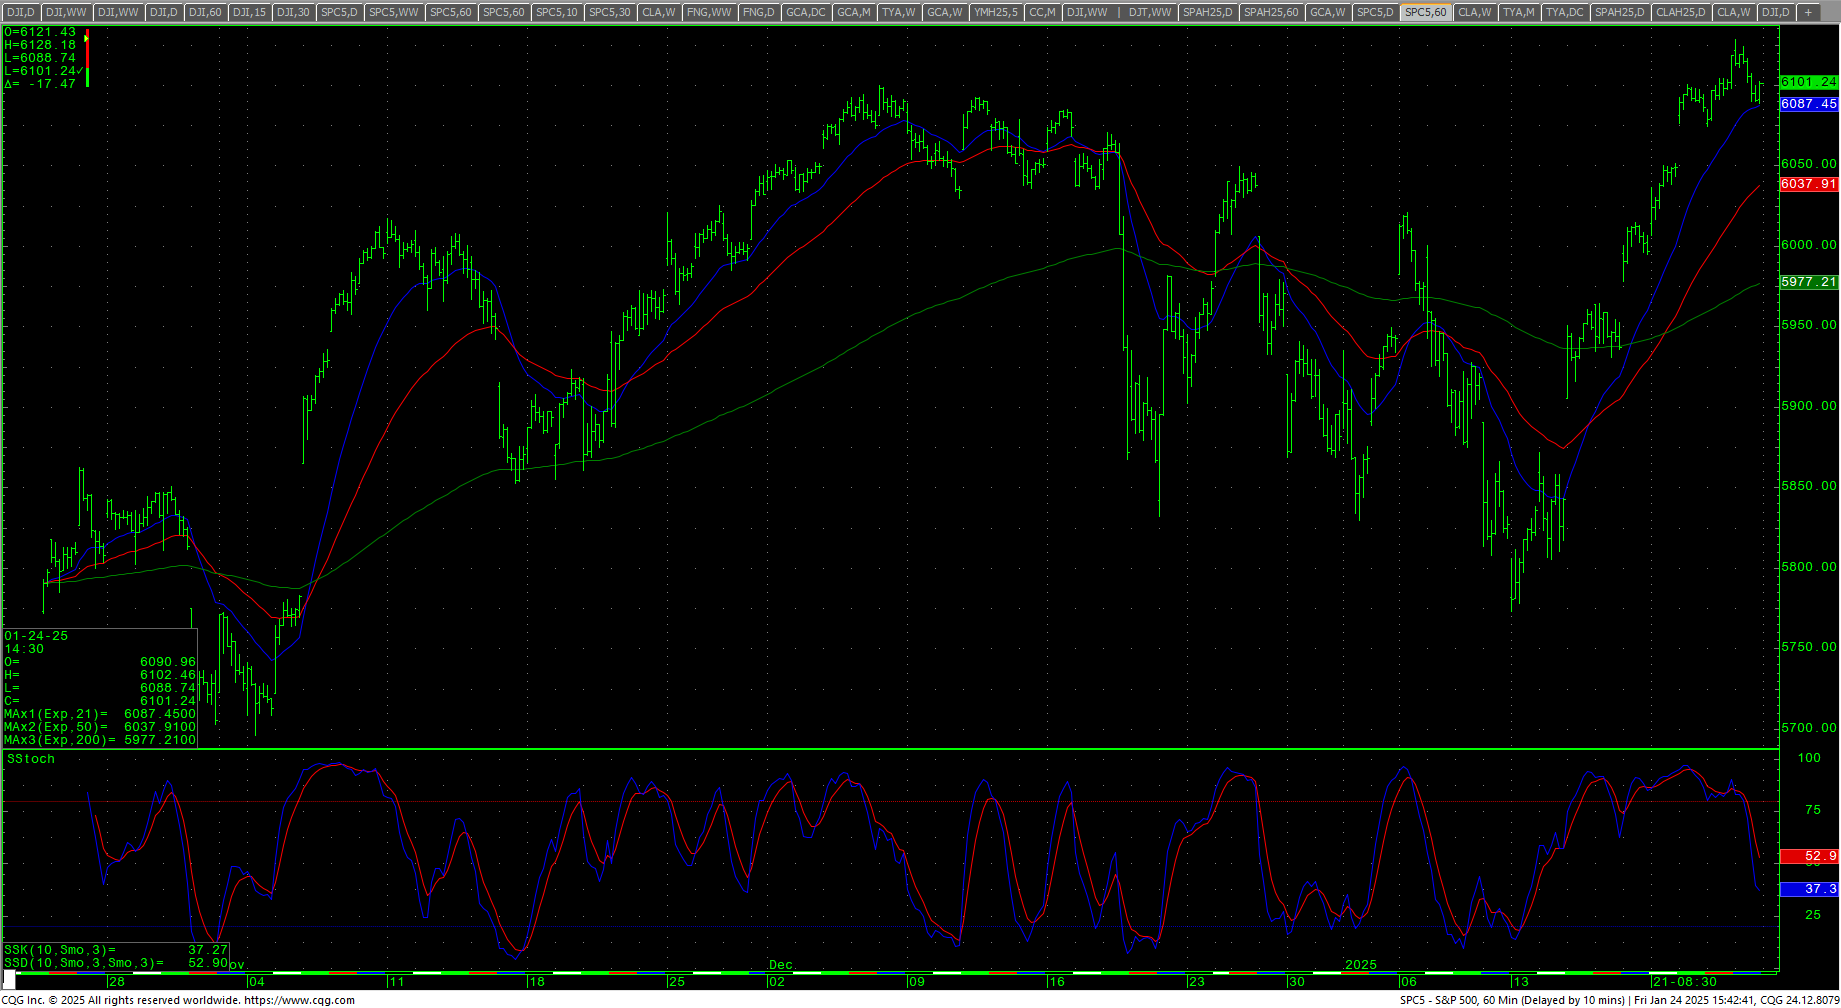 The hourly ended the week neutral as it relieves overbought conditions. The cash index traded above resistance of 6115 and closed just under that level with an intraday high of 6128.18. Continued rallies should take the S&P 500 to 6152. Closes over 6152 open counts to 6224 and 6296. Above 6296 can carry to 6368 with counts into the 6440 area. Closes over 6440 will open counts to 6584. A breakout over 6584 sets up 6638 and 6692.
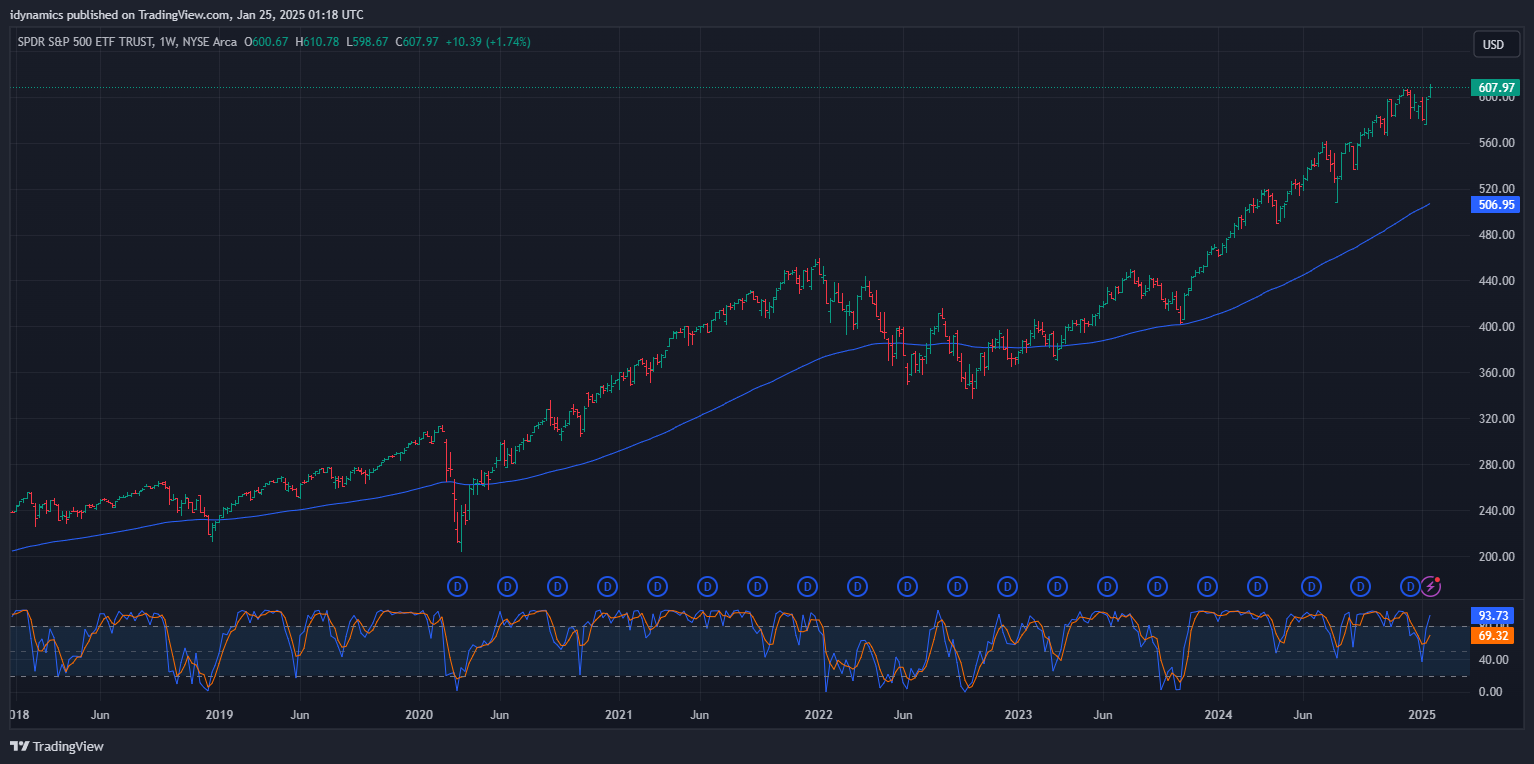
SPY Weekly
 Support is 6076/6074 and 6044. Trade under 6044 sets up 6018 with counts to 5992/5990. Closes under 5990 count to 5950 with potential to pivotal near-term support of 5908/5905. Daily closes under 5905 suggest 5882 through 5857 with full counts to swing support at 5773. A breakdown with closes under 5773 have potential to carry toward the 5650 level. Closes under 5650 setup critical short-term support of 5354/5350. Daily closes under 5350 sets up 5244/5240 with full counts to 5120/5100. Closes under 5100 will open counts into the 4866/4860 area.
| Resistance | Support |
|
|
Charts courtesy of CQG, Inc., CNN, Koyfin, Trading View and AAII