
Week of April 11, 2025
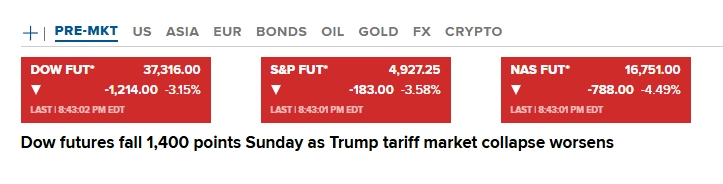
This is the continuation in these short-term timing updates. I’m starting with some past quotes before looking toward the future. Suffice to say that April continues this EXTREMLY CRITICAL TIMING. As of this writing, futures are once again in a selloff overnight and circuit breakers have been hit in Asian markets on their openings.
Six months ago:
 From previous updates:

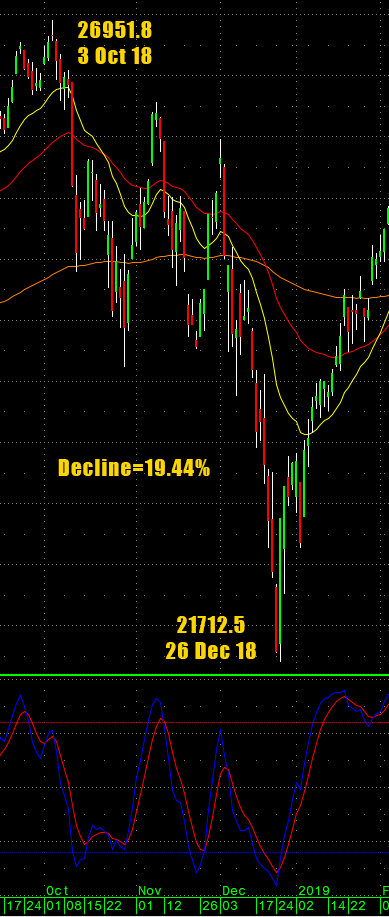
“If you were following along in early February, we pointed out that the week of February 21 was critical and a counter-move could begin in that critical timing.” “The high for the SPX futures basis the March contract SPAH, was set on February 19th at 6166.50.”: “…we indicated that this starts a time window that runs through the early part of May 2025 and closely resembles a pattern in late 2018 where the Dow lost -19.44%. If we follow this pattern the month of March could be seriously rough sailing for the stock market.”
Dow Jones Late 2018 Window
 And then this re-print from the March Timing Update:
“Again, this current window does not end until early May and could run into mid-Summer, late July to early August. While the energy shifts a bit coming out of March, April has the potential to be much more aggressive. Conflict is a keyword, how it plays out needs to be seen. I would not rule out a Black Swan in April, something that confirms the long-term trends and takes participants by storm. The weekend of April 19-20 is key with the 21st as the next ultra critical timing point.”
At this point, with tariffs on the table, the volatility could get manic as any small news regarding tariffs can move the markets a sizeable amount. This will be especially true for individual stocks such as Nike and Lulelemon, etc.
From last Friday’s letter:
“While this window runs through the first week of May, it is looking more and more, from a cycles standpoint, that this will run well into Q4 2025/Q1 2026. Thus, a much more protracted and drawn-out bear and not the “flash crash” that everyone has gotten used to over the past two decades. That doesn’t mean we won’t have significant rallies, but chasing rallies is likely to be a losing strategy until this thing is spent…which very likely will not be until Q1 2026 at this point.”
Also from Friday:
“Needlesstosay, sentiment is at mega-extremes with the CNN Fear Index at 4 and the AAII back to a 62% to 22% imbalance of bears to bulls. The VIX closed at the highest weekly close since 30 March 2020. Oversold is putting it mildly.”
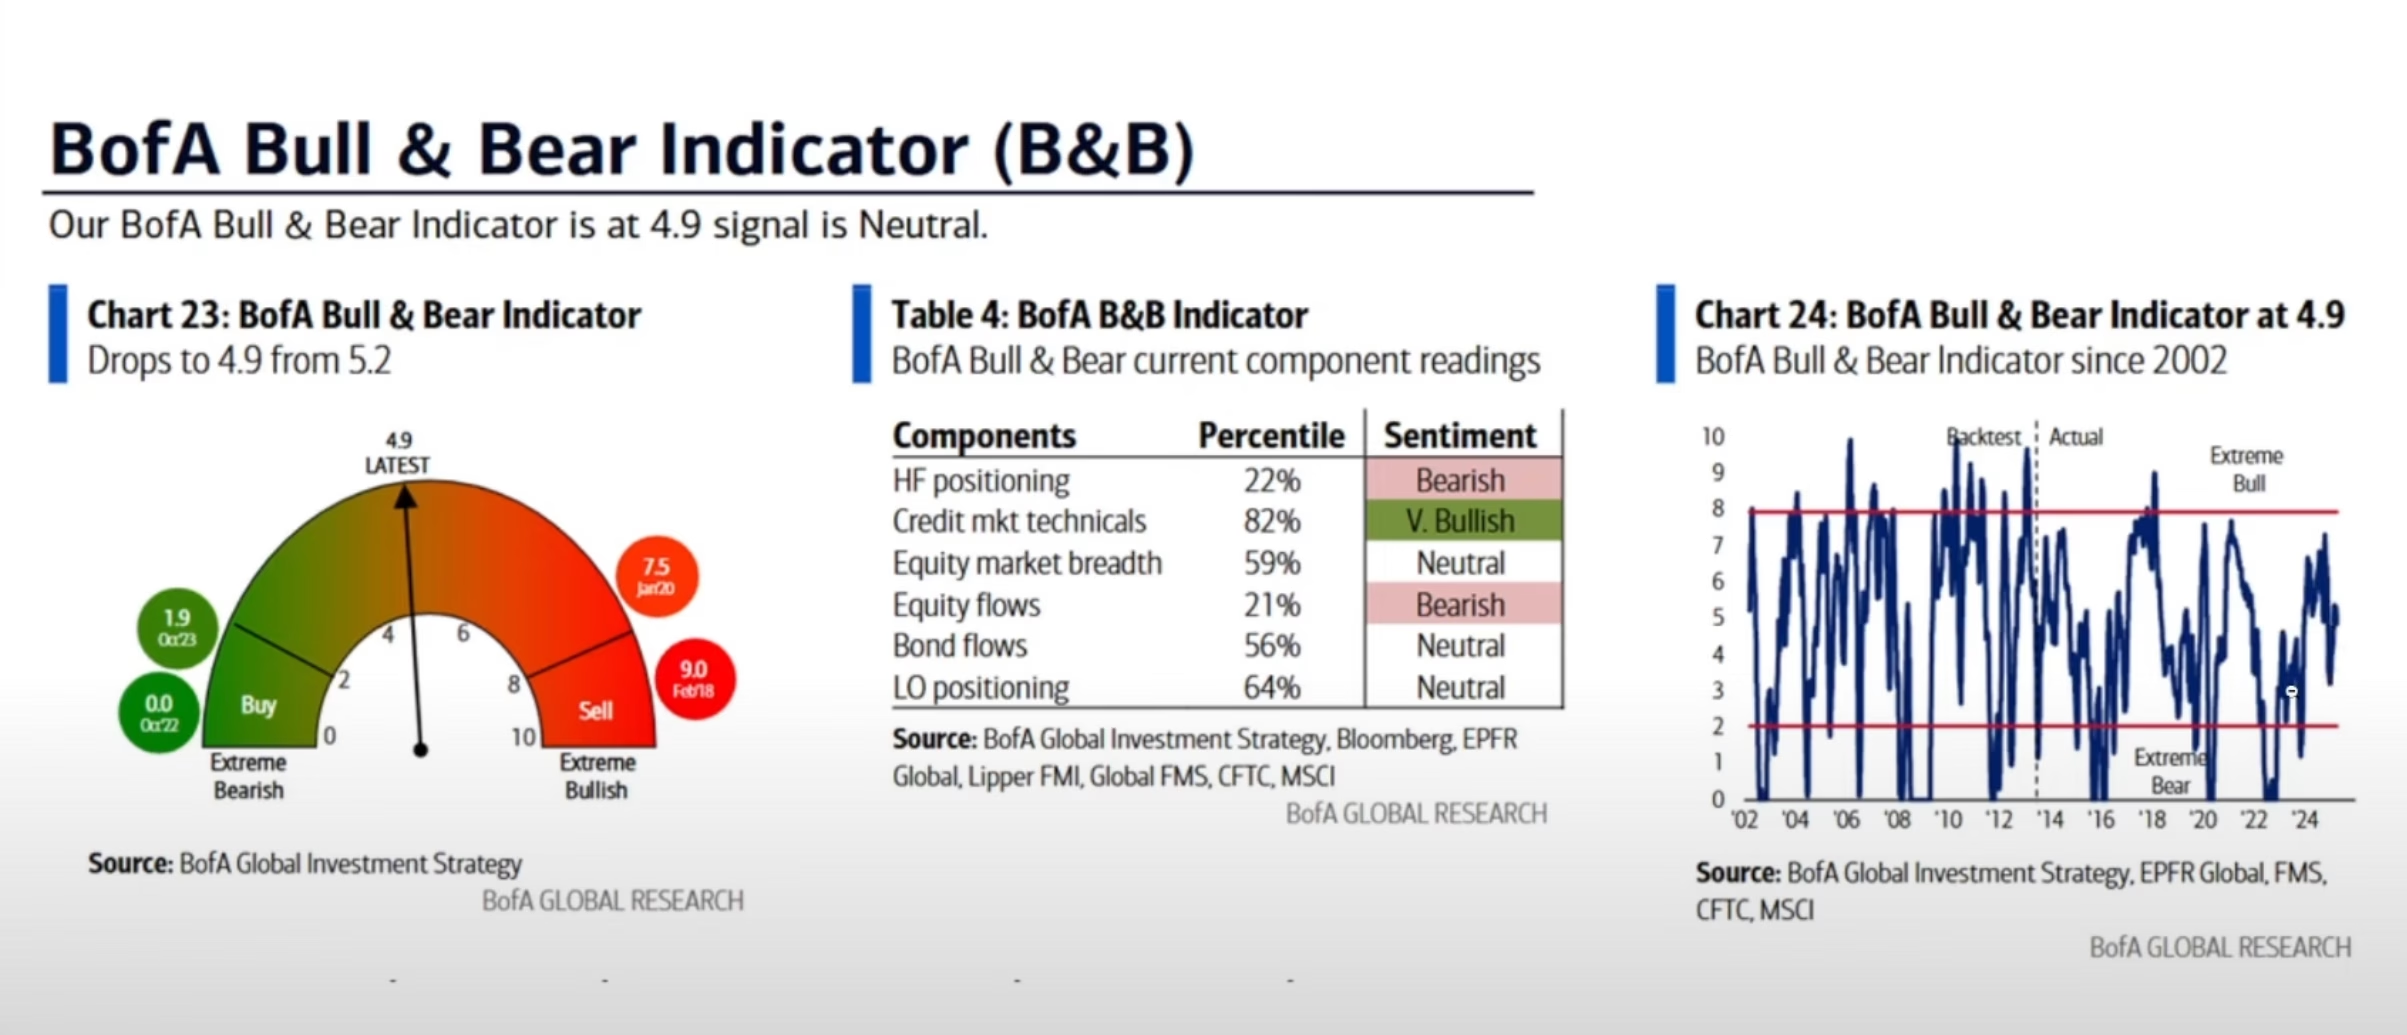
So, yes, the sentiment indicators are overblown but the BofA numbers do not show this type of fear…meaning that we simply have not hit panic levels yet. I want to emphasize that some time on or near Easter Weekend there is the potential for a geopolitical event, stay alert.
As far as the timing goes, this particular window does not end until first week of May with the last 10 days of April suggesting some extreme volatility. That said, it is looking more and more as if this cycle timing will minimally run into July/August of 2025 with a huge focus on September of this year and very likely will not run its course until at least Q1 of 2026. If we continue down into early May, we get a counter-trend move that lasts into June and then a resumption into late July to end of September. I will continue to issue these short-term reports as events unfold.
Timing Dates for April/May
- 04/14 **
- 04/21 *** X critical (from the 18th/19th) Geopolitical
- 04/25 **
- 04/30 *** X key
- 05/08 **
- 05/13 *** X critical, fast moves
- 05/20 **
- 05/29 *** X critical
SPX: S&P 500
I am going to reprint Friday’s technical comments for the SPX with the caveat that futures are now down near 200 points as of this writing.
 S&P 500 Index Weekly H-L-C
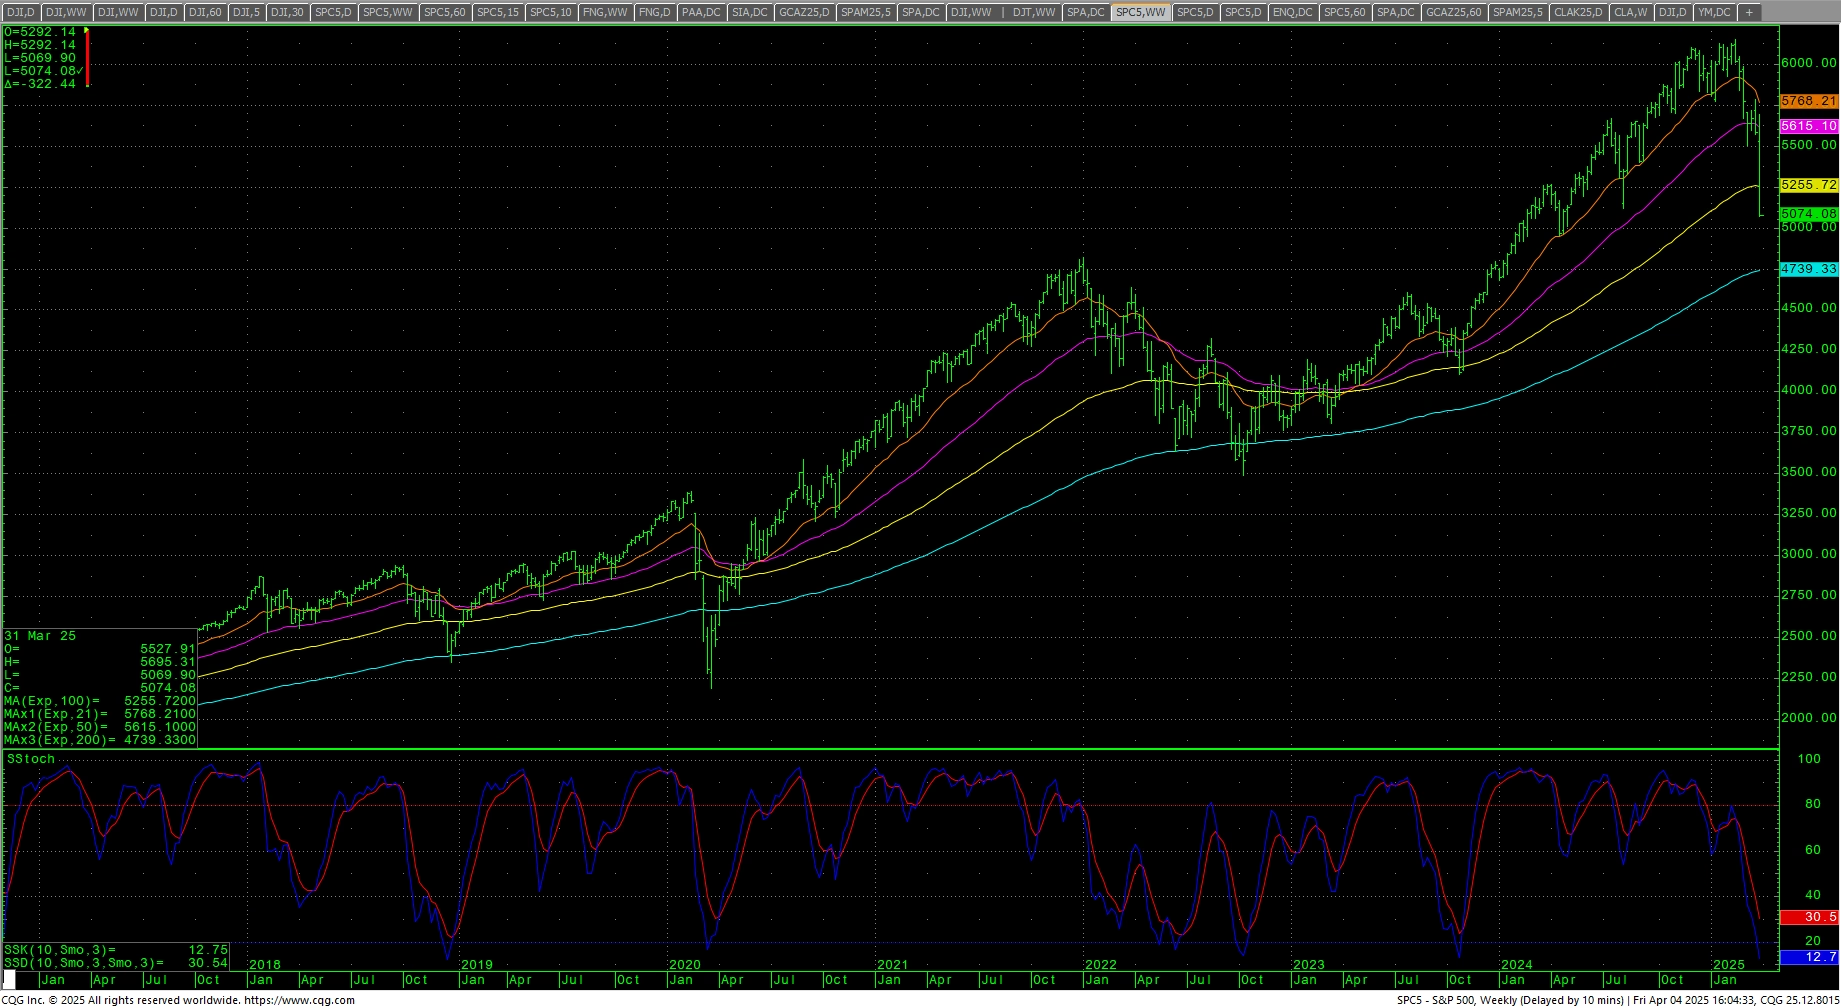 The S&P started the week lower and reversed into Wednesday’s trade before crashing in one of the worst weekly declines in 50 years. The daily close is the lowest since 2 May 2024. The daily is in a sell signal on the stochastics, the MACD is has hooked lower and the RSI is oversold at 18.15. The weekly stochastics remain in a sell signal with the lowest weekly close since 15 April 2024. The hourly ended deeply oversold with Friday’s plunge. The 200-day MA is 5691.40.
SPY Weekly
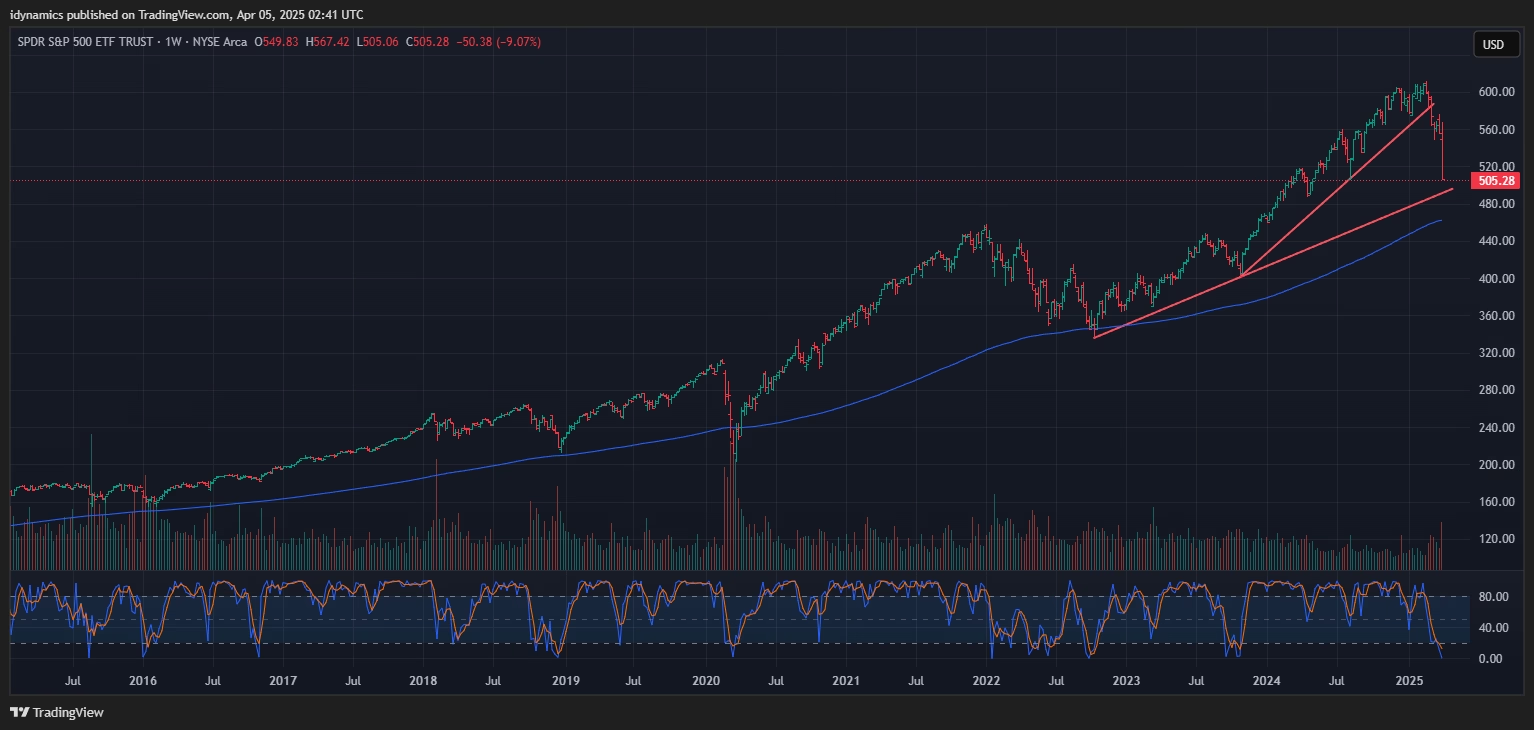 The market has retraced over 50% of the move from late 2023 to the February highs. Prices took out critical support 5125/5119 (there was a target at 5144 also). A further breakdown with closes under 5119 offers counts into the 4884/4880 area with support at 4953. Closes under 4880 are bearish and open counts to 4614 through 4586. Under 4586 can carry to 4486 with counts to 4421/4418 (gap) and support at 4459. Closes under 4418 set up 4319 with full counts into the 4104/4100 area.
S&P 500 Index Hourly H-L-C
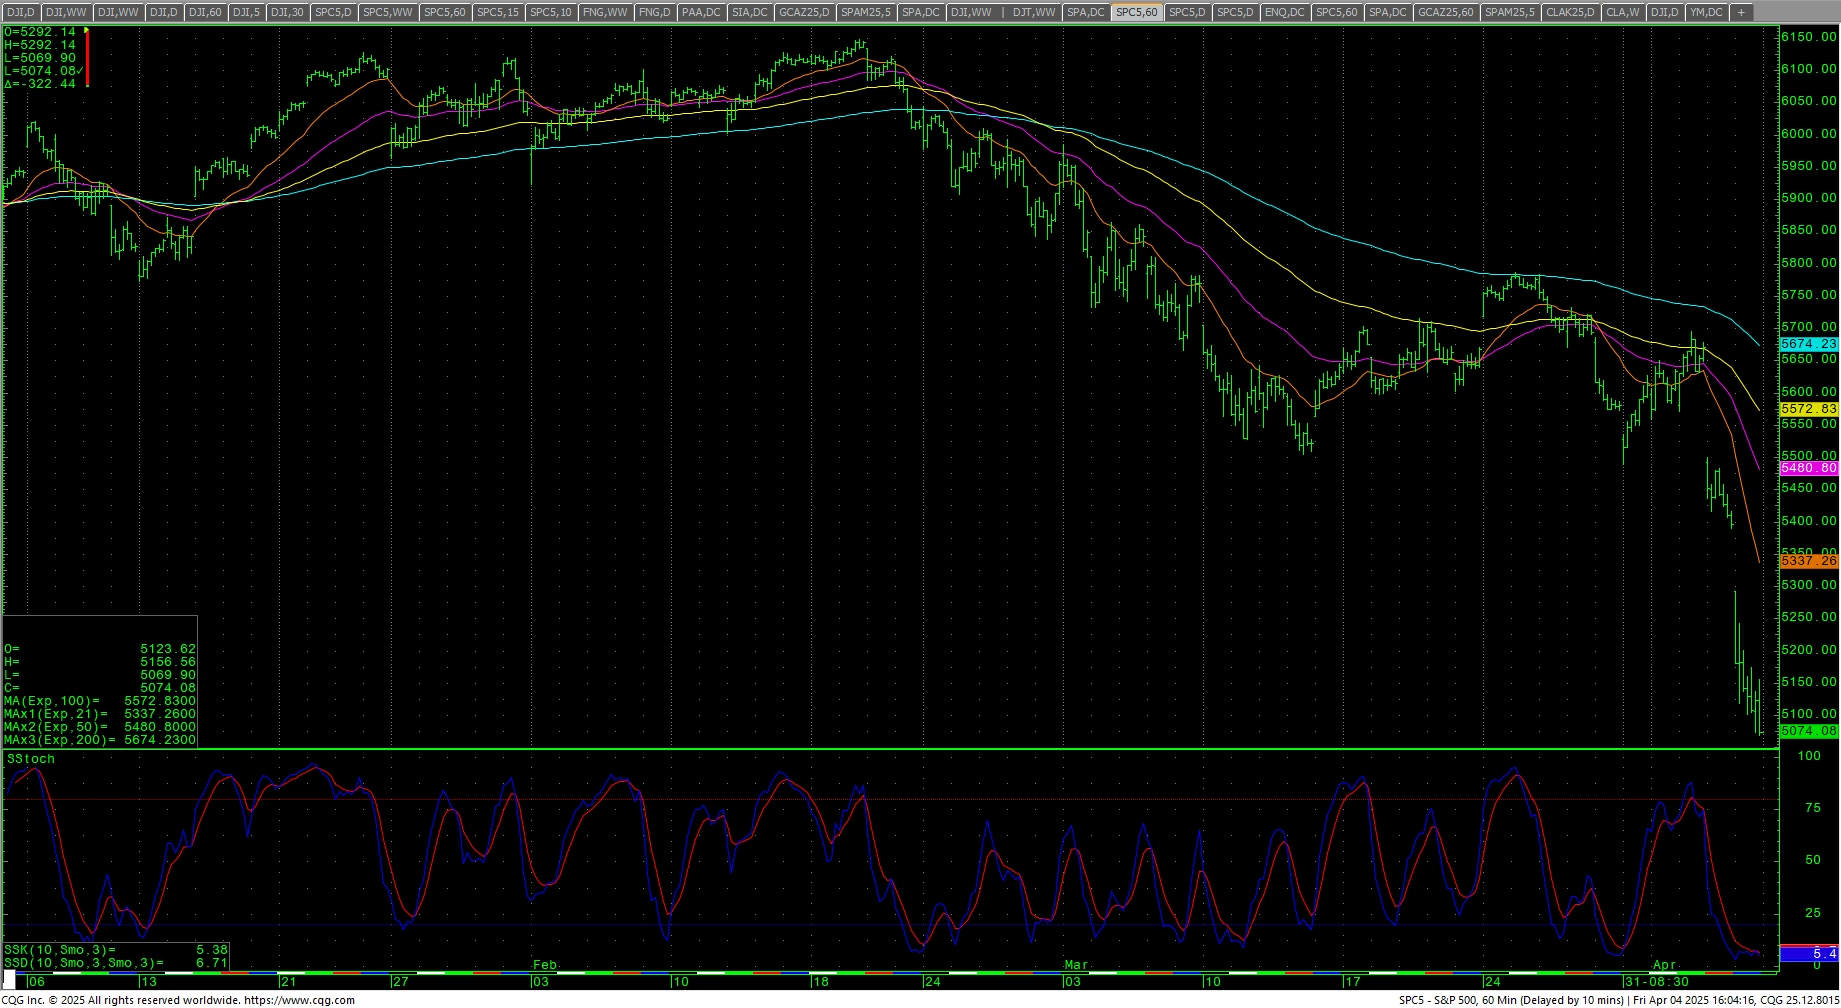 Resistance is 5167 and 5227. A drive back over 5227 sets up 5276 with counts to near-term resistance at 5325/5330. Closes over 5330 should test 5385 and 5480/5482. Closes over 5482 are friendly and count to 5608 with potential to 5735/5740. Daily closes above 5740 should minimally test 5787 with potential to 5878/5893. A breakout over 5893 will open counts to 5986 with full potential to 6043 and opens counts to 6112/6114 and full counts into critical resistance at the intraday high of 6147.43. Rallies through 6148 should test 6160 with a shot at a target of 6180.35/6181.
| Resistance | Support |
|
|
Charts courtesy of CQG, Inc., CNN, Koyfin, Trading View and AAII