TECHNICAL ANALYSIS (by Intraday Dynamics)
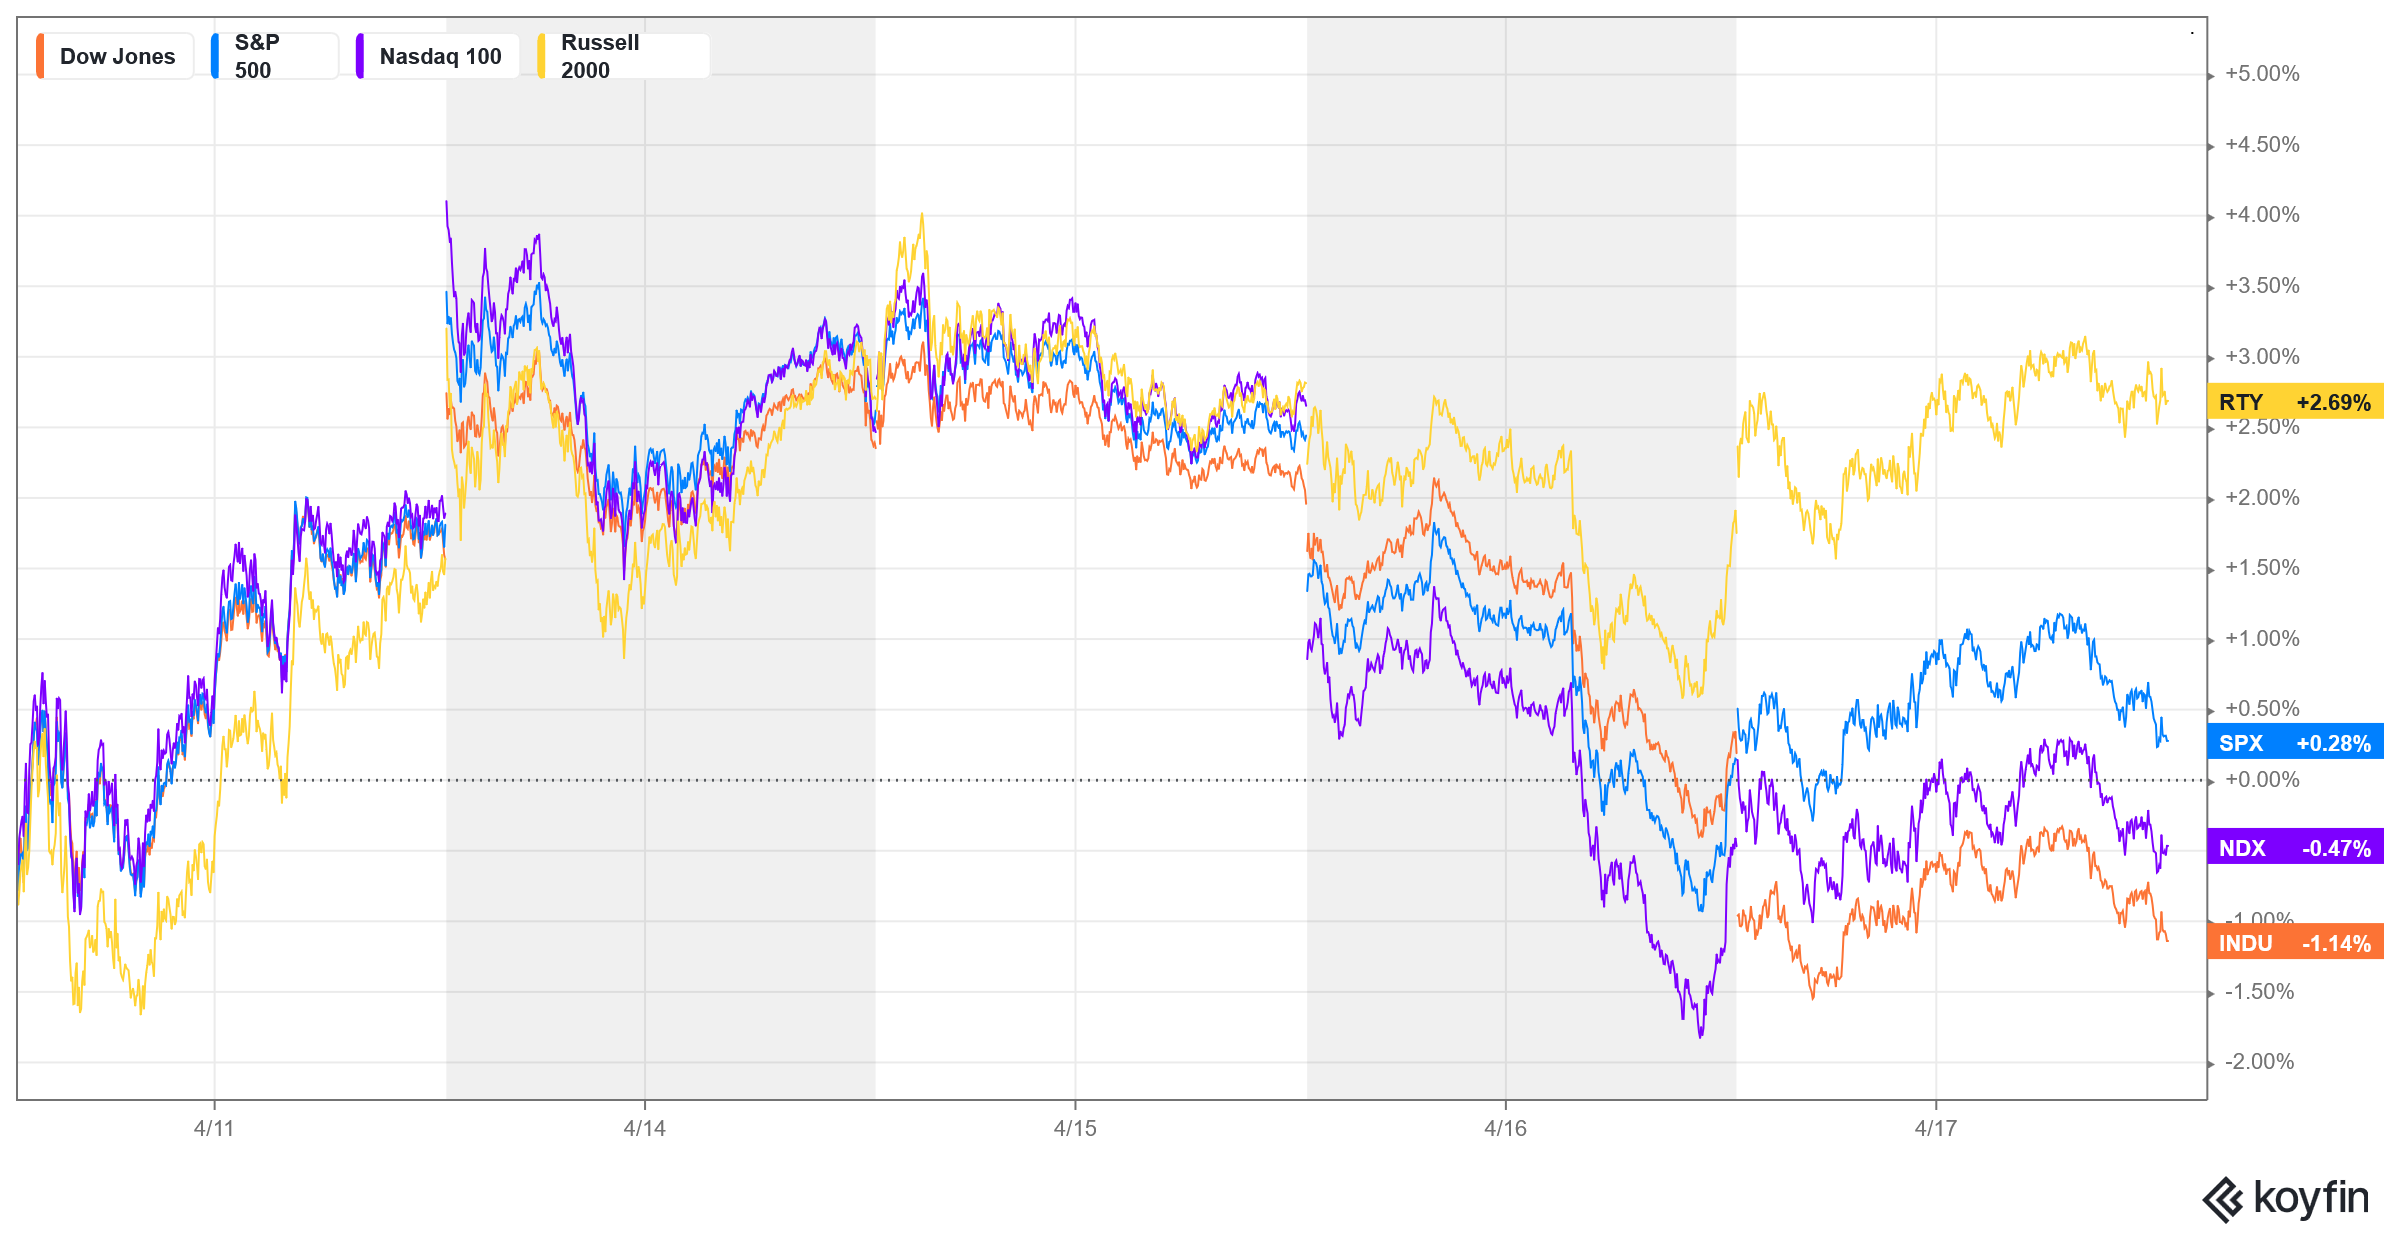
Major Indices Week of April 18, 2025
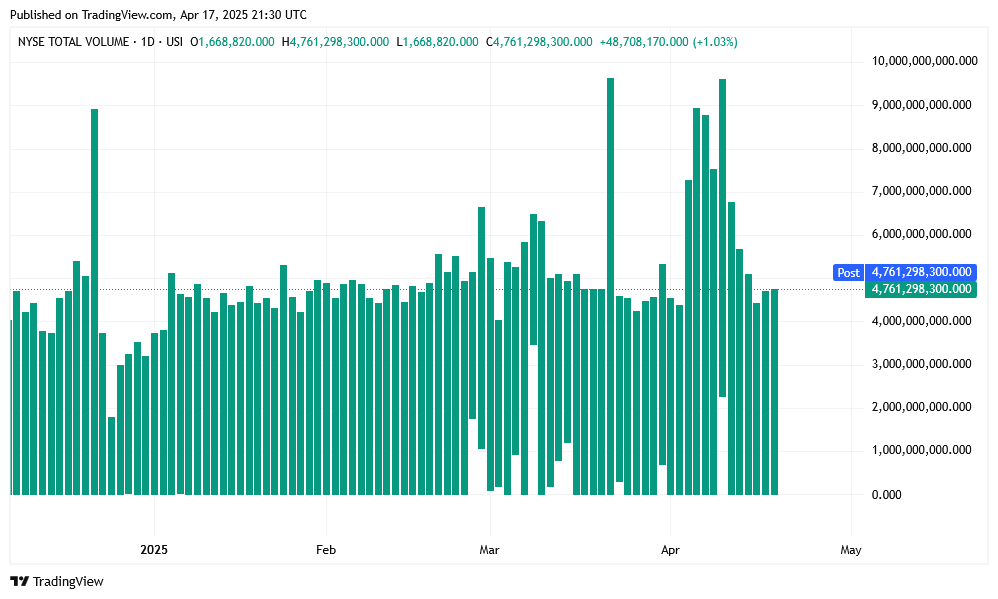
 NYSE Volume
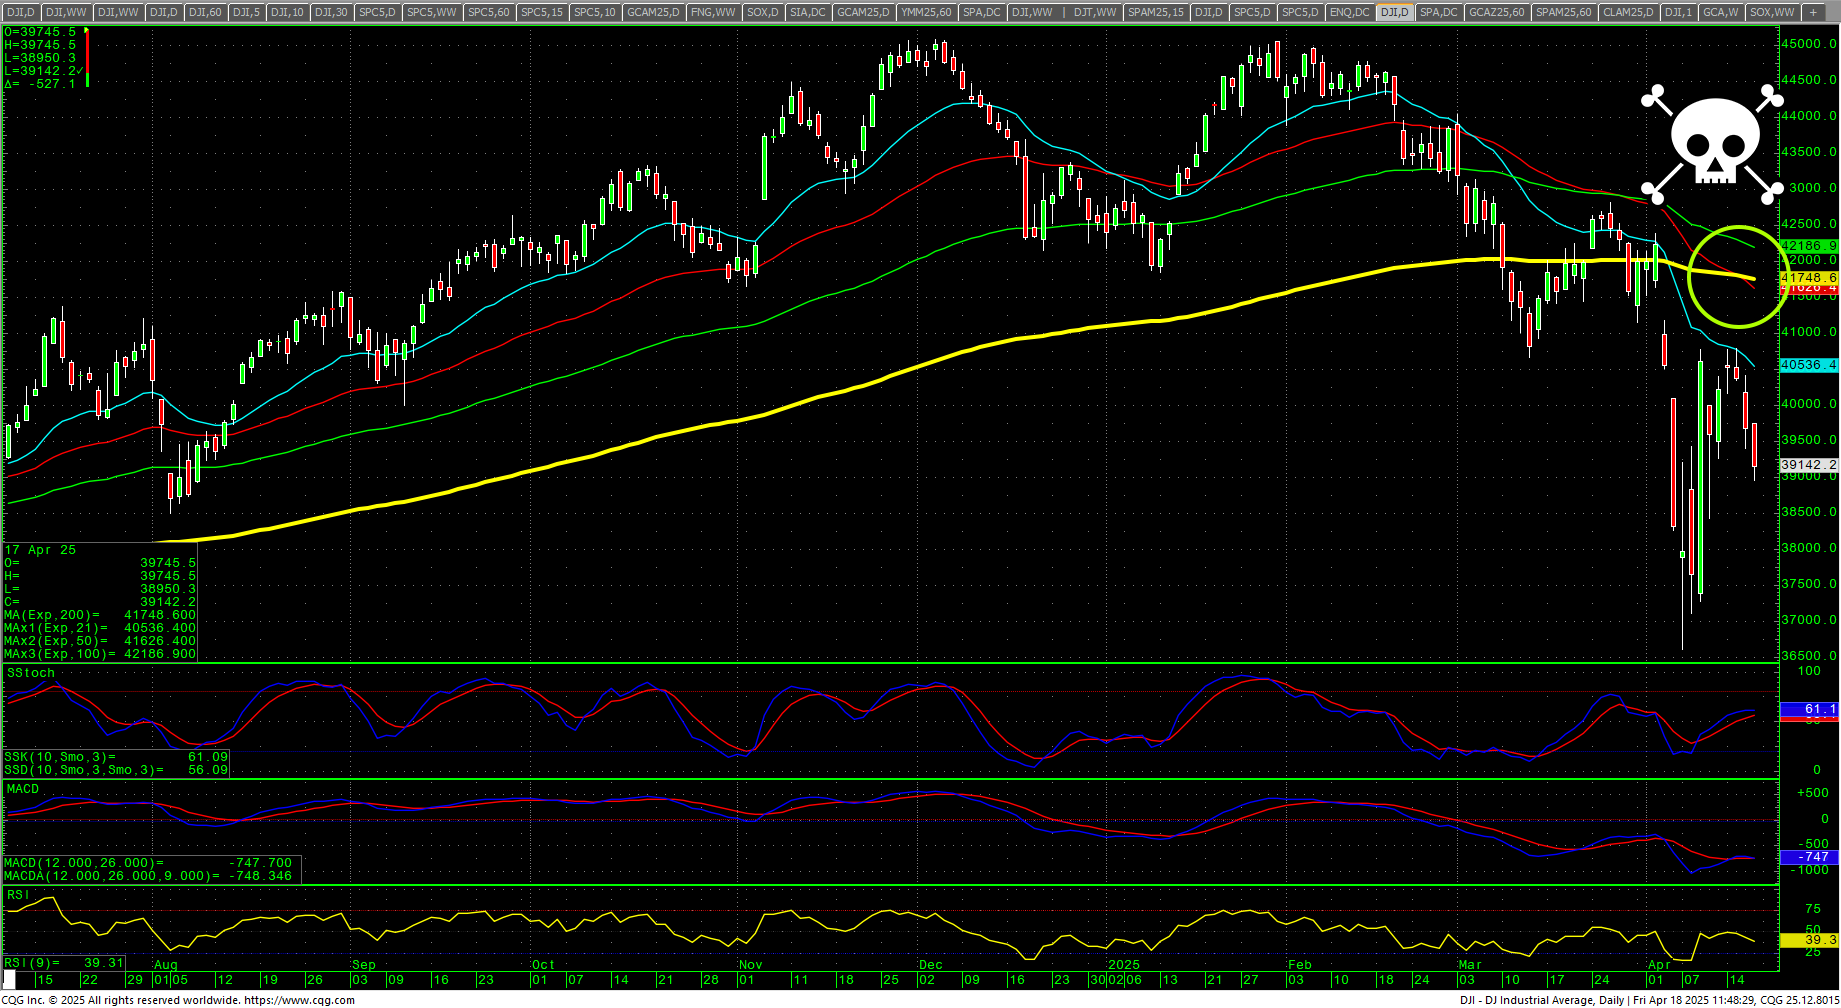
 Dow Jones Daily Candles
 Stocks traded mostly inside weeks, in a shortened holiday week, with the Dow being the only exception, staging a downside reversal. The Russell was the only green index. This may actually be a bearish signal as it is not unusual for the secondaries to improve when the larger market corrects. Prices reacted to a bearish Empire State Manufacturing Survey on Tuesday and then Fed Chair Jerome Powell speaking on Wednesday. Powell’s comments sent the market into a swoon with all the major indices retreating and then the Dow following through on Thursday on bad earnings data from United Health. Adding to the current chaos is the very real rumor talk now that the U.S. will delist Chinese stocks, none of this looks as though it will end well. Yes, it would hurt China, but it risks toppling the entire, already fragile, global economy.
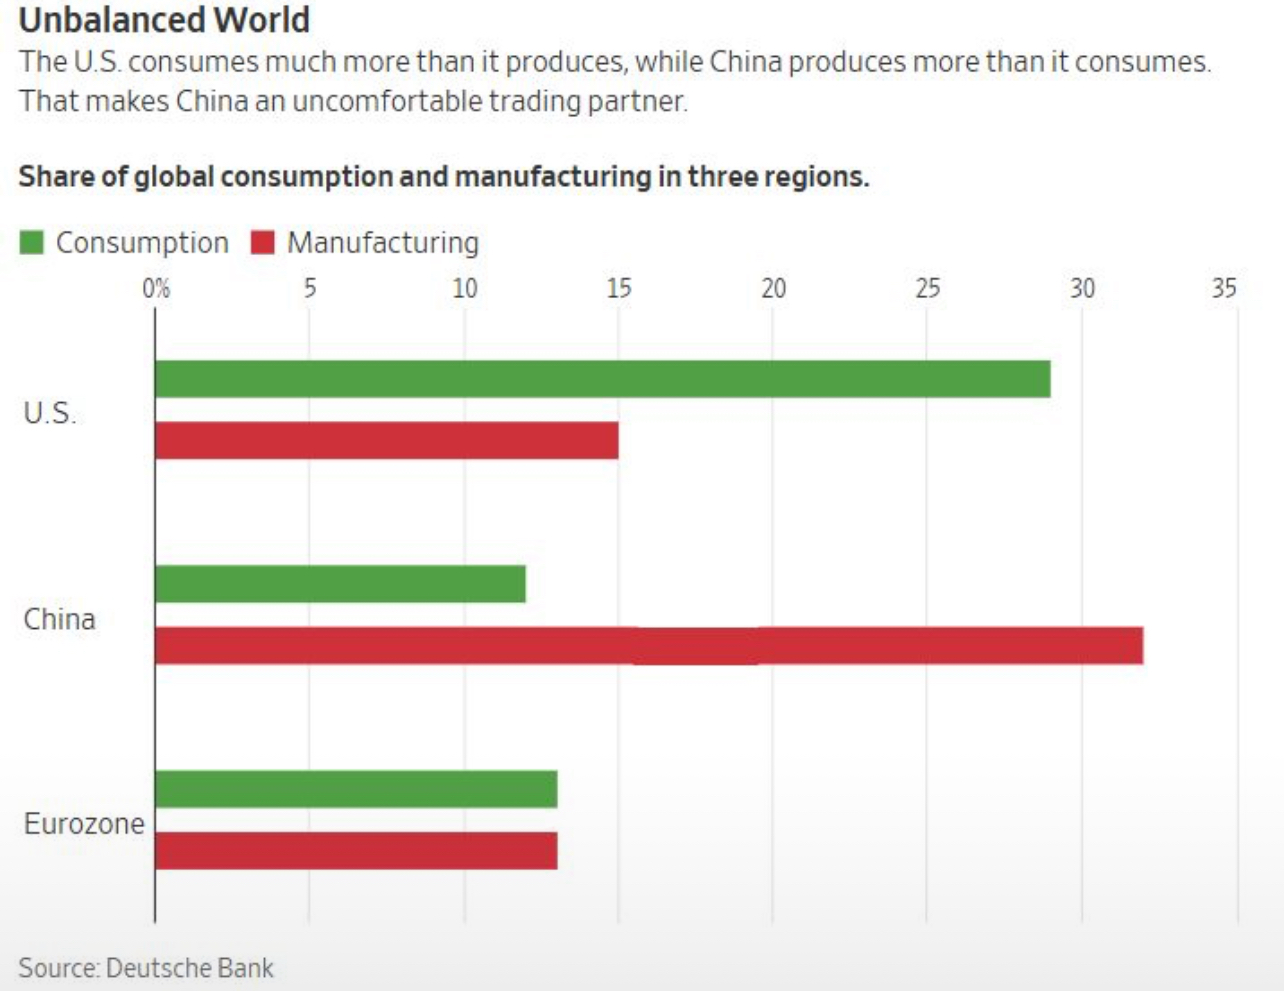
Who is the Manufacturing Super Power?
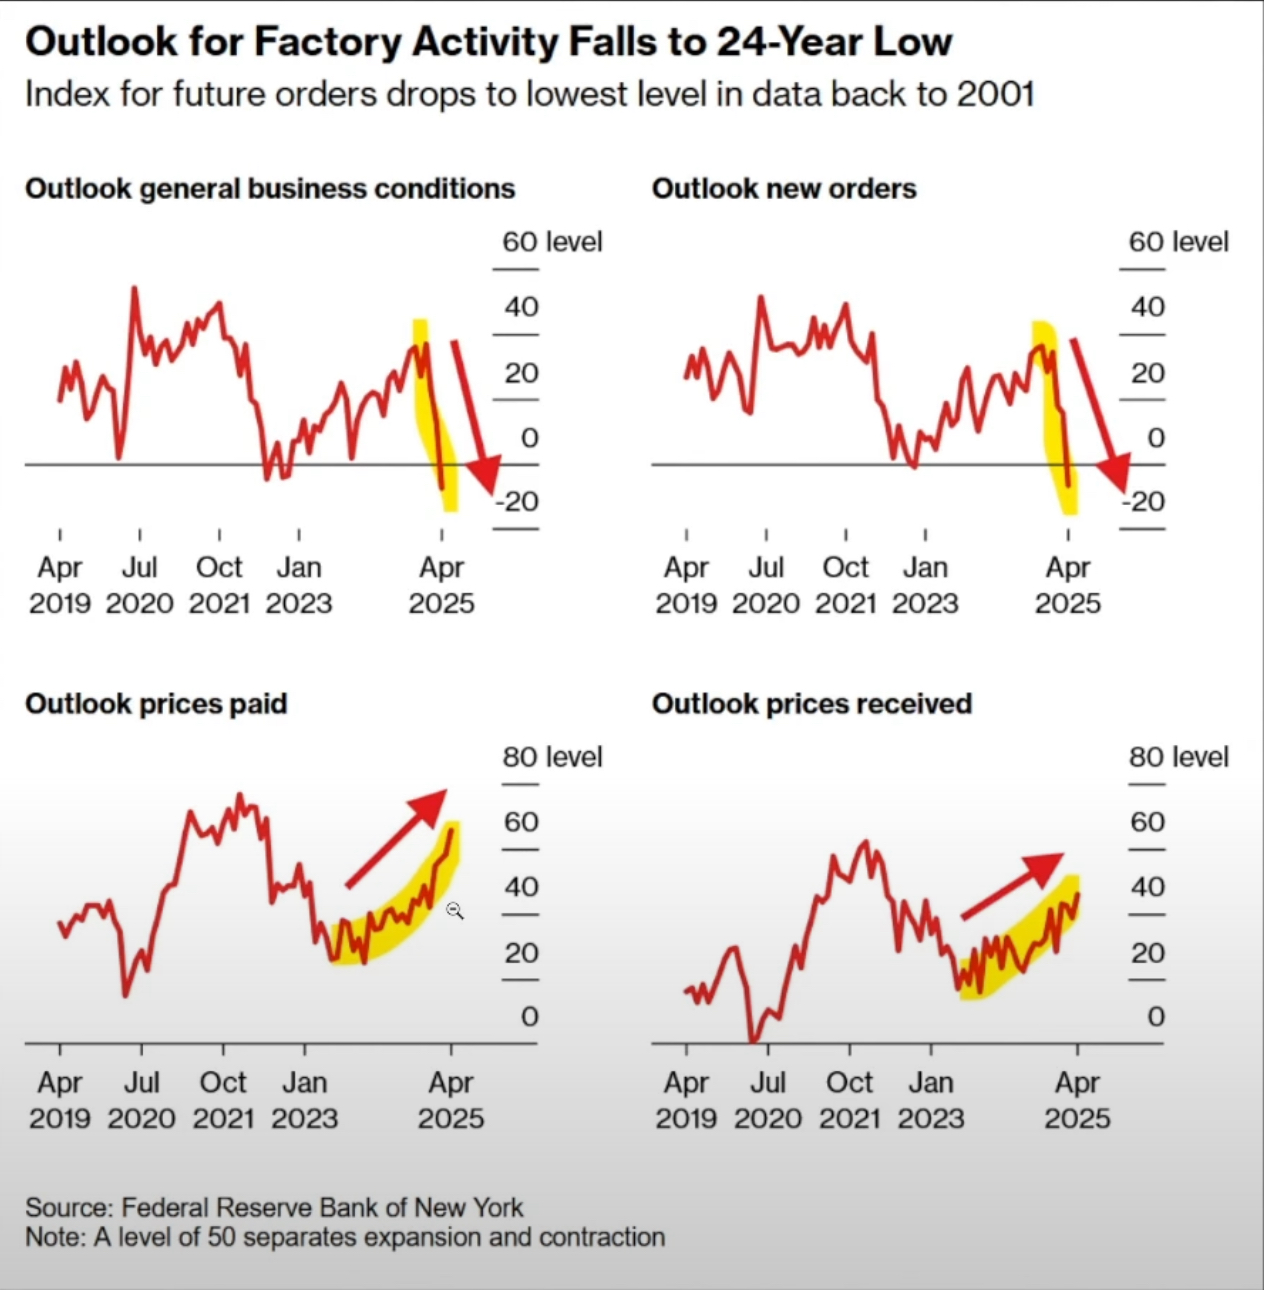
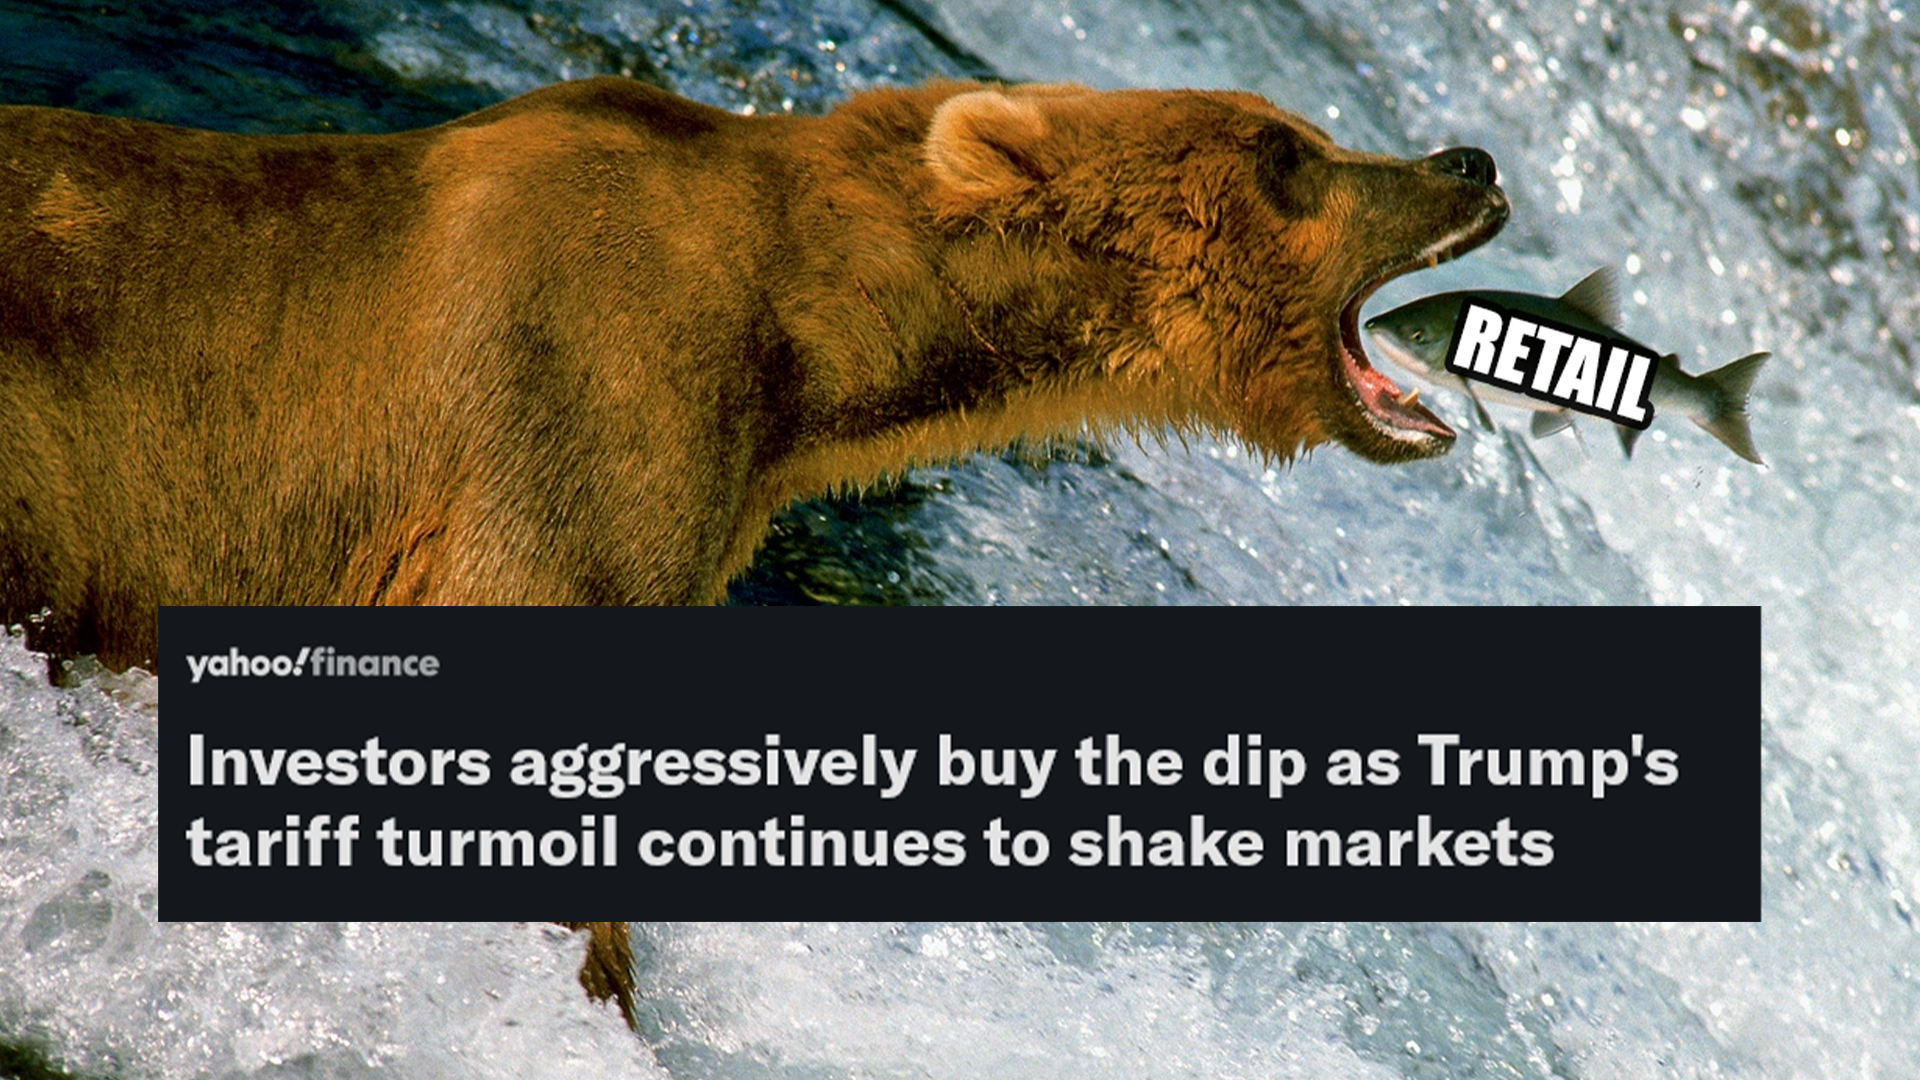
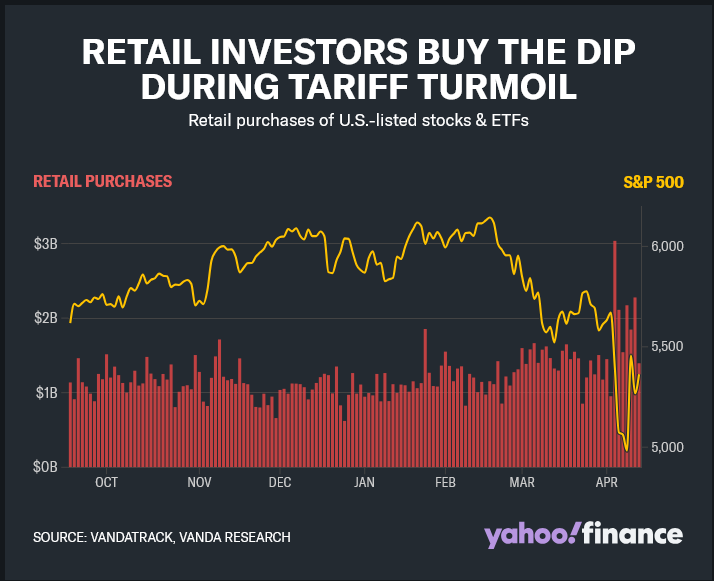
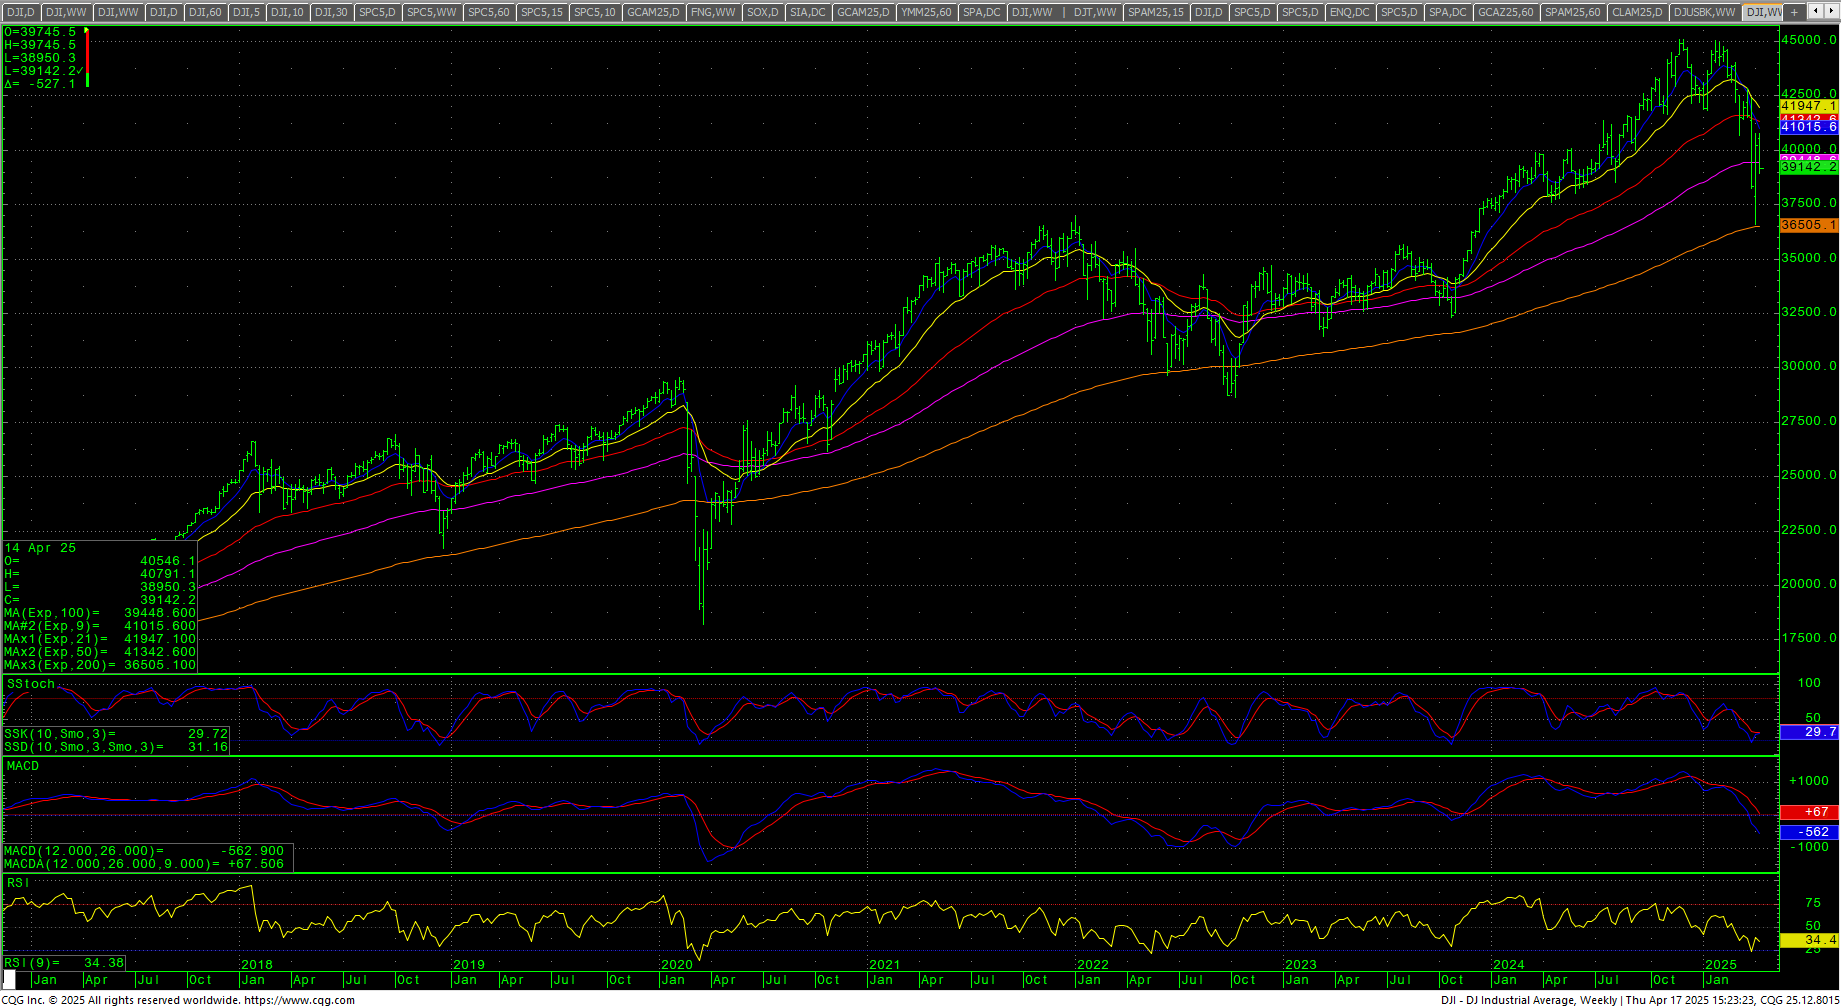
 The Dow now joins the Nasdaq and the SPX daily charts with a Death Cross on the daily with the 50-day MA going under the 200-day MA last week. The markets are in a pickle now. Underlying data is looking extremely weak while the uncertainty of “policy by tweet” looms over trading every day. While markets loathe uncertainty, this has not shifted the mindset of retail traders as they continue to pile in to the market. Some of this is driven by youthful ignorance and easy access to equities through things like Robinhood and CashApp…basically FanDuel for the rubes. The other is the proliferation of media channels on YouTube that consistently lead the lambs to slaughter by preaching DCA (dollar cost averaging). Couple this with the fact that very few people alive today have ever lived through a secular bear. Buy the Dip has been working every time, why not now?
 Why Not Now?
Two huge issues are simmering beneath this market, both of which have the power to eventually consume retail and may be pointing to a “lost decade” ahead. Outside of the fact that the AI hype of the past two years may go down in history as being bigger than the internet hype of the late 1990s, there is a serious liquidity issue bubbling underneath and a potential housing crash coming.
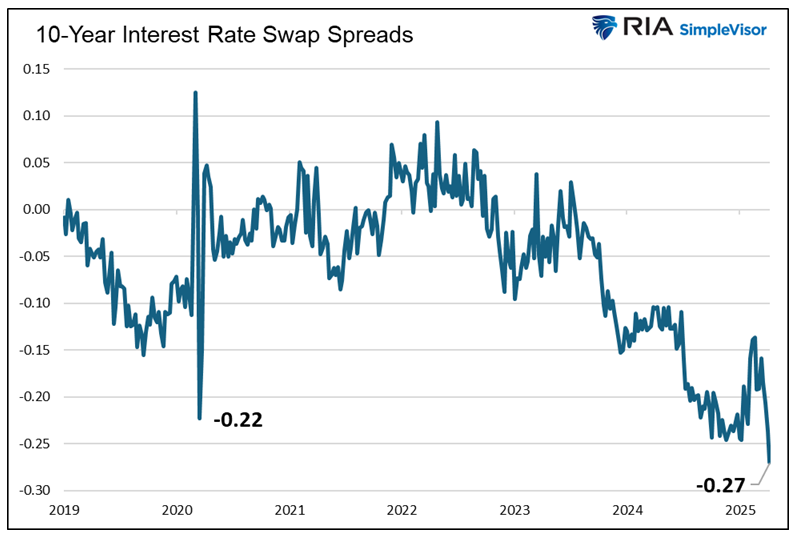
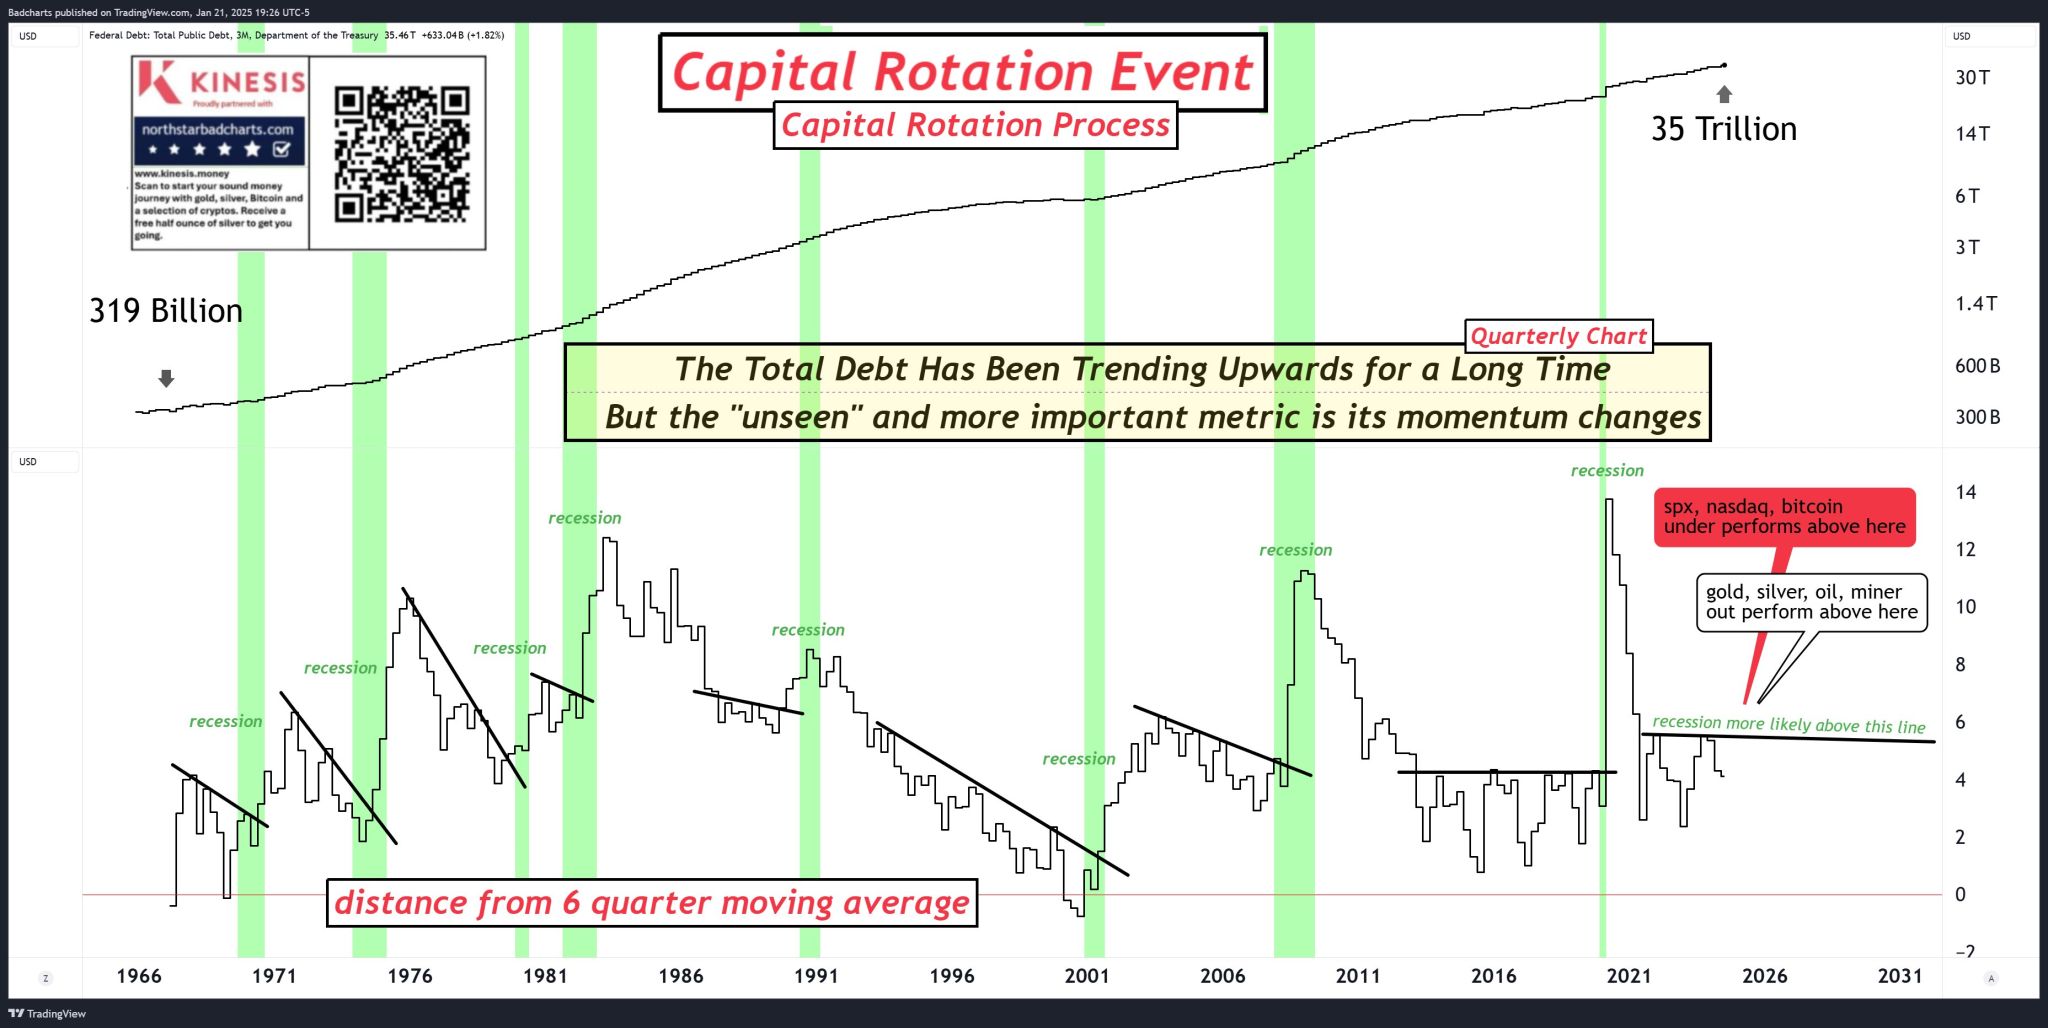
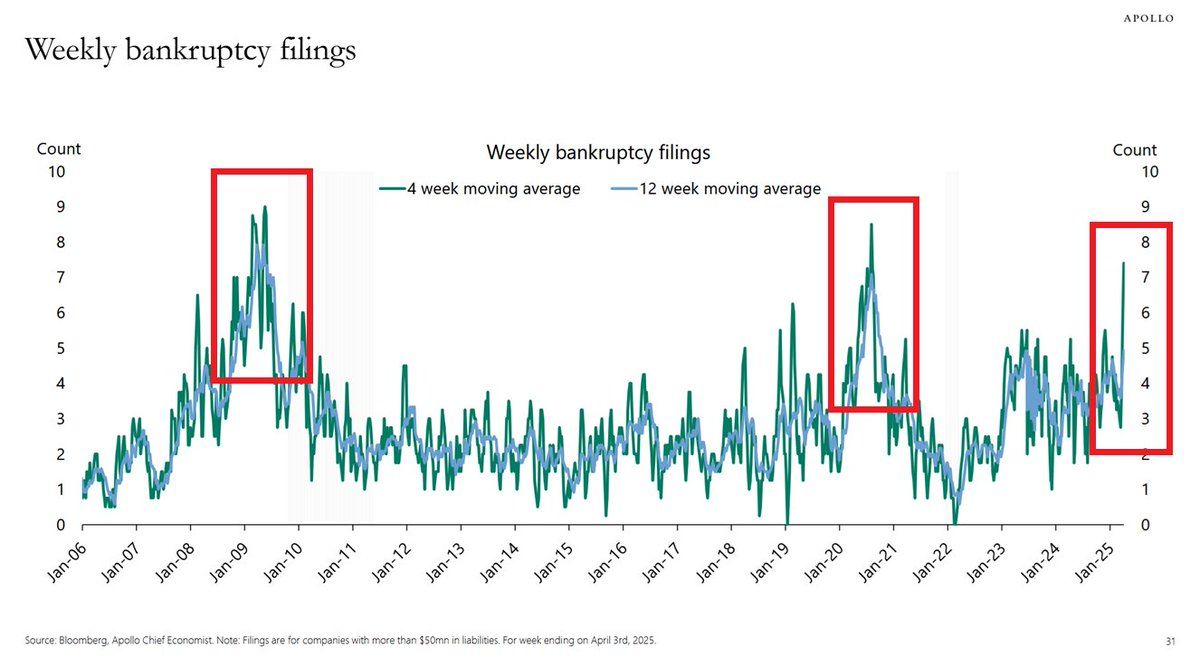 Swaps are a data point that simply cannot be ignored right now. Bankruptcy filings are accelerating. Hedge Funds have suffered liquidity issues during all the volatility. As this chart illustrates, debt is one issue…but the rate/momentum of debt is the most critical data point.
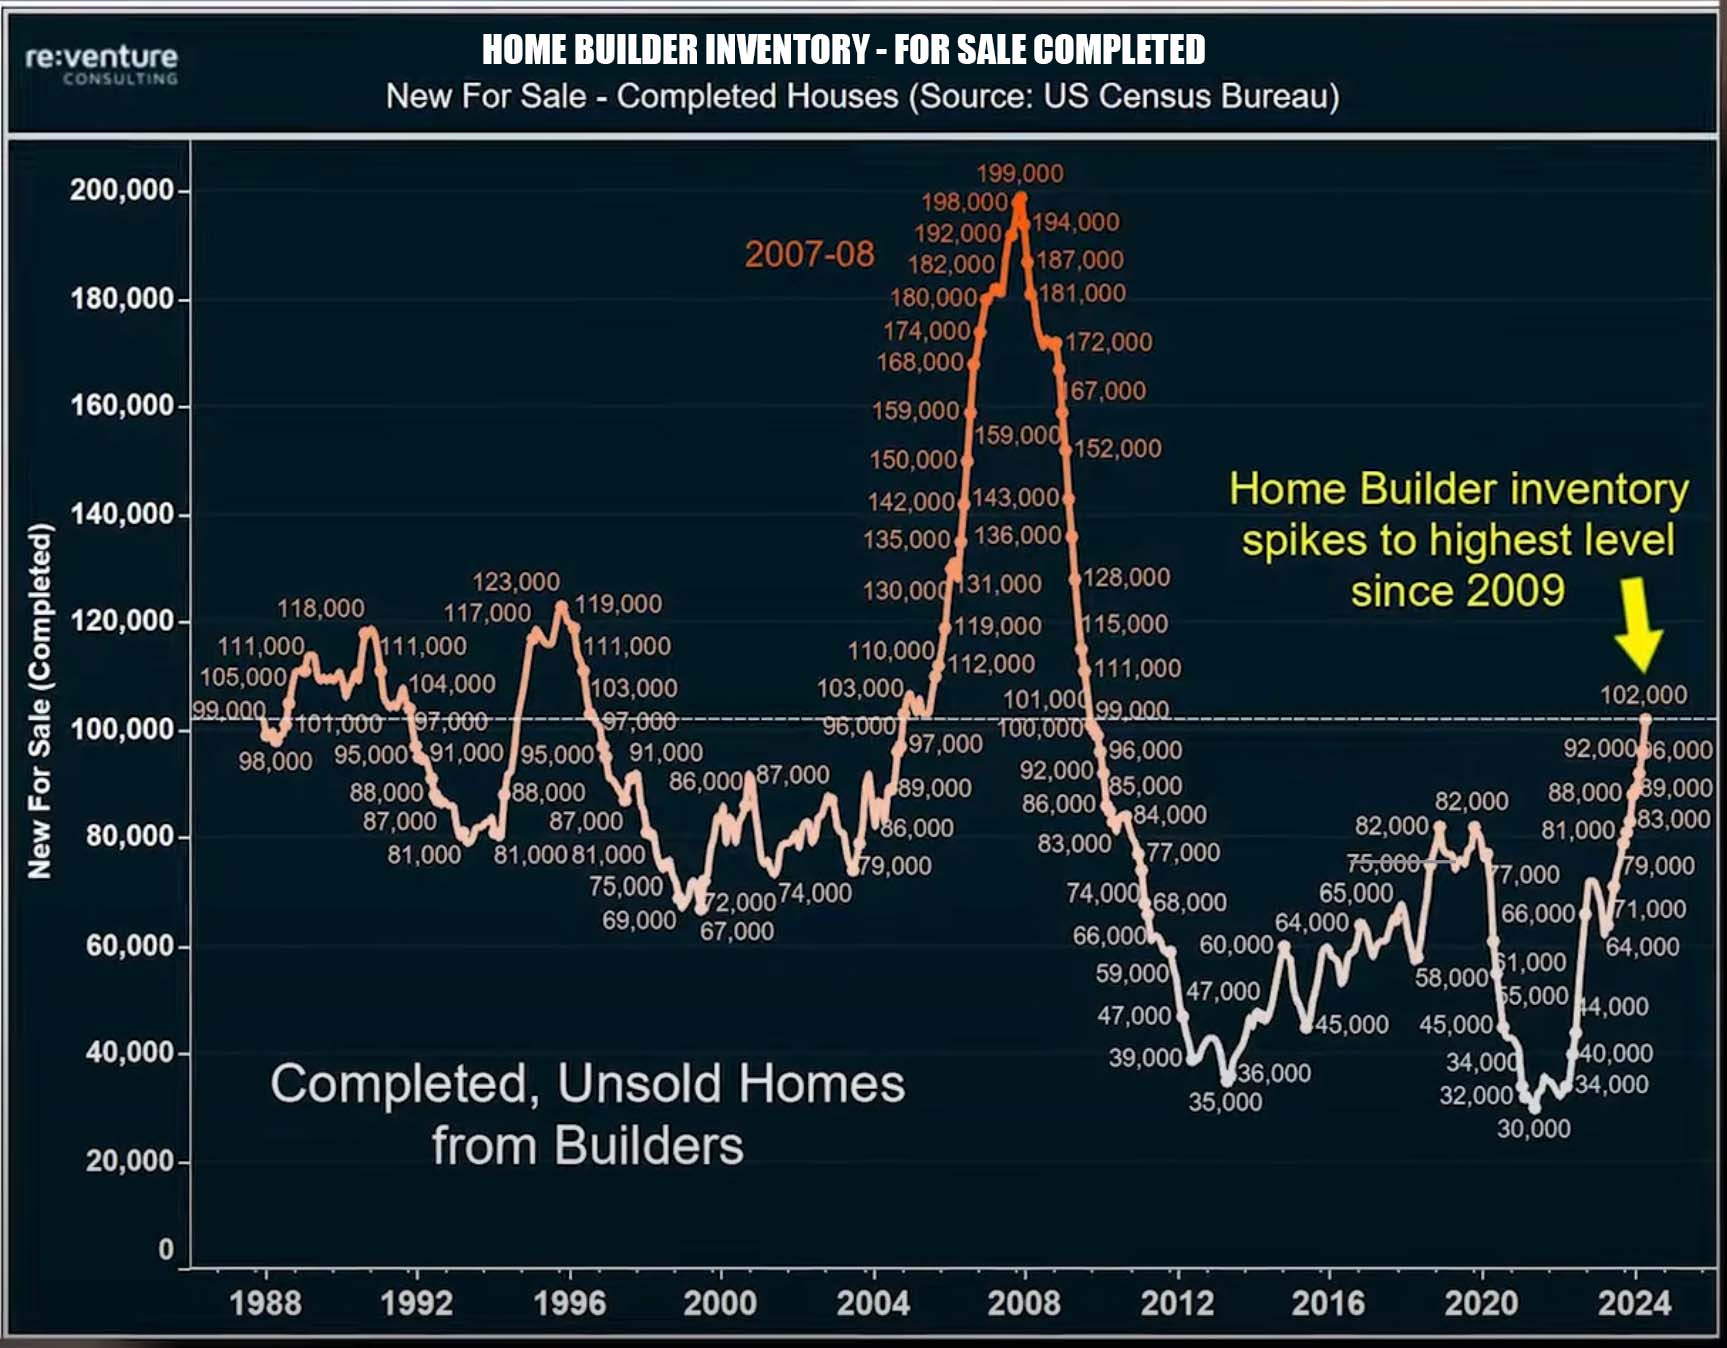
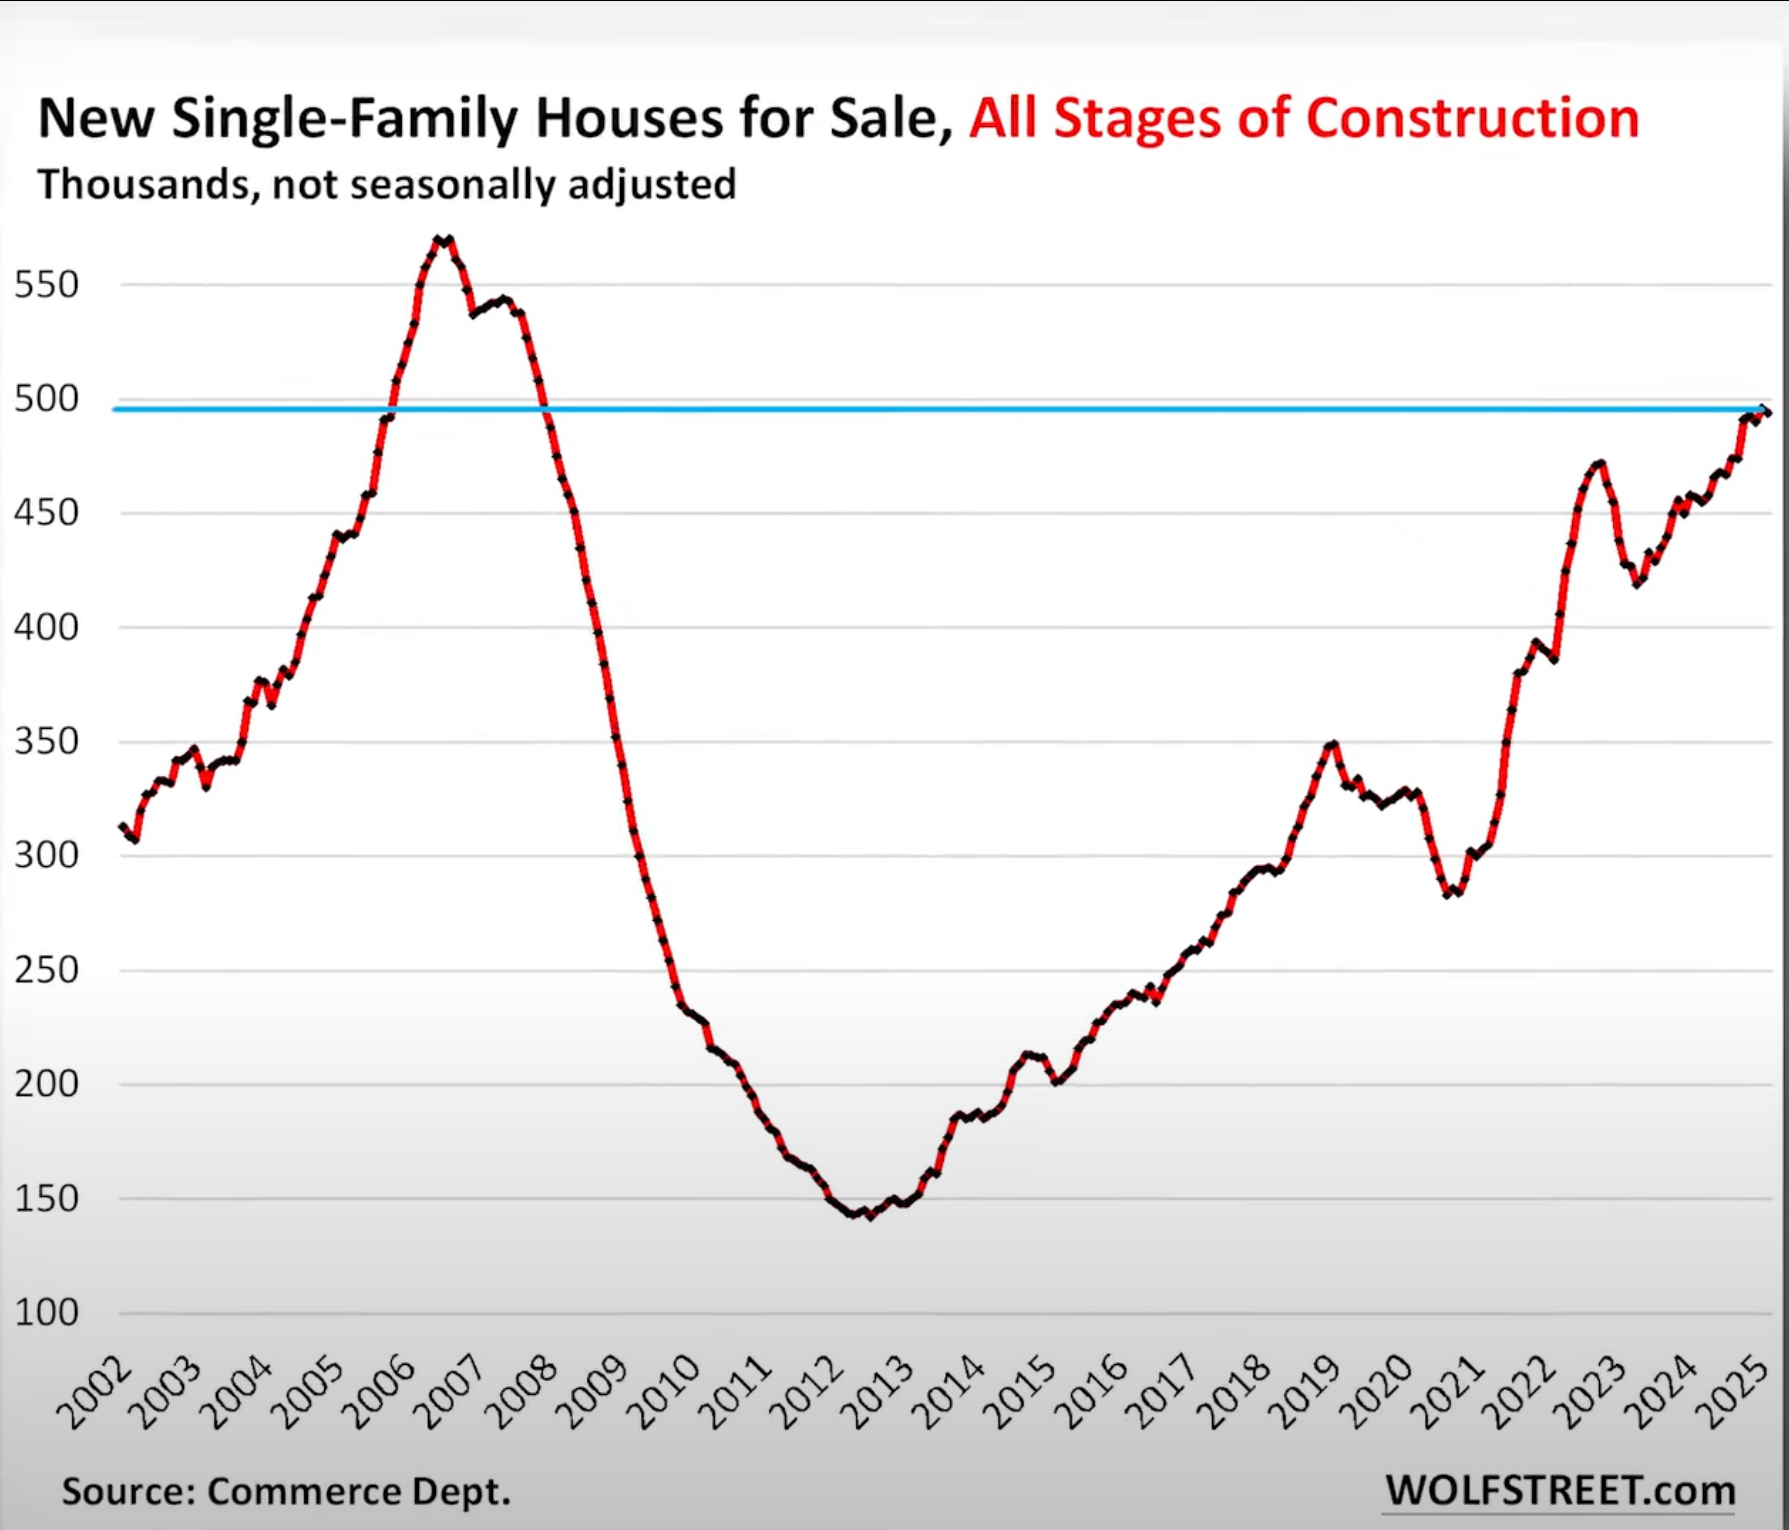
The Next Housing Crisis?
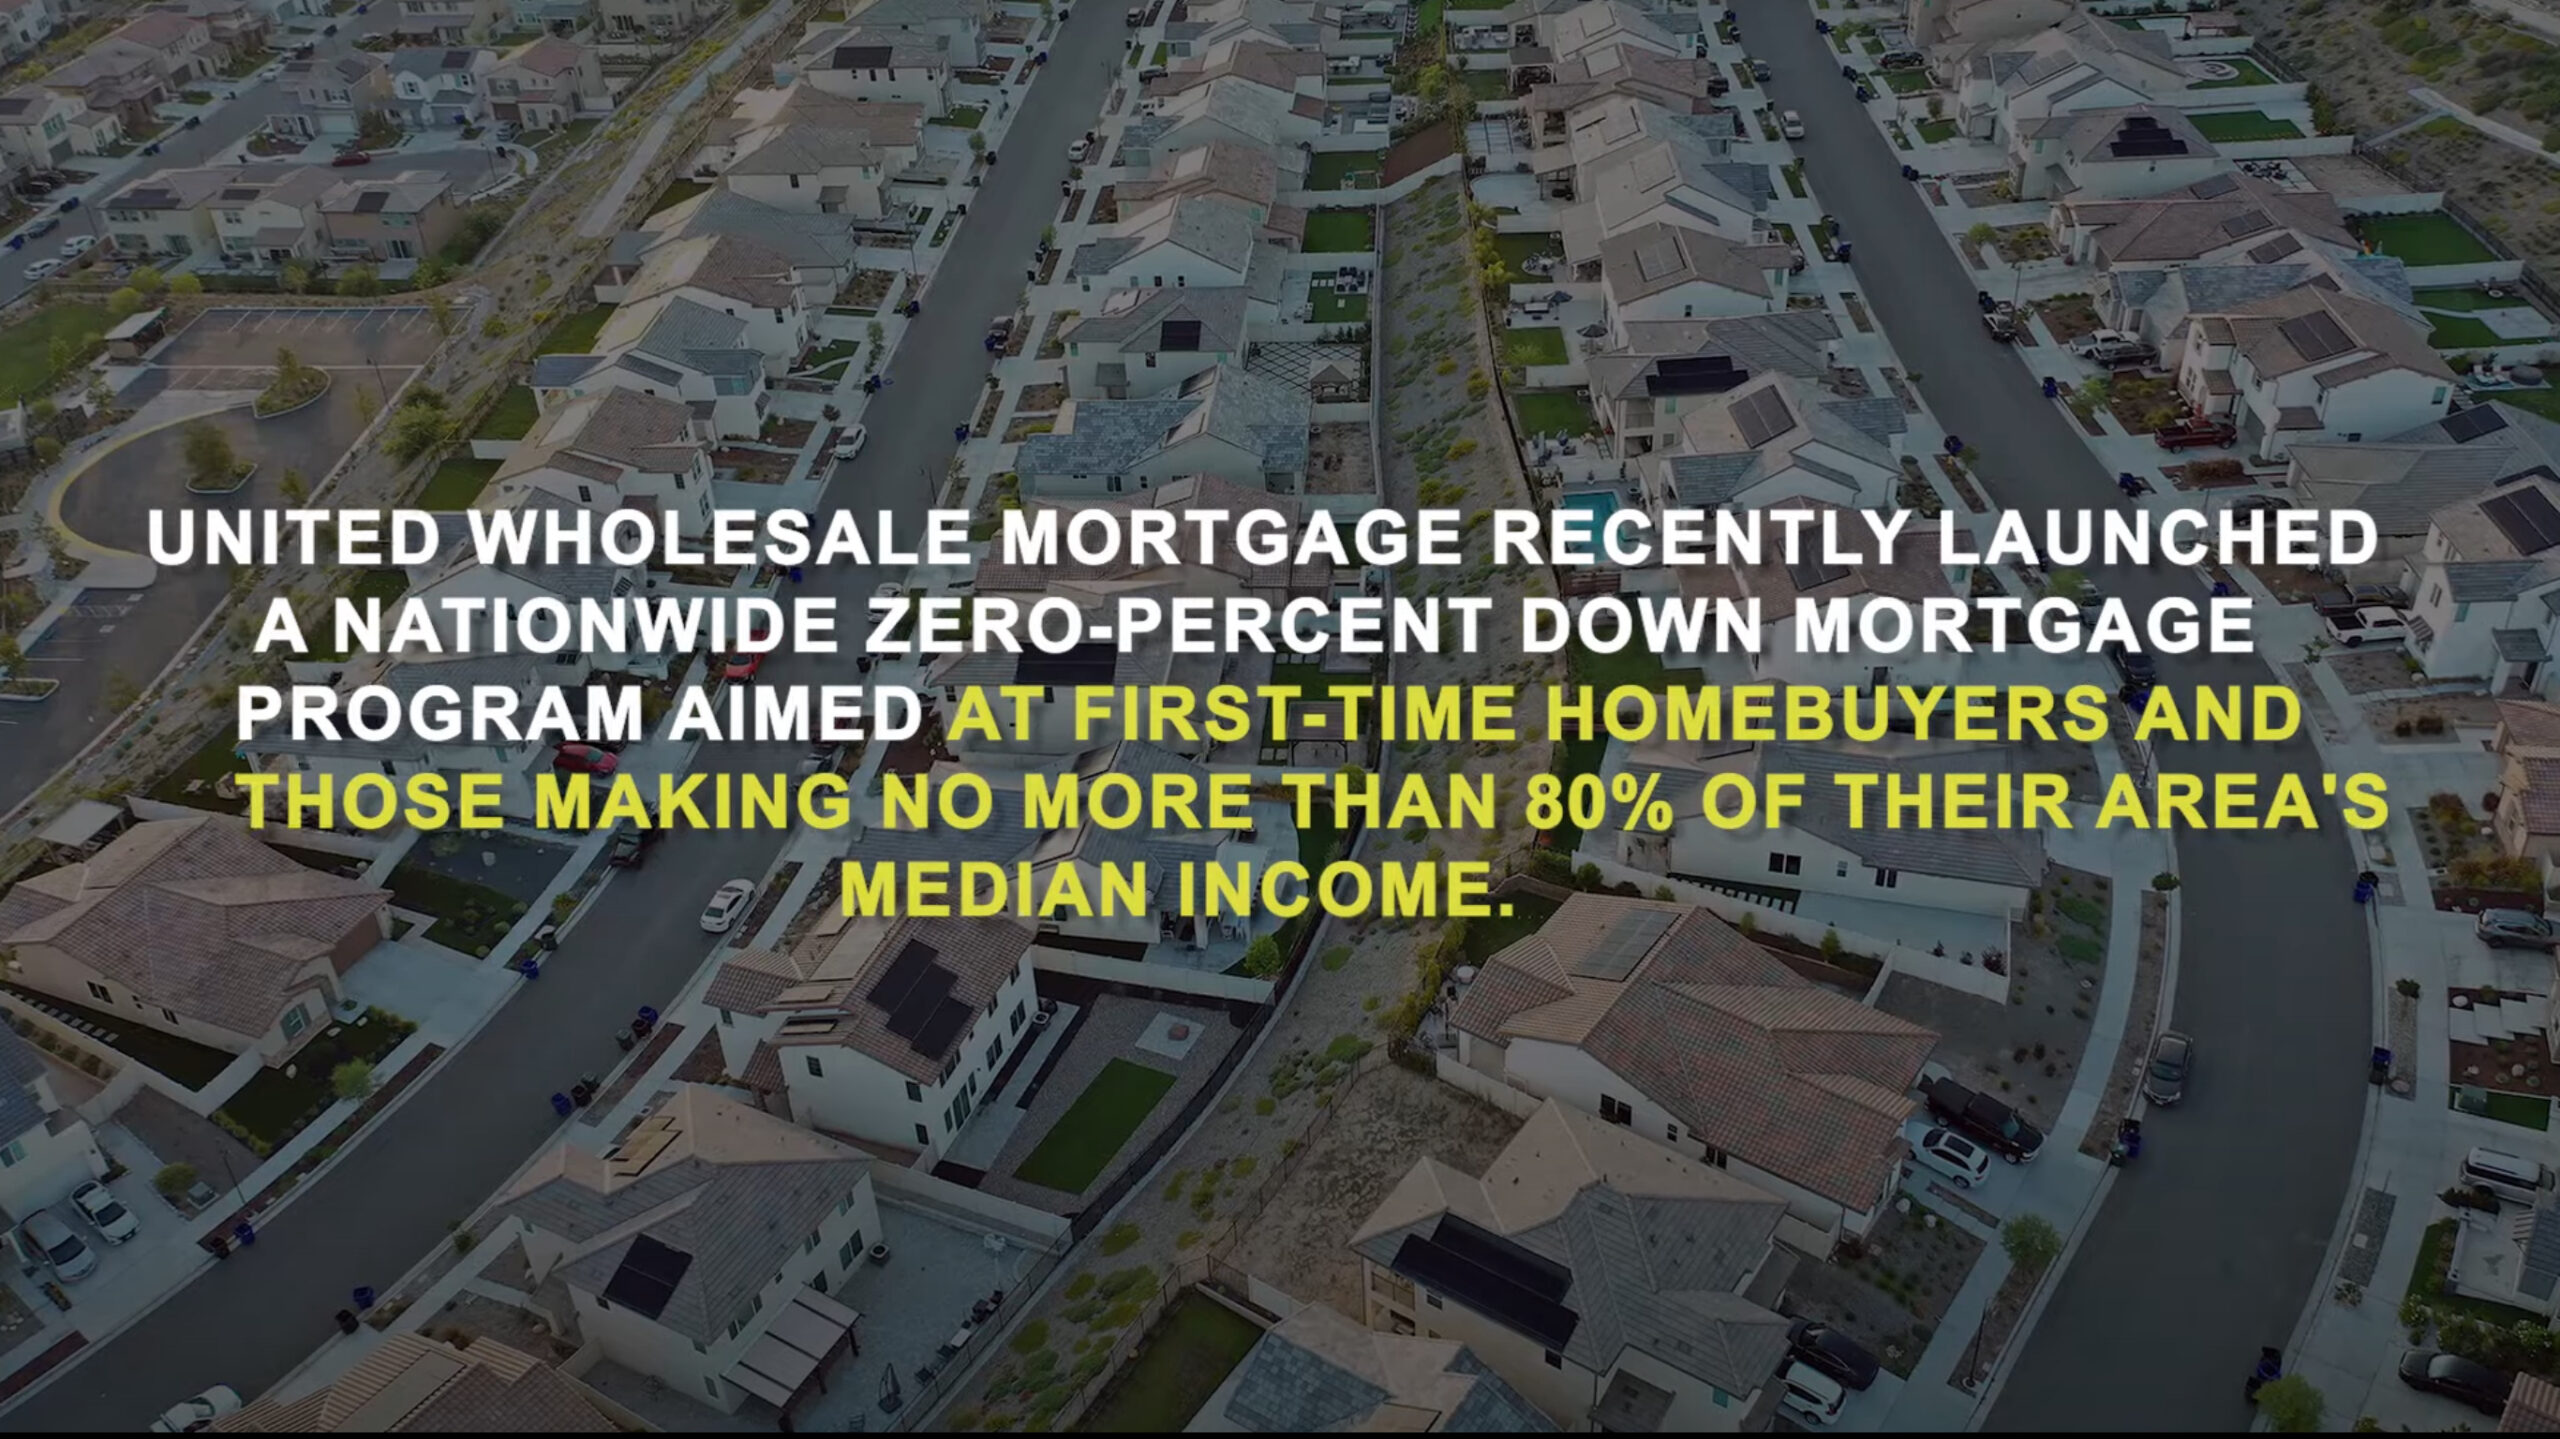
The specter of 2007/2008 is rearing its head. Completed home builder inventory has reached the highest levels since 2009. As was the case with “Sub-Prime,” lenders are coming up with some crazy schemes to sell the houses, with one lender now offering “Zero Down” to buyers with less than 80% of the average income in their location.
 On top of this, many homes were purchased during the pandemic when rates were at zero and they were purchased on ARMs that are coming due in the next 12-18 months…while 30YR rates are back at 7%+.
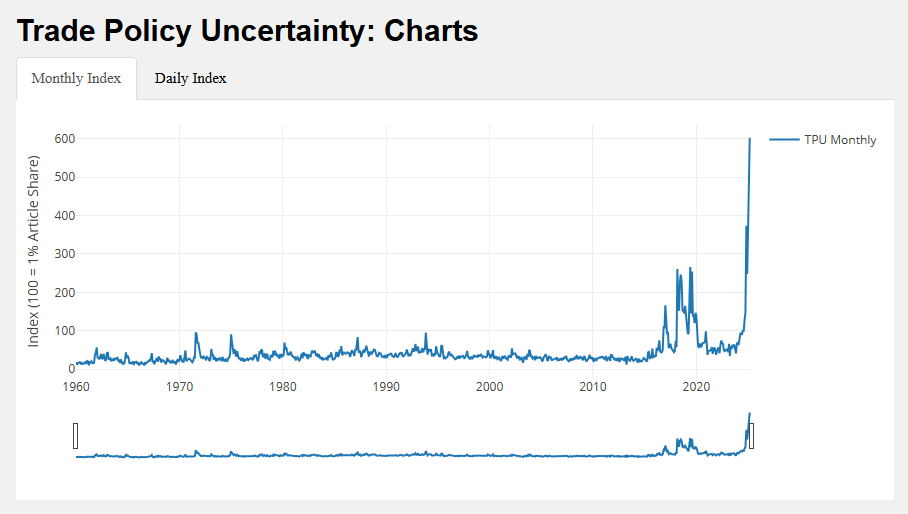
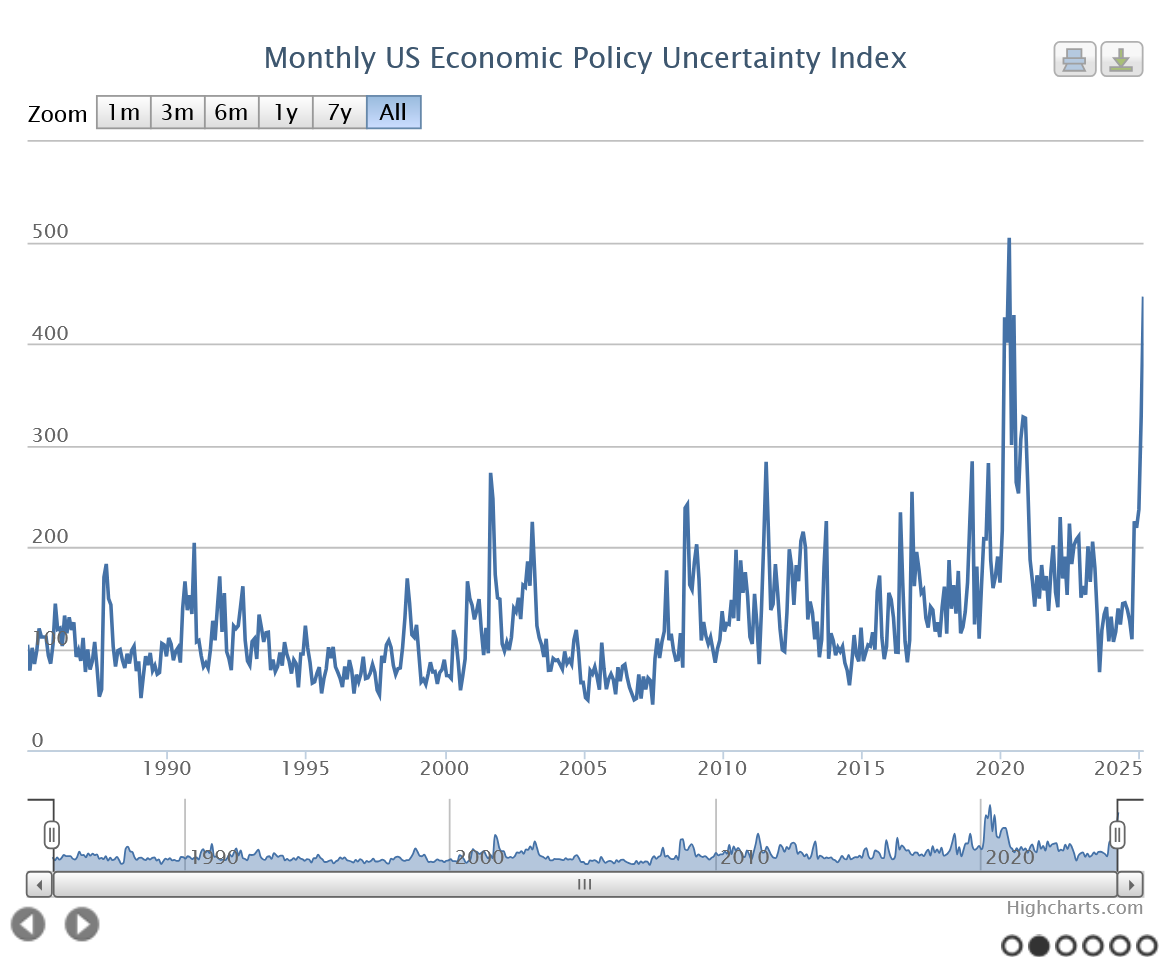
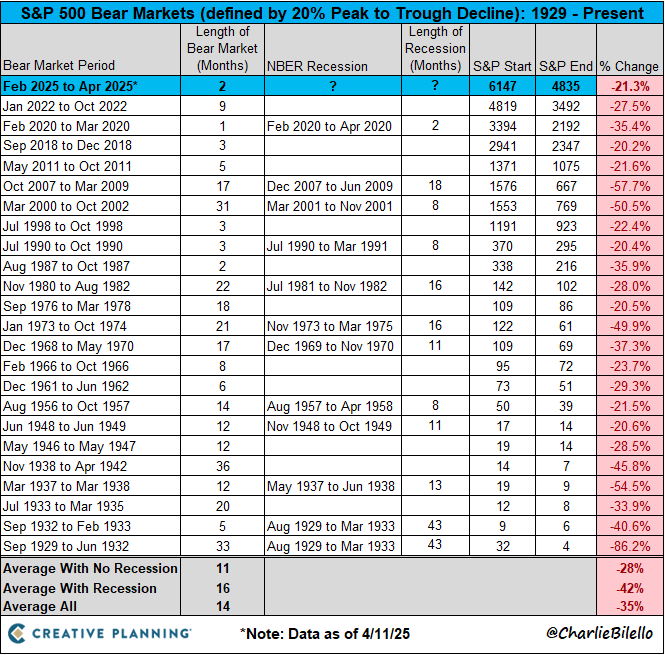
Of course, none of this changes the fact that sentiment remains low historically. As Charlie Bilello pointed out, these extremes, coupled with -20% drawdowns, have not always led to recessions. Like the retail “trader,” this is the thinking, because this is all we have known is recent history. Presently, we are in a situation where the entire globe is shunning America and the markets can be driven to extreme volatility by a social media “tweet.” Tariffs on, tariffs off. There is no consistency. If the tariffs magically went away (like Covid) it would be a reprieve and leave prices dealing with actual consumer data and inflation but also a severely damaged reputation for the U.S. It is important to note the threats to fire Jerome Powell this week would NOT be received well at all and could be fuel for even sharper declines.
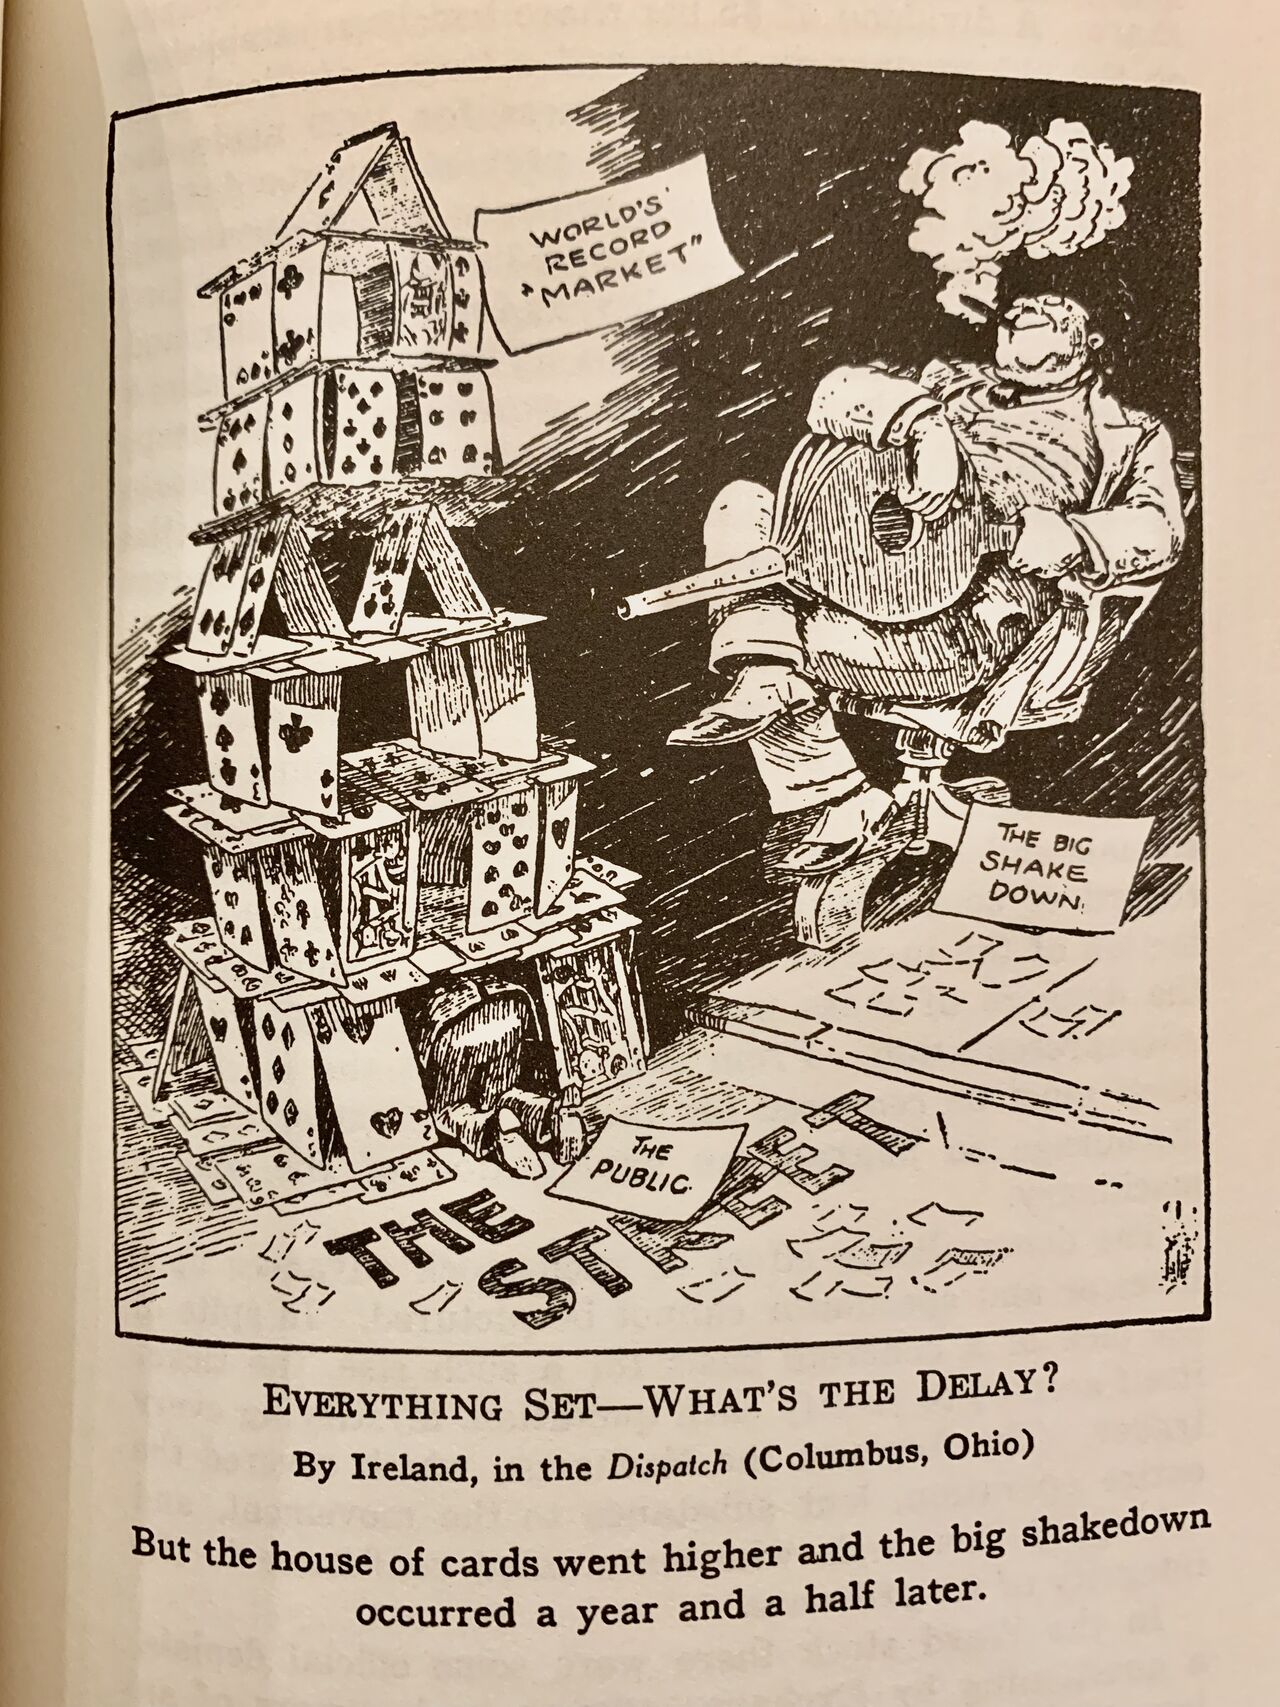
 None of this is new. As this old-time cartoon illustrates, inviting the public into your house at just the right time is a recipe to keep you as the fat cat with the bellows in hand while the little guy gets crushed. Big Money makes bank up or down. This market has not hit the retail jugular yet. It would seem that selling the RIP is the preferred strategy and new lows are in the offing?
 Re-printing from the March Timing Update:
“Again, this current window does not end until early May and could run into mid-Summer, late July to early August. While the energy shifts a bit coming out of March, April has the potential to be much more aggressive. Conflict is a keyword, how it plays out needs to be seen. I would not rule out a Black Swan in April, something that confirms the long-term trends and takes participants by storm. The weekend of April 19-20 is key with the 21st as the next ultra critical timing point.”
“While this window runs through the first week of May, it is looking more and more, from a cycles standpoint, that this will run well into Q4 2025/Q1 2026. Thus, a much more protracted and drawn-out bear and not the “flash crash” that everyone has gotten used to over the past two decades. That doesn’t mean we won’t have significant rallies, but chasing rallies is likely to be a losing strategy until this thing is spent…which very likely will not be until Q1 2026 at this point.” I would add right here that the last 10-12 days of April could be really wild.”
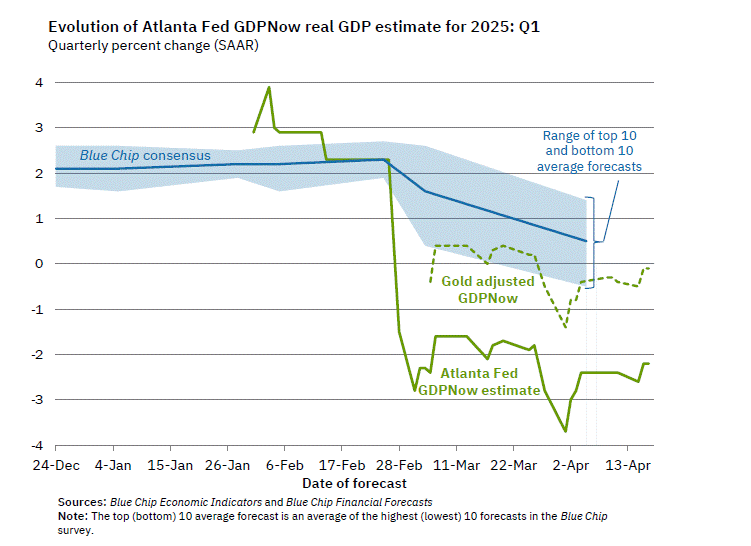 GDP isn’t released until month’s end and the data will be polluted by companies front-running the tariffs. Atlanta Fed is now predicting the Q1 to be -2.2% and -0.2% when accounting for gold imports.
Dow Theory
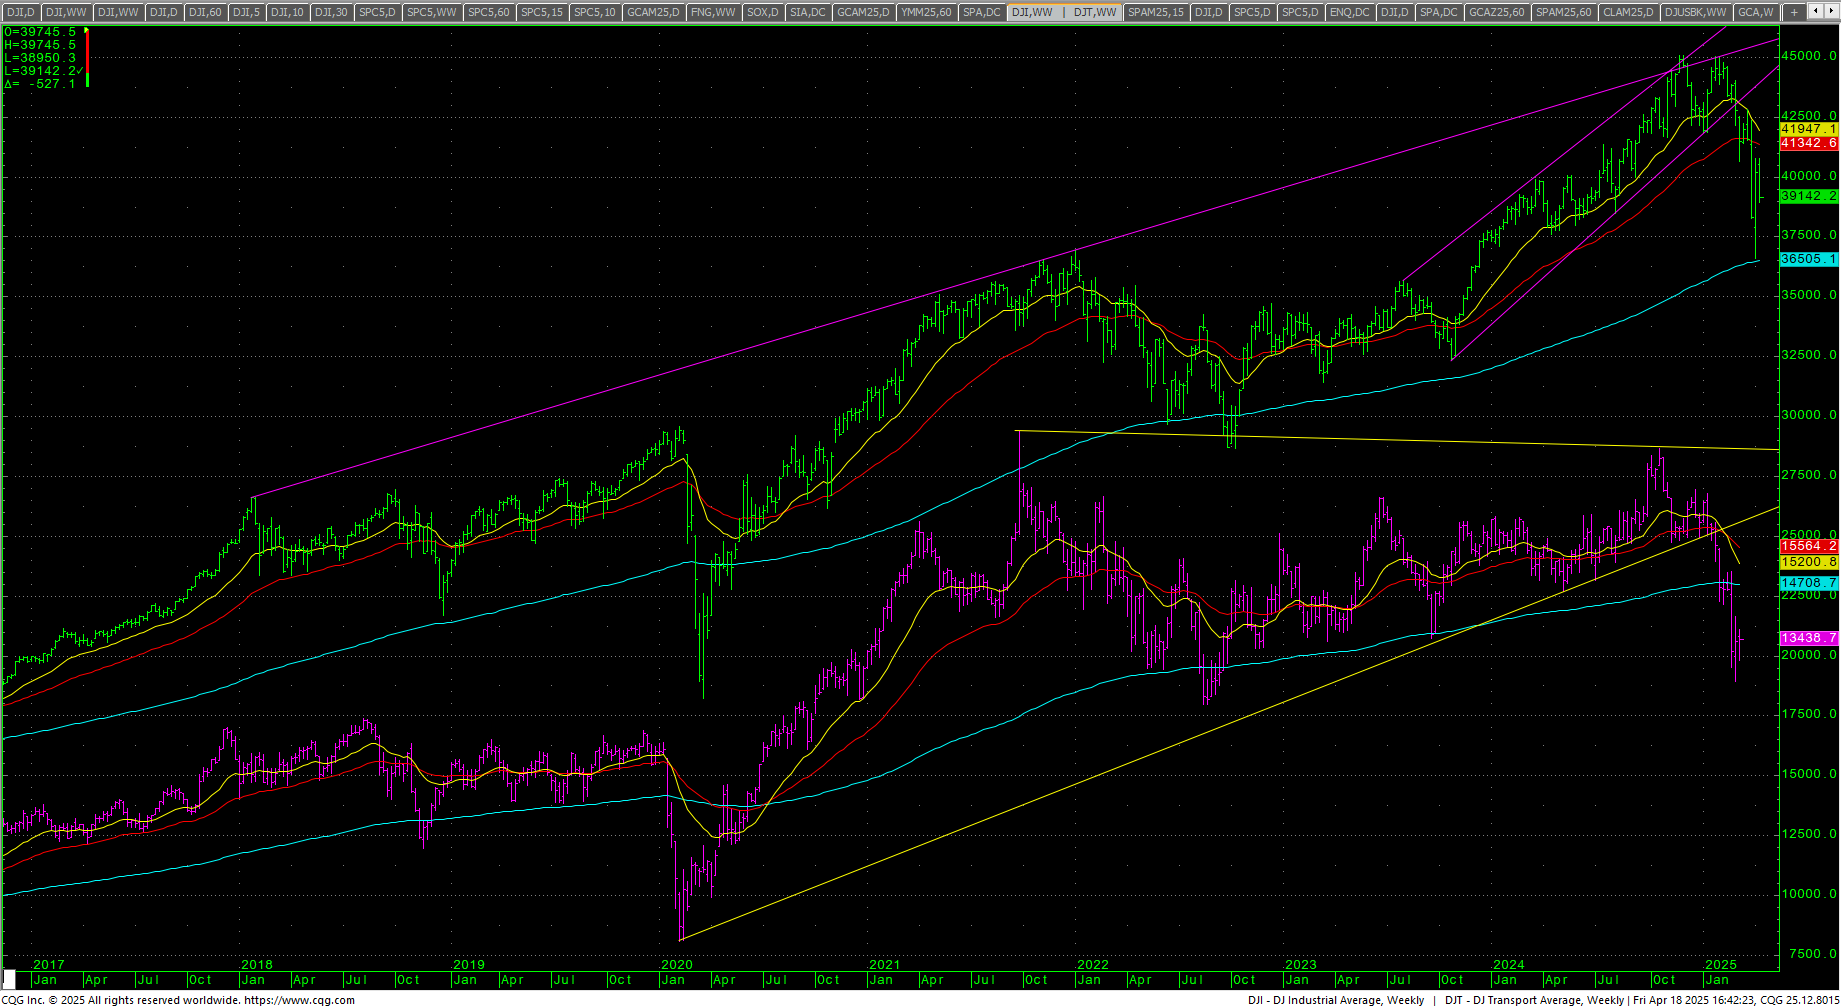
 Dow Theory still has a bearish pattern.
MAGS (Magnificent 7) Daily H-L-C
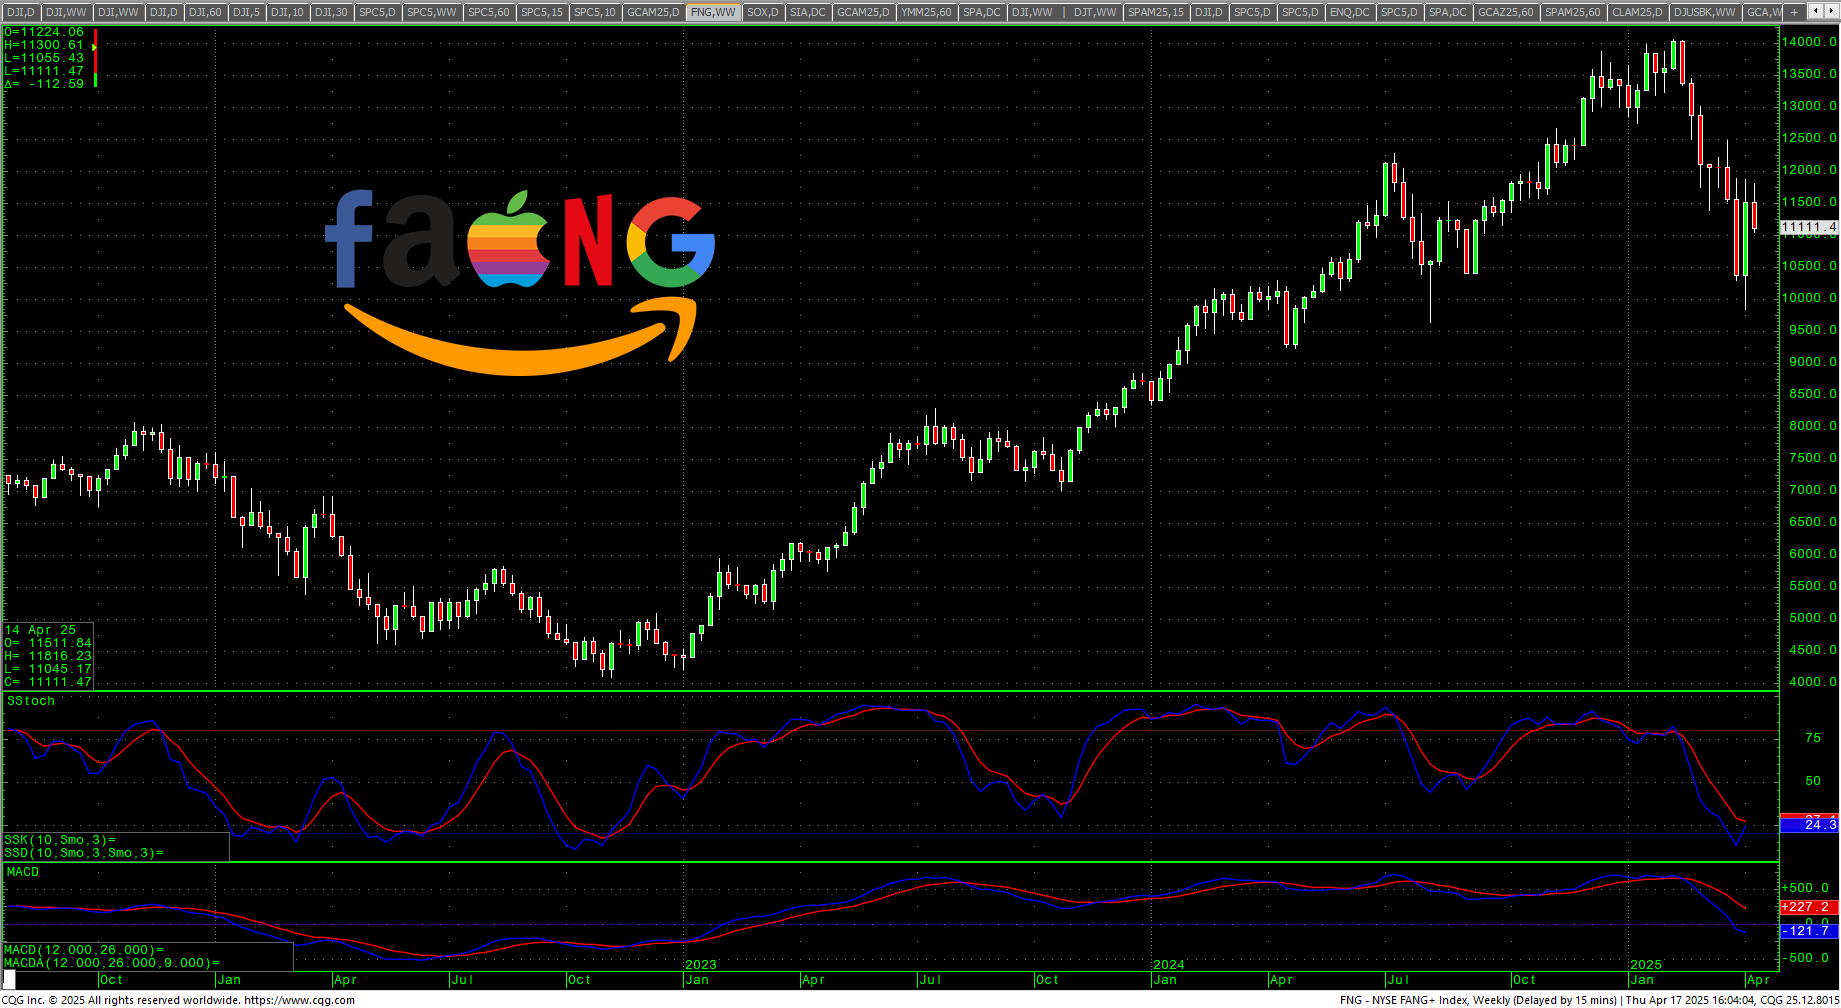
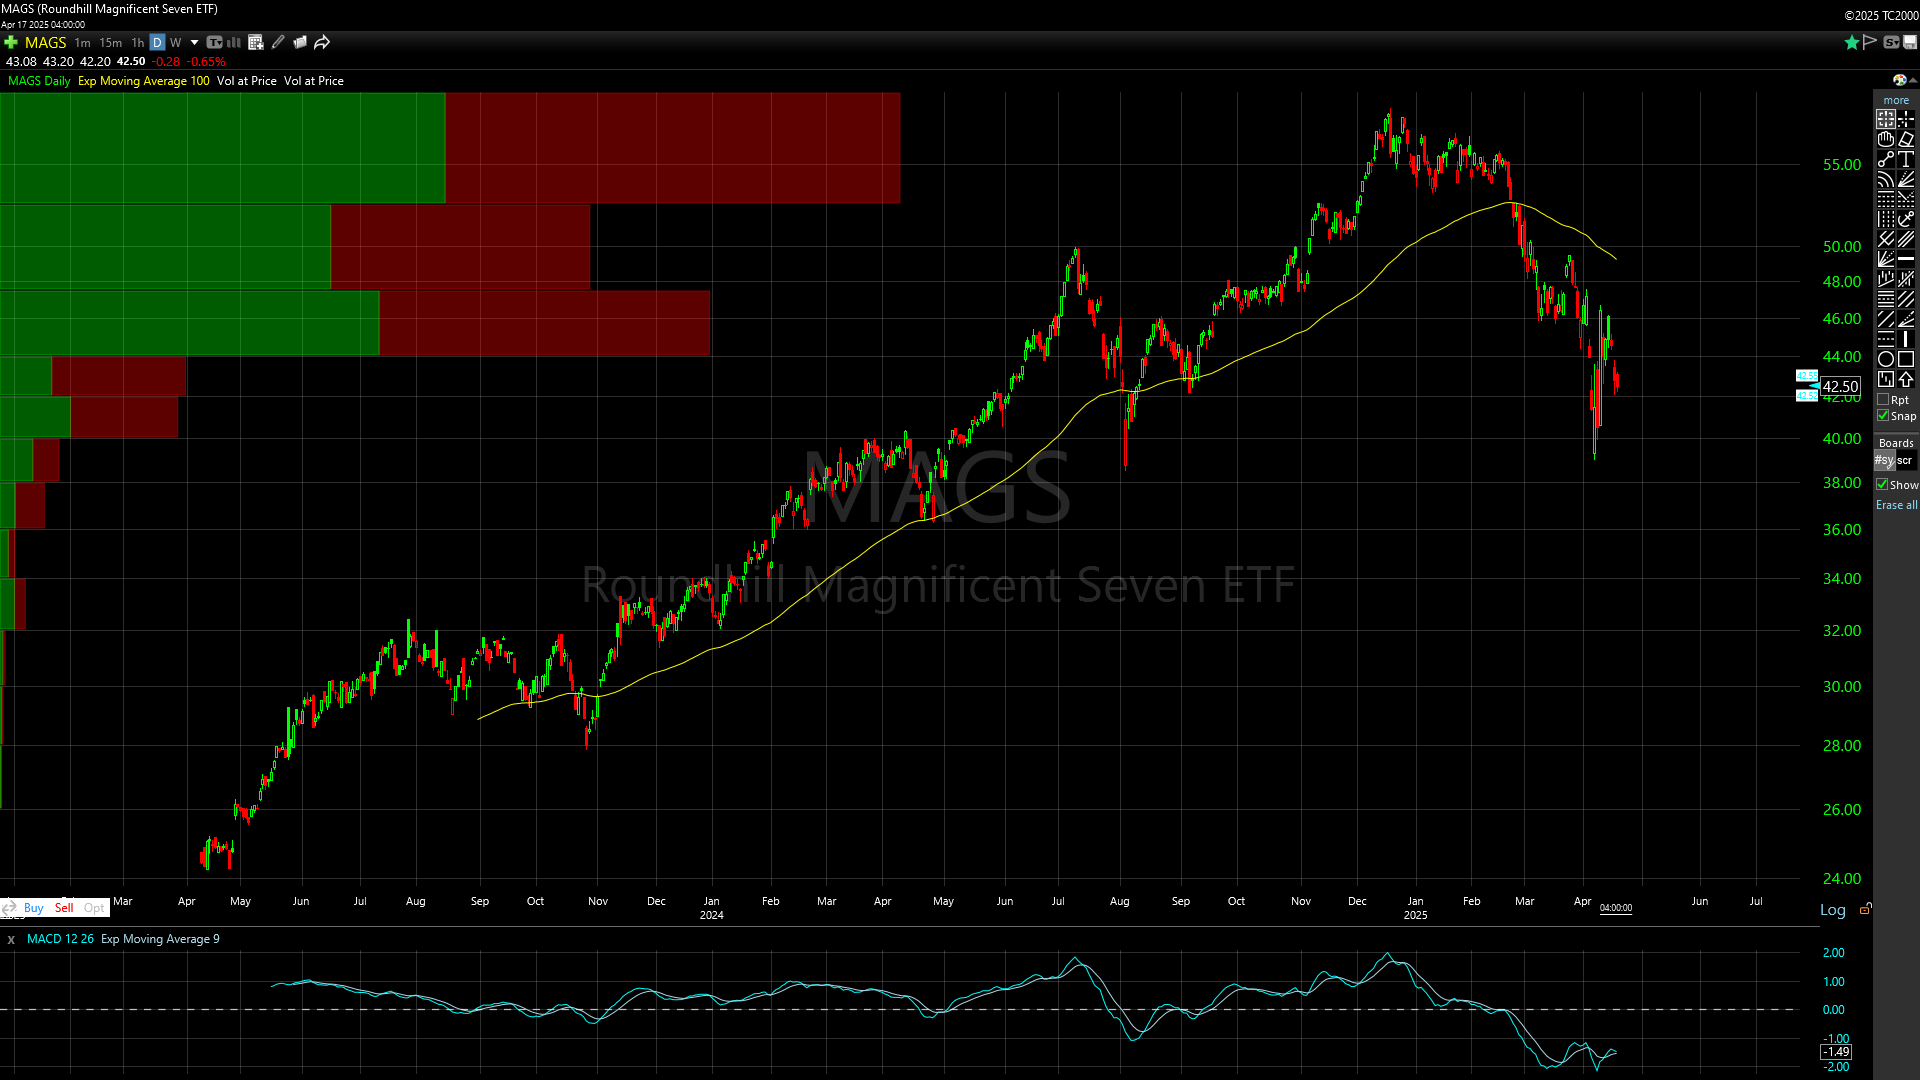 The MAGS (Magnificent 7) traded an inside week and closed on the low. As the chart shows, this is one of the most top-heavy charts in history where Volume at Price is basically ALL AT THE TOP. Retail has been the biggest buyers. Somewhere underneath here we will hit a major artery for retail. Basically, the floor is the limit. If this is year 2000 all over again, the MAGS could go all the way back to where it started. Selling rallies should remain the short-term strategy until proven otherwise. Closes over 50 in the MAGS would change things.
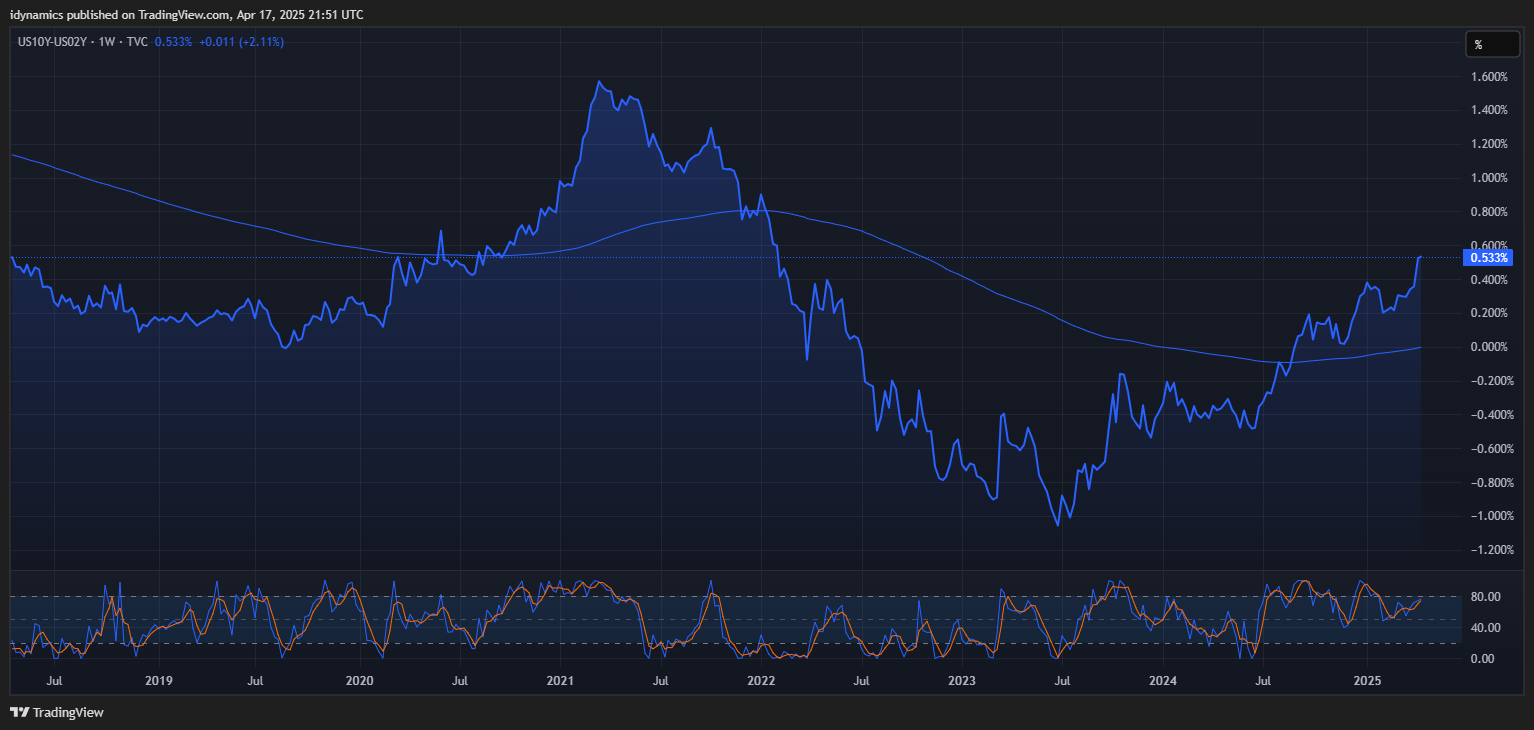
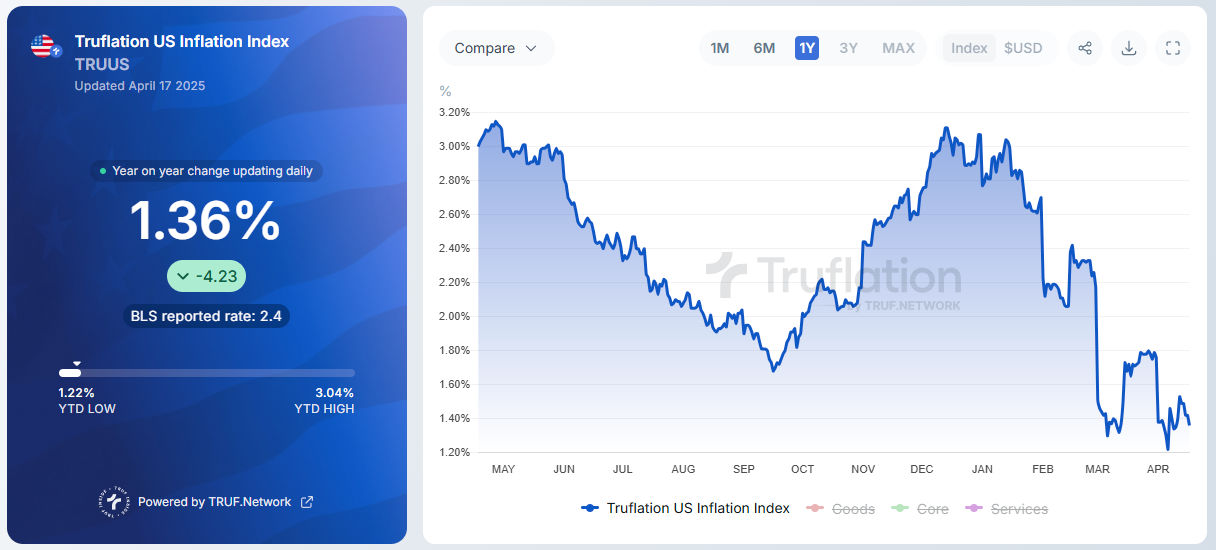
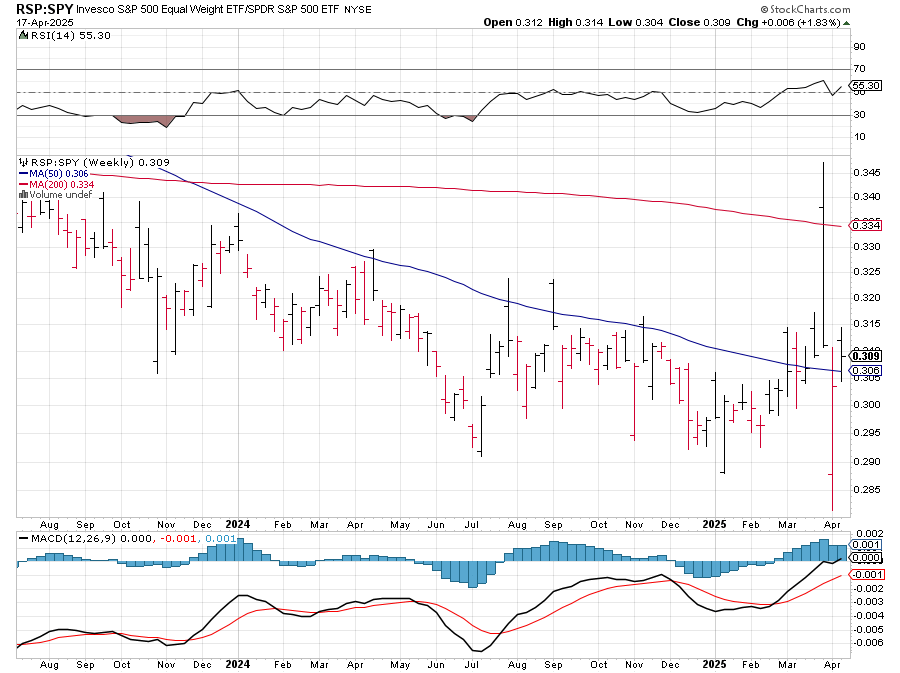
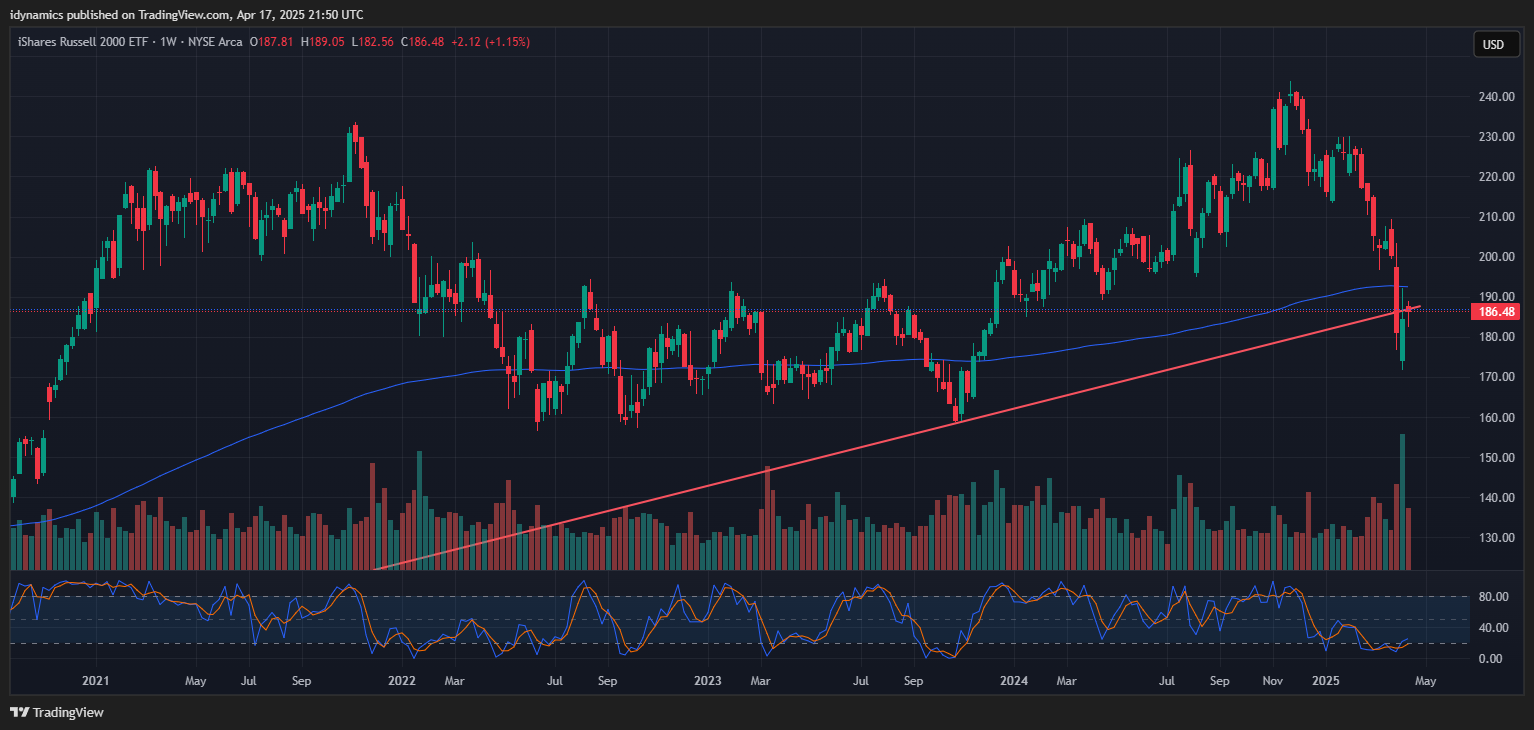
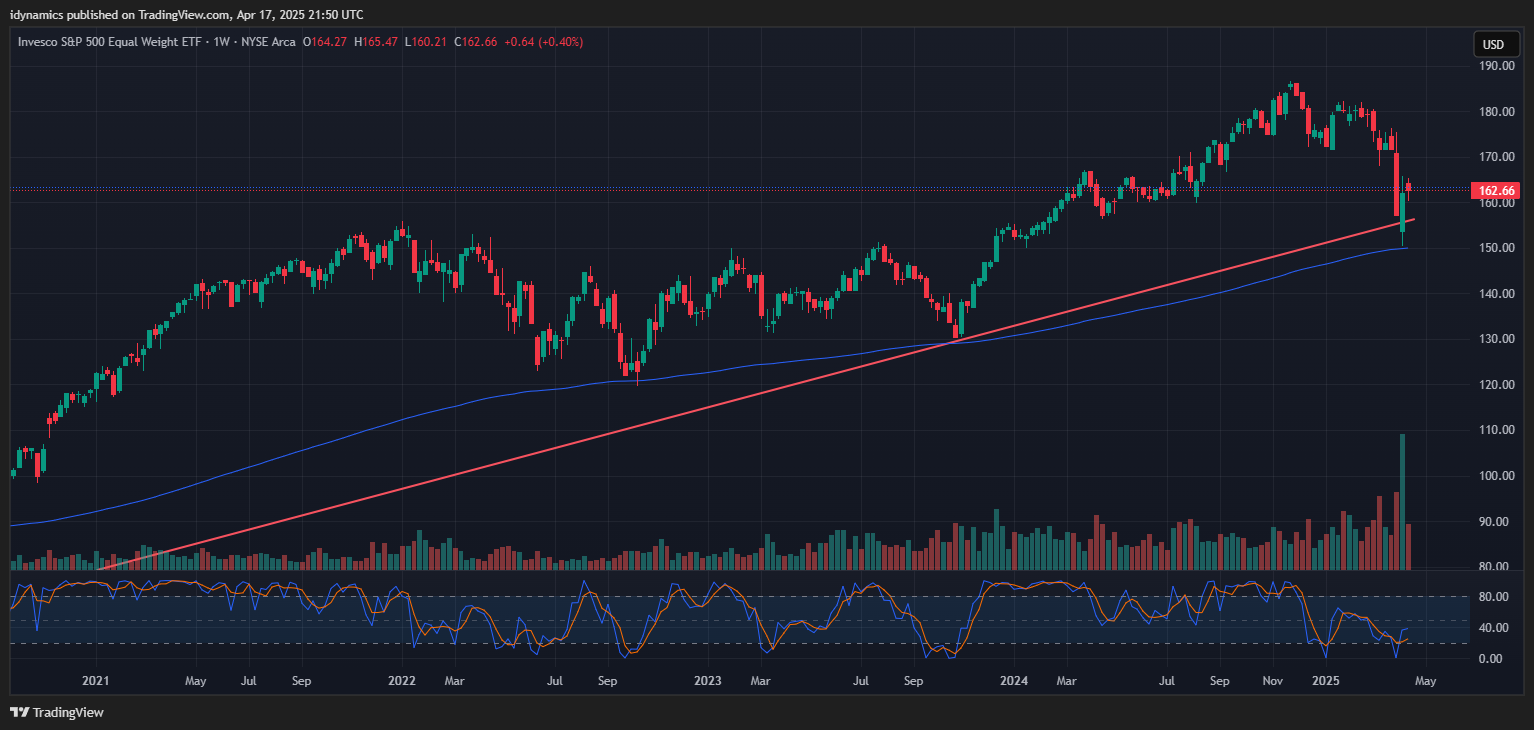
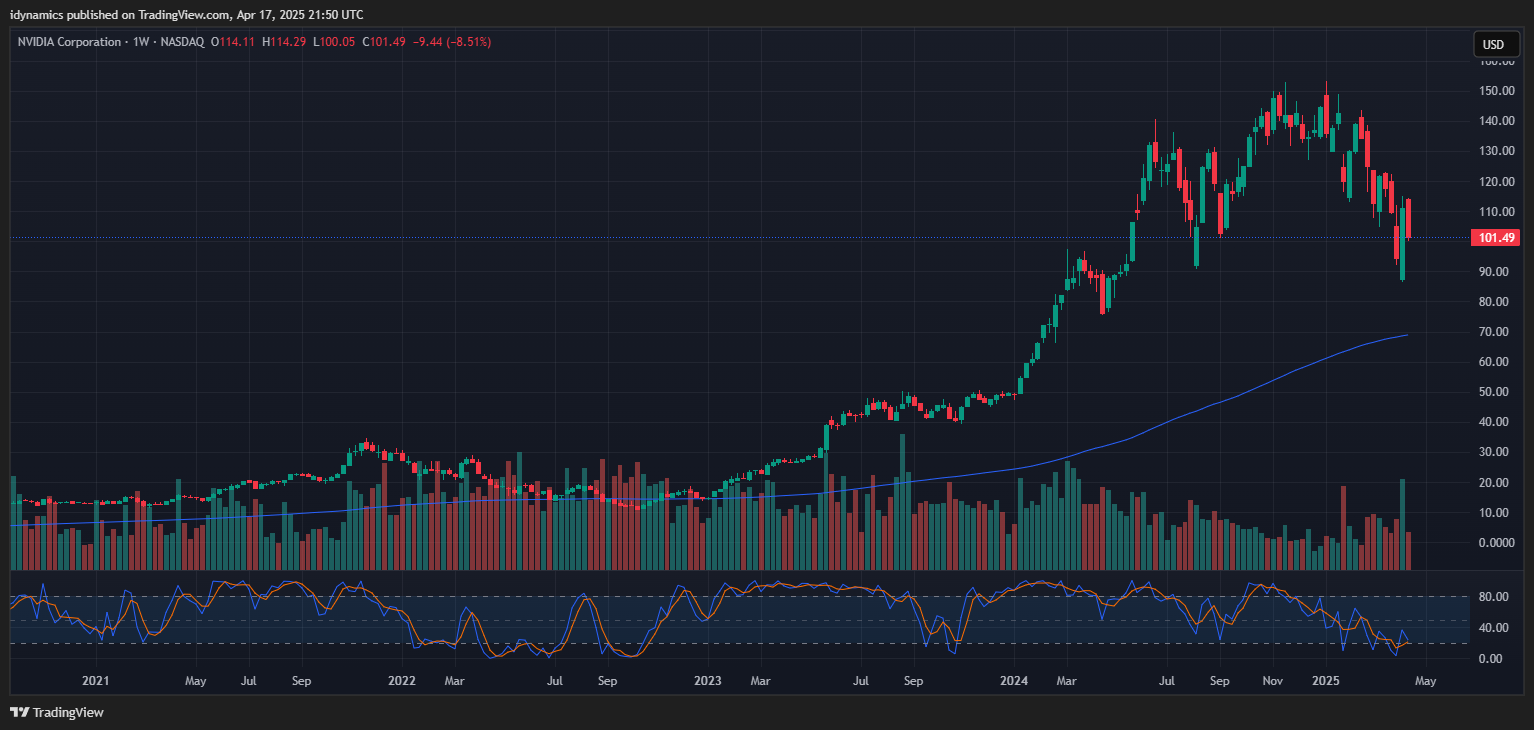
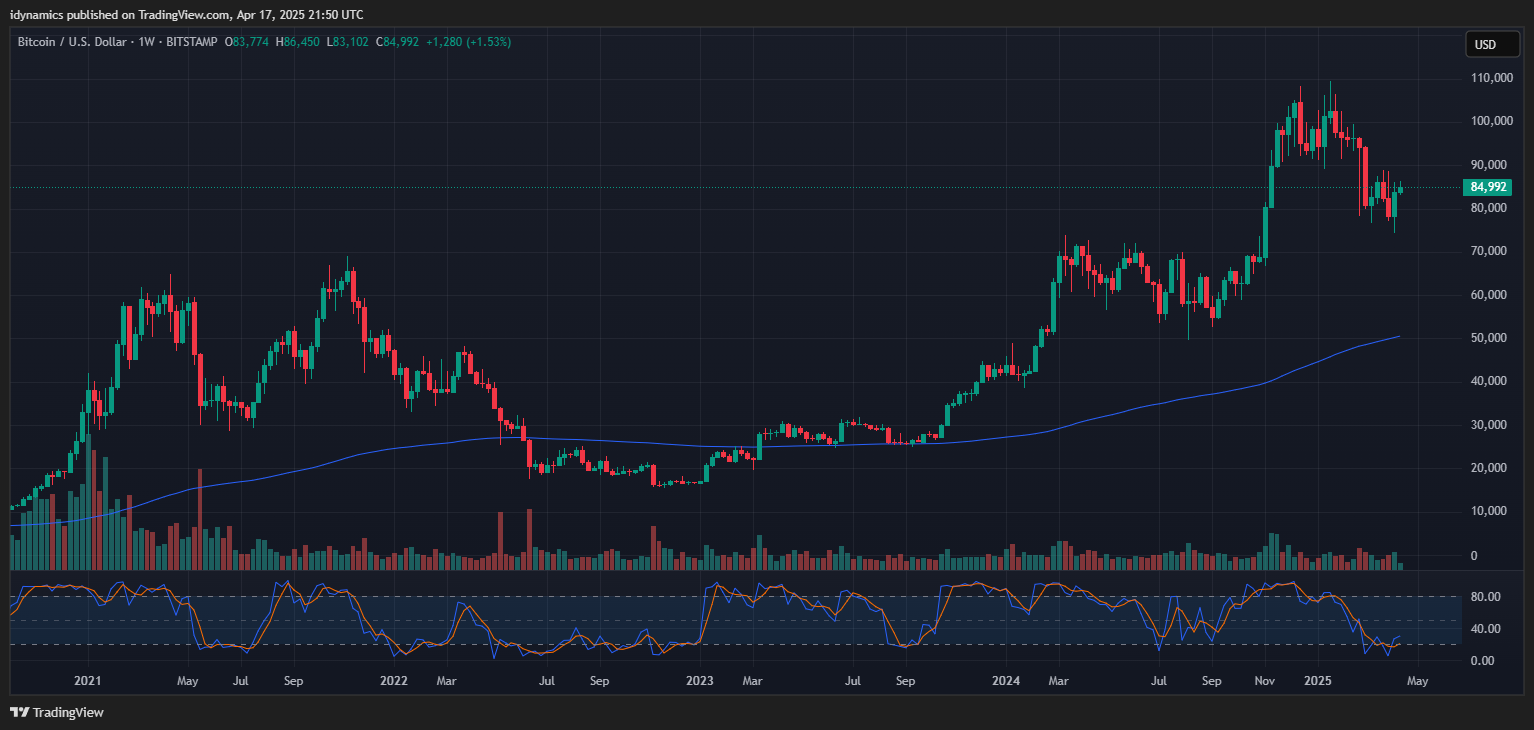
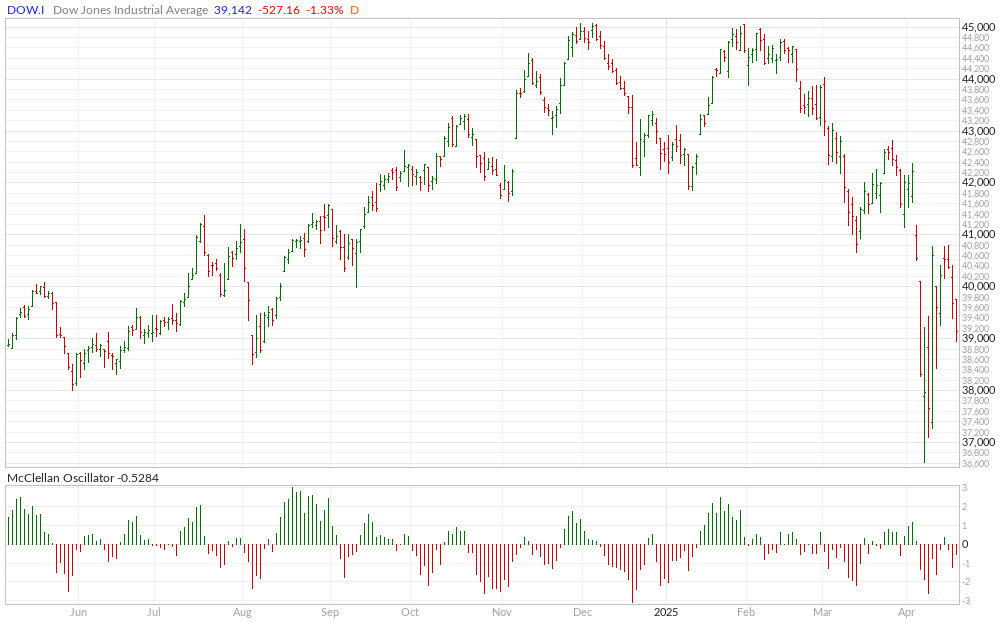
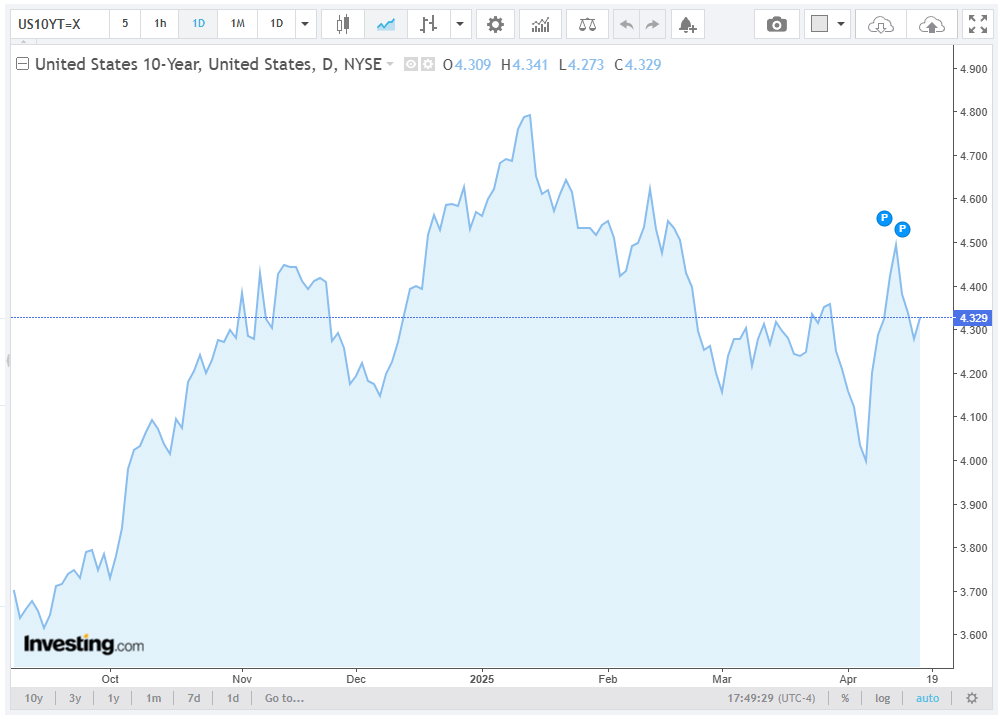
The RSP:SPY closed higher on the week as the weekly still looks like it is trying to bottom, albeit in a violent fashion. The IWM traded a tight inside week and closed near the middle of the range. The RSP also traded a tight inside range, closing toward the middle of the range. NVDA closed the week down -9.44%, on the bottom of an inside week’s range. Bitcoin traded an extremely tight range as it continues to hold above 80K. McClellan Oscillators are confirming the weakness in the Dow. The Yield Curve continued to expand and set new highs for the move at 0.533%. The 10YR yield closed out the week lower at 4.329%. Truflation was neutral at 1.36%.
10YR-2YR Yield Curve Daily

 VIX Weekly Candles

The VIX was lower all week and closed back under the 30 level on the bottom of the weekly range. The US Dollar traded a tight inside weeks range and closed slightly lower, under the 100 level and the lowest weekly close since 28 March 2022 and is threatening the bottom of the trading range of the past few years.
 Nasdaq 100 Weekly Candles52-Week A/D Line
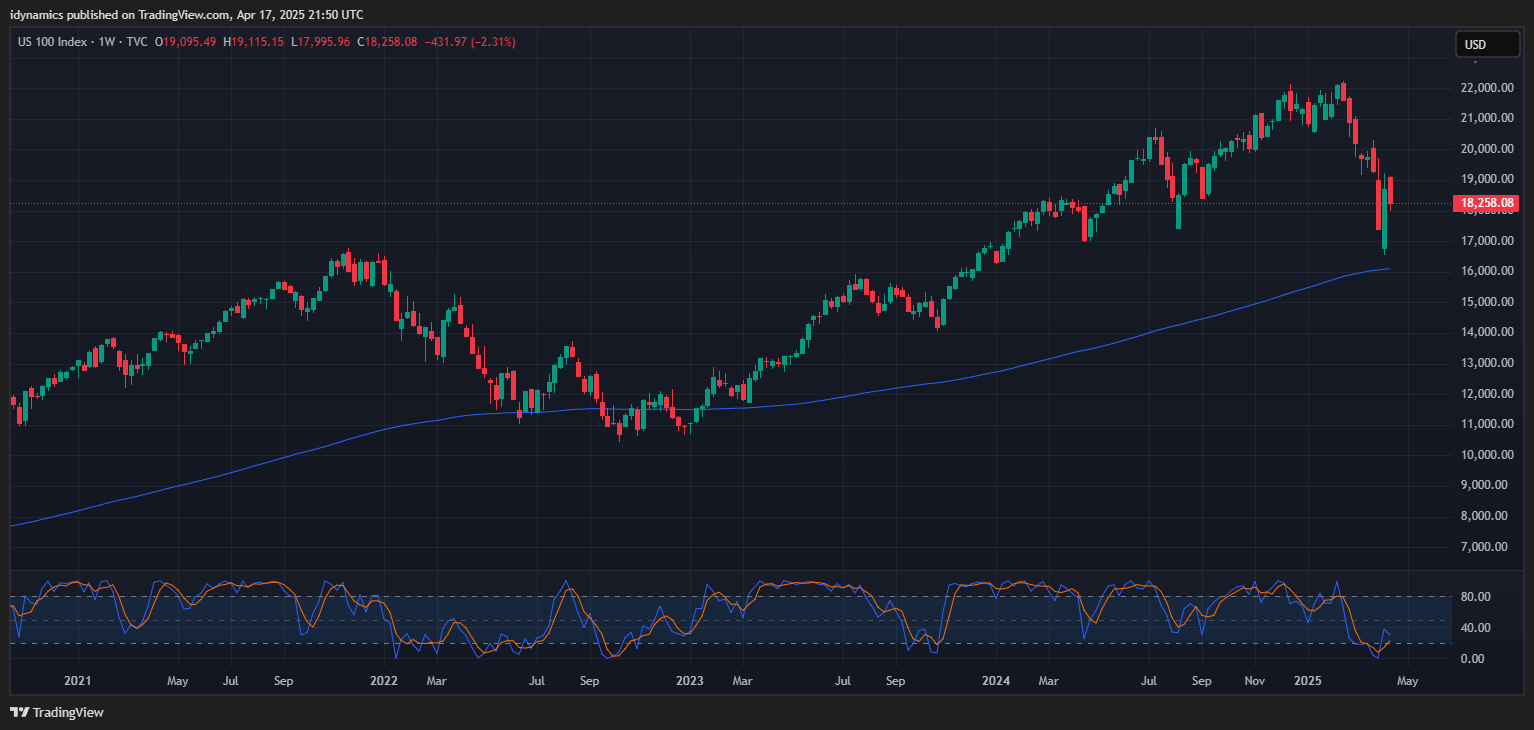
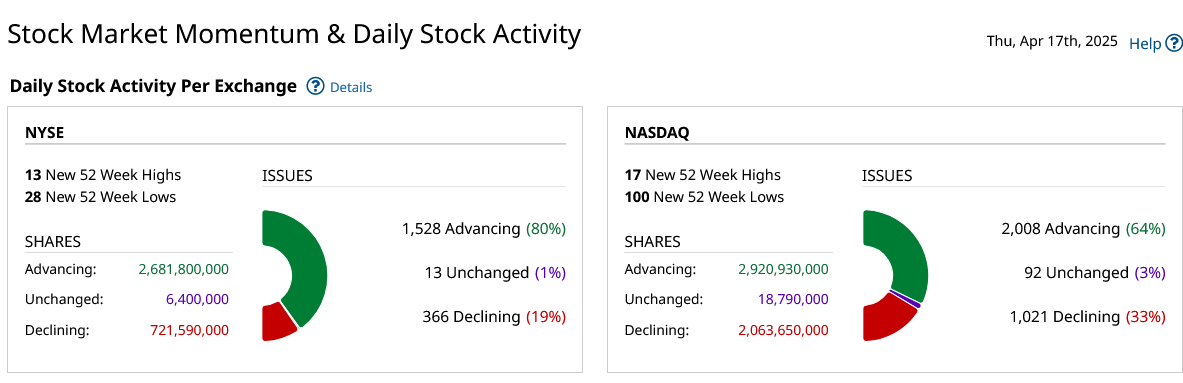
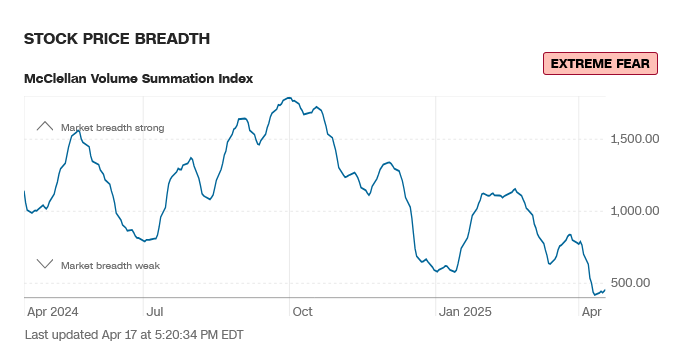
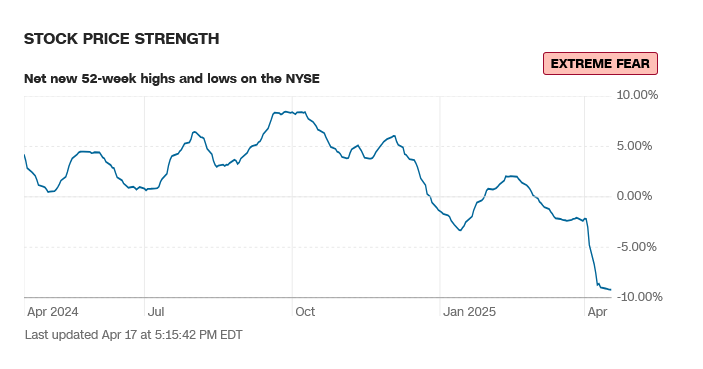
Breadth was decent on Friday but weak overall and sentiment remains in extreme fear.
CNN Fear & Greed Index
 AAII Investor Sentiment Survey
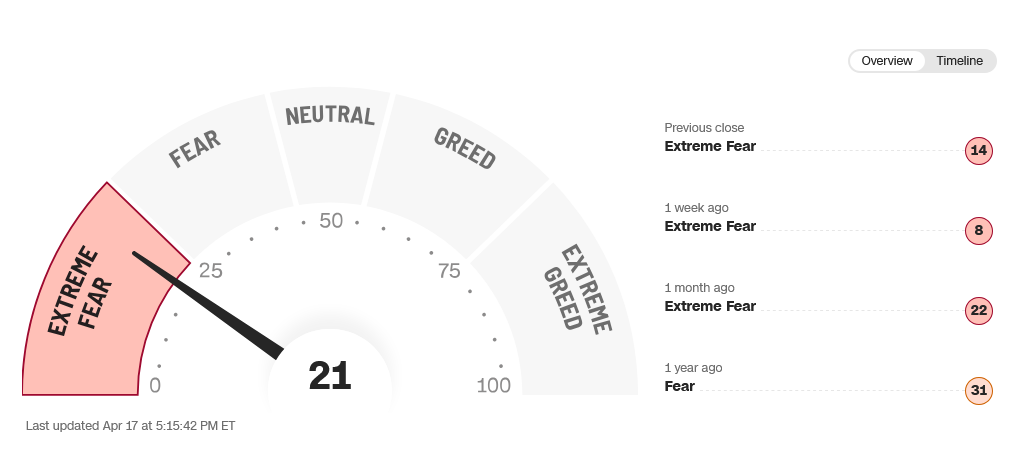
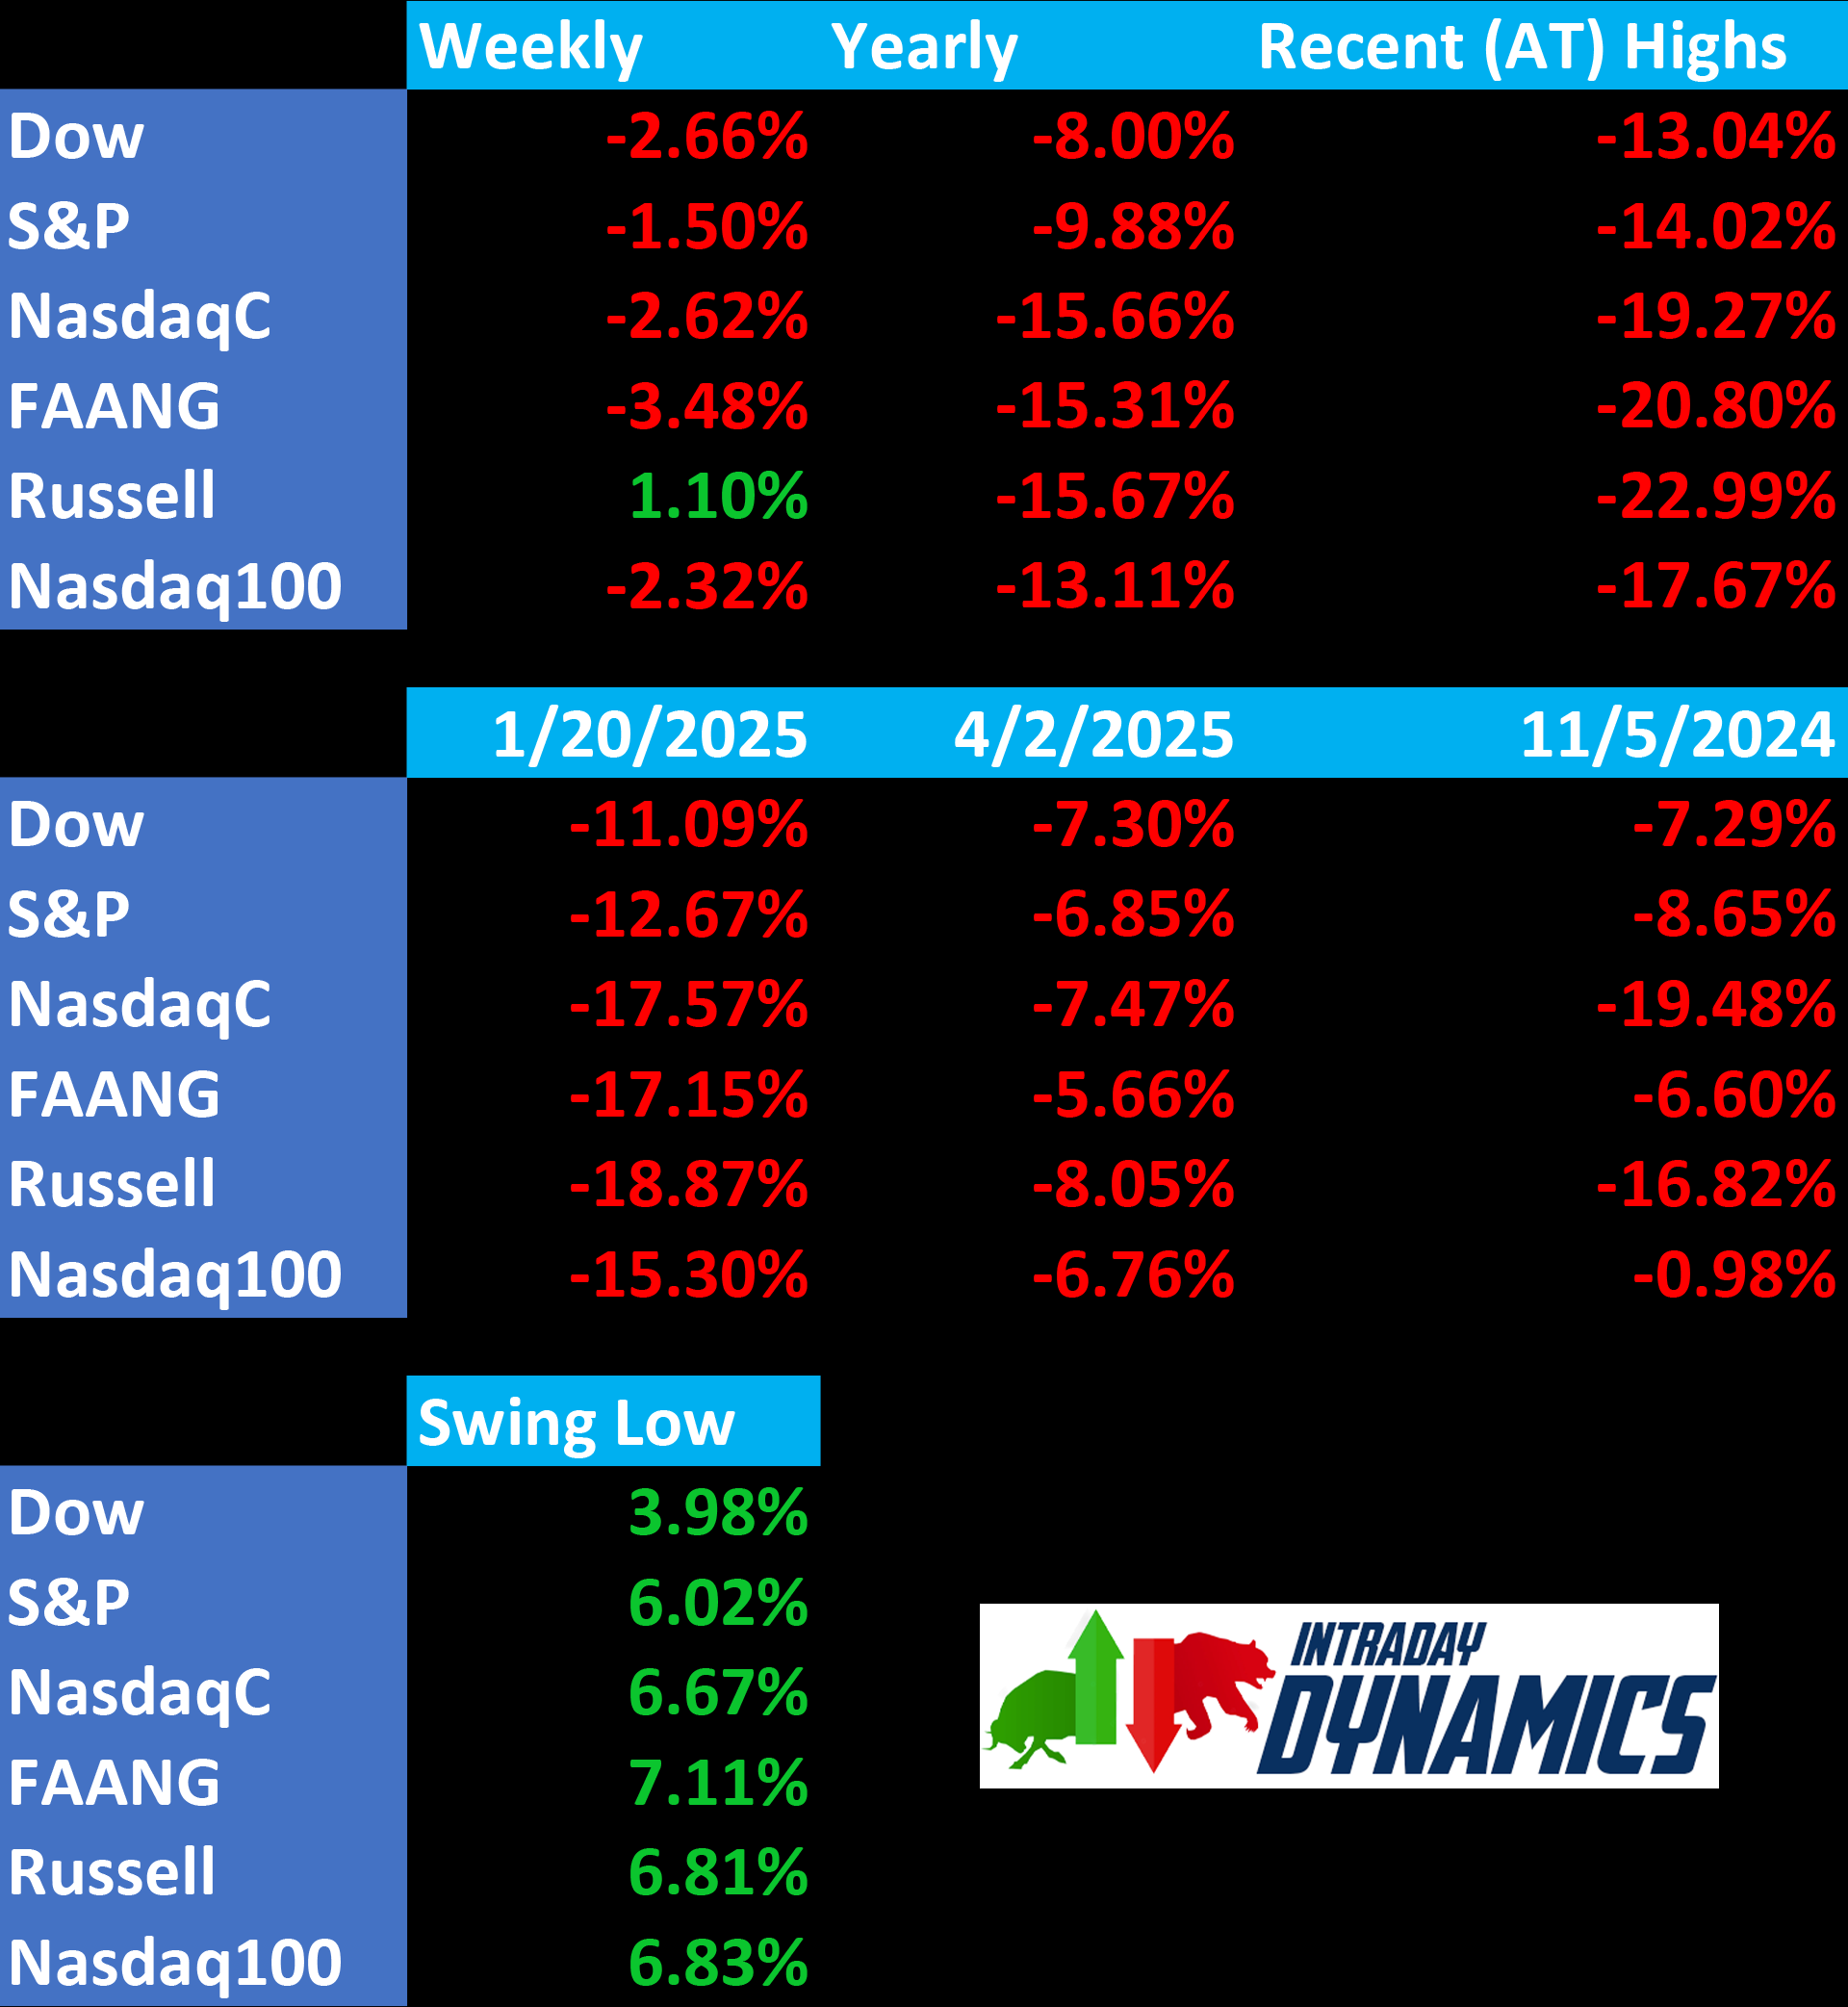
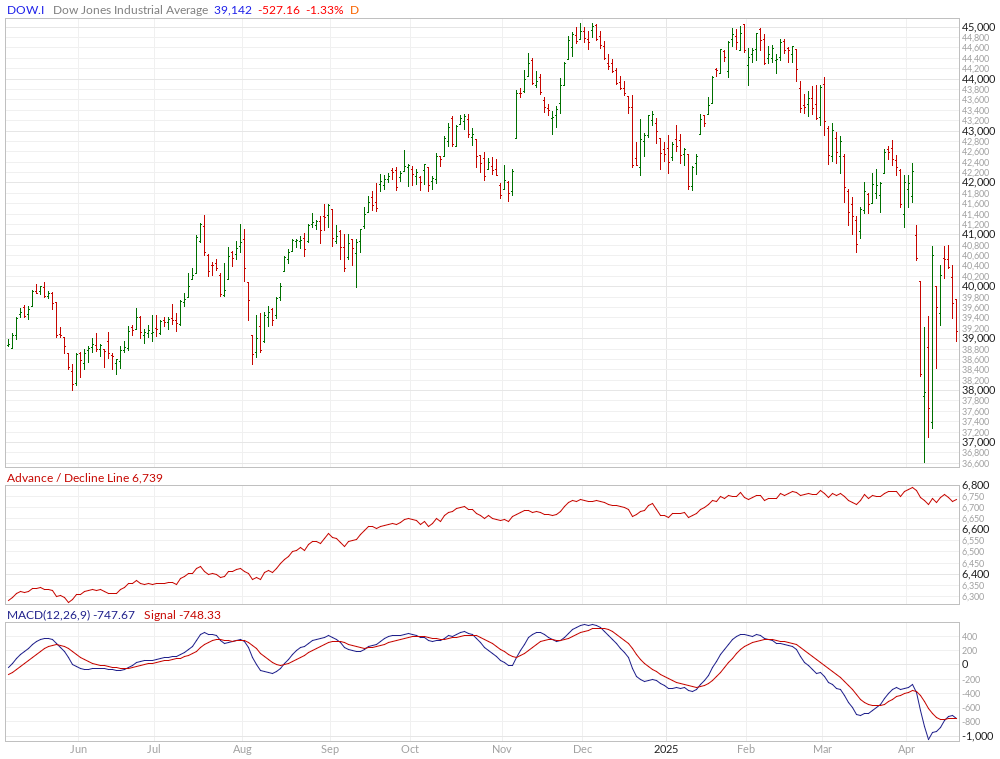
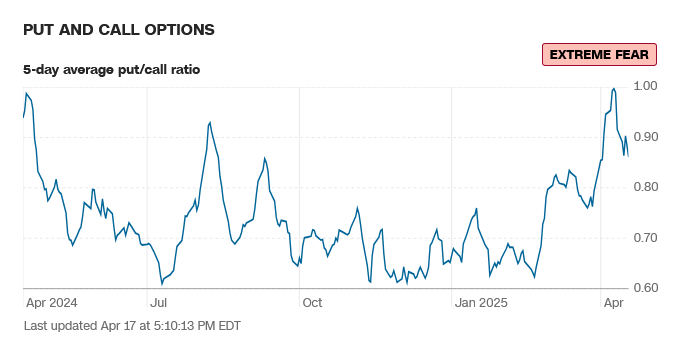
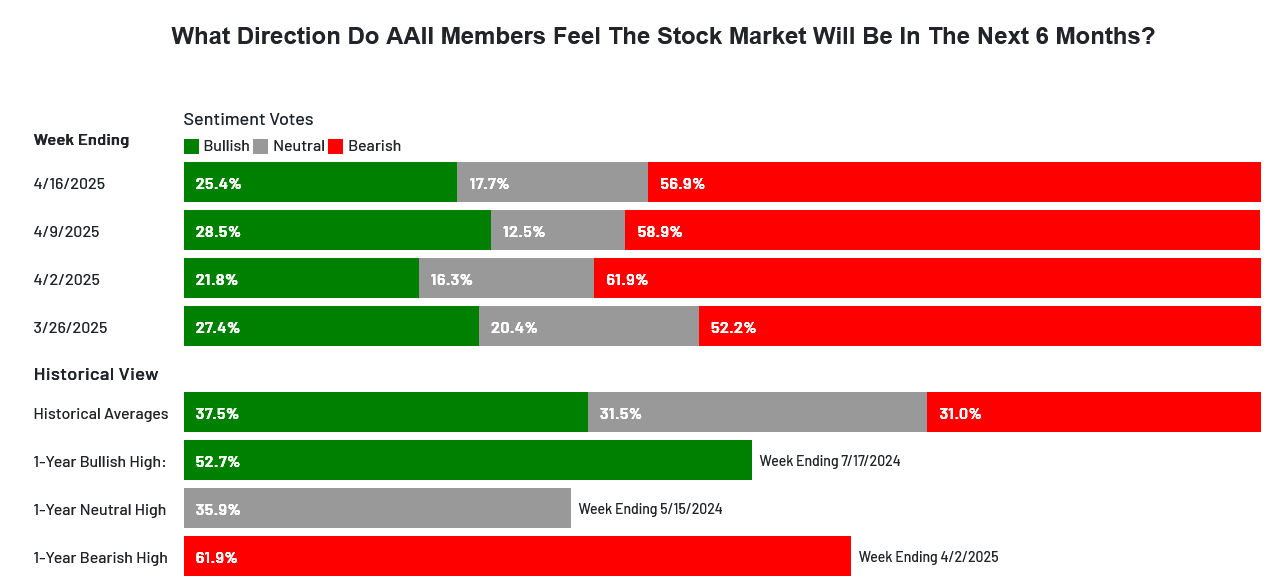 Sentiment remains in fear and extreme fear. The CNN Fear and Greed Index moved up to 21 on Thursday and reads extreme fear. Breadth recovered a bit but reads extreme fear. Latest AAII Sentiment Survey: Neutral Sentiment Grows. The Dow A/D ended at 6739, the MACD is oversold but threatening to hook lower again. The VIX sold off all week and closed on the lows to end under 30, down -21.06% on the week. The Put/Call ended at 0.86 and reads extreme fear. The 52-week, A/D moved down to -9.15% and reads extreme fear. The Dow closed the week down -2.66%, closing on the bottom of a reversal range. The S&P was down -1.50% on the bottom of an inside week’s range. The Nasdaq Composite was down -2.62% and the Nasdaq 100 was down -2.32%. The FANG was the weakest, settling down -3.48%. The Russell was up +1.10% in an tight inside week’s range, posting the second weekly gain in a row. The 10-year notes rallied and closed on the high of an inside week’s range. The yield on the 10YR declined to 4.329%.
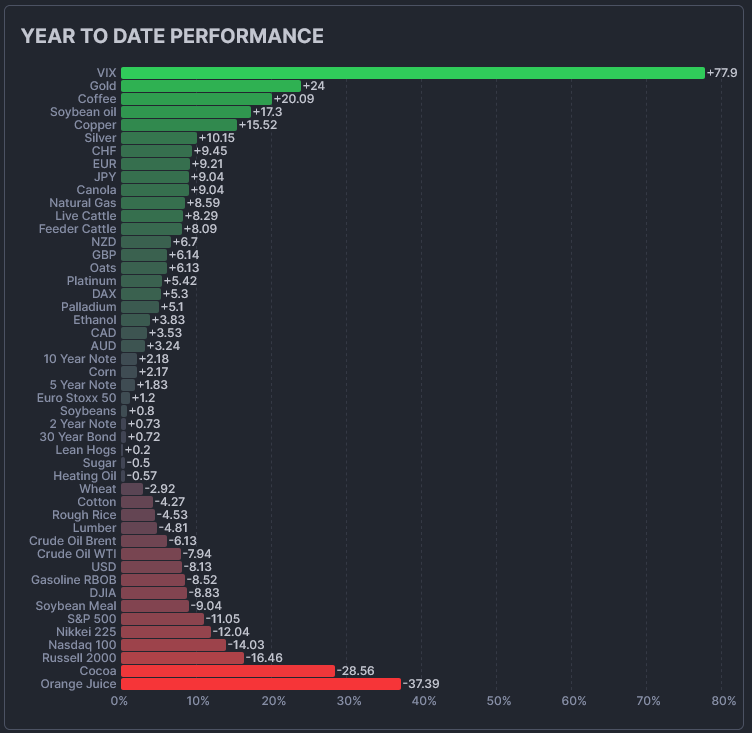
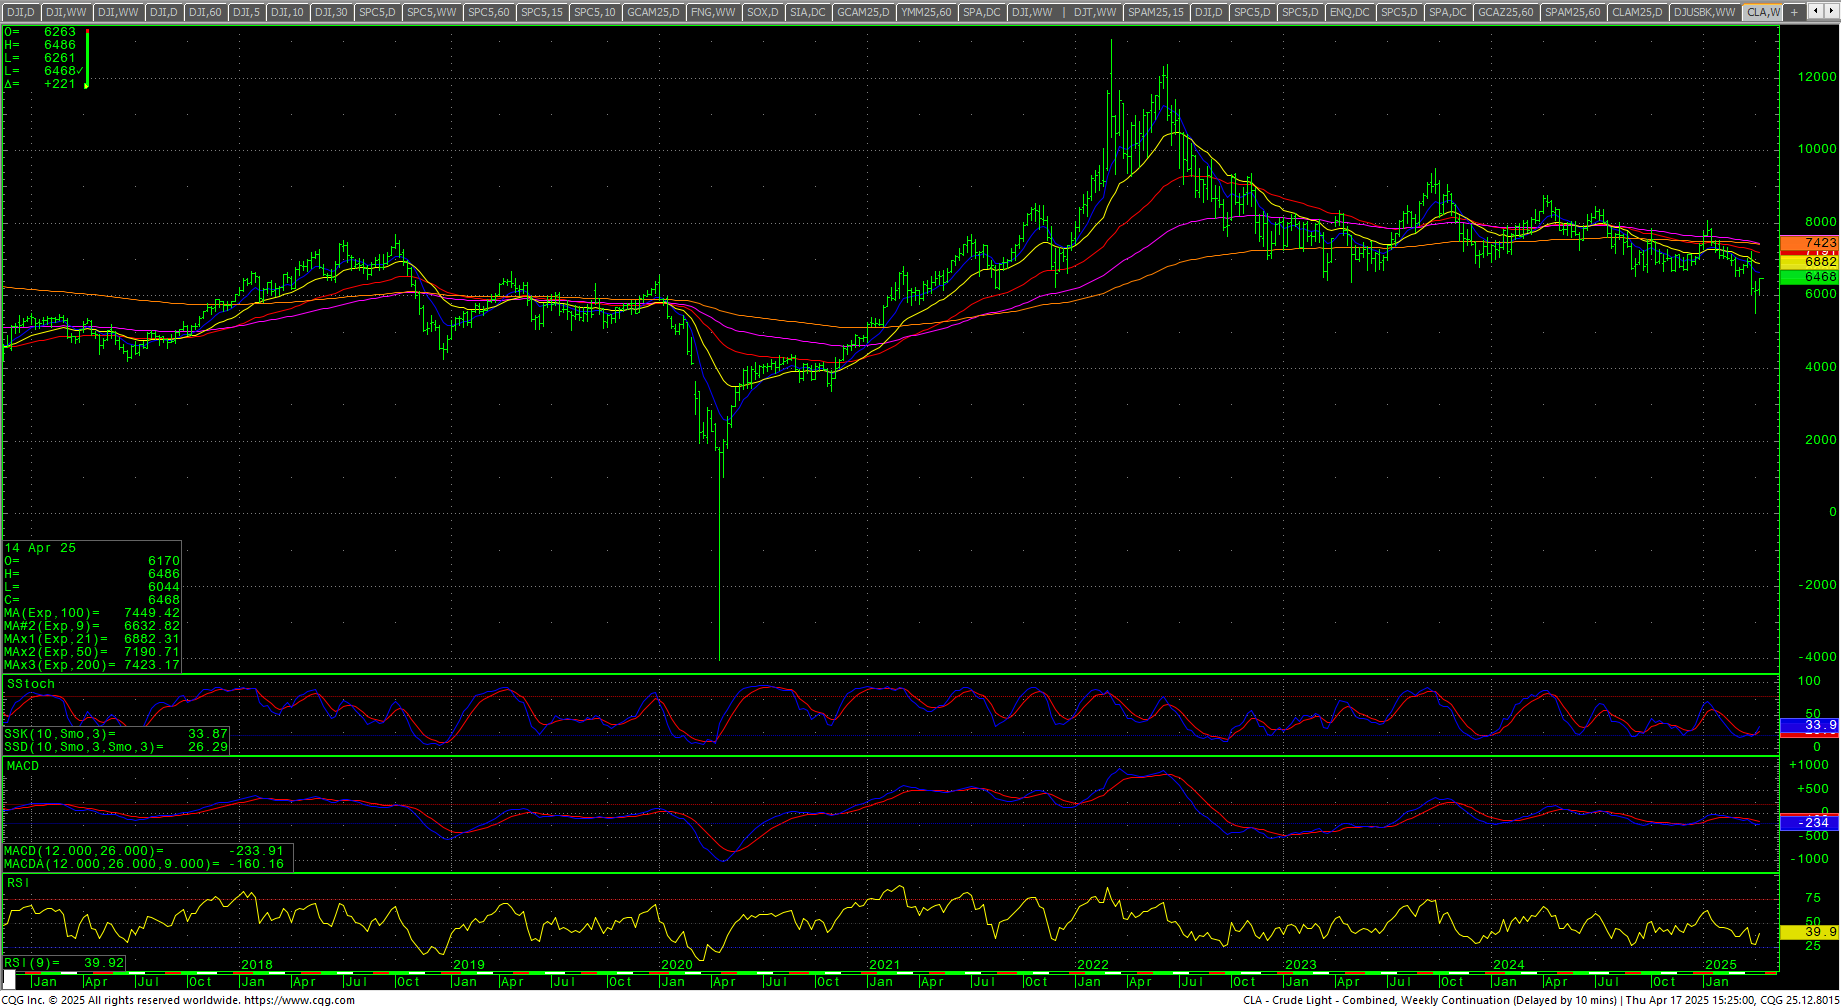
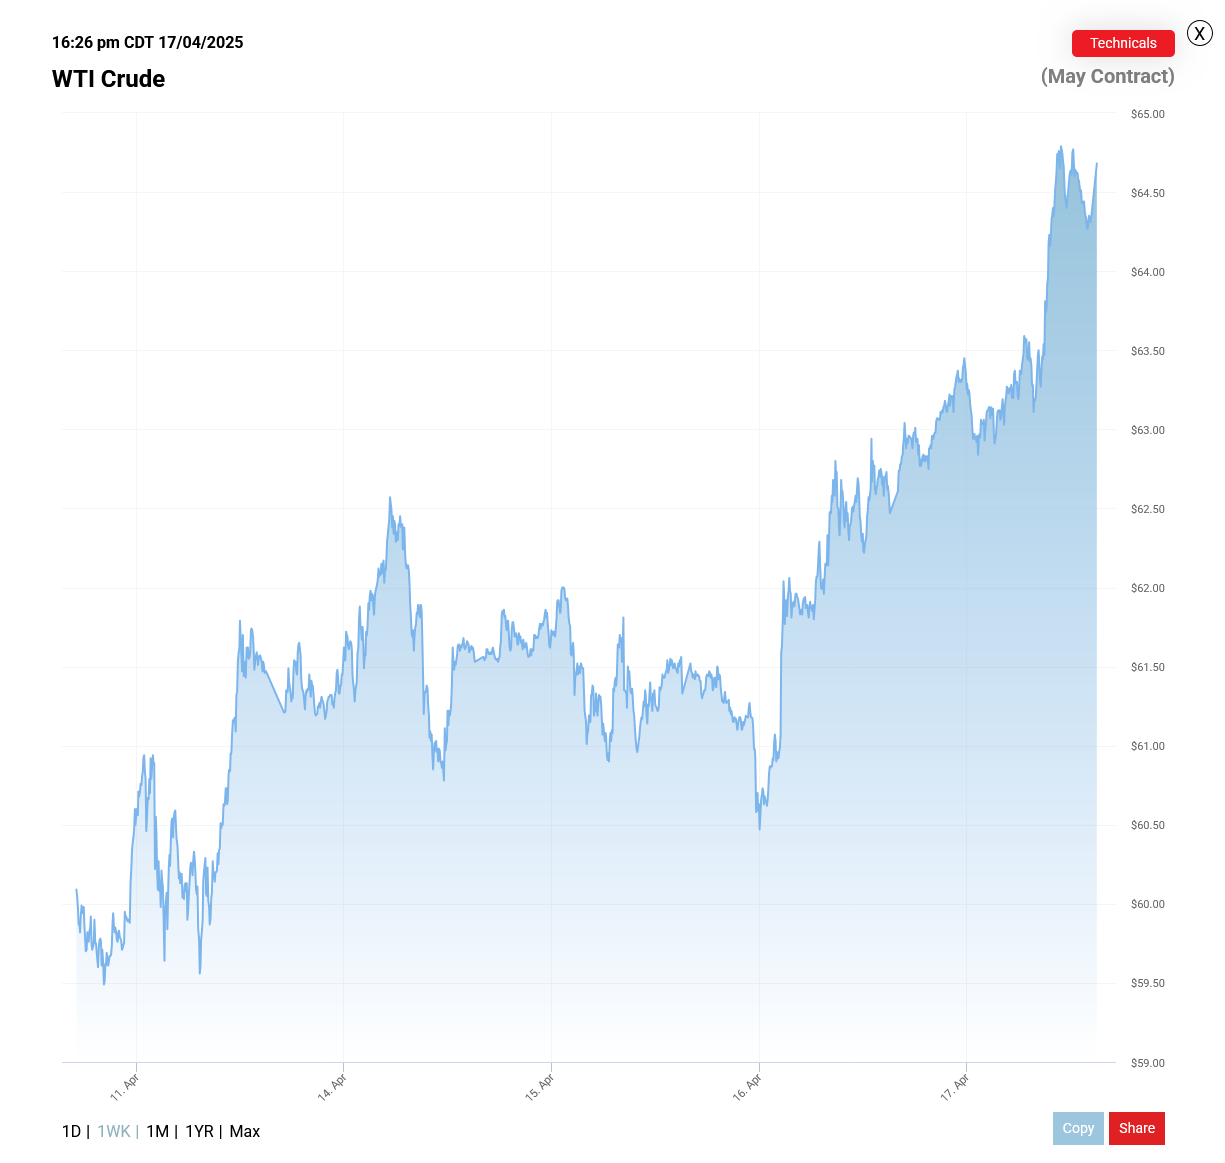
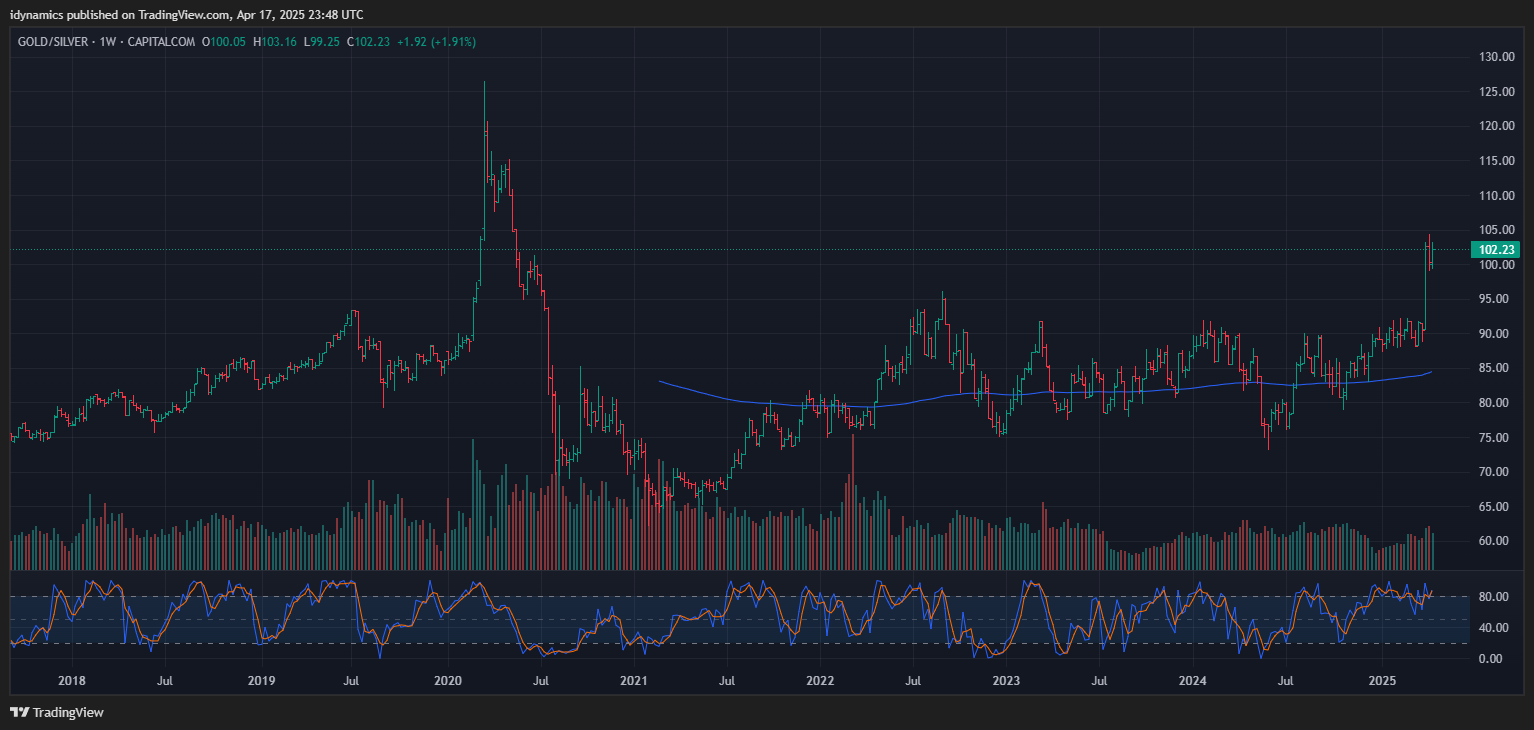 The CRB Index bounced back, closing up +2.73%. Crude oil recovered the $60 level on the top of the range. WTI Jumped late in the week to regain the critical $60 level. Gold sold off Thursday after rocketing to record highs with spot gold clearing the $3300 level. The Gold/Silver ratio is making a big move…and note the dates of the previous spikes. The CoT for the S&P 500 saw commercials adding and small specs exiting. The CFTC S&P 500 Non-Commercial Net Positions dropped to -63.1K and appears there was some short selling. Sellers have a 6 day window.
Timing Points
The next critical timing point is Monday April 21st.. We could see EXTREME volatility heading into early May. Monday we get U.S. leading economic indicators. Wednesday is Flash PMI. Thursday is Durable Goods and Existing Home Sales (est: 4.10M). Friday is final Consumer Sentiment for March. 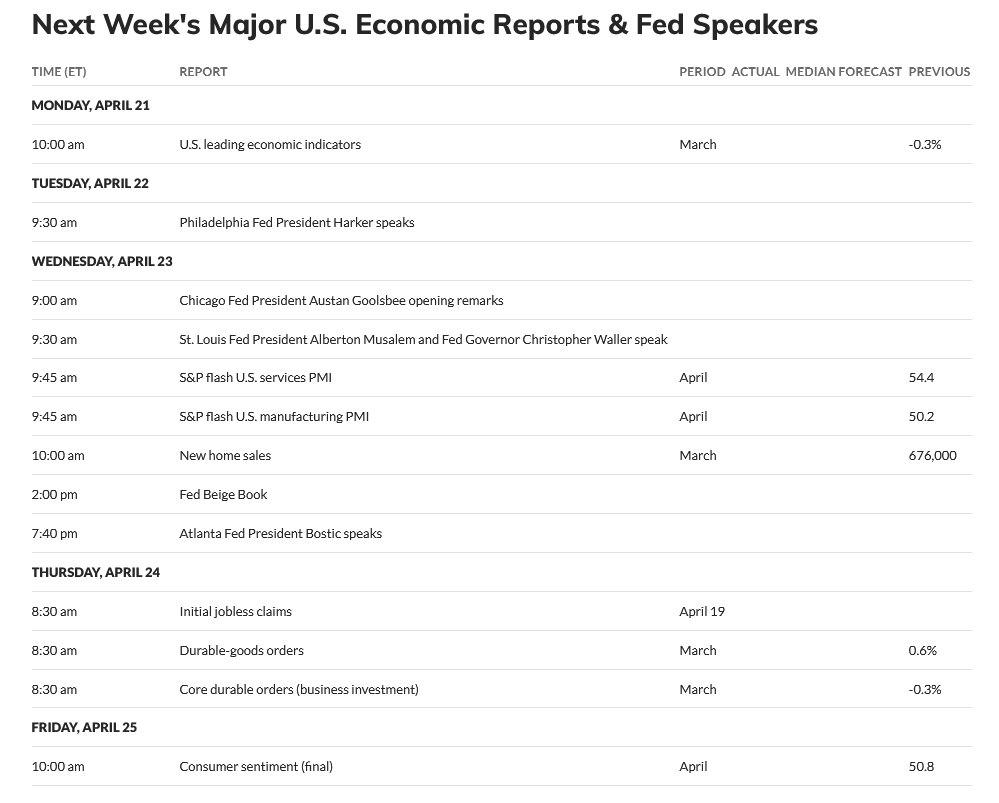
- 04/21 *** X critical (from the 18th/19th) Geopolitical
- 04/25 **
- 04/30 *** X
- 05/08 **
- 05/13 *** X critical, fast moves
- 05/20 **
- 05/29 *** X critical
Dow Jones Industrial Average
Dow Jones Industrial Average Weekly Candles
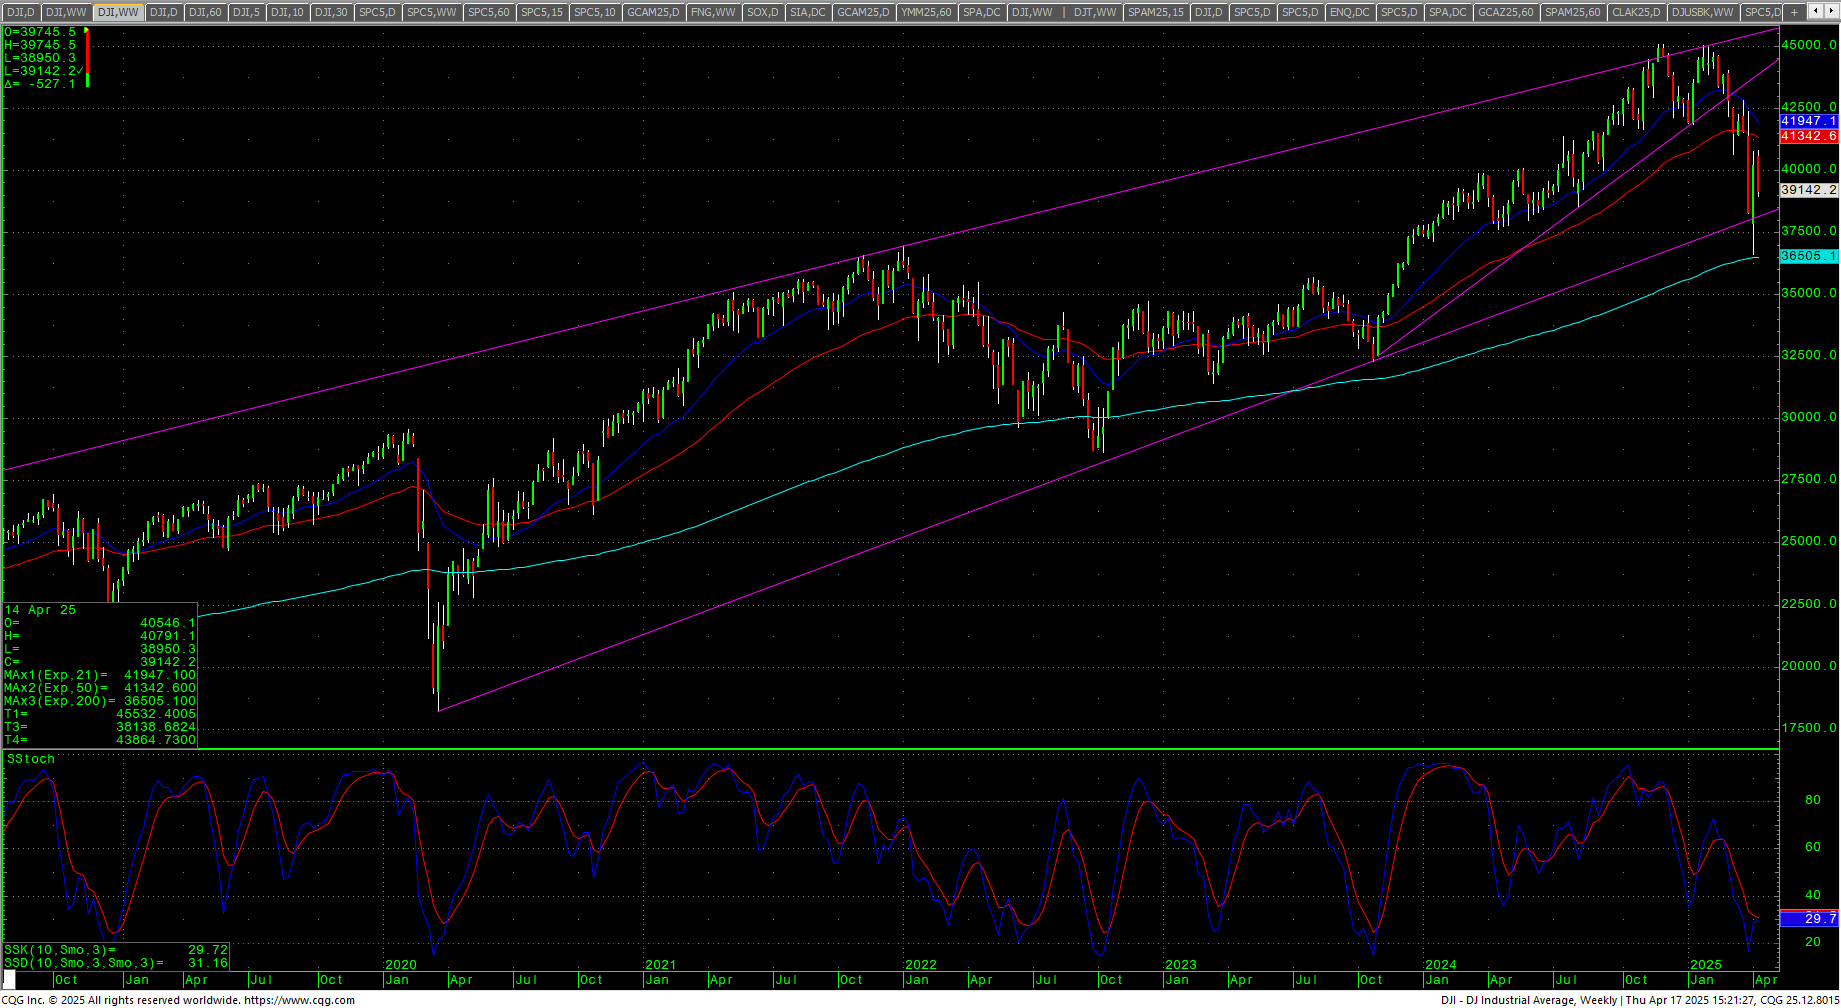 The Dow started the week higher on more tariff news and then declined to close out a reversal week on the bottom of the range. It is a higher high and a higher low on the weekly with a bearish candle while the daily posted four bearish candles in a row. The market is building value under “Liberation Day” and there is nothing technically that offers a friendly picture…only the sentiment numbers. Both the daily stochastics and the MACD are threatening to hook lower, RSI is at 39.31. As mentioned above, the daily now has a Death Cross on the moving averages. The weekly remains in a sell signal. Prices are sitting right around a .382% retracement of the vault off the spike low on Monday, 7 April 2025. The 200-day MA starts the week at 41748 as it is now trending lower.
Dow Jones Industrial Average Weekly H-L-C
 Resistance is 39451 and 39653. A drive above 39653 sets up 39870 with counts to 40087/40090. A drive above 40090 can test 40330/40357 and 40449/40455 with near-term pivotal resistance at 40778/40833. Closes over 40833 will open counts into 41140/41148 level with counts to the 41269 through 41356 area. Daily closes above 41356 should minimally test critical resistance at 41829/41835 through 40865. Closes over 41835 opens counts to 42943 through 43061.
Dow Jones Industrial Average Hourly H-L-C
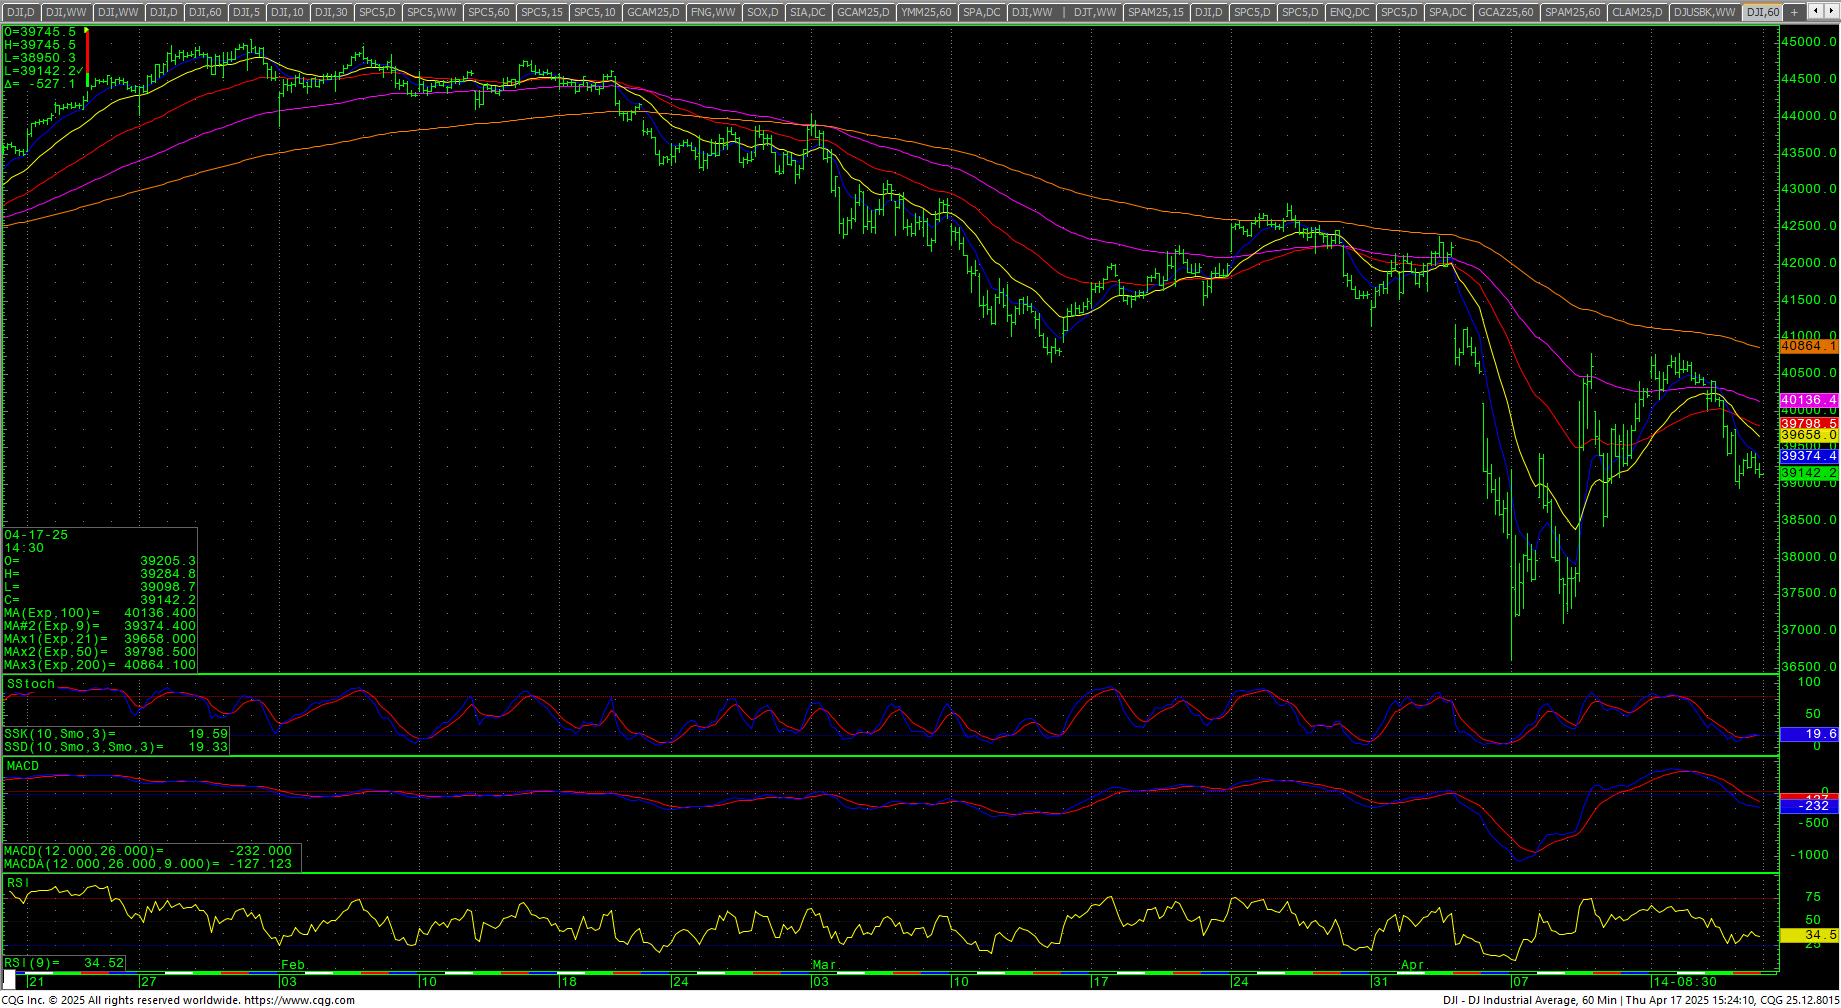 The hourly is a tad oversold with a bear flag. Support is at 38950, 38701 and 38208/38205. Closes under the 38205 level sets up 37656 through 37598 with full potential to retest the 36611 low with support at 37103. Closes under 37611 should test 36478 with full potential toward 35515/35335 and trading support at 36024.
| Resistance | Support |
|
|
S&P 500 Cash Index: SPX
S&P 500 Index Weekly H-L-C
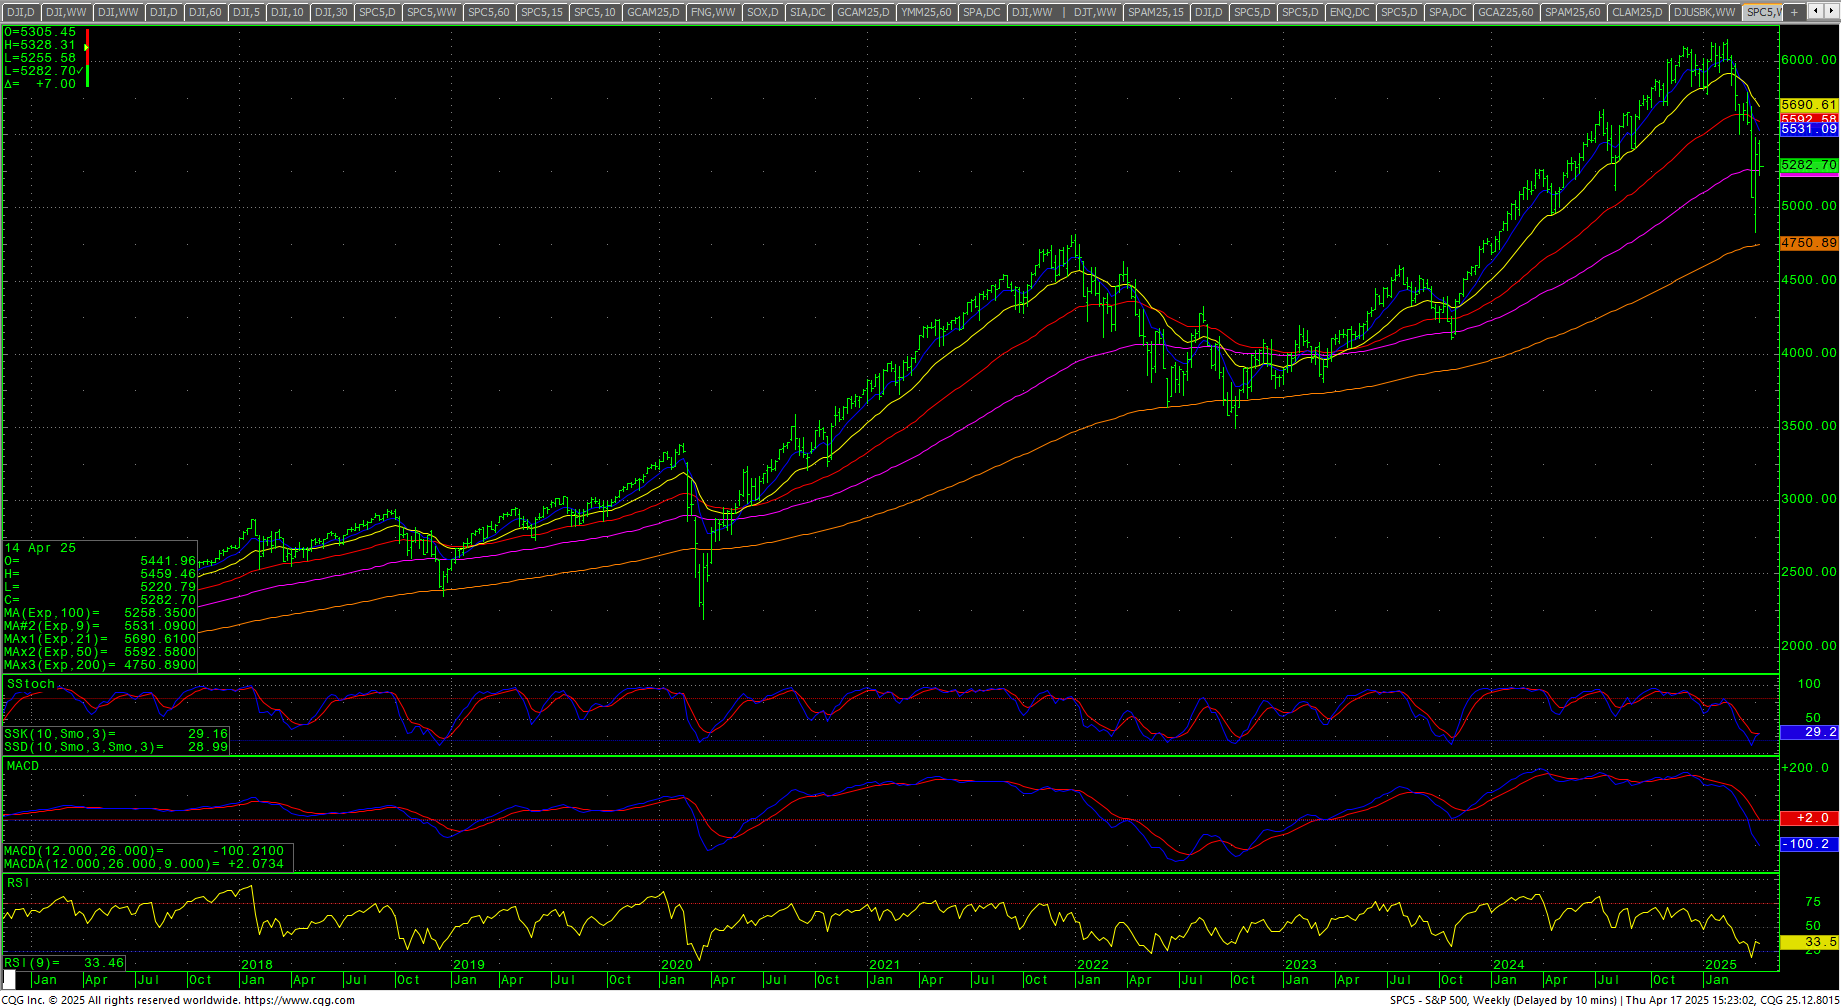
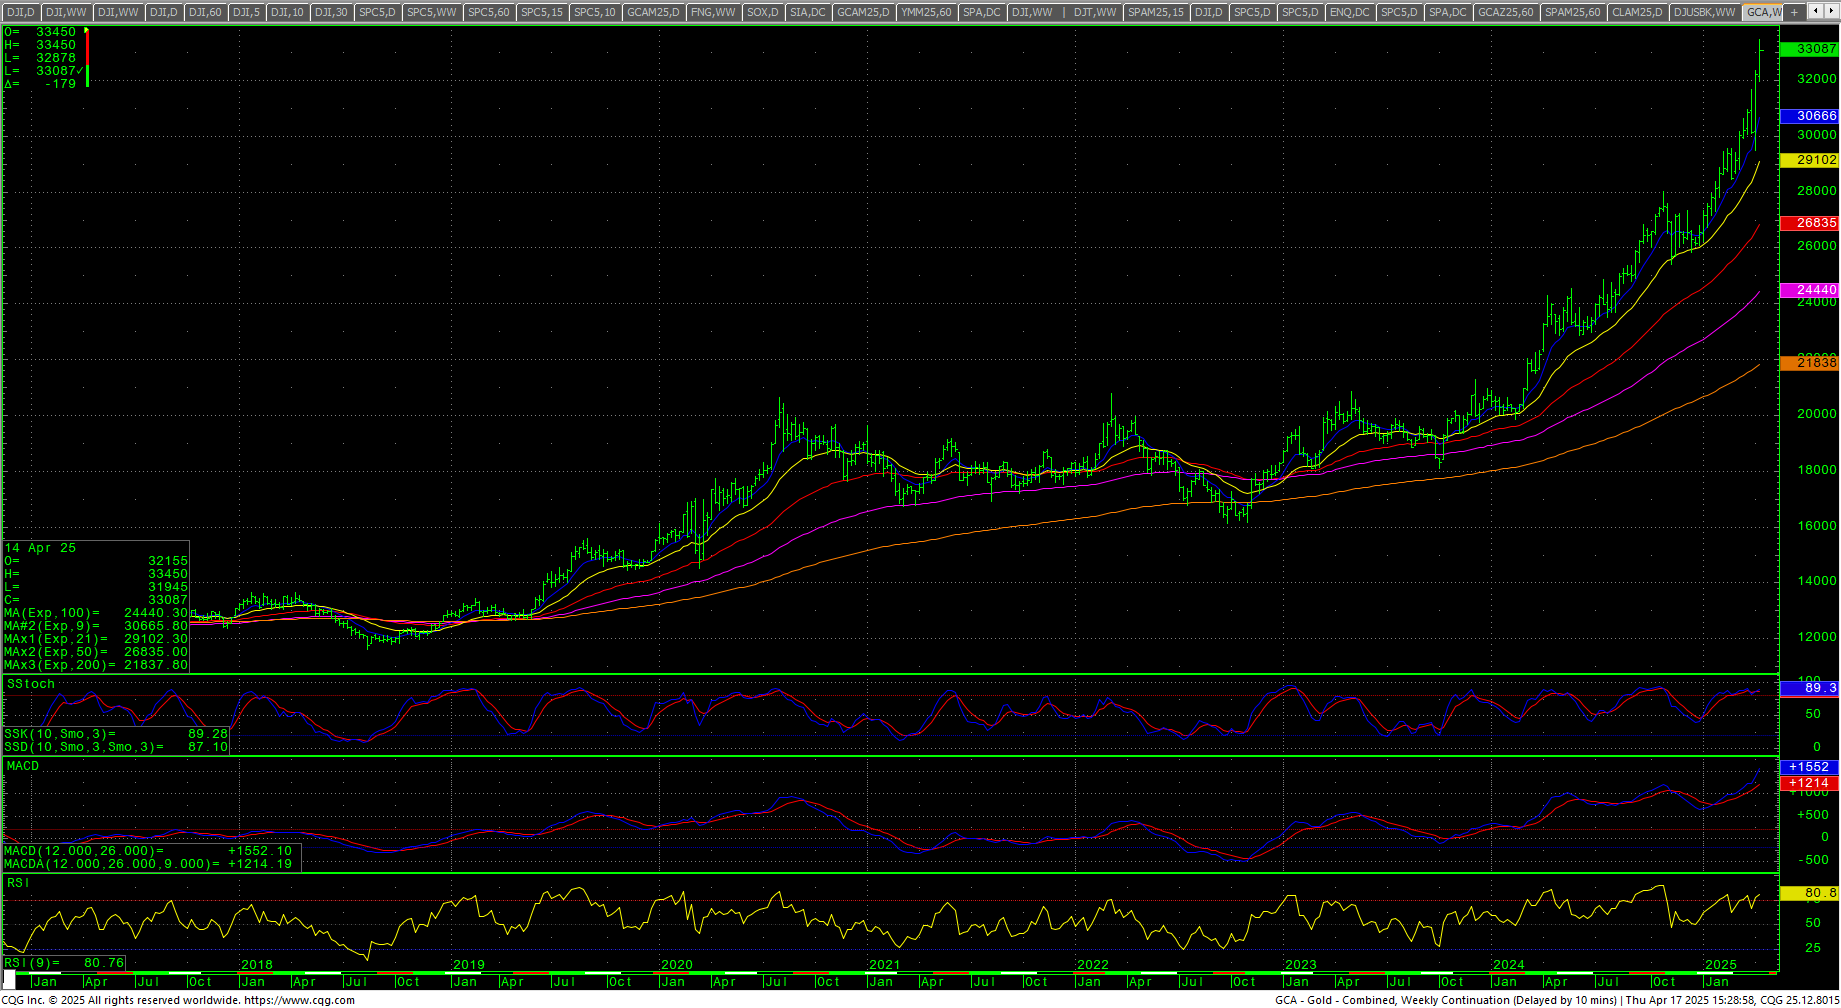
The S&P traded an inside week and closed on the low end of the weekly range in a bearish weekly candle. The daily has a Death Cross and is threatening to hook back down on the stochastics and the MACD shows the same. RSI remains over 40 at 42.79. The weekly is leaning toward oversold readings. The hourly ended neutral with Thursday’s trade. The 200-day MA is 5655.92 and is trending down.
S&P 500 (SPX) Daily Candles
SPY Weekly
 Resistance is 5298, 5336/5340, 5387 and 5490/5491. Closes over 5491 are friendly and count to 5646/5650. Daily closes above 5650 should minimally test 5819/5837. A breakout over 5837 will open counts to 5986 with full potential to 6043 and opens counts to 6112/6114 and full counts into critical resistance at the intraday high of 6147.43. Rallies through 6148 should test 6160 with a shot at a target of 6180.35/6181.
S&P 500 Index Hourly H-L-C
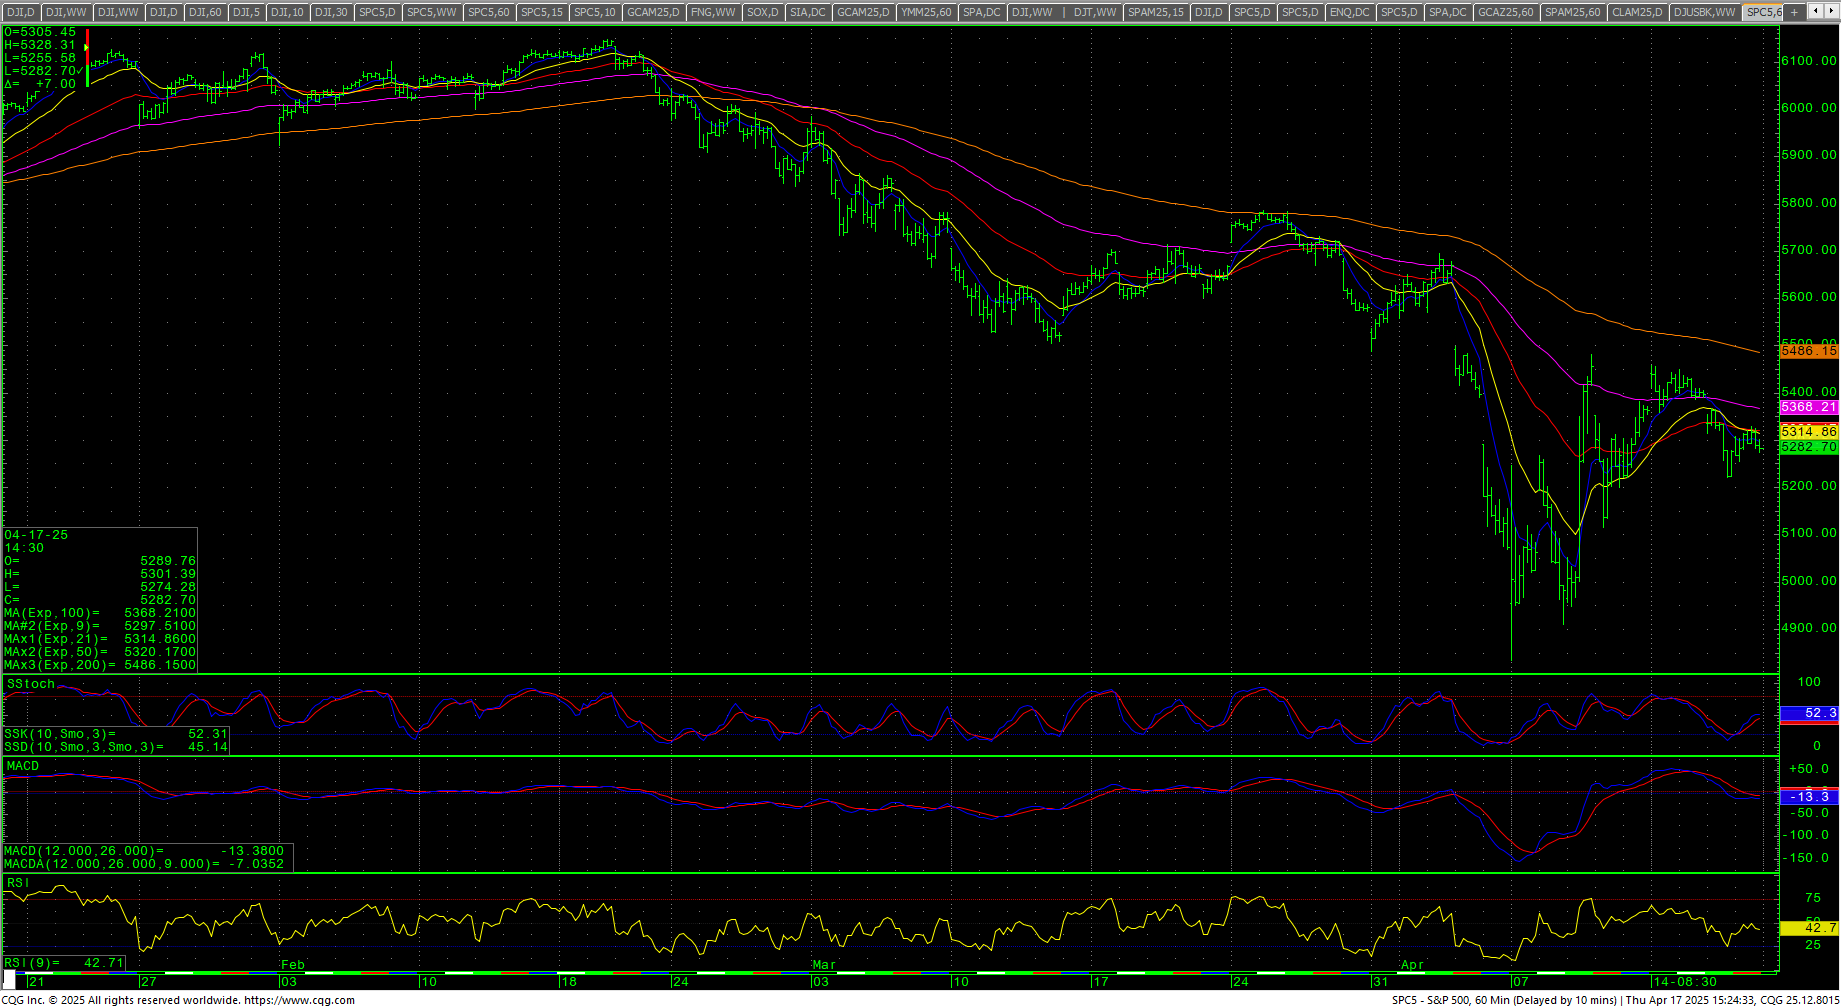 Support is 5241/5234. A breakdown under 5234 sets up 5184/5180 and 5158. Closes under 5158 should minimally test 5114 with counts to 5000/4996. A breakdown under 4996 sets up a retest of the 4835 swing lows with support still at 4884/4880. Closes under 4880 are bearish and open counts to 4614 through 4586. Under 4586 can carry to 4486 with counts to 4421/4418 (gap) and support at 4459. Closes under 4418 set up 4319 with full counts into the 4104/4100 area.
| Resistance | Support |
|
|
Charts courtesy of CQG, Inc., CNN, Koyfin, Trading View and AAII