
TECHNICAL ANALYSIS (by Intraday Dynamics)
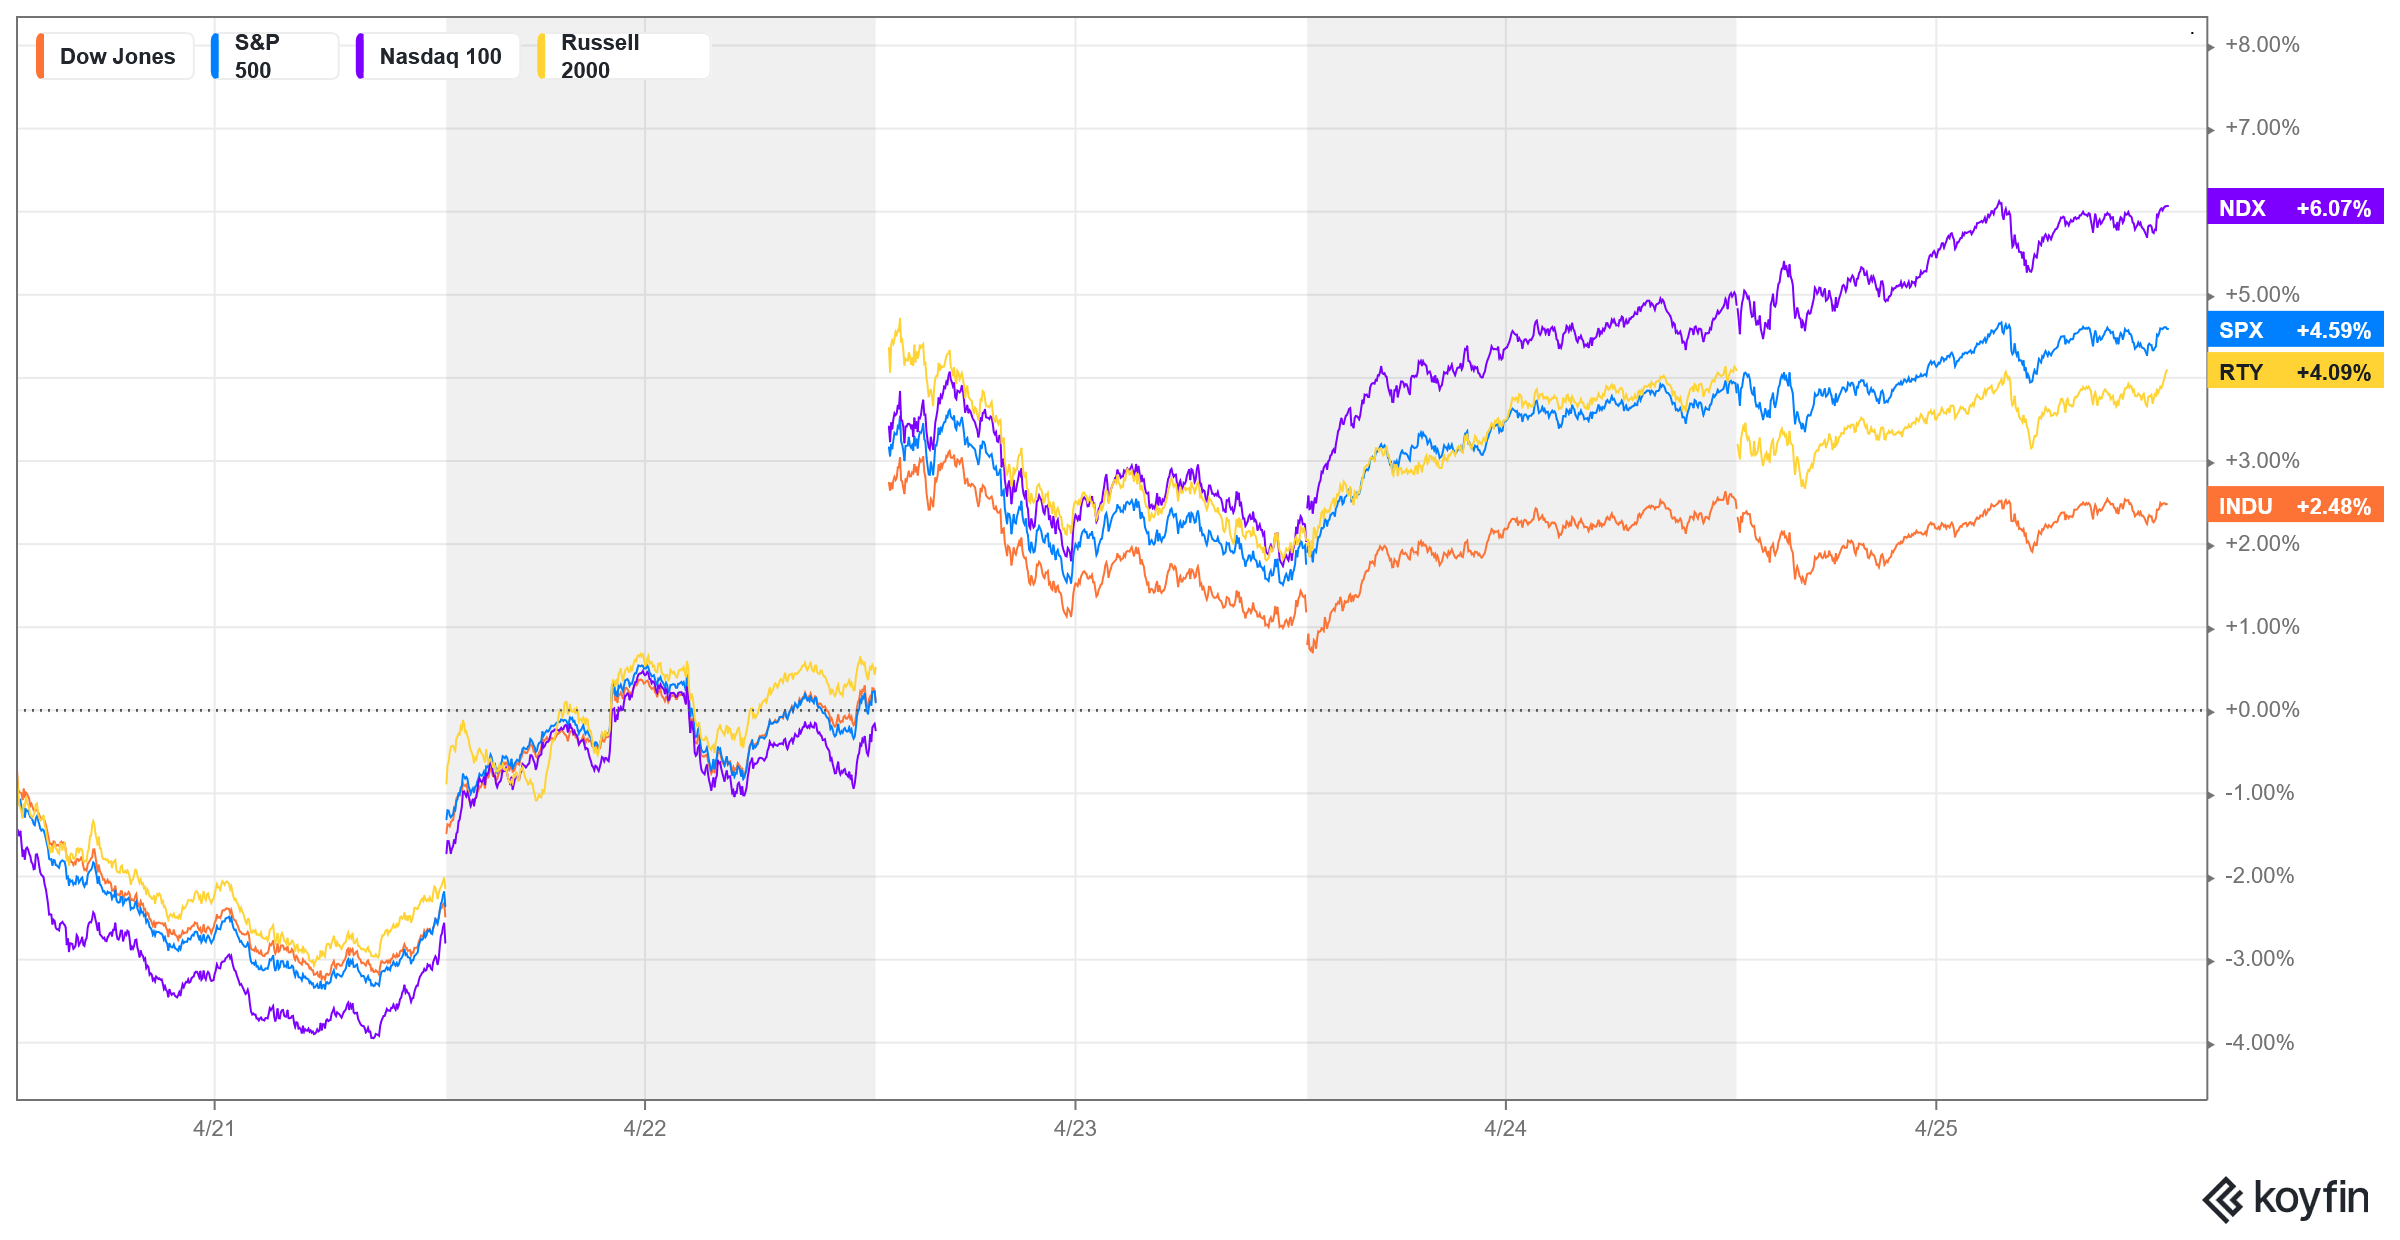
Major Indices Week of April 25, 2025
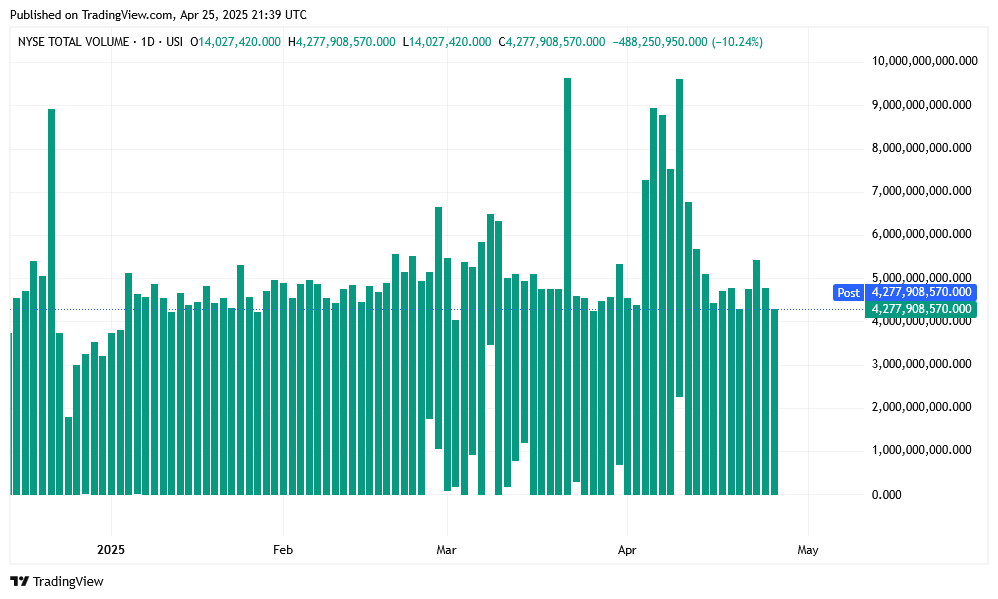
 NYSE Volume
 SPX Weekly Candles
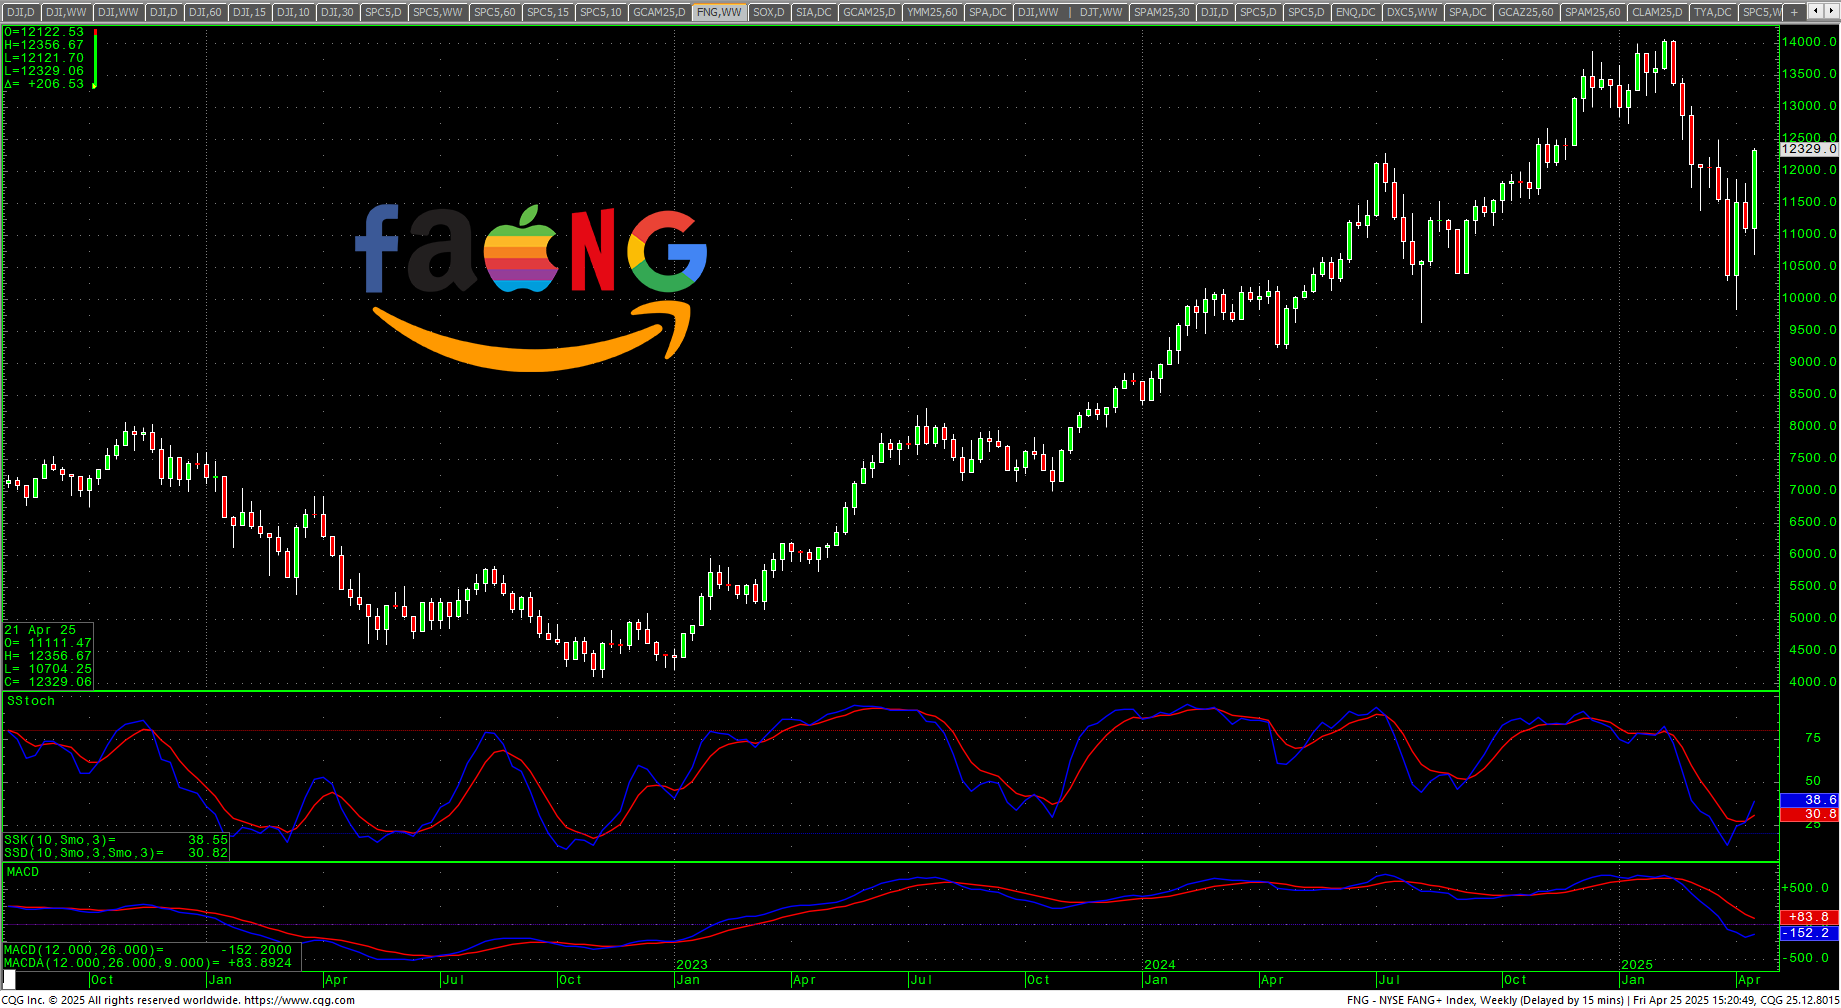
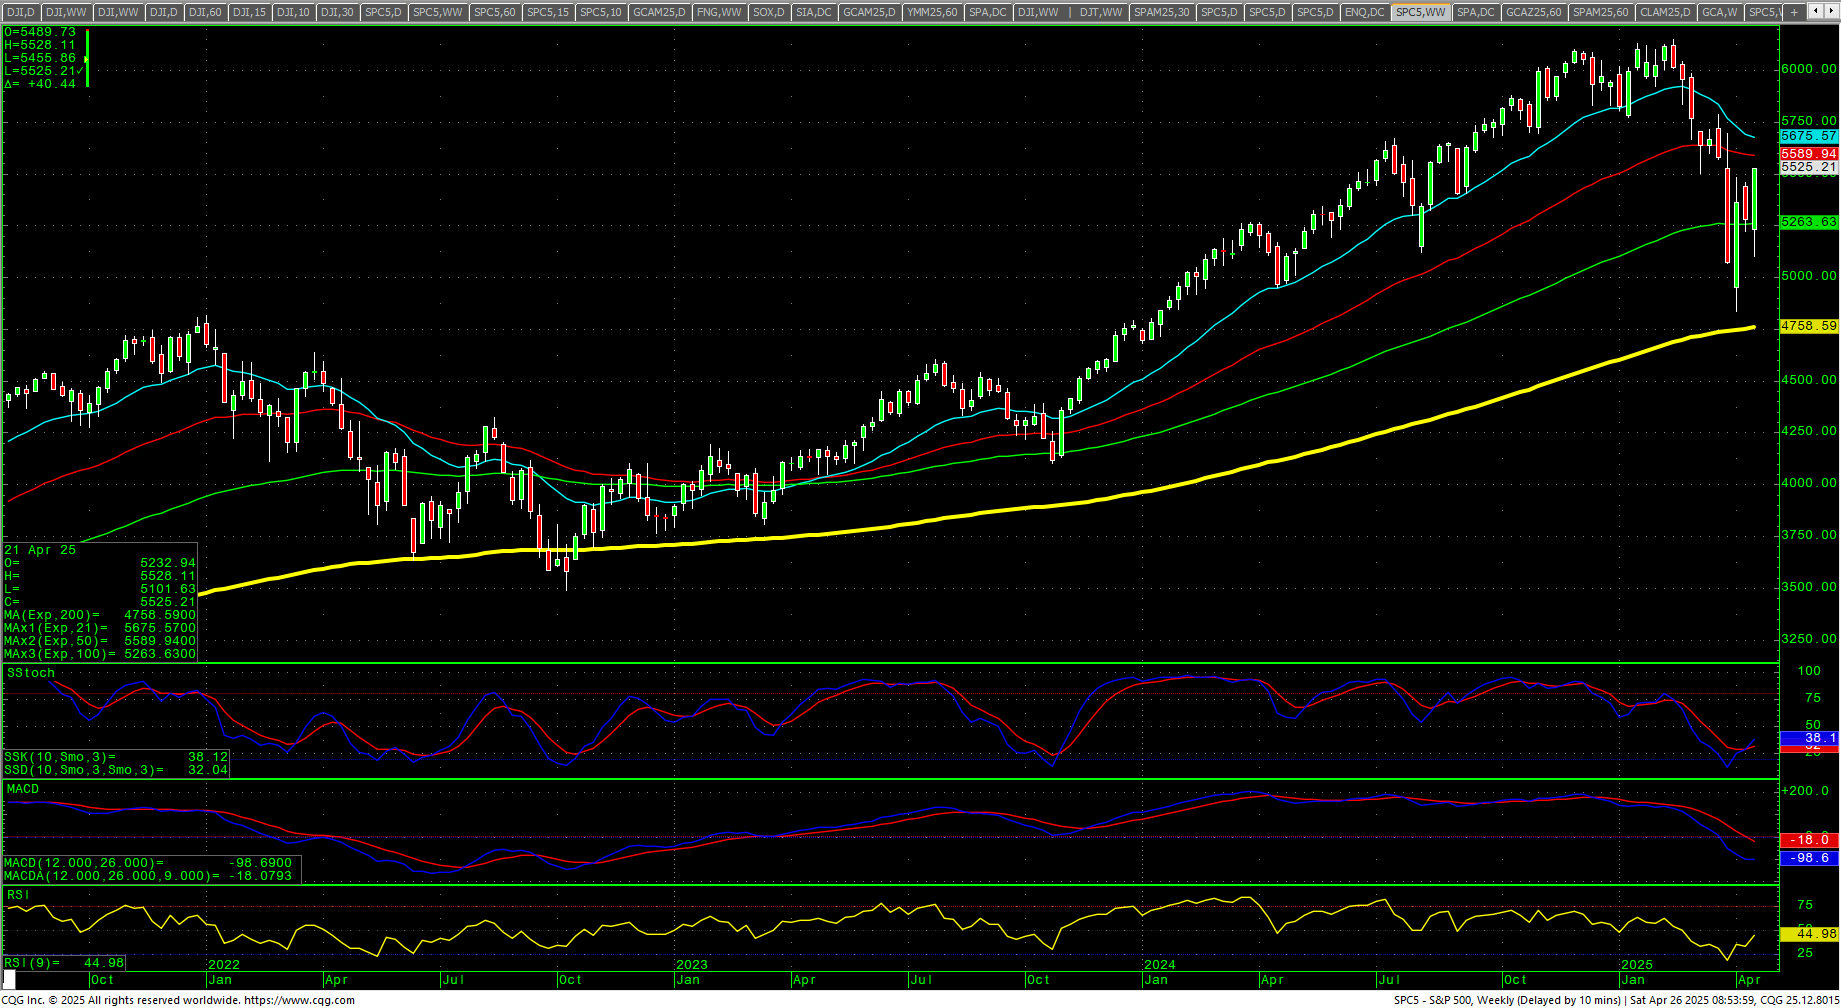 Stocks started the week on the defensive, hitting the lows in Monday’s CRITICAL cycle timing, and then rocketed higher with tech stocks leading the way. Call it a “relief rally.” Call it a “Houdini rally.” But the reality is that very bullish activity occurred with both the SPX, FANG and the Nasdaq staging Bullish Engulfing Candles on the weekly chart and the FANG soaring almost 11%. Another week, another yearly move.
Meme Stocks: So Much Whimming
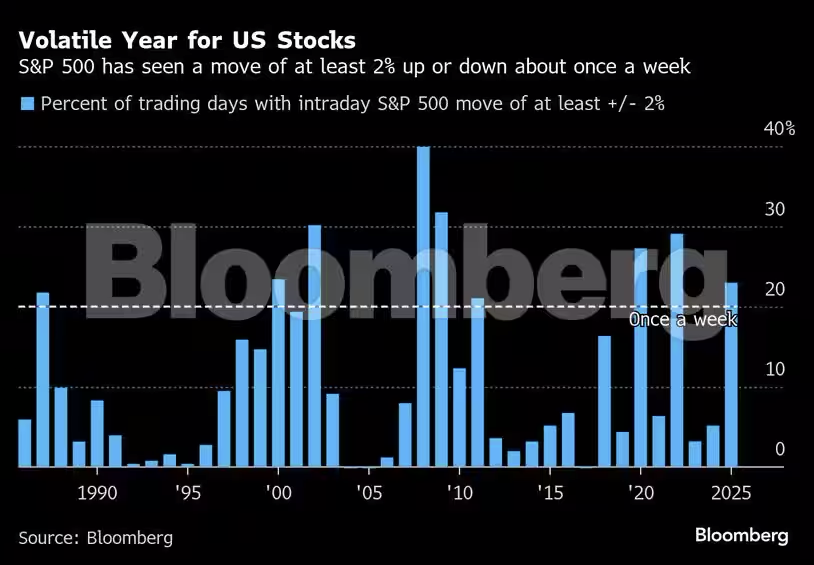 The U.S. stock market is now basically a meme stock. The volatility and extreme price moves mirror a penny stock, and a “tweet” can move prices 4-6% in the blink of an eye. On top of this is the reality that this market is deliberately being manipulated.
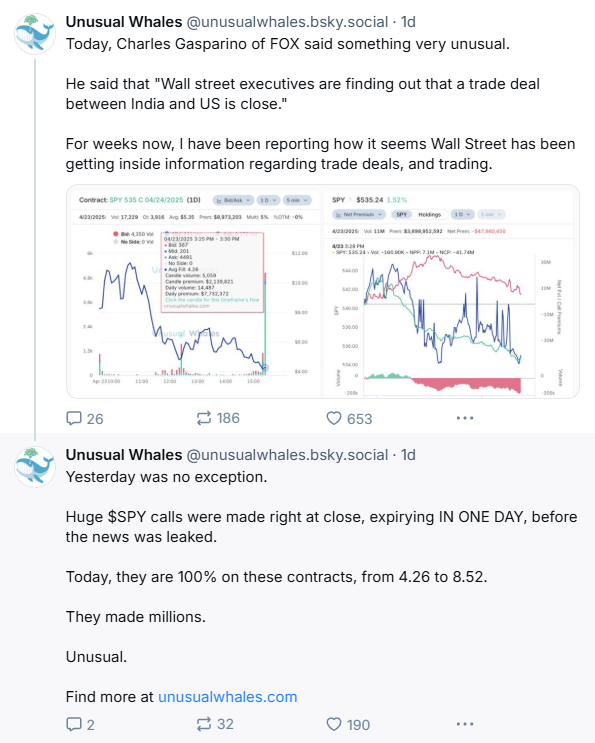
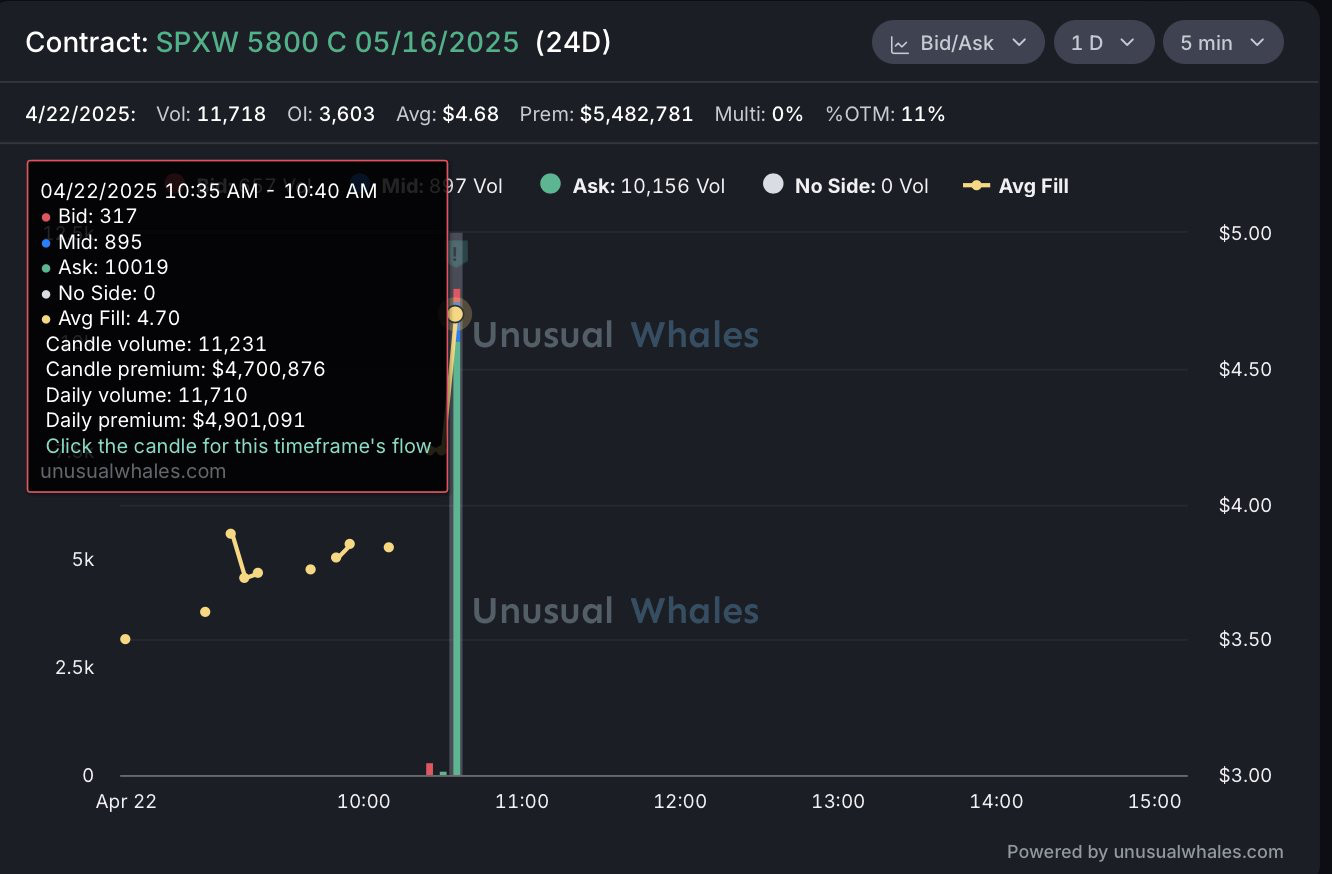 We came into Monday with the whole Jerome Powell fiasco still in the news while the Fed was set to release their Beige Book. Unusual Whales continues to expose the blatant market manipulation and front-running of trades. On 22 April 2025, just before (contrived) news was “announced” regarding the tariffs, the trade and volume on the SPXW 5800 Calls EXPLODED. There is ONLY ONE explanation for these radical moves in options…people are trading on inside information.
 Last week also brought a plethora of headlines from the billionaire class who were harshly criticizing Tariff Man. Bill Ackman, Jamie Dimon, Ken Fisher, Ken Griffin and Ray Dalio all took off the gloves and attacked the tariff insanity, with Ackman referring to it as ‘Economic Nuclear War.’ These men are not selling the “Big Beautiful Department Store” narrative. A total 360 from 90+ days ago when these same people were foaming at the mouth over the rocket ship they were about to ride.
“He dreams of giving people their dignity back, and I have to applaud him for having that dream,” Griffin, speaking Friday at Stanford University’s Graduate School of Business, said of President Donald Trump. The dream of creating more manufacturing jobs, however, “is not going to come true.”
“These jobs are not coming back to America,” Griffin said. “And to be clear, with an unemployment rate of 4%, America has moved on.” —Ken Griffin
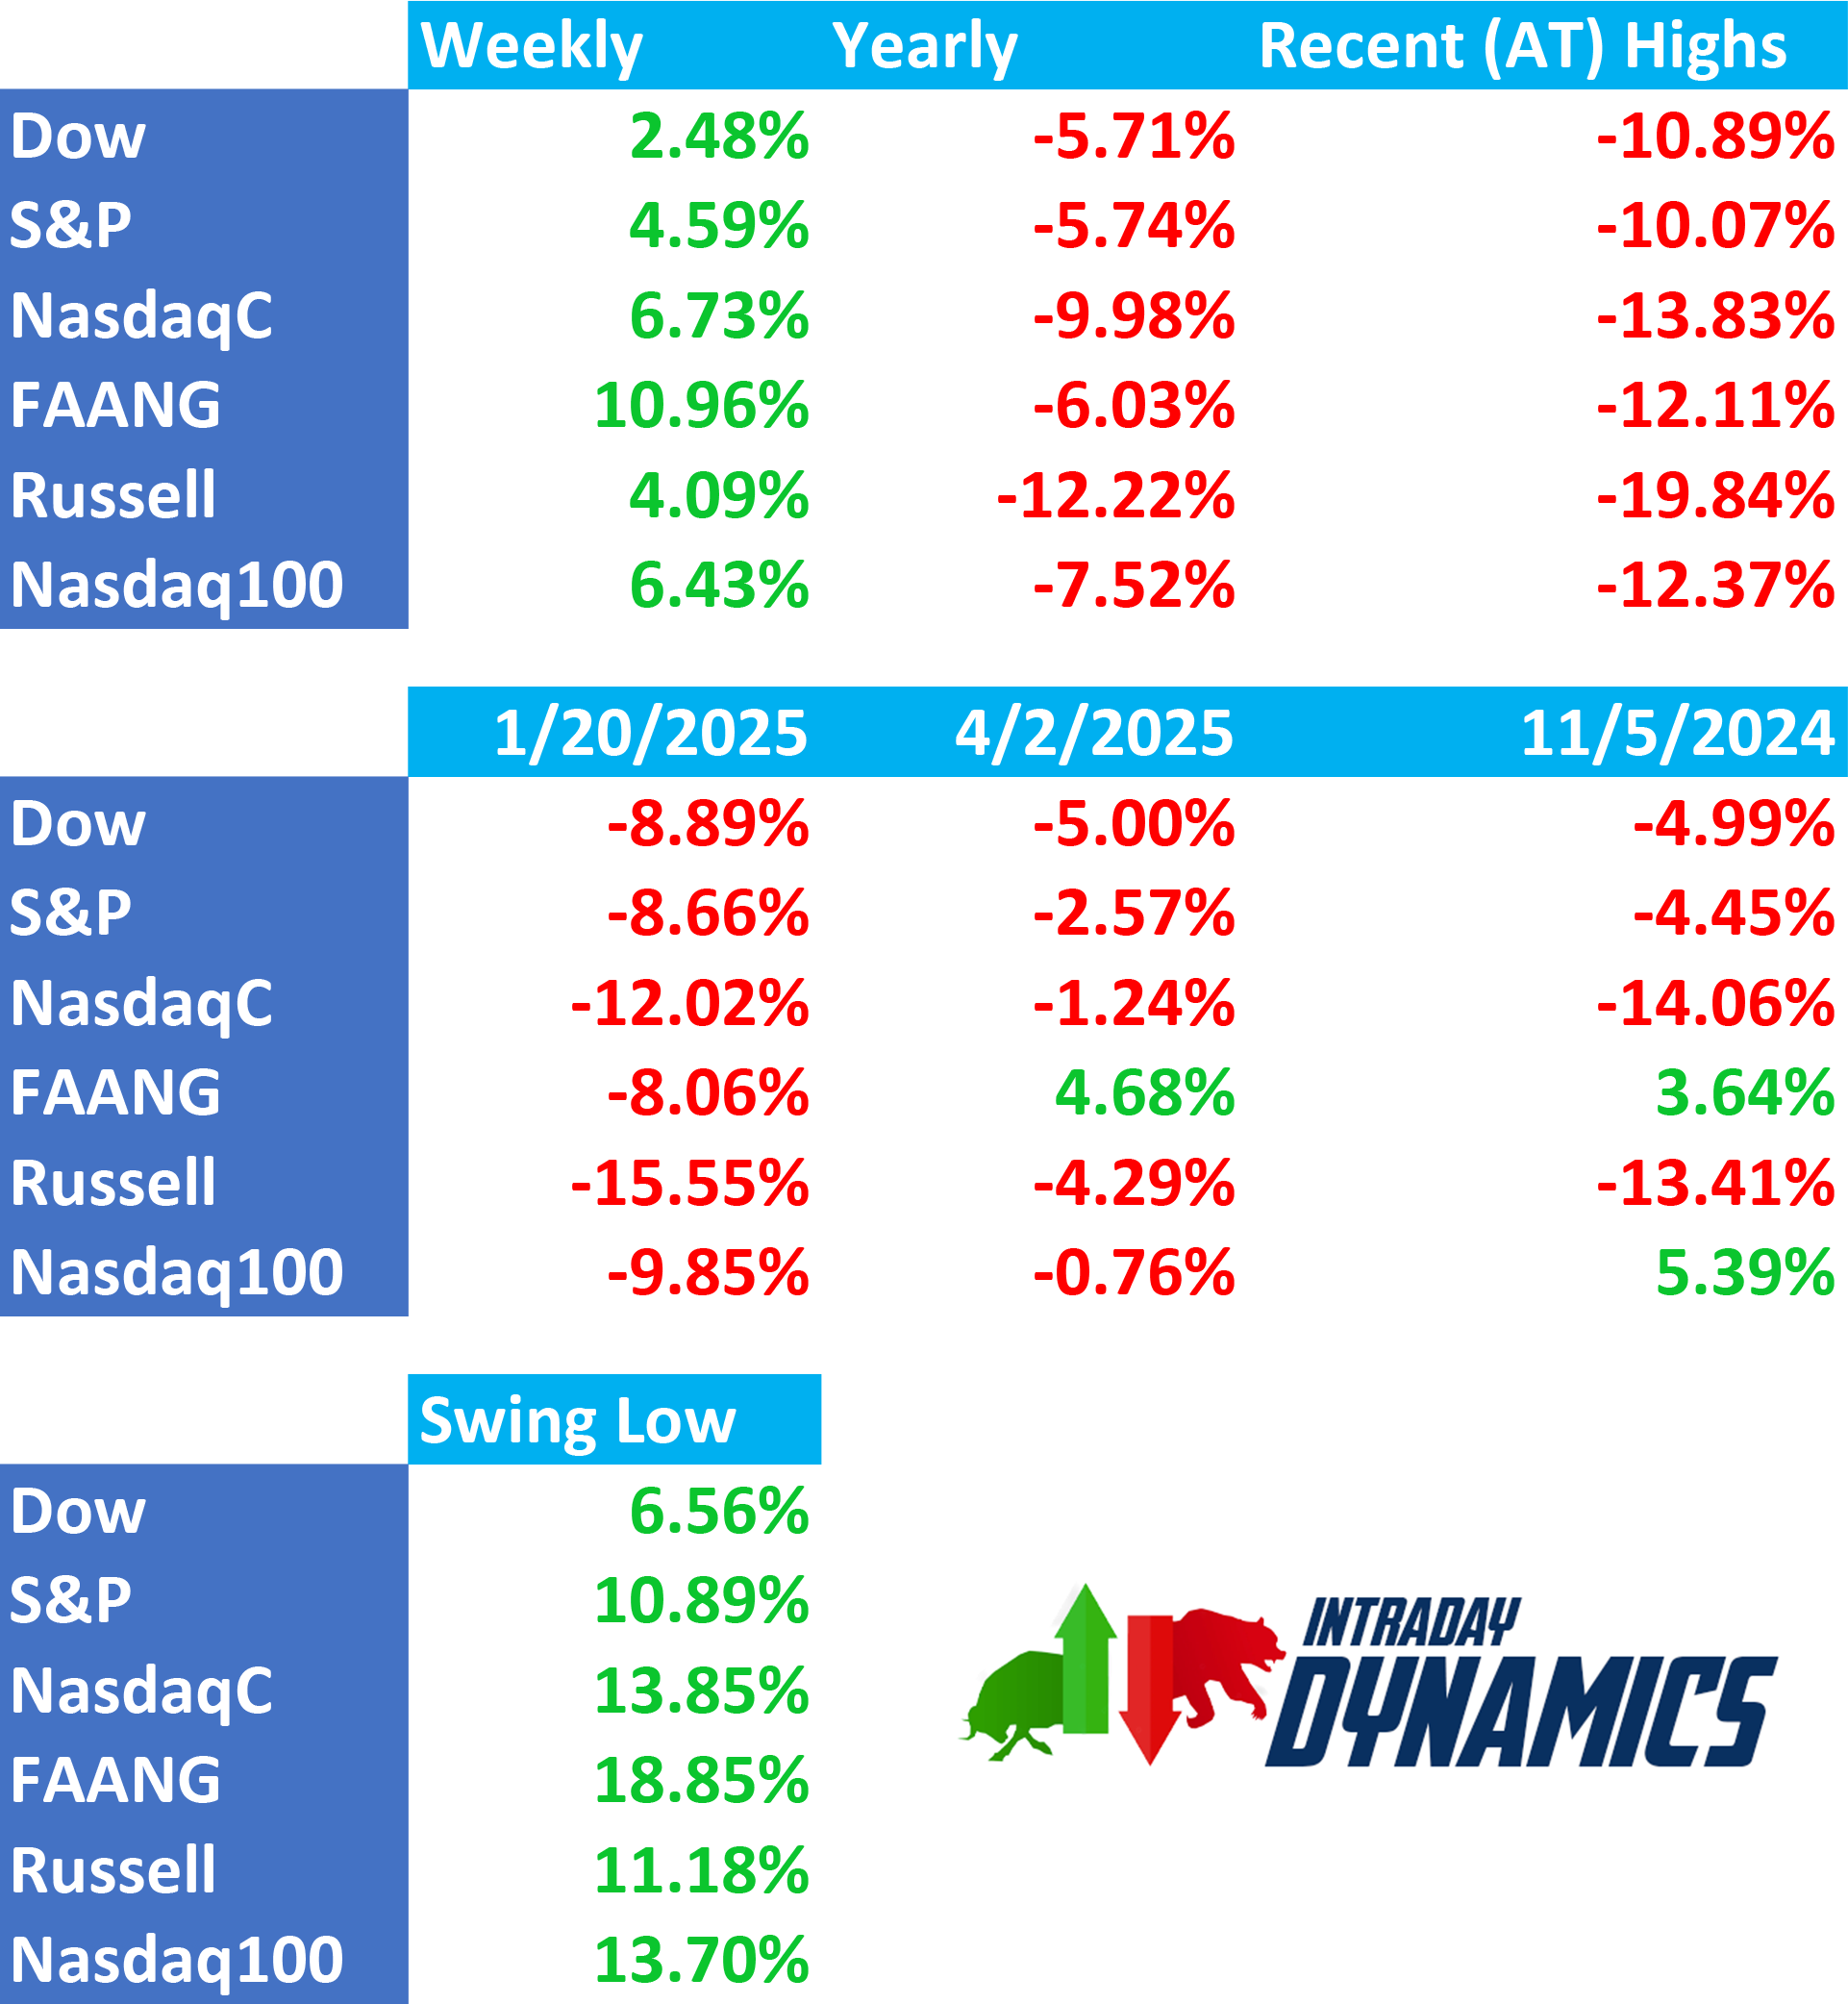
 If you are bullish, there is a lot to celebrate after last week. The Bullish Engulfing Patterns cannot be shrugged off, and the monster rallies in tech keep the lifeblood of this market alive. The huge rally in the FANG has lifted it above both “Liberation Day” and election day 2024. The Nasdaq 100 is now trading above 5 November 2024 as well. The Russell ticked just above the -20% level last week while the FANG is now up almost +20% from its recent closing low. We also have earnings reports coming up now and the lockout on buybacks is ending with some $300B+ waiting in the wings. Economic data is going to be skewed for at least one month with so many companies building inventory in front of the tariffs.
DJIA Daily Candles
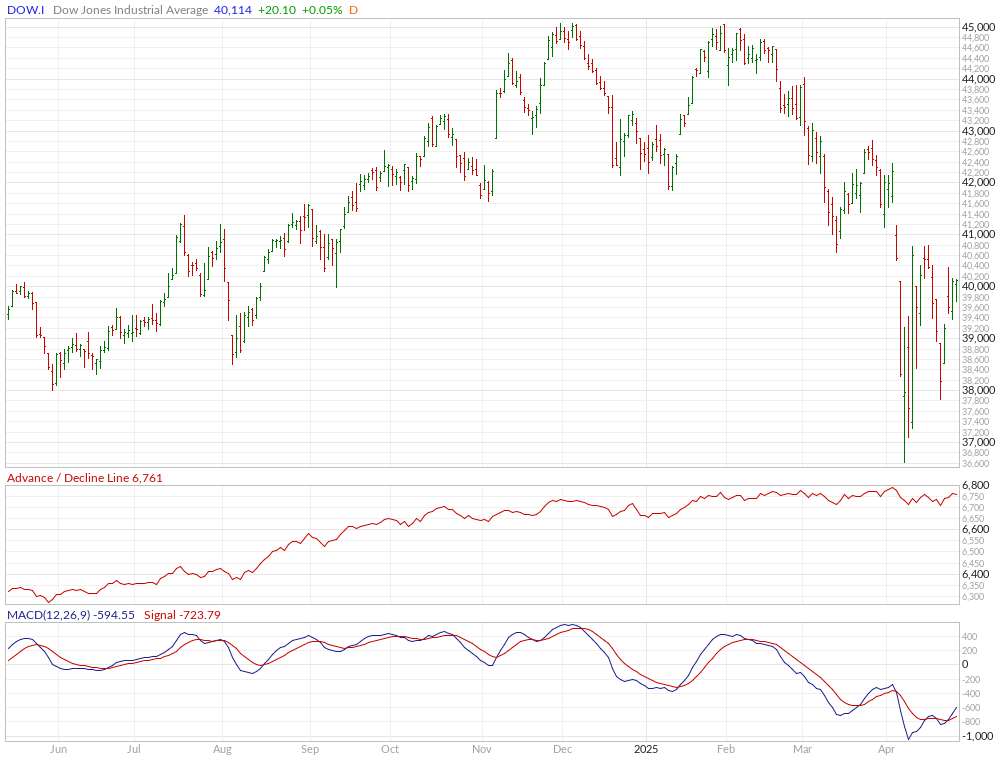
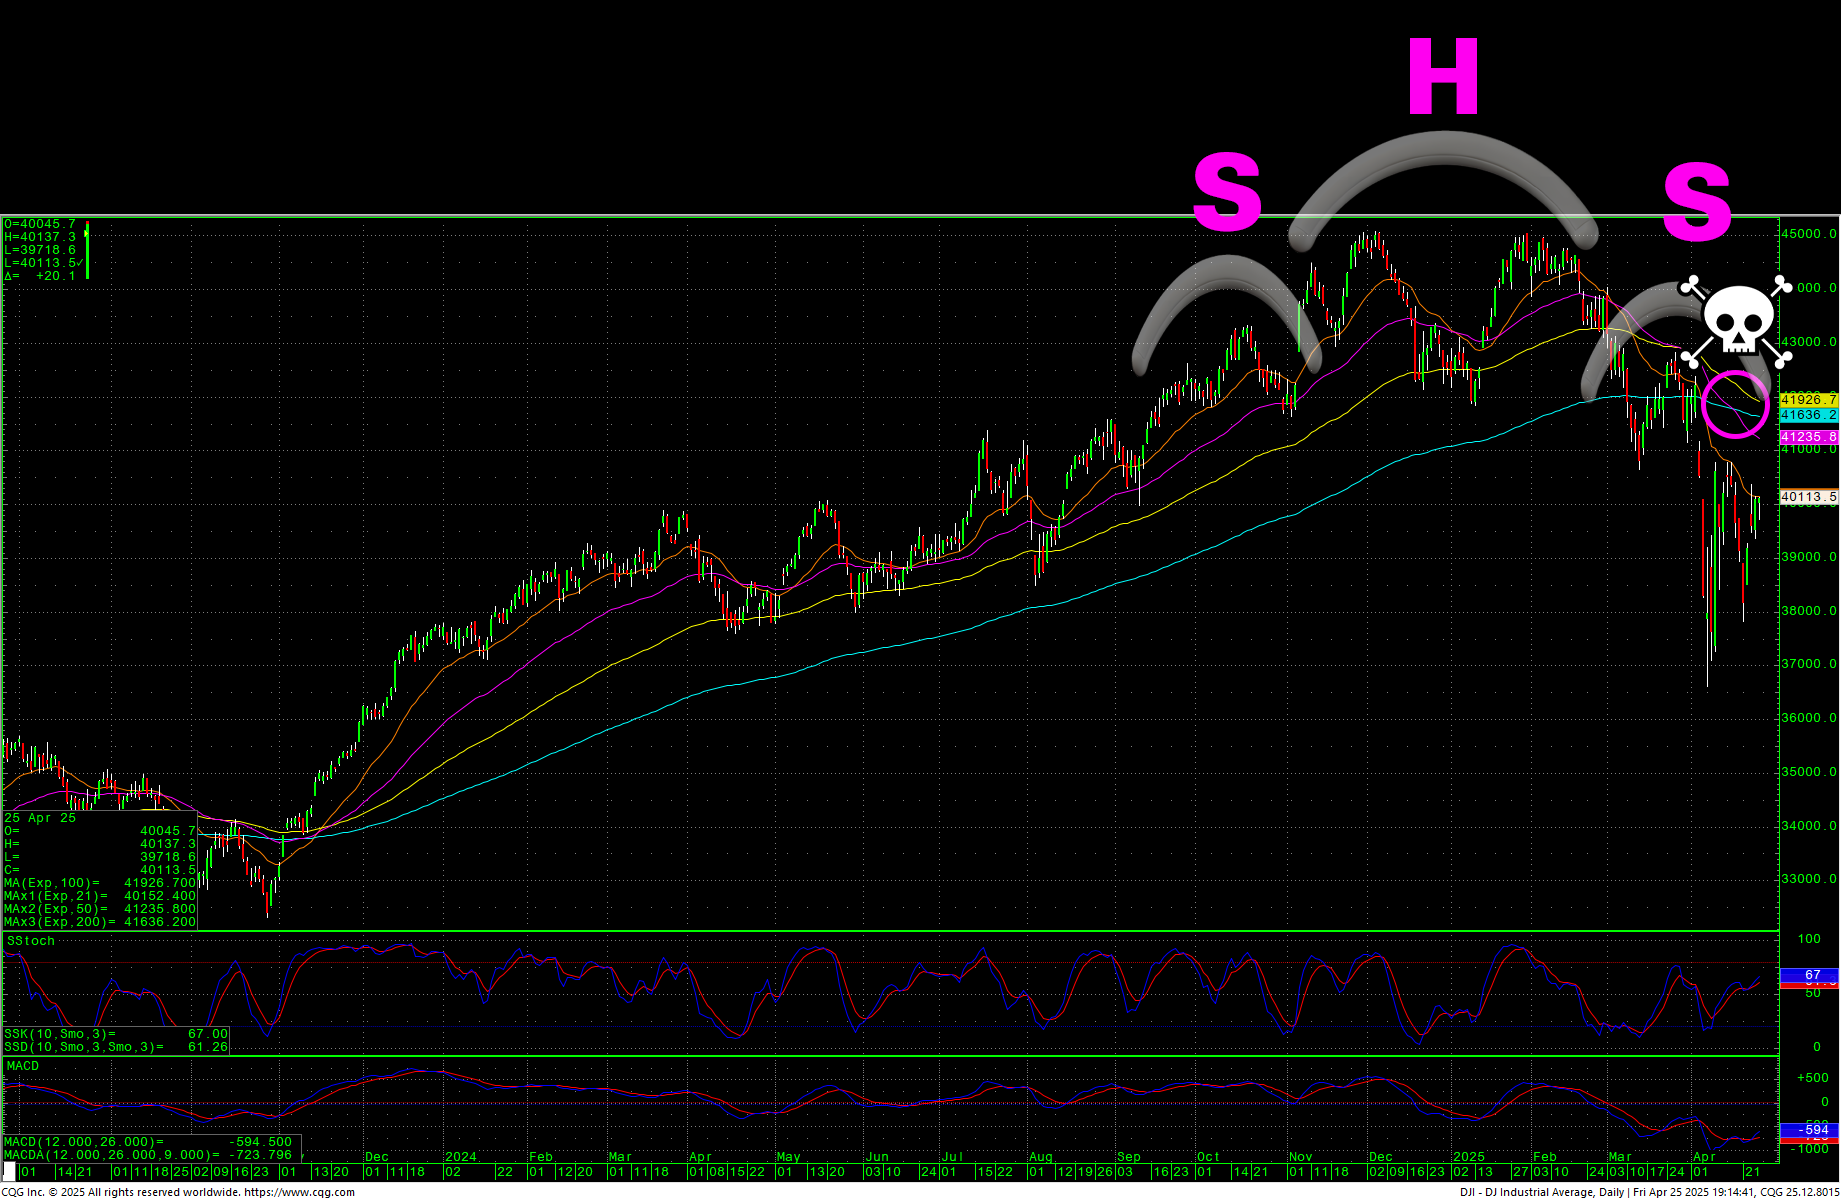 If you are bearish (as we remain), there is still the reality that we have a Death Cross on the daily Dow, SPX and Nasdaq charts. All are trading under their 50-day MAs and, timing-wise, we may be mapping out large H&S top patterns on the charts (which will simply require more time at this juncture). Another potentially bearish indicator is volume, which slowed sharply during the surge last week. It just looks like more and more retail traders continue to pile in to this market.
“This is the quietest, calmest down 4% day I can recall,” said Dave Lutz, a 30-year veteran known for his market commentary. “Equity and options volumes are non-existent.” –Money Control
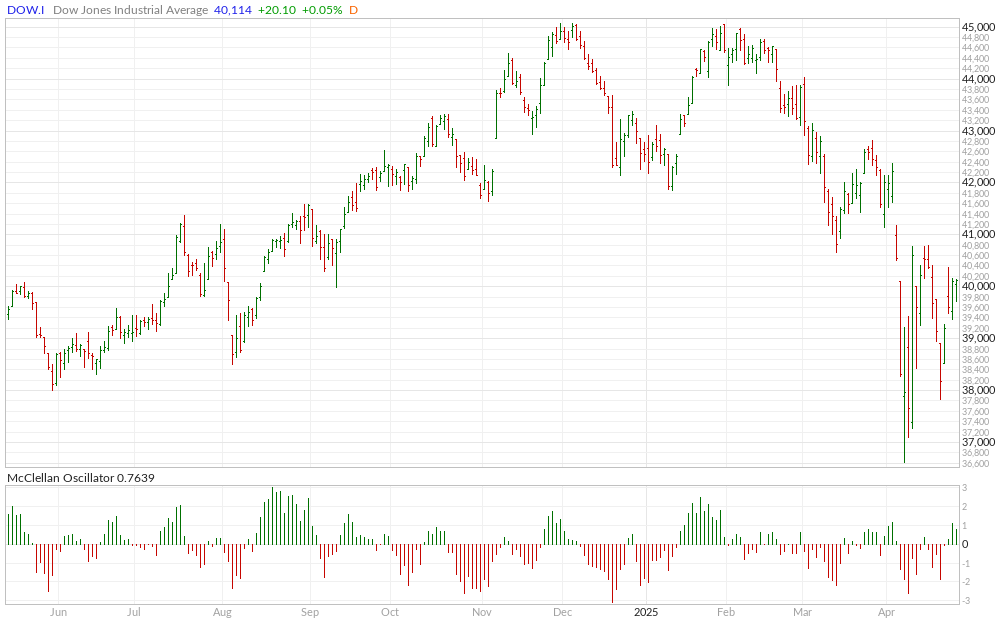
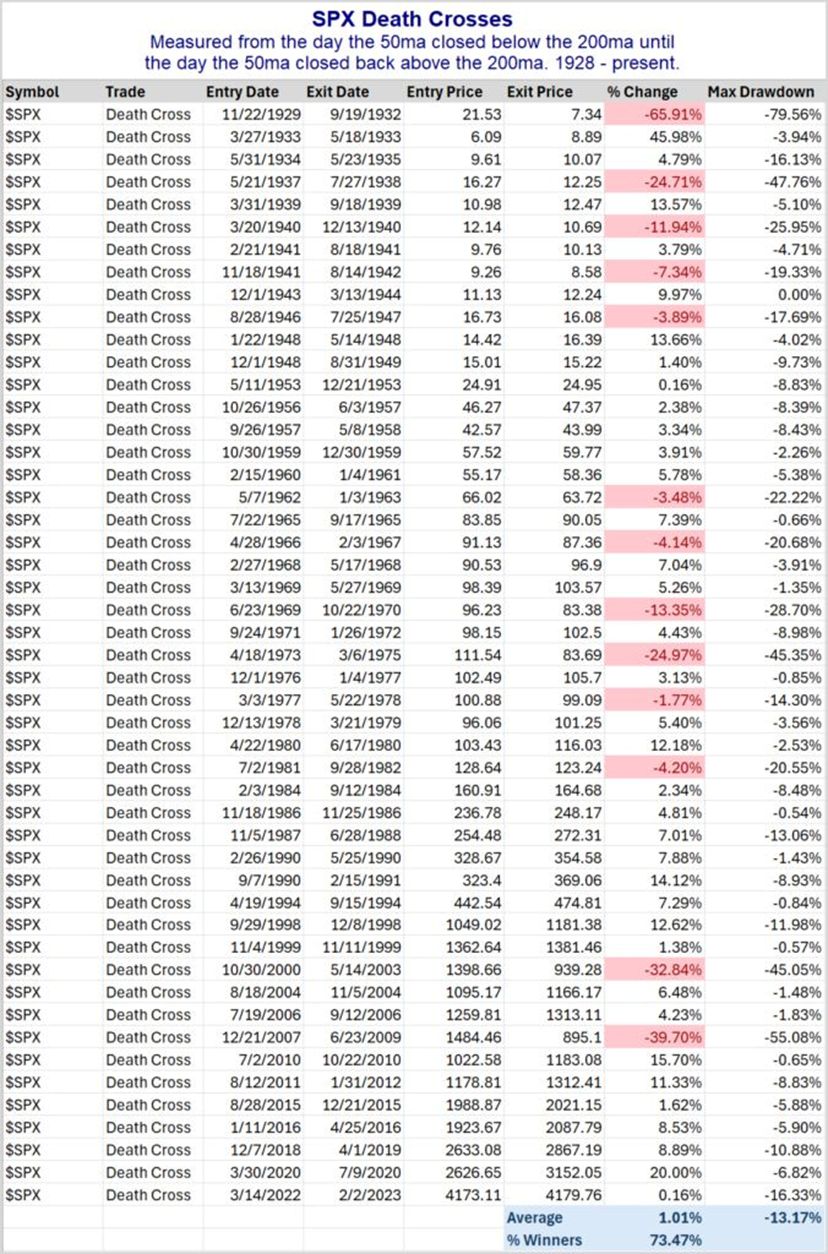 The table above shows that Death Crosses do not always equal Death, The Dow did not have a bullish engulfing, just a bullish reversal…and it would require substantially more upside action to turn the chart around. Long-term cycles DO NOT favor the bullish case, but price dictates reality. Strap in.
Re-printing from the March Timing Update:
“Again, this current window does not end until early May and could run into mid-Summer, late July to early August. While the energy shifts a bit coming out of March, April has the potential to be much more aggressive. Conflict is a keyword, how it plays out needs to be seen. I would not rule out a Black Swan in April, something that confirms the long-term trends and takes participants by storm. The weekend of April 19-20 is key with the 21st as the next ultra critical timing point.”
About the timing, Monday definitely marked a critical turning point, and I would argue that the death of Pope Francis fits the cycle’s call for a “geopolitical event” around Easter weekend.
“While this window runs through the first week of May, it is looking more and more, from a cycles standpoint, that this will run well into Q4 2025/Q1 2026. Thus, a much more protracted and drawn-out bear and not the “flash crash” that everyone has gotten used to over the past two decades. That doesn’t mean we won’t have significant rallies, but chasing rallies is likely to be a losing strategy until this thing is spent…which very likely will not be until Q1 2026 at this point.”
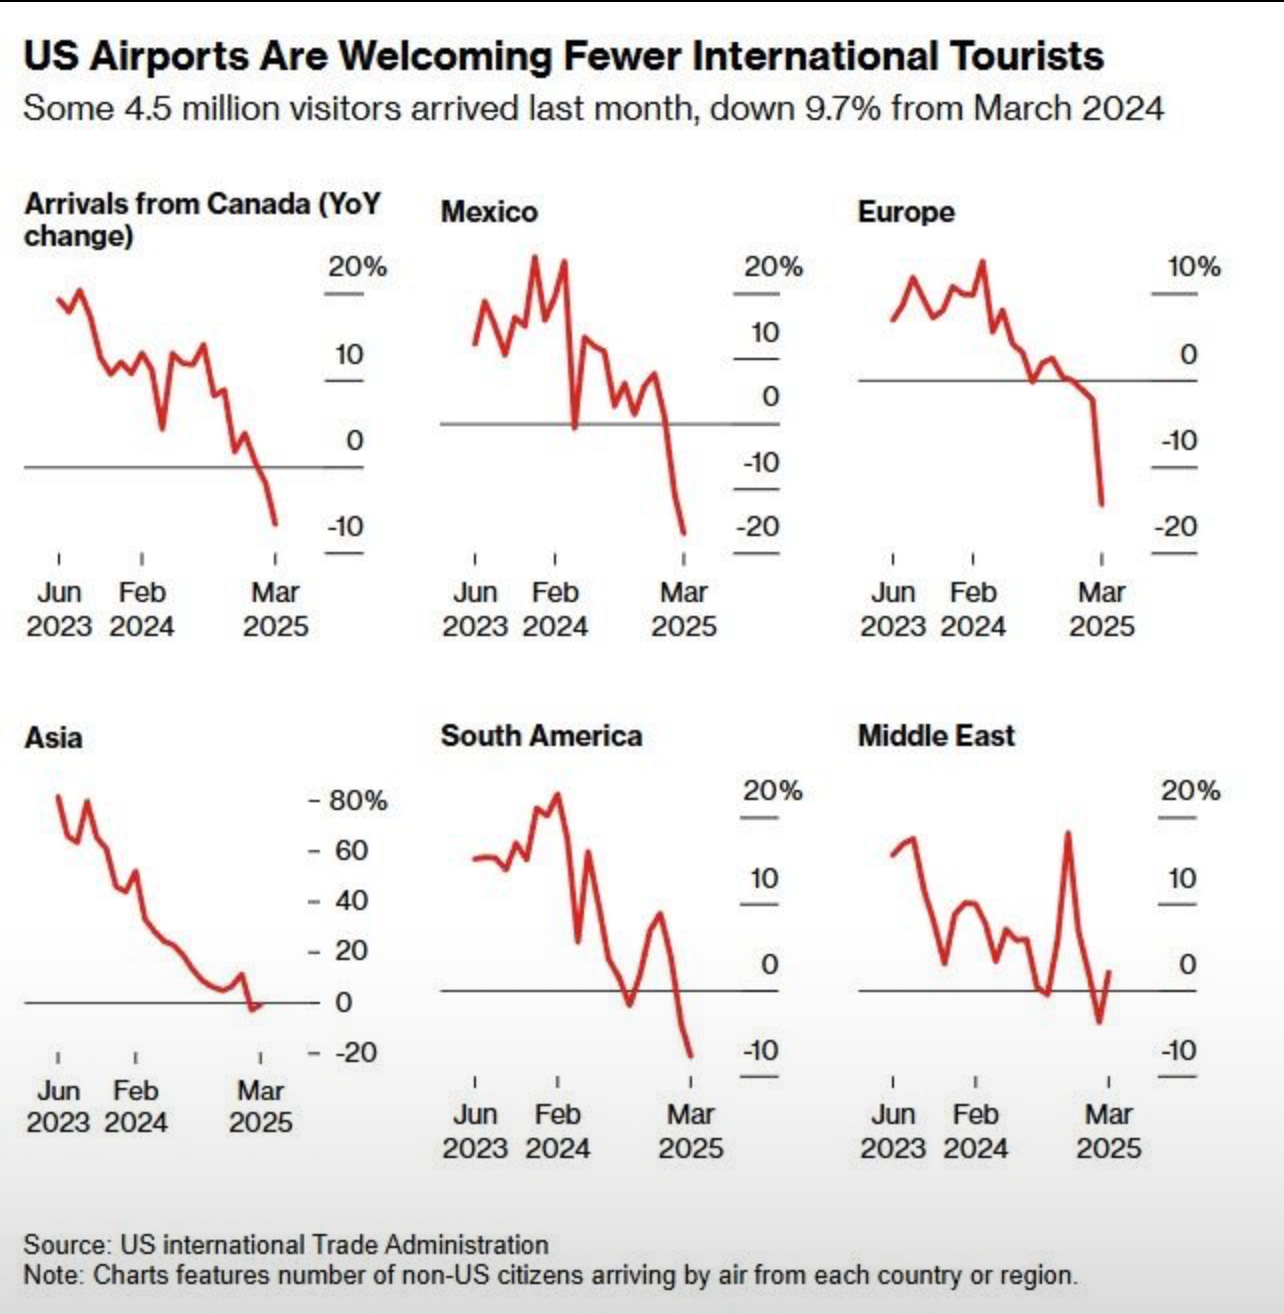
 Travel to the United States is plunging as the brand is being tarnished. We have some BIG reports coming up this week, including GDP and PCE on Wednesday and Nonfarm Payrolls on Friday.
 Capital expenditure is now expected to drop sharply in 2025.
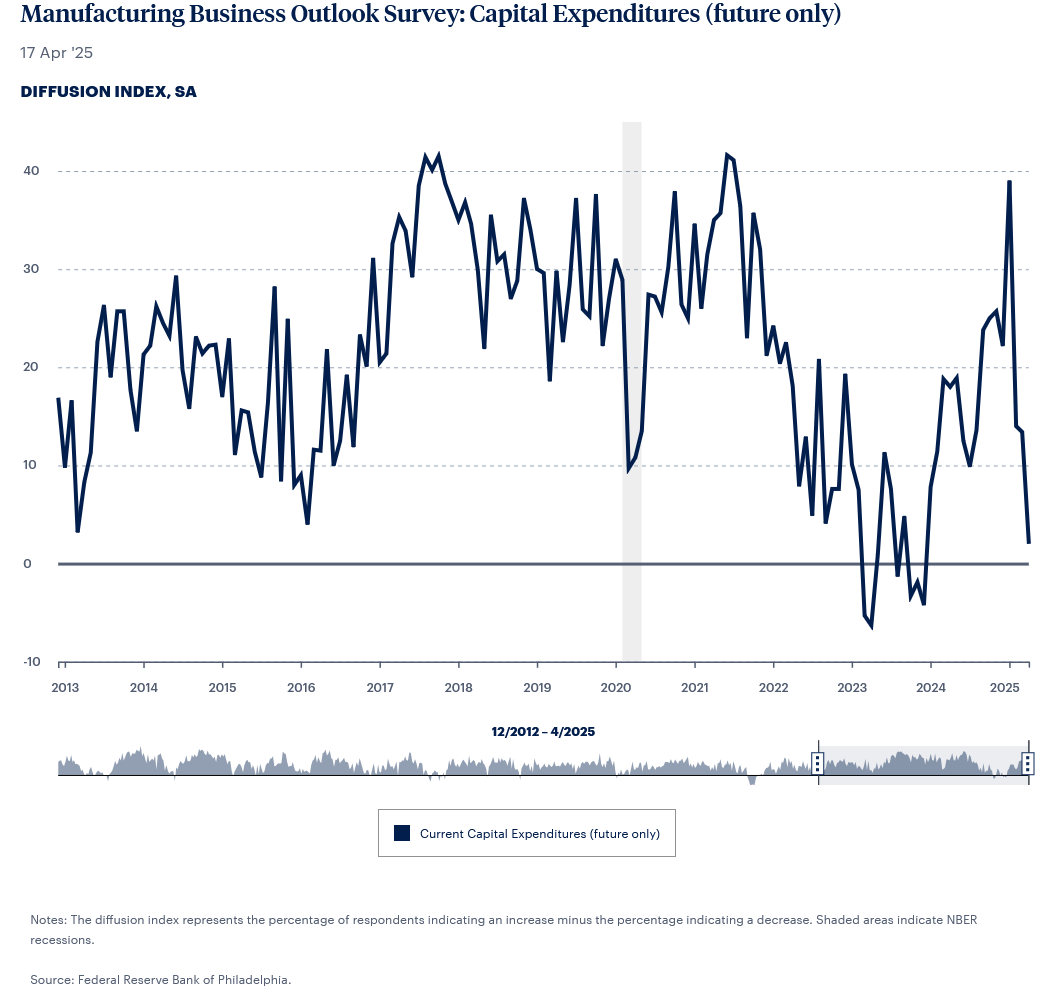
Manufacturing is now expected to see a severe drop as well.
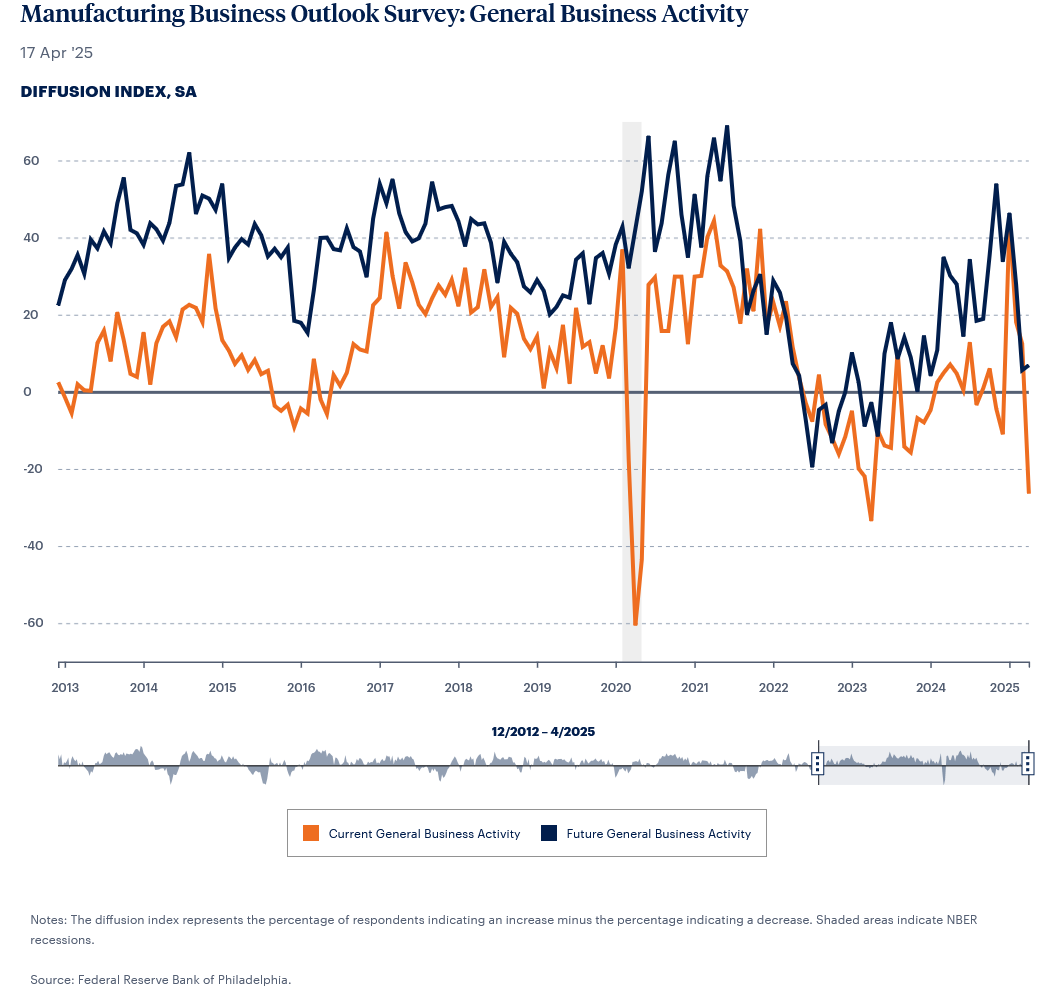

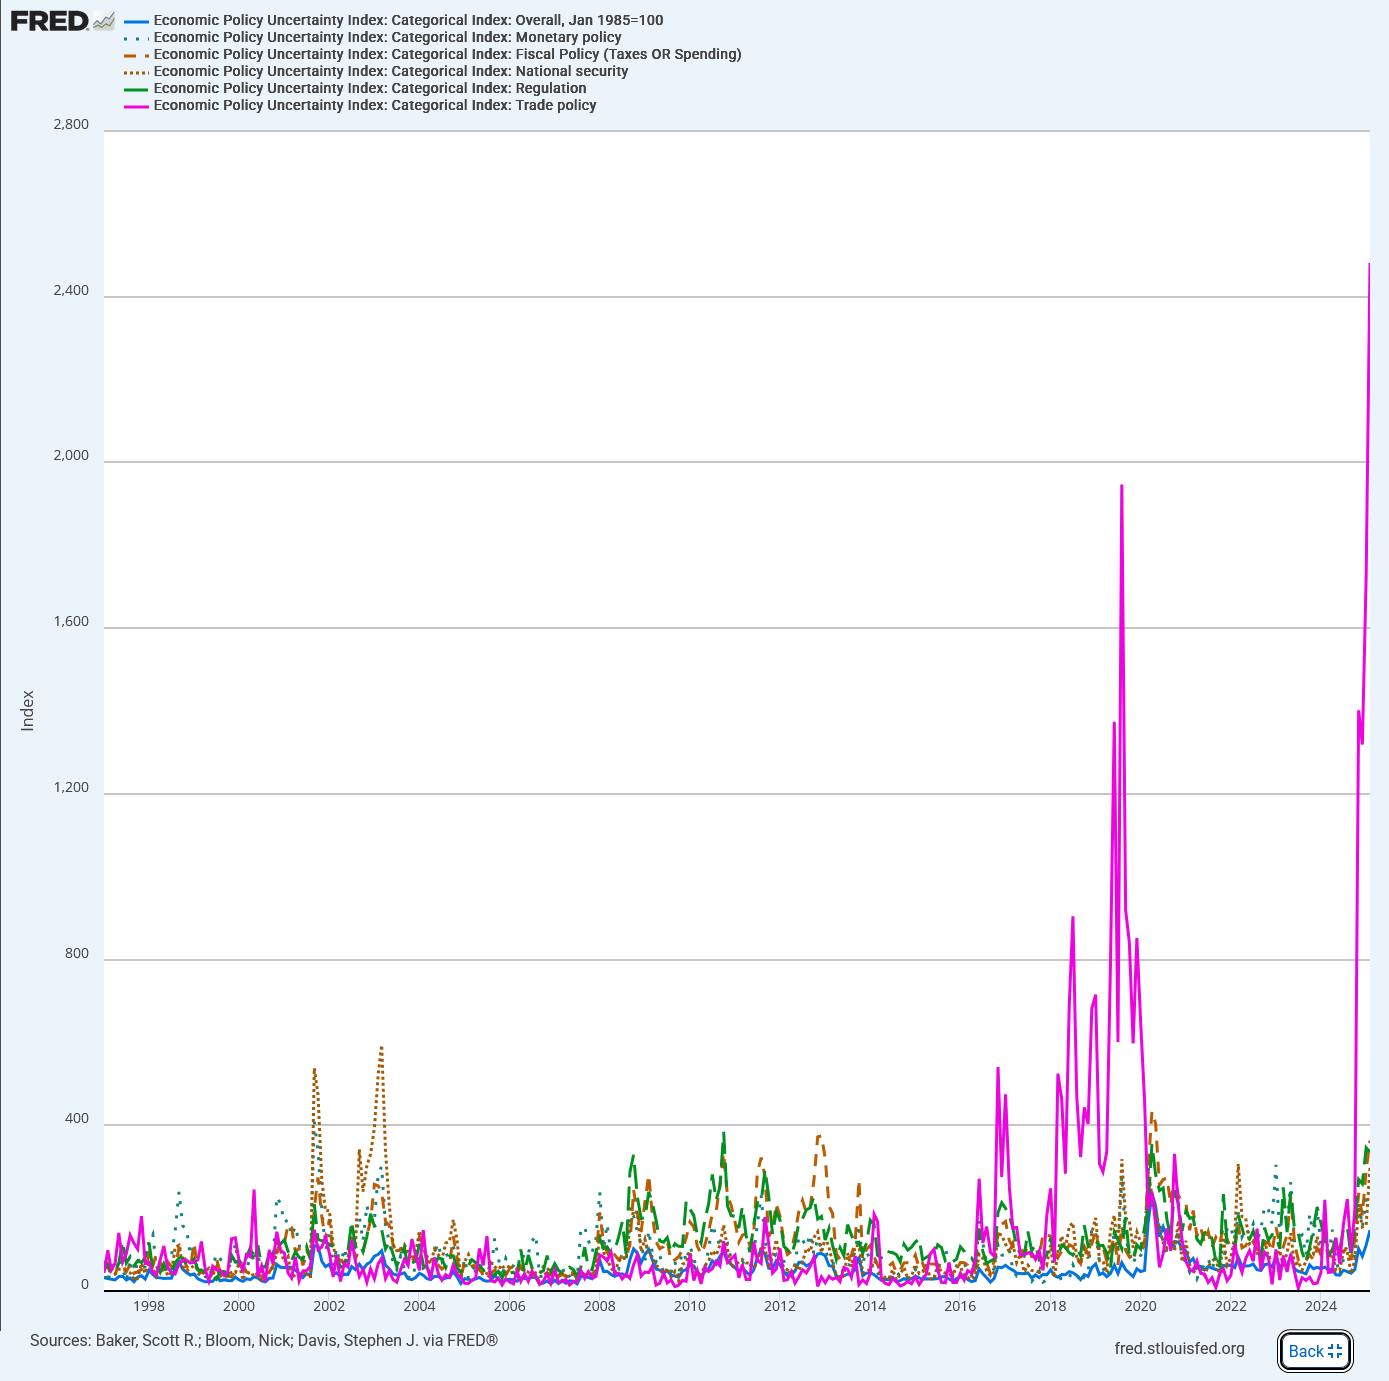
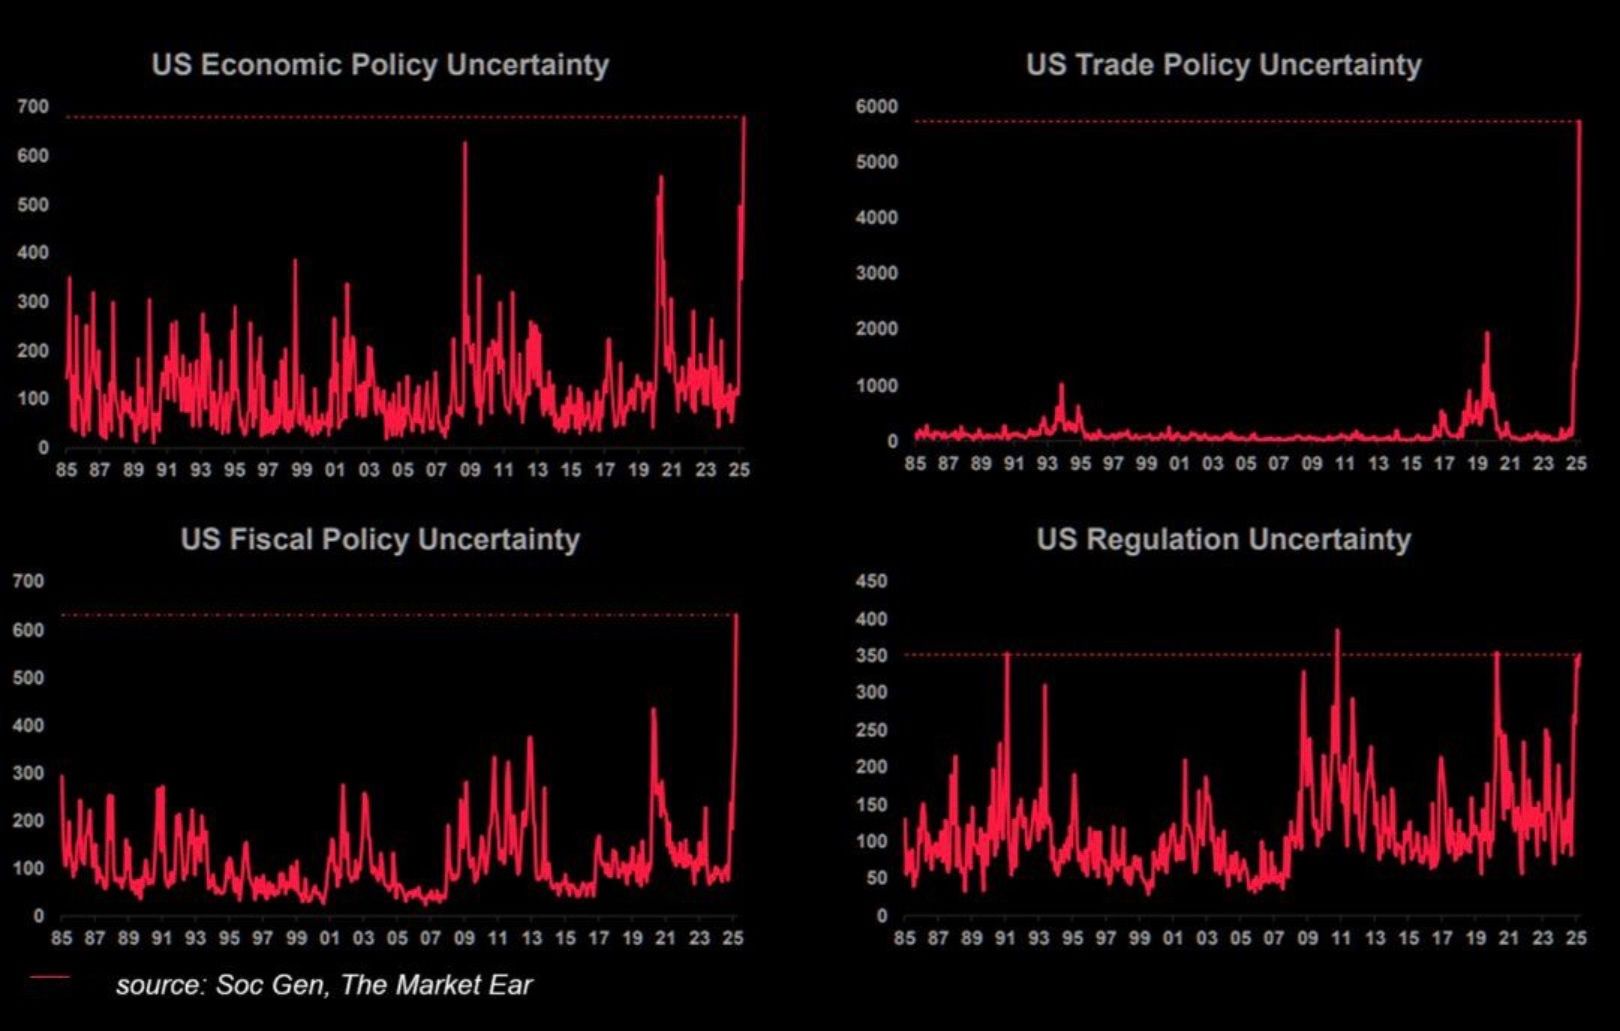
 Economic Uncertainty has exploded with no one sure what Tariff Man will do next.
 GDP is released on Wednesday. Pedestrian guesses are for a reading of +0.4%. Atlanta Fed is now predicting the Q1 to be -2.5% and -0.4% when accounting for gold imports.
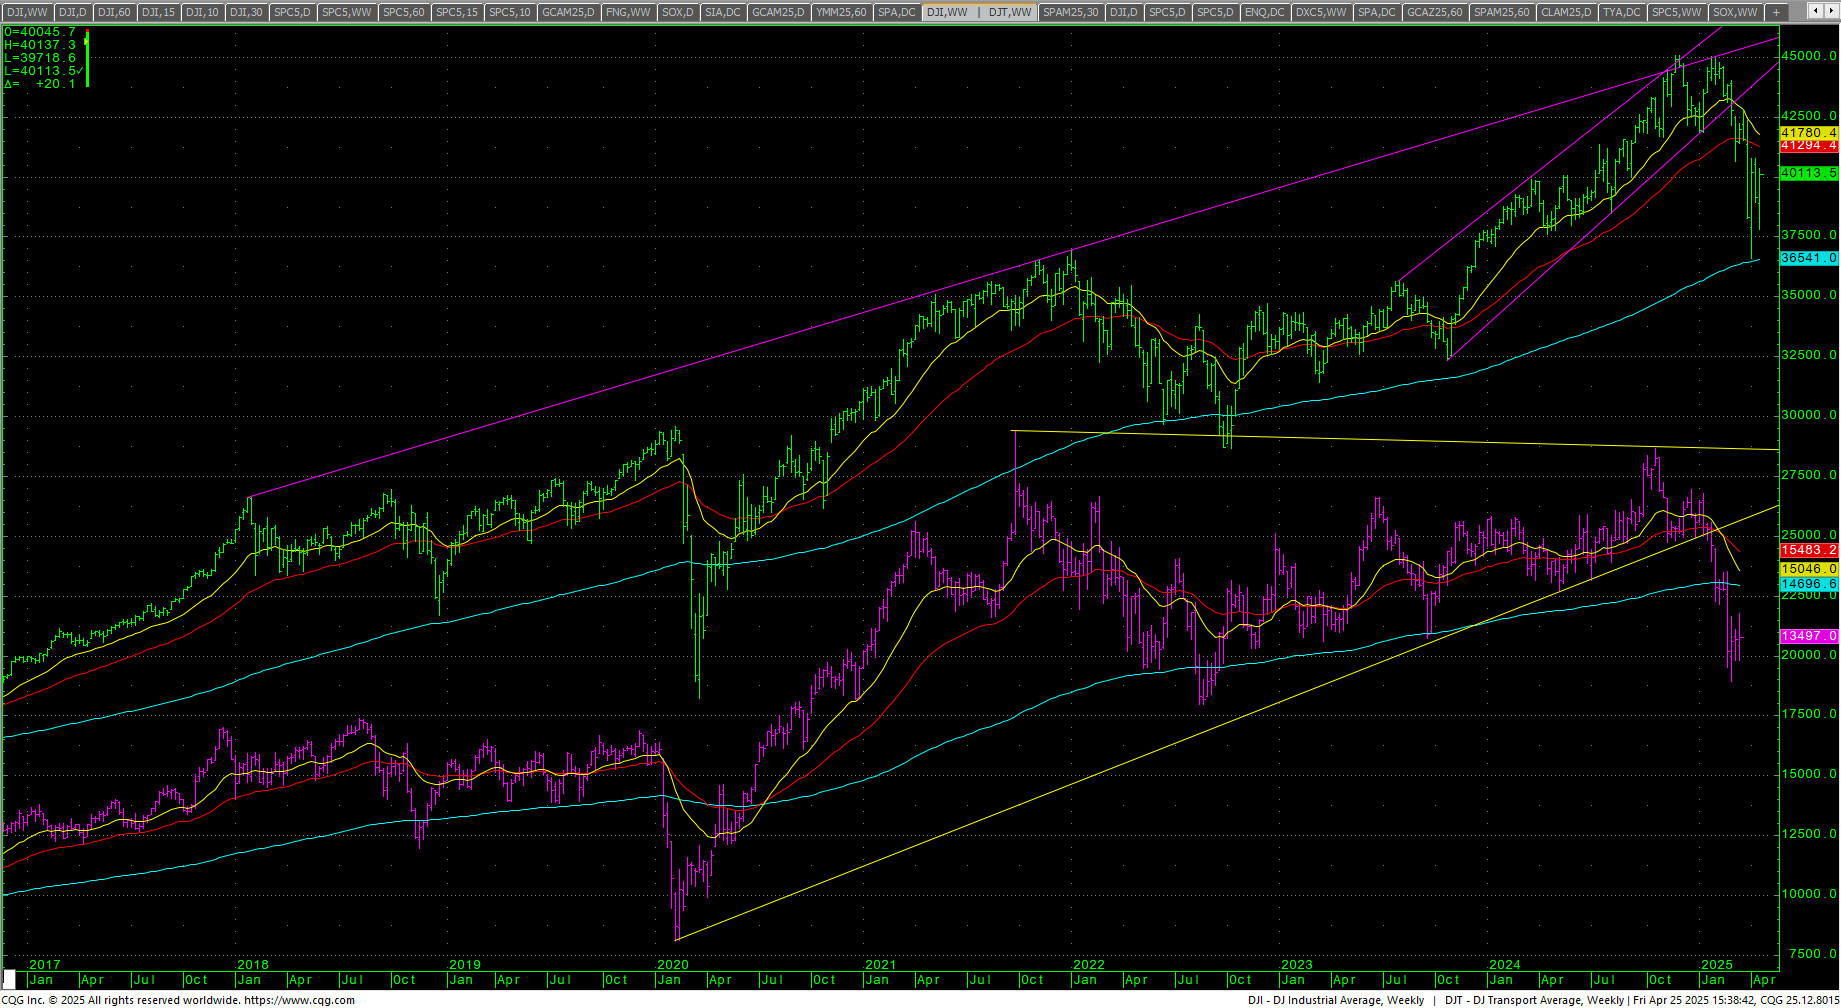
Dow Theory
 Dow Theory still has a bearish pattern with the Transports holding the weakest pattern.
MAGS (Magnificent 7) Daily H-L-C
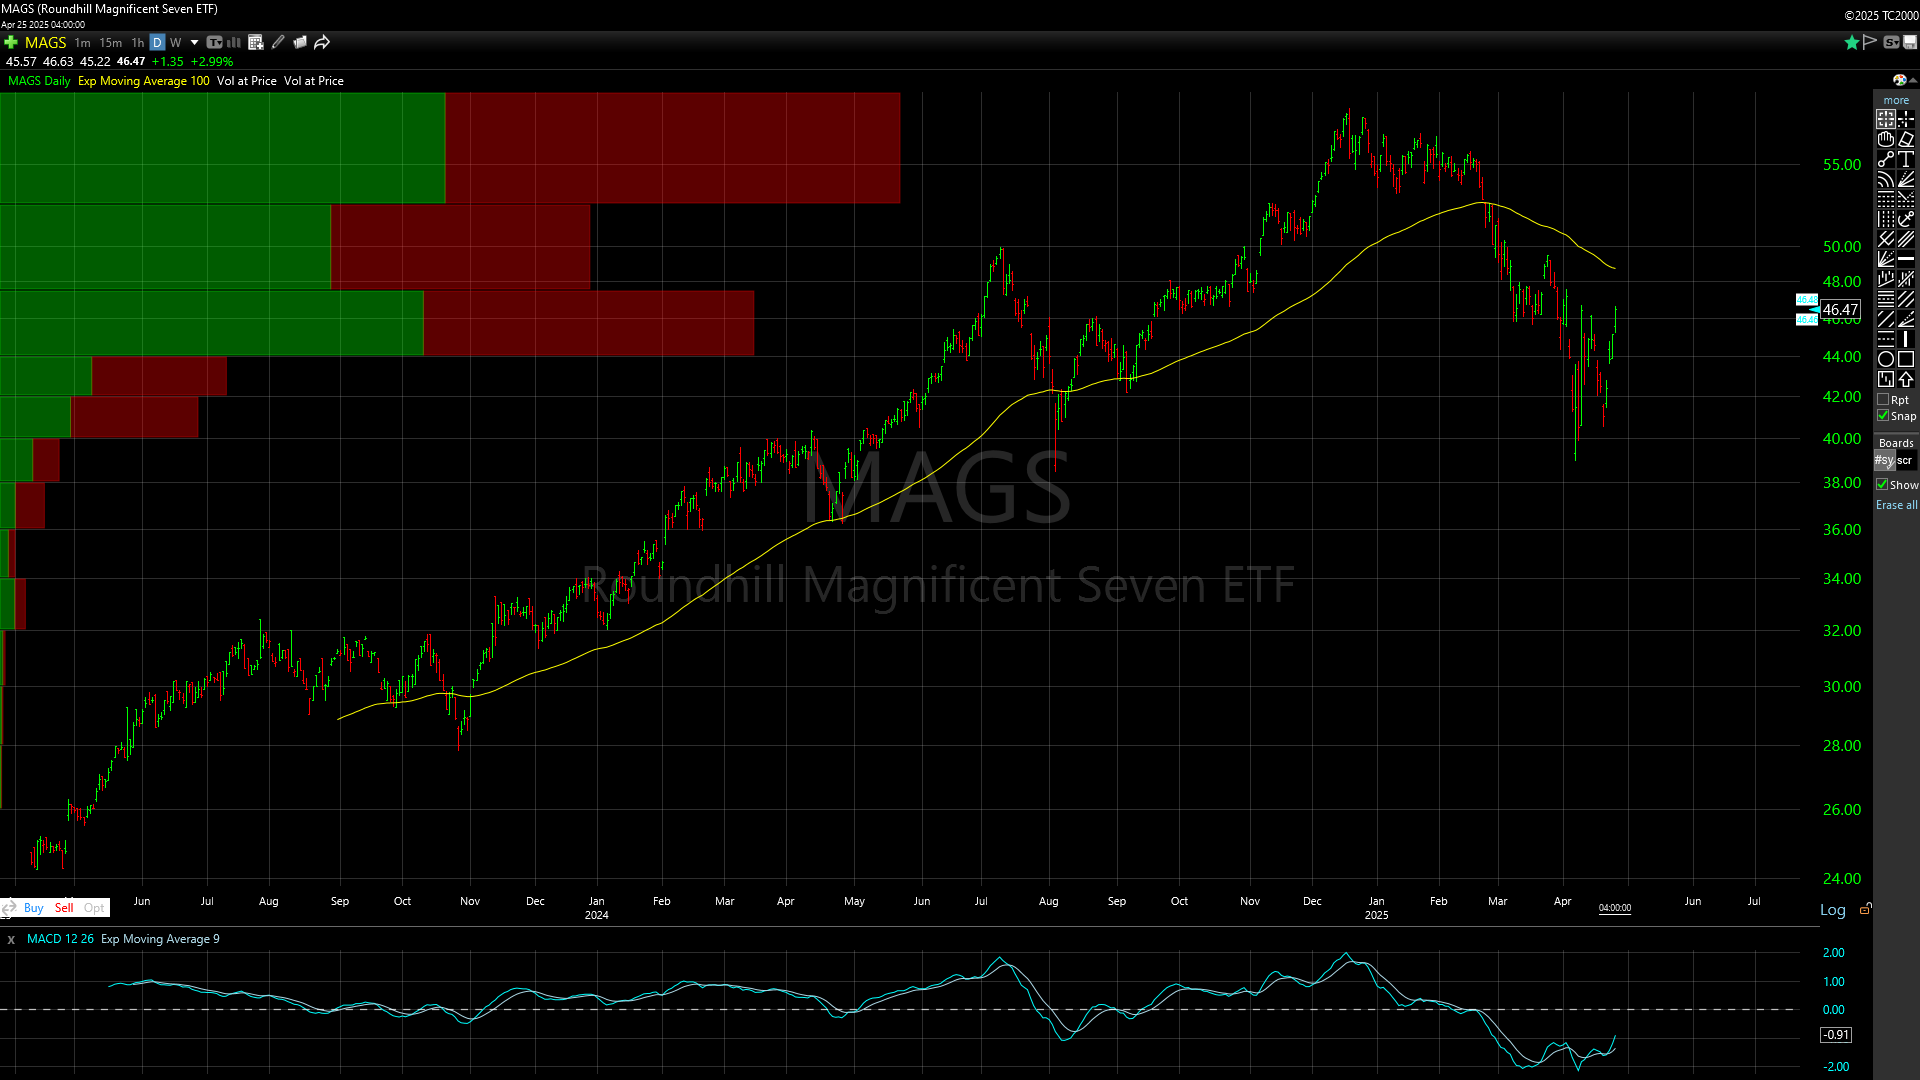 The MAGS (Magnificent 7) staged a Bullish Engulfing Candle and closed right at the massive high-volume candle high of 9 April 2025…again on light volume dominated by retail trade. As has been shown the past few weeks of updates, the chart shows one of the most top-heavy charts in history where Volume at Price is basically ALL AT THE TOP. Retail remains the biggest buyers. Somewhere underneath here we will hit a major artery for retail. Basically, the floor is the limit. If this is year 2000 all over again, the MAGS could go all the way back to where it started. Selling rallies against 48/50 should remain the short-term strategy until proven otherwise. Closes over 50 in the MAGS would change things.
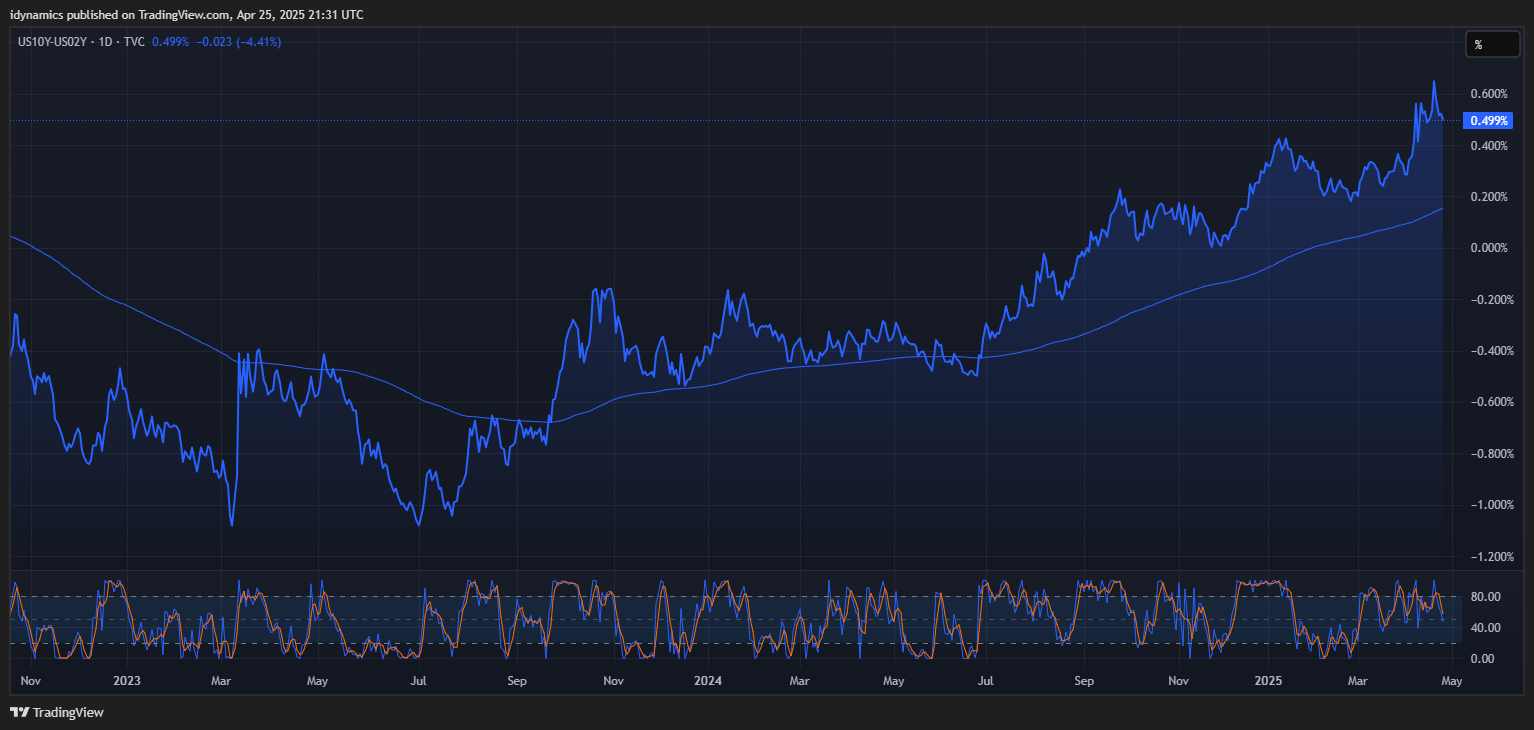
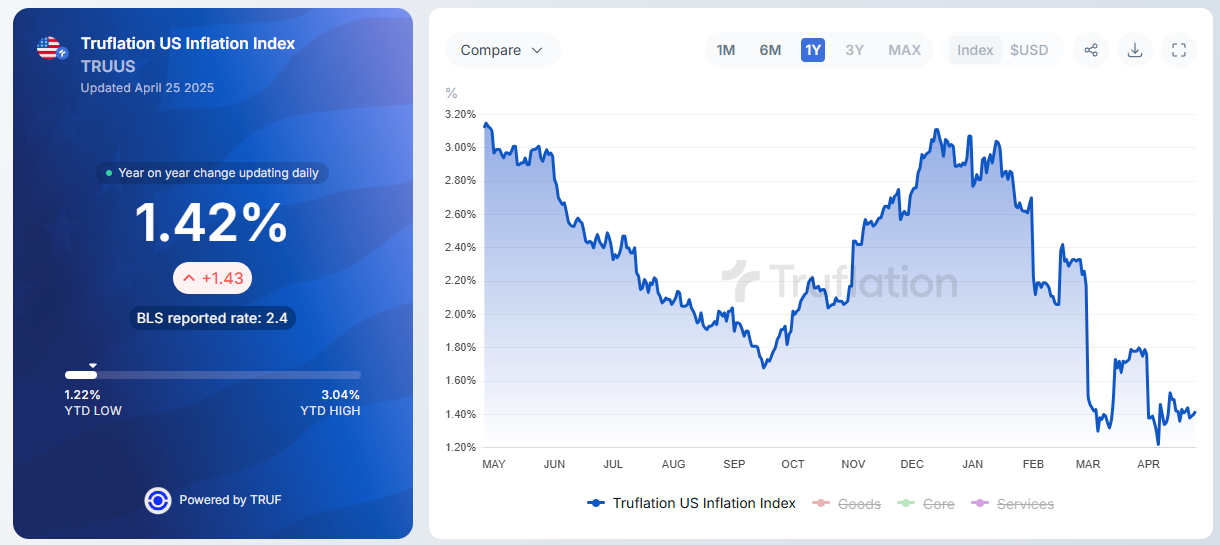
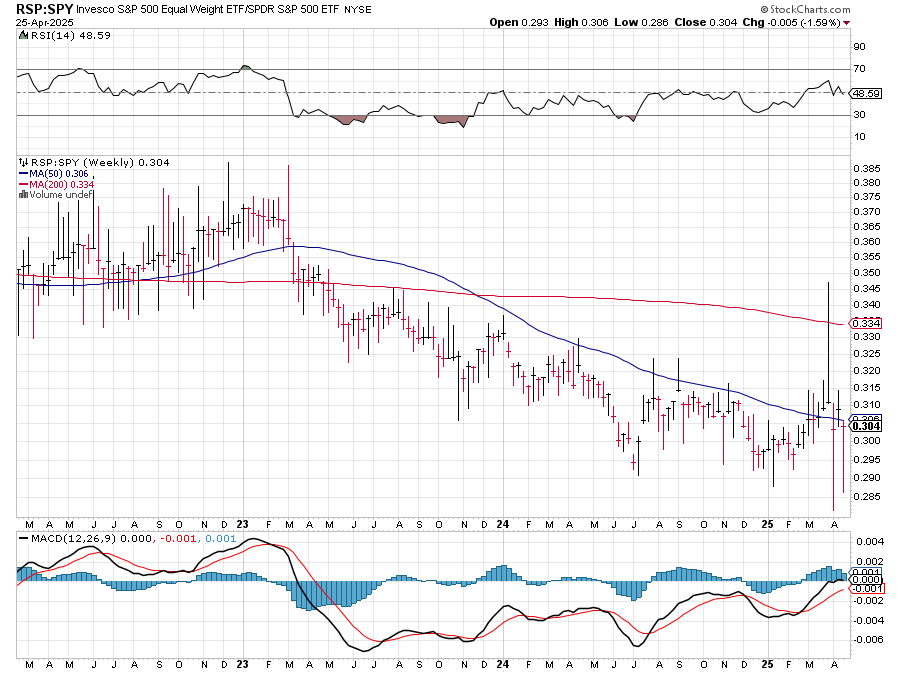
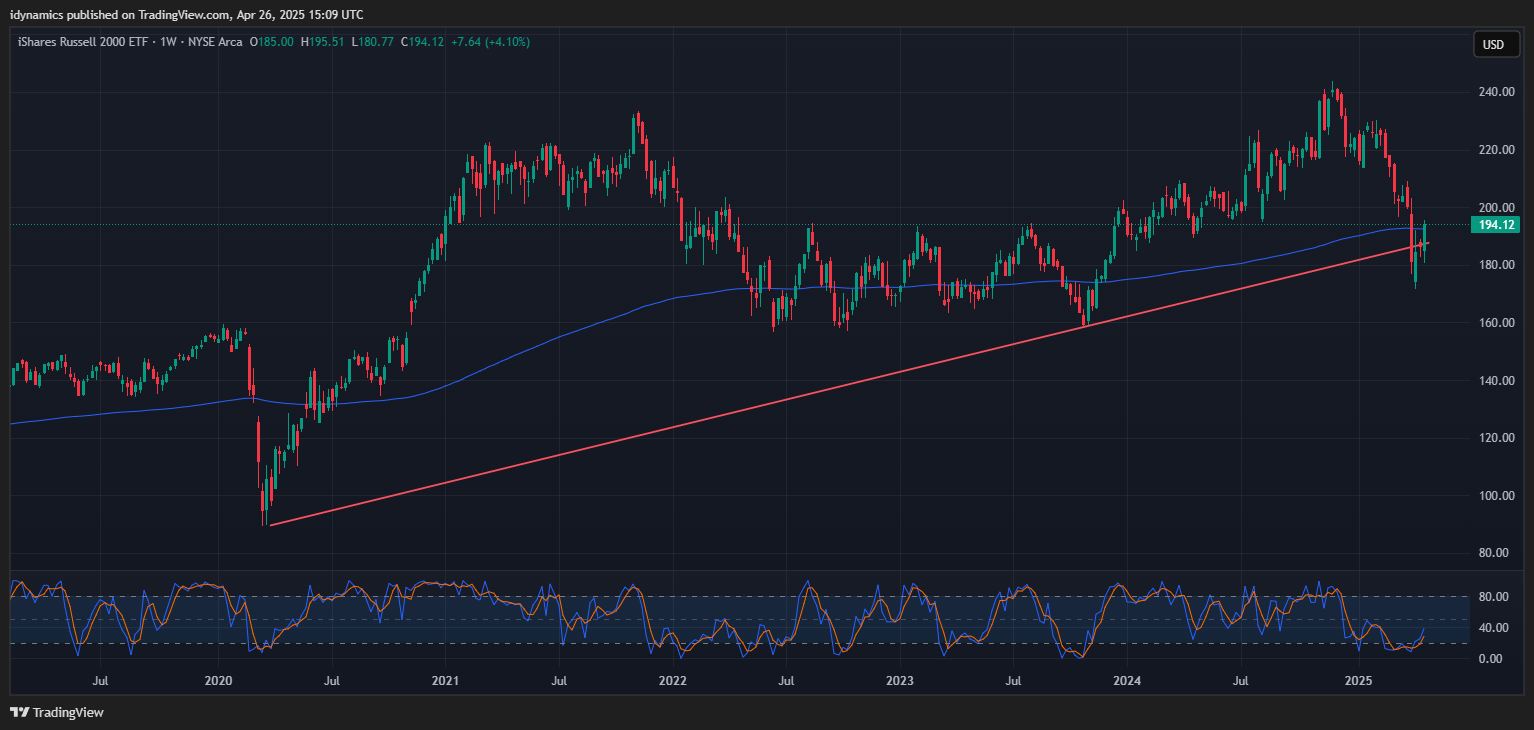
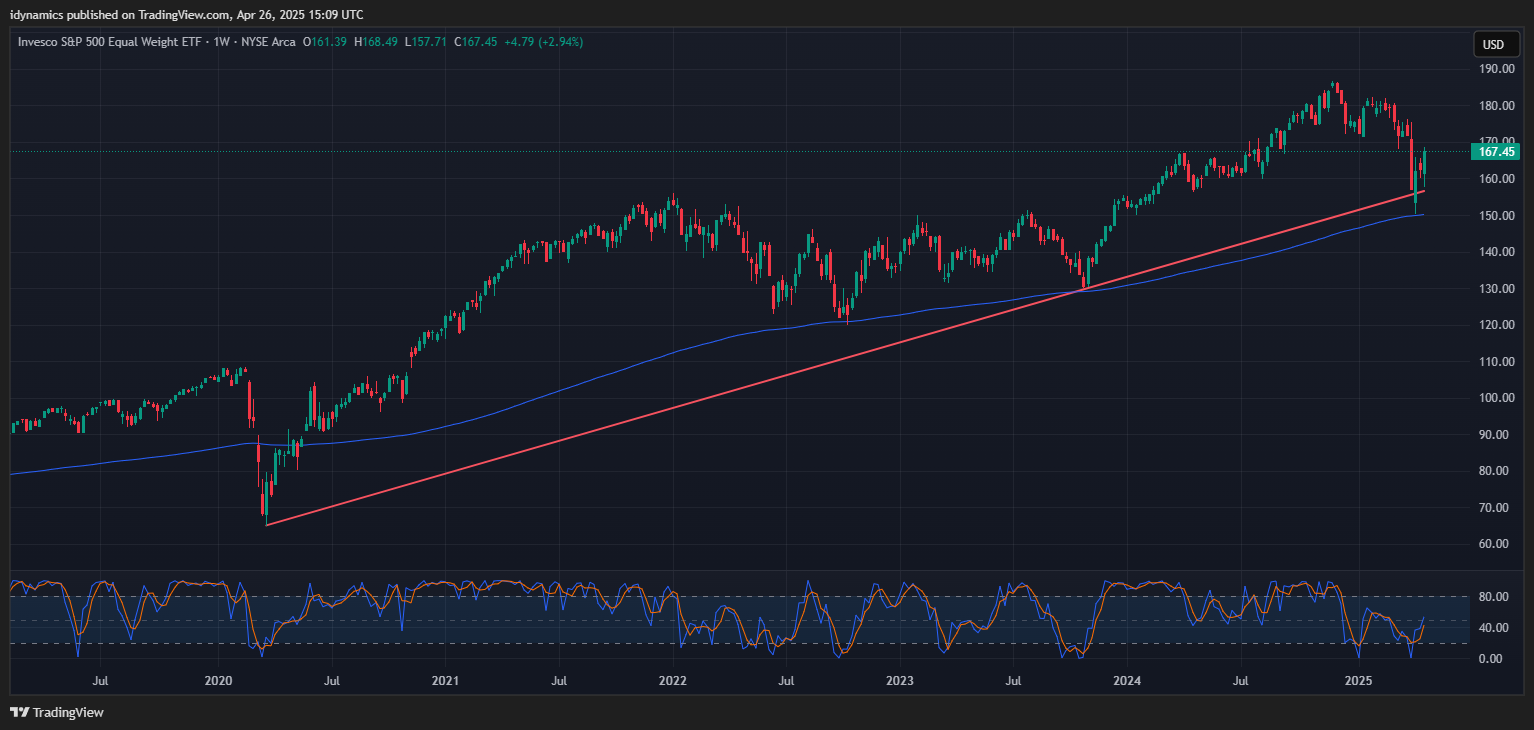
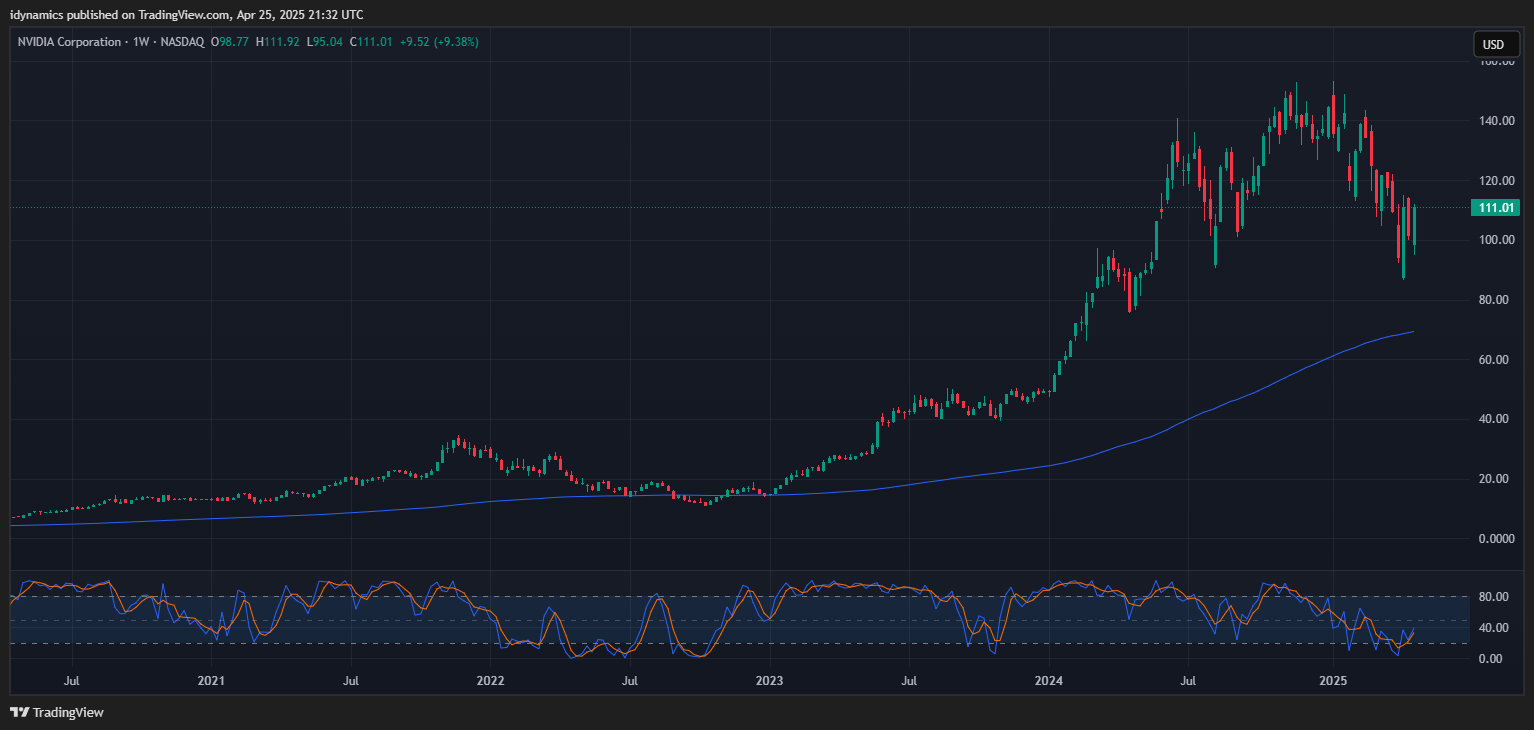
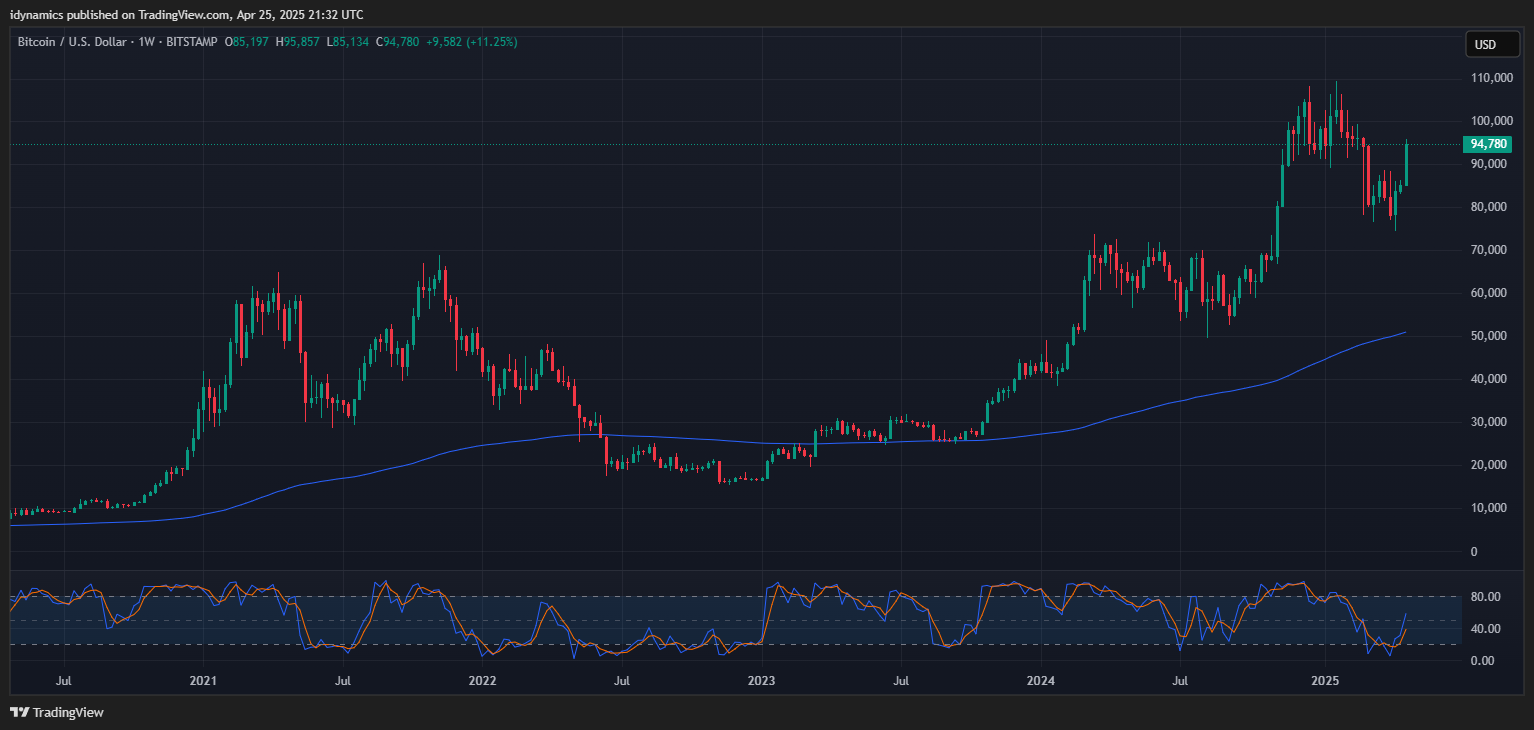
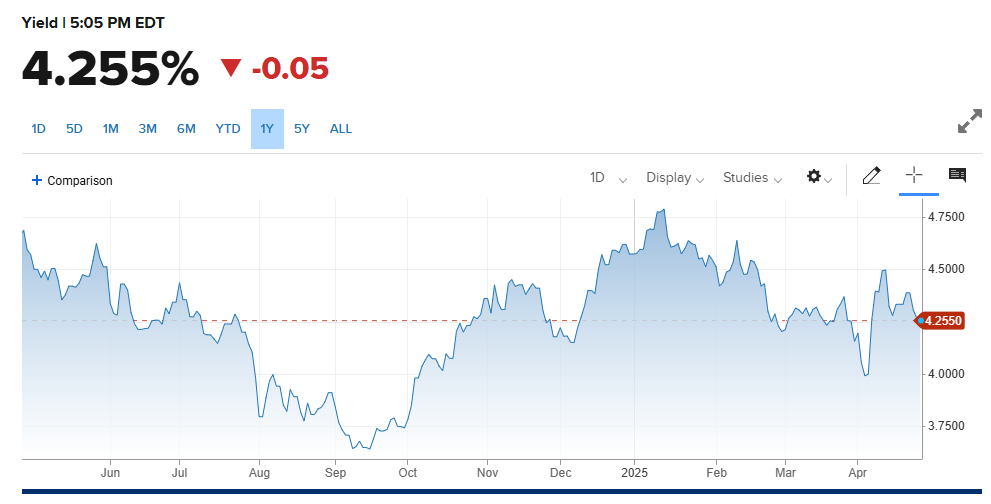
The RSP:SPY closed lower on the week after yet another test of multi-year lows as the secondaries fell off the pace with the rally last week. The IWM closed up +4.10% on the week on top of a bullish engulfing candle and has reclaimed the 200-week MA. The RSP also traded a bullish engulfing and ended at the top of the range. NVDA reversed higher and closed on the top end of the range as it regained the 110 level, ending up +9.52%…this stock remains the darling of the retail crowd. Bitcoin exploded +11.43% on the week, taking out 90K and moving to a seven week high. McClellan Oscillators are confirming the last couple days rally in the Dow. The Yield Curve spiked at +0.648% before dipping to end the week at +0.400%. The 10YR yield closed out the week lower at 4.255%. Truflation rose to 1.42%.
10YR-2YR Yield Curve Daily

 VIX Weekly Candles
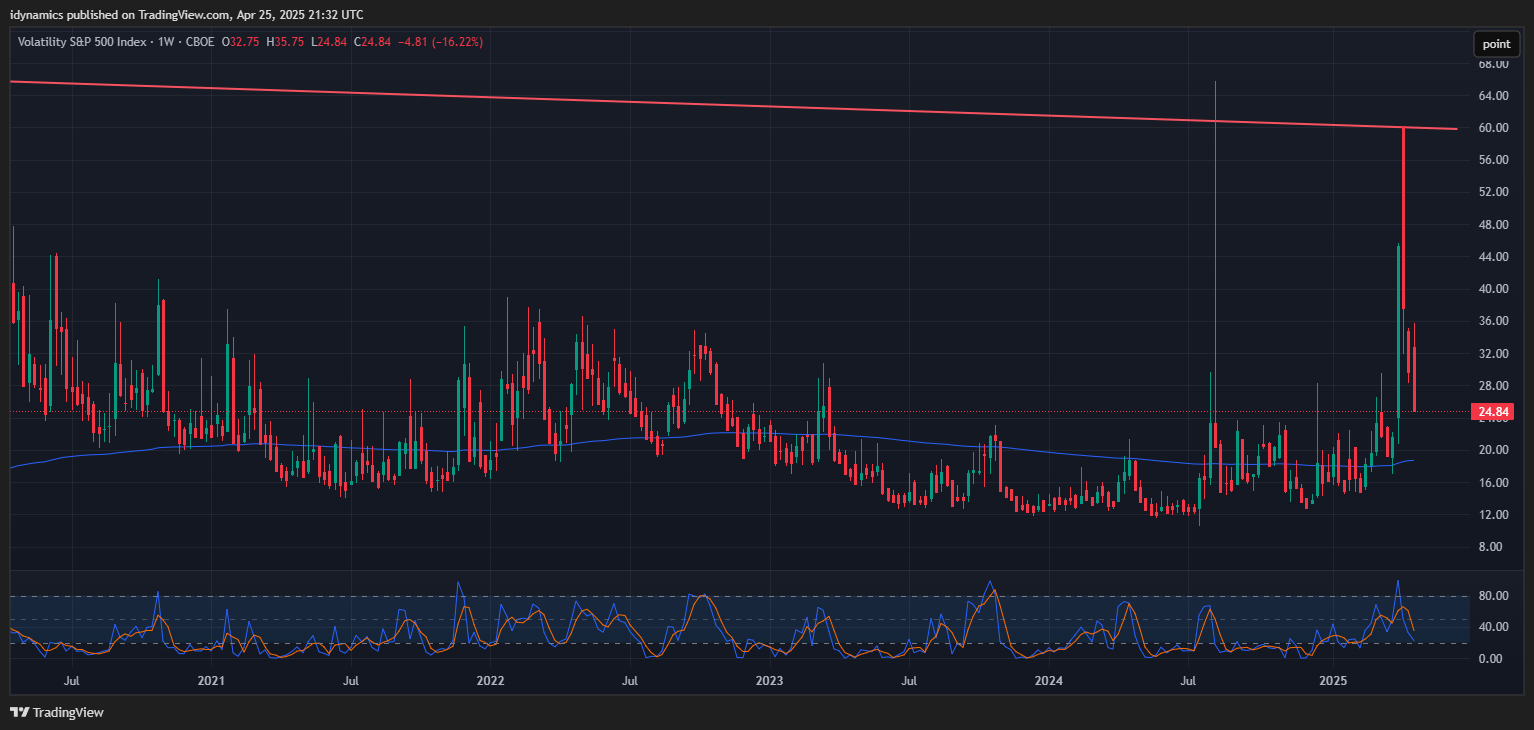
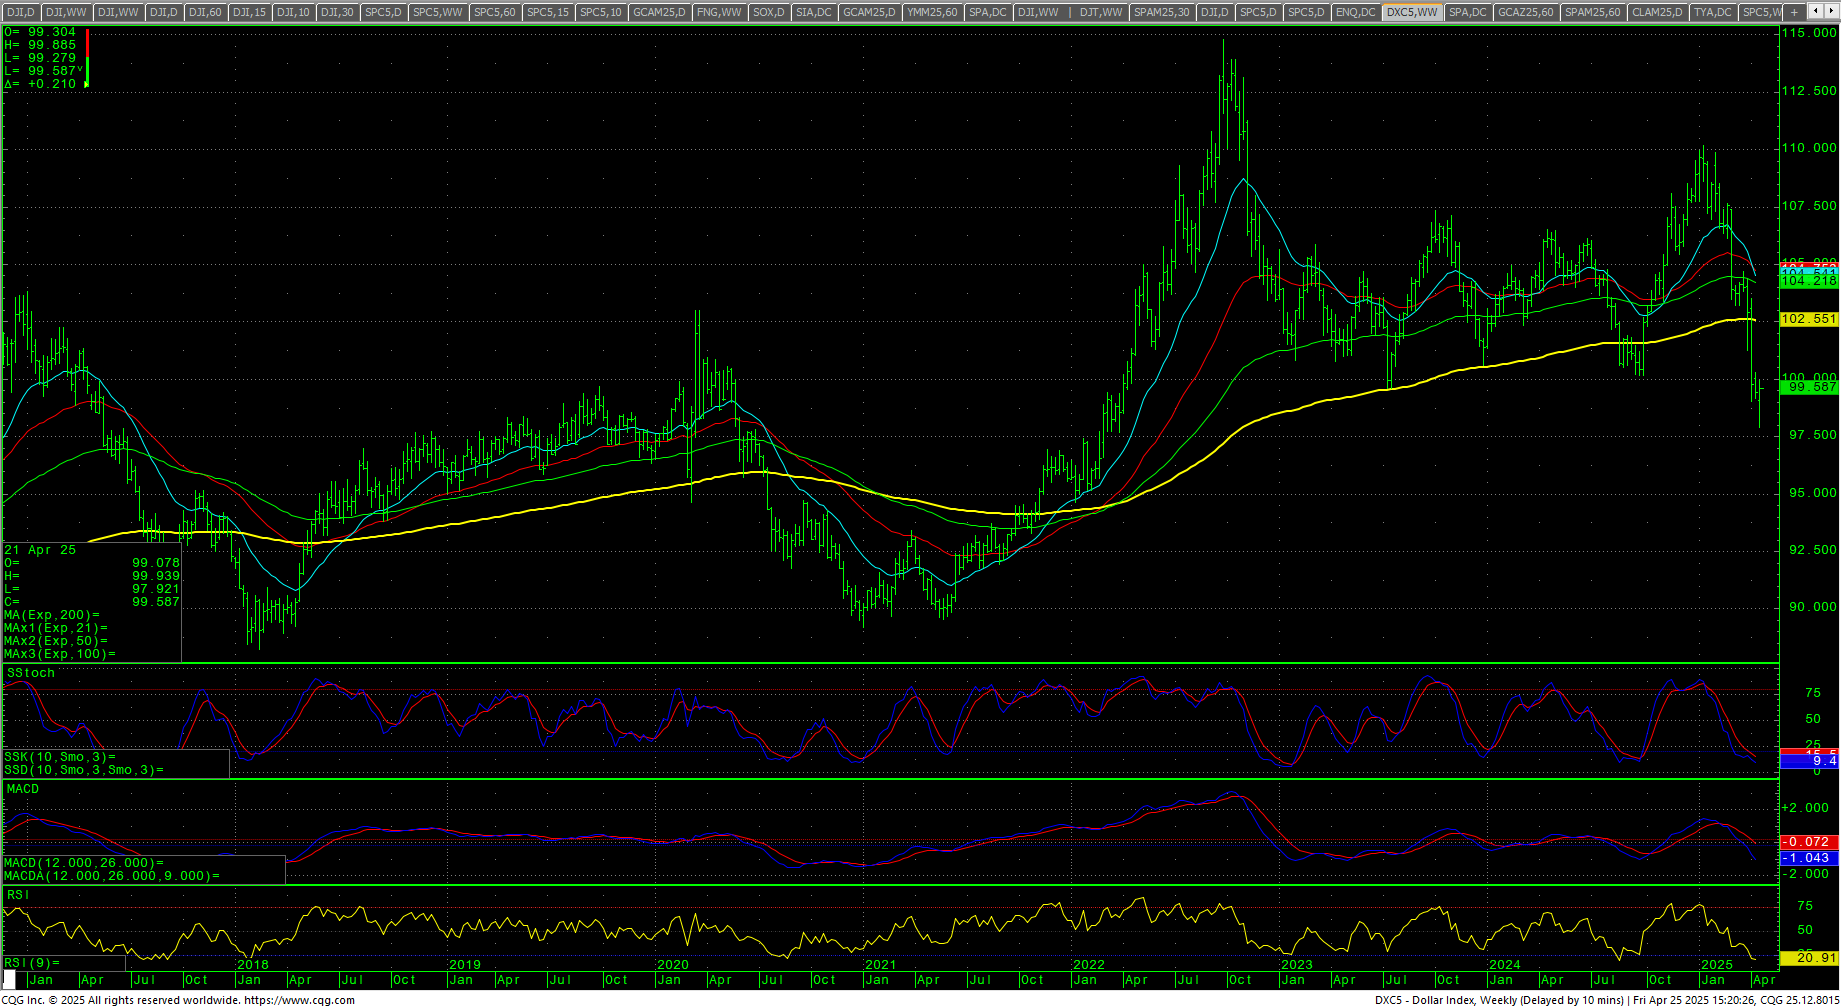
The VIX had a bearish engulfing candle and dropped back under the 30 level, closing on the bottom of the weekly range. The US Dollar revered higher from a multi-year (3 year) low and closed basically flat.
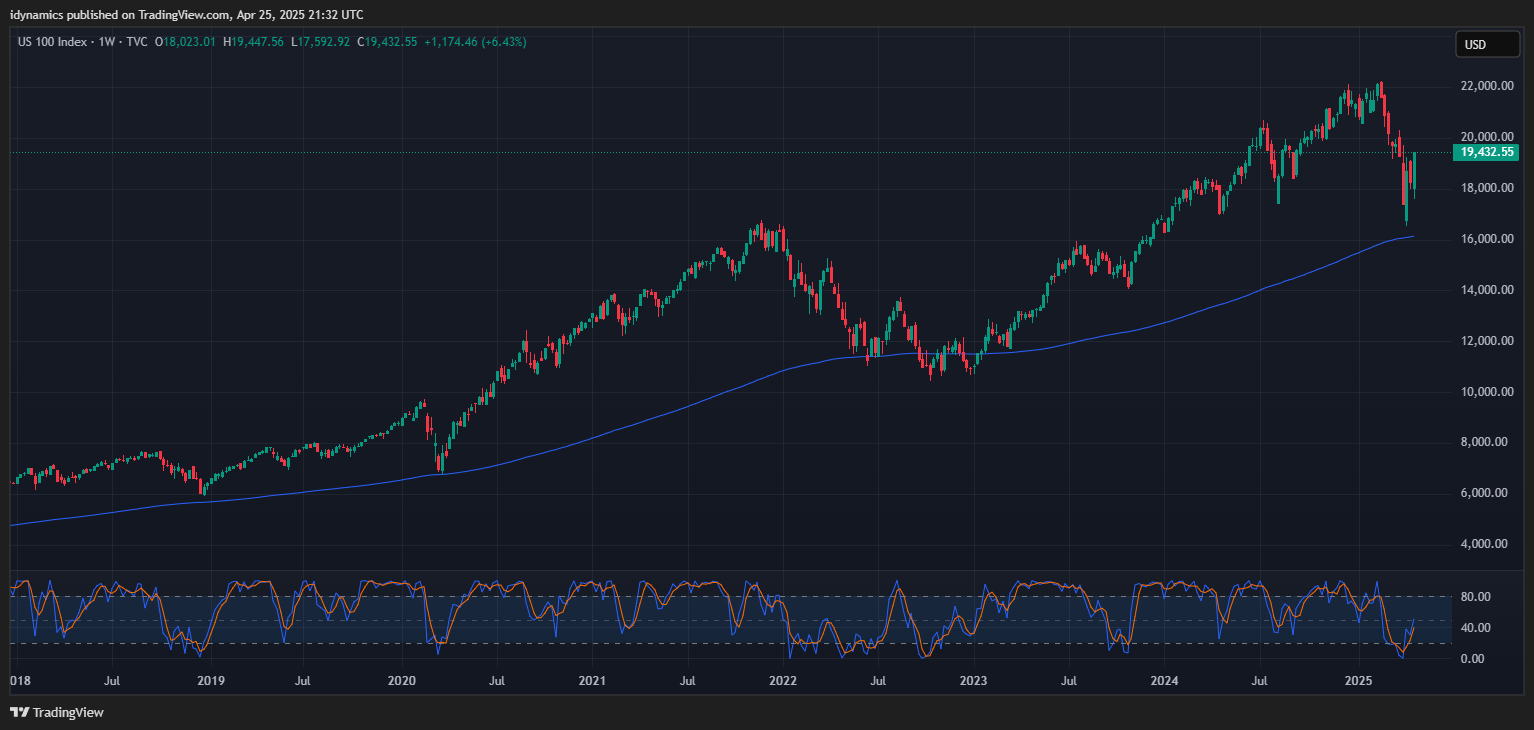
 Nasdaq 100 Weekly Candles
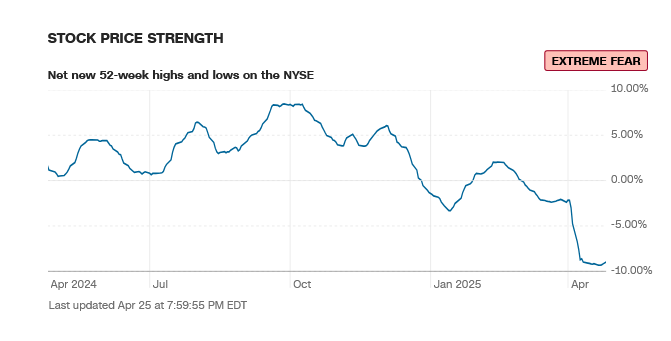
52-Week A/D Line
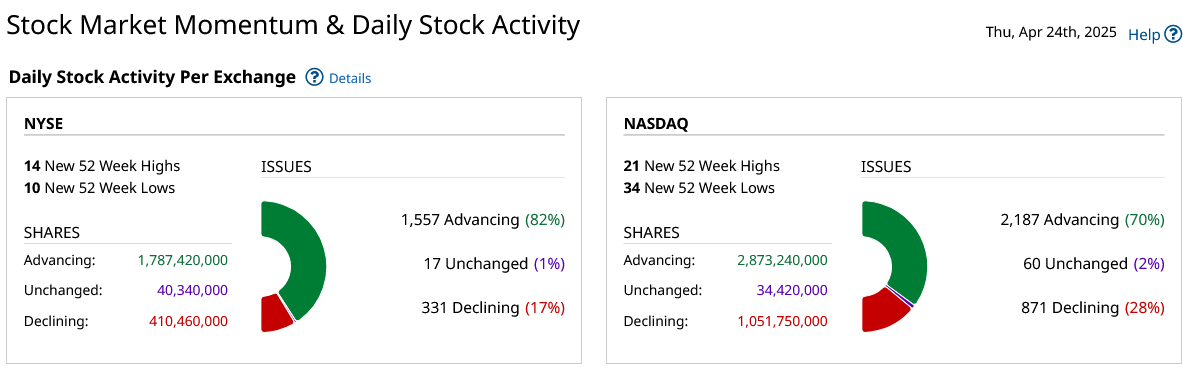
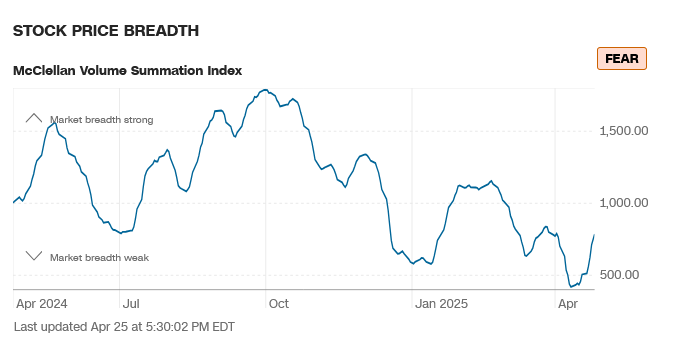
Breadth repaired itself throughout the week and was strong on Friday but weak overall and sentiment remains in fear.
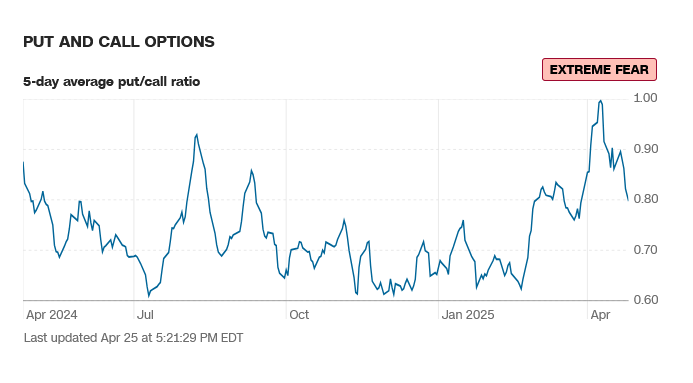
CNN Fear & Greed Index
 AAII Investor Sentiment Survey

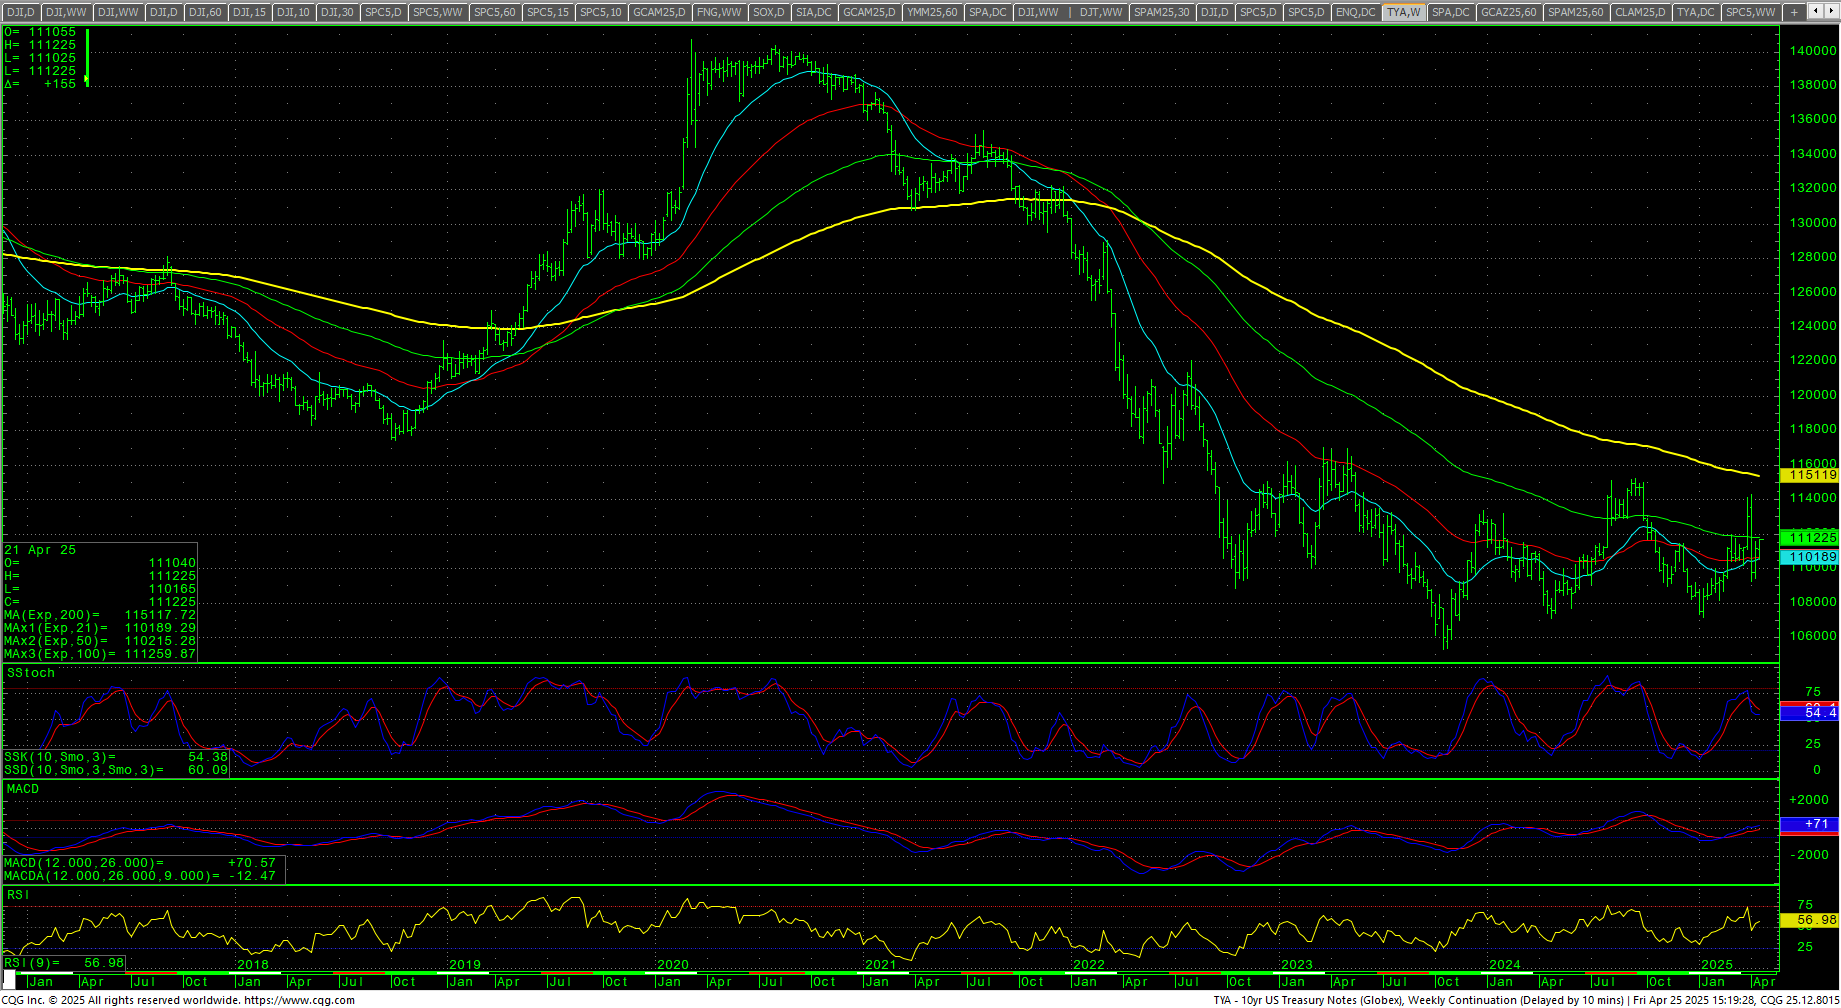
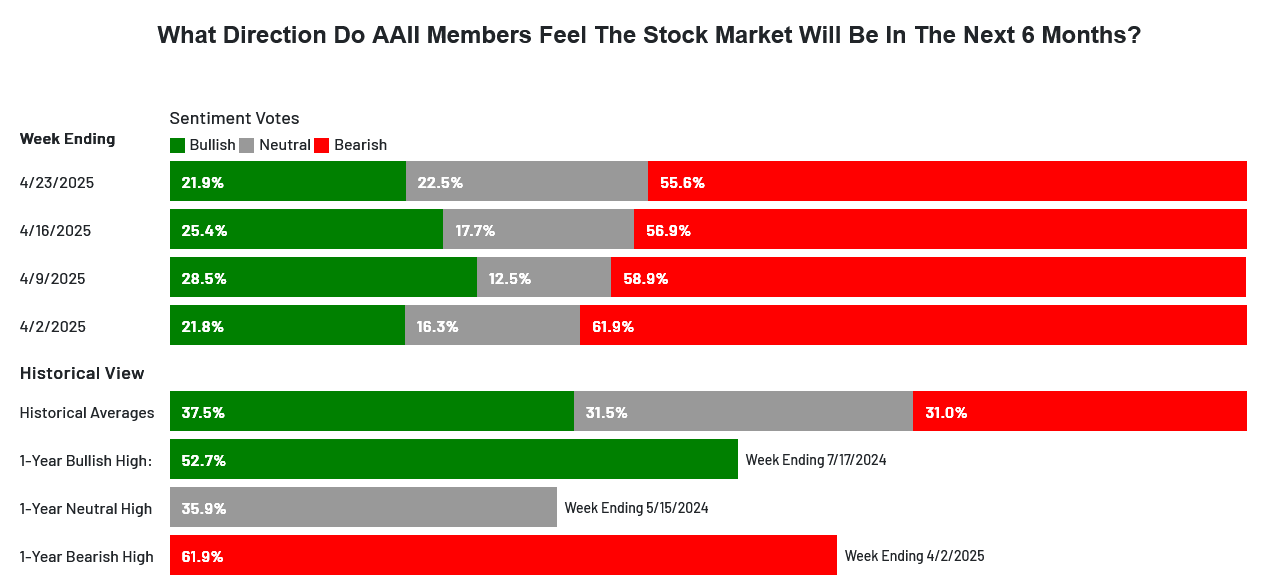 Sentiment remains in fear and extreme fear. The CNN Fear and Greed Index moved up to 35 and reads fear. Breadth recovered substantially and reads fear. Latest AAII Sentiment Survey: Neutral Sentiment Ticks Up. The Dow A/D ended at 6761, the MACD is trying hook higher again. The VIX sold off all week and closed on the lows to end under 30, down -16.22% on the week. The Put/Call dropped to 0.80 and reads extreme fear. The 52-week, A/D moved up to -8.98% and reads extreme fear. The Dow closed the week up +2.48%, closing on the top of a reversal range. The S&P surged +4.59% on the top of a bullish engulfing candle. The Nasdaq Composite soared +6.73% and the Nasdaq 100 was up +6.43%. The FANG rocketed higher, closing up +10.96%. The Russell was up +4.09%, posting the 3rd weekly gain in a row. The 10-year notes closed higher on the top of a tight weekly range. The yield on the 10YR declined to 4.255%.
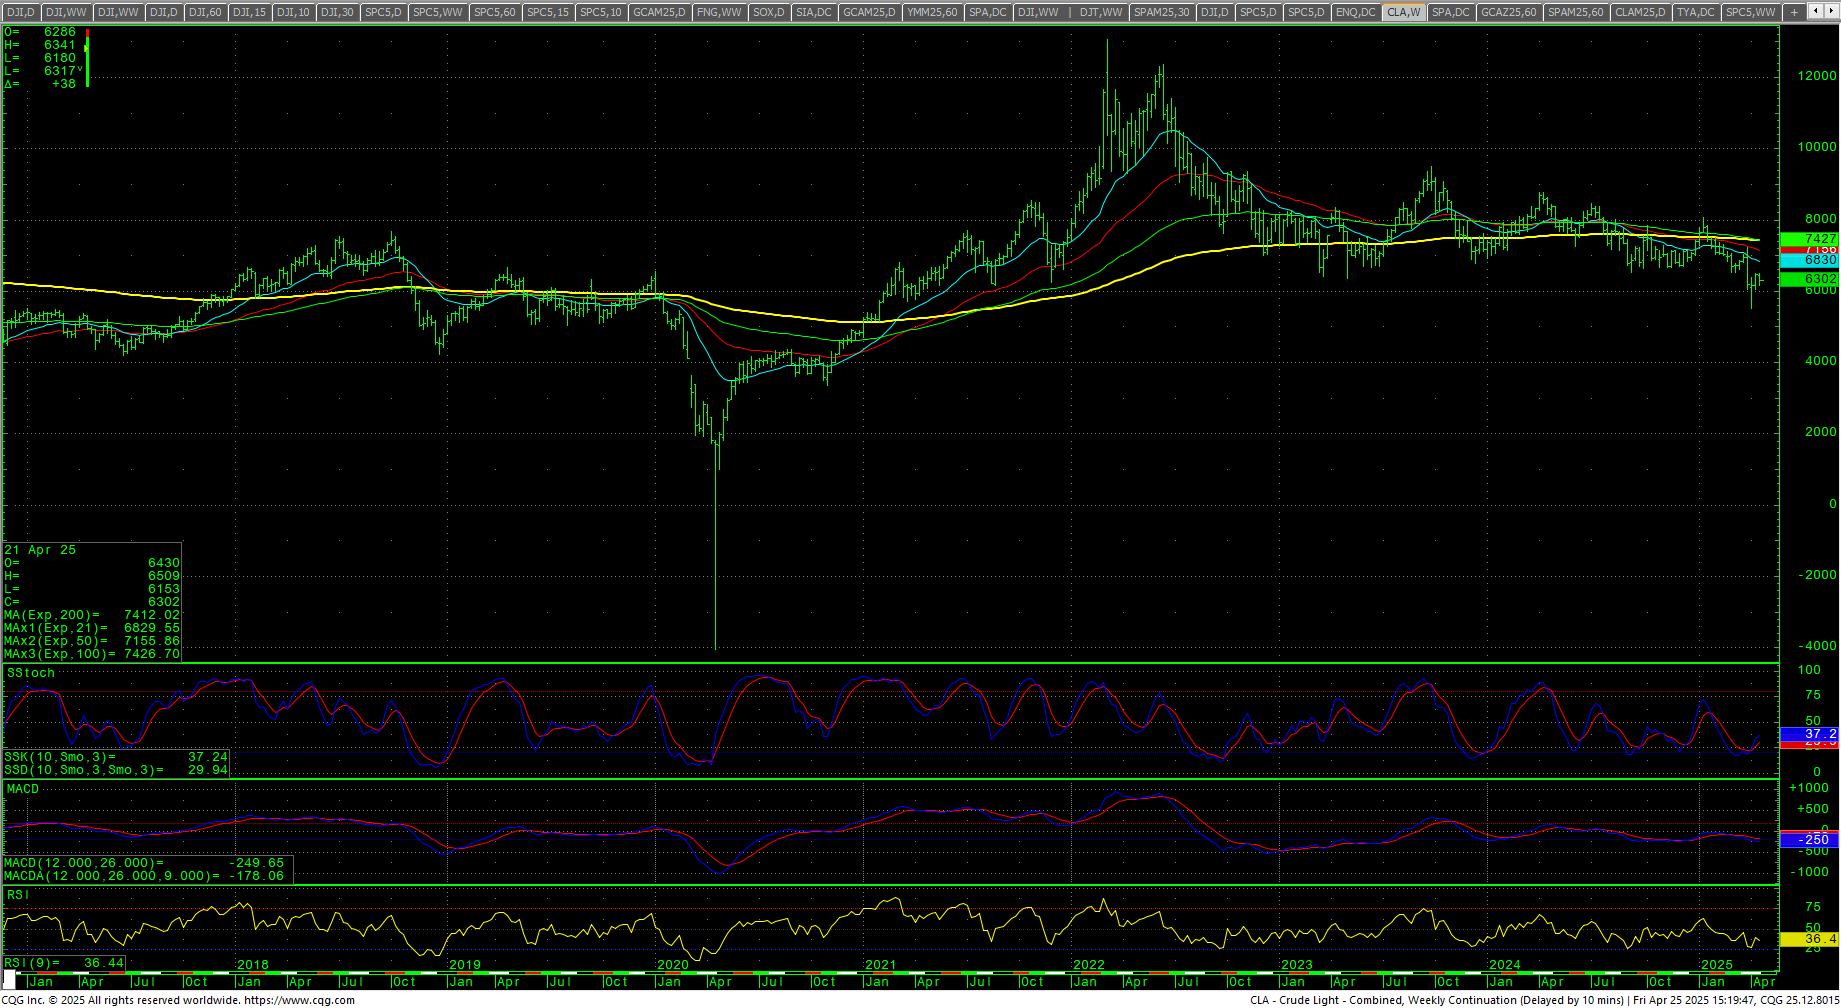
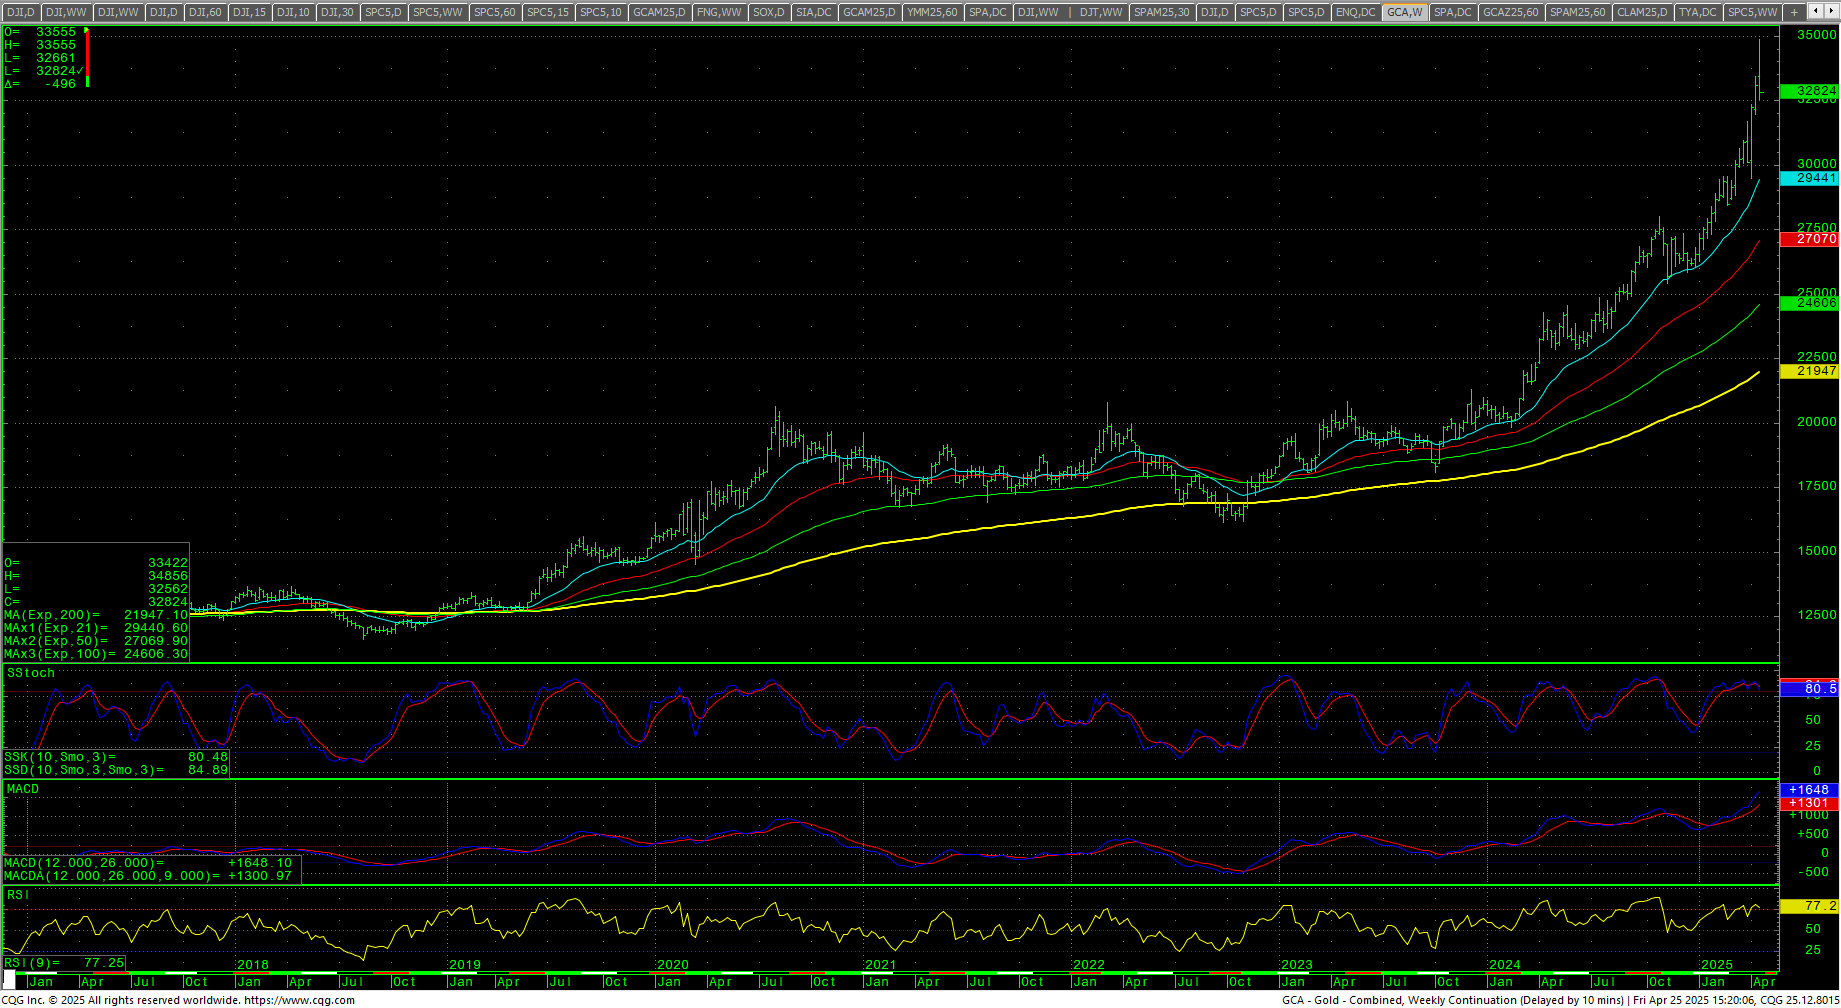
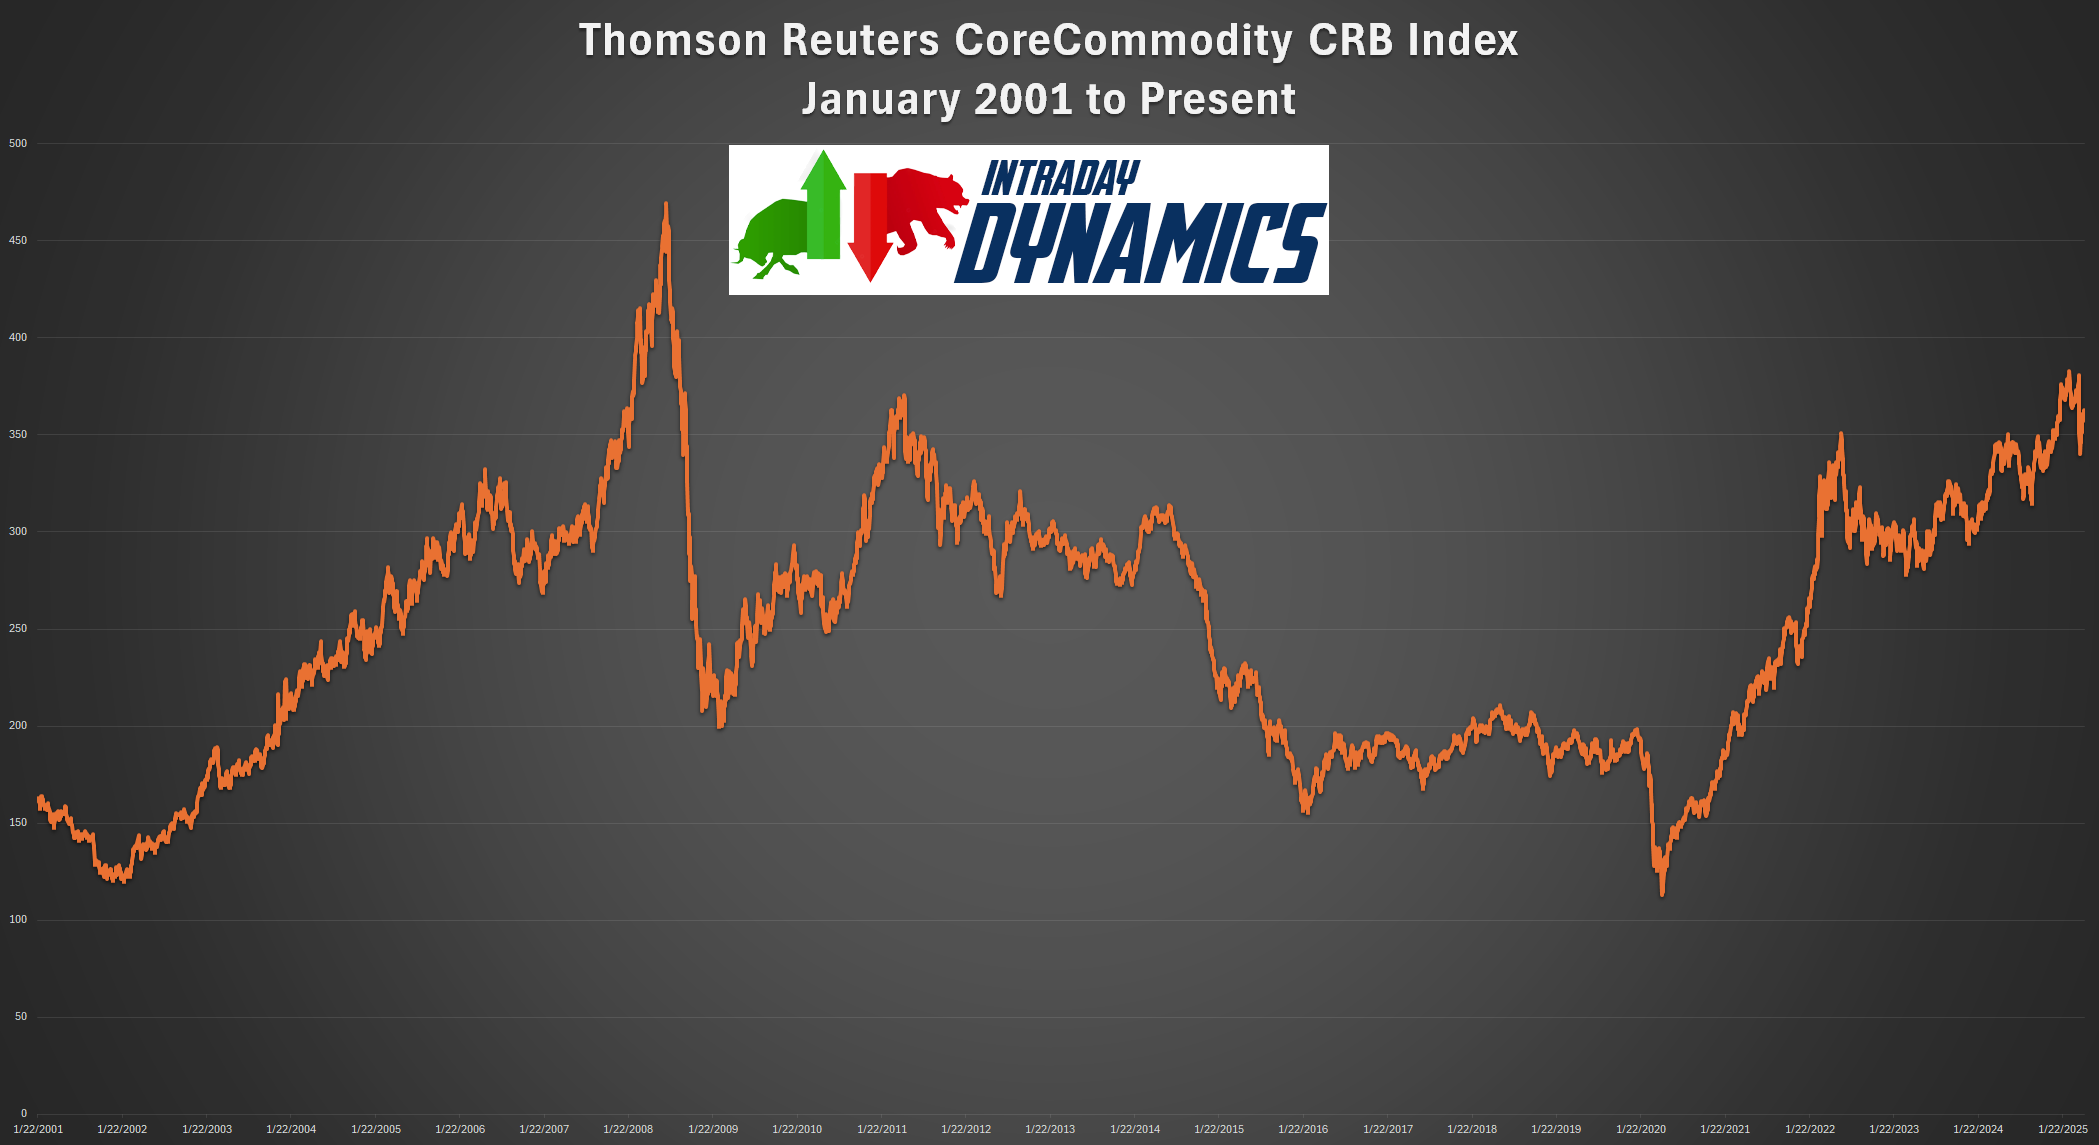 The CRB Index bounced back, closing up +1.85%. Crude oil closed lower in a tight weekly range as it continues to hold the $60 level. Gold soared to record highs at $3500 and then plunged to close lower on the bottom of a reversal week. The CoT for the S&P 500 saw small specs and asset managers exiting. The CFTC S&P 500 Non-Commercial Net Positions dropped to -75.9K. Sellers have a 6 day window.
Timing Points
Last Friday marked minor timing. This Wednesday marks critical timing. Tuesday, we get Trade Balance. Wednesday is Q1 GDP (range +0.4%/-2.5%) and PCE (est: 0.0%). Thursday is ISM and S&P PMI along with Construction Spending. Friday is April Nonfarm Payrolls (est: 130K).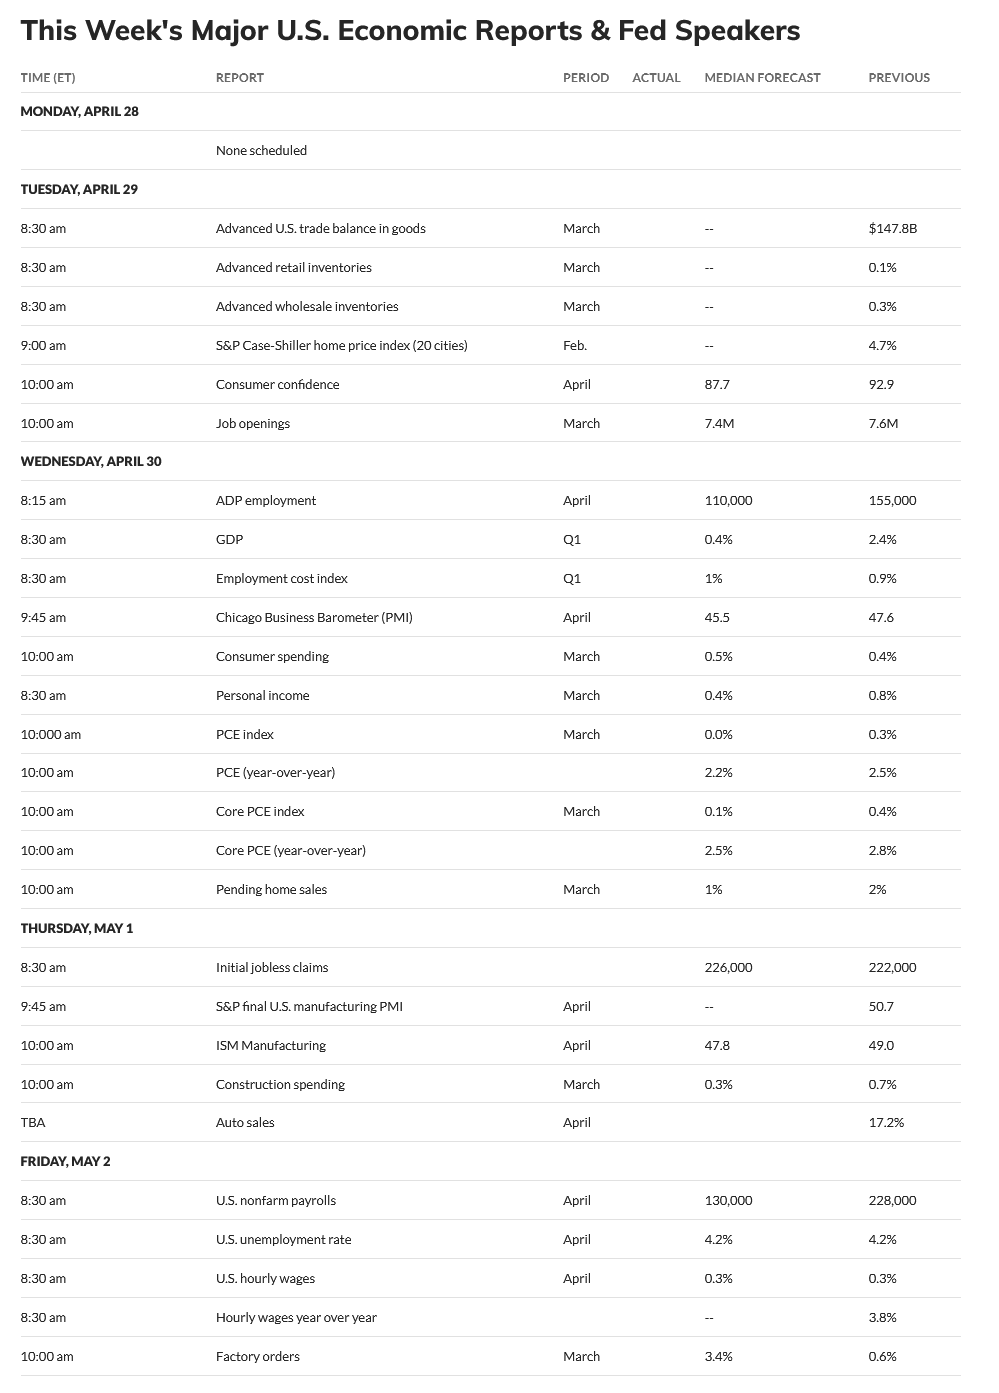
- 04/30 *** X
- 05/8 **
- 05/13 *** X critical, fast moves
- 05/20 **
- 05/29 *** X critical
Dow Jones Industrial Average
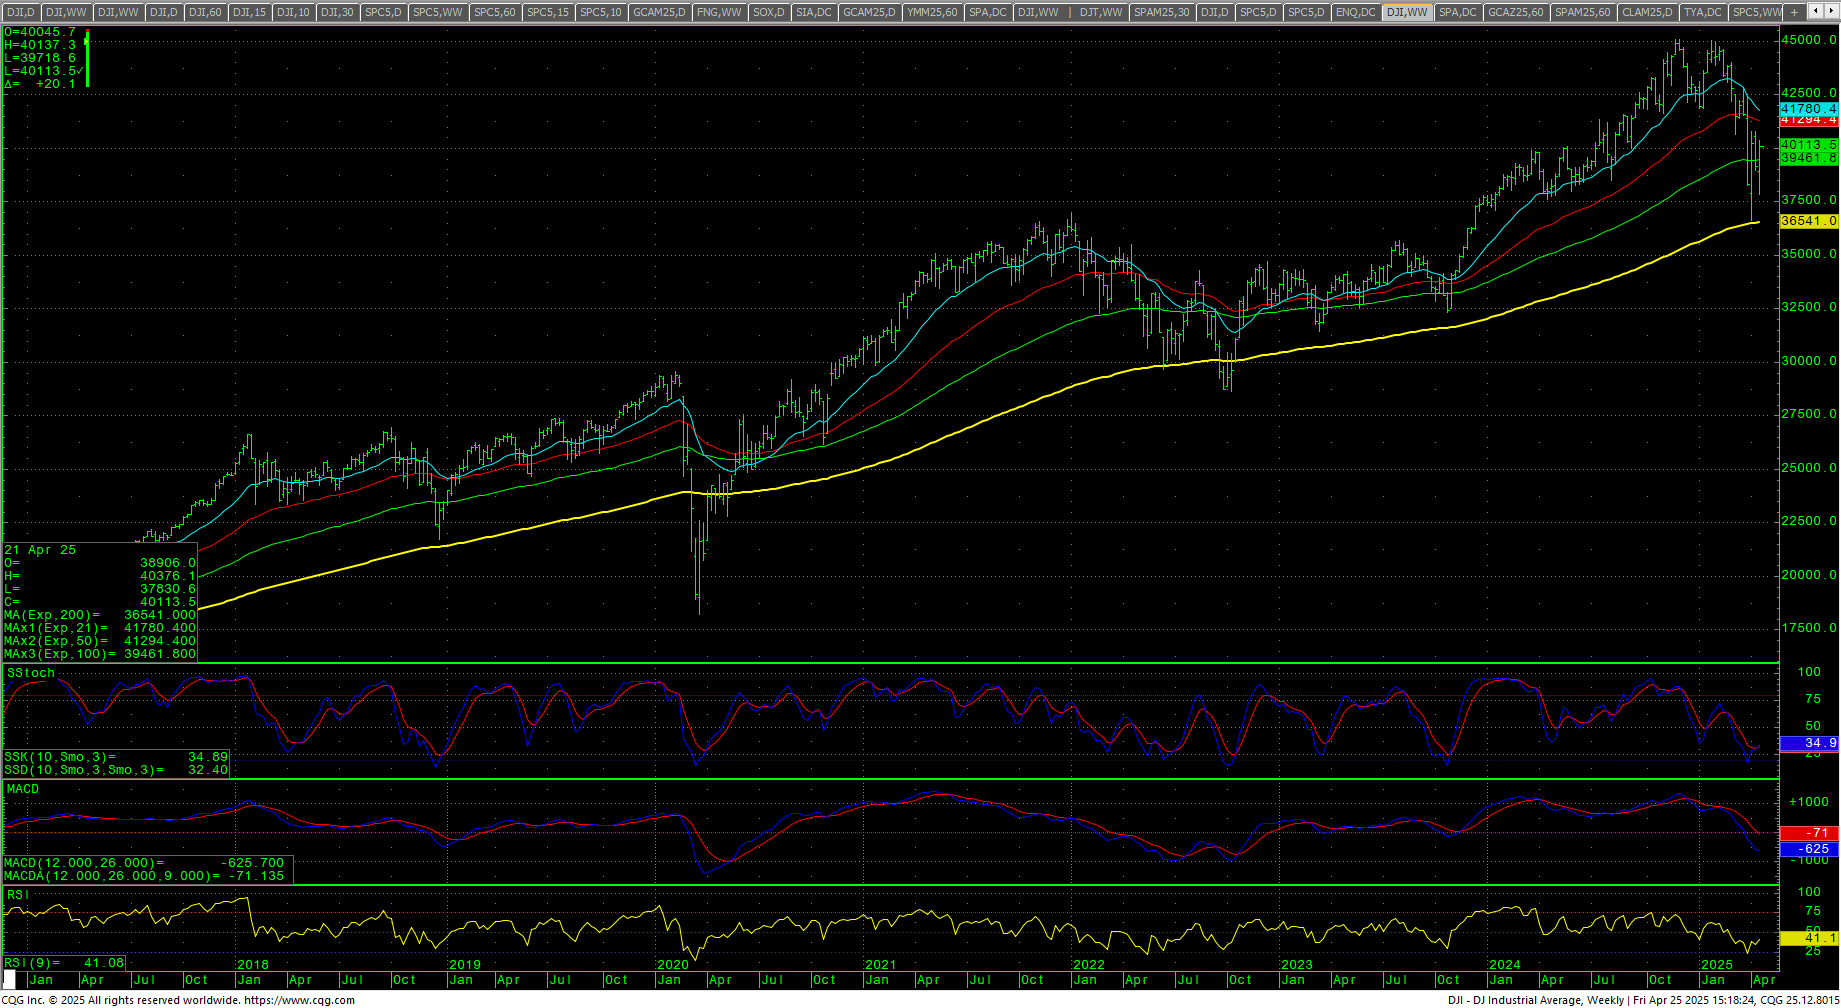
Dow Jones Industrial Average Weekly Candles
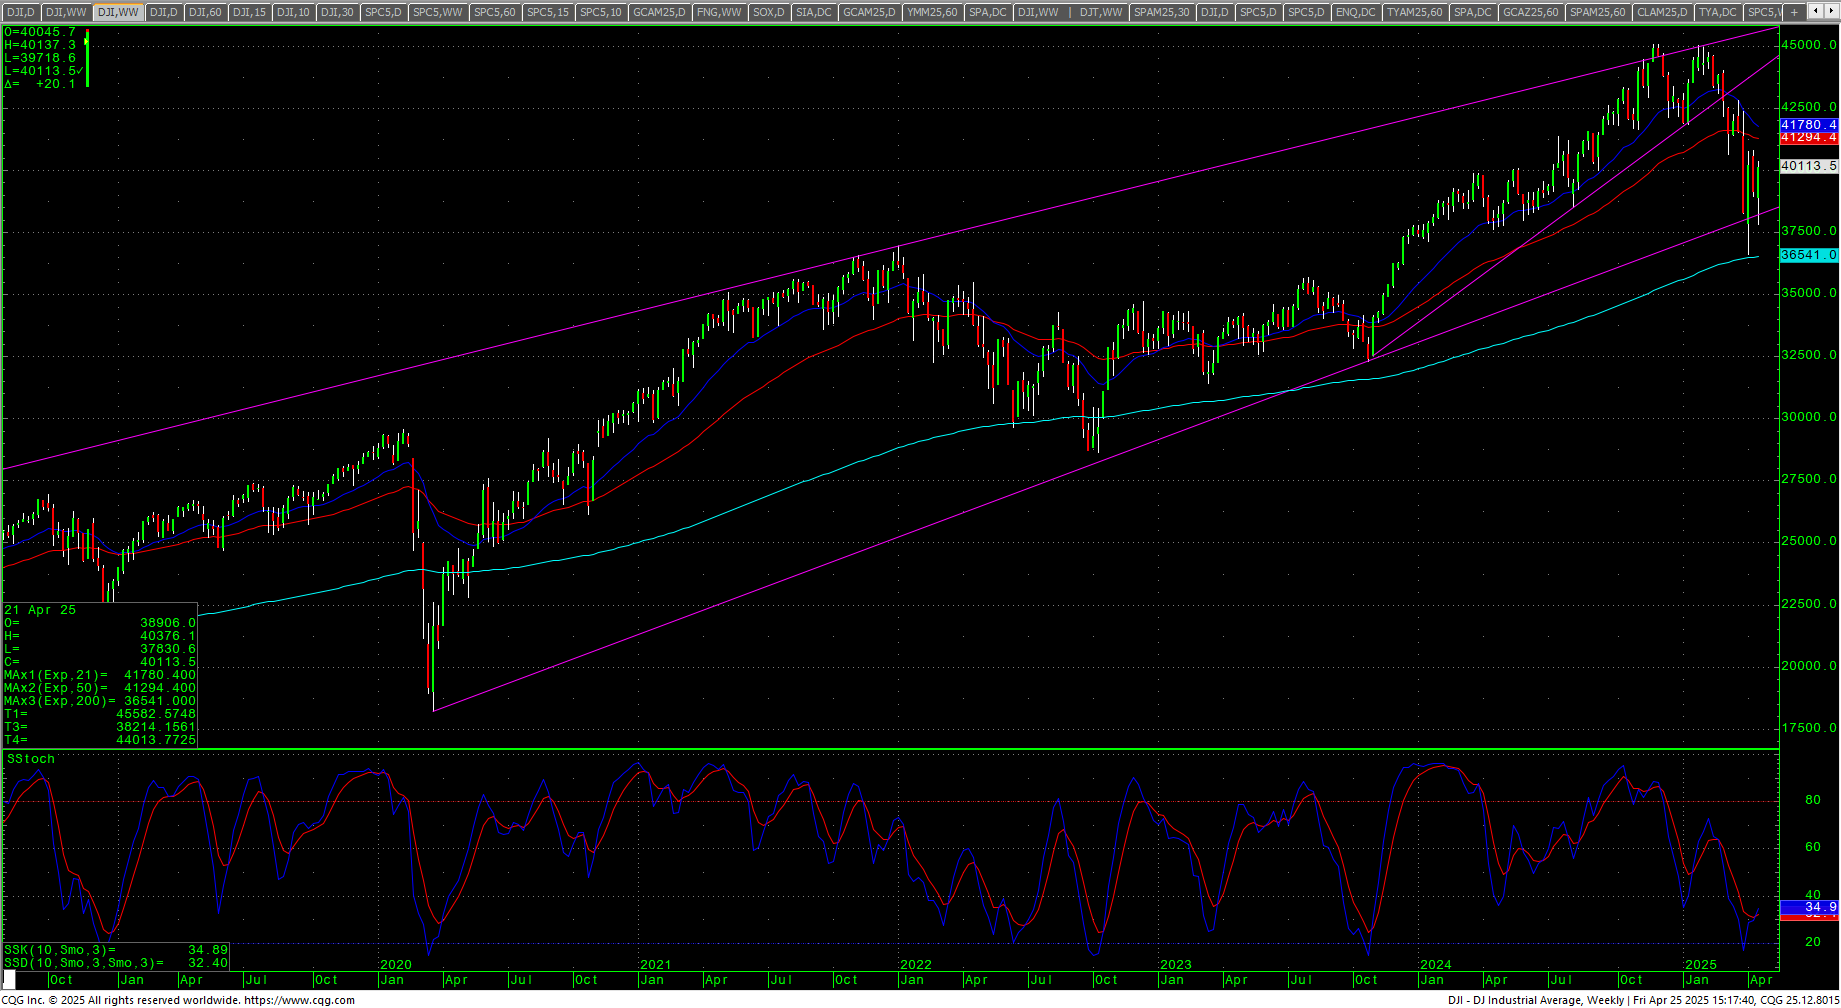 The Dow started the week sharply lower on Fed Chair freakout, with prices opening at the opening level two weeks prior…and then the spin machines started, and the options exploded with stock prices following. The market is building a massive flagging pattern under “Liberation Day” and the technical picture is mixed, even with the bullish action last week. ly that offers a friendly picture…only the sentiment numbers. Both the daily stochastics and the MACD are up but could easily hook lower, RSI is at 51.40. As mentioned above, the daily now has a Death Cross on the moving averages. The weekly remains in a sell signal but is trying to hook higher. Prices have retraced a little under .618% of the drop from 26 March 2025 to the spike low on 7 April 2025. The 200-day MA starts the week at 41636 and is picking up steam trending lower.
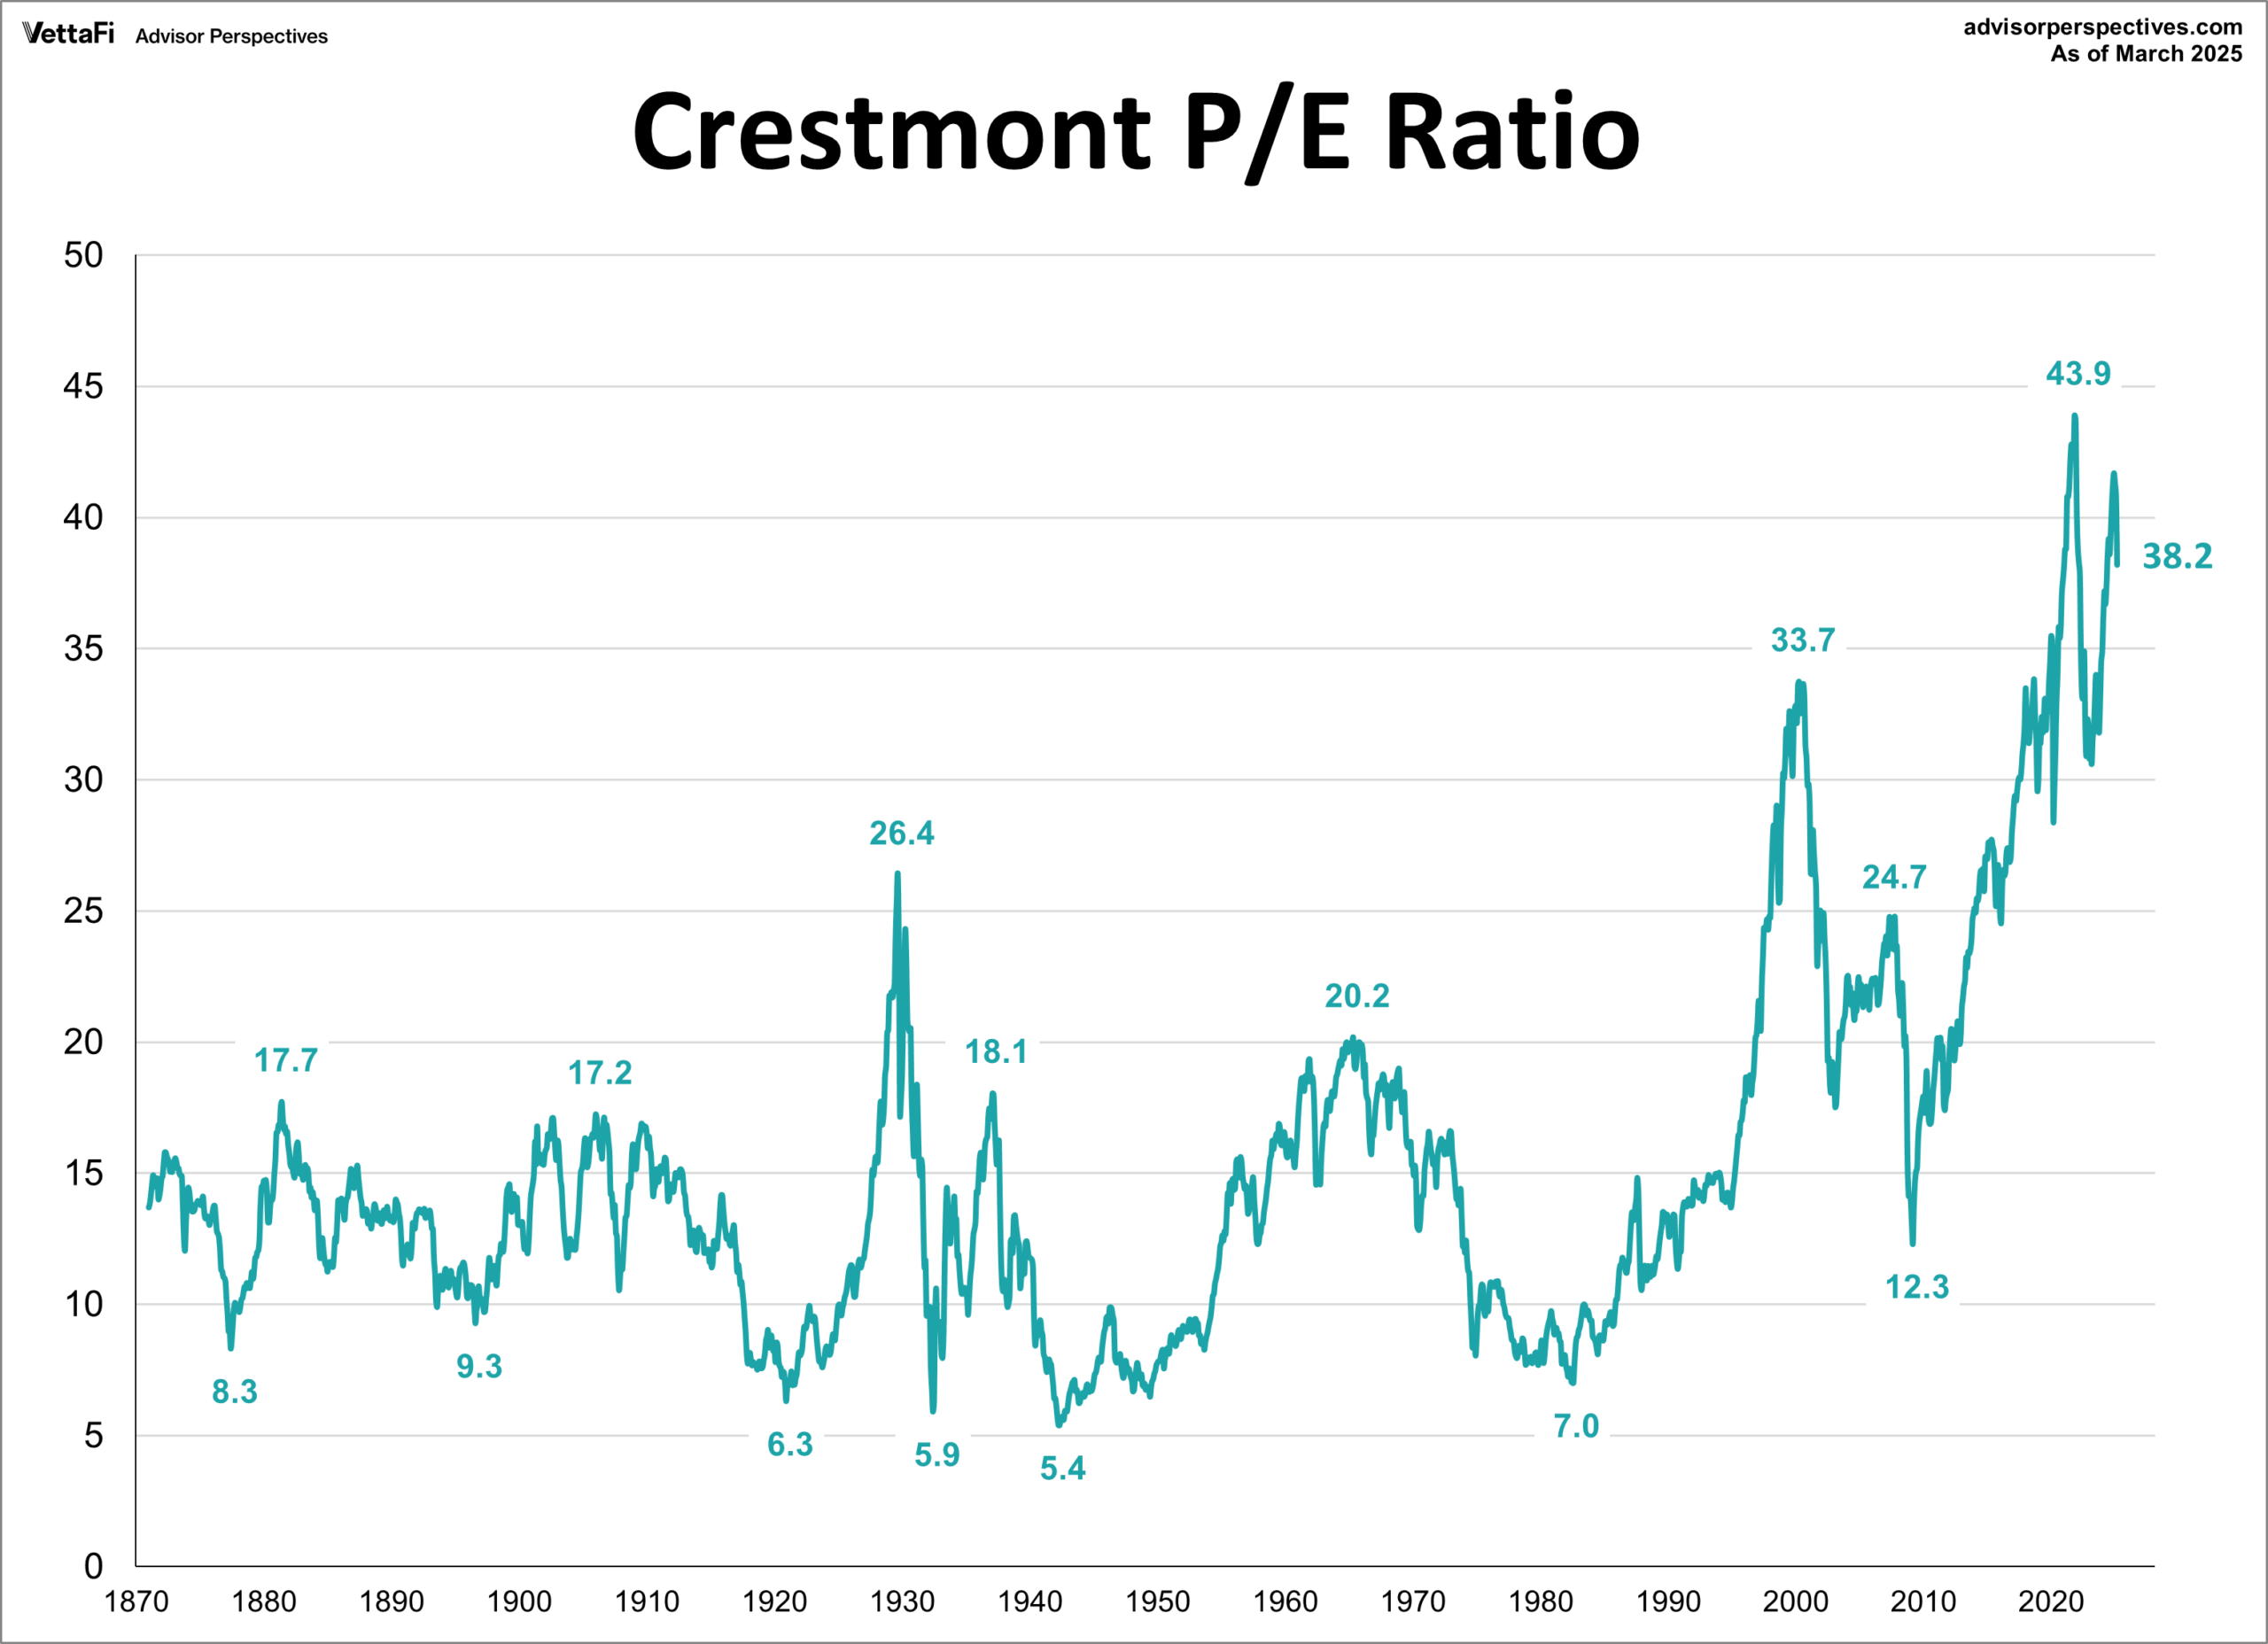
No matter how you slice it, U.S. stocks are still overvalued.
Dow Jones Industrial Average Weekly H-L-C
 Resistance remains at 40137/40157. A drive above 40157 can test 40330/40357 and 40449/40455 with near-term pivotal resistance at 40778/40833. Closes over 40833 will open counts into 41140/41148 level with counts to the 41269 through 41356 area. Daily closes above 41356 should minimally test critical resistance at 41829/41835 through 40865. Closes over 41835 opens counts to 42943 through 43061.
Dow Jones Industrial Average Hourly H-L-C
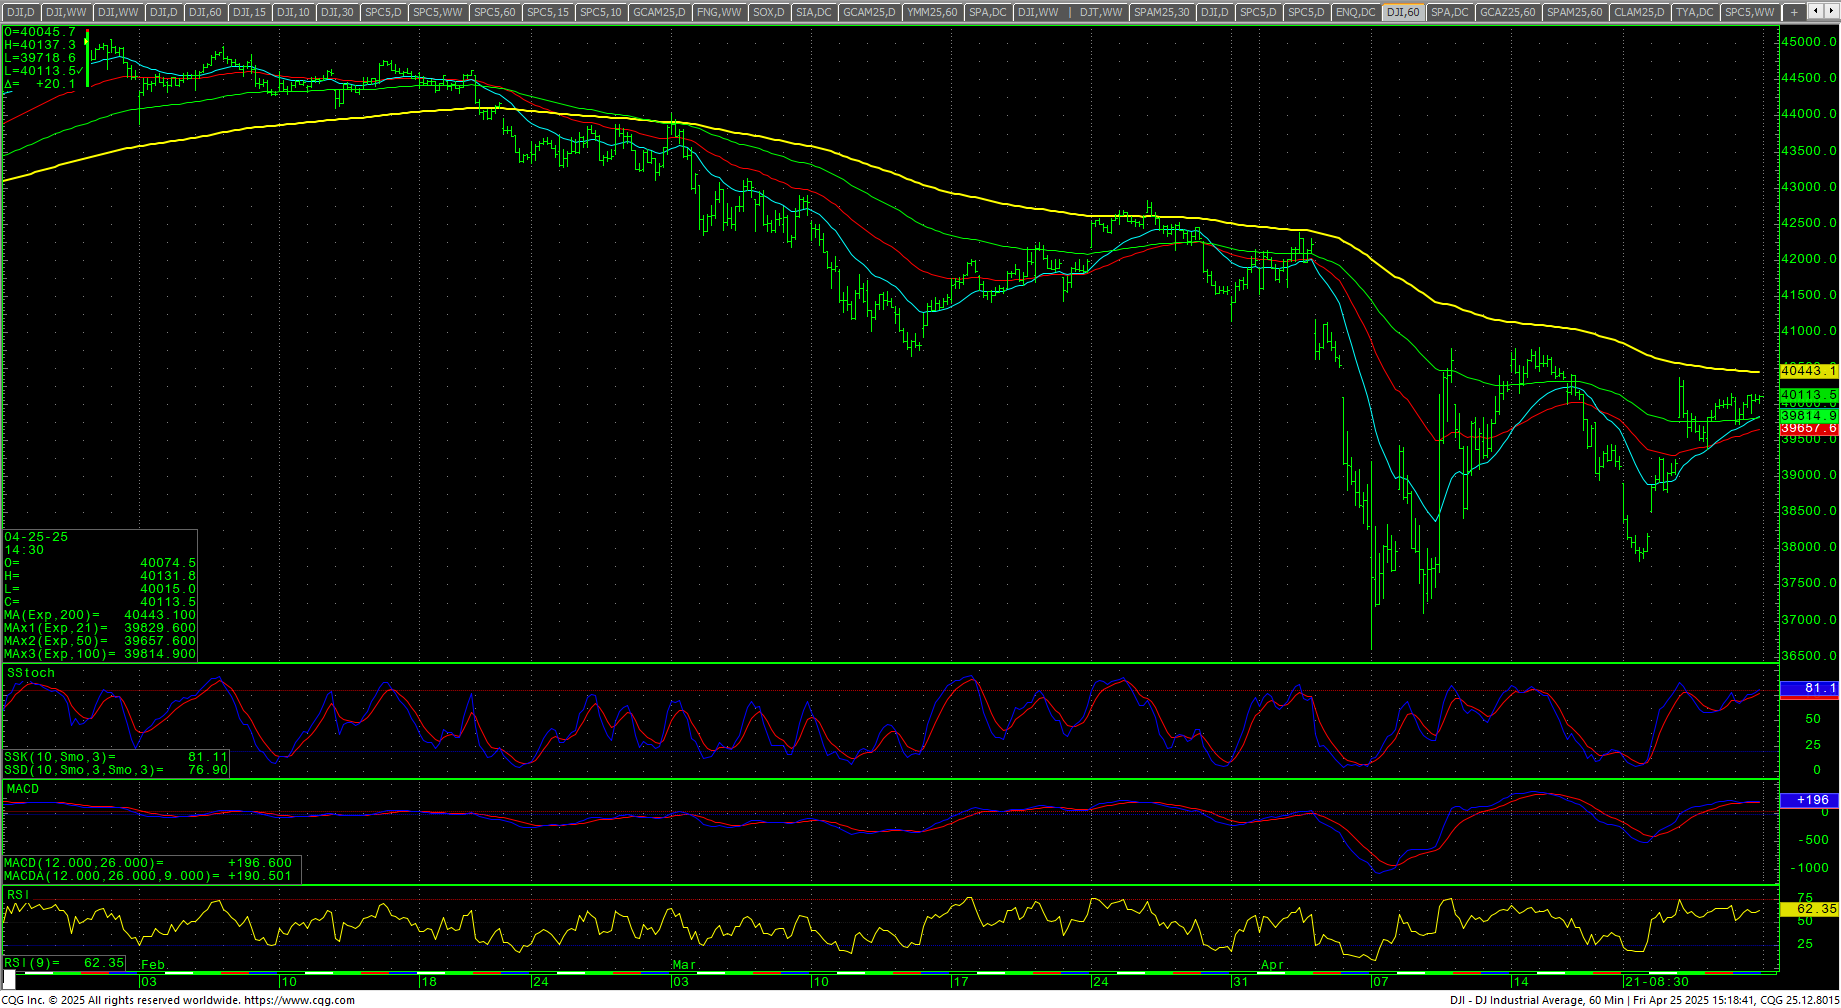 The hourly is overbought. Support is at 39804 through 39718. A breakdown under 39718 can test 39403 to the gap area at 39371. Trade under 39371 should fill the gap at 39233 with support at 39194 and 39103. Closes under 39103 should test 38802/38798 with counts to 38701. A breakdown under 38701 should minimally test 37598/37656 with full potential to pivotal support at 38208/38205. Closes under the 38205 level sets up 37656 through 37598 with full potential to retest the 36611 low with support at 37103. Closes under 37611 should test 36478 with full potential toward 35515/35335 and trading support at 36024.
| Resistance | Support |
|
|
S&P 500 Cash Index: SPX
S&P 500 Index Weekly H-L-C
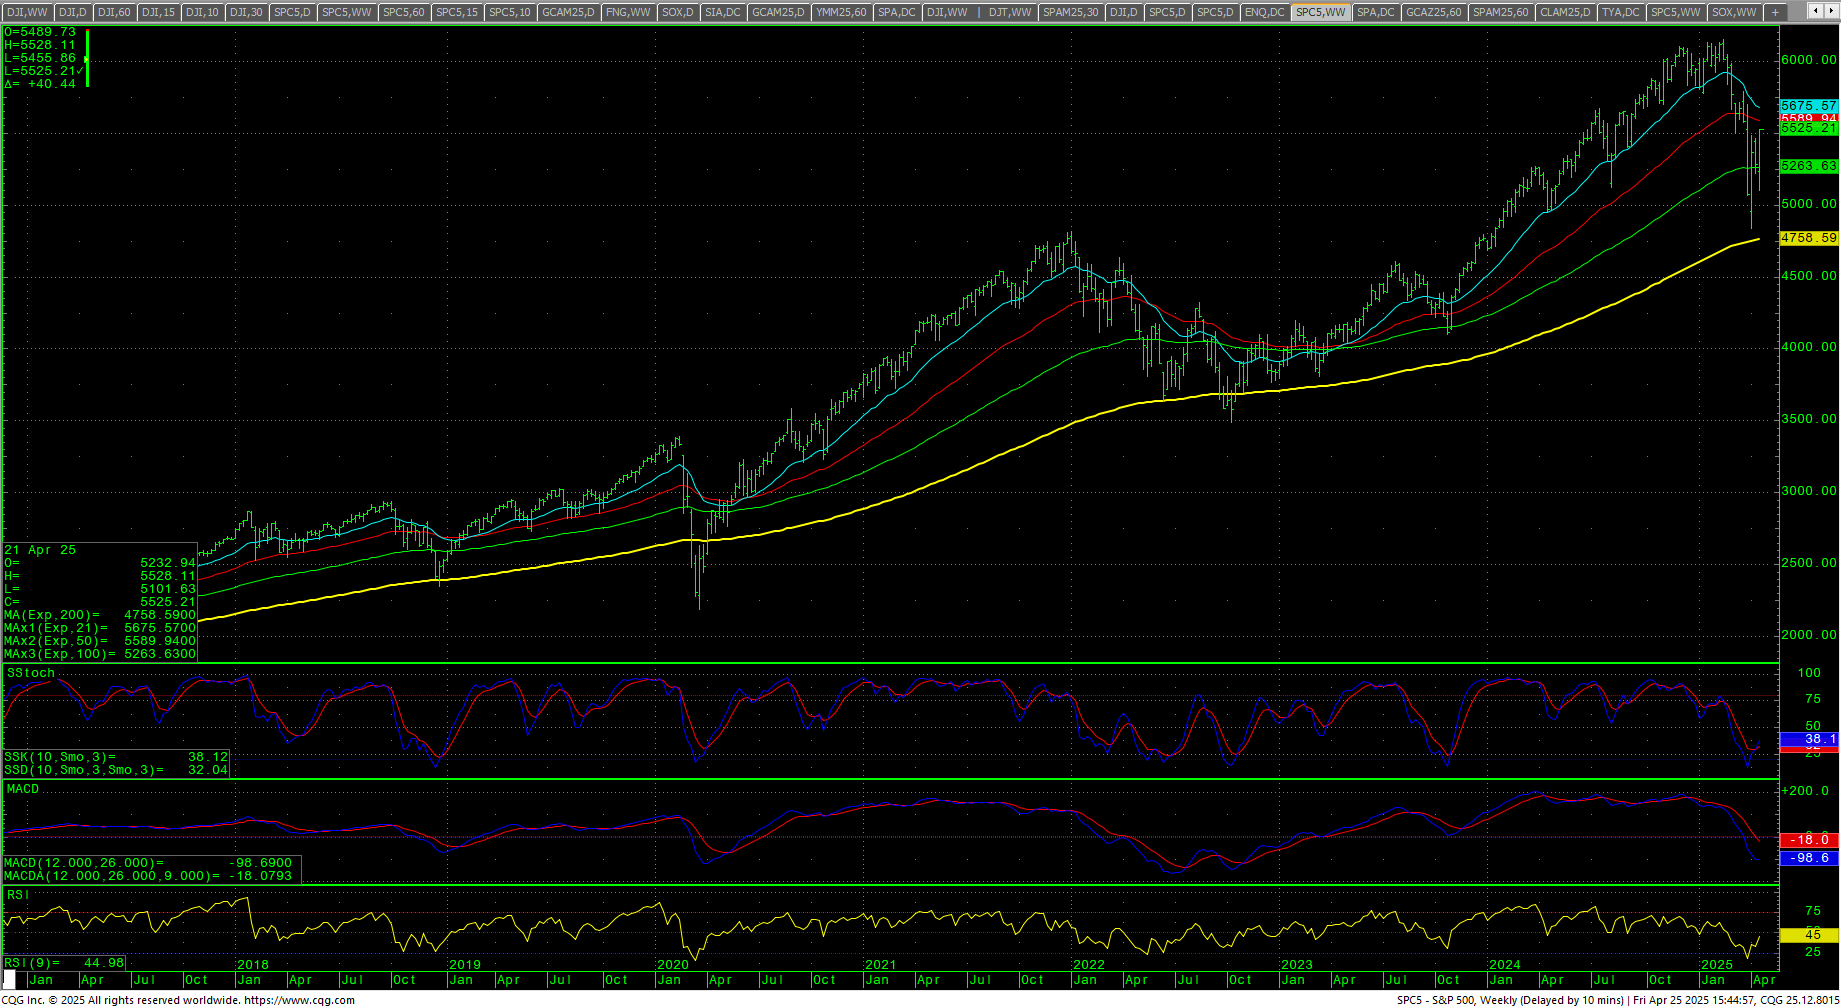 The S&P traded a Bullish Engulfing Candle and closed on the highs, up +4.59%. The market closed into the gap area on the daily left after “Liberation Day.” The short-term action is bullish as prices build a flagging pattern in the breakdown area on the daily. The daily has a Death Cross and is reaching overbought conditions. SPX is now withing striking distance of the 50-day MA at 5572 and is above the 21-day MA, which has now turned up. RSI is now 58.40. The weekly is oversold and could be trying to hook up. The hourly is extremely overbought on Friday’s close. The 200-day MA is 5641.89 and is trending down while picking up steam.
S&P 500 (SPX) Daily Candles
SPY Weekly

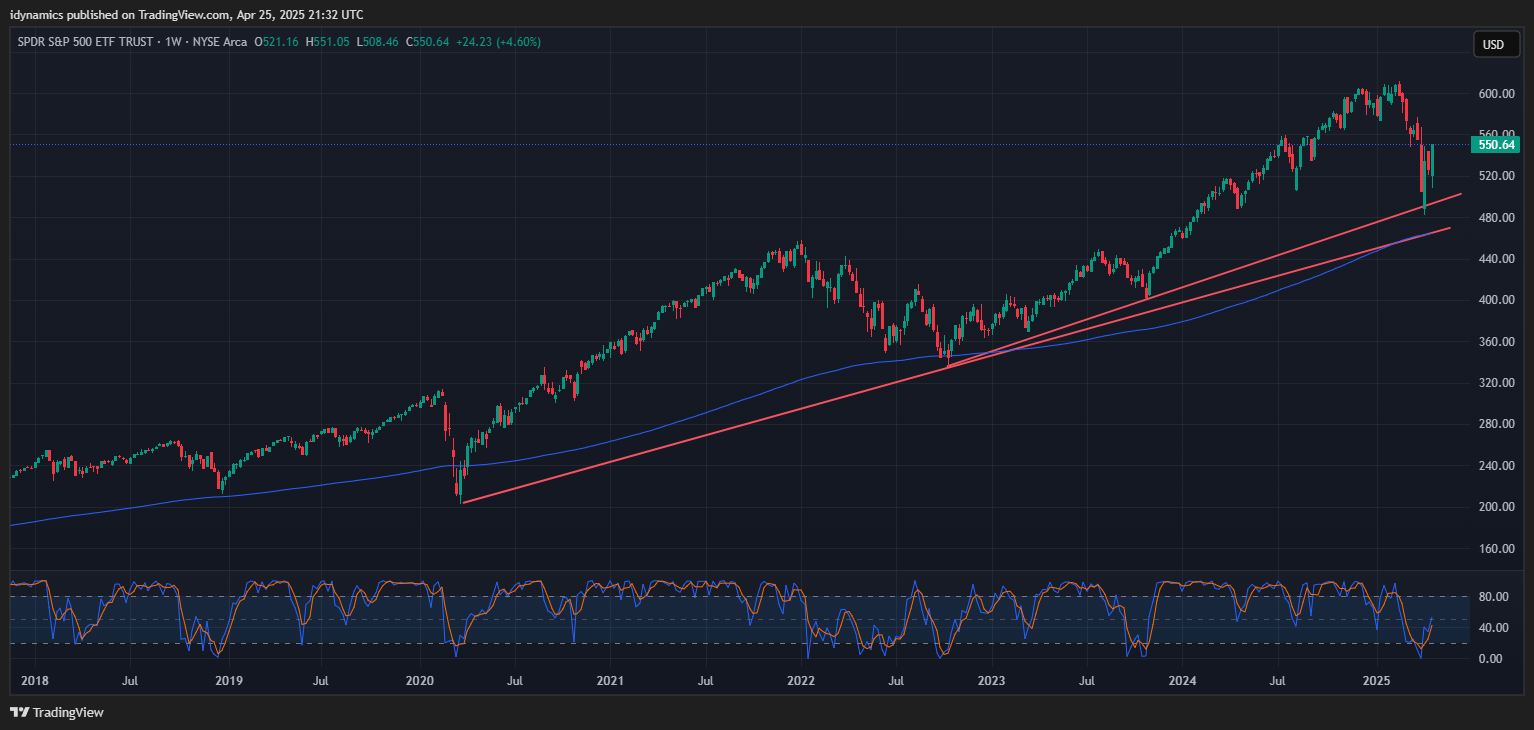 The close over 5491 is friendly and opens counts to 5646/5650. Daily closes above 5650 should minimally test 5819/5837. A breakout over 5837 will open counts to 5986 with full potential to 6043 and opens counts to 6112/6114 and full counts into critical resistance at the intraday high of 6147.43. Rallies through 6148 should test 6160 with a shot at a target of 6180.35/6181.
S&P 500 Index Hourly H-L-C
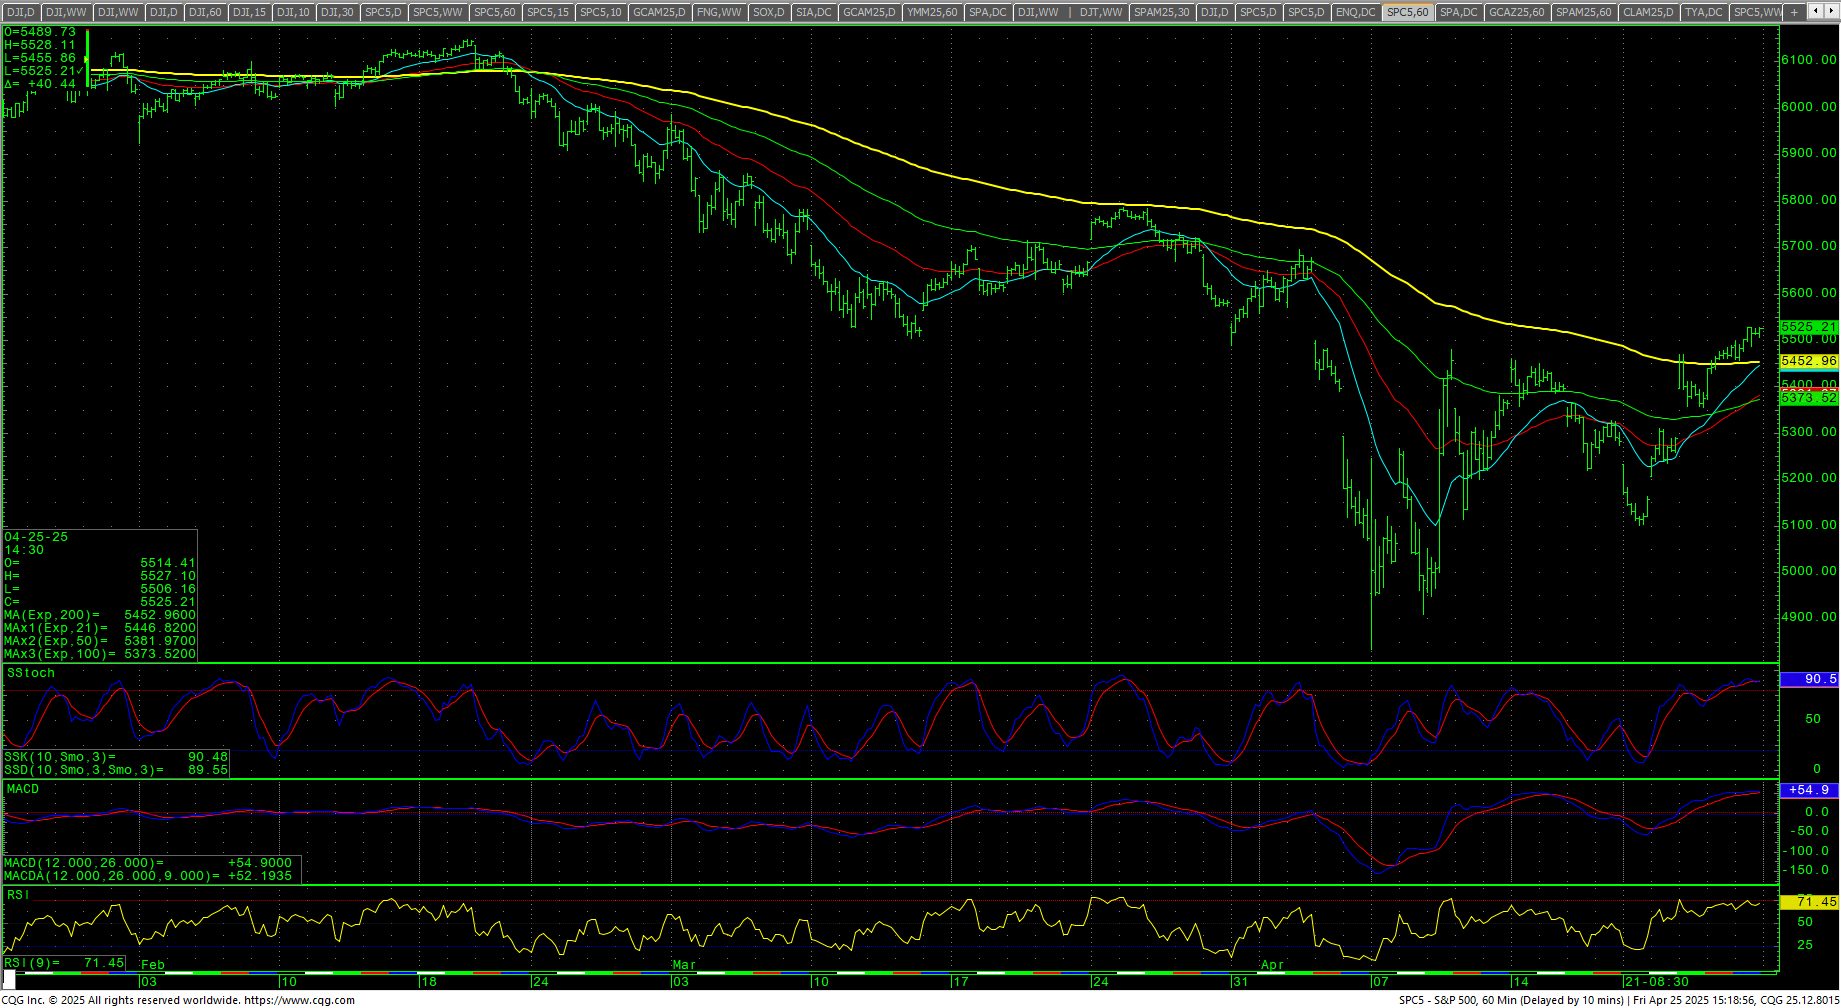 Support is 5427, 5364 and 5264/5260 with support at 5314. A breakdown under 5260 sets up 5182/5180 and 5158 with potential to critical near-term support of 5099/5095. A breakdown under 5095 sets up a retest of the 4835 swing lows with support still at 4884/4880. Closes under 4880 are bearish and open counts to 4614 through 4586. Under 4586 can carry to 4486 with counts to 4421/4418 (gap) and support at 4459. Closes under 4418 set up 4319 with full counts into the 4104/4100 area.
| Resistance | Support |
|
|
Charts courtesy of CQG, Inc., CNN, Koyfin, Trading View and AAII