
Cycle Timing Update
Week of May 2, 2025
Today, 30 April 2025 marks another very CRITICAL timing point and a potential pivotal point for the markets. This cycle beginning here runs hot between now and May 13th.
The recent rallies have positioned the SPX futures at a critical crossroads where they will either achieve a move back above the 50-day MA, or we will reject the 50MA with the timing and begin a move back for a retest of the recent lows.
A brief comment on the fundamentals. They are glaringly bad and flashing some major warning signs…not just for the U.S. economy, but across the globe. That said, price discovery is another thing entirely…and the market will find its value on its own regardless of how terrible some of the fundamental data looks.
Like the stars in the skies, there are established facts. This current cycle’s theme is “The constellations in the sky.” The danger is in prognosticating or ‘creating realities’ while ignoring the obvious. “Our assurance lies in the actuality of personal experience” We can look up and see the stars, but we cannot create our own reality. The market creates its own reality.
With Wednesday’s close, the S&P has extended its rally to the best six-day streak since 2022…taking spot SPX futures to the 50-day MA. We did have a sequence in 2024 of multiple days with higher highs and higher lows, but the key with this rally in the “thrust.”
This caused multiple financial headlines over the weekend as analysts pulled out the ZBT Indicator (Zweig Breadth Thrust).
“This bullish signal is triggered when this calculated 10-day moving average swiftly transitions from a level below 40% to above 61.5% within a concise 10-day window. This rapid transformation signifies a dramatic change in market sentiment, moving from a state of oversold conditions and widespread pessimism to one characterized by strong and broad buying activity across a significant portion of the market.” — Zweig Breadth Thrust: Is It a Trustworthy Technical Indicator for Stock Market?
Back to the idea of ‘creating realities.’ The headlines over the weekend declared that the ZBT is 100% accurate. That’s right, 100%. The truth is that the data usually only accounts for trade after 1940. Prior to 1940, the ZBT was hit and miss, with quite a few heavy-duty misses.
So, we have a MAJOR THRUST and the ZBT being triggered and, as pointed out in the past two weekly updates, the SPX also has a Death Cross on the chart. We will take a look at the June futures for the SPX, SPM25…and the snapshots are from the close of 29 April 2025. (As of this writing futures are slightly lower). We also have big news being released in the next few days including Q1 GDP and Nonfarm Payrolls along with big tech earnings reports.
Timing Dates for April/May
- 04/30 *** X
- 05/8 **
- 05/13 *** X critical, fast moves
- 05/20 **
- 05/29 *** X critical
SPX Futures: SPM25
While focusing on the SPM25, I am using the daily continuation chart for the futures for the analysis of the daily.
SPX Futures: Daily Continuation Candles
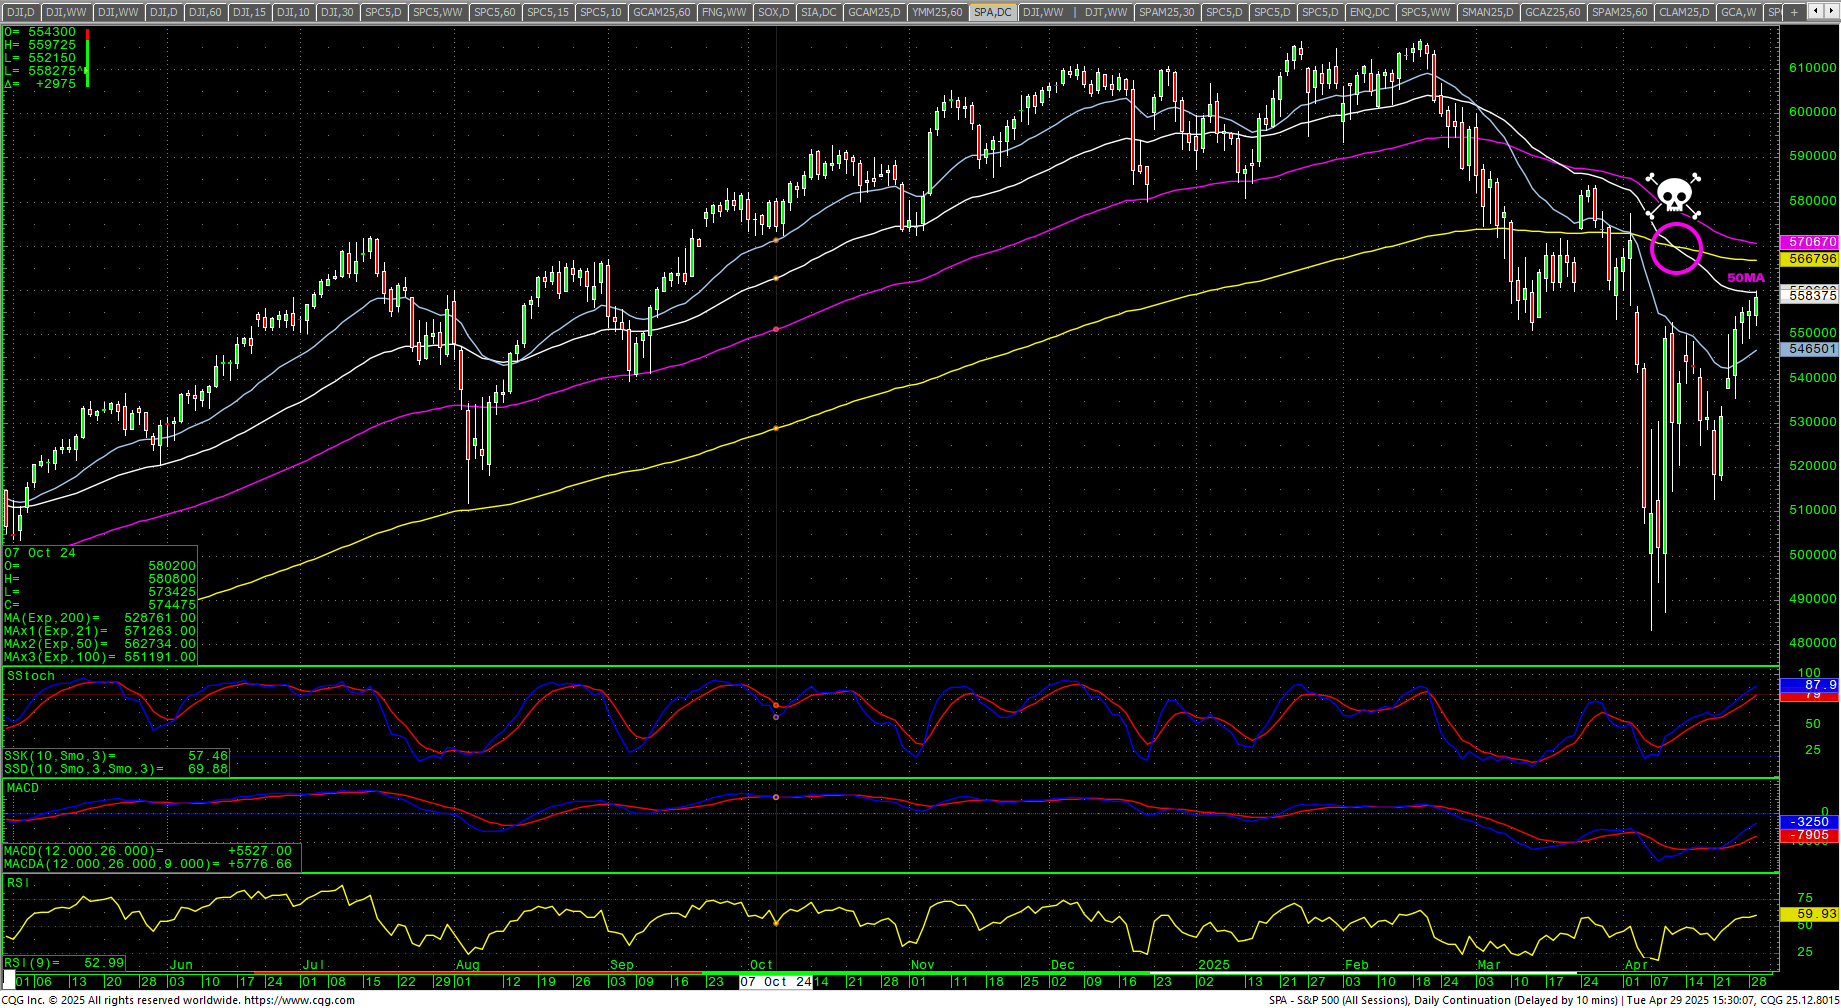 The S&P futures now have six bullish candles in a row and the action on Tuesday took the spot SPM25 to a precise test of the 50-day MA at 5596.00 with the intraday high at 5597.25. The robust rally has taken prices above the gap high following “Liberation Day” at 5564.75. S&P futures are up +10.63% from the closing low established on 8 April 2025. The market has retraced around 59% of the entire decline from the 19 February 2025 high close of 6163.00 to the 8 April 2025 closing low of 5050.25.
There remains a Death Cross on the daily chart and the stochastics are beginning to reach overbought conditions. The MACD is up and the RSI ended Tuesday at 59.93. The 21-day has turned up.
Prices are not only testing the 50-day MA, but they are also in the Death Zone from the trading high of 25 March 2025 at 5837.25 to the intraday low of 4832.00 on 7 April 2025. That zone is 5585.95 through 5600.00 (and includes the 50-day MA).
The 200-day MA starts Wednesday around 5668.00.
SPX Futures: Weekly Continuation Candles
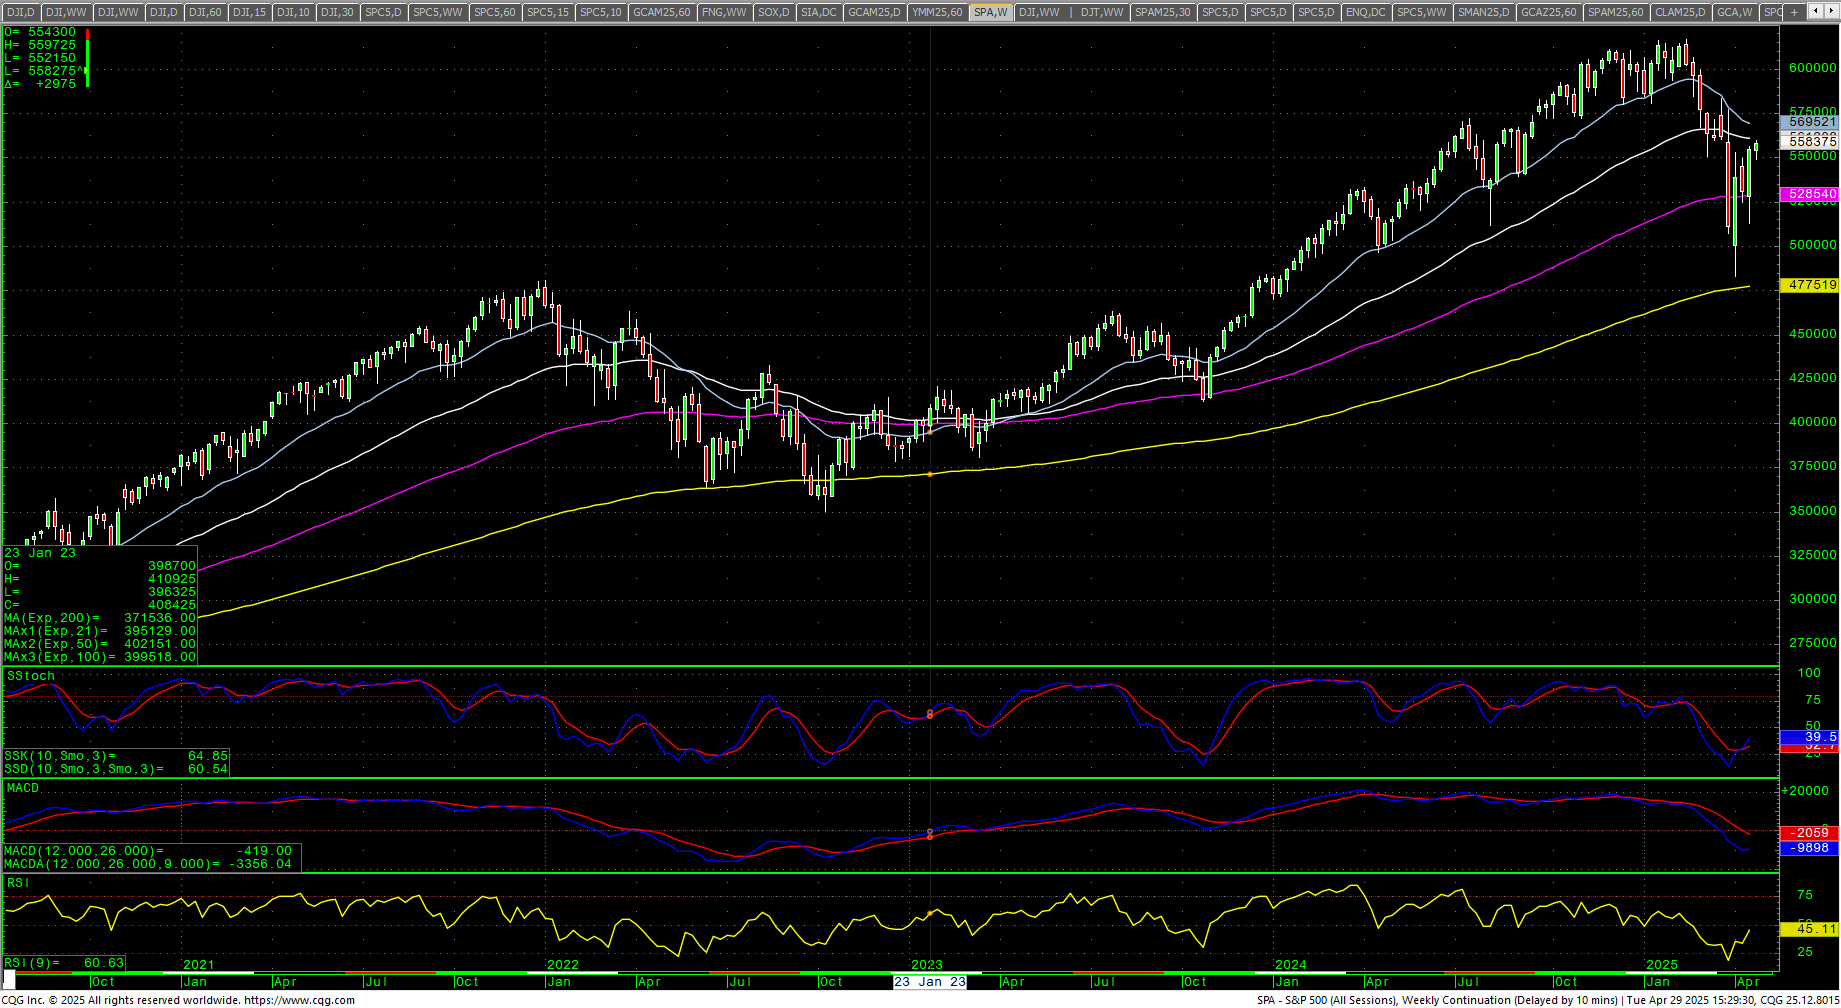 On the continuation weekly, the futures traded to the .236 retracement of the entire move off the 2009 bottoms and came within around 70 points off the weekly 200-week MA. The April bottom was also a precise 50% retracement of the move from the 2022 lows to this year’s highs. The weekly RSI is back above 40 and the stochastics have hooked higher.
SPX Futures: Monthly Continuation Candles
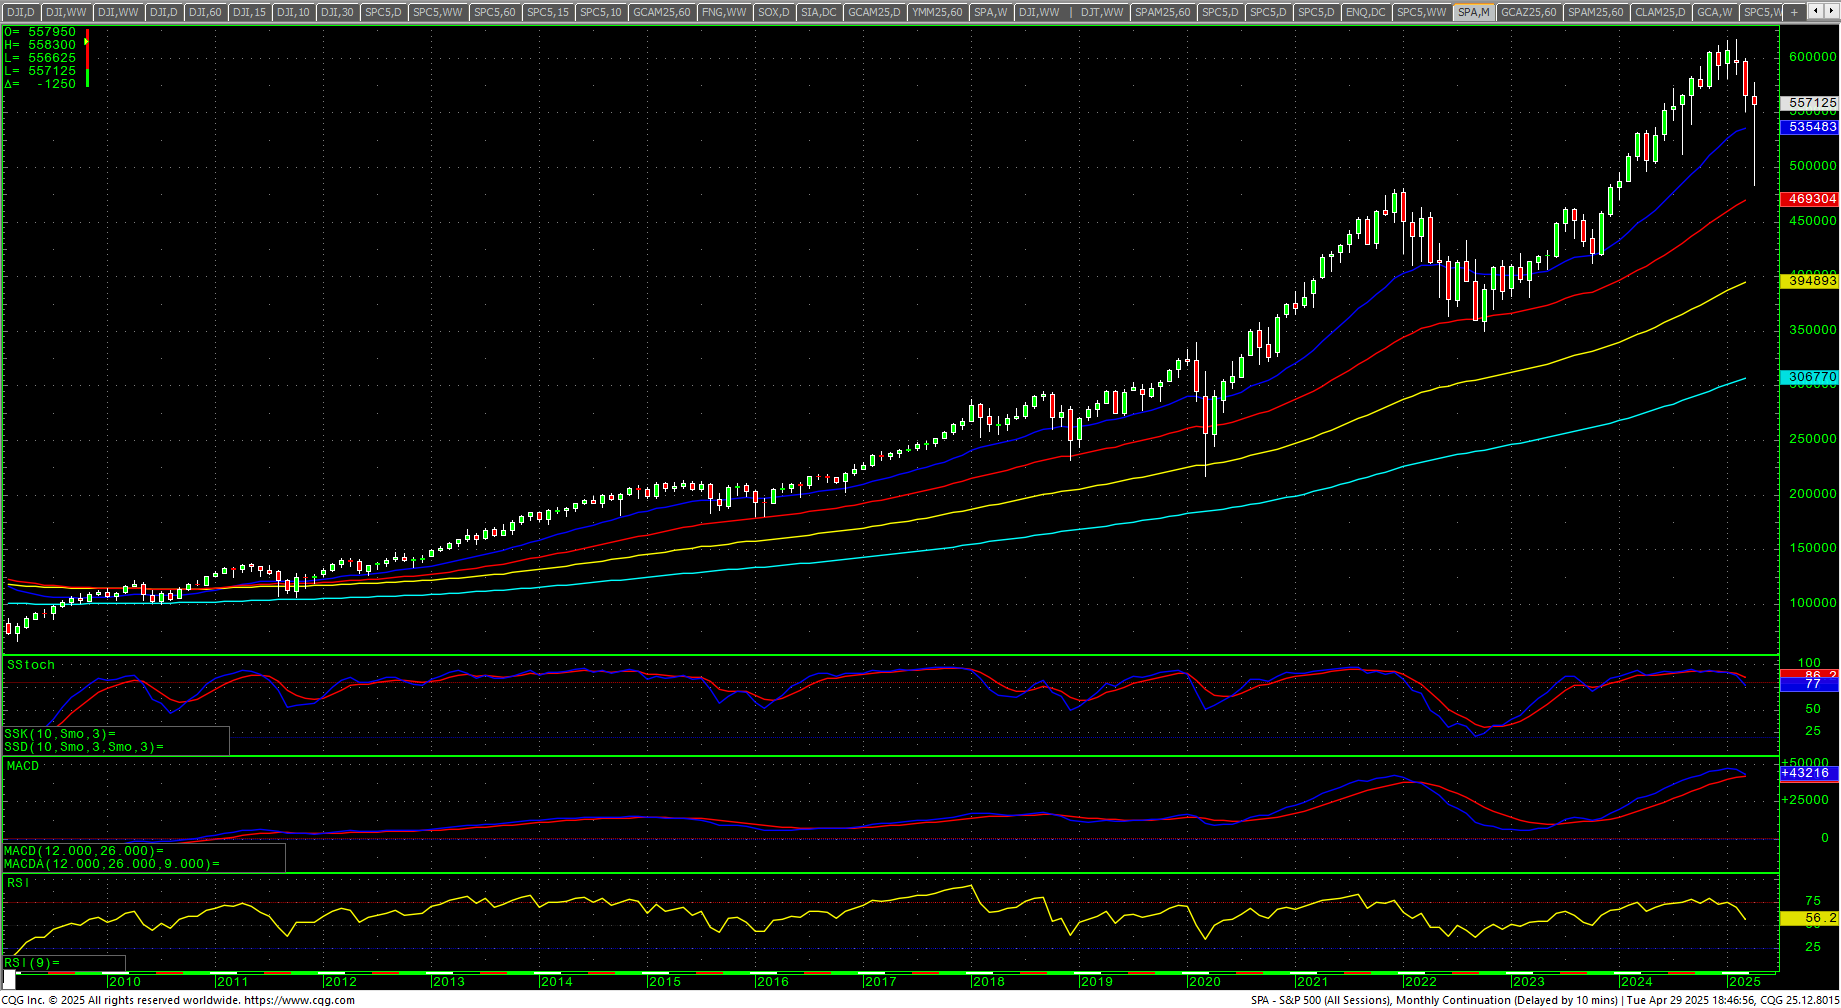 The monthly is rolling over in the MACD, the stochastics and the RSI…all pointing down.
SPM25 Hourly Candles
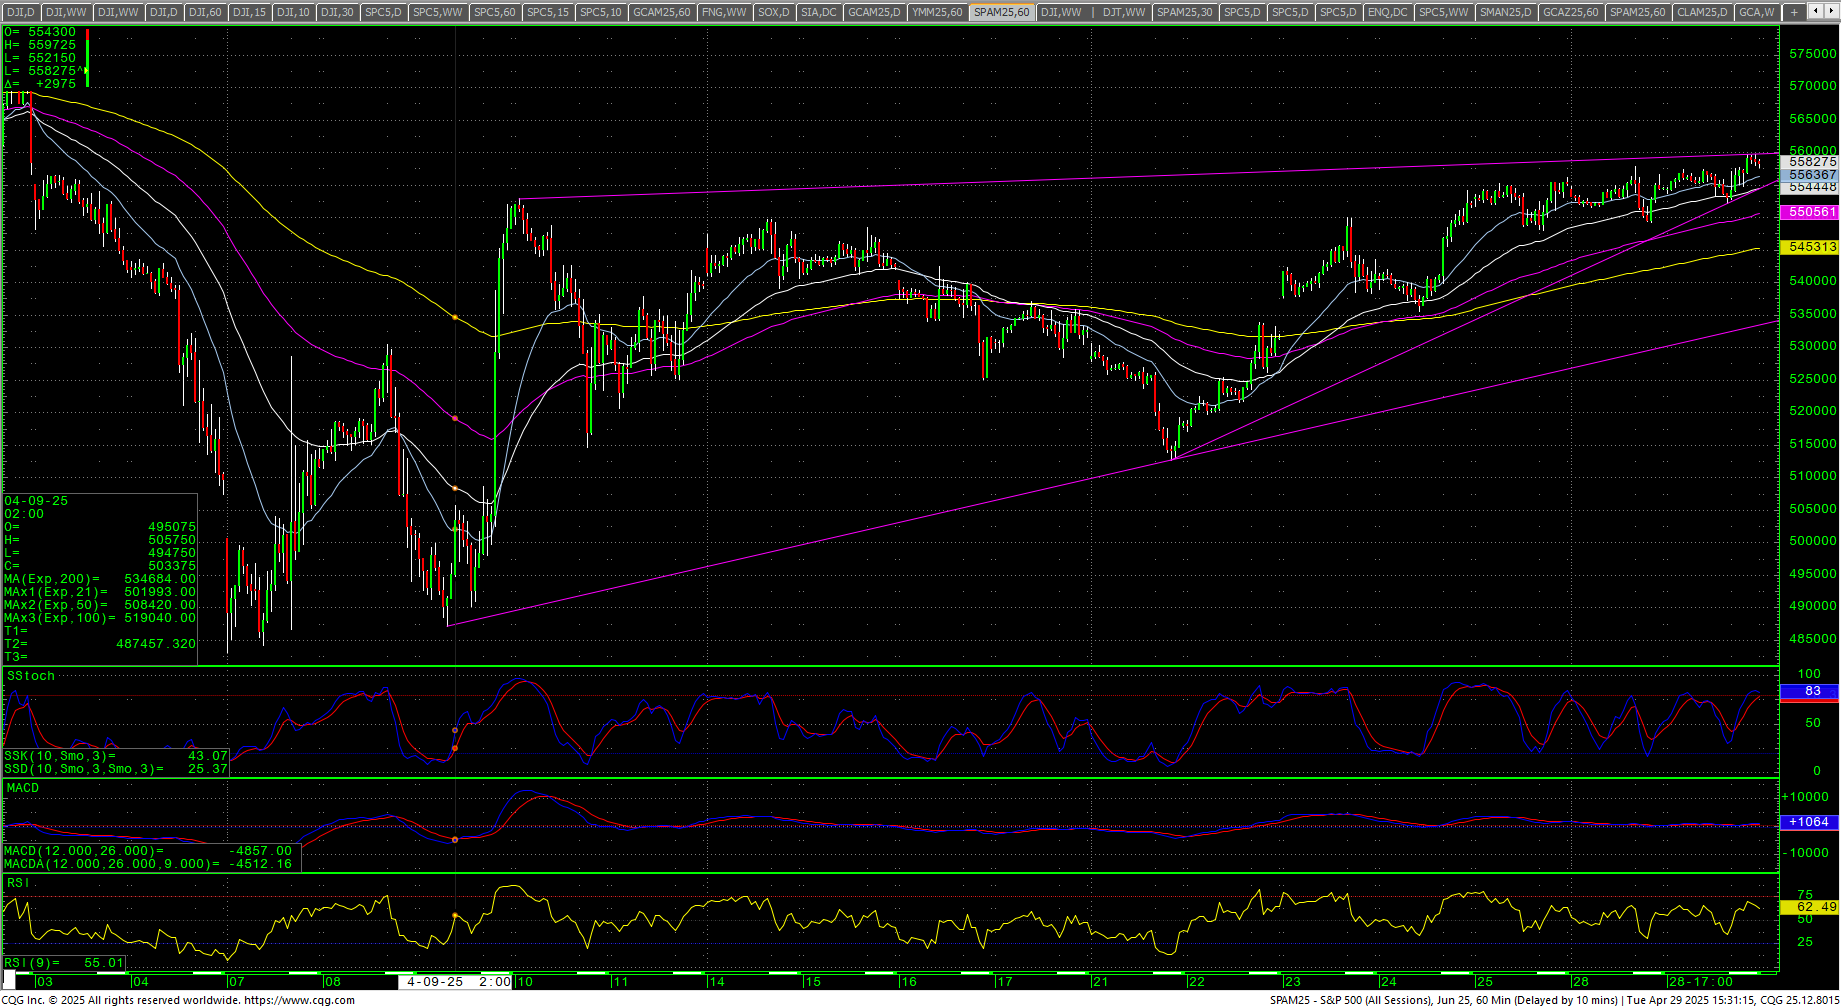 The hourly ended Tuesday in overbought conditions and the overnight trade is slightly lower. For the SPM25, resistance is critical against this Death Zone that runs between 5585.95 through 5600.00 with the 50-day at 5596.00. A breakout over this level would change things on the near-term and intermediate-term charts and would open counts into the 5656.75/5658.00 area where there is critical intermediate-term resistance. This level represents the 200-day MA on the daily continuation. Closes over 5668.00 opens counts back toward critical resistance at the March swing high of 5832.90/5837.25 to 5851.55. Closes over 5851.55 are bullish and suggest a retest of the record highs.
Support is 5486.30 and a breakdown under this level would setup a test of 5417.00/5416.00. Closes under 5416.00 are near-term bearish and open counts to 5362.25 with full potential to critical short-term support of 5306.80/5304.90. A breakdown under 5304.90, especially with closes, will setup 5214.60 with full counts to critical support of 5127.25/5123.00. A breakdown under 5123.00 gives minimal counts to 5023.30 through 5012.80 while opening potential for a retest of the 4832.00 lows.
Charts courtesy of CQG, Inc.