
TECHNICAL ANALYSIS (by Intraday Dynamics)
Major Indices Week of May 2, 2025
 NYSE Volume
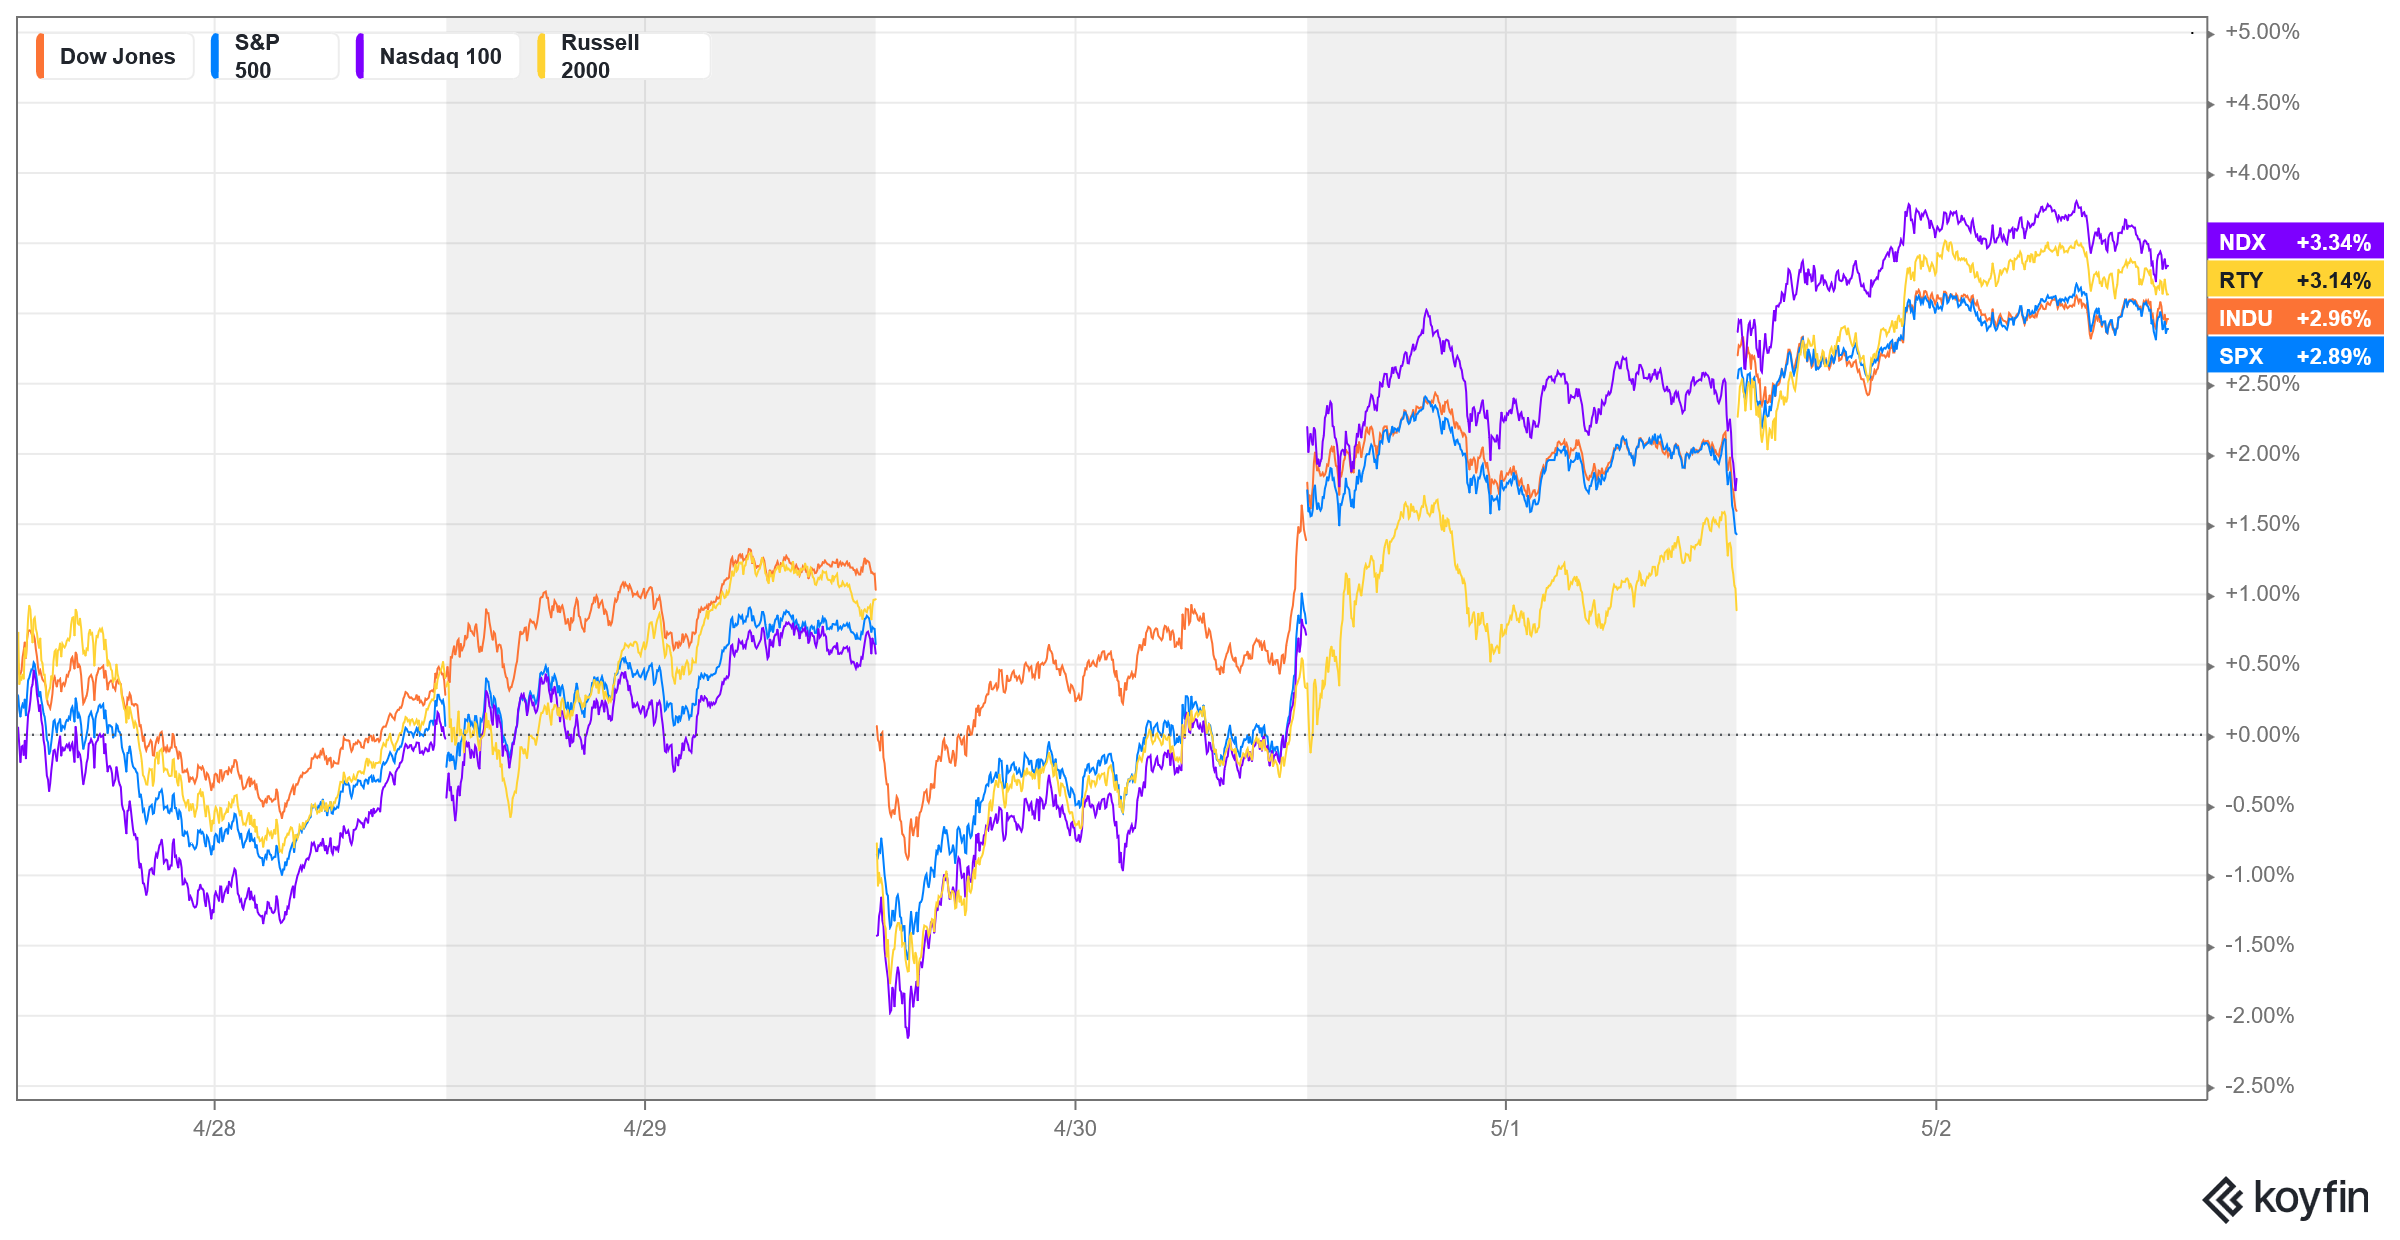
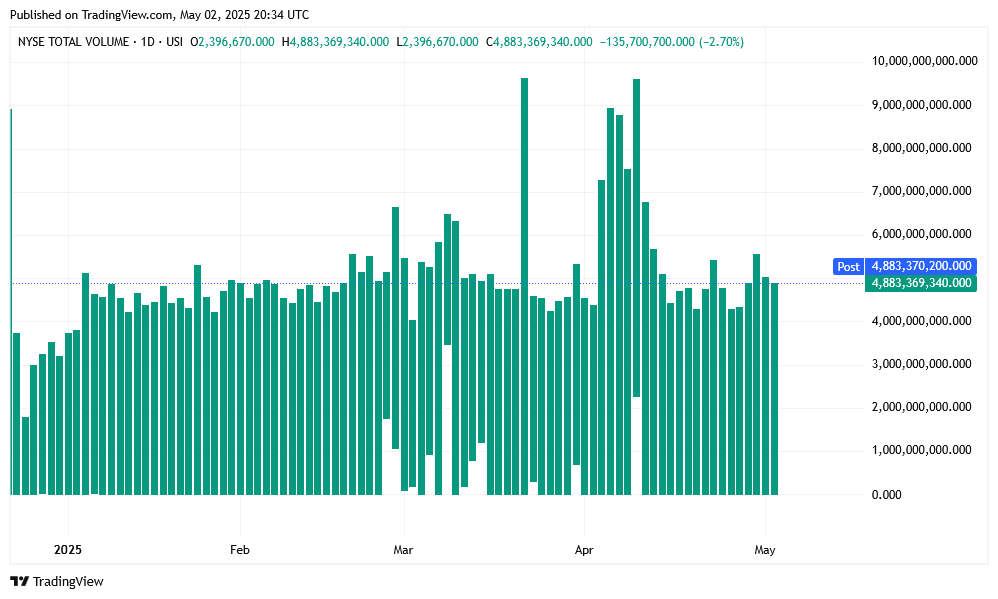
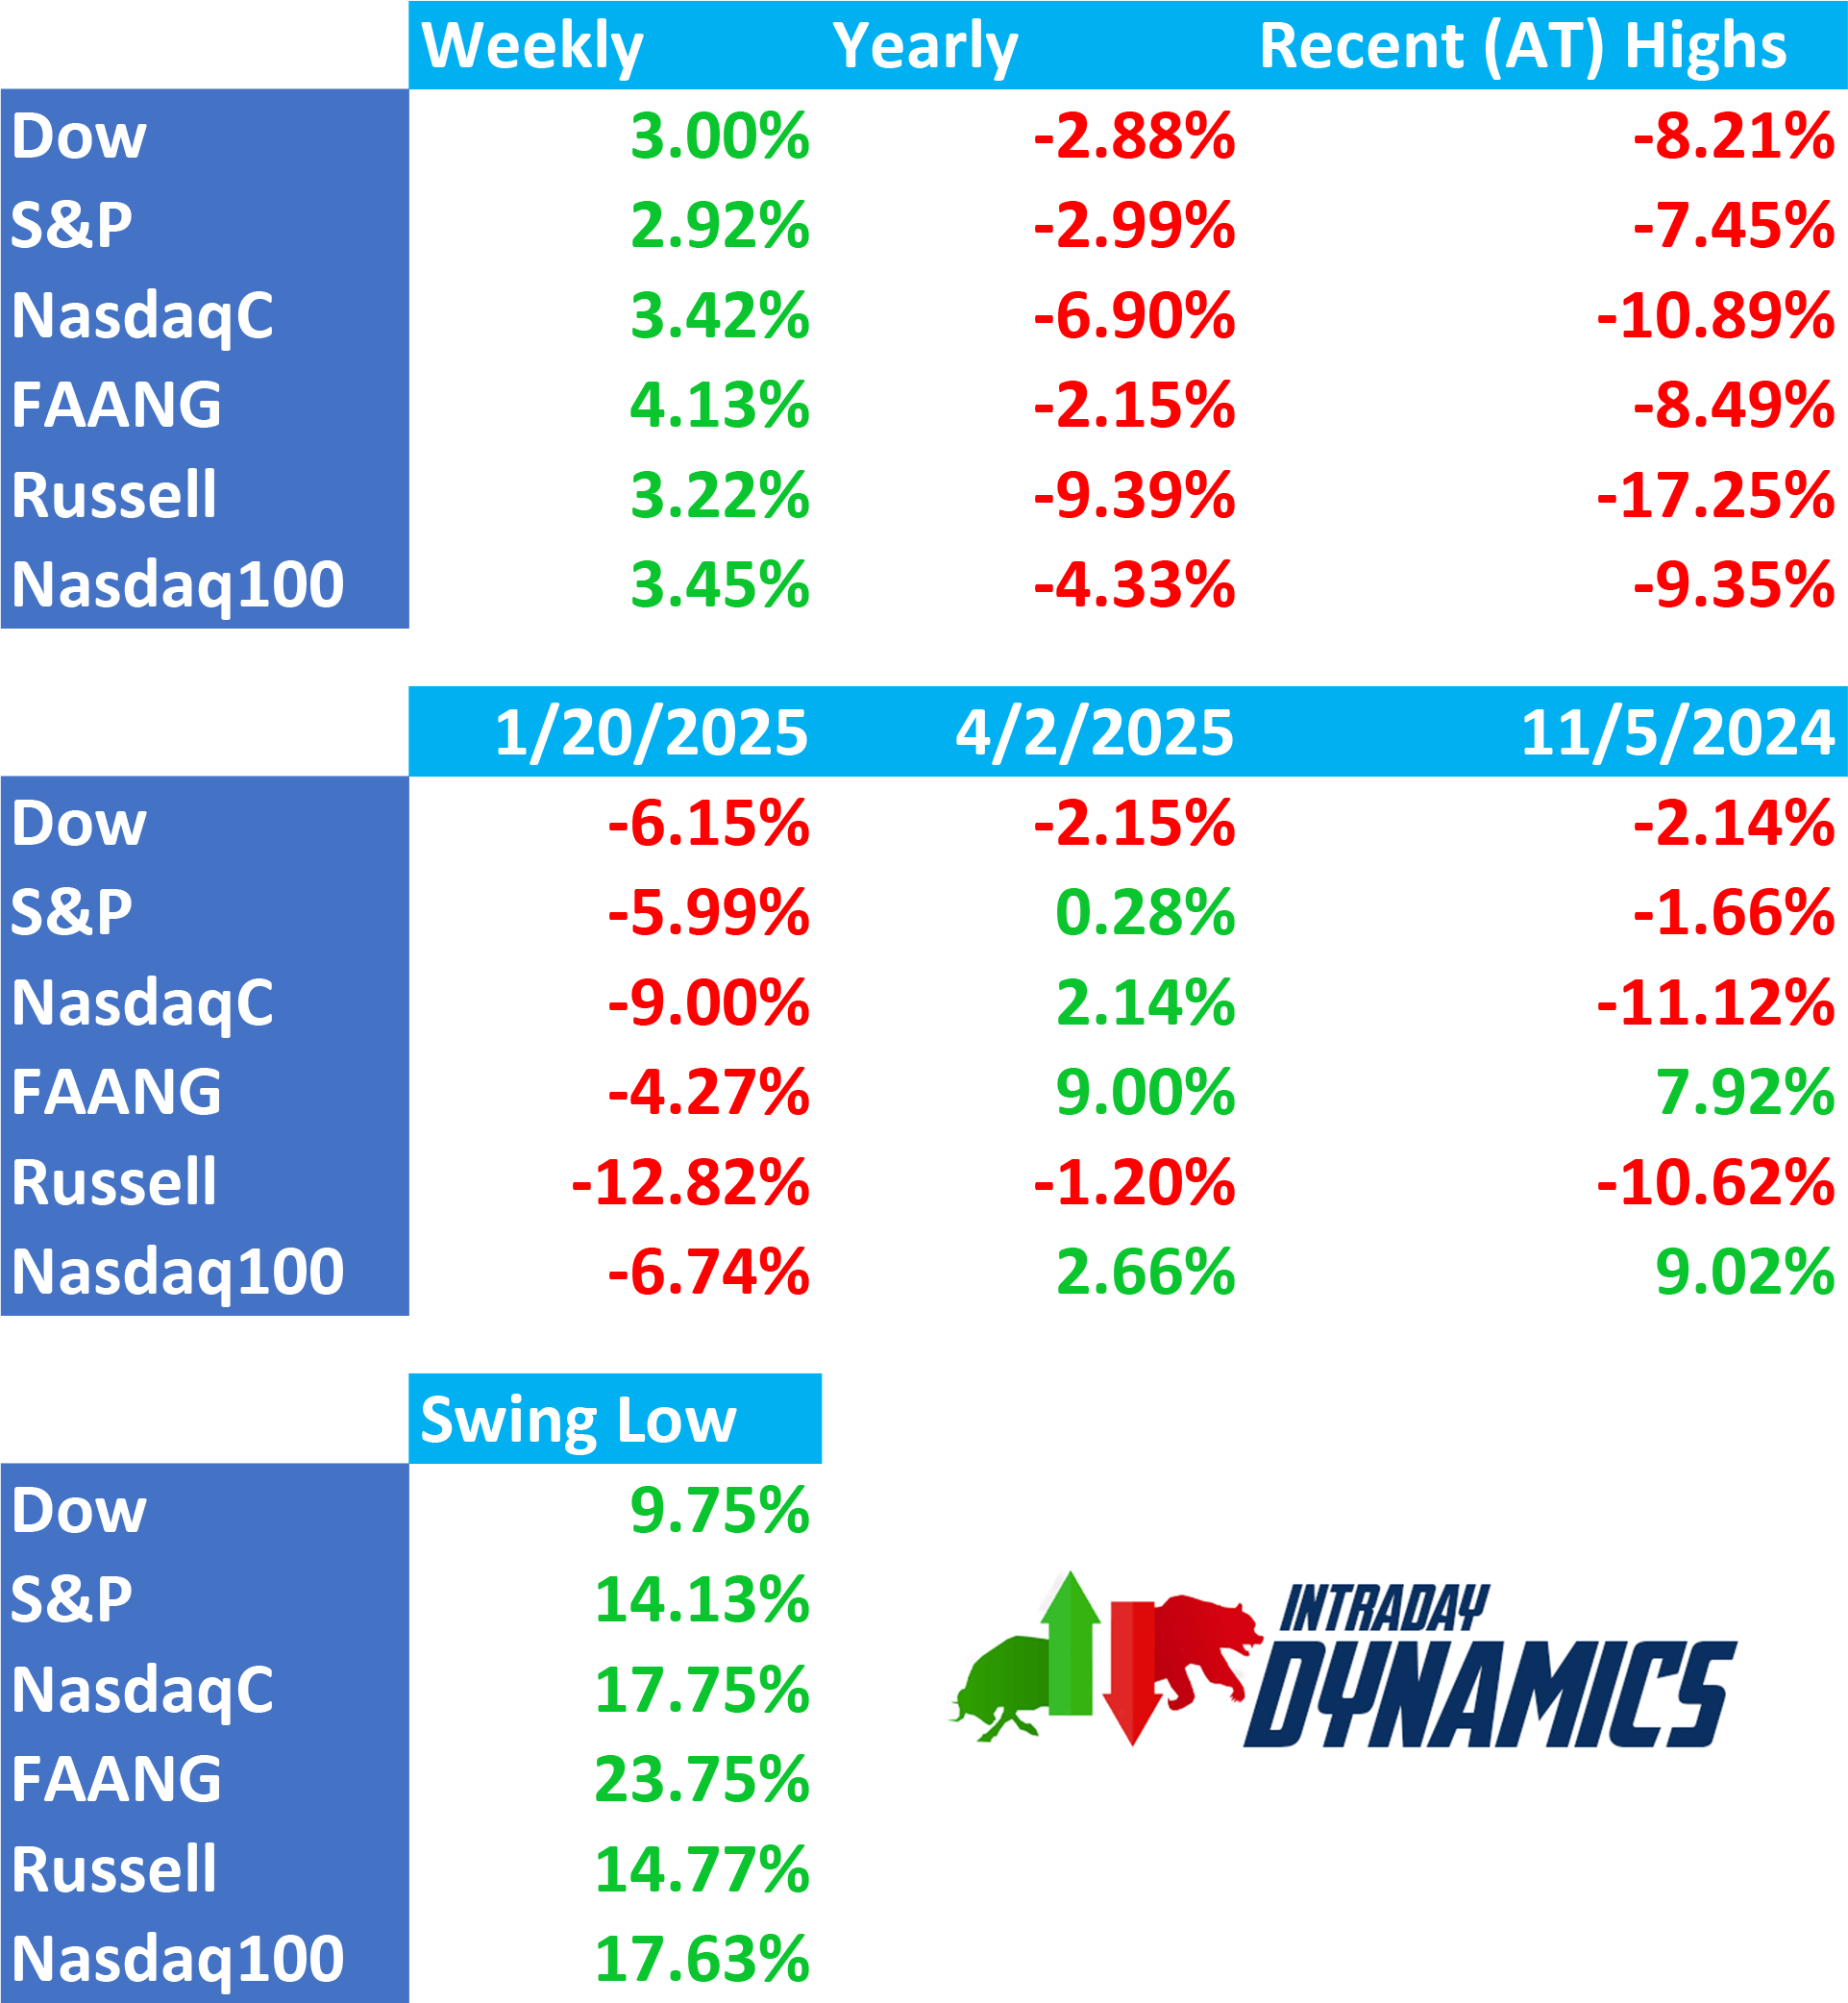
 Stocks stepped on the gas last week, on low volume, following the previous week’s bullish engulfing candles, with prices rocketing to new recovery highs. The market took out the 50-day MAs on a number of charts and has taken all indexes except the Dow and the Russell above the “Liberation Day” closes…erasing 100%+ of the losses following that announcement.
SPX Weekly Candles
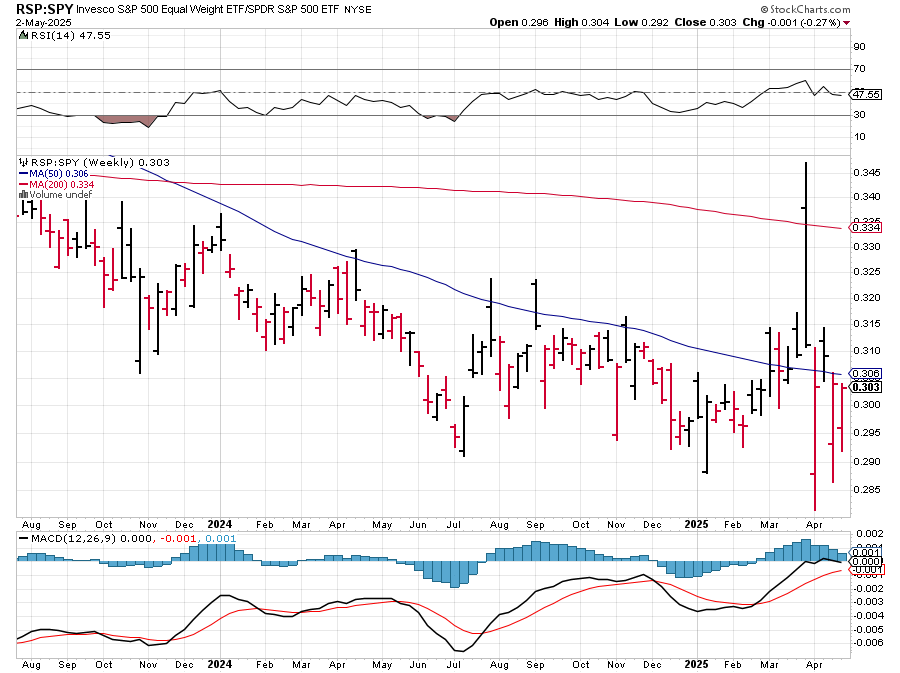
 The S&P closed higher on Friday for the 9th day in a row which prompted CNBC to state that it was the best run for the S&P since 2004…although the S&P had a 10-day run in late 2024. The RSP eked out a slightly better advance than the S&P, but the RSP:SPY remains subdued near multi-year lows.
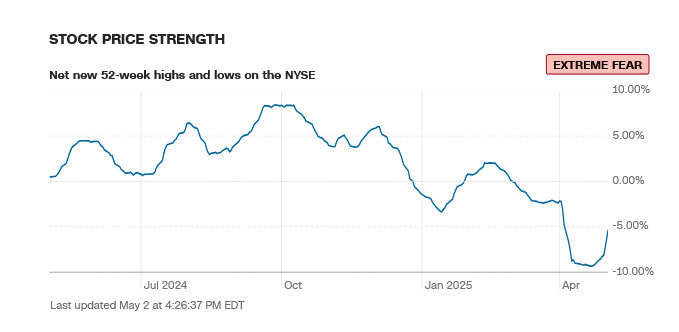
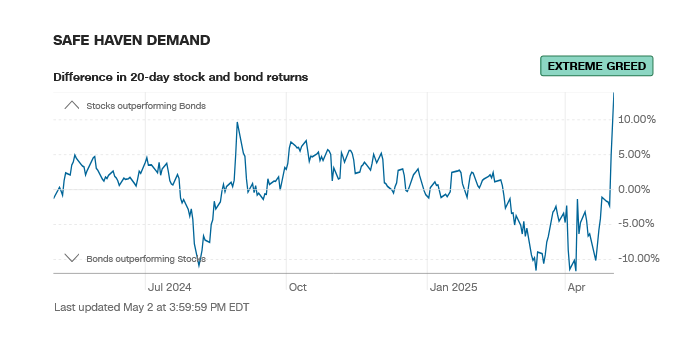 The action has cured the sentiment of the extreme fear with Safe Haven demand now in Extreme Greed.
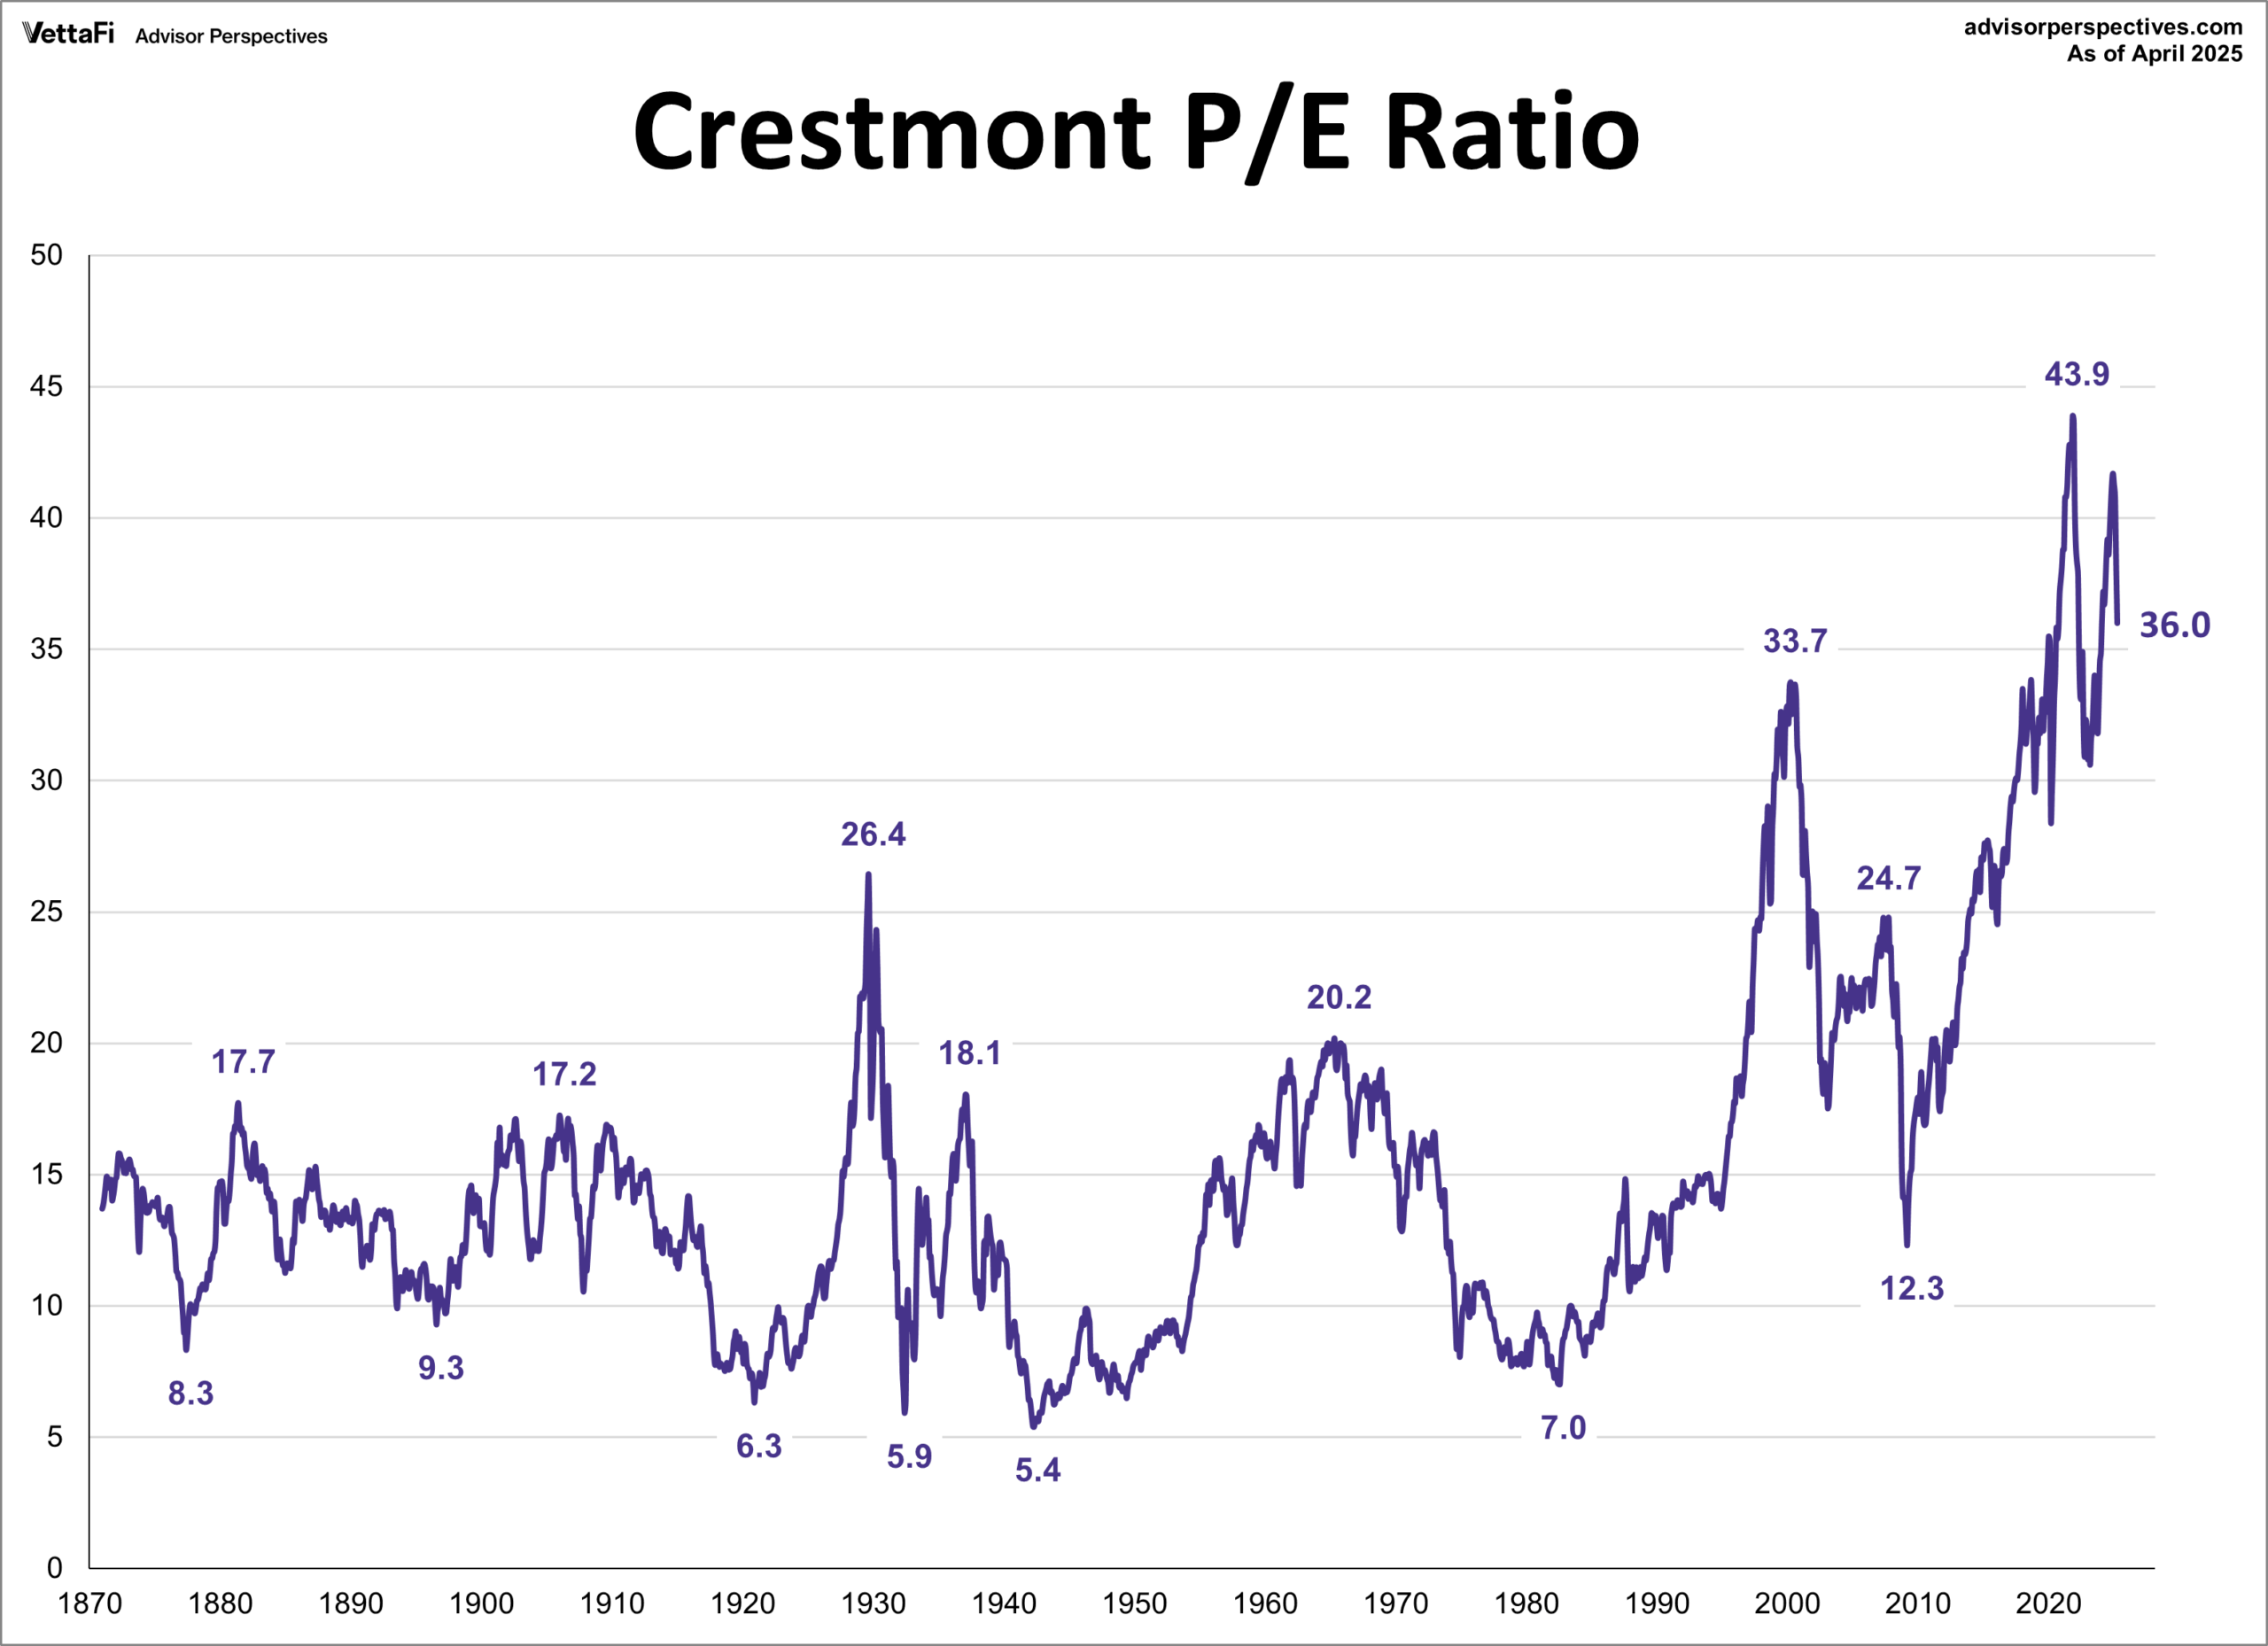
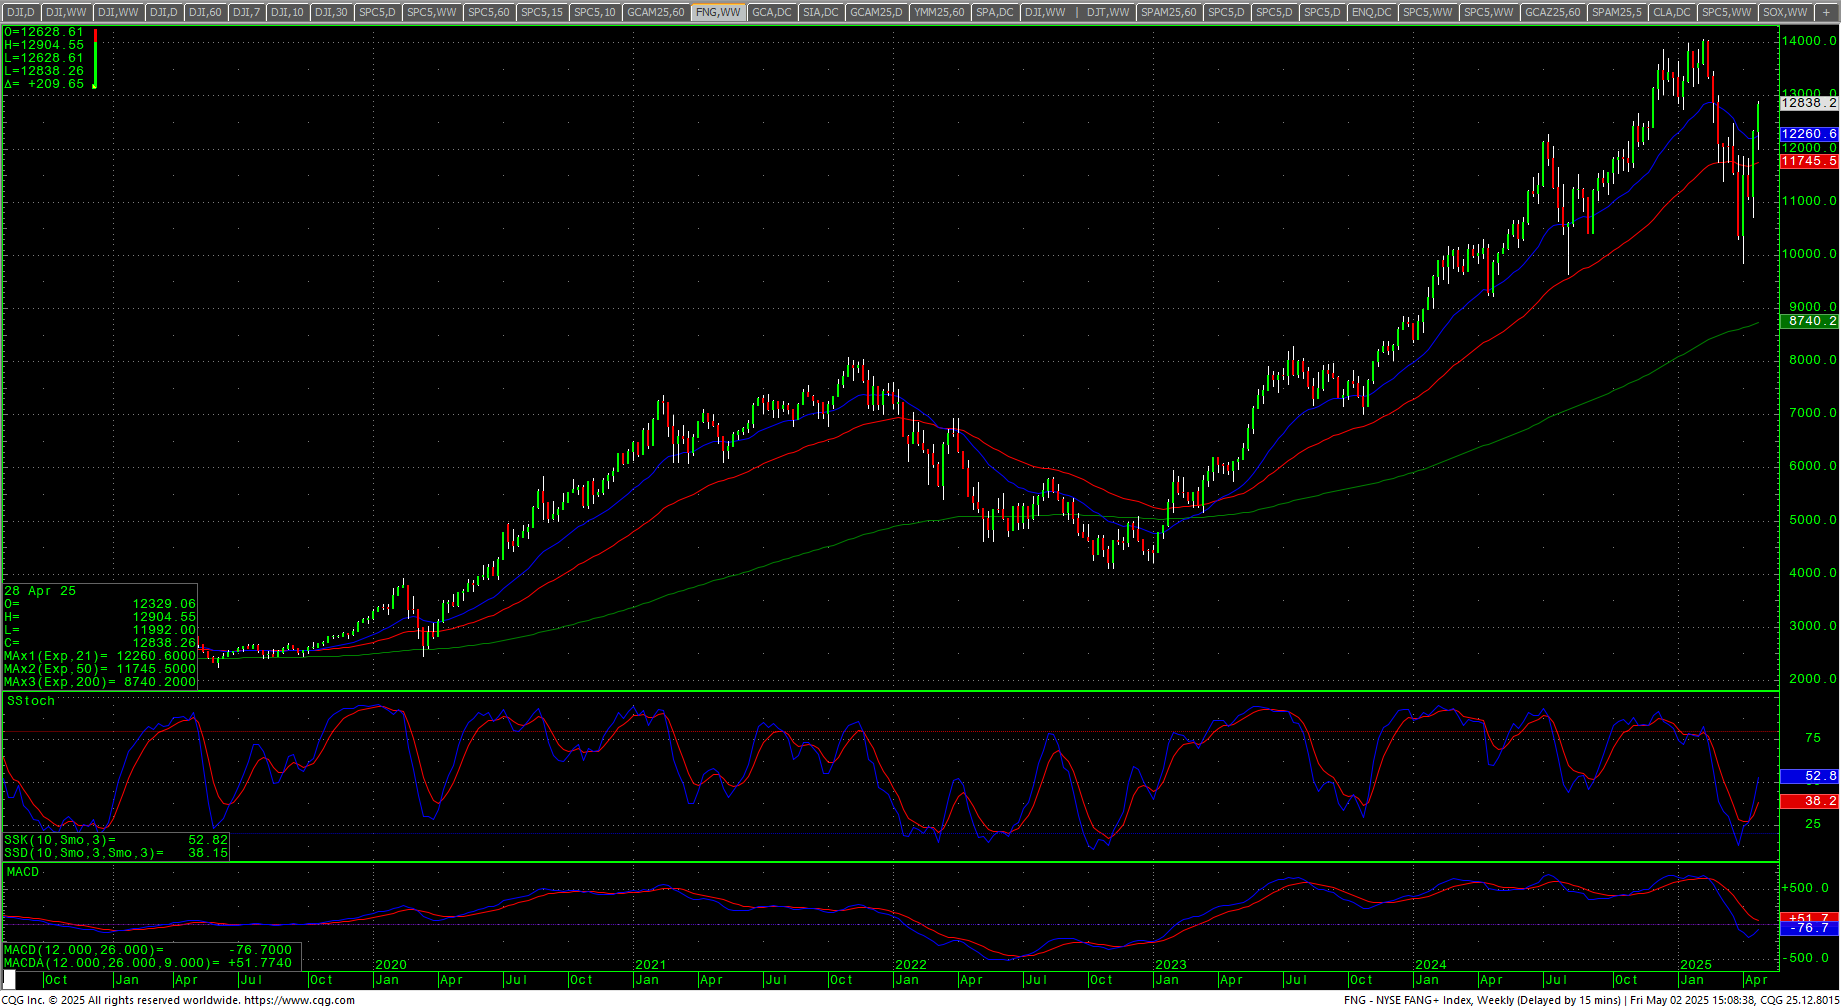
Wednesday’s critical cycle timing date and negative GDP was followed by strong tech earnings and a better-than-expected Nonfarm Payrolls number on Friday. The FANG is now up +23.75% from its closing low and this establishes a “new” bull market for the tech-heavy markets. The top tech stocks still make up the bulk of the valuation for the S&P. The S&P remains at an historically high P/E ratio.
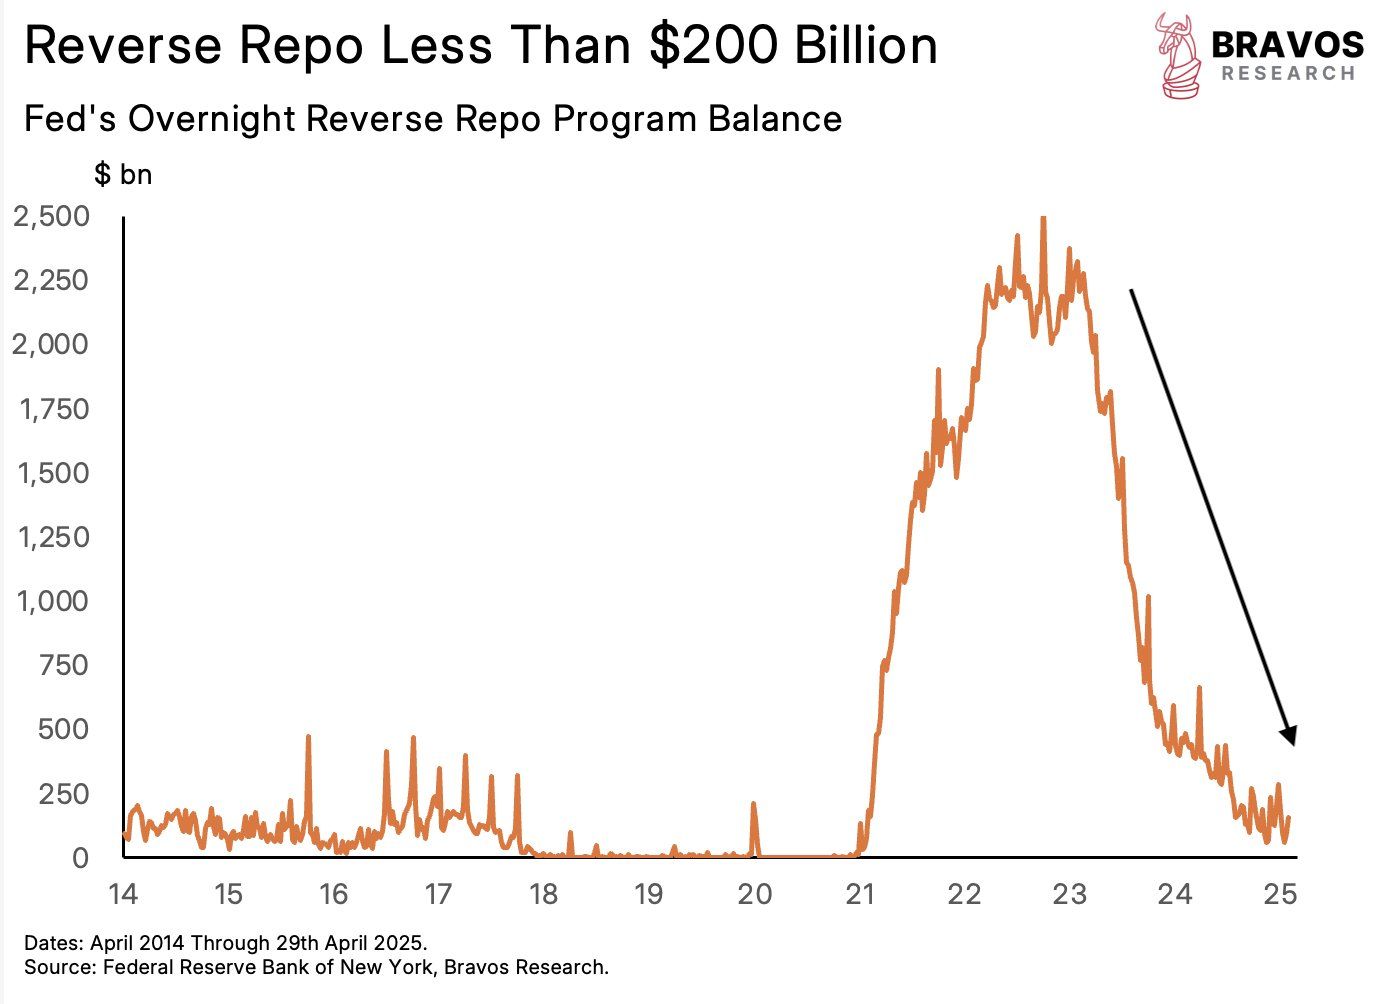
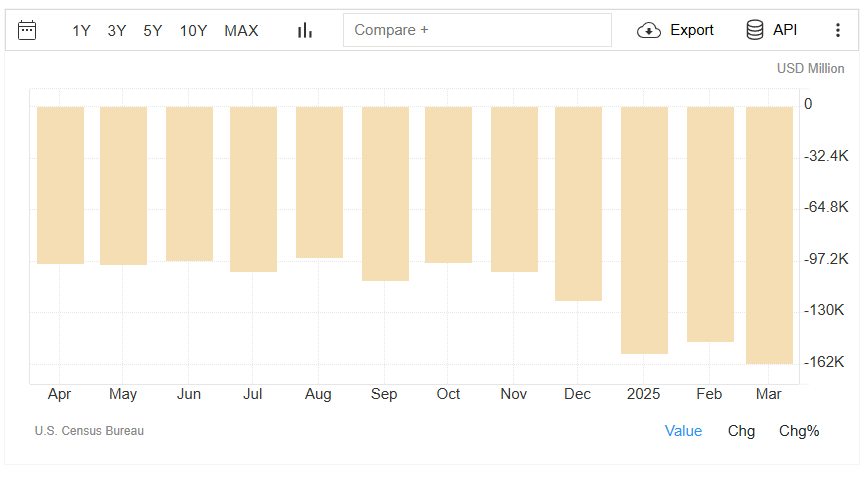
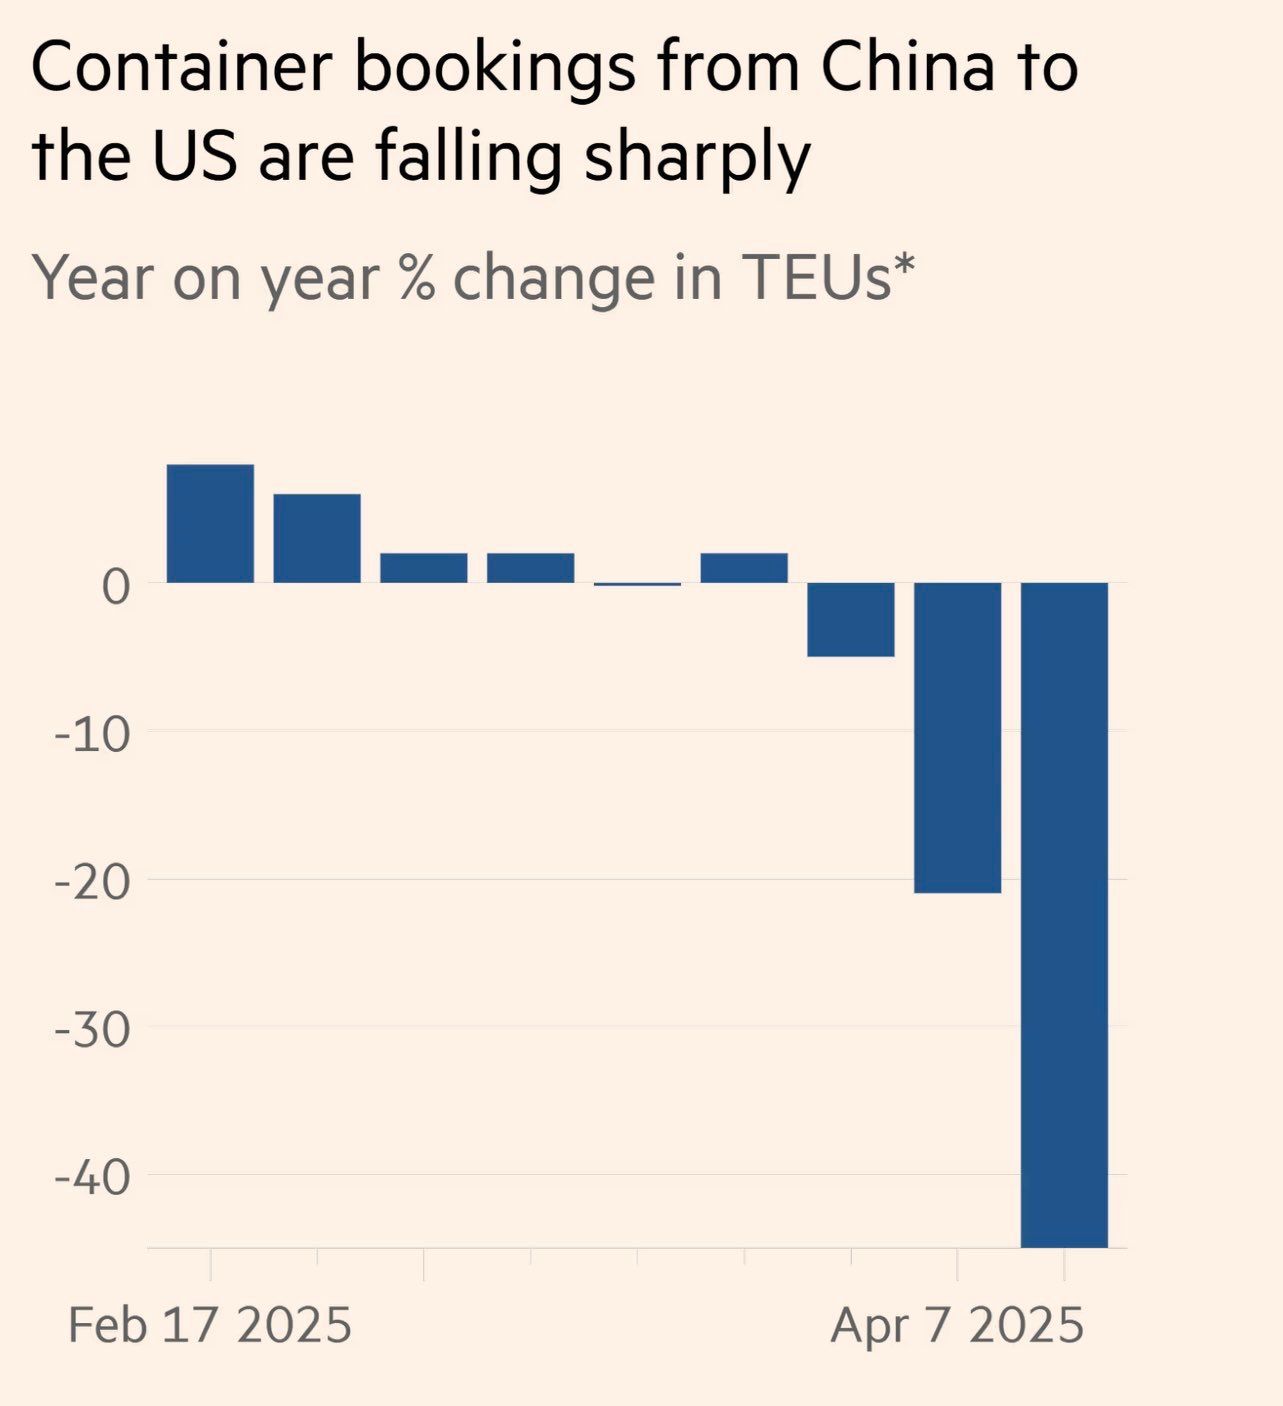
 This doesn’t dispel the issues underlying the markets fundamentally. There is clearly an issue with liquidity in the heart of the economy…Reverse Repos have cratered. The ADP number last week, coupled with the JOLTS report, shows cracks in the employment arena. The Trade Balance hit a record low. Container Bookings are collapsing.
 Trade Balance Hits Record Low

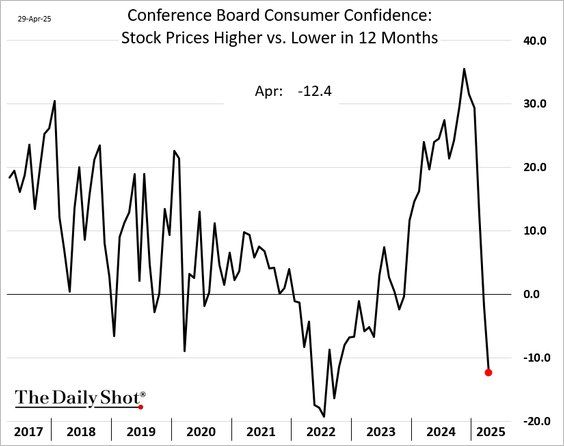
 Consumer Confidence
 As pointed out in the short-term timing update, Wednesday marked a pivotal point for prices. In addition, Friday marks the END of the Phase One of this long-term timing cycle (that runs well into early 2026). That said, May 13th remains an extremely CRITICAL cycle date where there can be extreme volatility and/or a turning point.
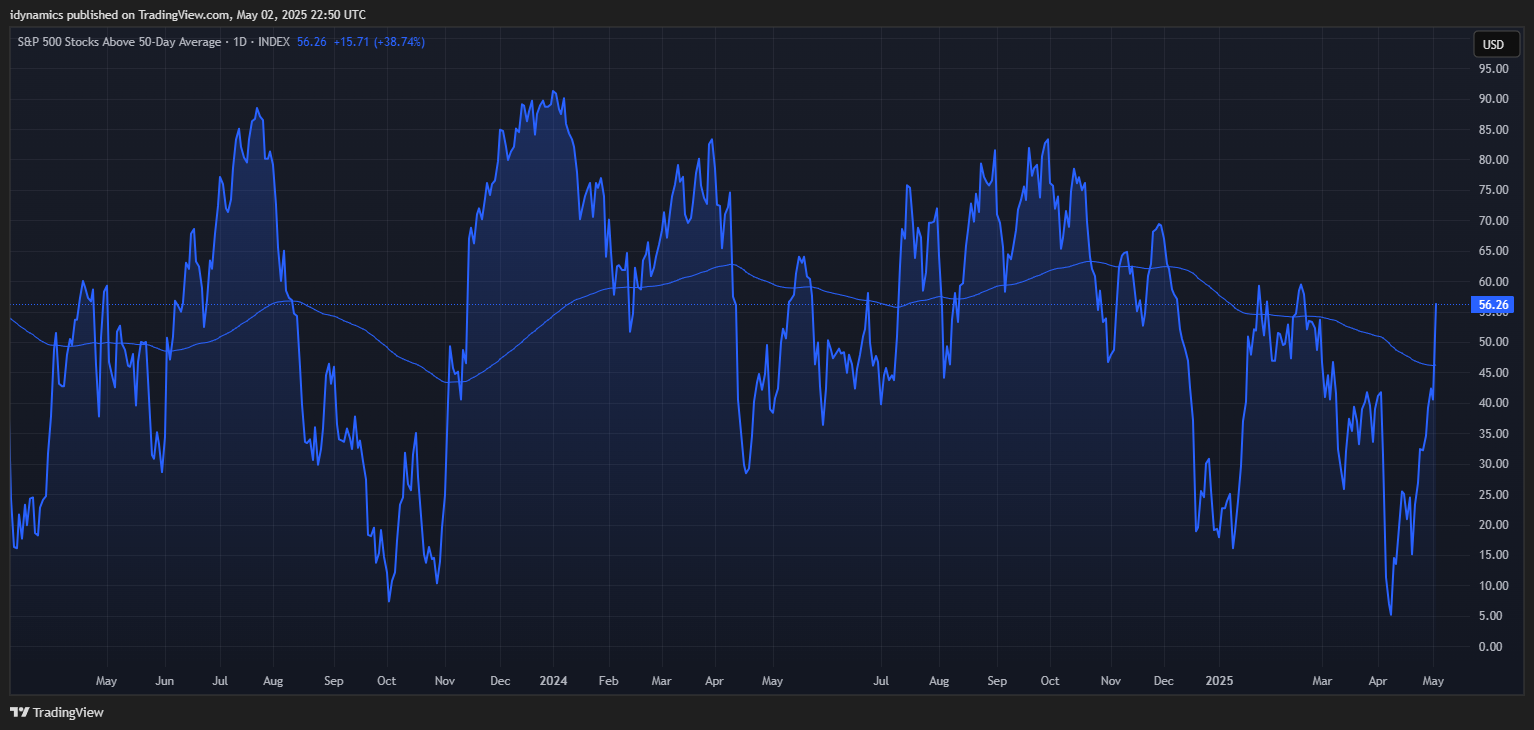
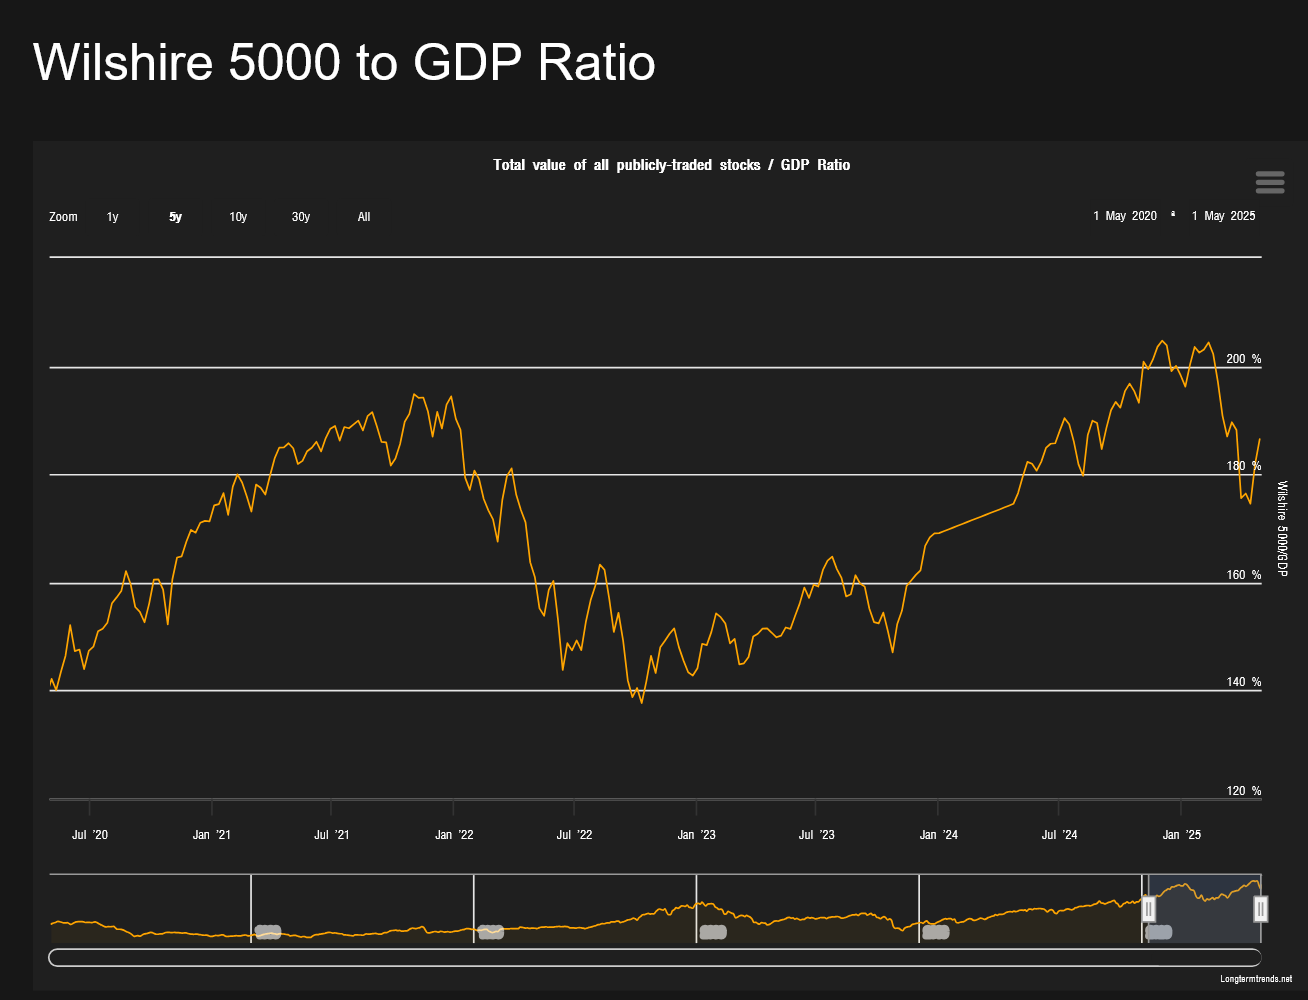
In that update, we pointed out that the ZBT, Indicator (Zweig Breadth Thrust) had been triggered as the breadth has thrusted sharply (in a bullish sign), carrying the number of S&P stocks under the 50-day MA from an anemic 5.16% to a high on Friday at 56.26%…so over half of the S&P is back above their 50-day MAs now. Last week also brought out talk about the decline in the Buffet Indicator. Even though it remains historically high.
S&P 500 Stocks Above 50-Day Average

 DJIA Weekly Candles
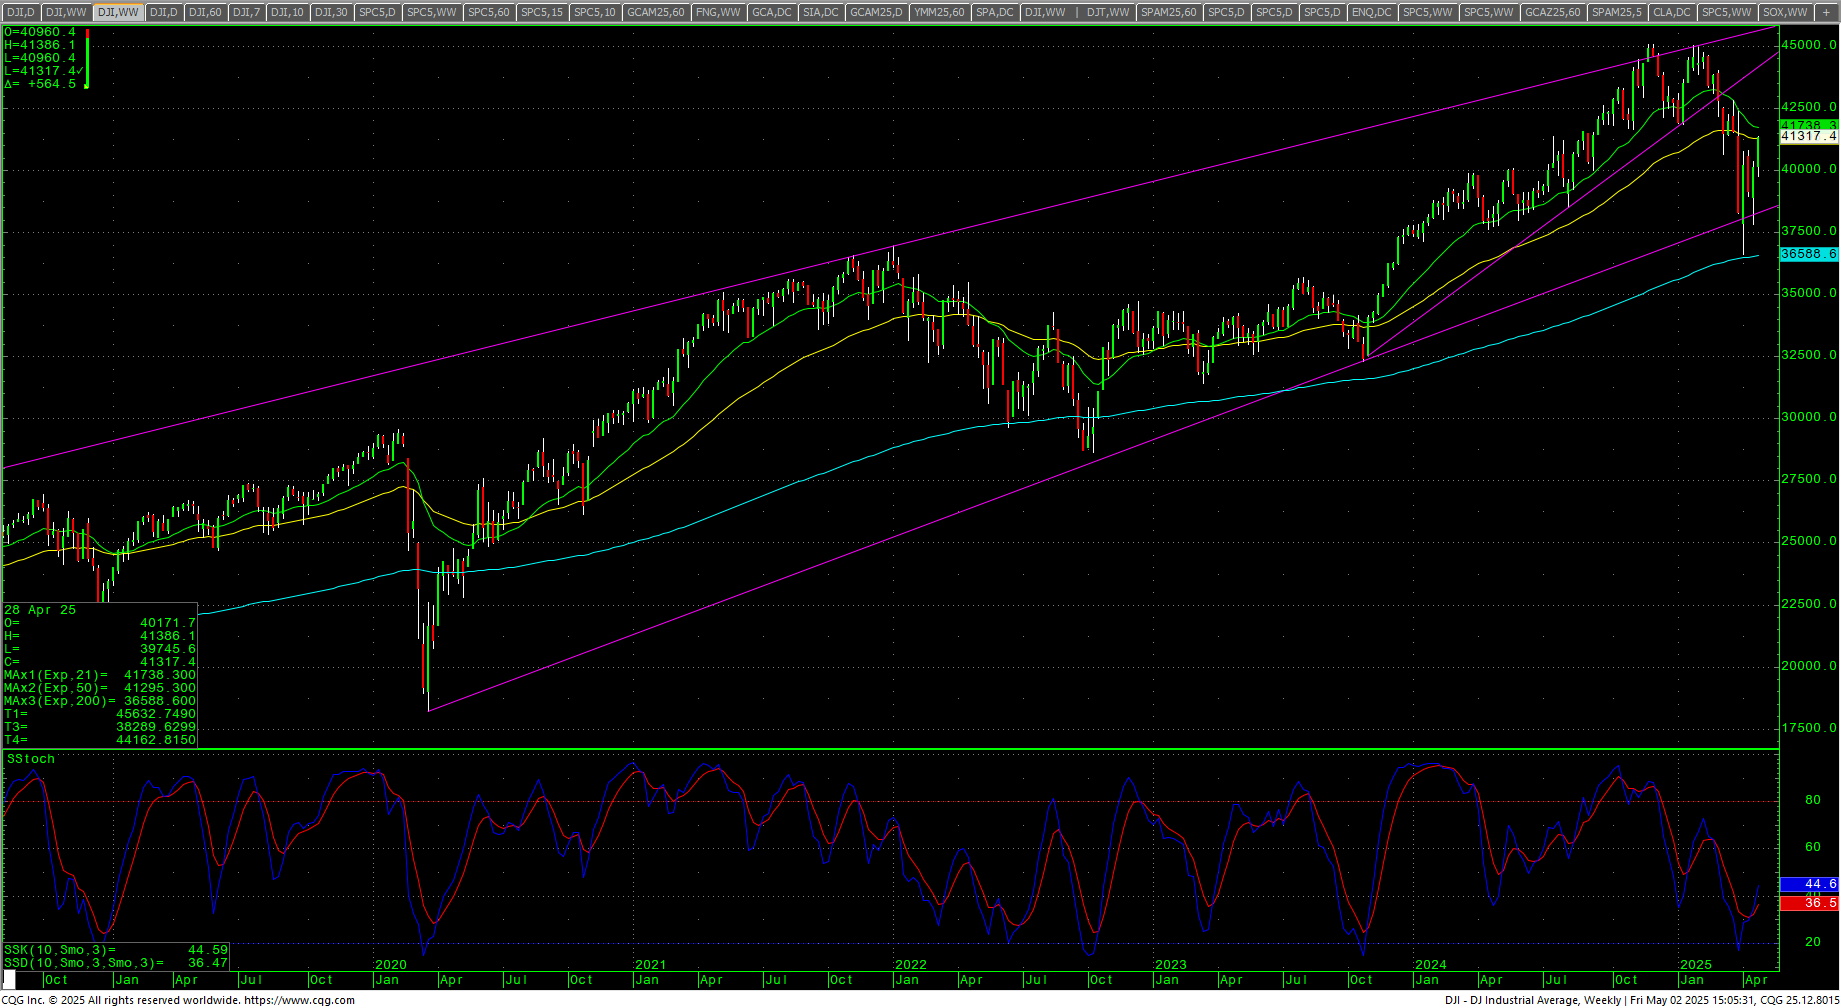 Yes, lowered volume is a single point of contention for the bullish case, but everything is looking very bullish technically right now for these markets. It looks like the ZBT will beat the Death Cross right here. For reference, take a look at the table in last week’s update that shows that Death Crosses do NOT always mean Death.
Sticking to the longer-term timing analysis:
“While this window runs through the first week of May, it is looking more and more, from a cycles standpoint, that this will run well into Q4 2025/Q1 2026. Thus, a much more protracted and drawn-out bear and not the “flash crash” that everyone has gotten used to over the past two decades. That doesn’t mean we won’t have significant rallies, but chasing rallies is likely to be a losing strategy until this thing is spent…which very likely will not be until Q1 2026 at this point.”
Dow Theory
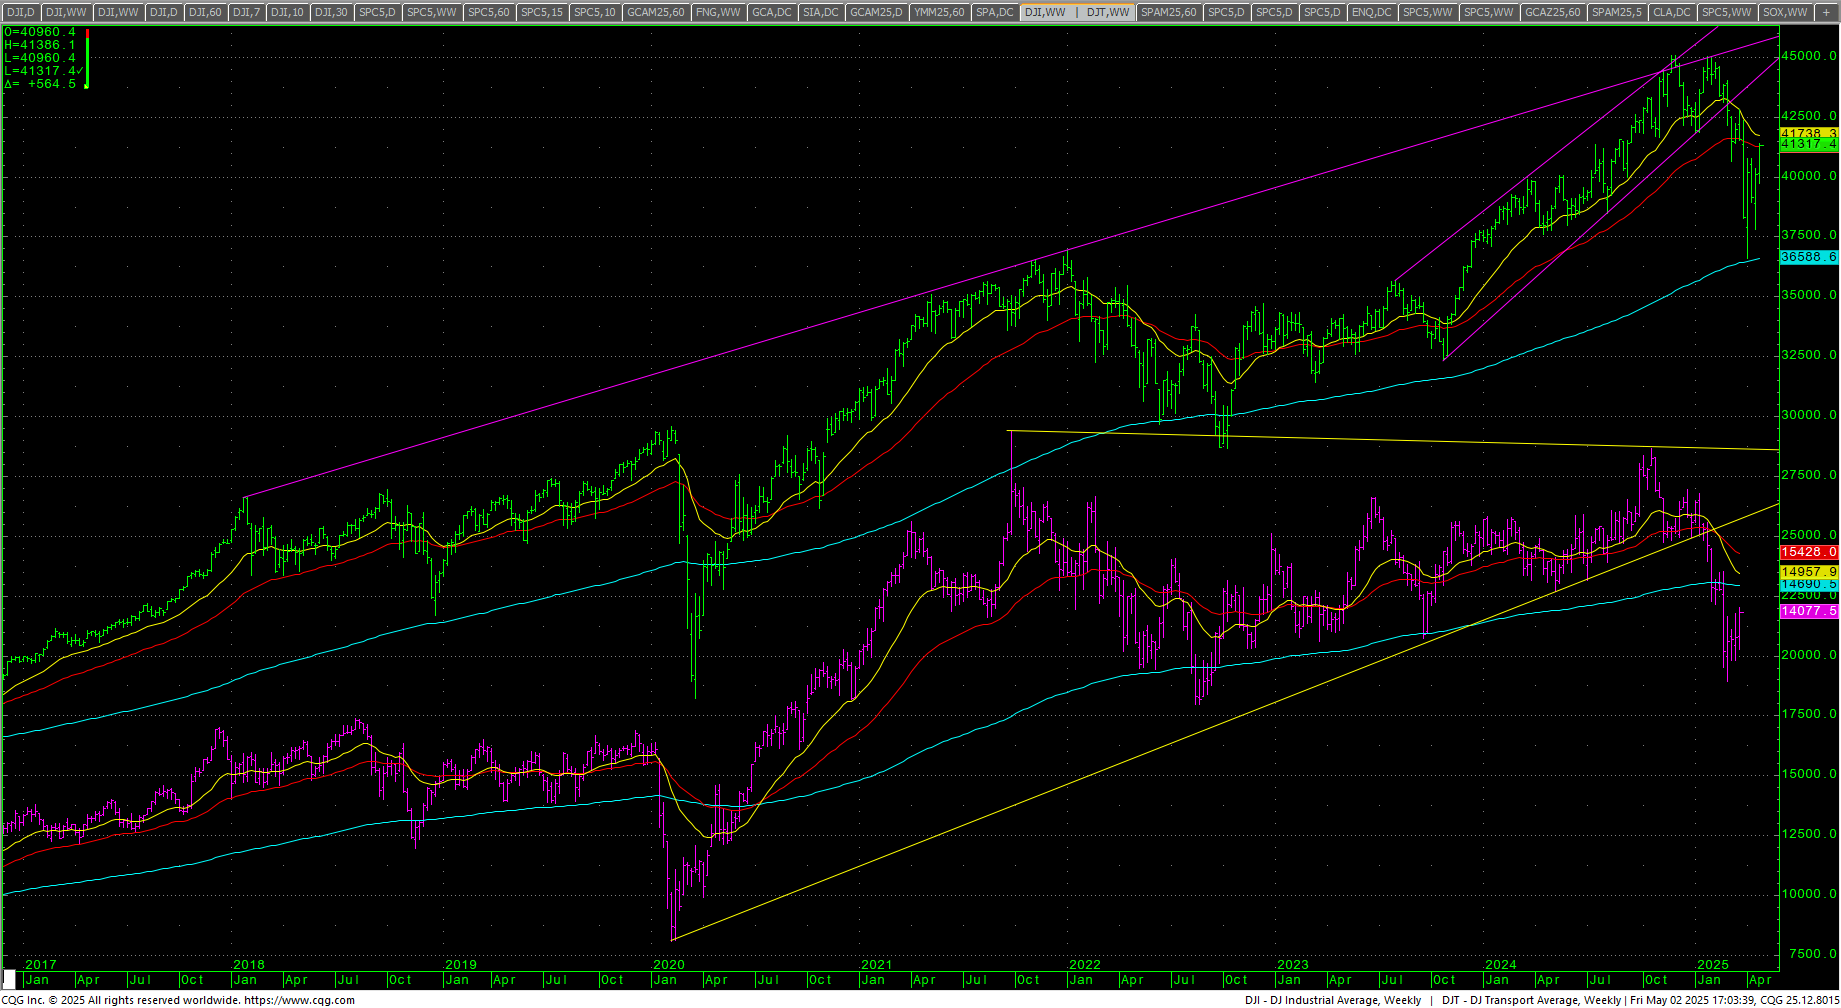 Dow Theory remains bearish, but the Transports showed good strength with last week’s surge.
MAGS (Magnificent 7) Daily H-L-C
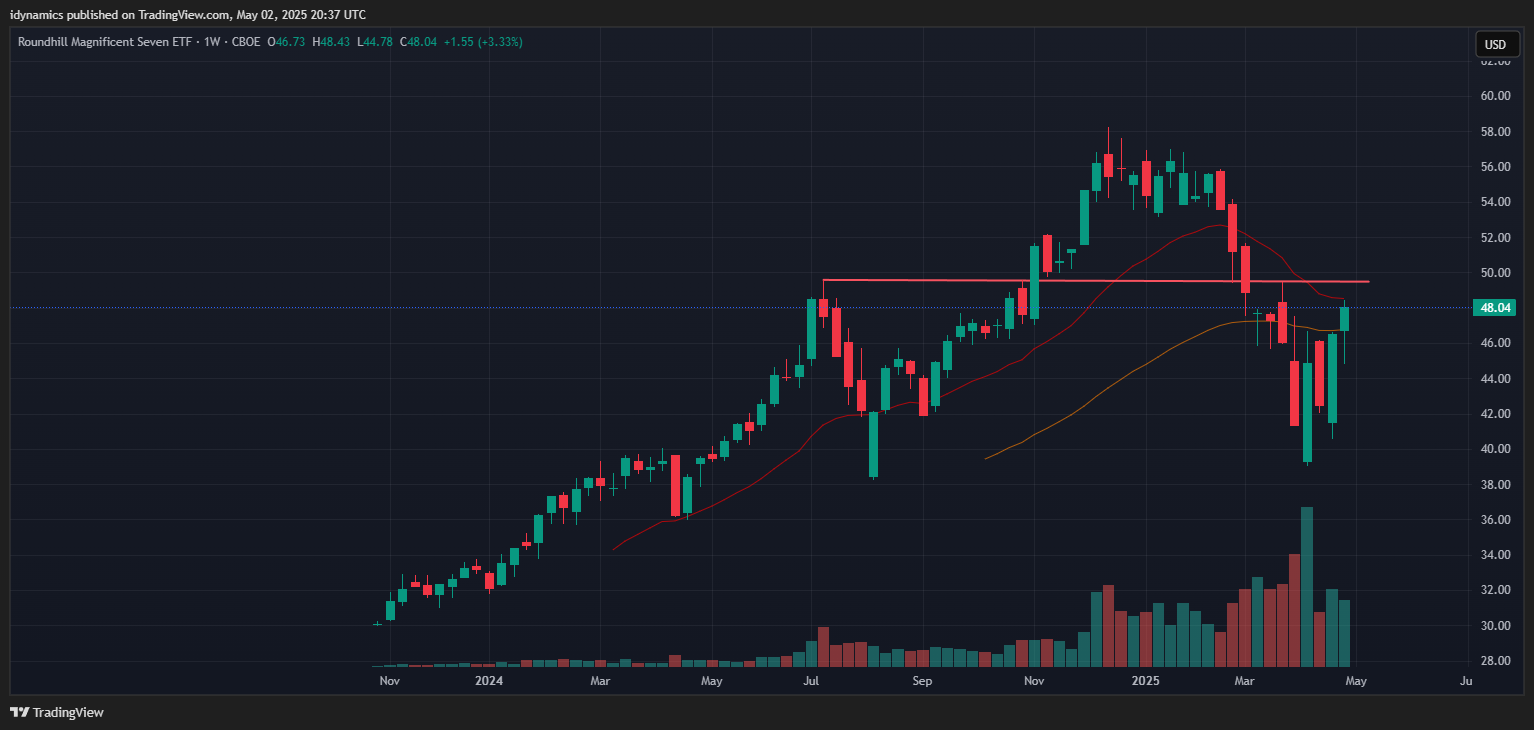 The MAGS (Magnificent 7) traded higher (on declining volume) from the previous week’s Bullish Engulfing Candle and closed on the highs as prices retest the critical zone at 48. If we are mapping out a large H&S top, the 50 level is critical for the right shoulder. Closes over 50 in the MAGS would change things. Long-term, the chart is still on the defensive, with the potential to trade all the way down to new lows. Selling rallies against 48/50 should remain the short-term strategy until proven otherwise.
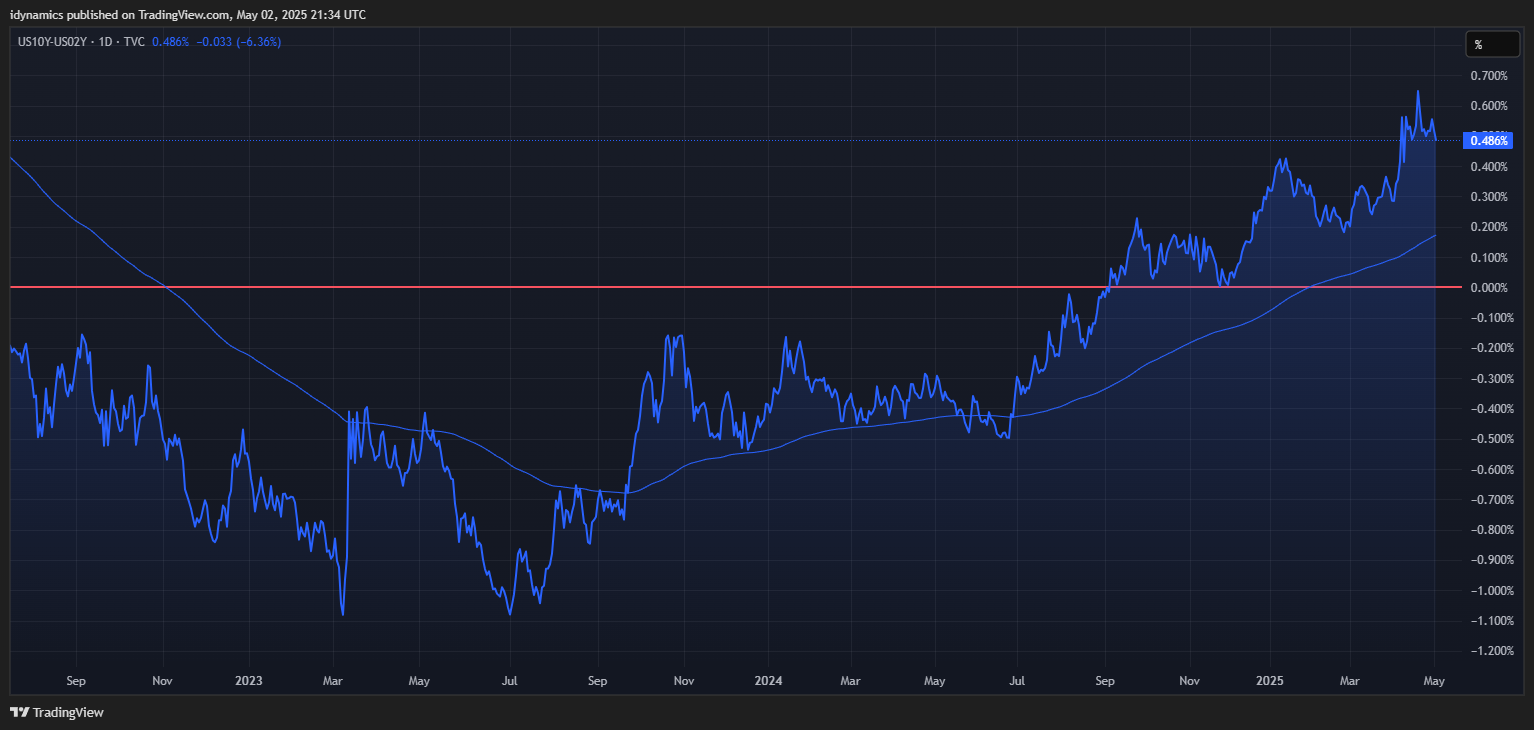
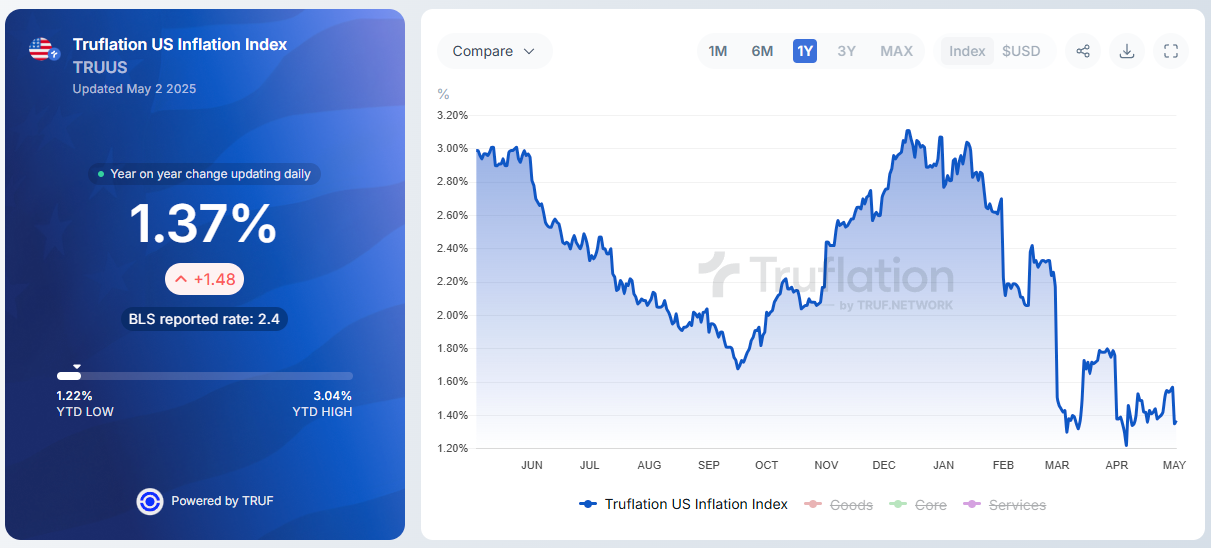
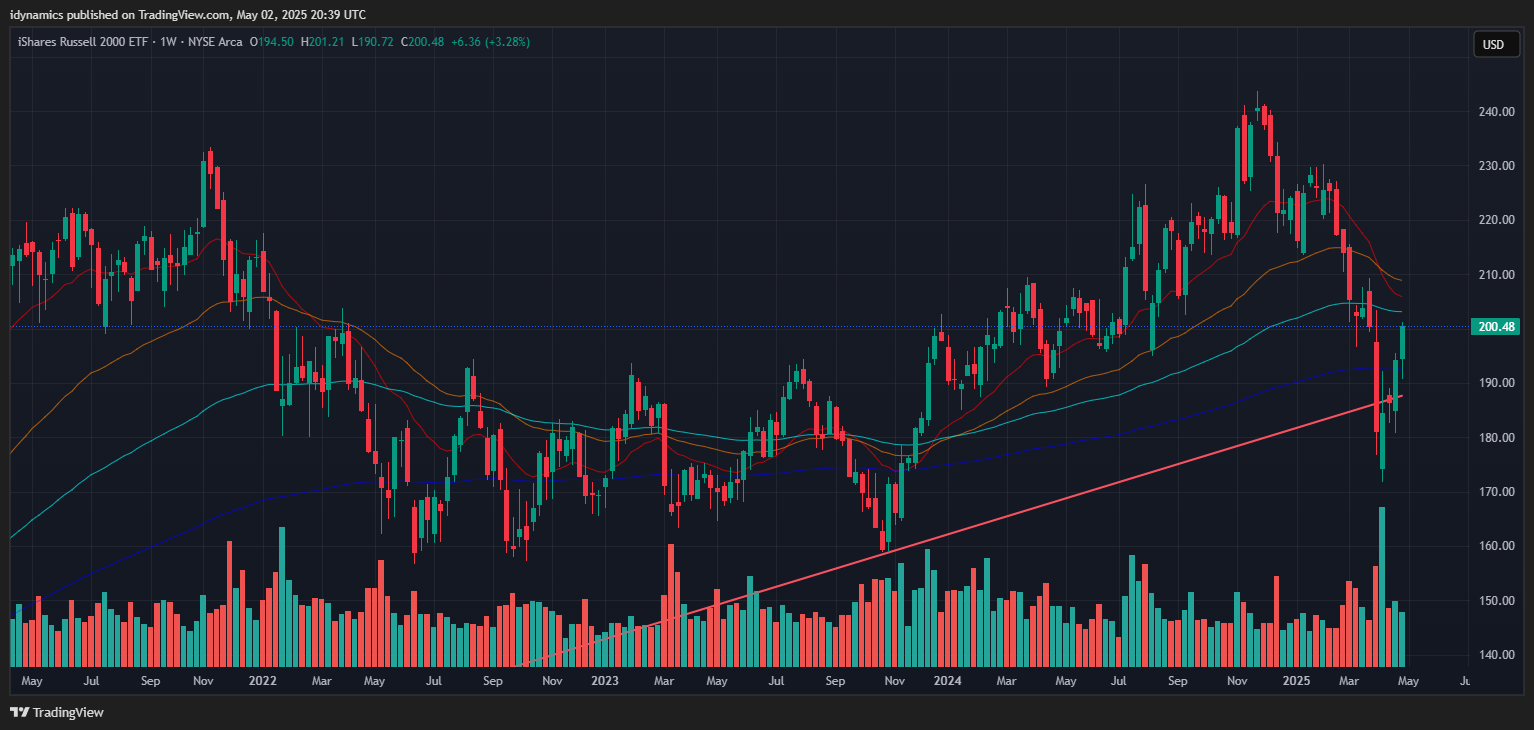
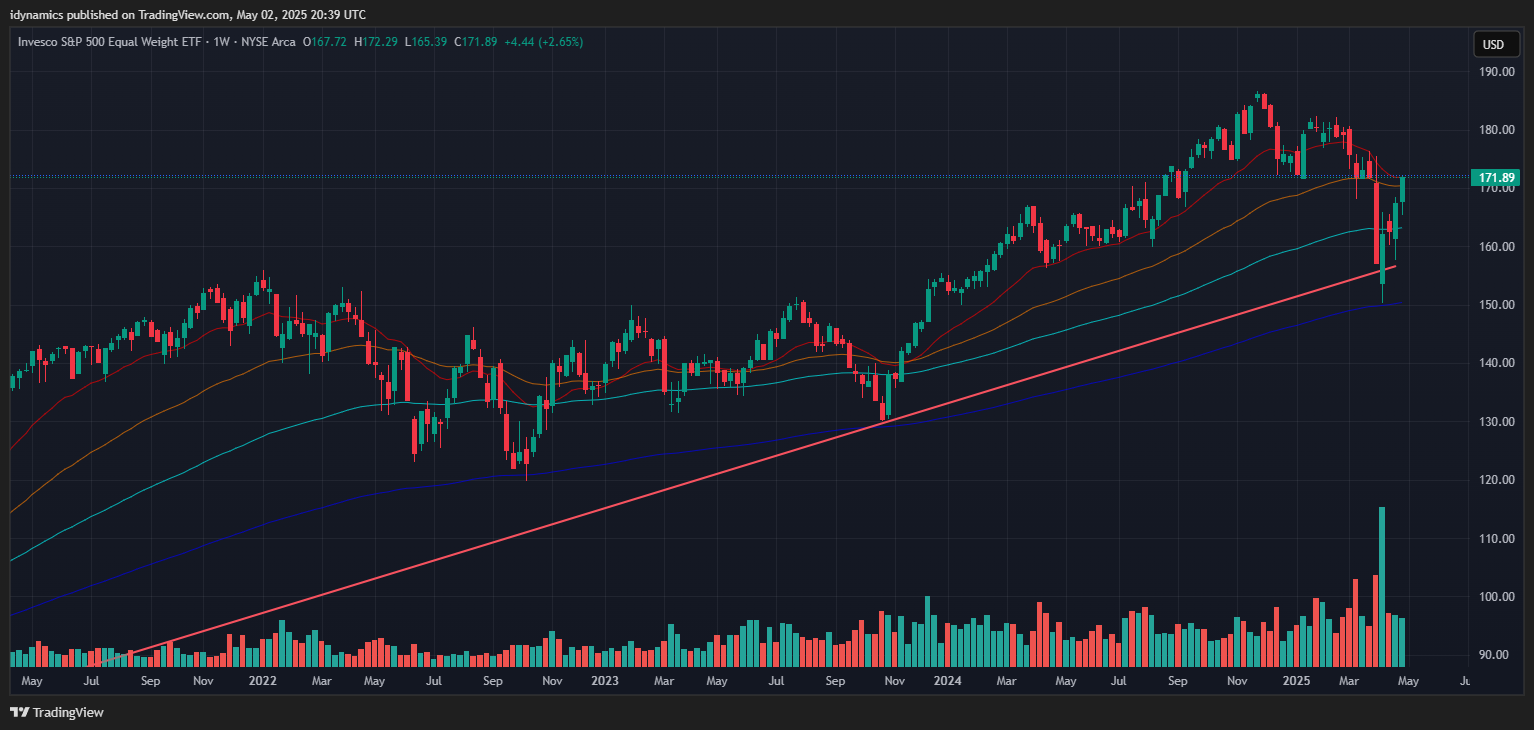
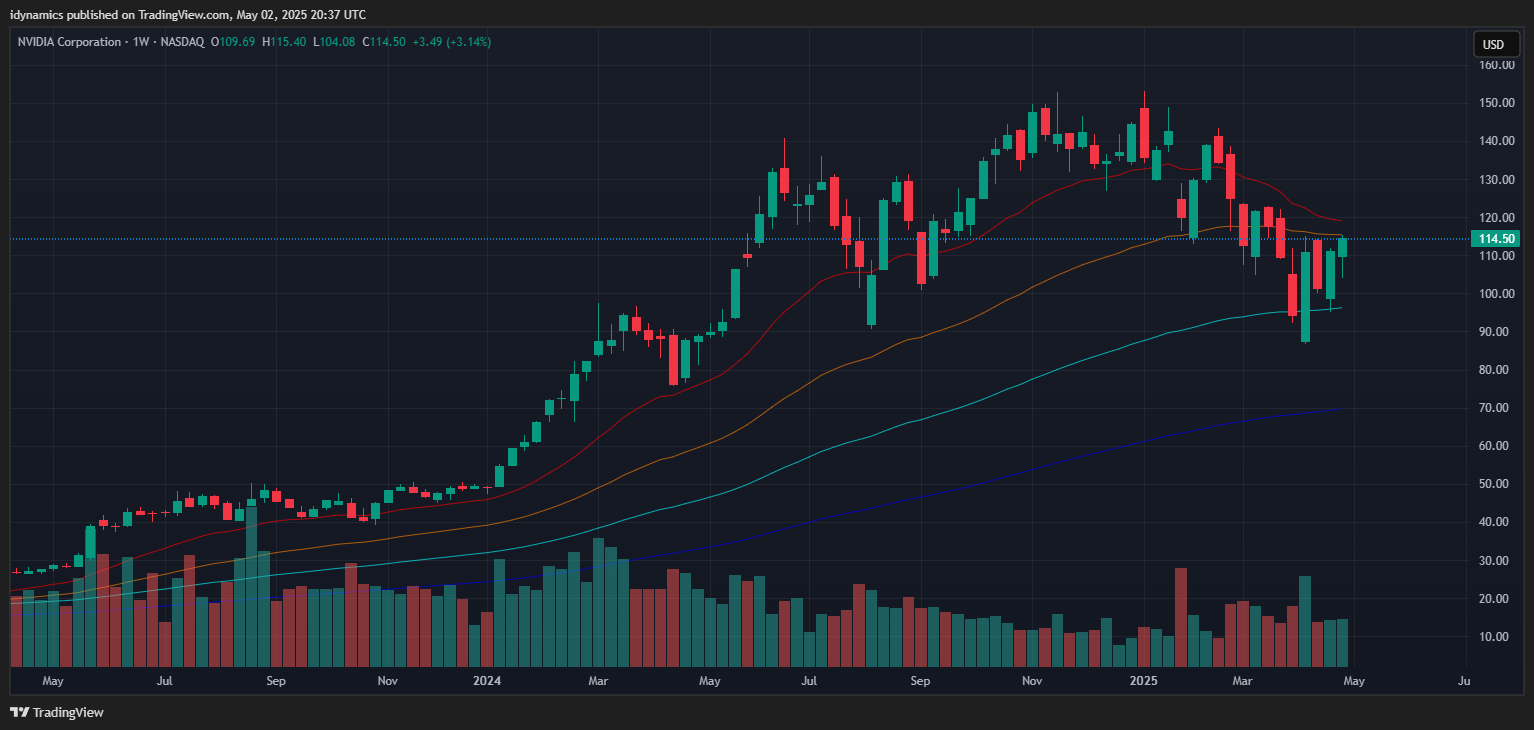
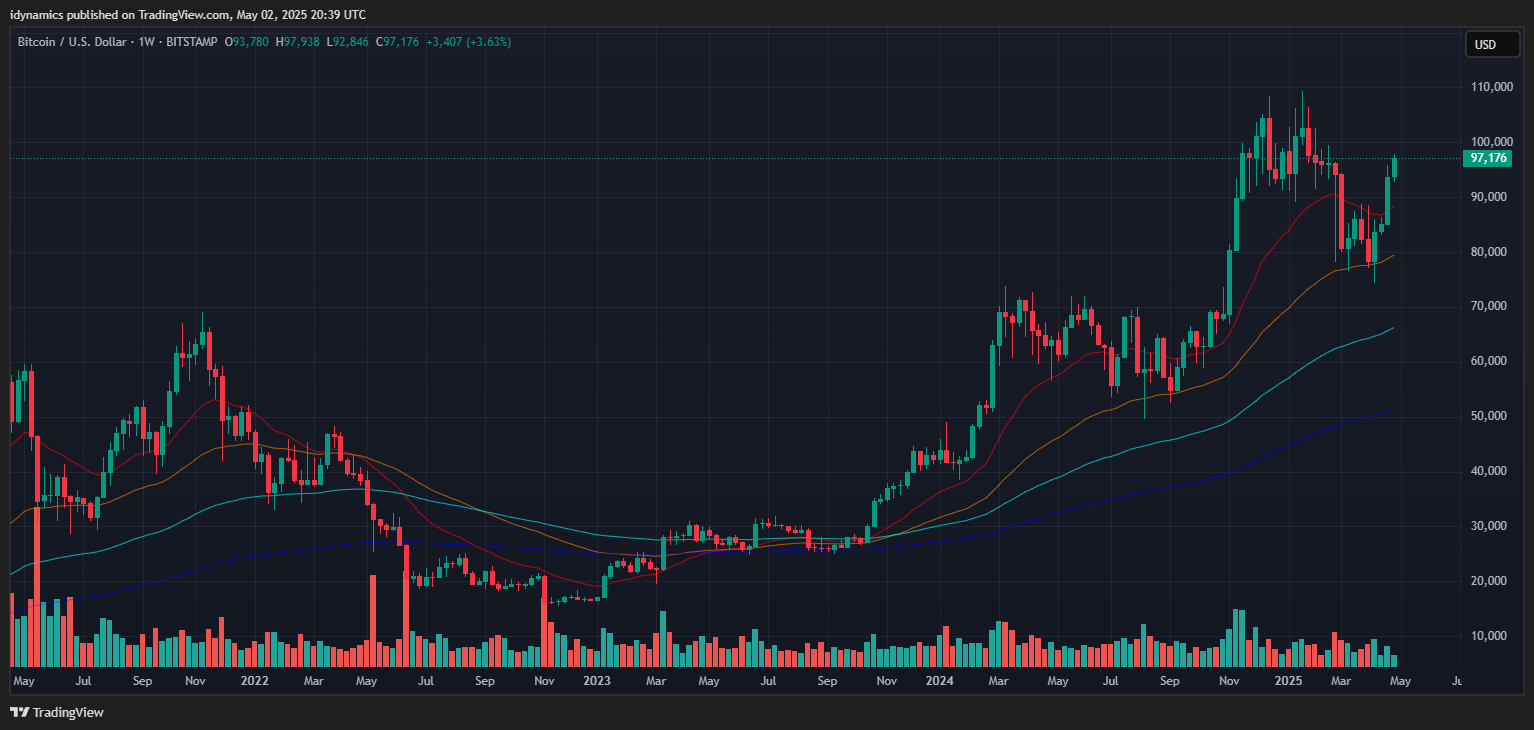
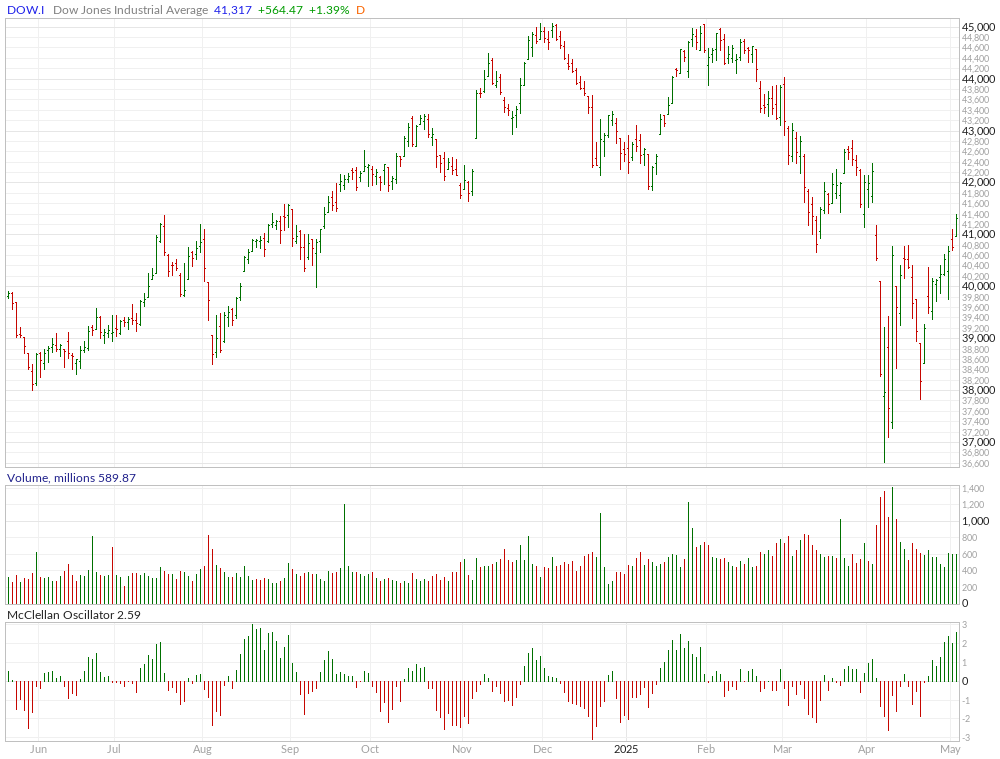
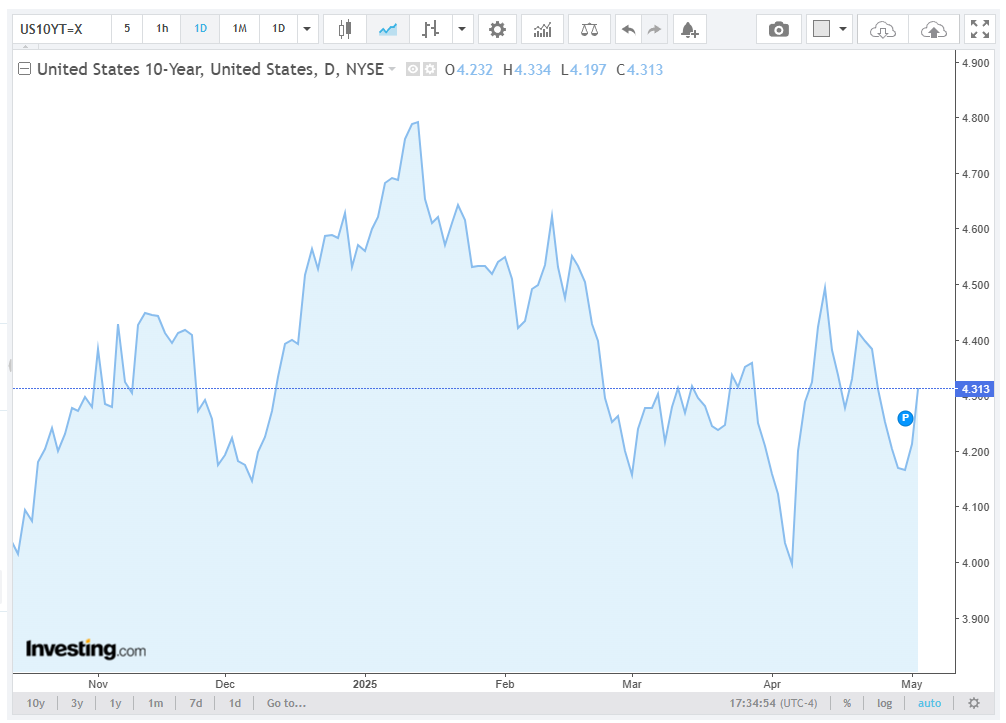
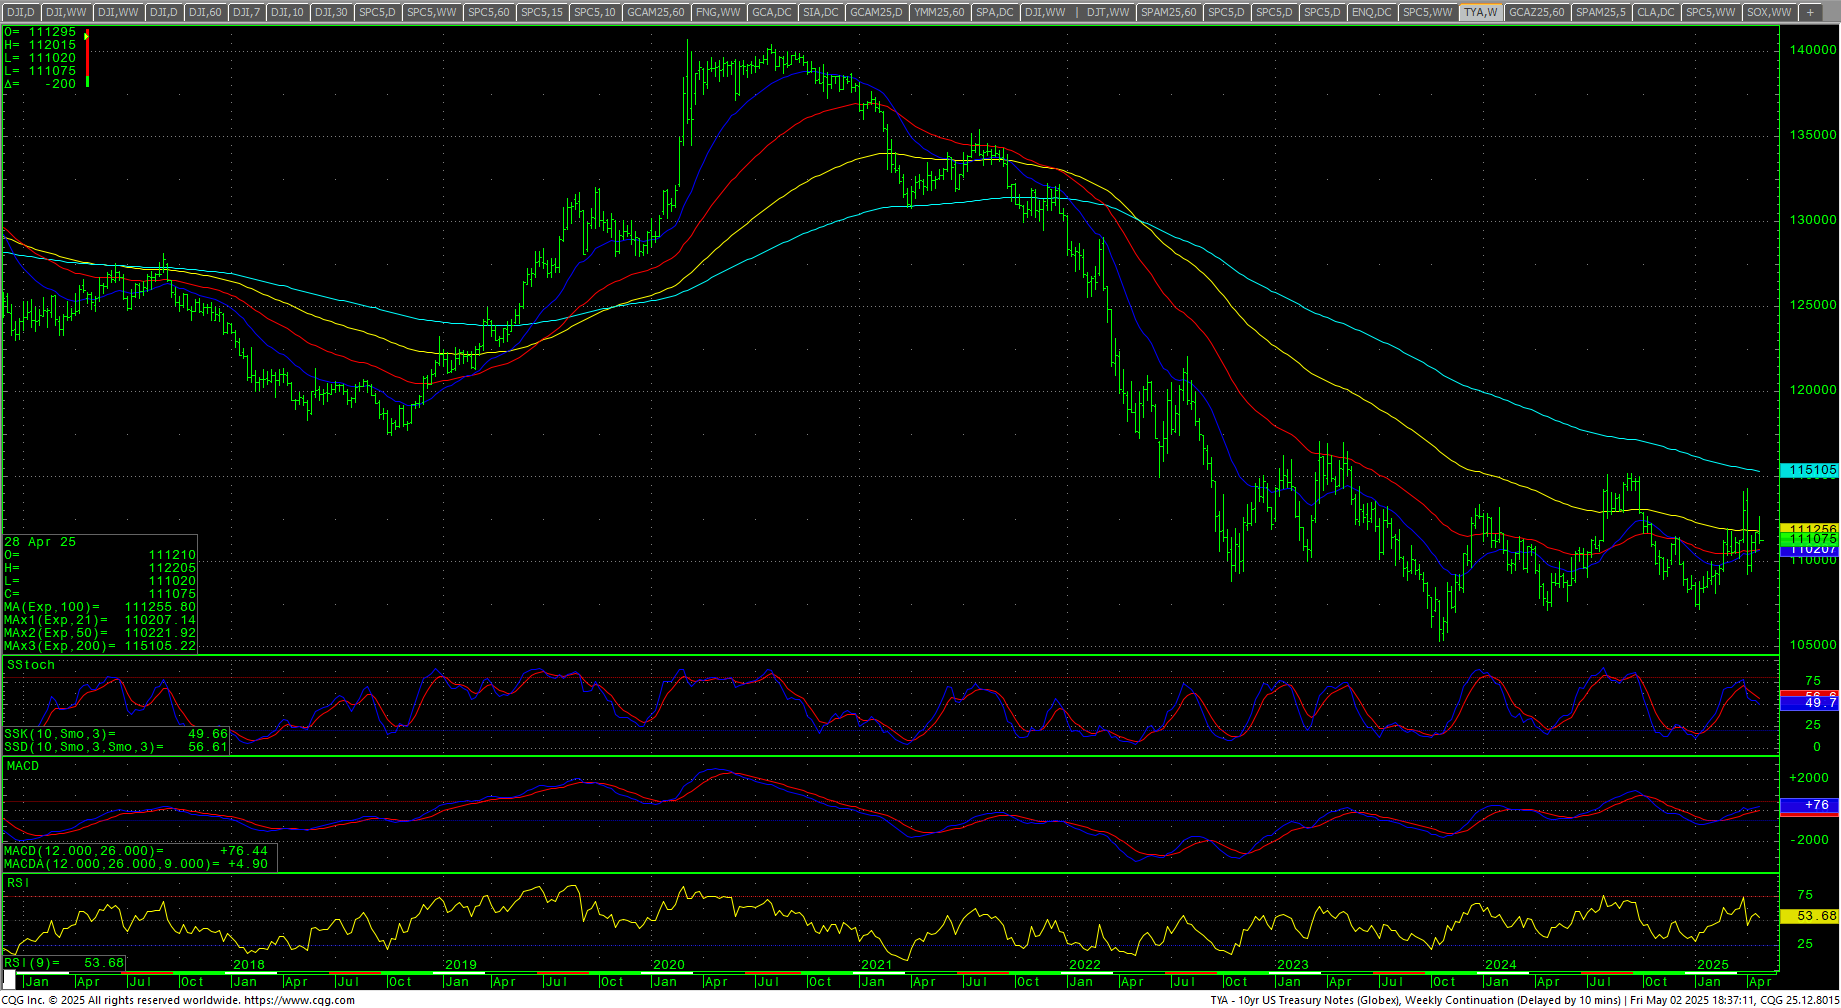
The RSP:SPY closed lower on the top of an inside week’s range. The IWM closed up +6.36% on the week on top of a bullish candle and has critical resistance just overhead. The RSP traded a bullish and ended at the top of the range, up +2.36%. NVDA closed on the top end of weekly the range, ending up +3.14%…this stock remains the darling of the retail crowd. Bitcoin soared to new highs, closing up +3.31% on the week as it assaults the 100K level. McClellan Oscillators are confirming the rally in the Dow. The Yield Curve closed out the week higher +0.486%. The 10YR yield closed out the week higher at 4.313%. Truflation declined to 1.37%.
10YR-2YR Yield Curve Daily
 VIX Weekly Candles
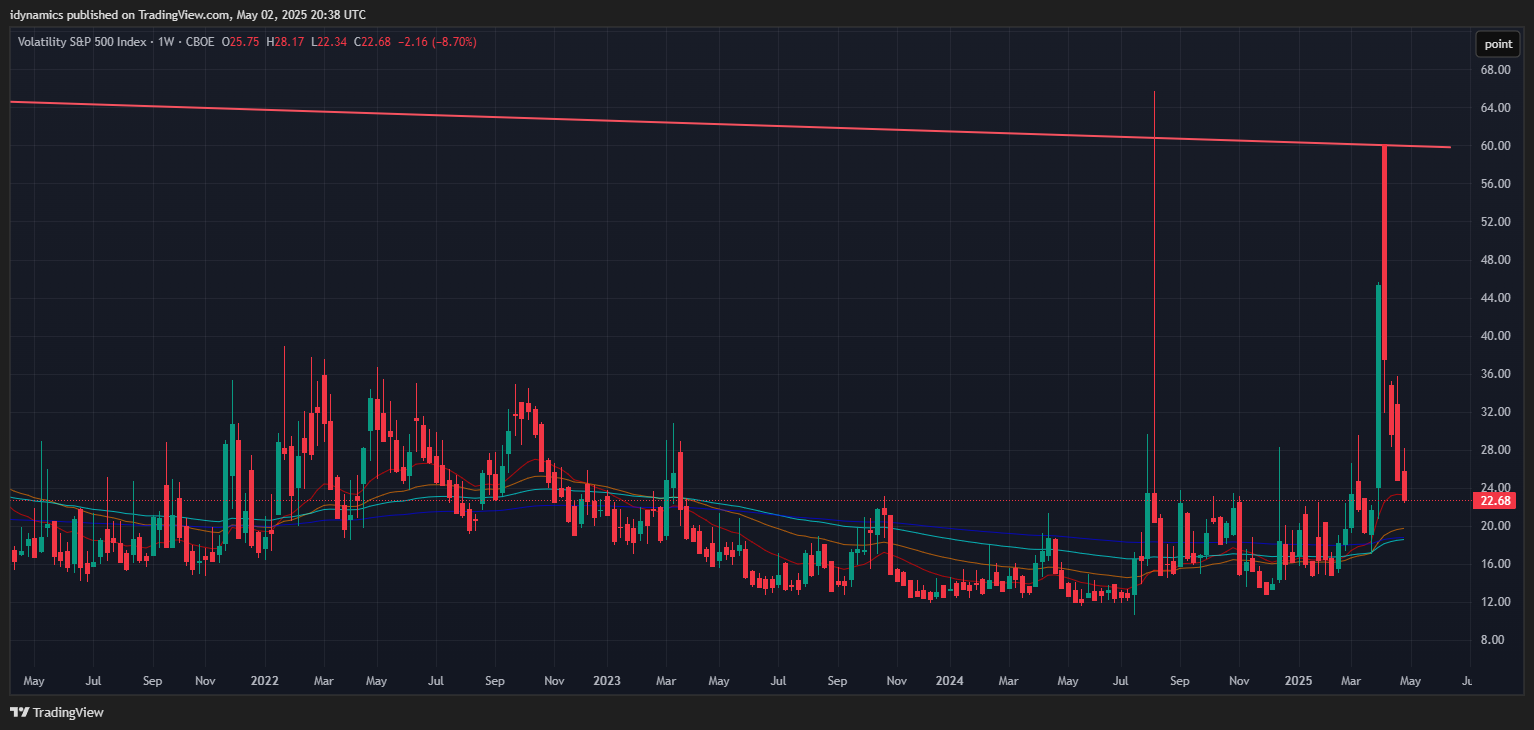
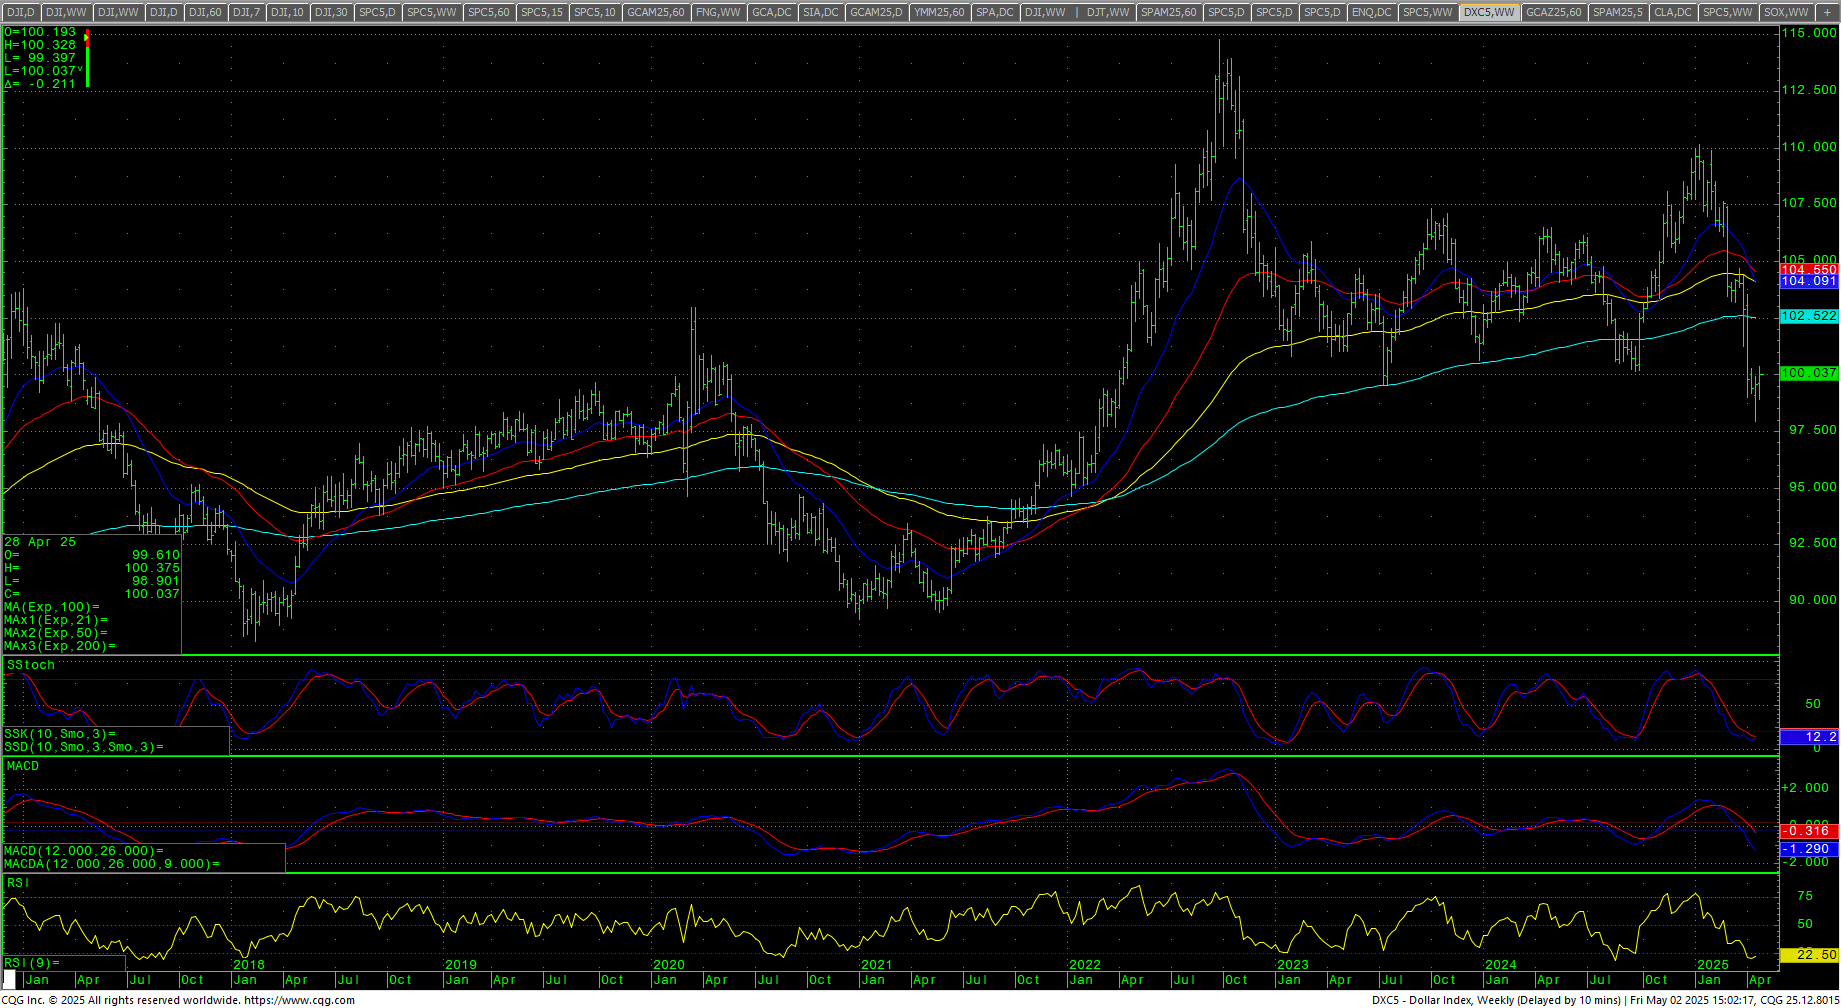
The VIX declined and closed at the weekly low as is retests the 20 level. The US Dollar closed the week higher, just above the 100 level.
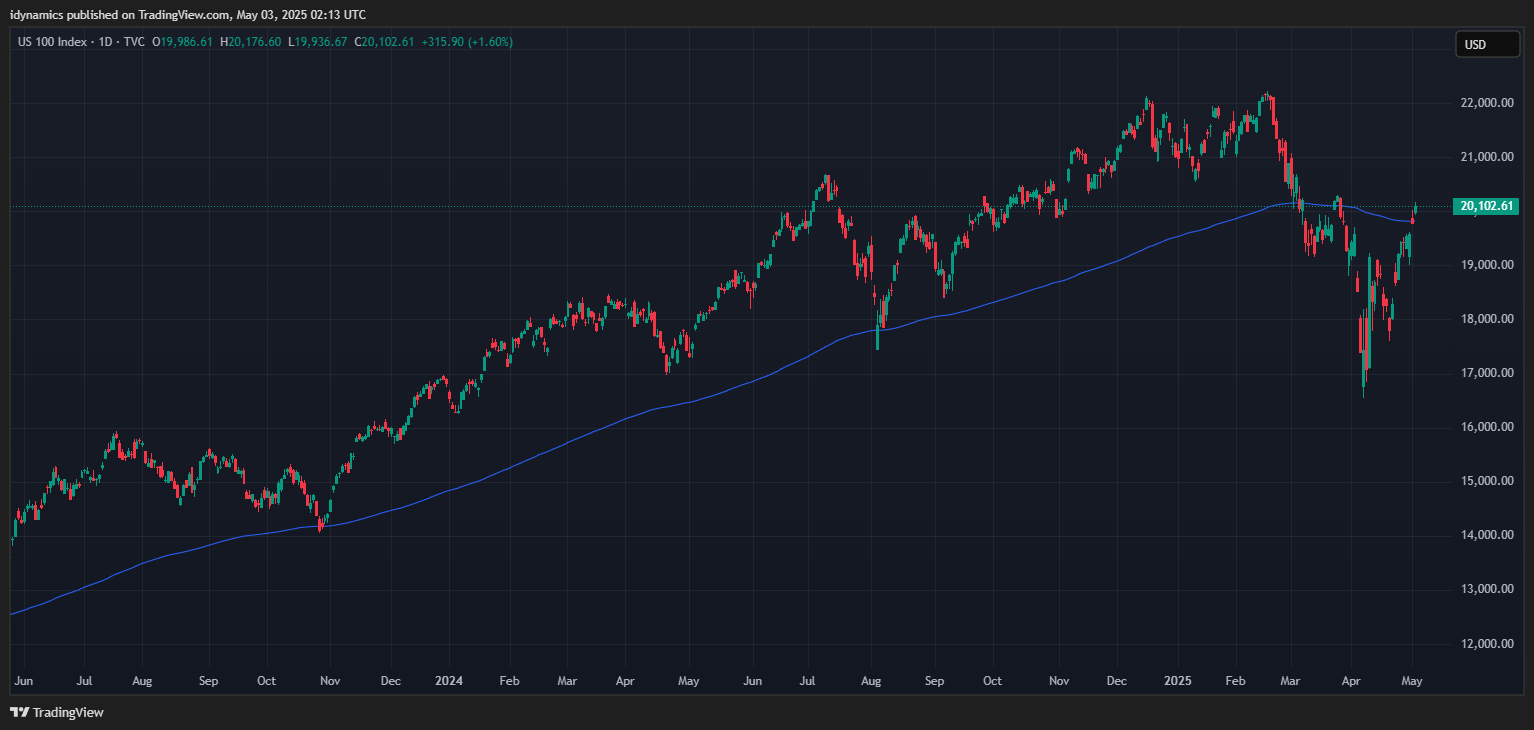
 Nasdaq 100 Daily Candles
Breadth A/D Line
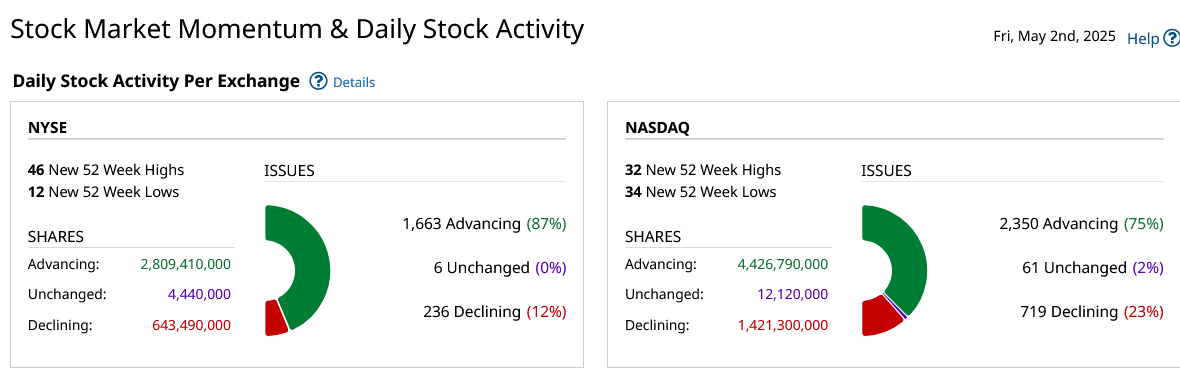
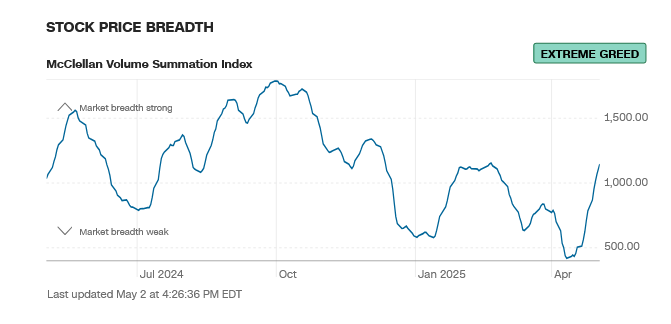
Breadth staged a big move to the highest levels since the mid-February and sentiment now reads extreme greed.
CNN Fear & Greed Index
 AAII Investor Sentiment Survey
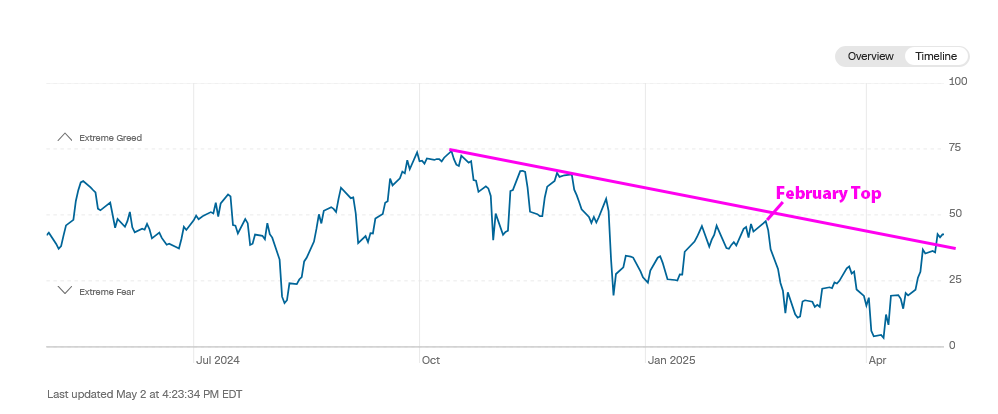
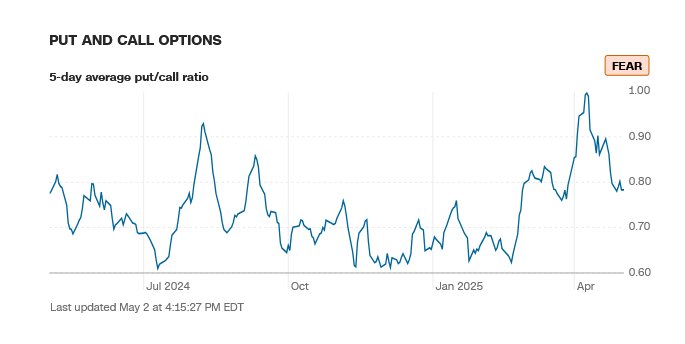
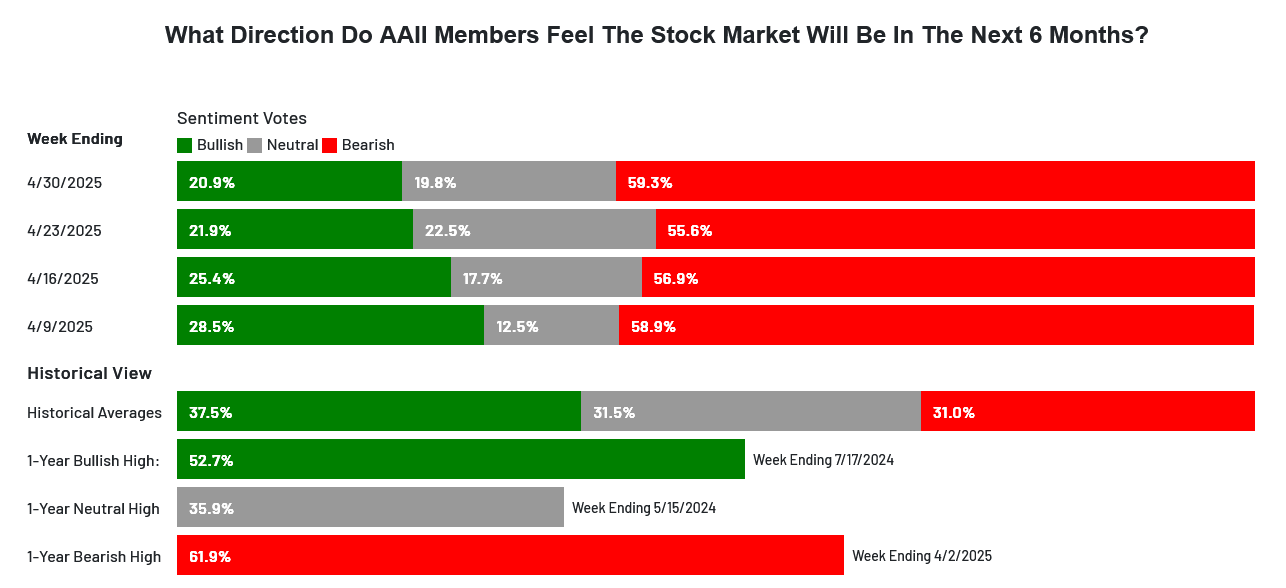 Sentiment moved to neutral, fear and extreme greed. The CNN Fear and Greed Index moved up to 43 and still reads fear, but has broken the trendline on the weekly. Breadth recovered substantially and reads extreme greed. Latest AAII Sentiment Survey: Pessimism Returns. The Dow A/D ended at 6827, this is a new record high…even with prices well off the records. The VIX sold off most of the week and closed on the lows, down -8.70% on the week. The Put/Call dropped to 0.78 and reads fear. The 52-week, A/D moved up to -5.31% and still reads extreme fear. The Dow closed the week up +3.00%, closing on the top of a the range. The S&P surged +2.92% on the top of the week’s range. The Nasdaq Composite was up +3.42% and the Nasdaq 100 was up +3.45%. The FANG led the way again, closing up +4.13%. The Russell was up +3.22%, posting the 4th weekly gain in a row. The 10-year notes reversed lower and closed at the bottom of the weekly range. The yield on the 10YR increased to 4.313%.
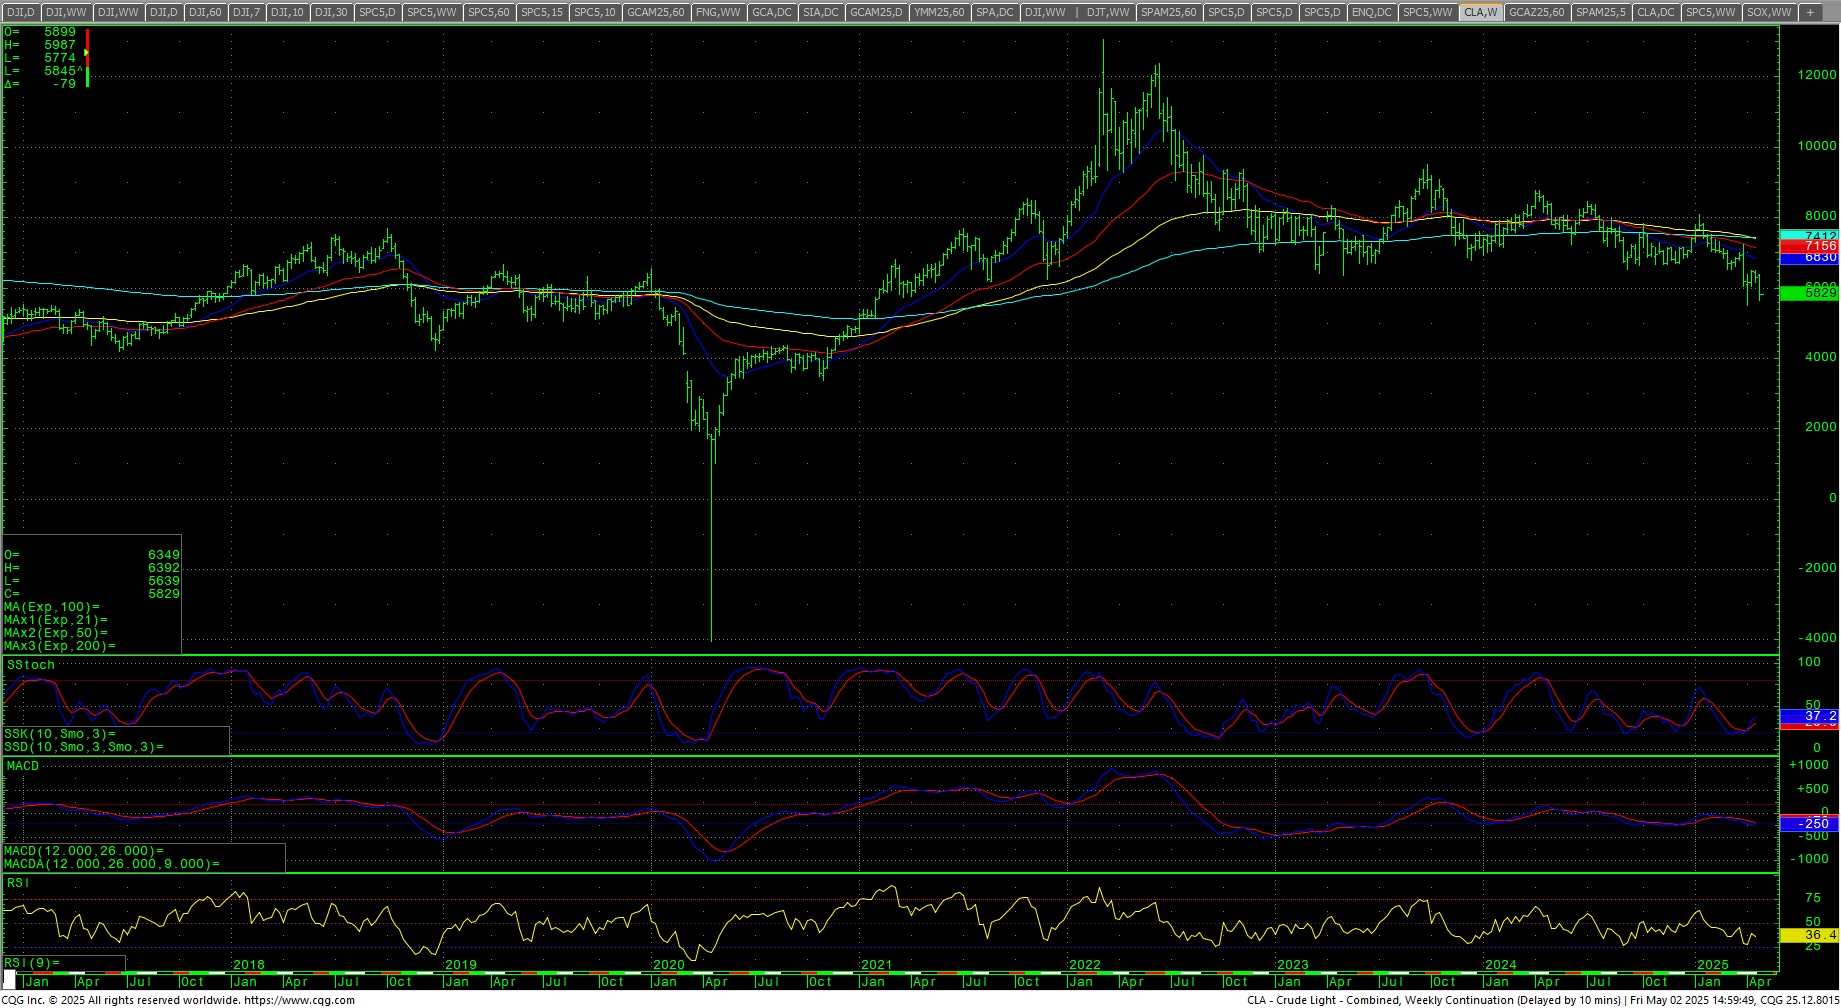
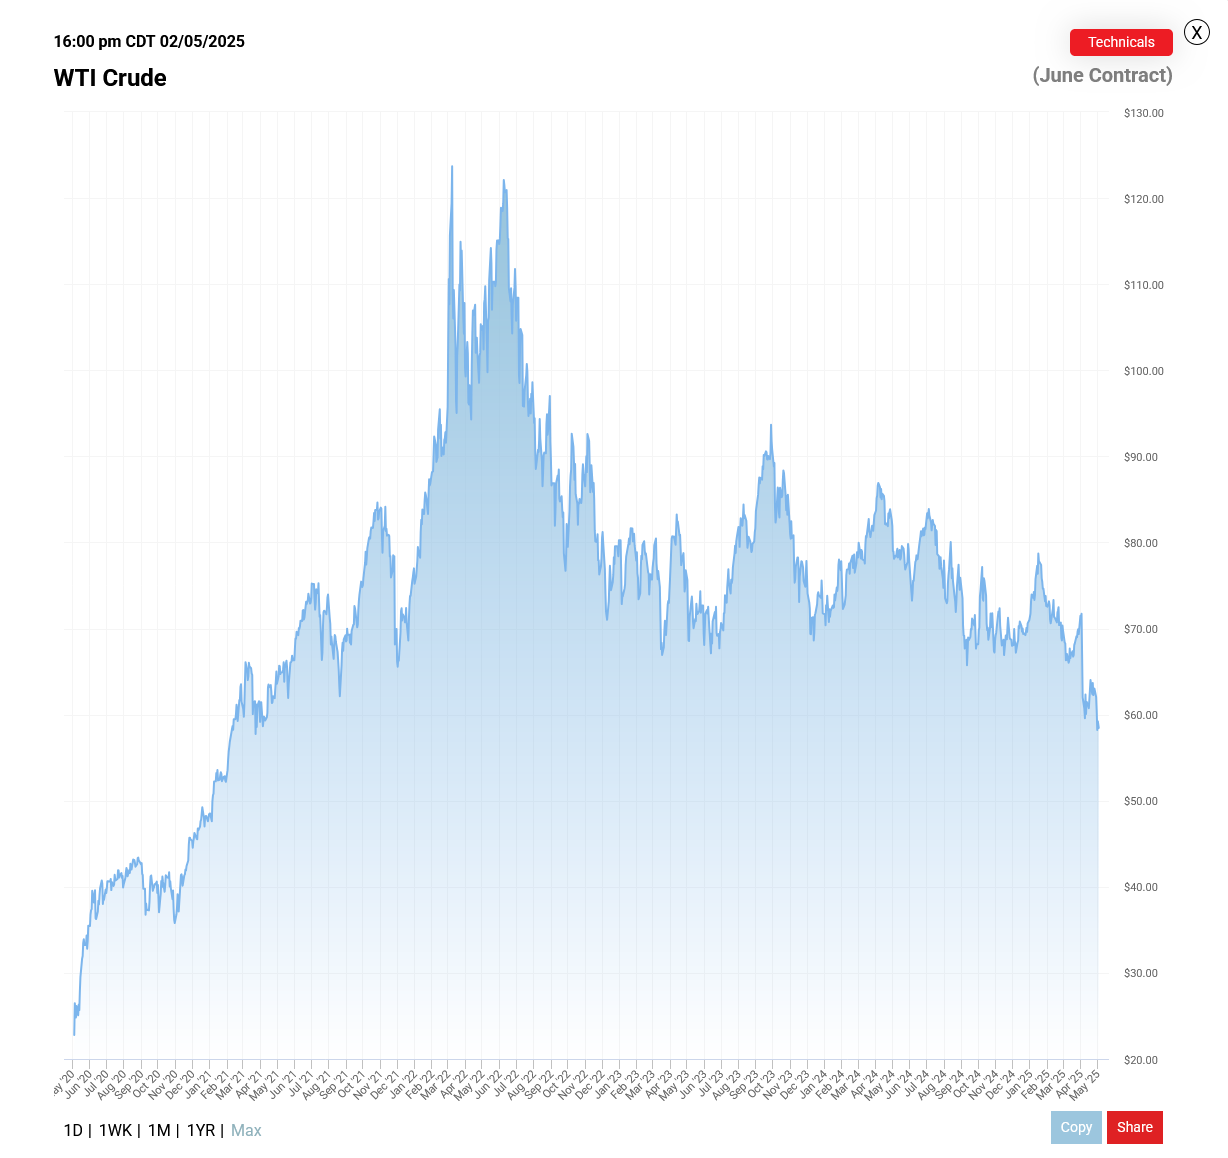
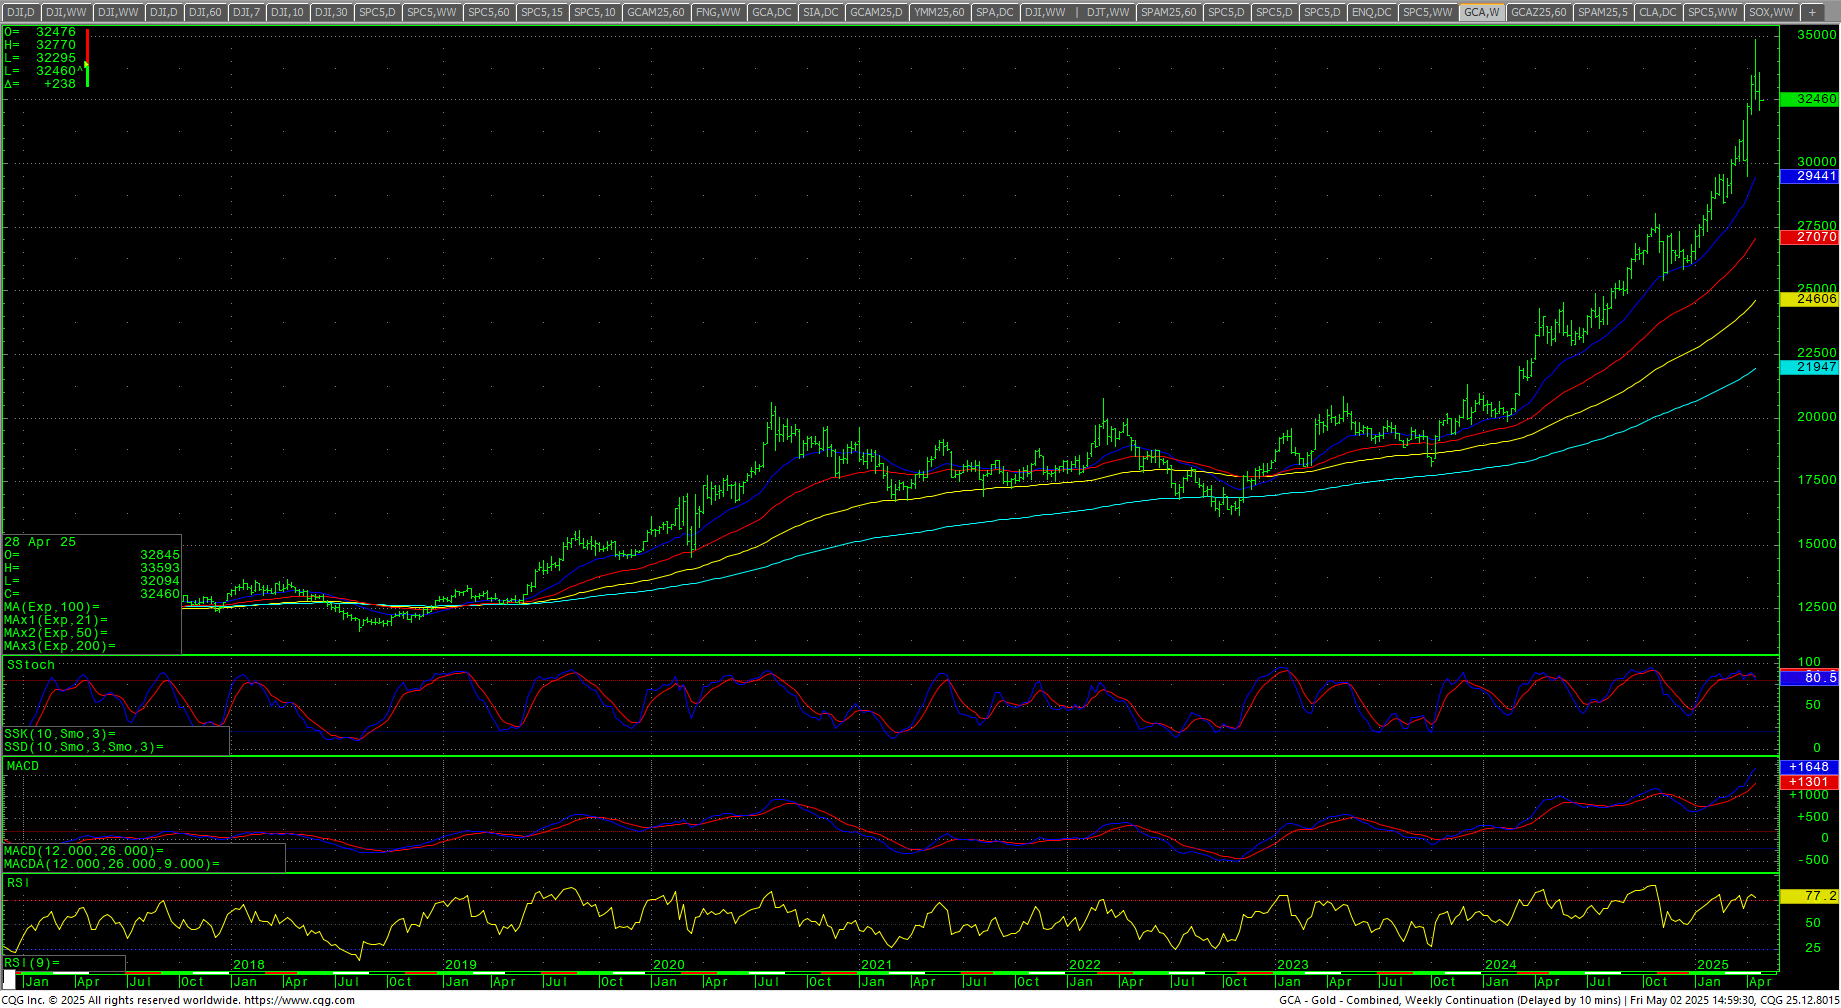
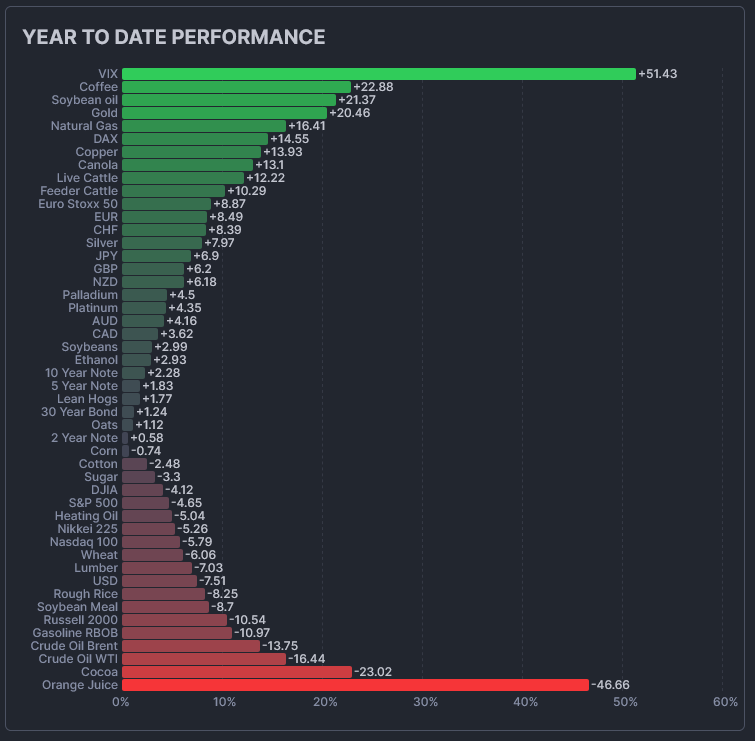 The CRB Index declined sharply, closing down -2.72%. Crude oil closed lower as spot futures and WTI Crude ended under the critical $60 level at the lowest weekly close since early 2021. Gold closed the week lower as prices continue to correct off the recent record highs at $3500. The CoT for the S&P 500 saw small specs and managed money declining. The CFTC S&P 500 Non-Commercial Net Positions dropped to -78.7K. It looks like there may still be traders willing to short the market here. Sellers have a 6 day window.
Timing Points
Thursday marks minor timing and the next critical date is 13 May 2025. Monday, we have final April PMI and ISM Services. Wednesday is the FOMC Meeting and the Powell press conference. 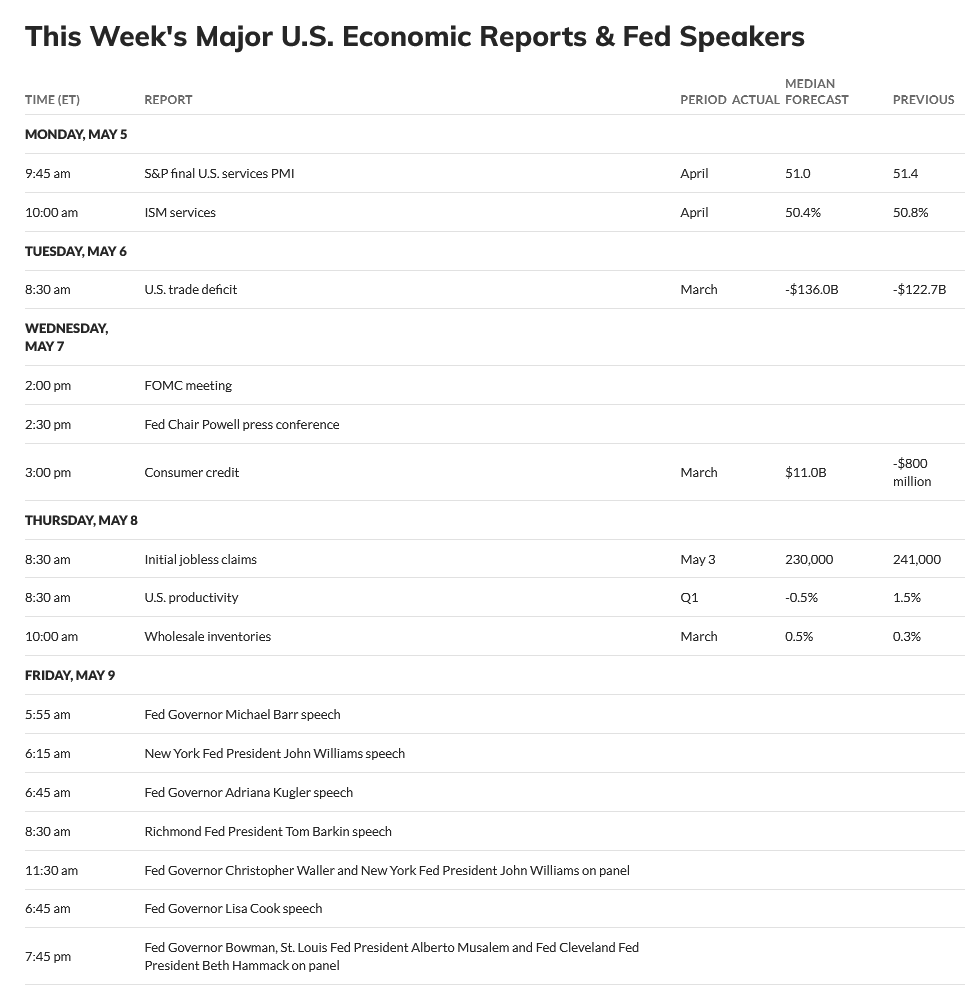
- 05/08 **
- 05/13 *** X critical, fast moves
- 05/20 **
- 05/29 *** X critical
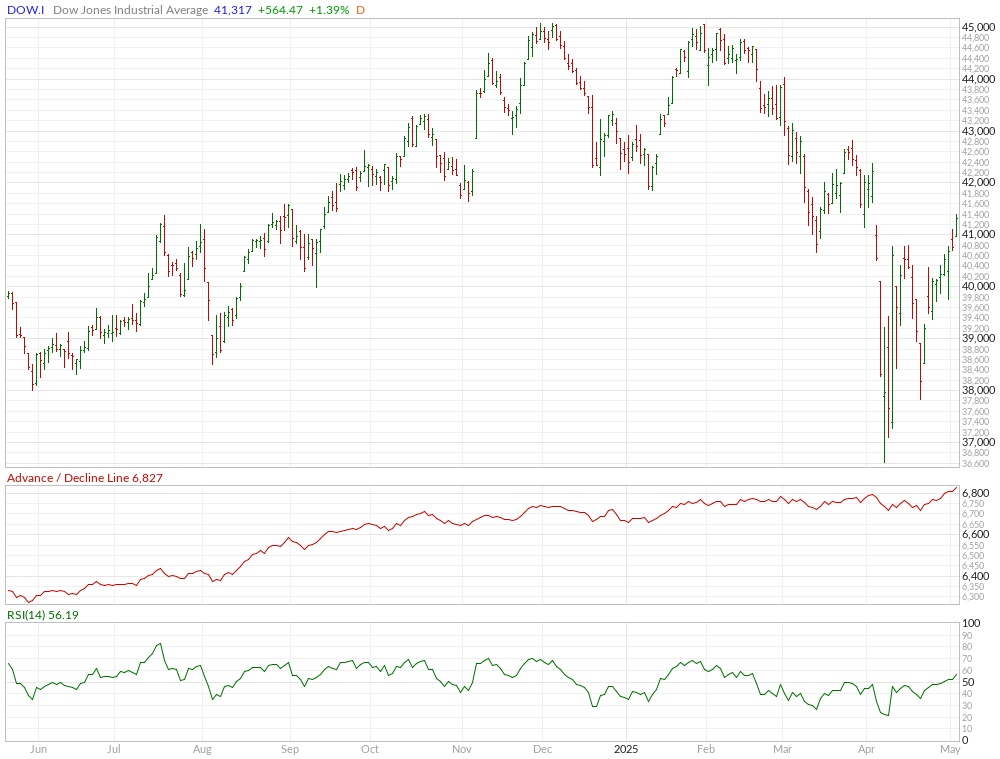
Dow Jones Industrial Average
Dow Jones Industrial Average Weekly H-L-C
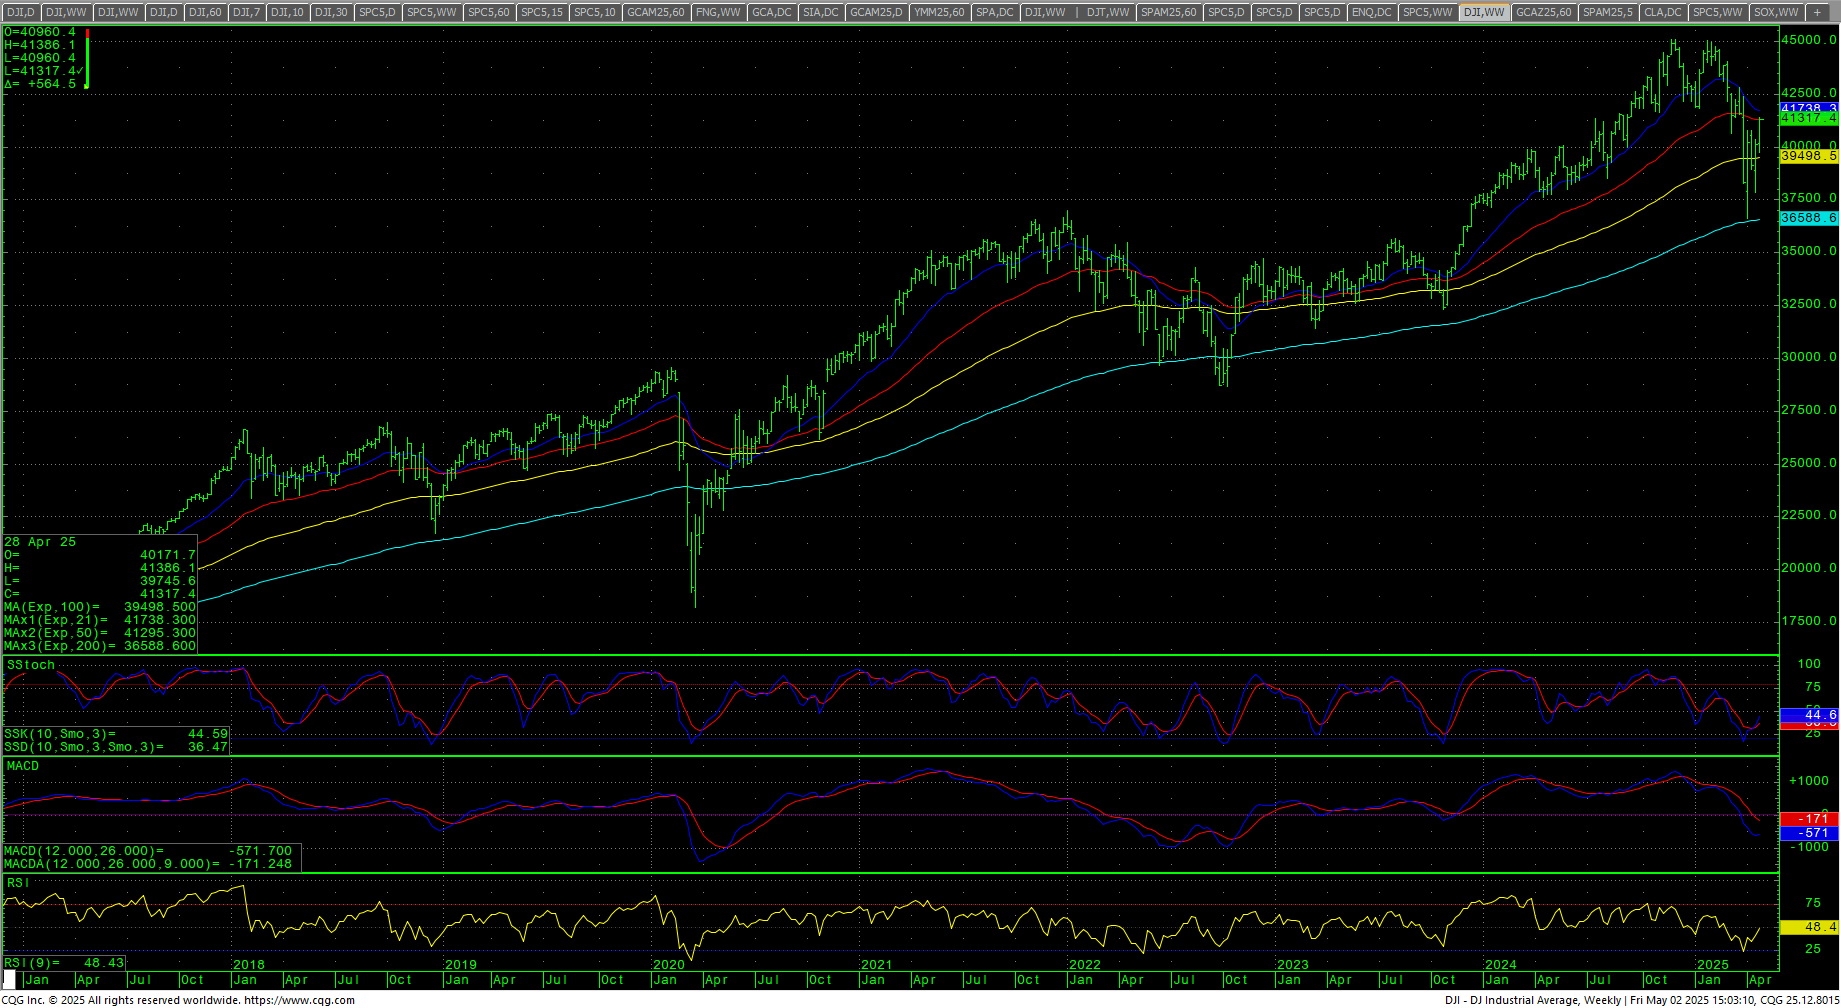 The Dow closed up +3.00% on the top of the weekly range. The daily reclaimed the 50-day MA and entered the huge gap area left on 3 April 2025, post Liberation Day. Both the daily stochastics and the MACD are up and the RSI is nearing overbought levels at 63.63. The daily still has a Death Cross on the moving averages but the 50 is slowing and micro-ticked higher on Friday. The weekly has hooked higher. Prices closed right into the “Death Zone” from the 26 March 2025 high to the 7 April 2025 low. That zone is 41269 through 41356. The 200-day MA starts the week at 41591 and is trending lower. The gap on 2 April 2025 is at 41629.7.
Resistance remains at critical in this Death Zone level through 41356 area. Daily closes above 41356 should minimally test critical resistance at 41829/41835 with gap resistance at 41629/41630. Closes over 41835 opens counts to 42822 and 42943 through 43061. A breakout above 43061 sets up a retest of the record highs at 45050/45054 with key resistance at 44033/44034.
Dow Jones Industrial Average Hourly H-L-C
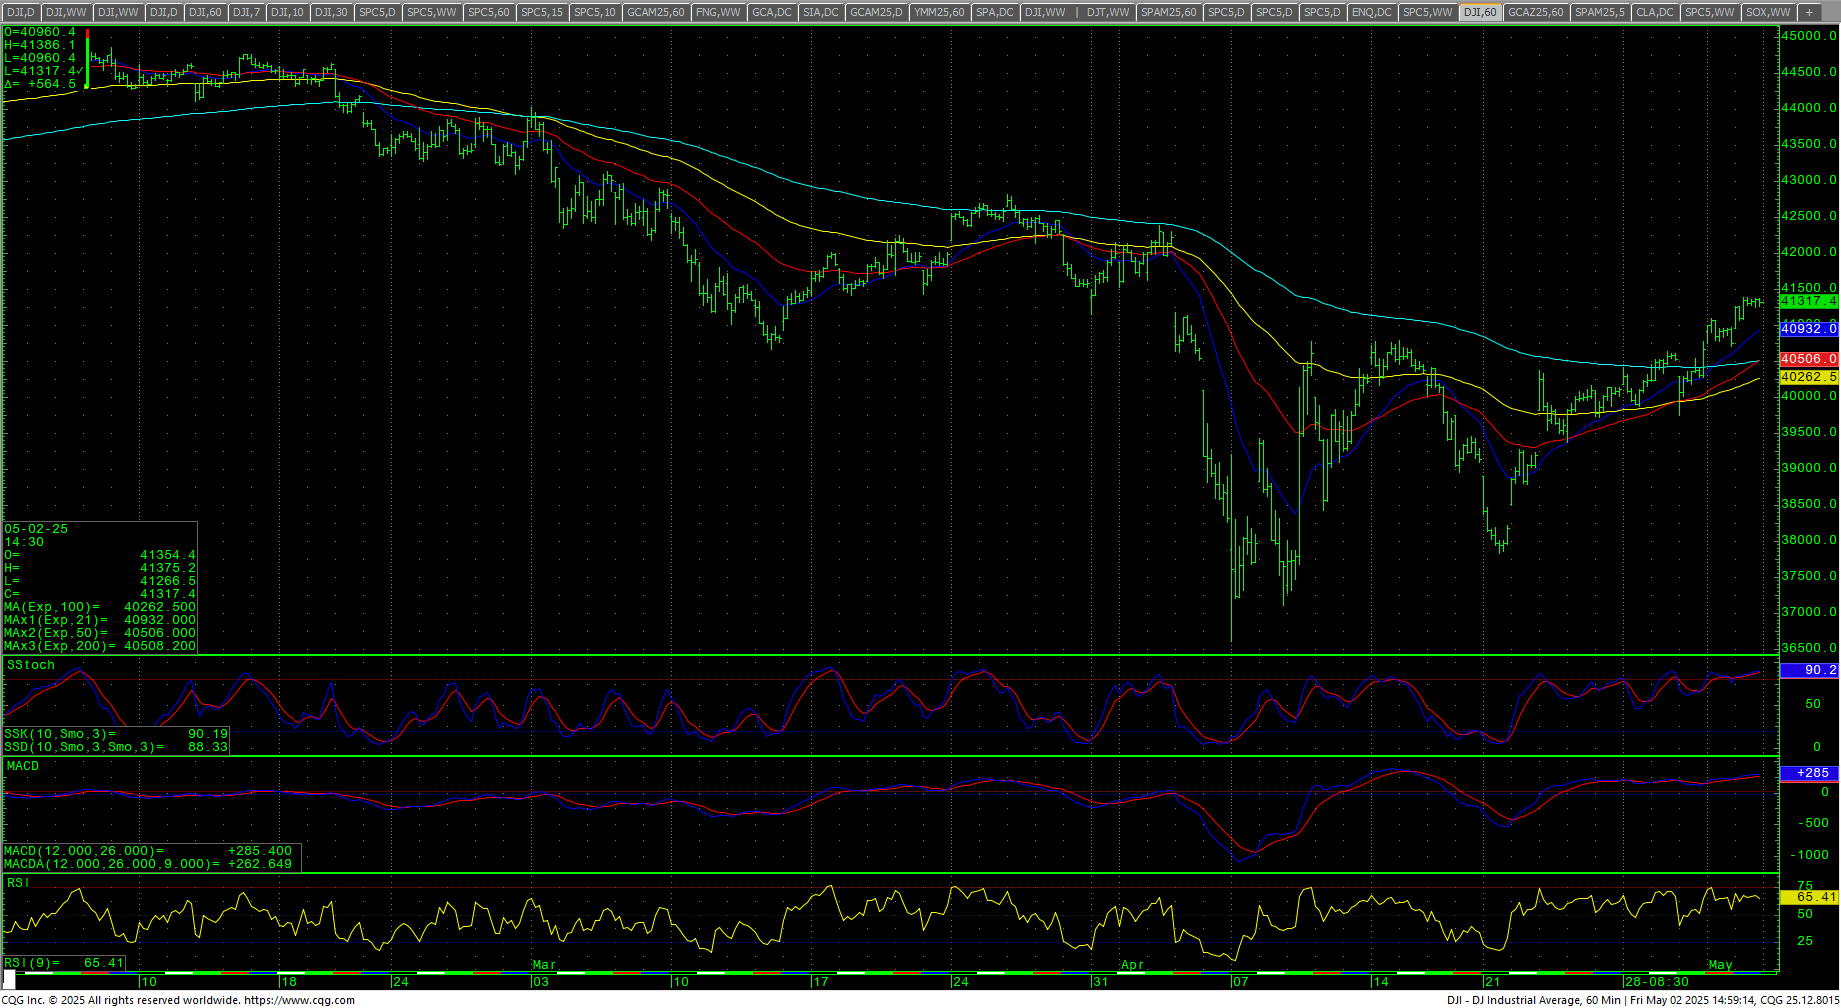 The hourly is extremely overbought on Friday’s close. Support is at 40995 and 40756. A breakdown under 40756 can test 40563 with counts to pivotal near-term support at 40370/40365. A breakdown under 40365 sets up 40154/40132 with pivotal support against the 40025 area. Closes under 40025 are bearish for a test of 39606 through 39562 with full counts into key support at 38998. Support is critical against the 38435/38430 level and closes below that support should minimally test 37805 through 37738 and would open counts to retest the 36611 low with support at 37103.
| Resistance | Support |
|
|
S&P 500 Cash Index: SPX
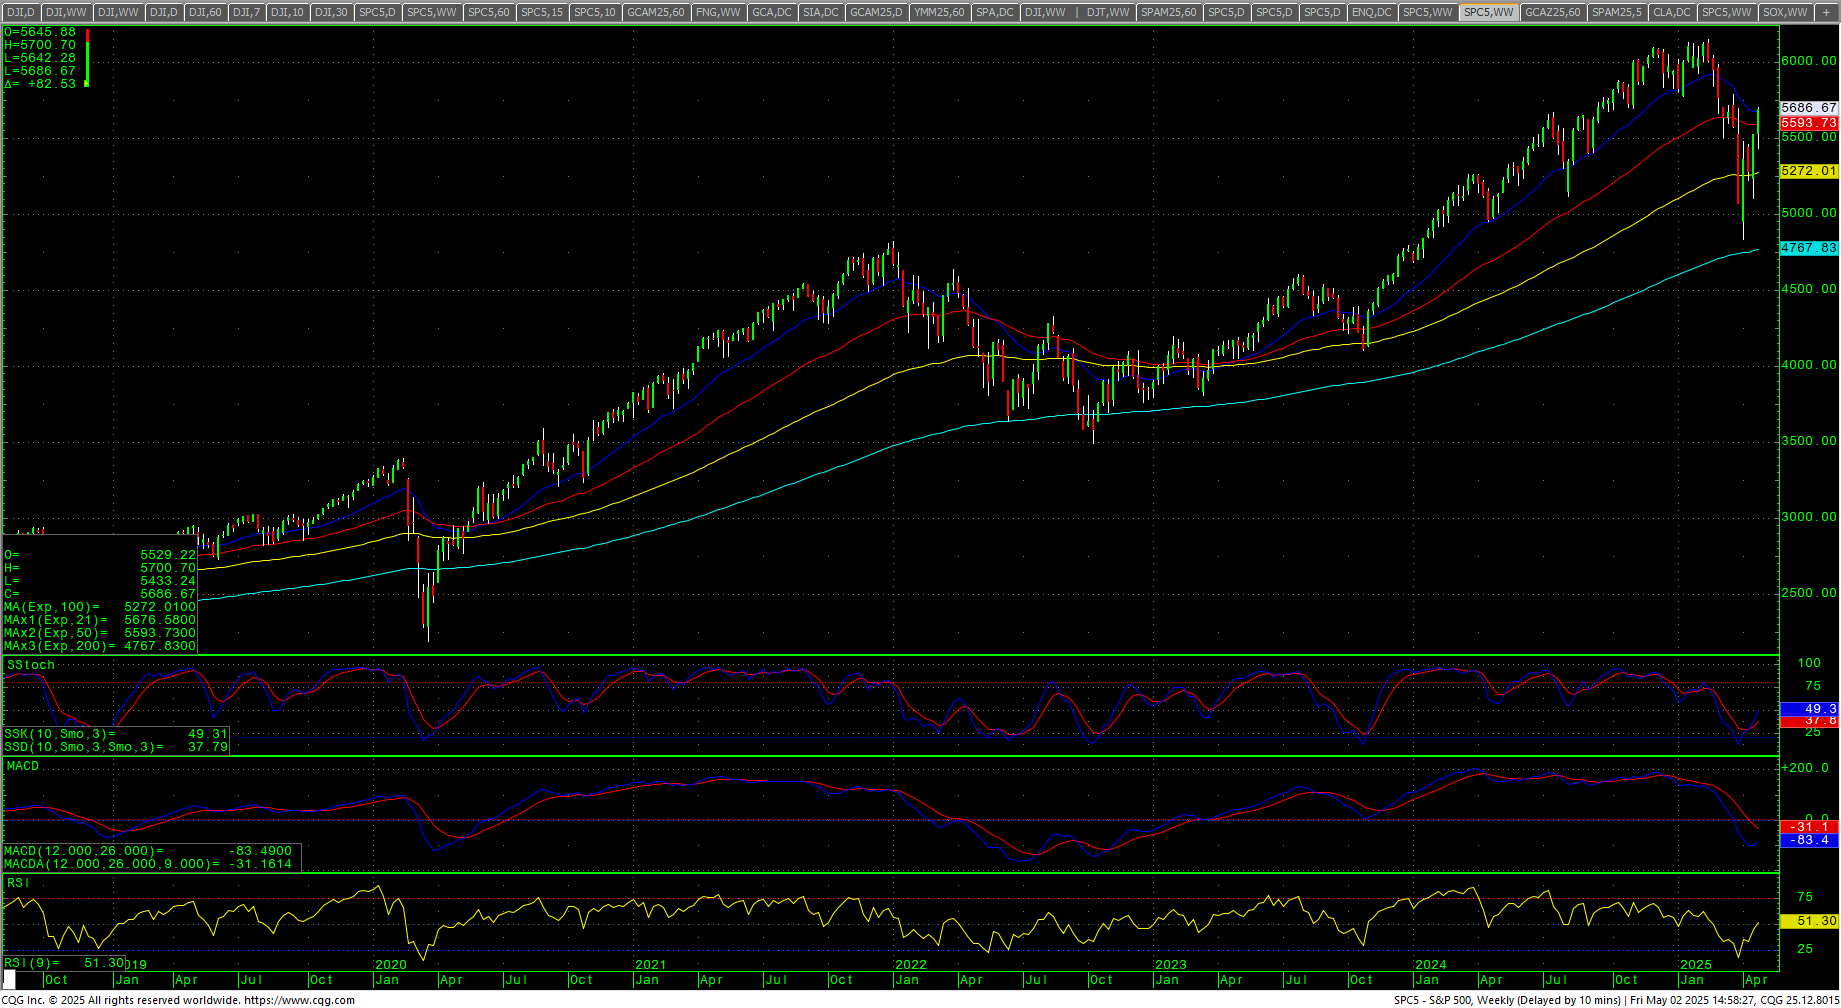
S&P 500 Index Weekly H-L-C
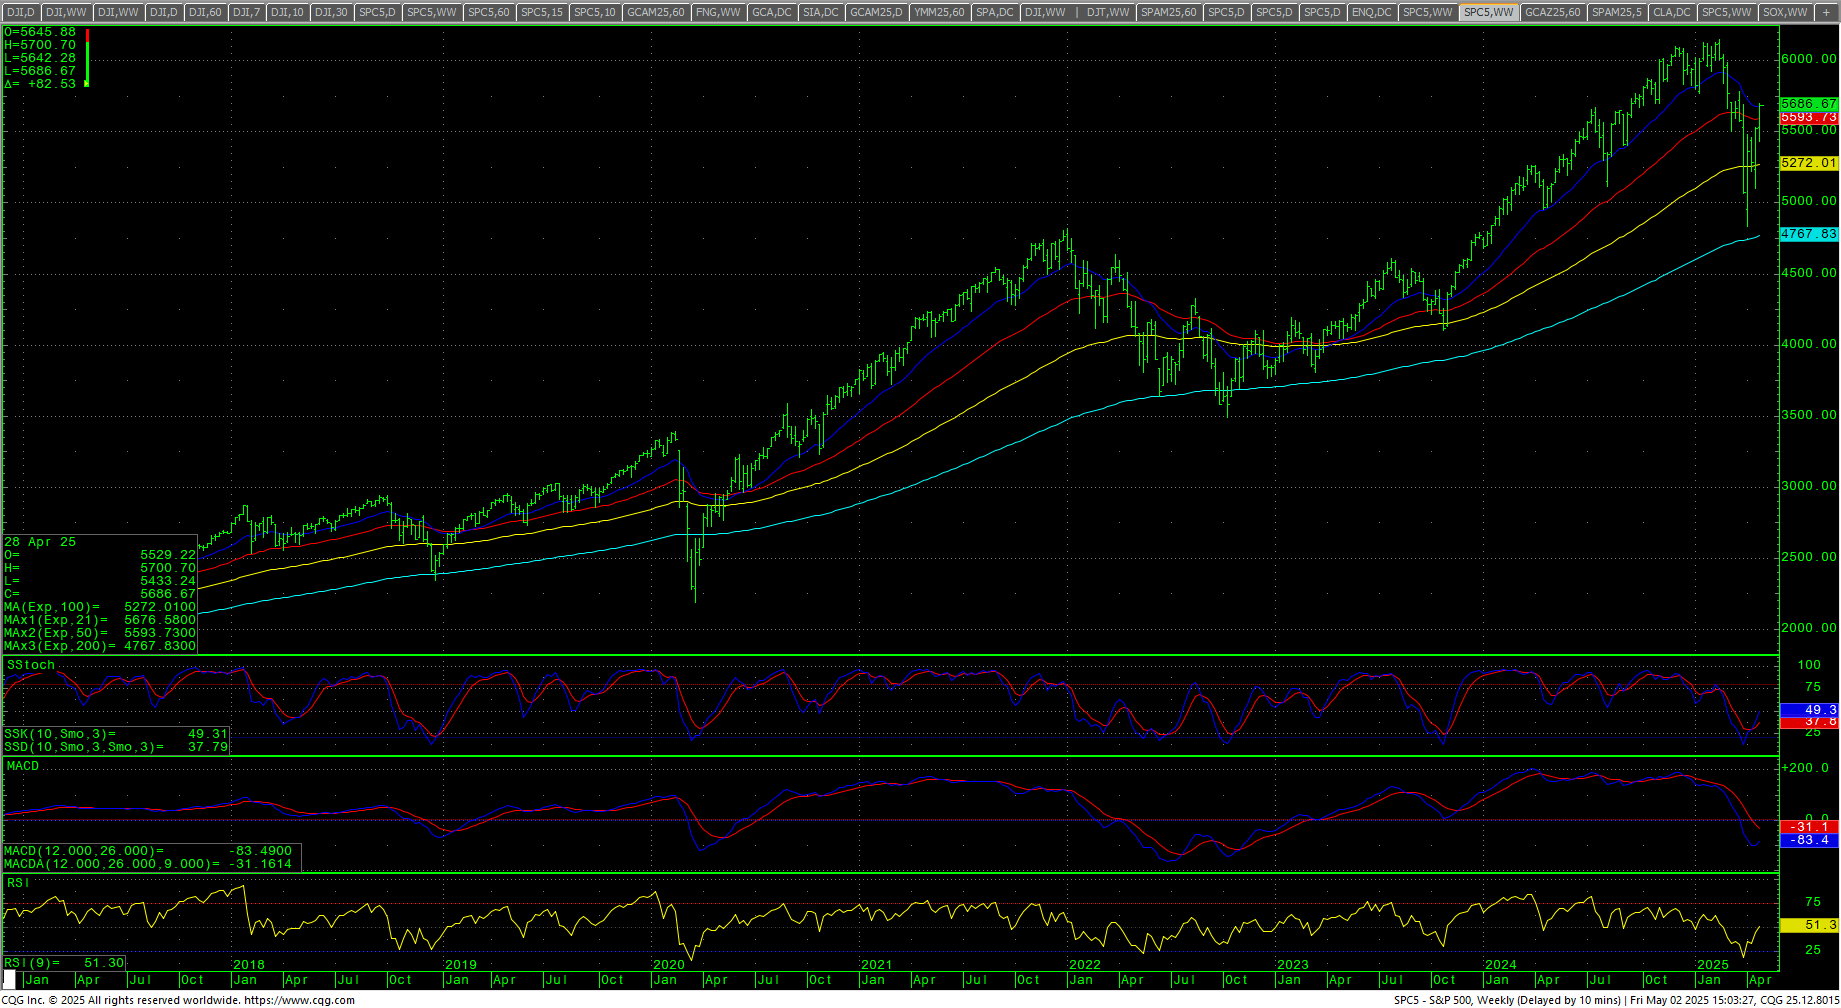 The S&P closed the week up sharply on the high of the weekly range, up +2.92%. The market has retraced the entire decline now from “Liberation Day” and is up +0.28% from the close 2 April 2025. The daily still has a Death Cross and has reached overbought conditions as prices have reclaimed both the 50-day MA and the 200-day MA. RSI is near overbought readings now at 67.90. The weekly has turned up from oversold conditions. The hourly is extremely overbought on Friday’s close. The 200-day MA is 5639.39 and is stalling out in its down trend.
S&P 500 (SPX) Weekly Candles
 SPY Weekly

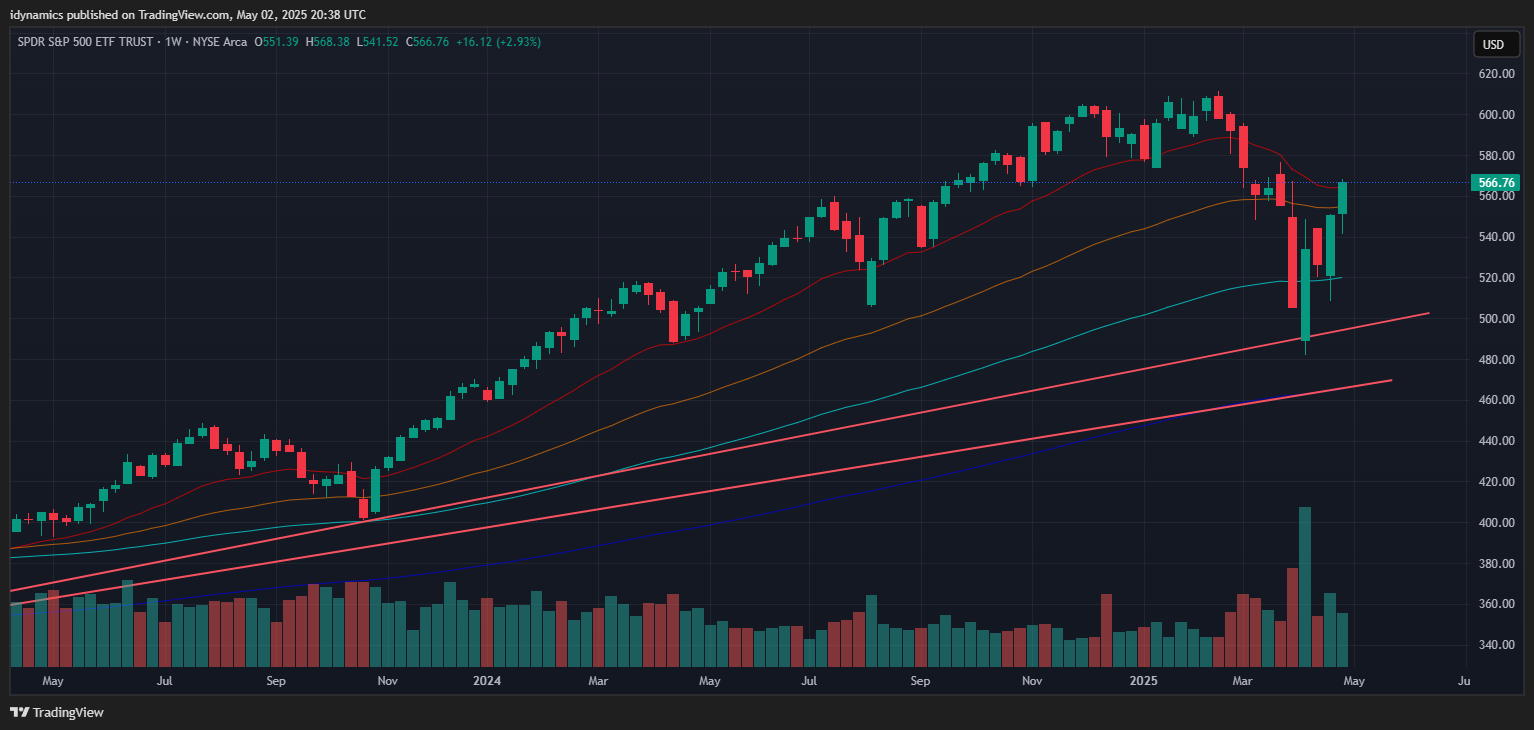 Further rallies with daily closes above 5650 should minimally test 5819/5837 with resistance at 5735/5740 and 5783/5787. A breakout over 5837 will open counts to 5986 with full potential to 6043 and opens counts to 6112/6114 and full counts into critical resistance at the intraday high of 6147.43. Rallies through 6148 should test 6160 with a shot at a target of 6180.35/6181. Closes over 6181 open counts to 6224 and 6296. Above 6296 can carry to 6368 with counts into the 6440 area. Closes over 6440 will open counts to 6584.
S&P 500 Index Hourly H-L-C
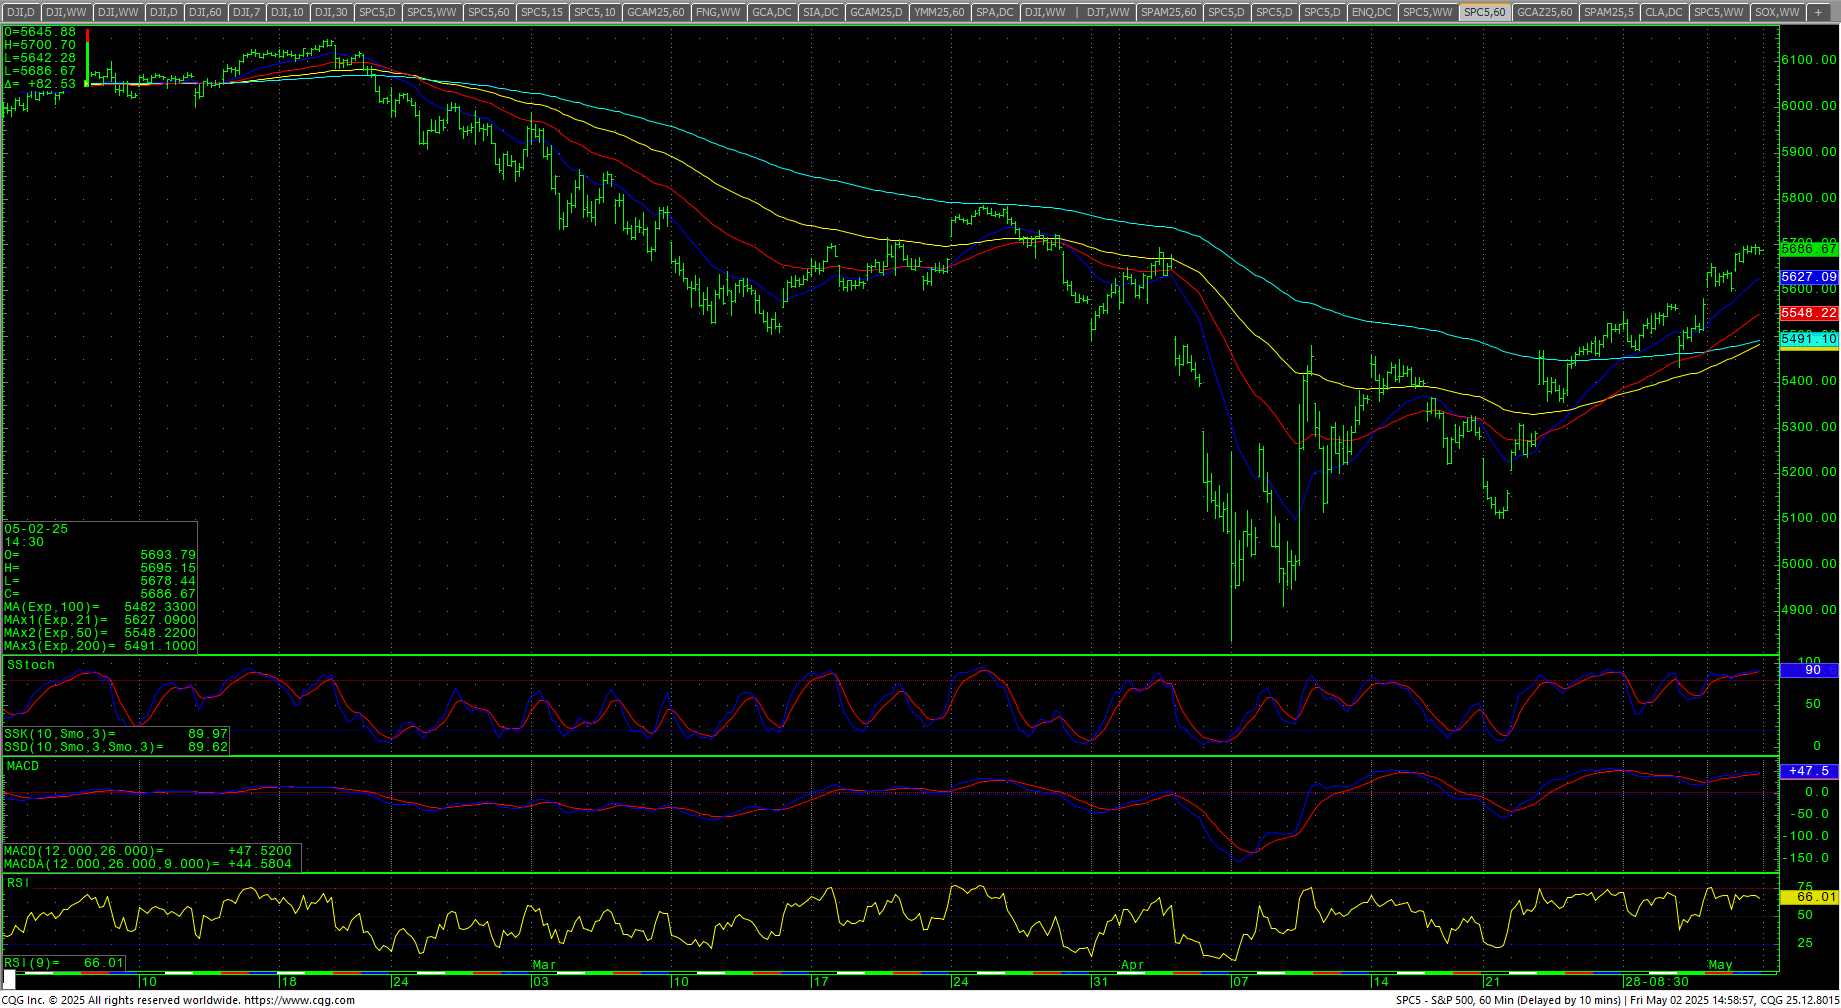 Support is 5642/5638 and 5600/5598. A breakdown under 5598 can test 5567 with counts to 5536/5533. Closes under 5533 suggest 5472/5470, 5401 and pivotal near-term support at 5330/5325. A breakdown under 5325 sets up 5251/5243 with potential to critical near-term support of 5165/5160. A breakdown under 5160 should minimally test 5051/5039 and opens intermediate-term counts for a retest of the 4835 swing lows with support still at 4884/4880. Closes under 4880 are bearish and open counts to 4614 through 4586.
| Resistance | Support |
|
|
Charts courtesy of CQG, Inc., CNN, Koyfin, Trading View and AAII