
TECHNICAL ANALYSIS (by Intraday Dynamics)
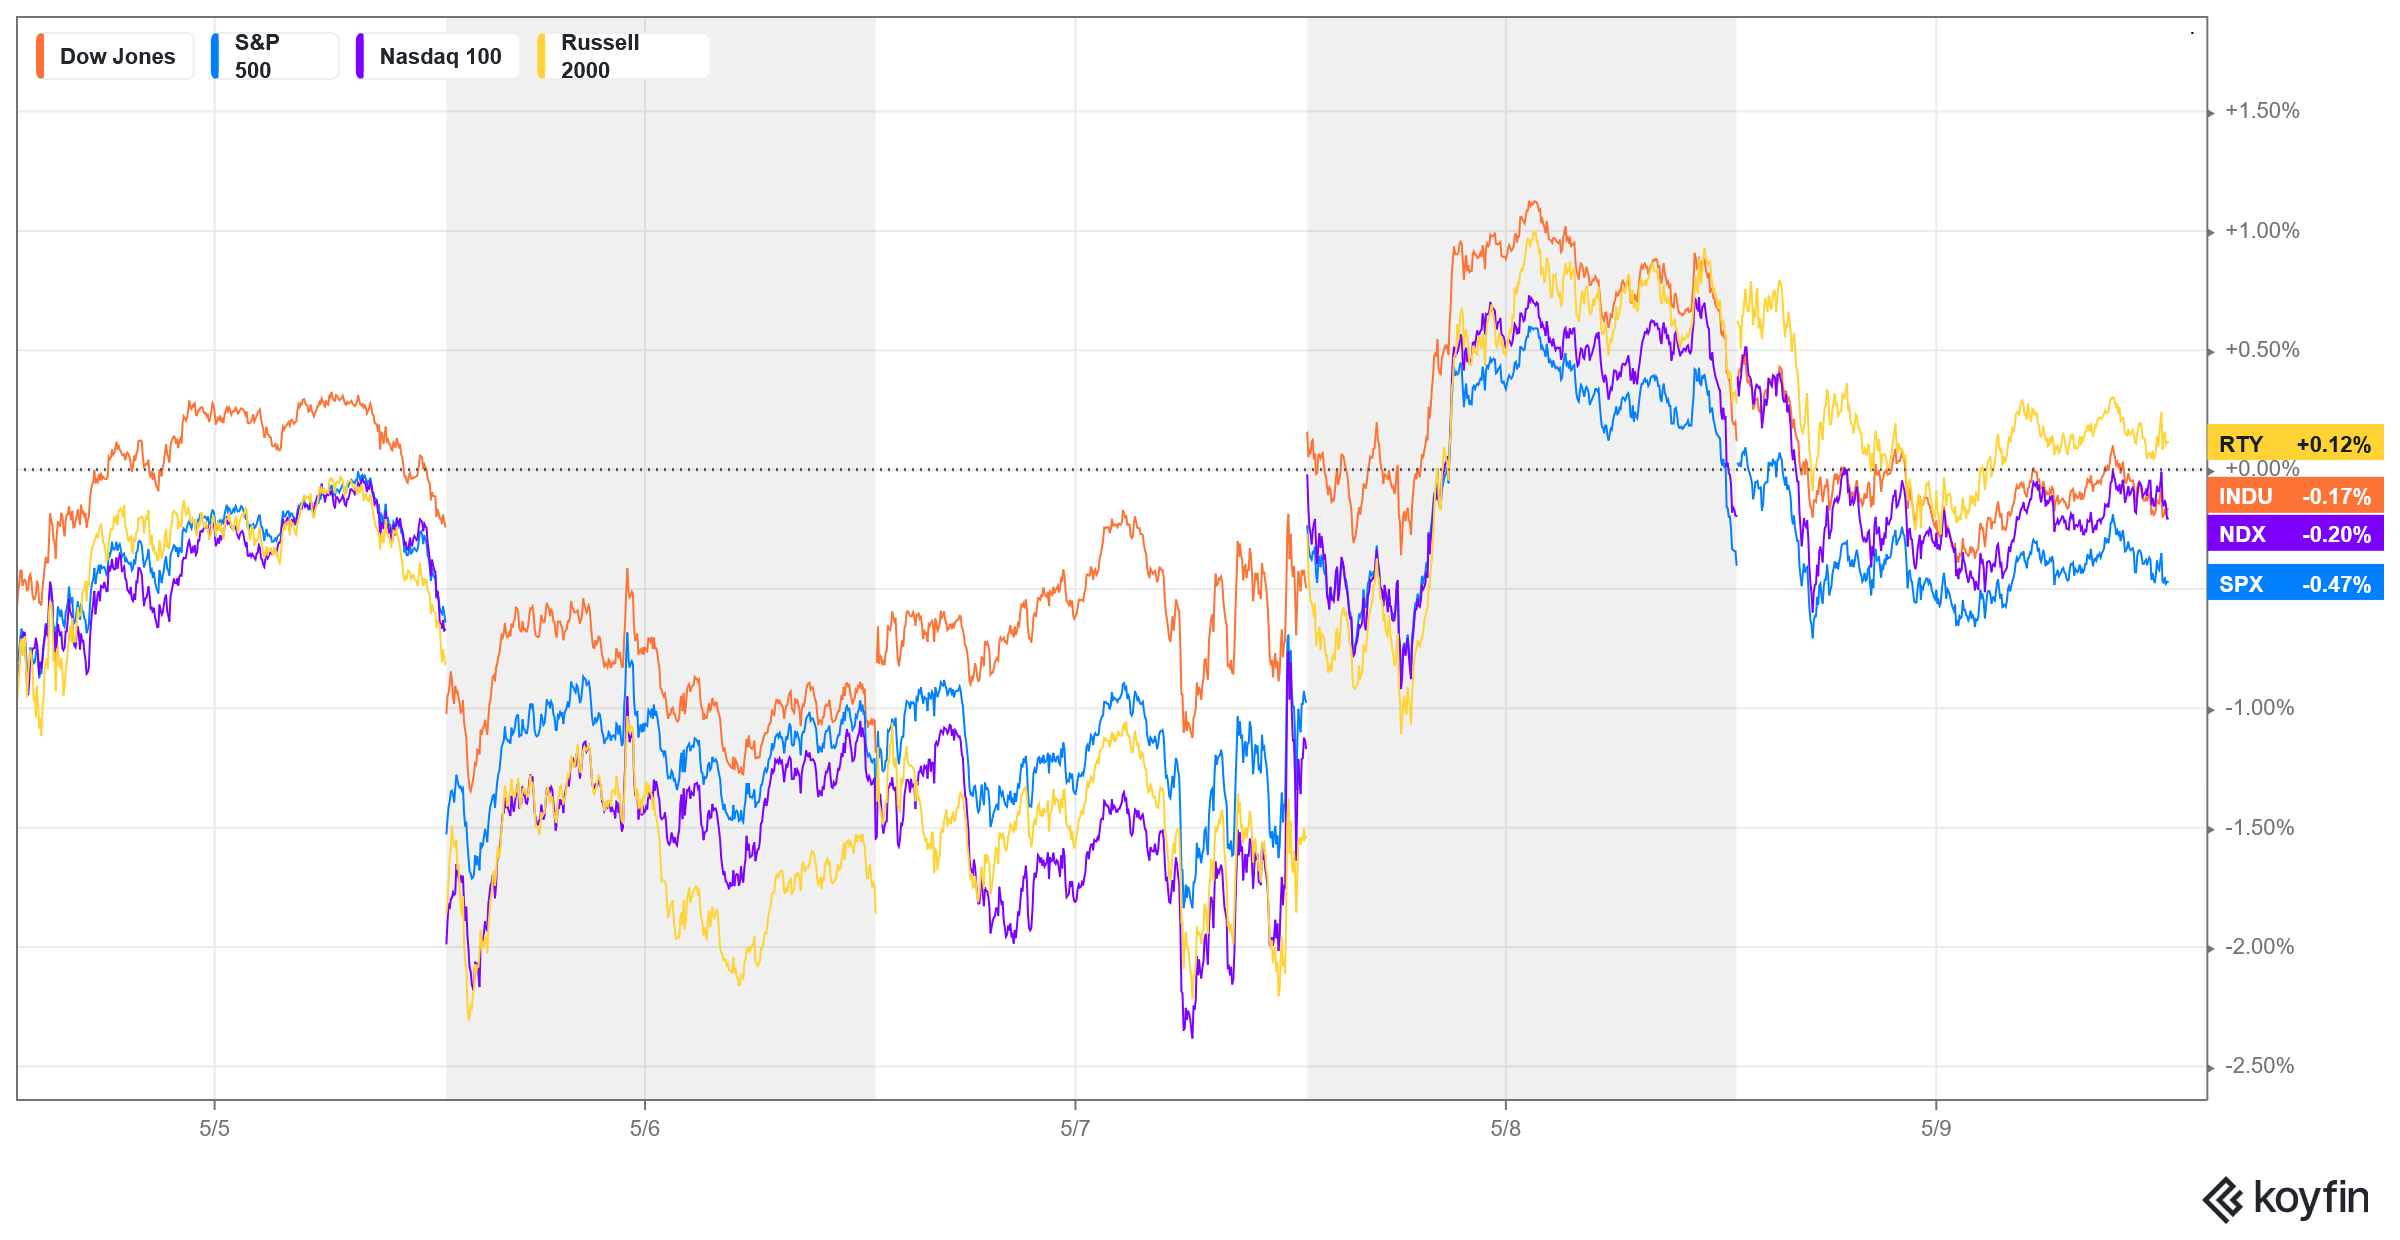
Major Indices Week of May 9, 2025
 NYSE Volume

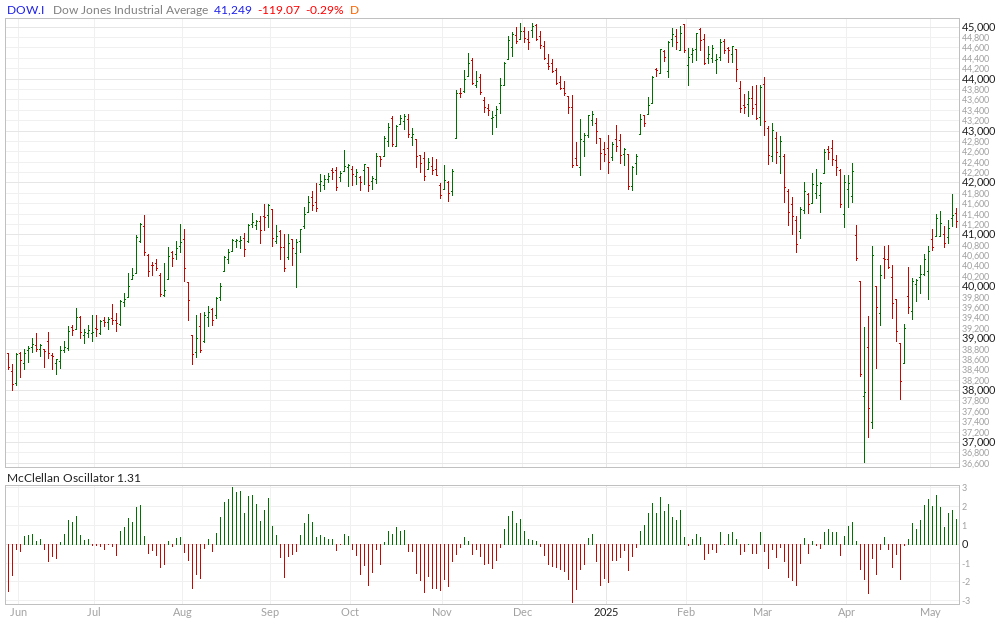
 Dow Jones Daily Candles
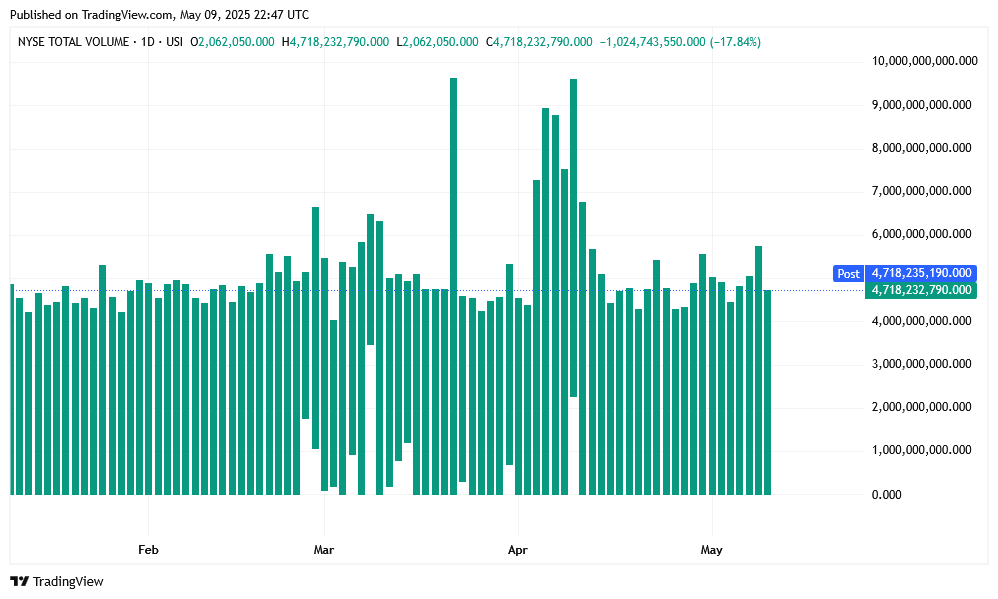
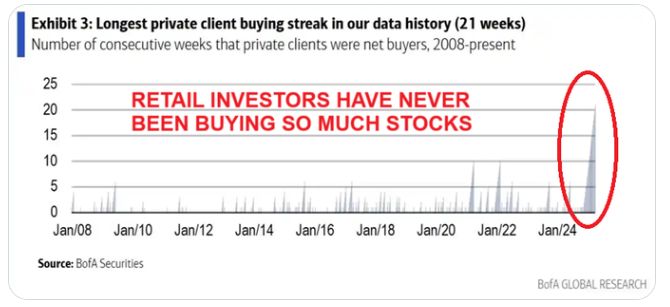
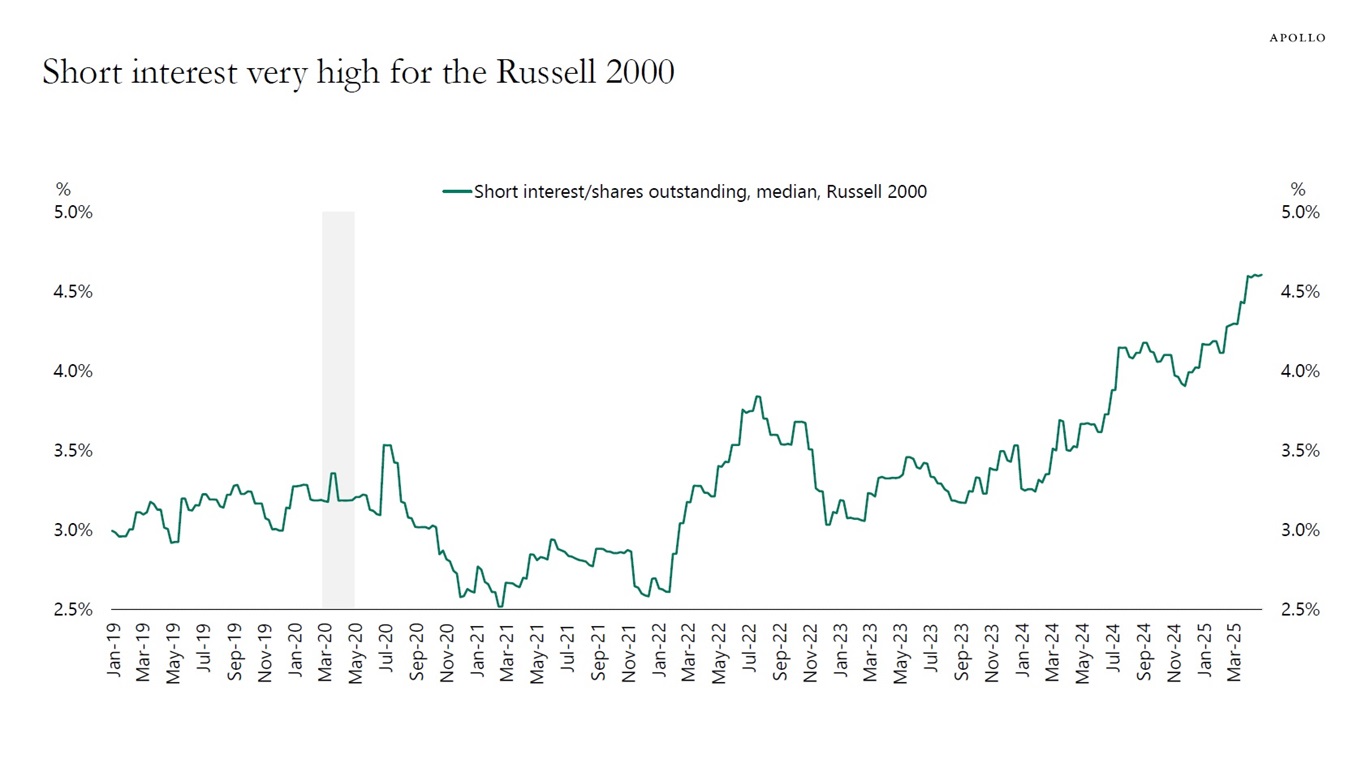
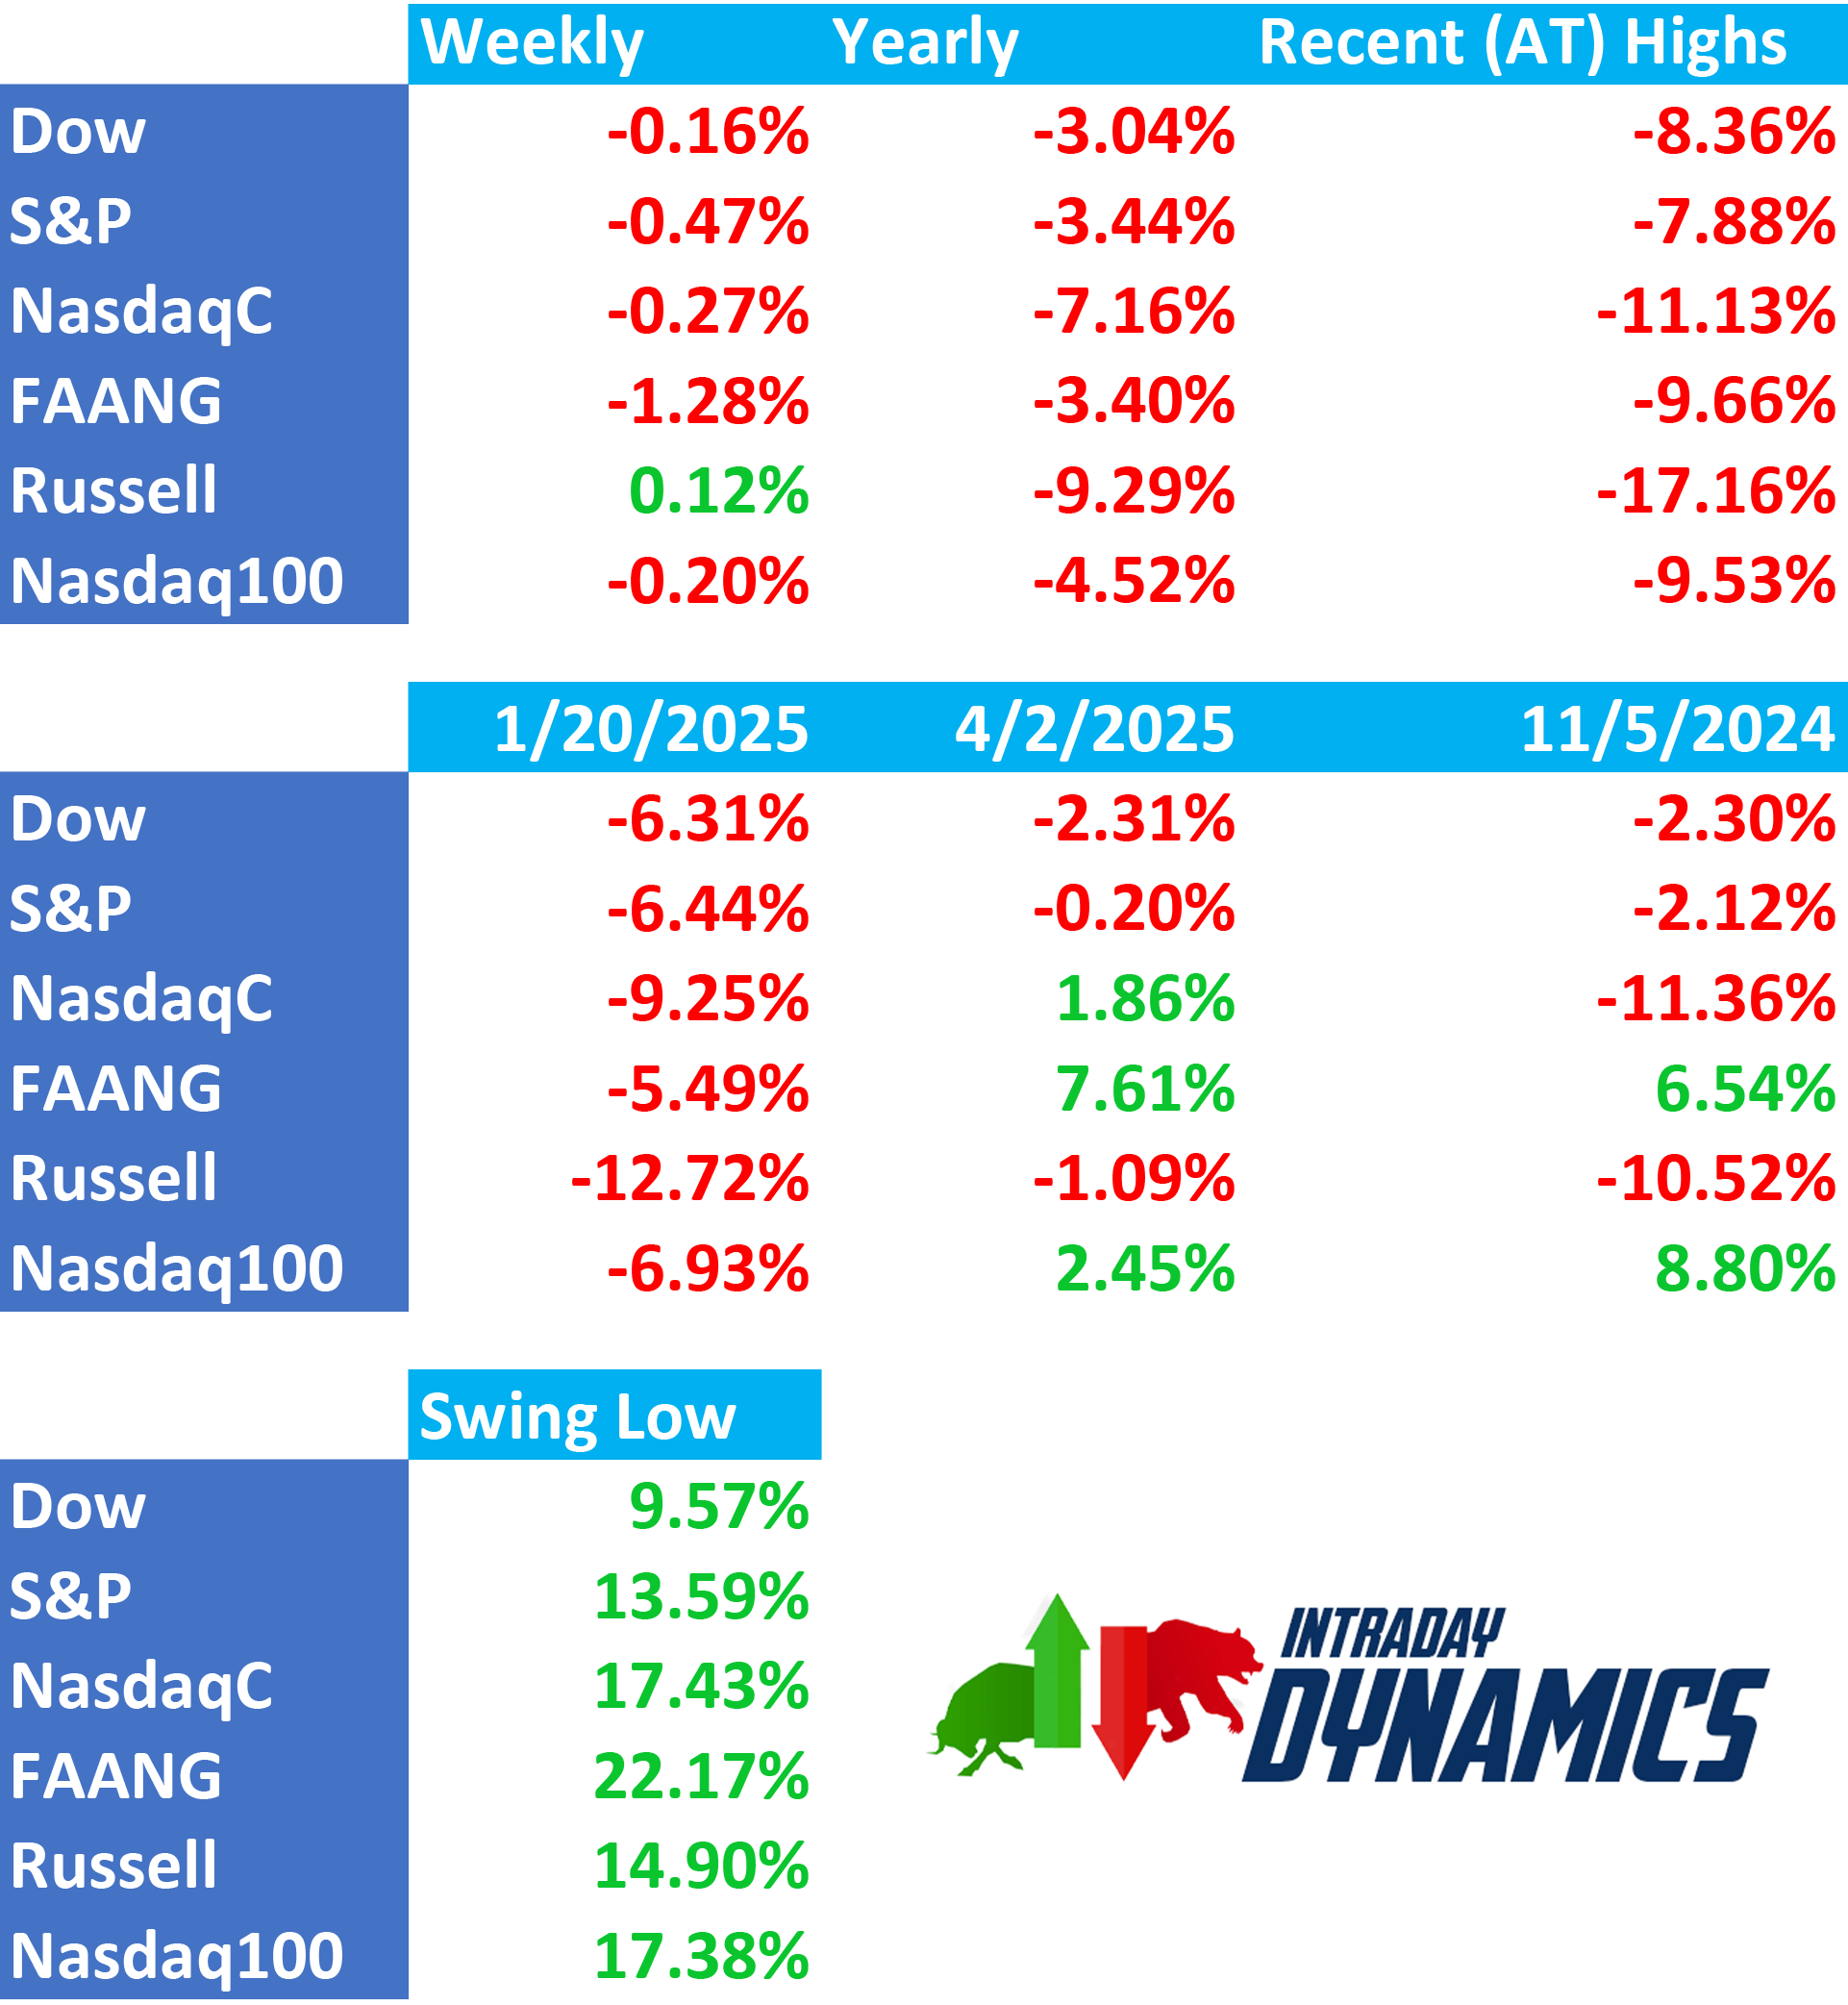
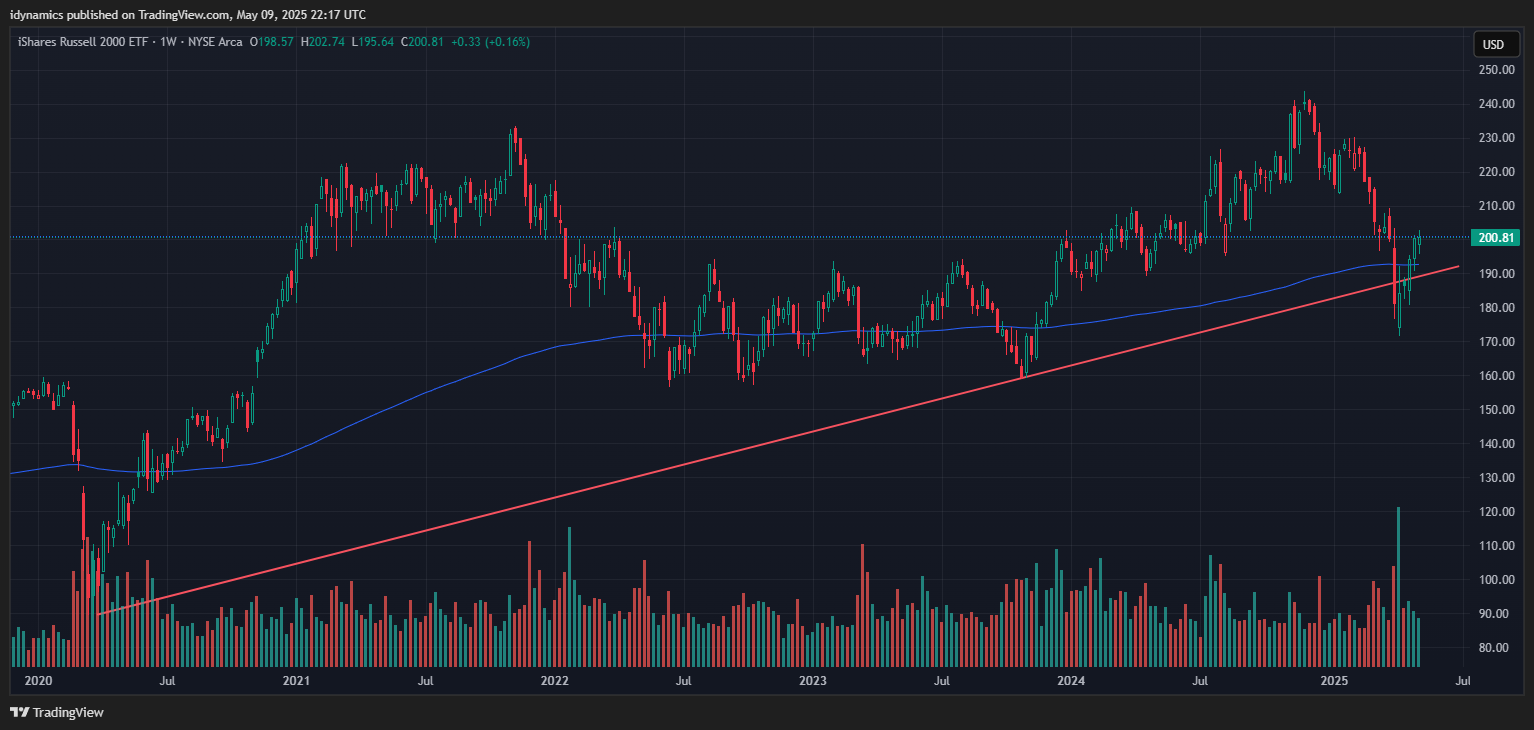
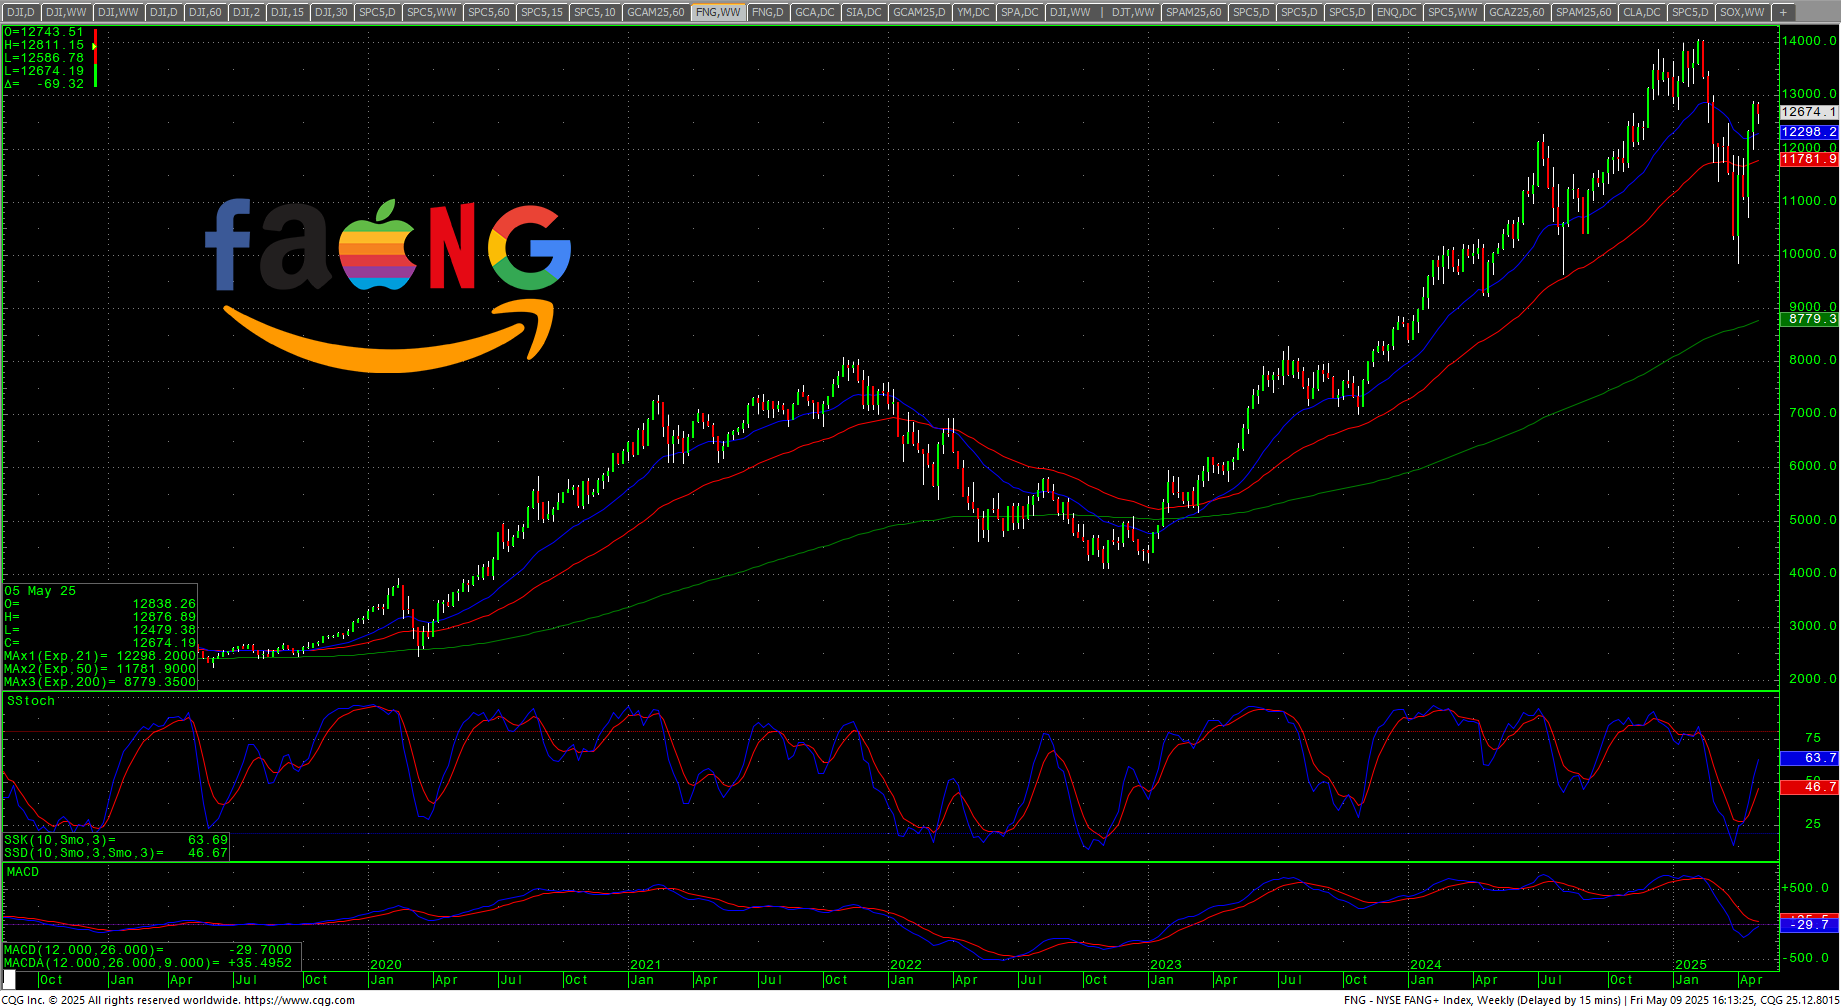
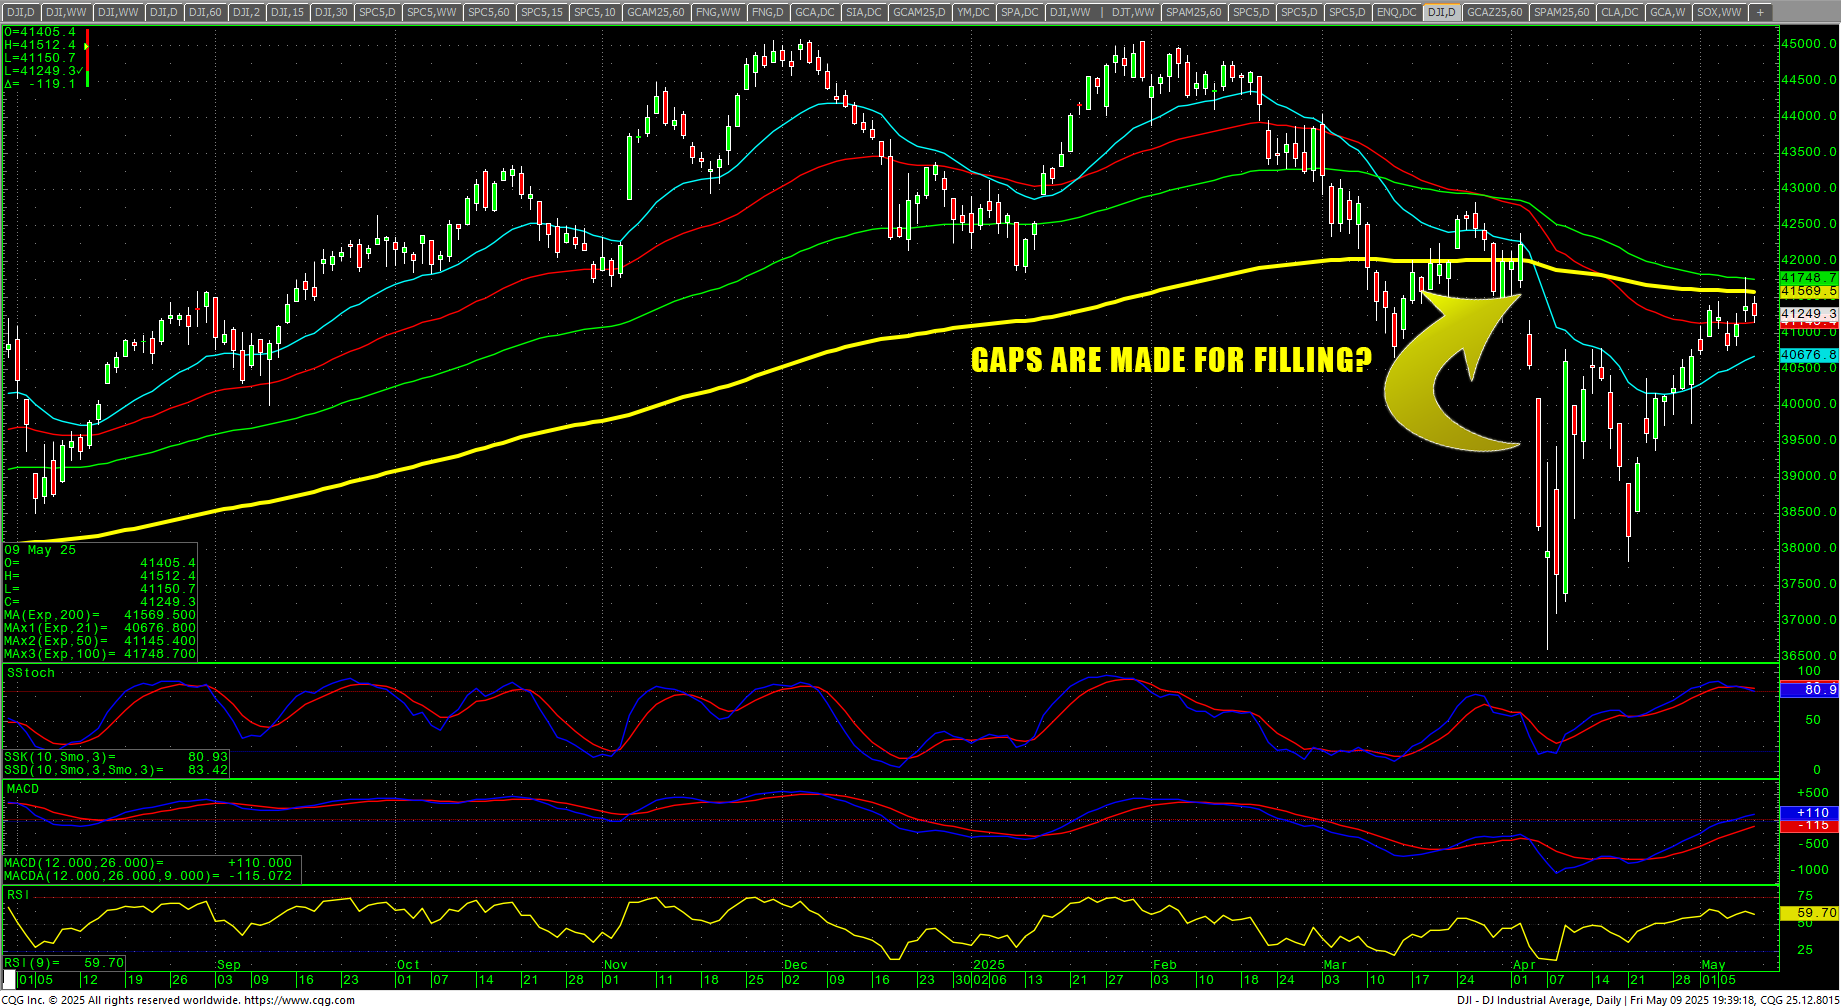 Stocks ended a low volume and choppy week, mostly lower with only the Russell eking out a gain on the week. The Dow rallied back above the 200-day MA (in Thursday’s minor cycle timing) but rejected it as prices filled in the gap left on 3 April 2025 after “Liberation Day.” Short-interest on the Russell is high and retail traders continue to pour into the market while hedge funds distribute to retail and outright short this market. Who will win this battle between the bulls and bears? Will retail traders emerge as the new Warren Buffet’s…who is sitting on $347B+ in cash? The FANG led the way lower after a two-week tear to the upside while the Russell remains the most depressed at -9.29% on the year.


 SPY Daily Candles
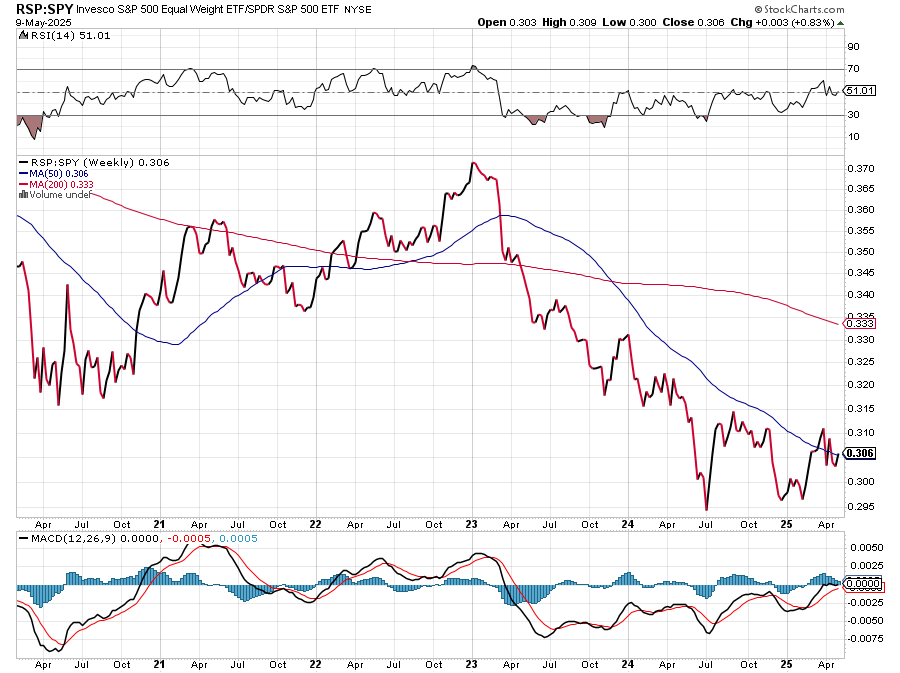
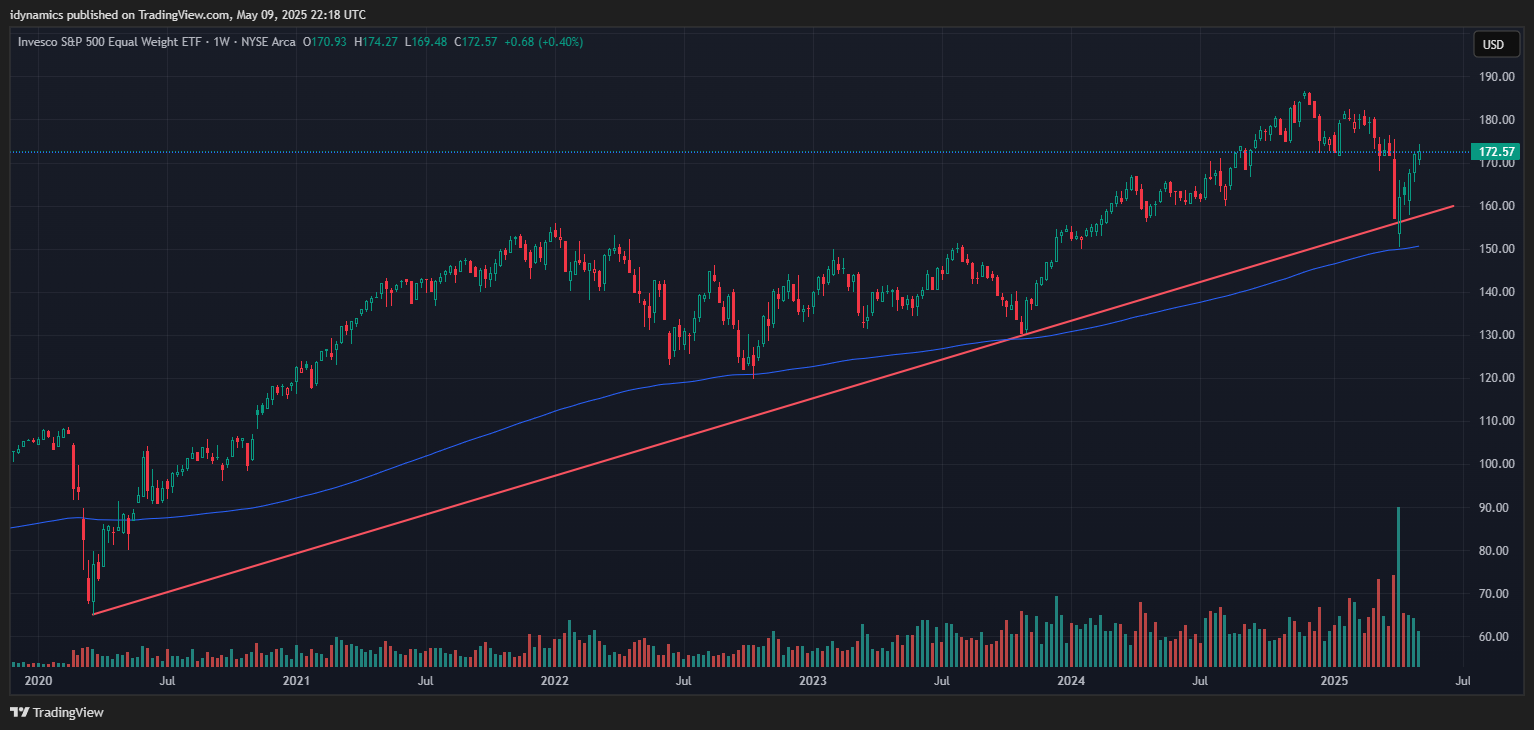
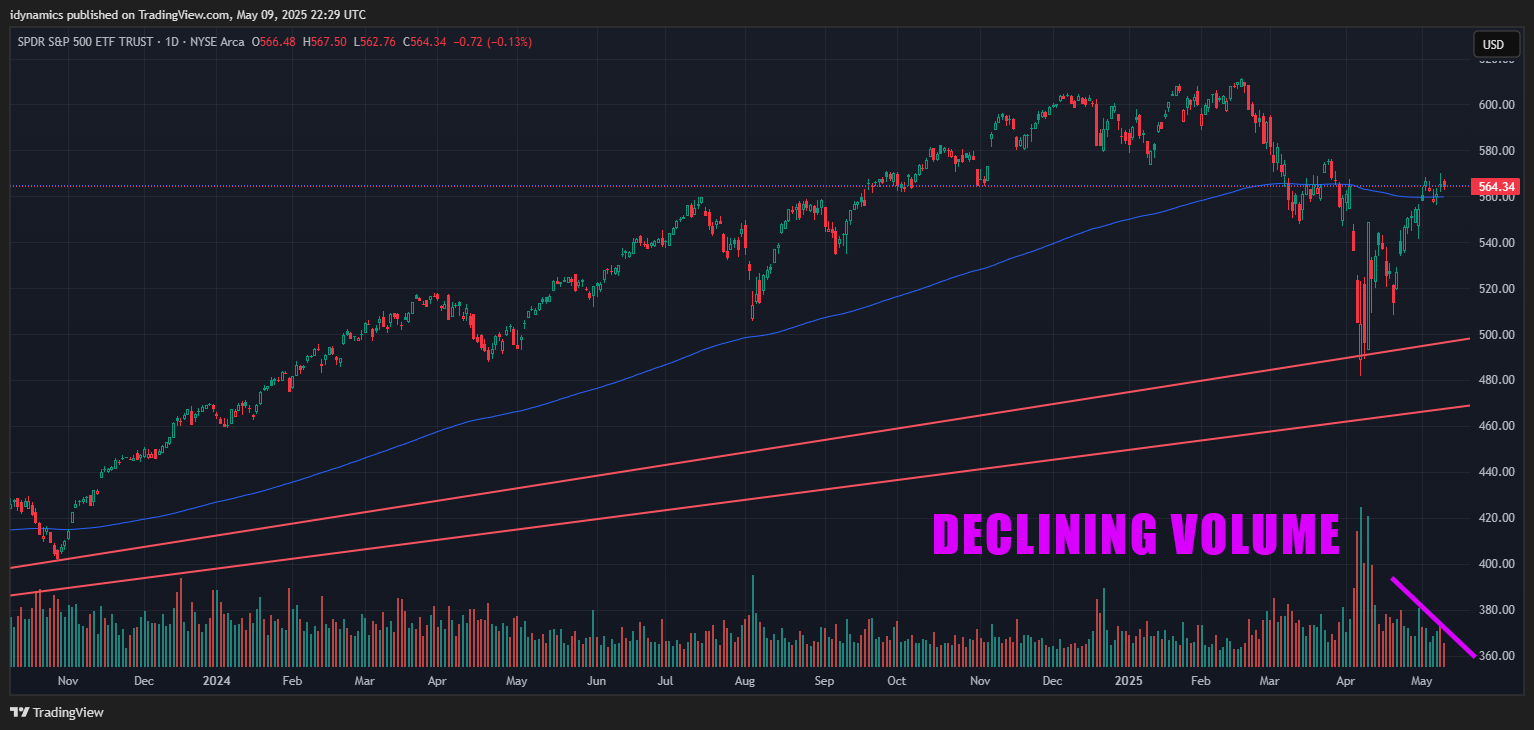 Sentiment has shifted sharply away from its deeply oversold readings to greed and extreme greed with the strong rally. The volume is pathetic and represents typical “distribution.” The S&P closed fractionally lower on Friday and ended the week down about a half percent, the first weekly loss in four weeks and putting the SPX just a hair under the close on “Liberation Day.” Momentum is slowing, even though Dow Jones ‘new highs’ hit a record high last week. The RSP eked out a net positive for the week and the RSP:SPY is struggling near multi-year lows. The ratio has basically been flat for almost one year now.
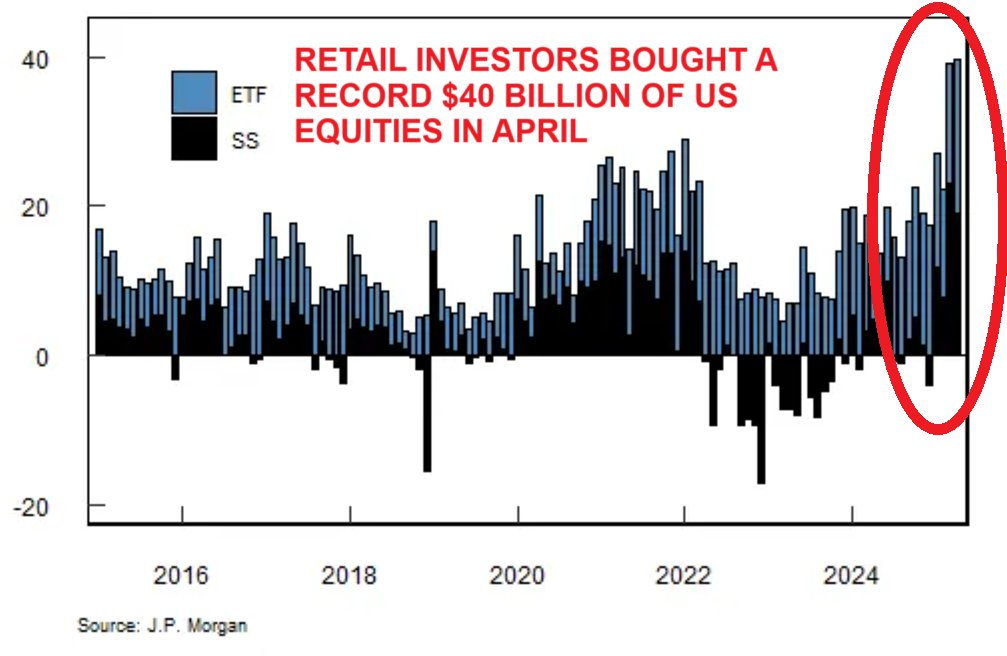
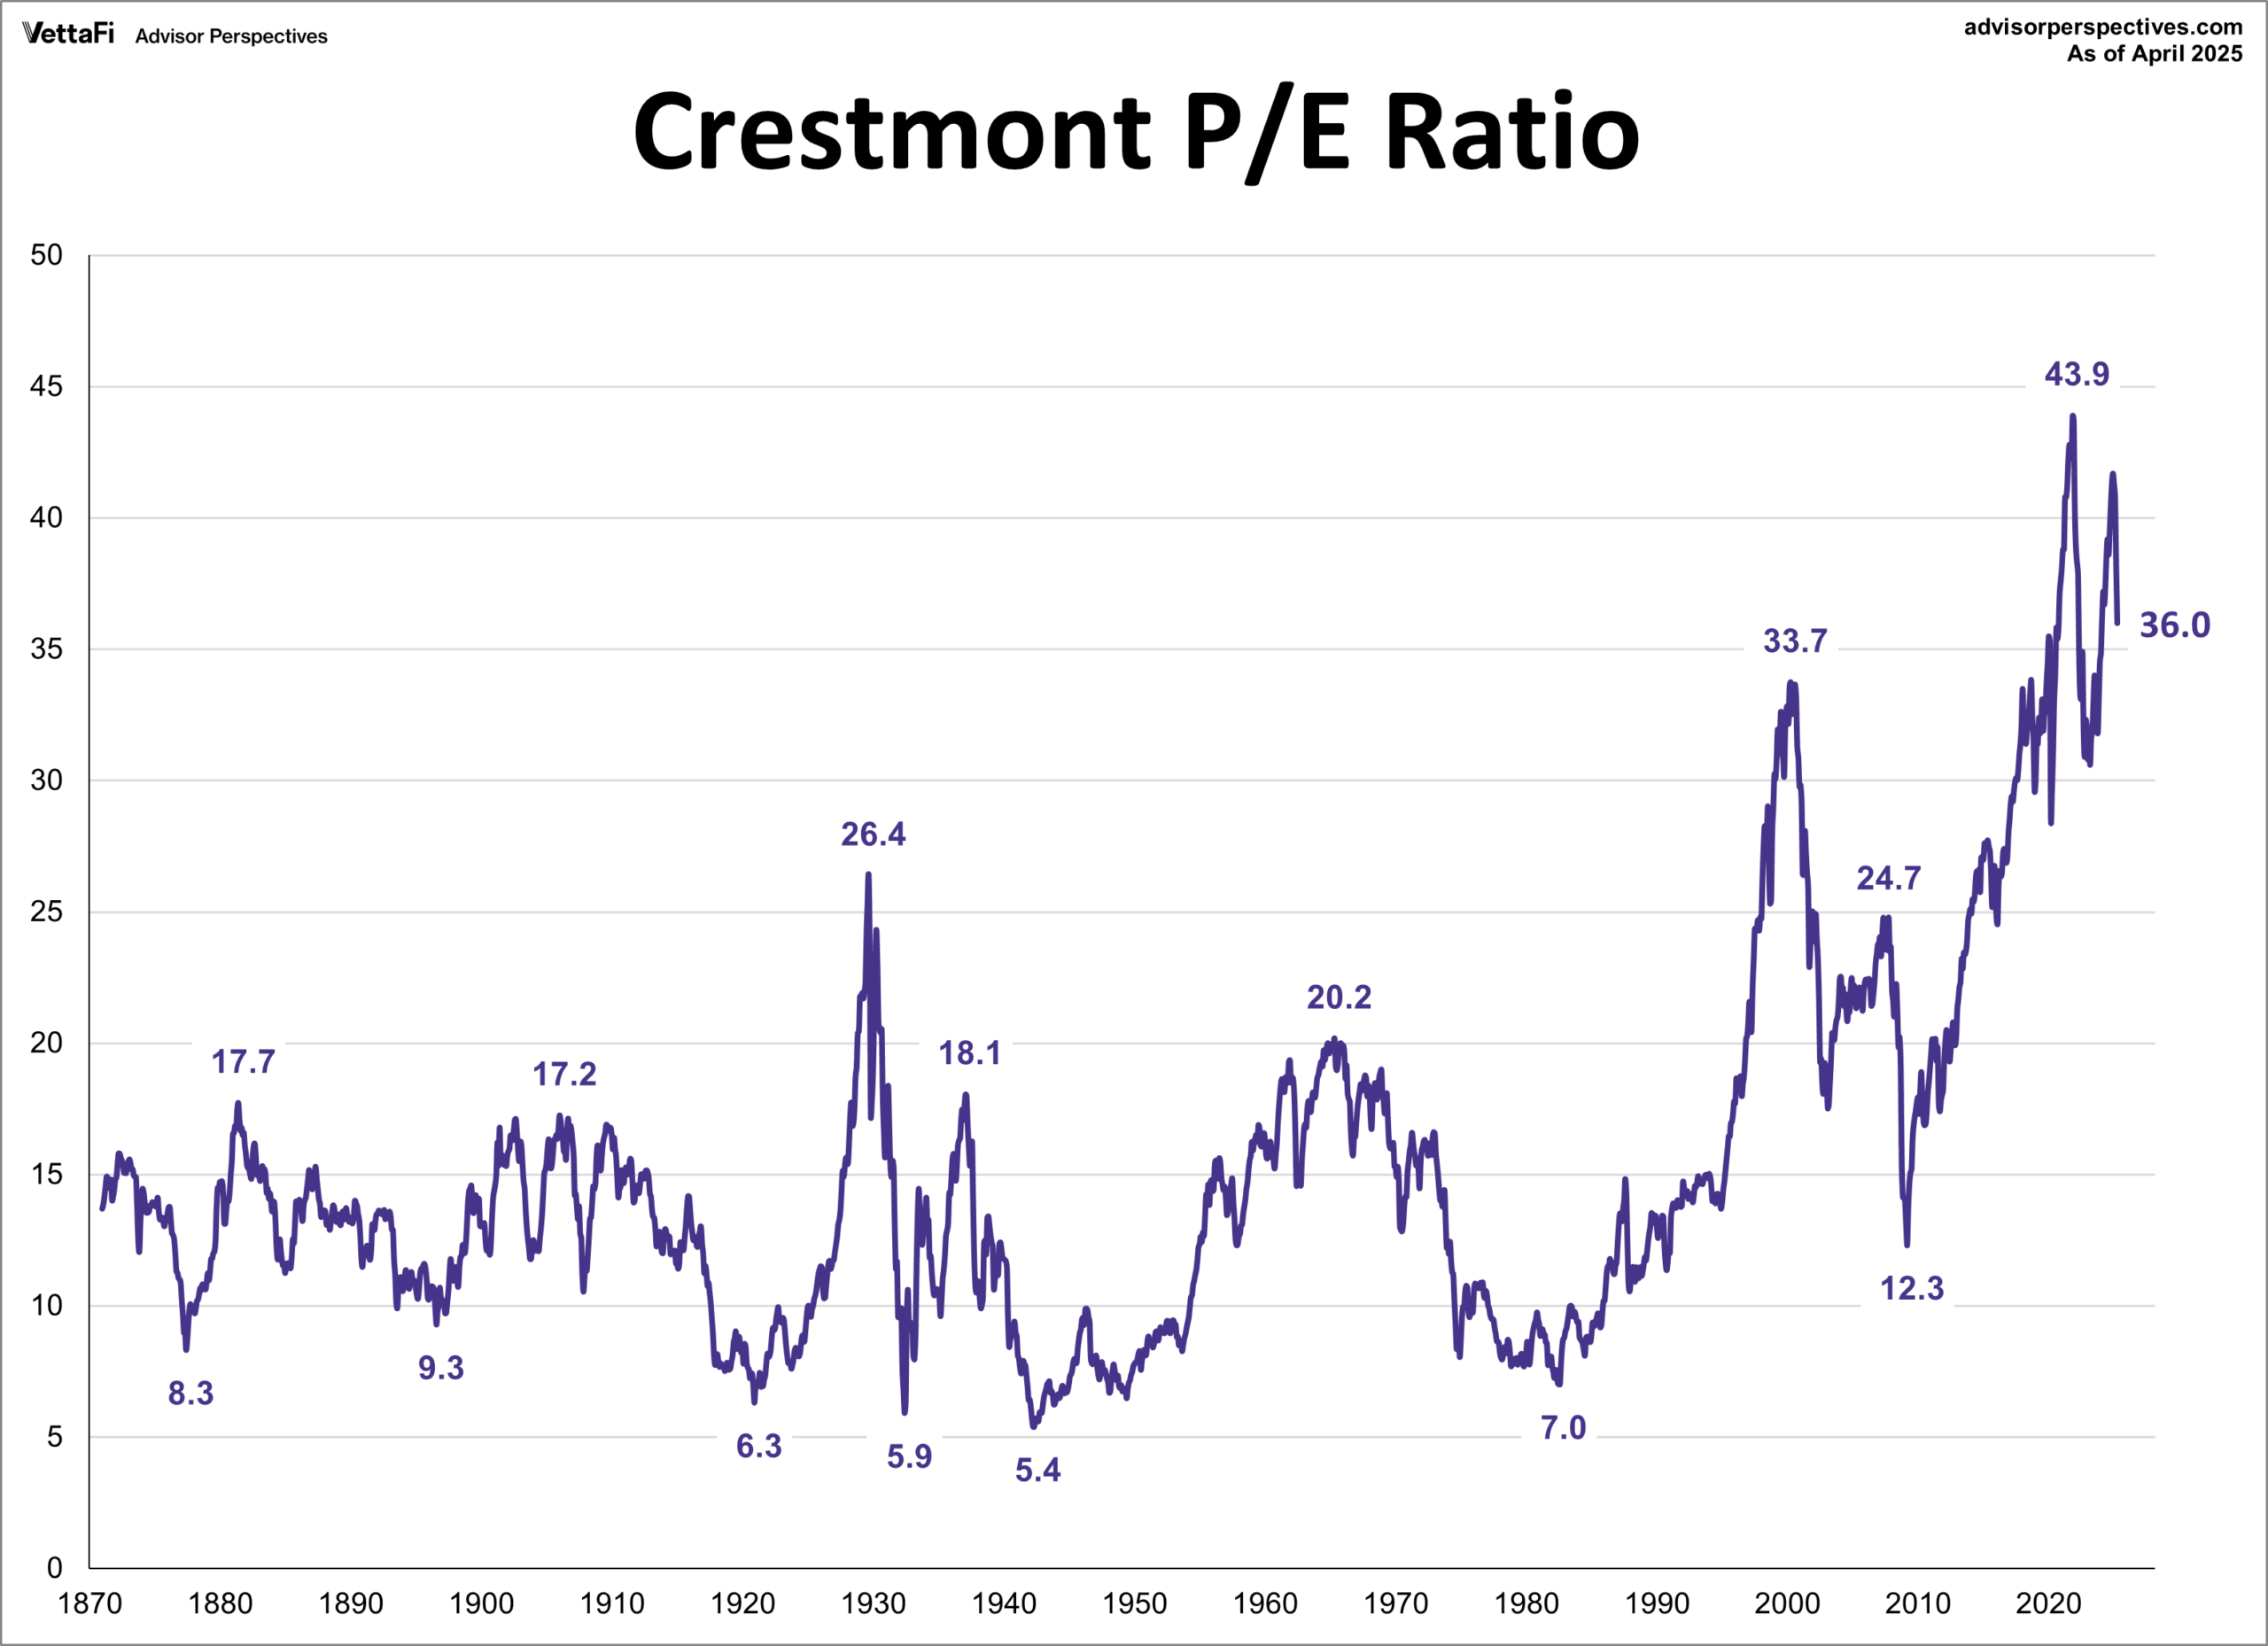
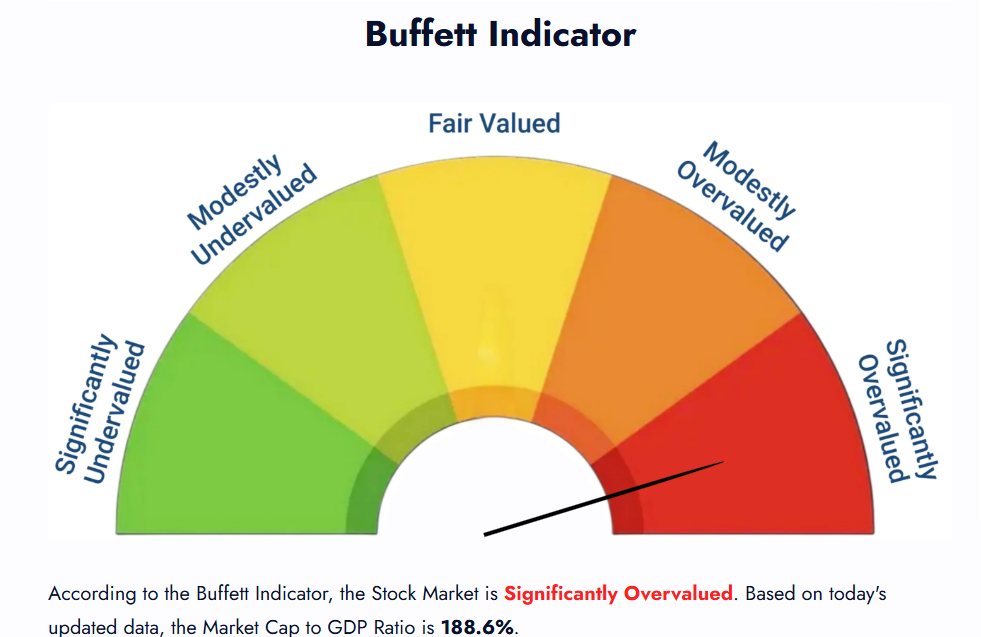
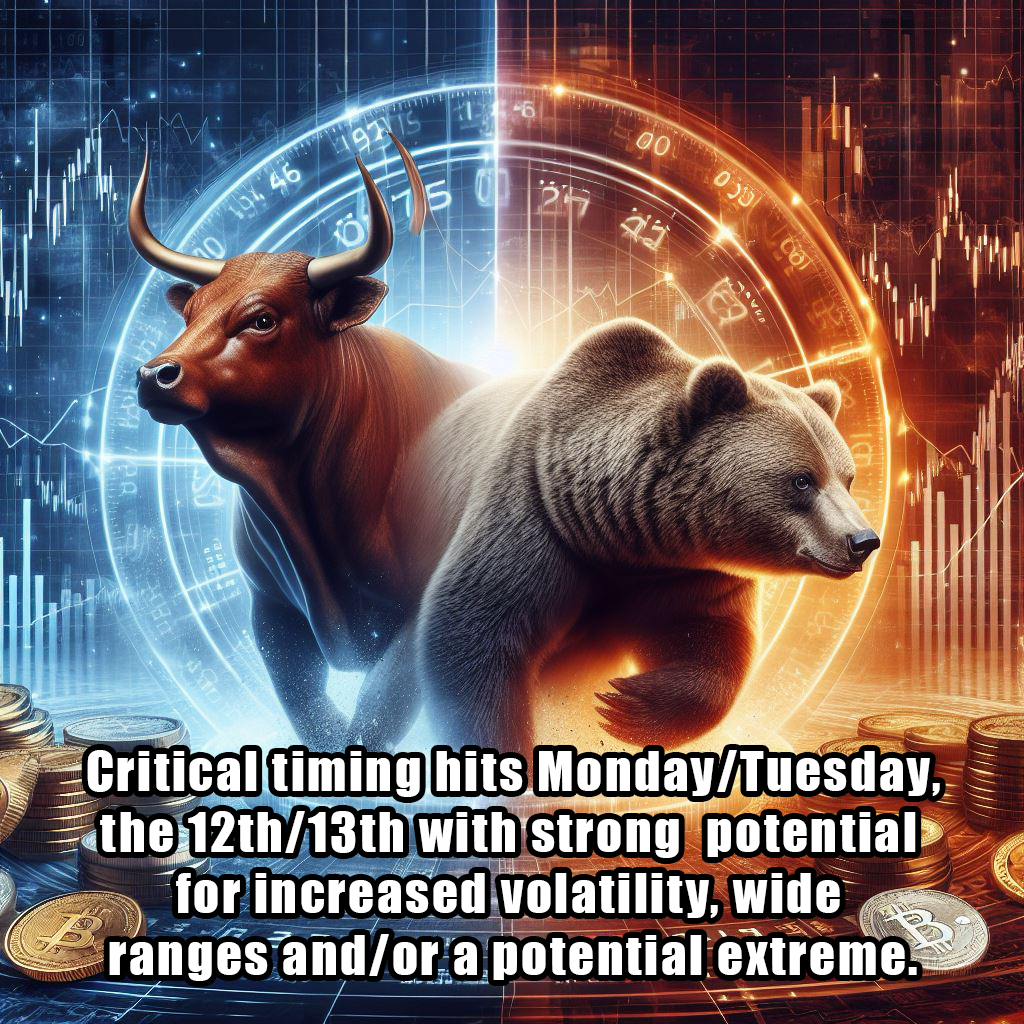 We have CRITICAL TIMING due on Monday/Tuesday and there is strong potential for a day with wide ranges and/or large net changes. Regardless of how bullish the retail traders remain (pumping $40B into the market in April) The S&P remains at an historically high P/E ratio. The “Buffet Indicator” still stands at “Significantly Overvalued.”
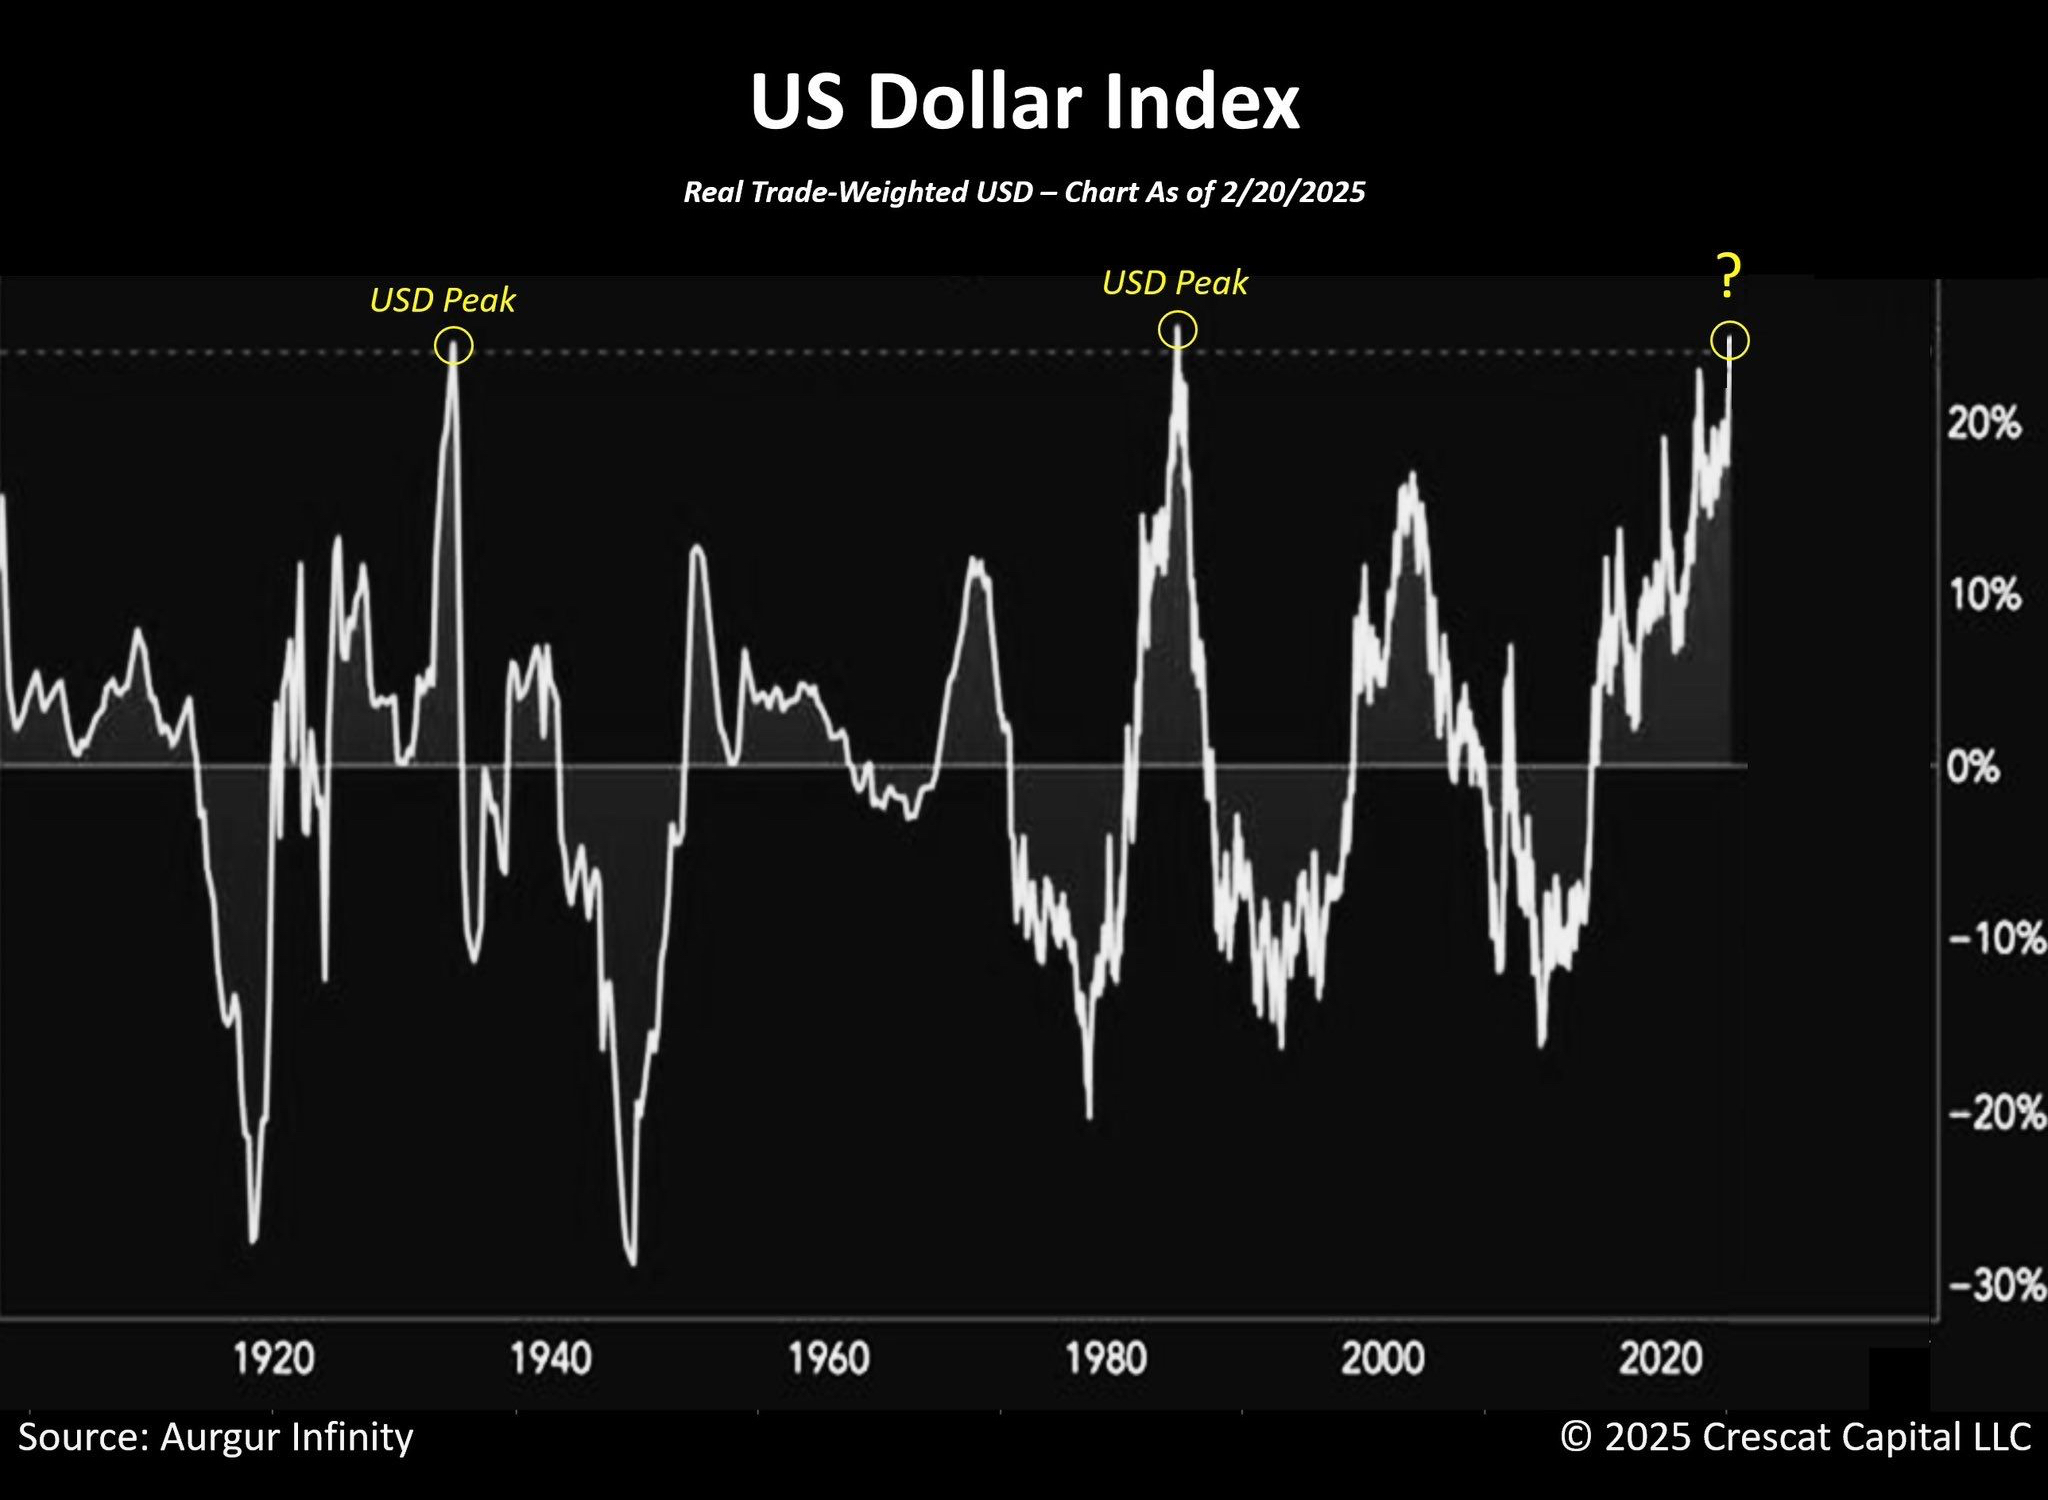
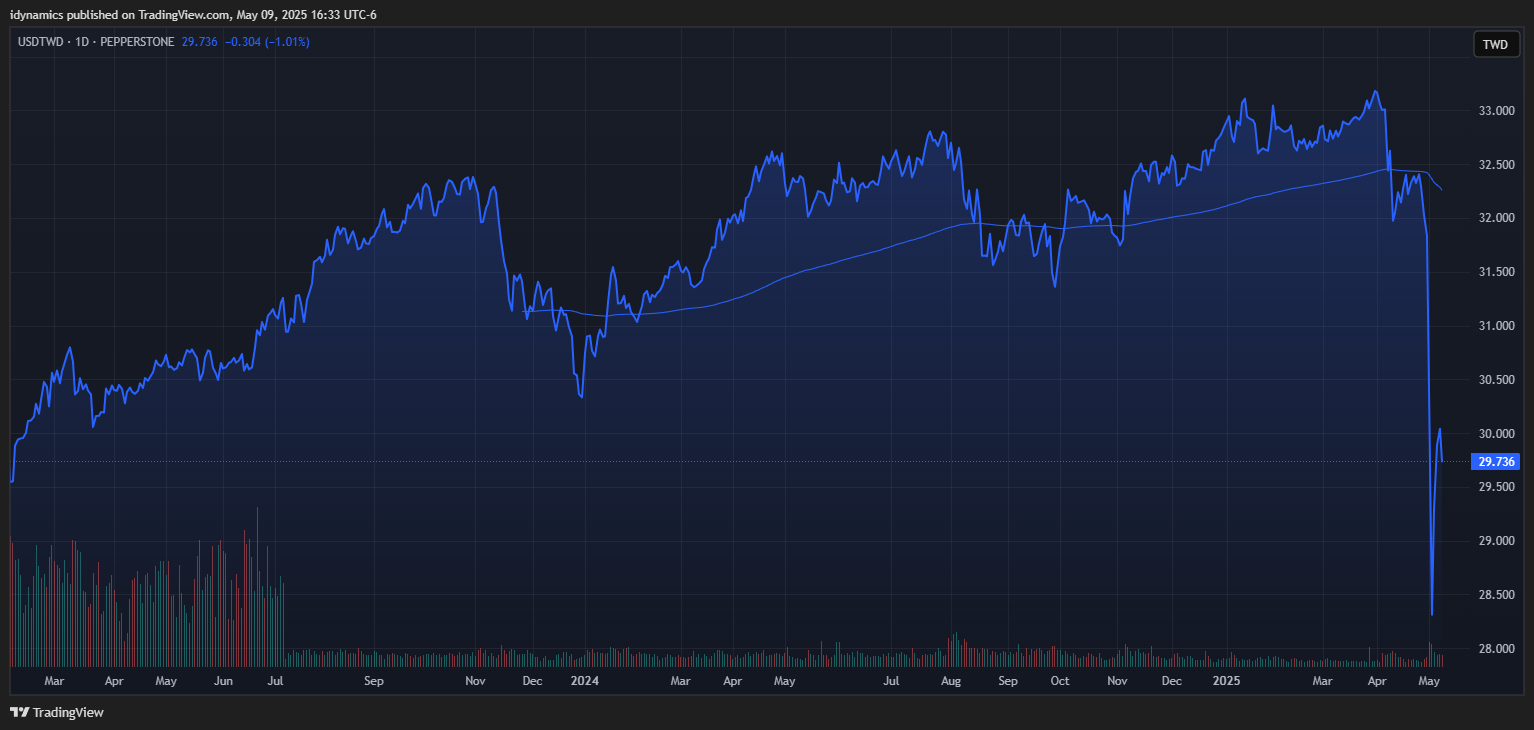
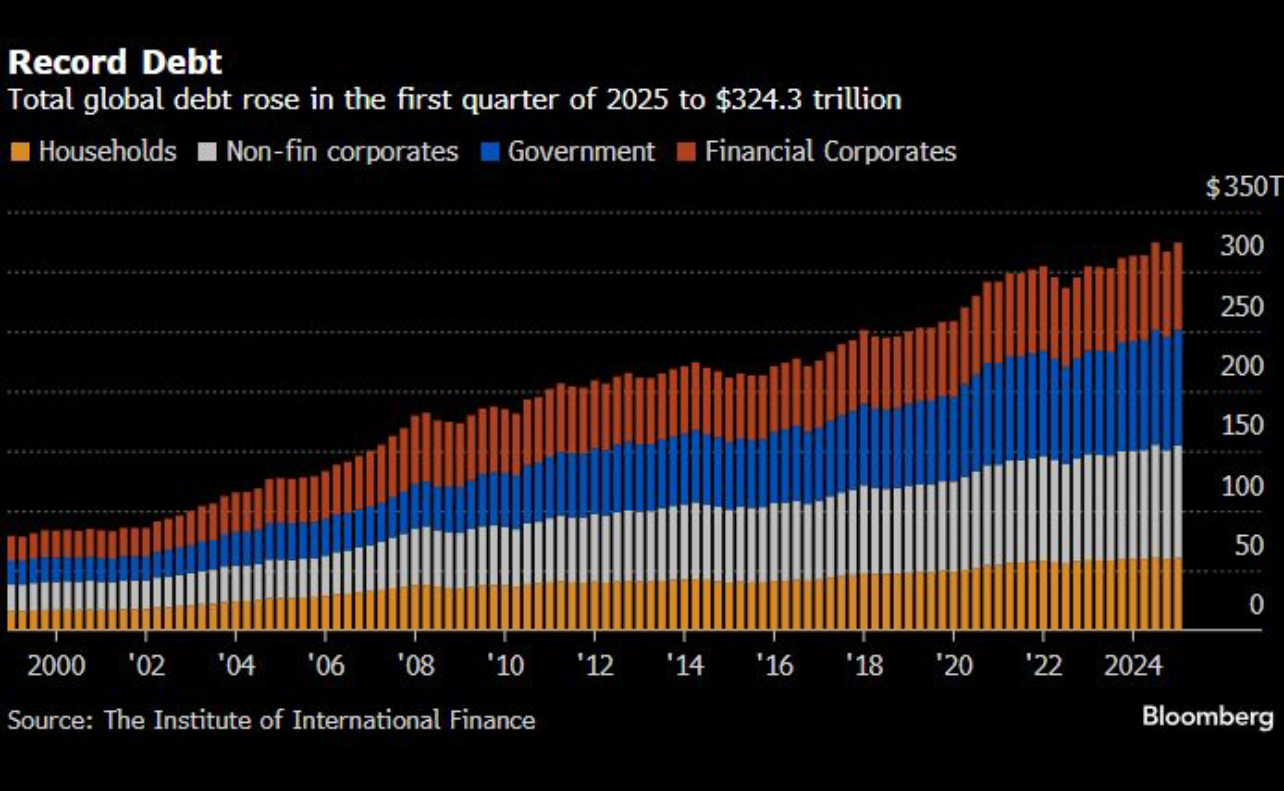
 There remains extremely troubling fundamentals underlying the markets. The “Trade War” is causing a flight from U.S. assets as Asian markets are dumping U.S. dollars. USD to Taiwan came unglued last week. Global debt is an unsolvable equation.
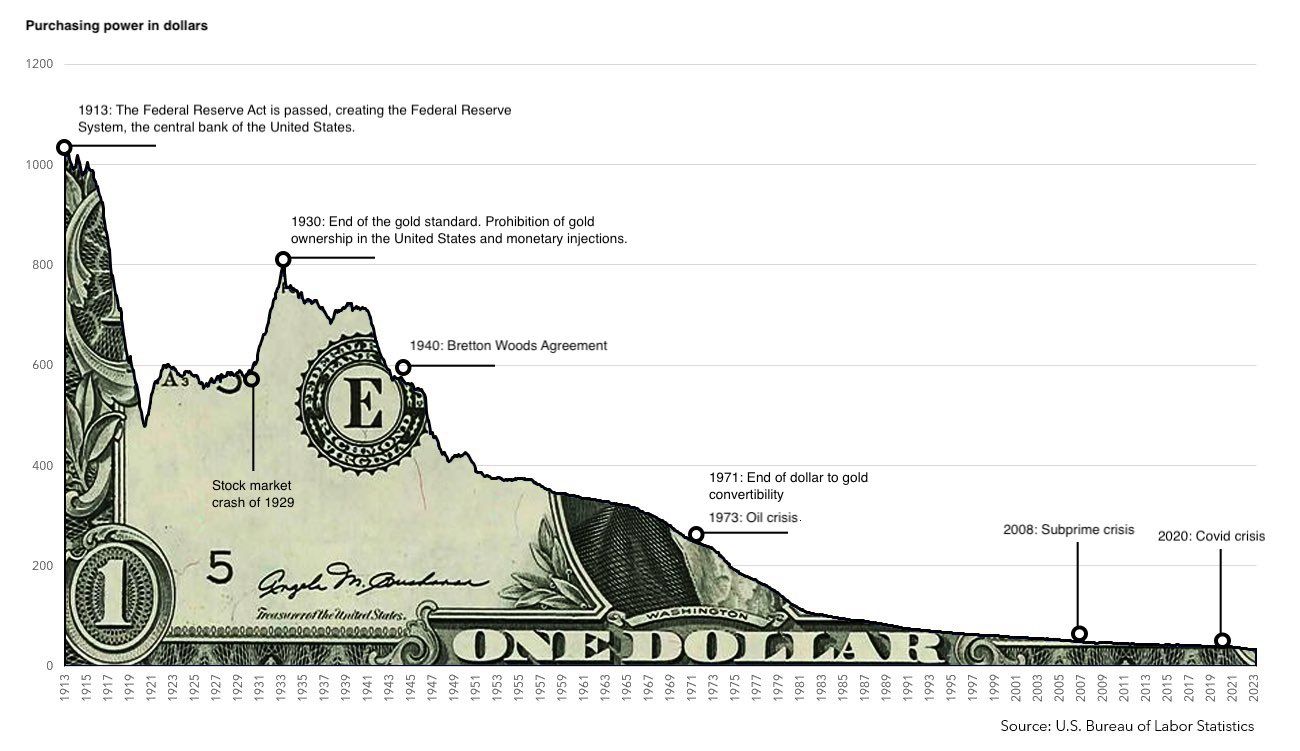
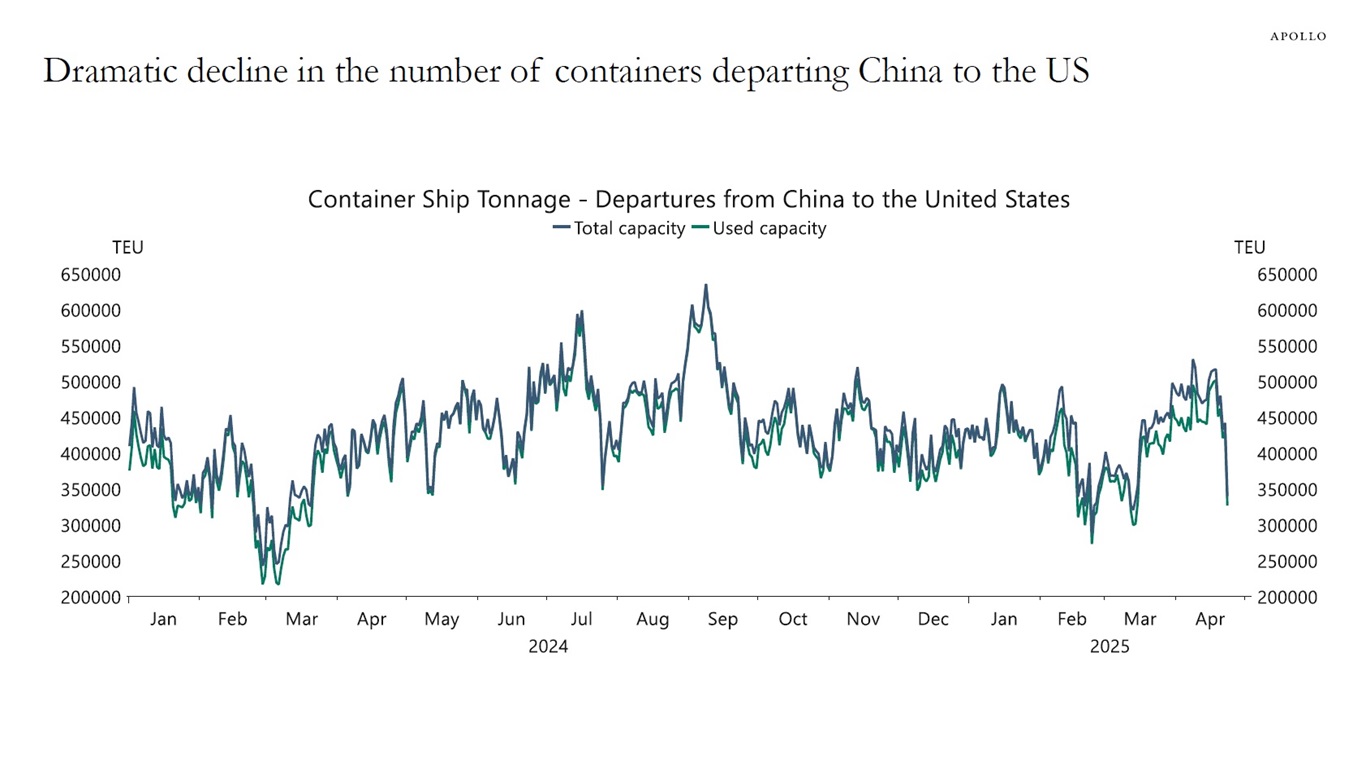
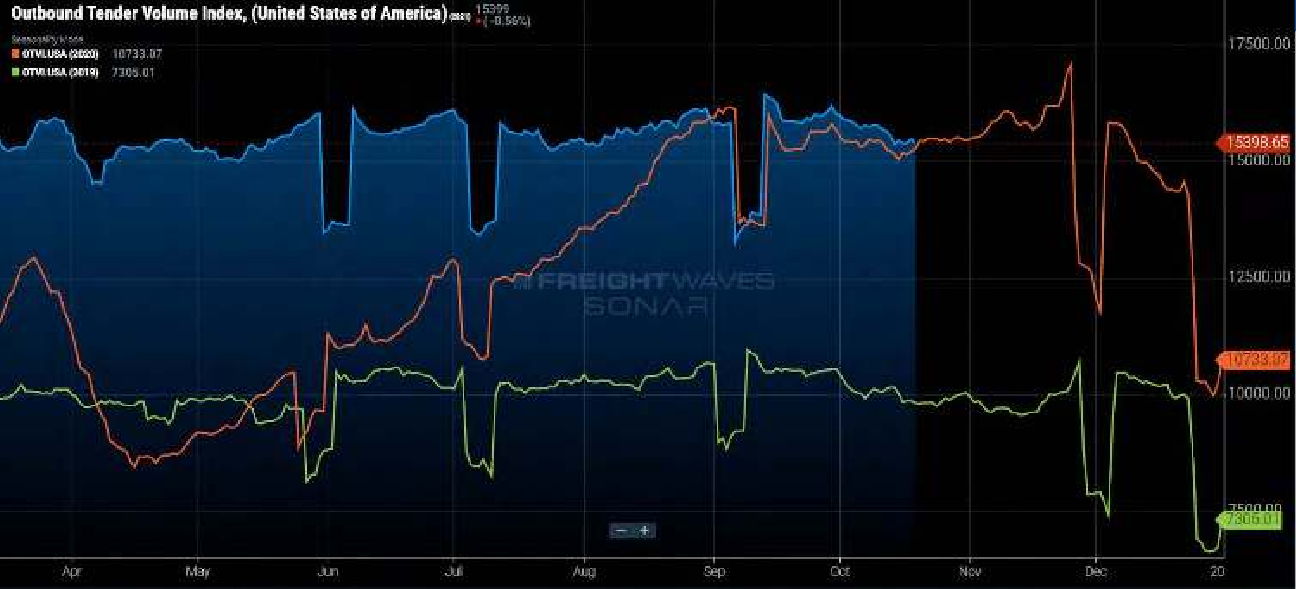
 Container shipping is in a meltdown while earnings revisions continue to keep pushing lower. Outbound shipping has cratered.
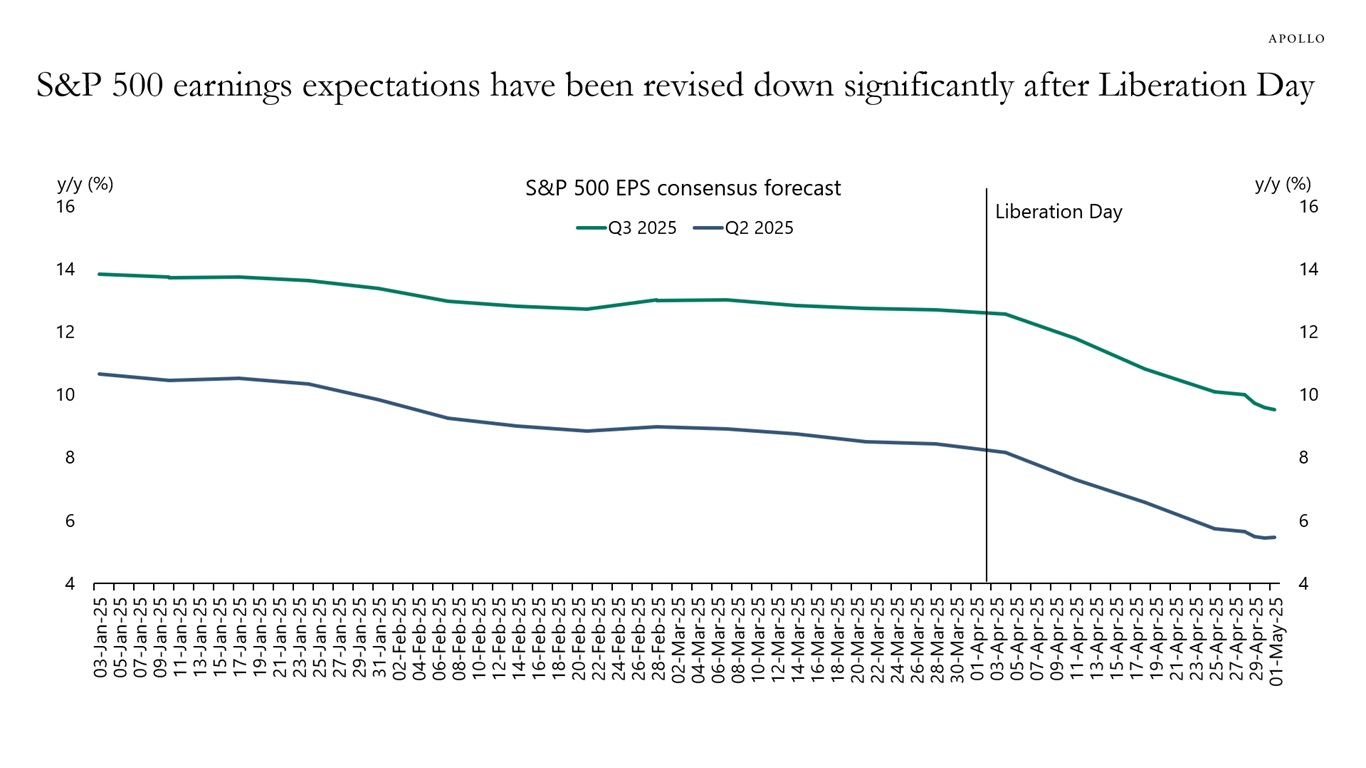
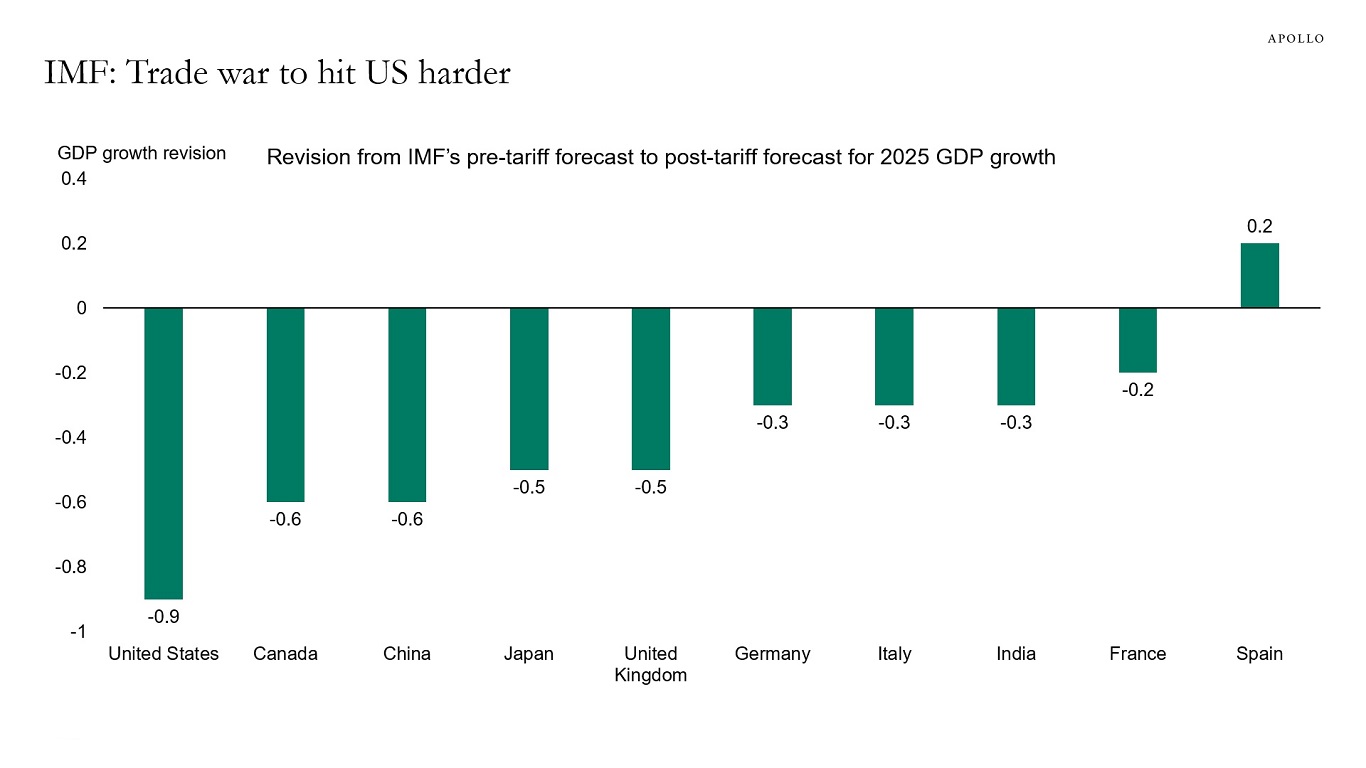
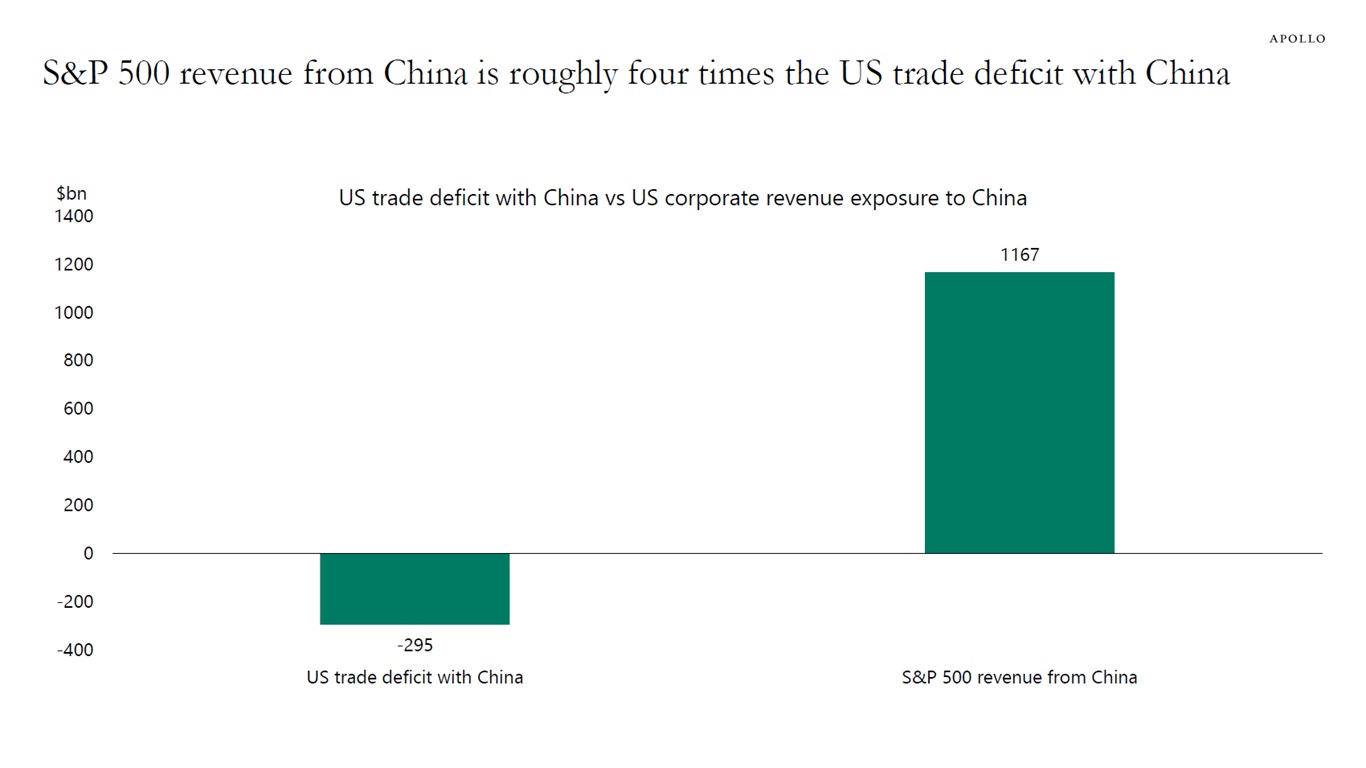
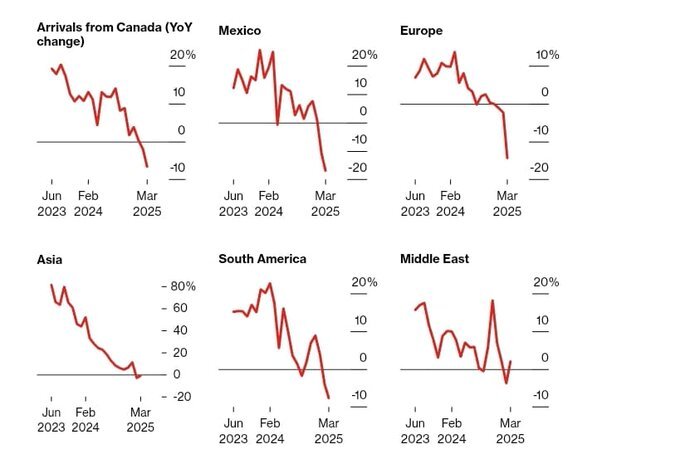
 The “Trade War” headlines appear to show a ‘dick measuring contest,’ but the reality is in the numbers. Who stands to suffer the most under unnecessary tariffs?
BRICS+
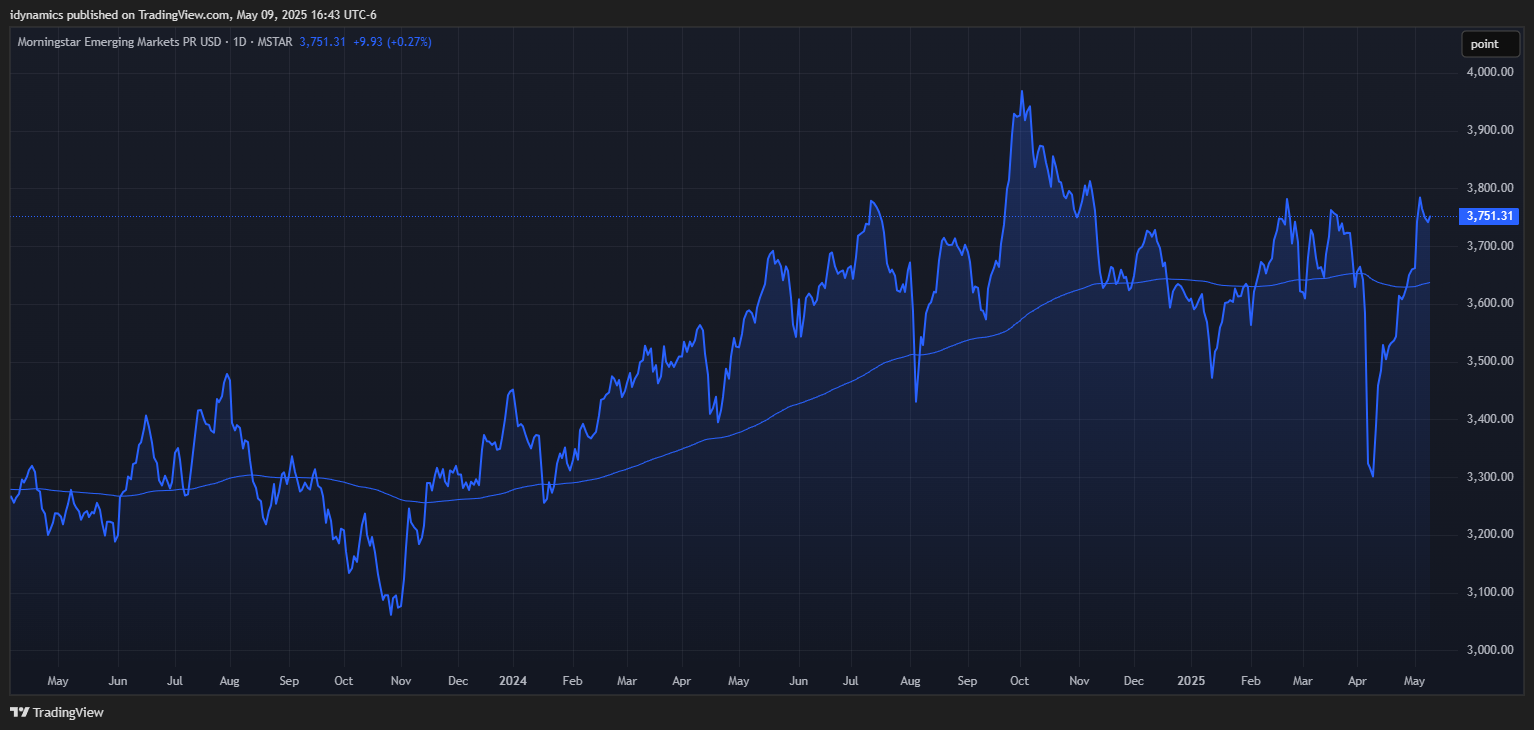
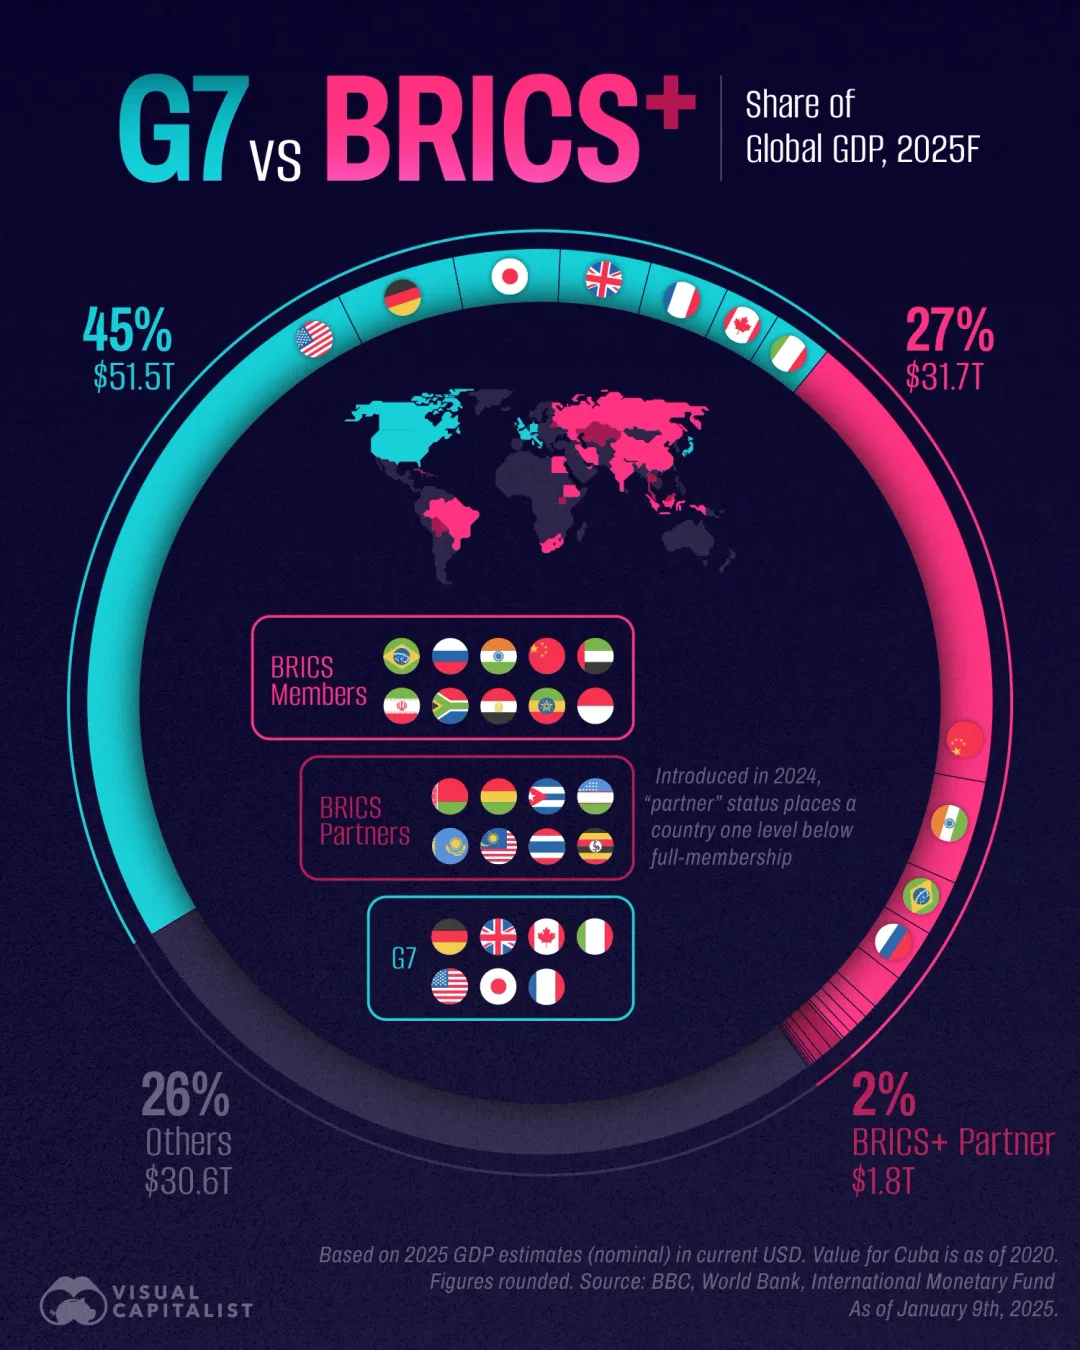 The BRICS+ continues to surge and encompasses a larger percentage of the global population.
Commercial Mortgage Backed Securities
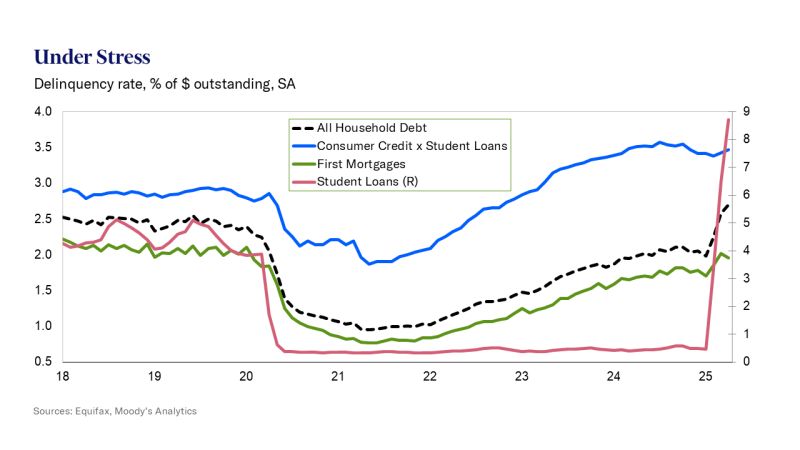 Commercial Mortgage Backed Securities are firing off a major warning sign.
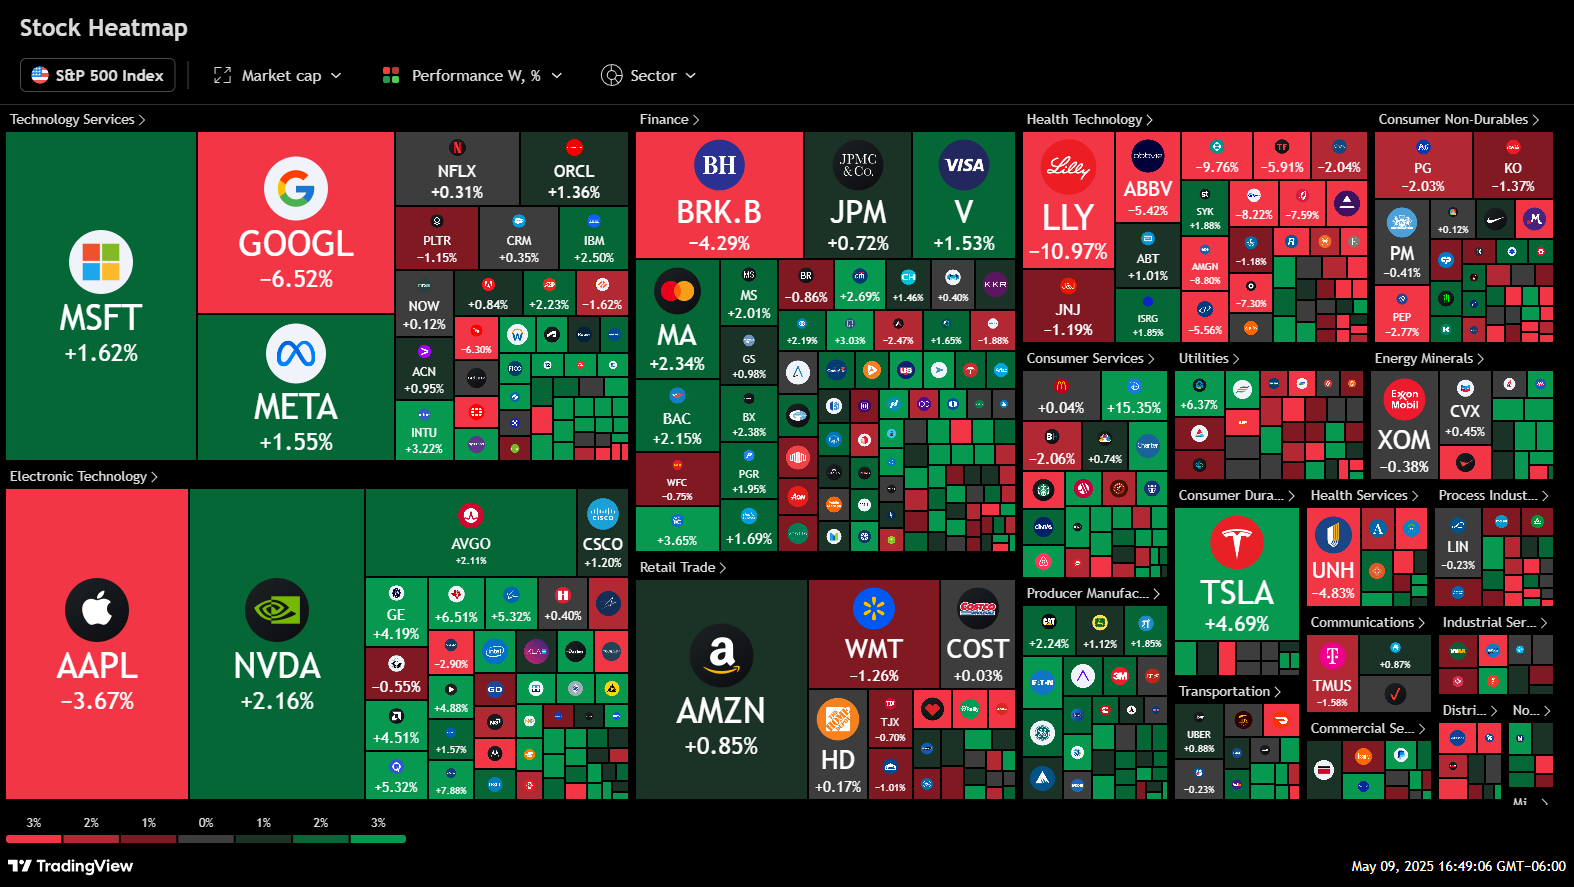
S&P 500 Stocks Above 50-Day Average
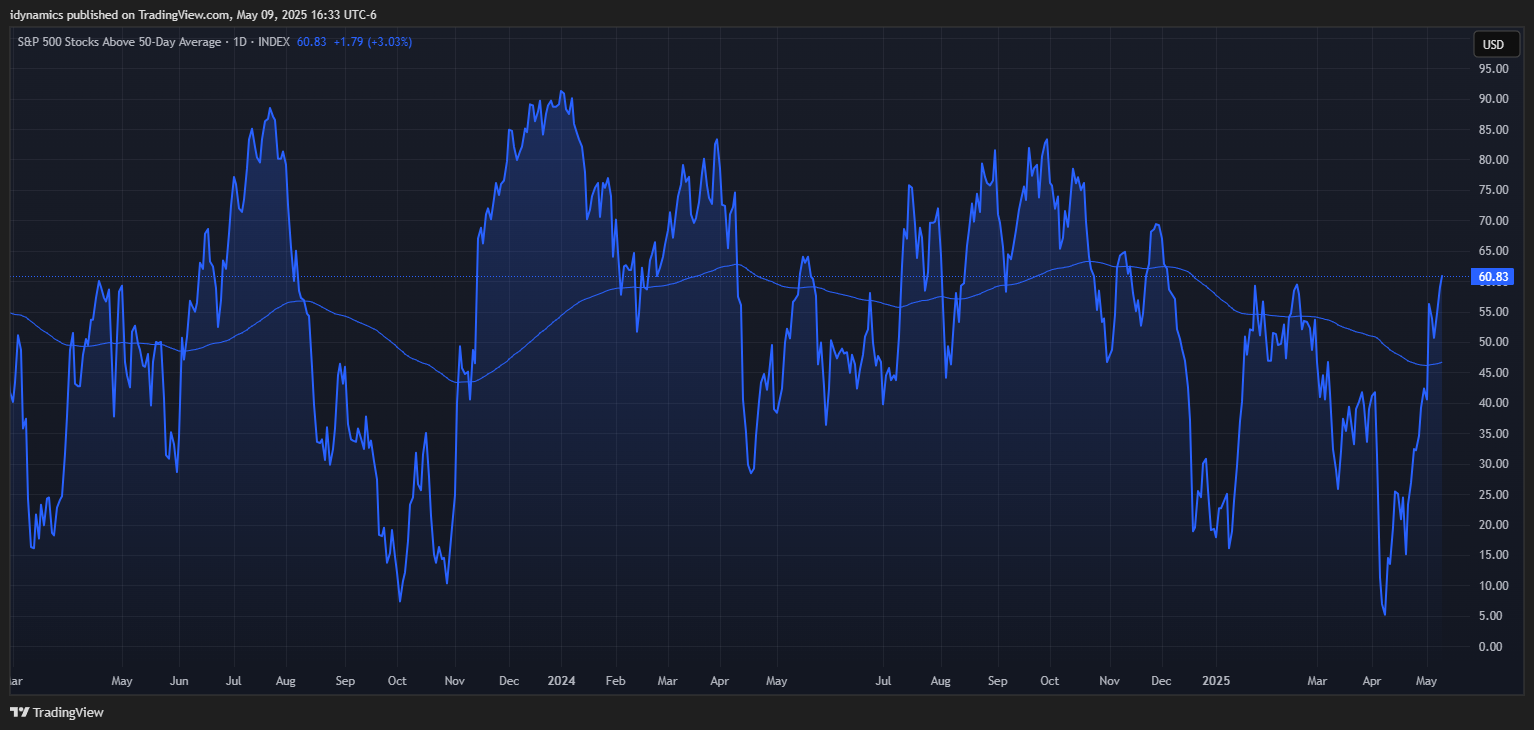 The rally has taken the number of stocks in the SPX above the 50-day MA back to late 2024 levels.
SPX Daily Candles
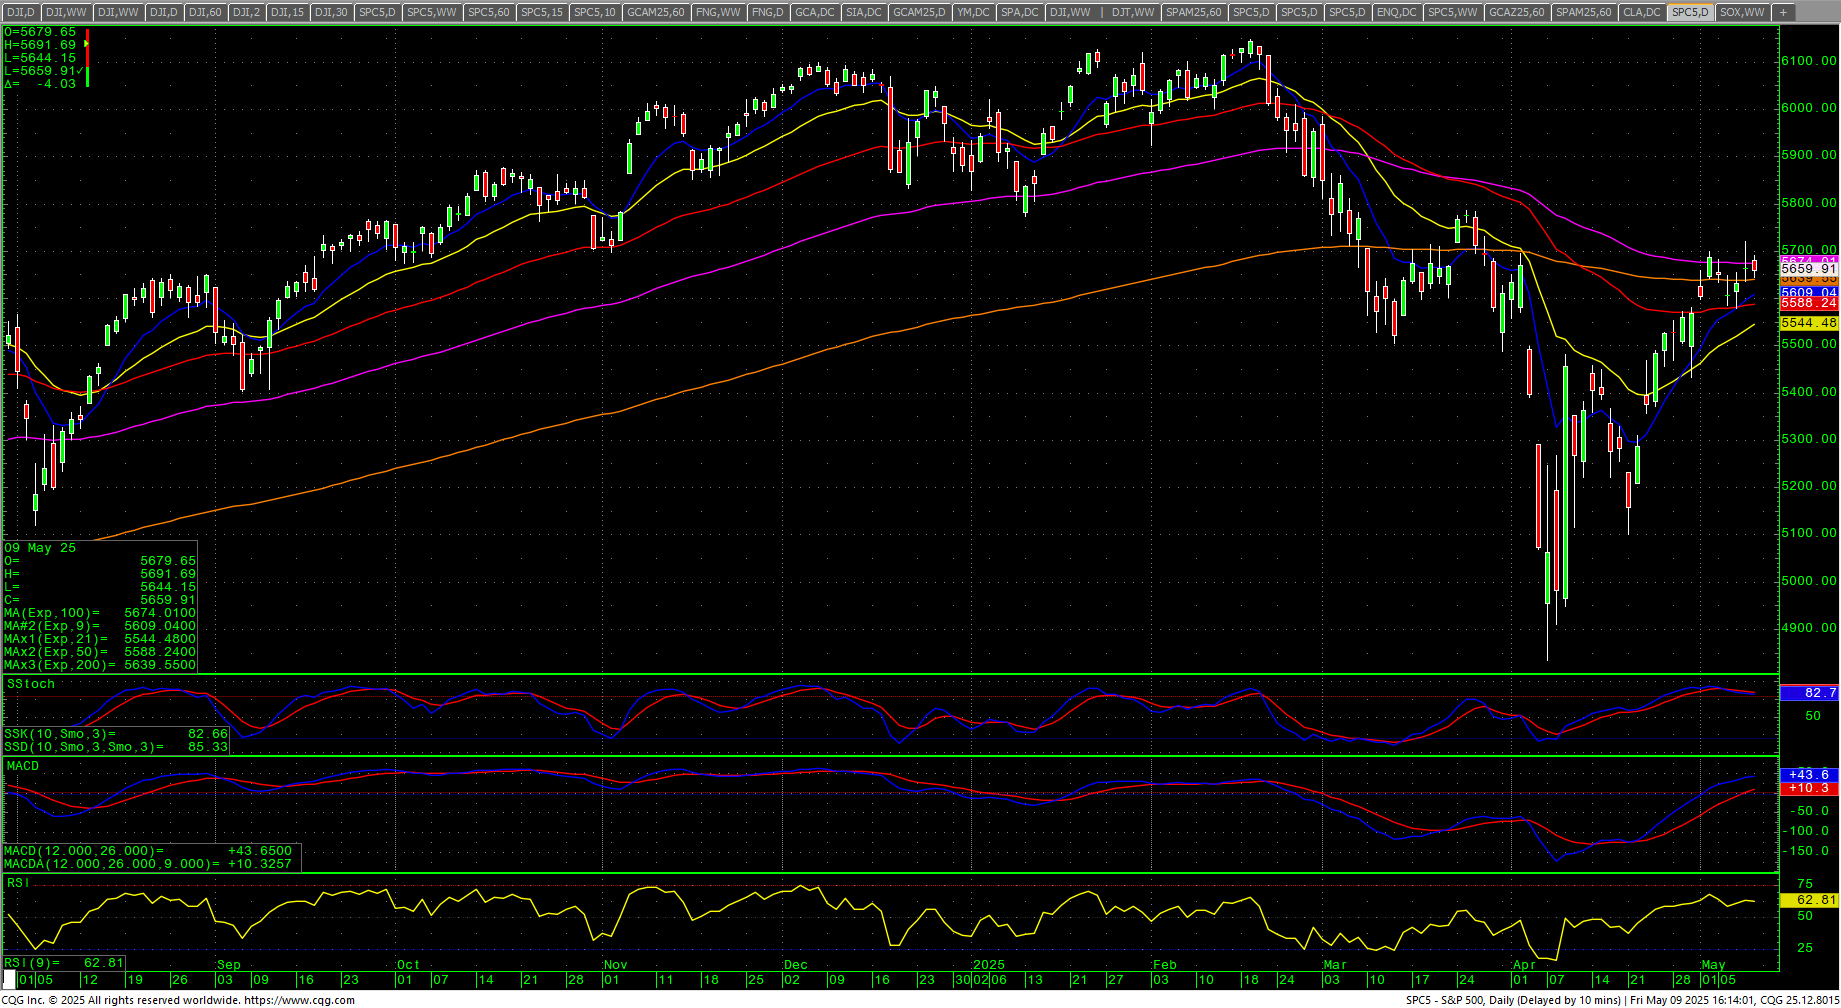 The weak volume is a key indicator that argues the trend might be stalling.
Sticking to the longer-term timing analysis:
“While this window runs through the first week of May, it is looking more and more, from a cycles standpoint, that this will run well into Q4 2025/Q1 2026. Thus, a much more protracted and drawn-out bear and not the “flash crash” that everyone has gotten used to over the past two decades. That doesn’t mean we won’t have significant rallies, but chasing rallies is likely to be a losing strategy until this thing is spent…which very likely will not be until Q1/Q2 2026 at this point.”
Dow Theory
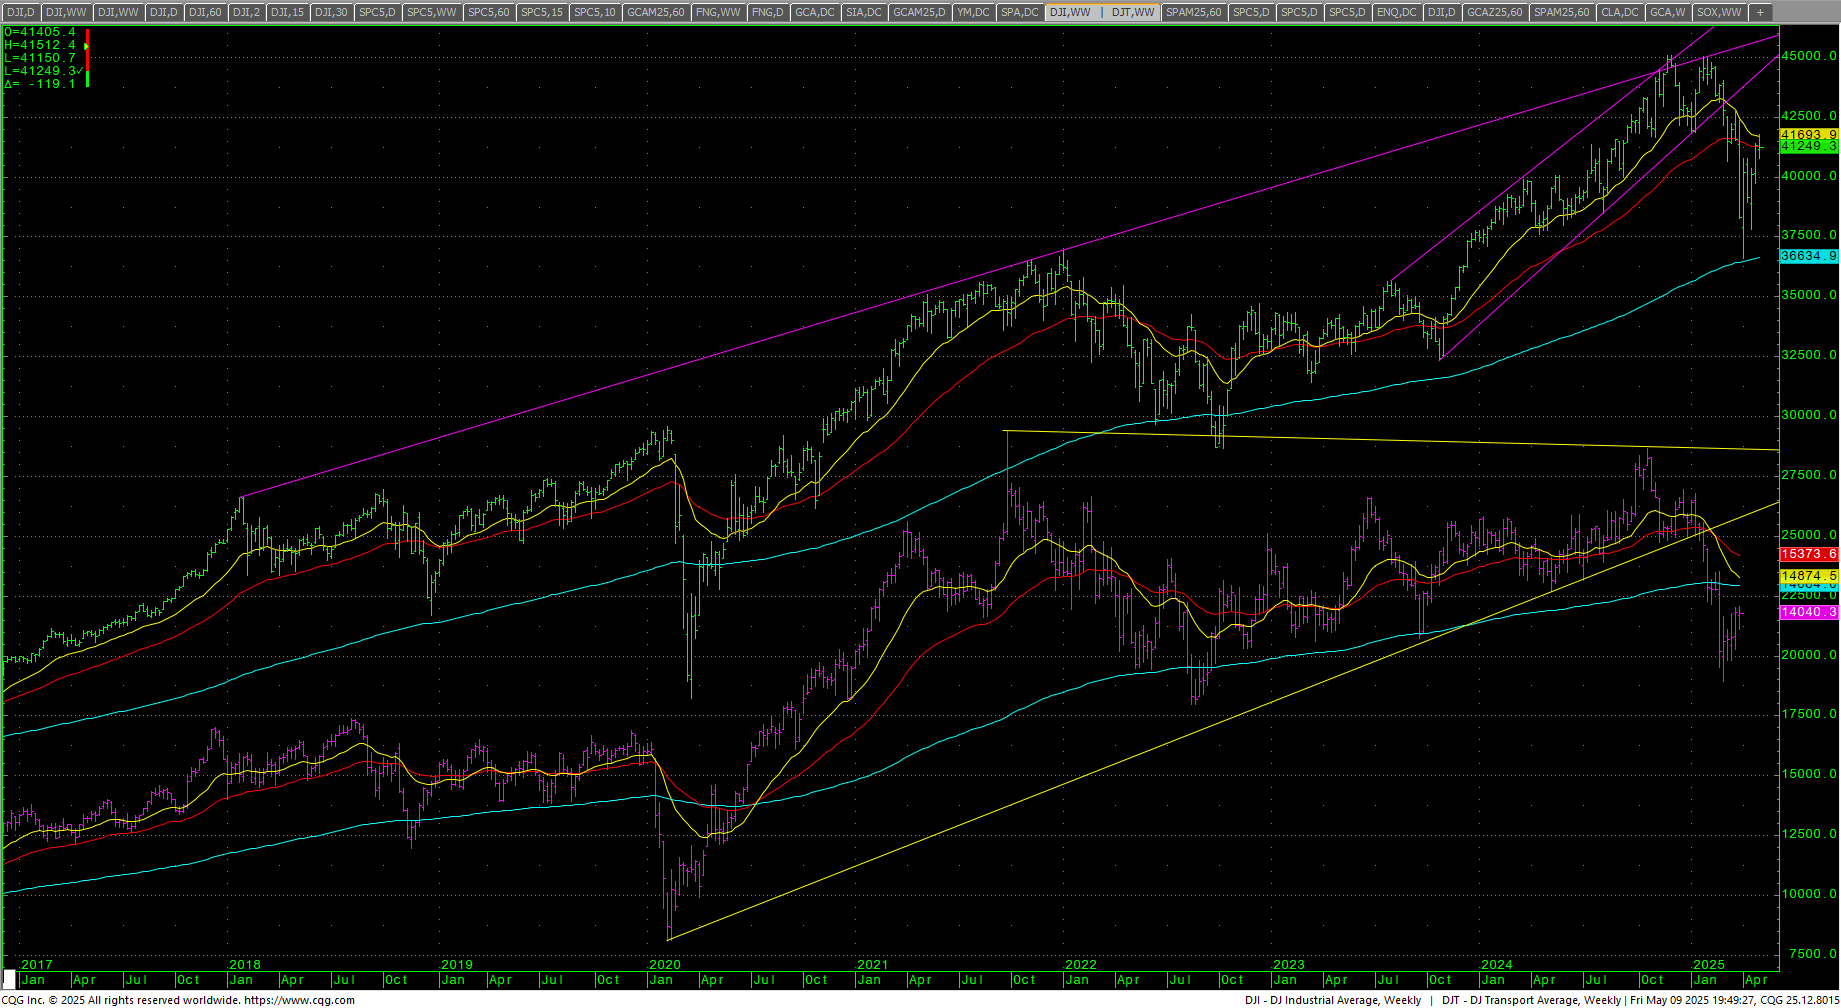 Dow Theory remains bearish, and the Transports appear to be building a bear flag. Since the DJTA is heavily weighted to airlines, it might suffer more as airline traffic is expected to decline sharply in 2025.
 MAGS (Magnificent 7) Daily H-L-C
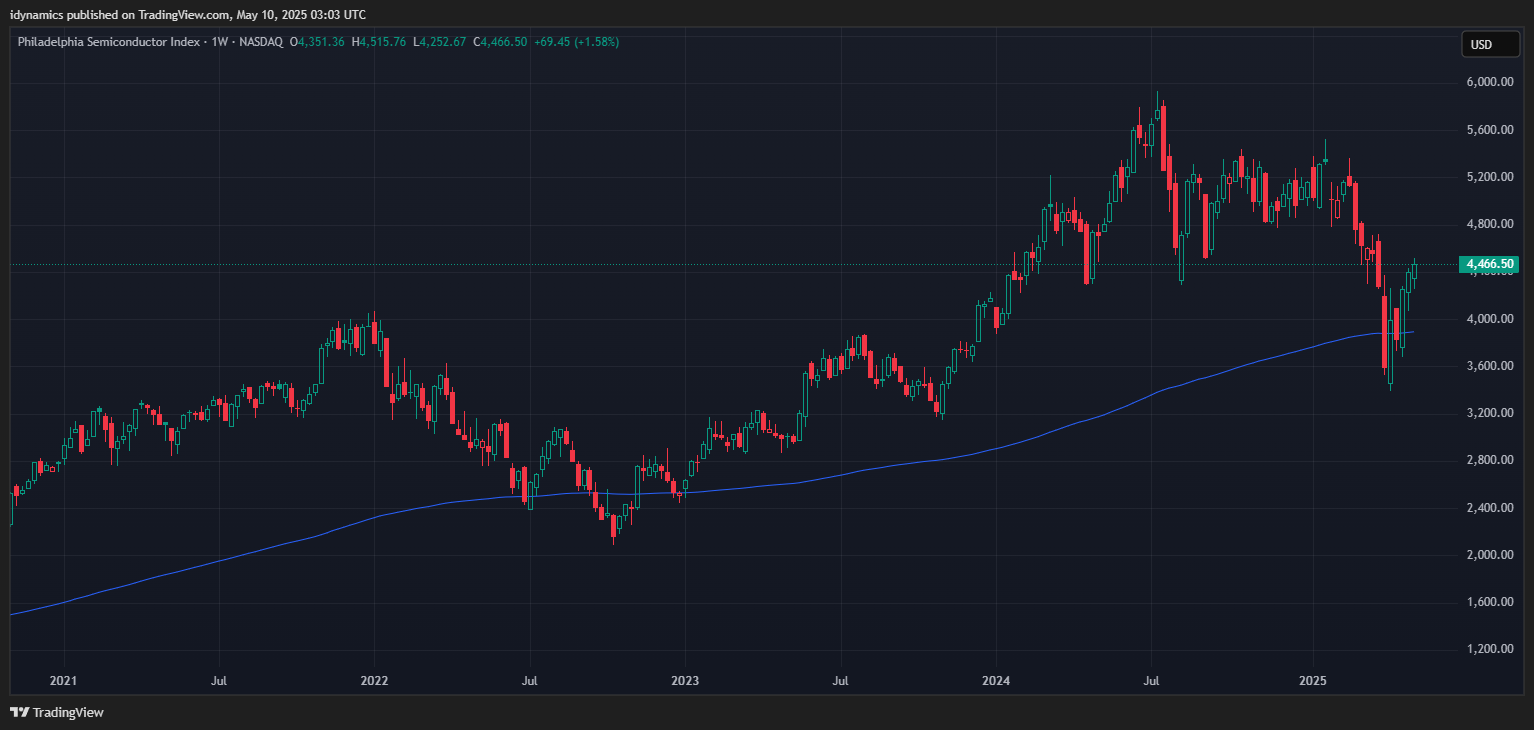
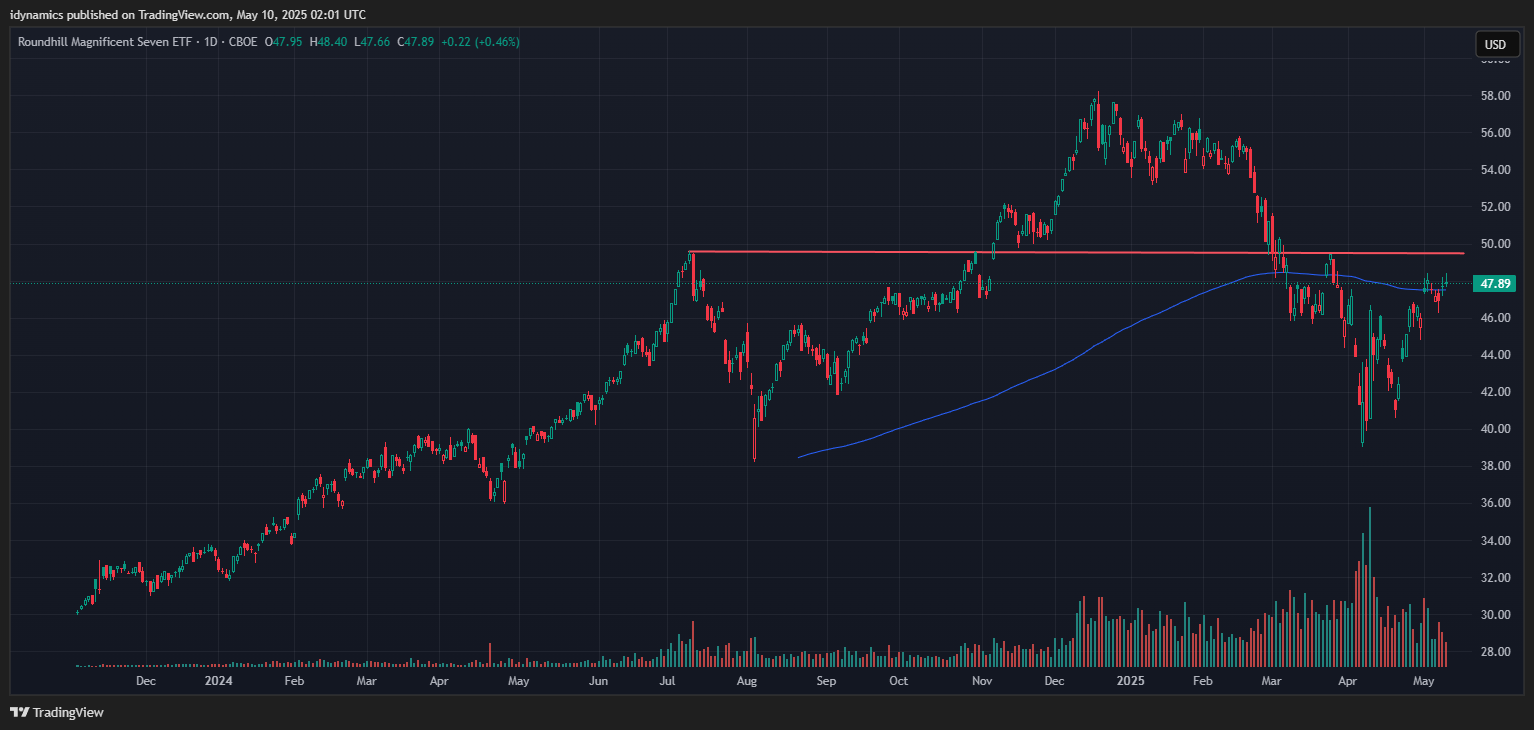 The MAGS (Magnificent 7) closed down -0.15% toward the upper portion of the weekly range as it continues to retest critical resistance at 48/50. Volume is drying up. Comments are the same. If we are mapping out a large H&S top, the 50 level is critical for the right shoulder. Closes over 50 in the MAGS would change things. Long-term, the chart is still on the defensive, with the potential to trade all the way down to new lows. Selling rallies against 48/50 should remain the short-term strategy until proven otherwise. On the MAGS, it is worth noting that the SOX chart remains a bit stronger with three bullish weeks in a row. However, one extremely critical thing to be aware of is that we are likely within DAYS of the announcement of DeepSeek R2. DeepSeek R2 has the potential to flatten the tech heavy indices upon its official announcement.
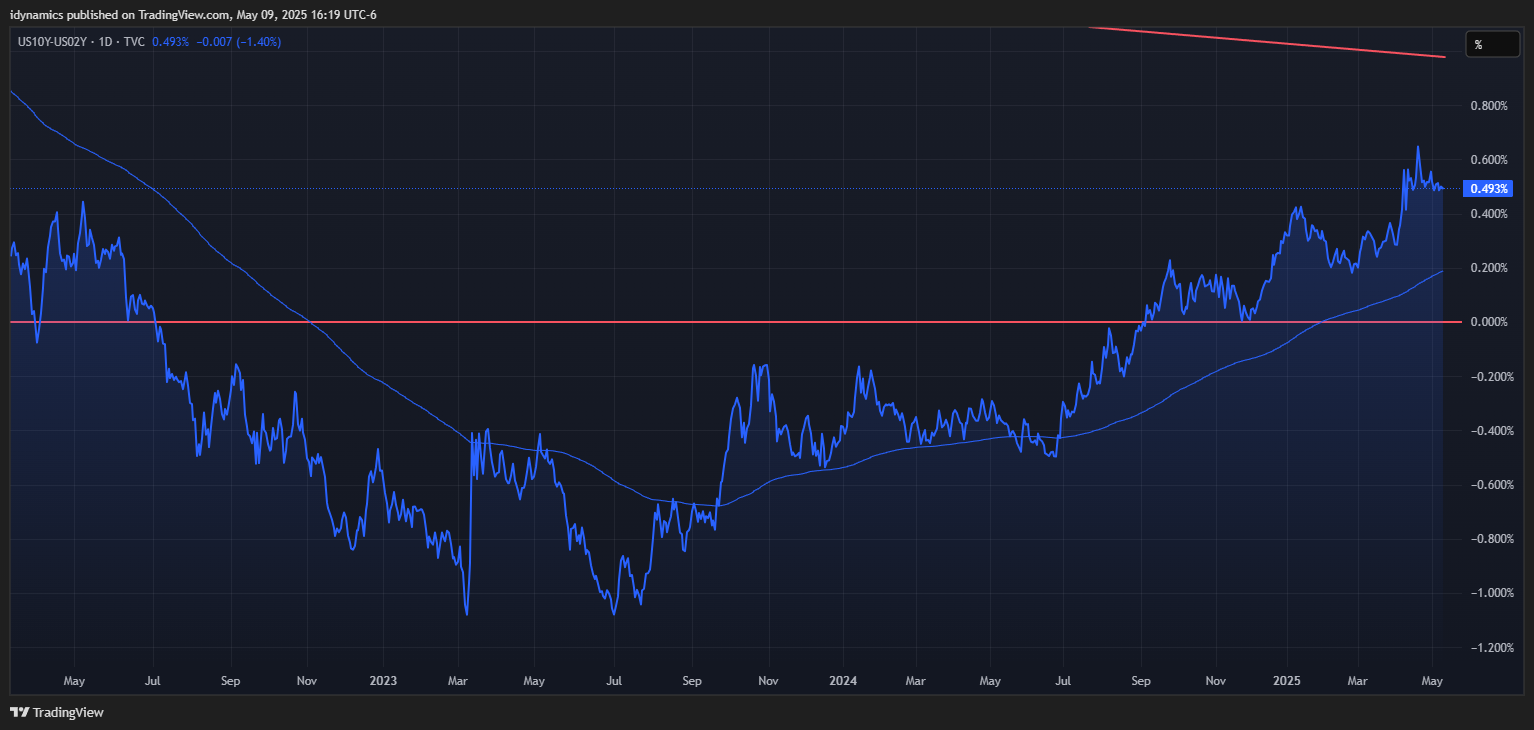
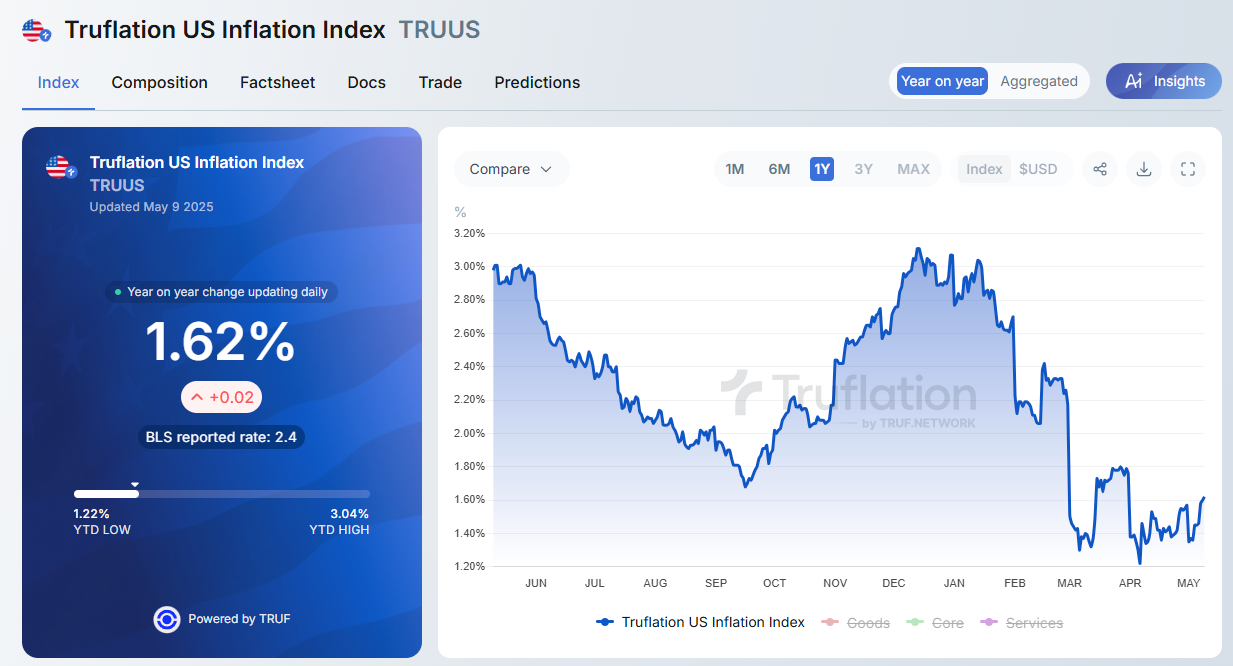
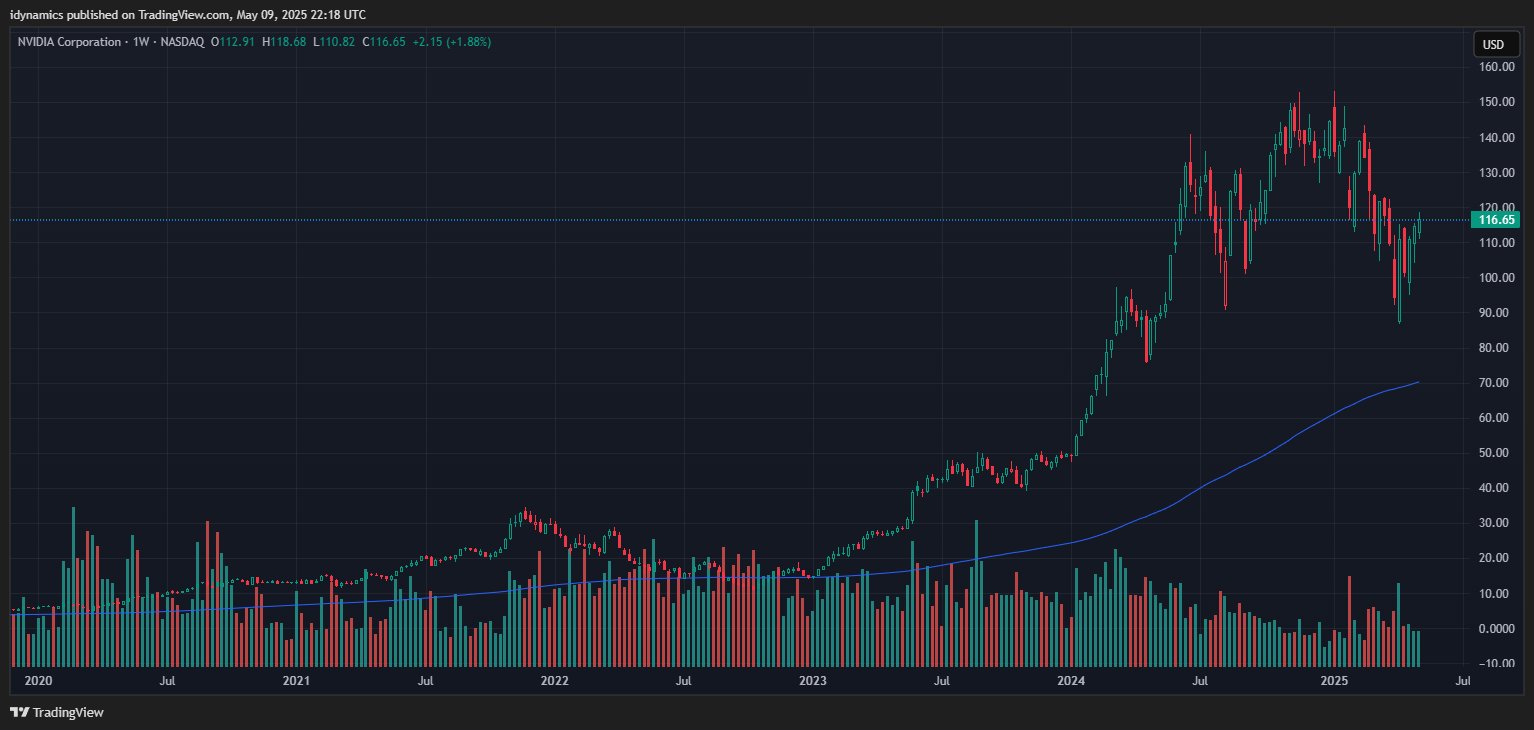
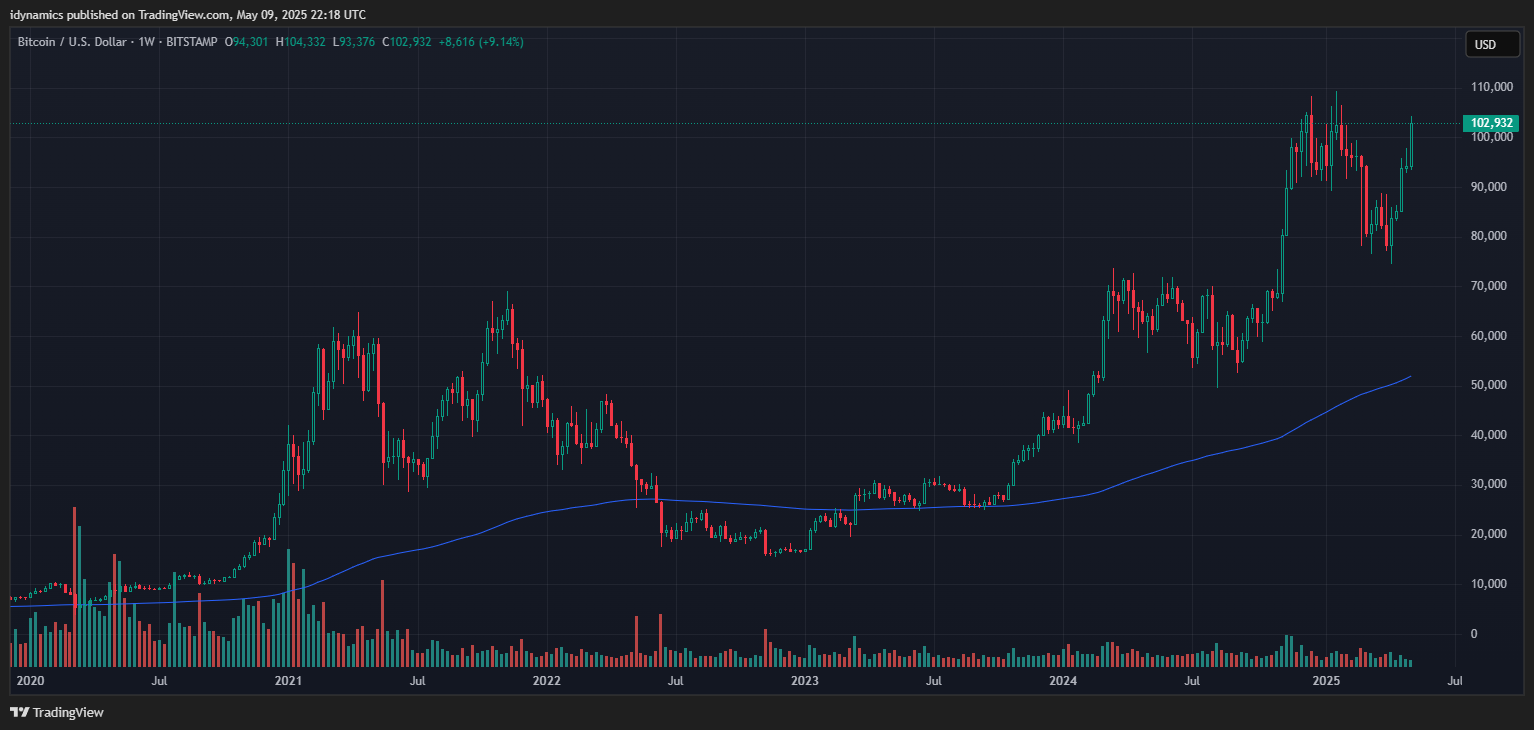
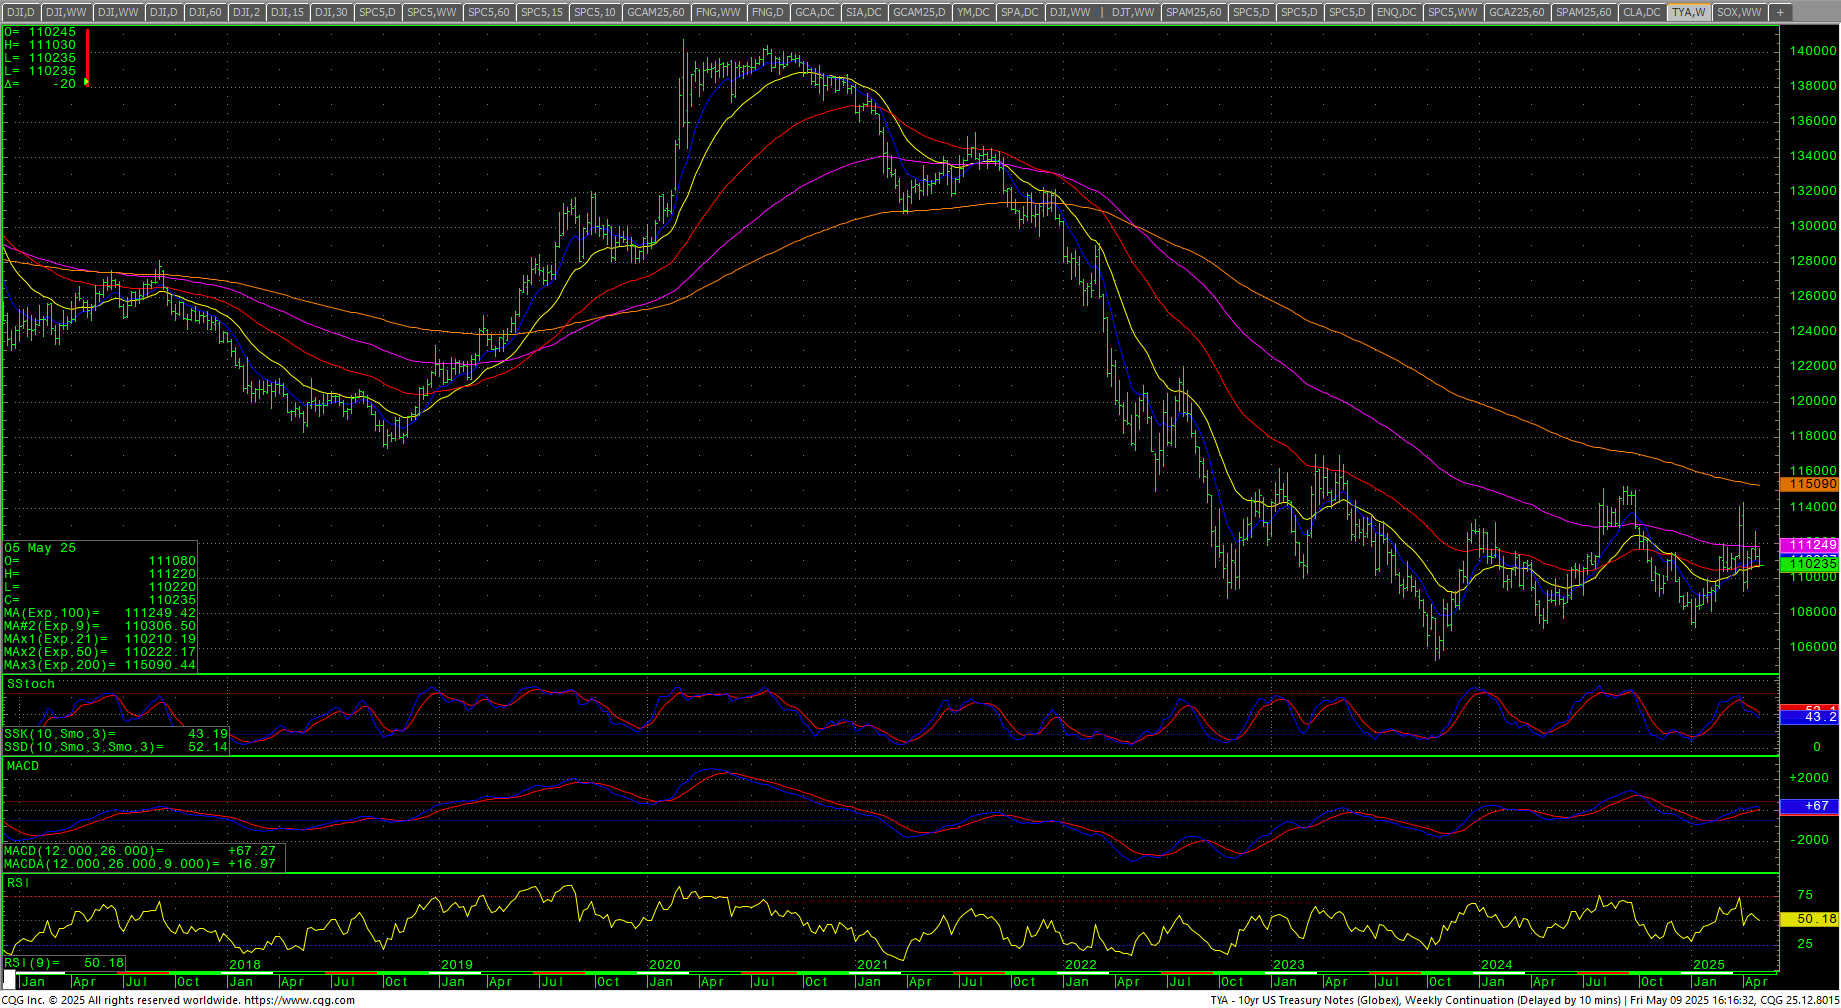
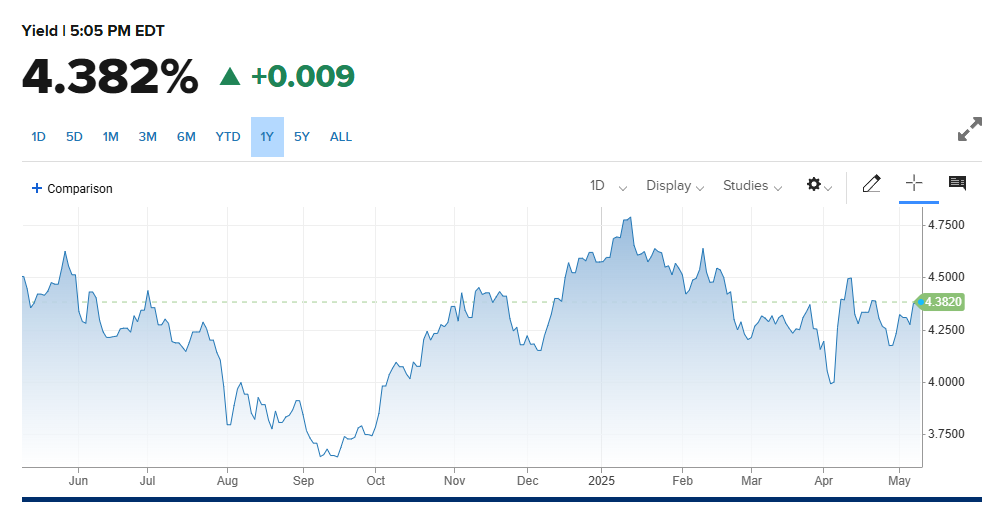
The RSP:SPY closed higher as the chart churns against long-term lows. The IWM has five bullish candles in a row as it closed up +0.16% on the week. The RSP also has five bullish weeks and settled the week up +0.40%. NVDA is testing critical overhead and trendline resistance on the chart as it ended up +1.88%. Bitcoin rocketed back above the $100K level and volume is also declining on the rally, closing up +9.24% on the week. McClellan Oscillators are confirming the rally in the Dow. The Yield Curve closed out the week flat +0.493%. The 10YR yield closed out the week higher at 4.382%. Truflation jumped to 1.62%.
10YR-2YR Yield Curve Daily

 VIX Weekly Candles
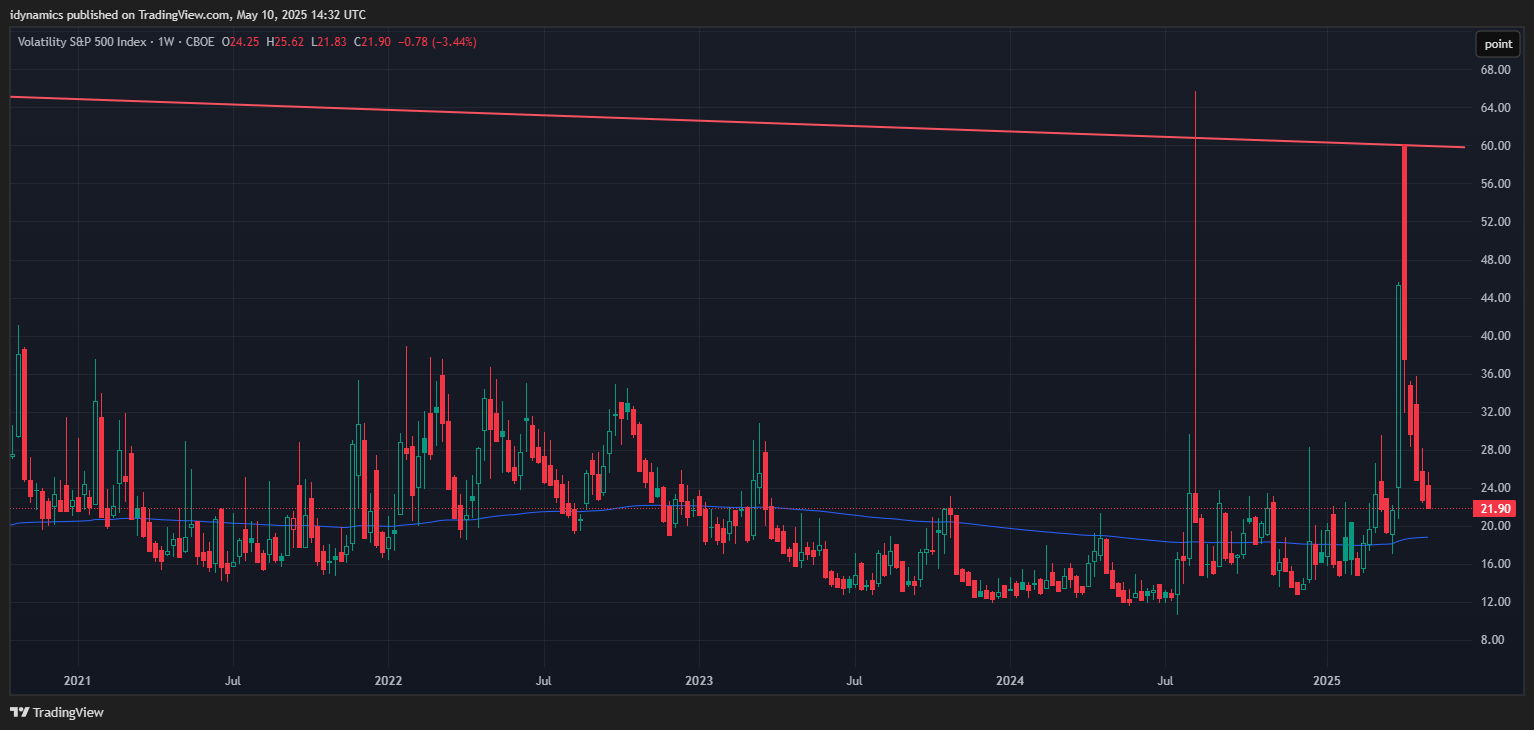
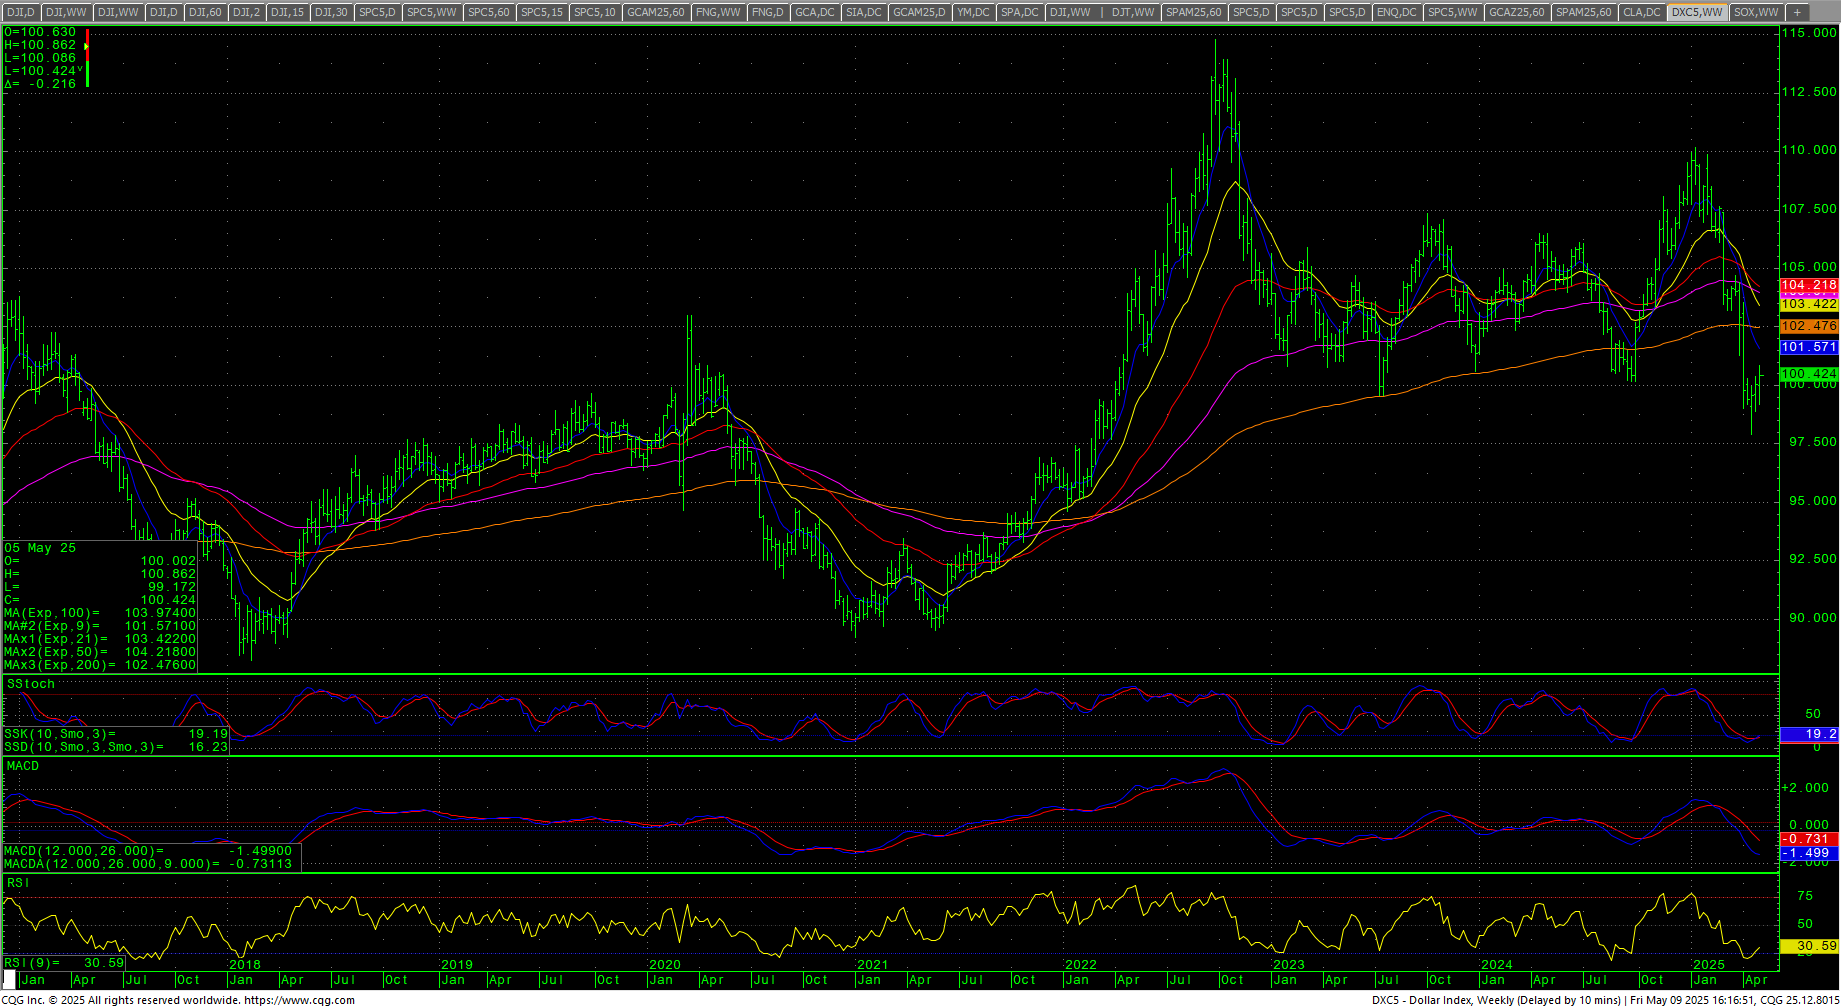
The VIX declined most of the week and closed at the weekly low as is retests the 20 level. Rumors are that Dark Pool Money was shorting the VIX late last week. The US Dollar closed the week higher, just above the 100 level as it builds a bear flag pattern on the daily.
 Nasdaq 100 Weekly Candles
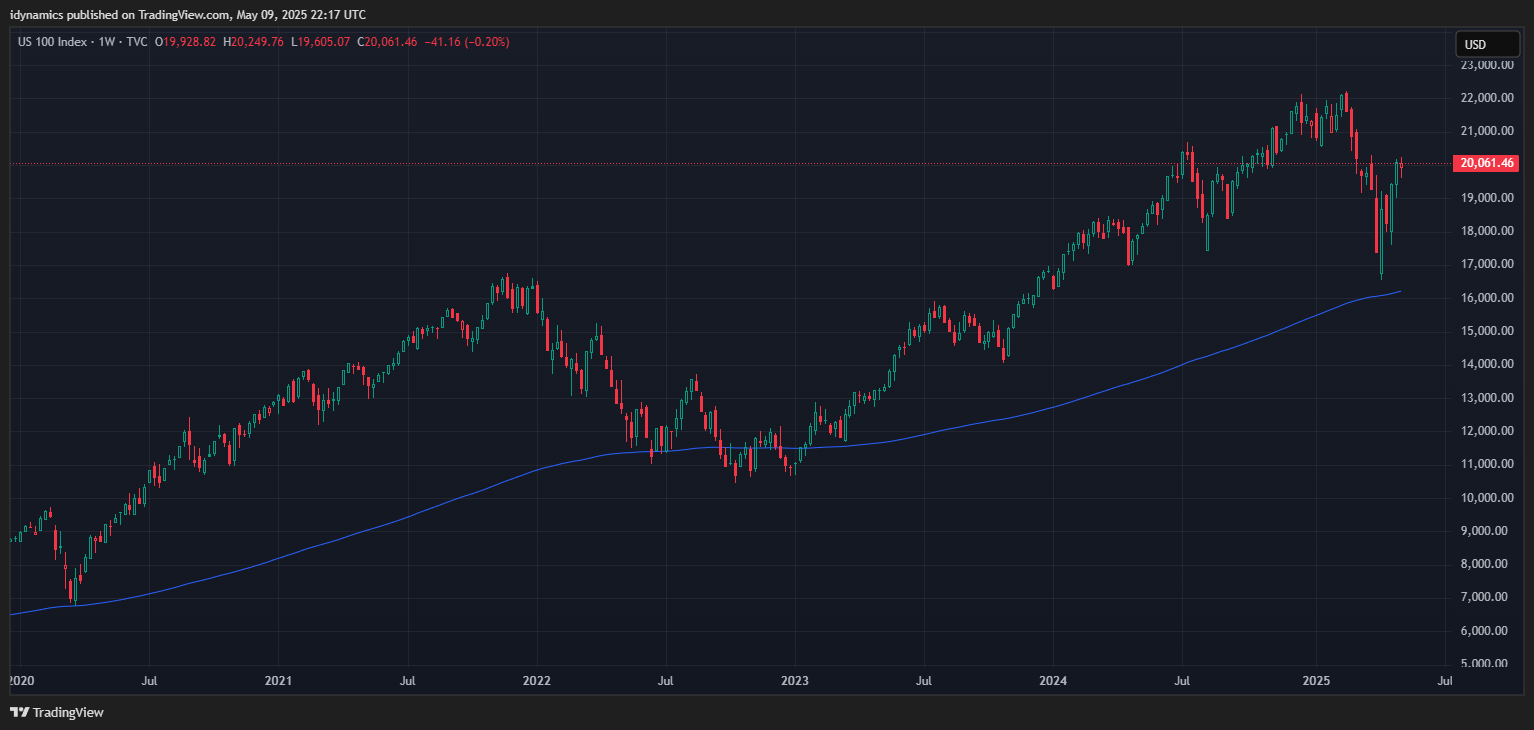
Daily Breadth 
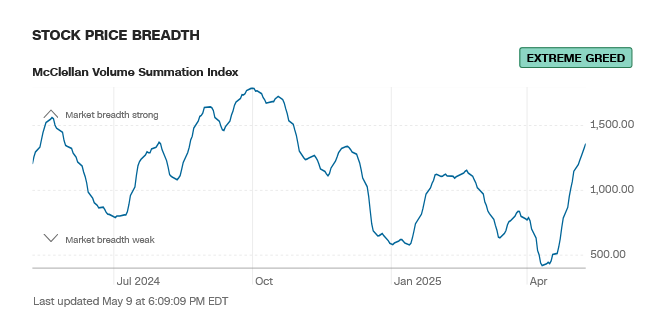
Breadth moved up sharply to new highs for 2025 and sentiment now reads extreme greed.
CNN Fear & Greed Index
 AAII Investor Sentiment Survey
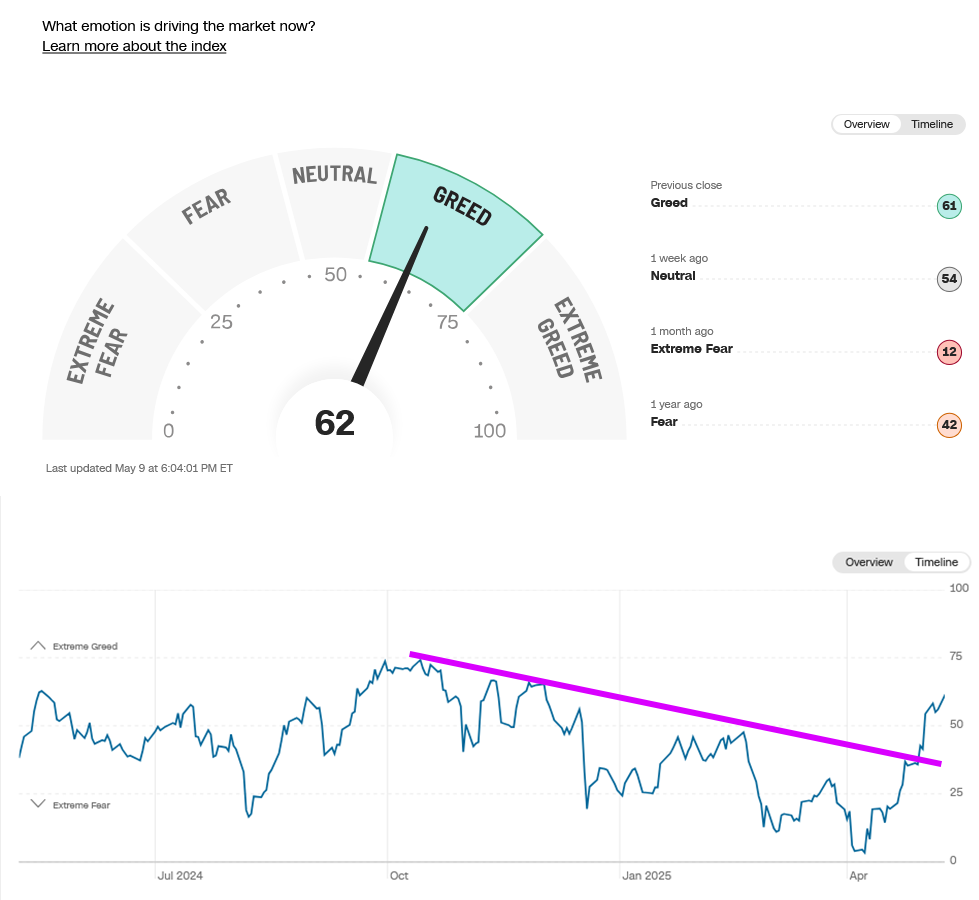
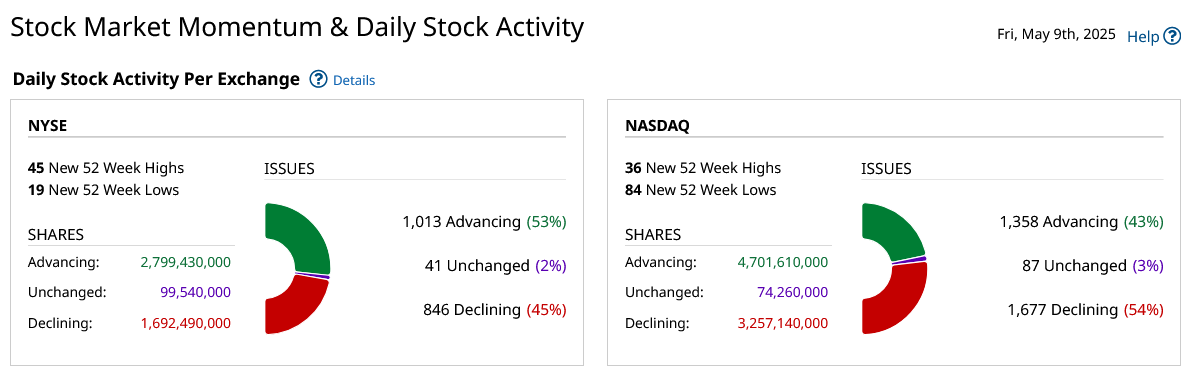
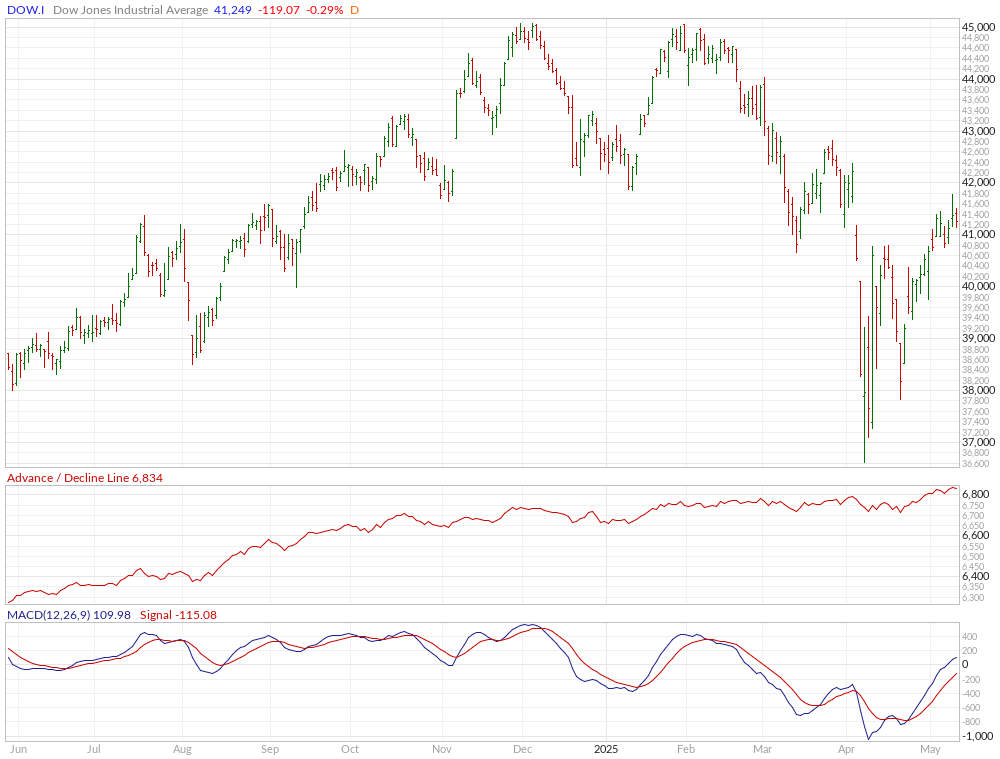
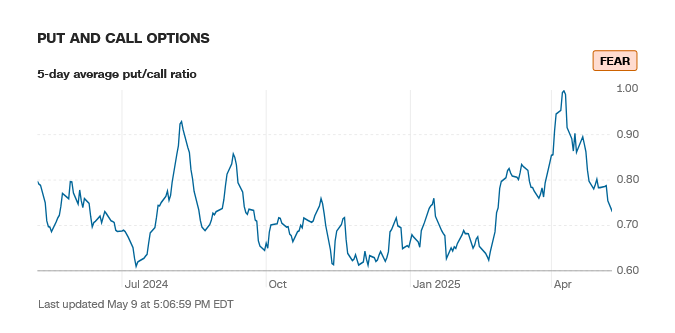
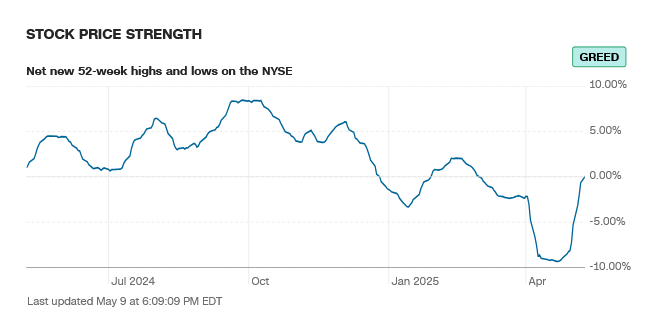
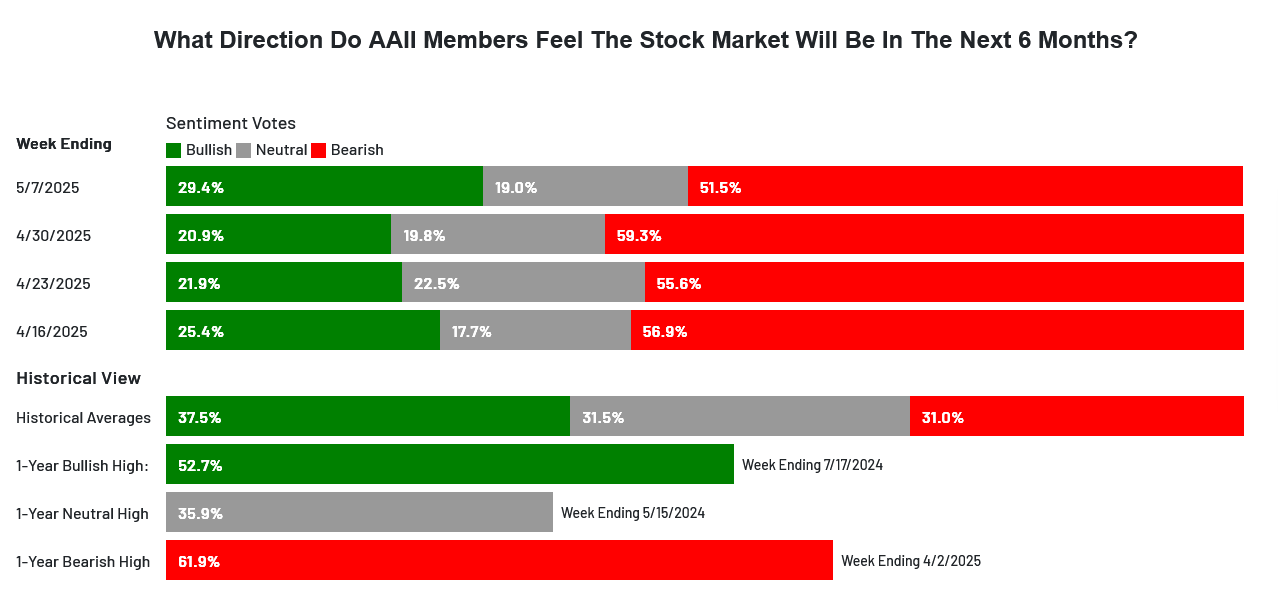 Sentiment moved to greed and extreme greed on a number of fronts. The CNN Fear and Greed Index moved up to 61 and now reads greed. It has broken the trendline on the weekly and reached the highest levels since late 2024. Breadth moved up sharply to new highs for 2025 and sentiment now reads extreme greed. Latest AAII Sentiment Survey: Optimism Leaps. The Dow A/D ended at 6834, this is a new record high…even with prices well off the records. The VIX sold off most of the week and closed on the lows, down -3.44% on the week. The Put/Call dropped to 0.73 and still reads fear. The 52-week, A/D moved up to +0.06% and now reads greed. The Dow closed the week down -0.16%, closing in the middle of a reversal range. The S&P was off -0.47% toward the middle of a reversal week’s range. The Nasdaq Composite was down -0.27% and the Nasdaq 100 was down -0.20%. The FANG led the way down, closing off -1.28%. The Russell was up +0.12%, posting the 5th weekly gain in a row. The 10-year notes closed lower on the bottom of the weekly range. The yield on the 10YR increased to 4.382%.
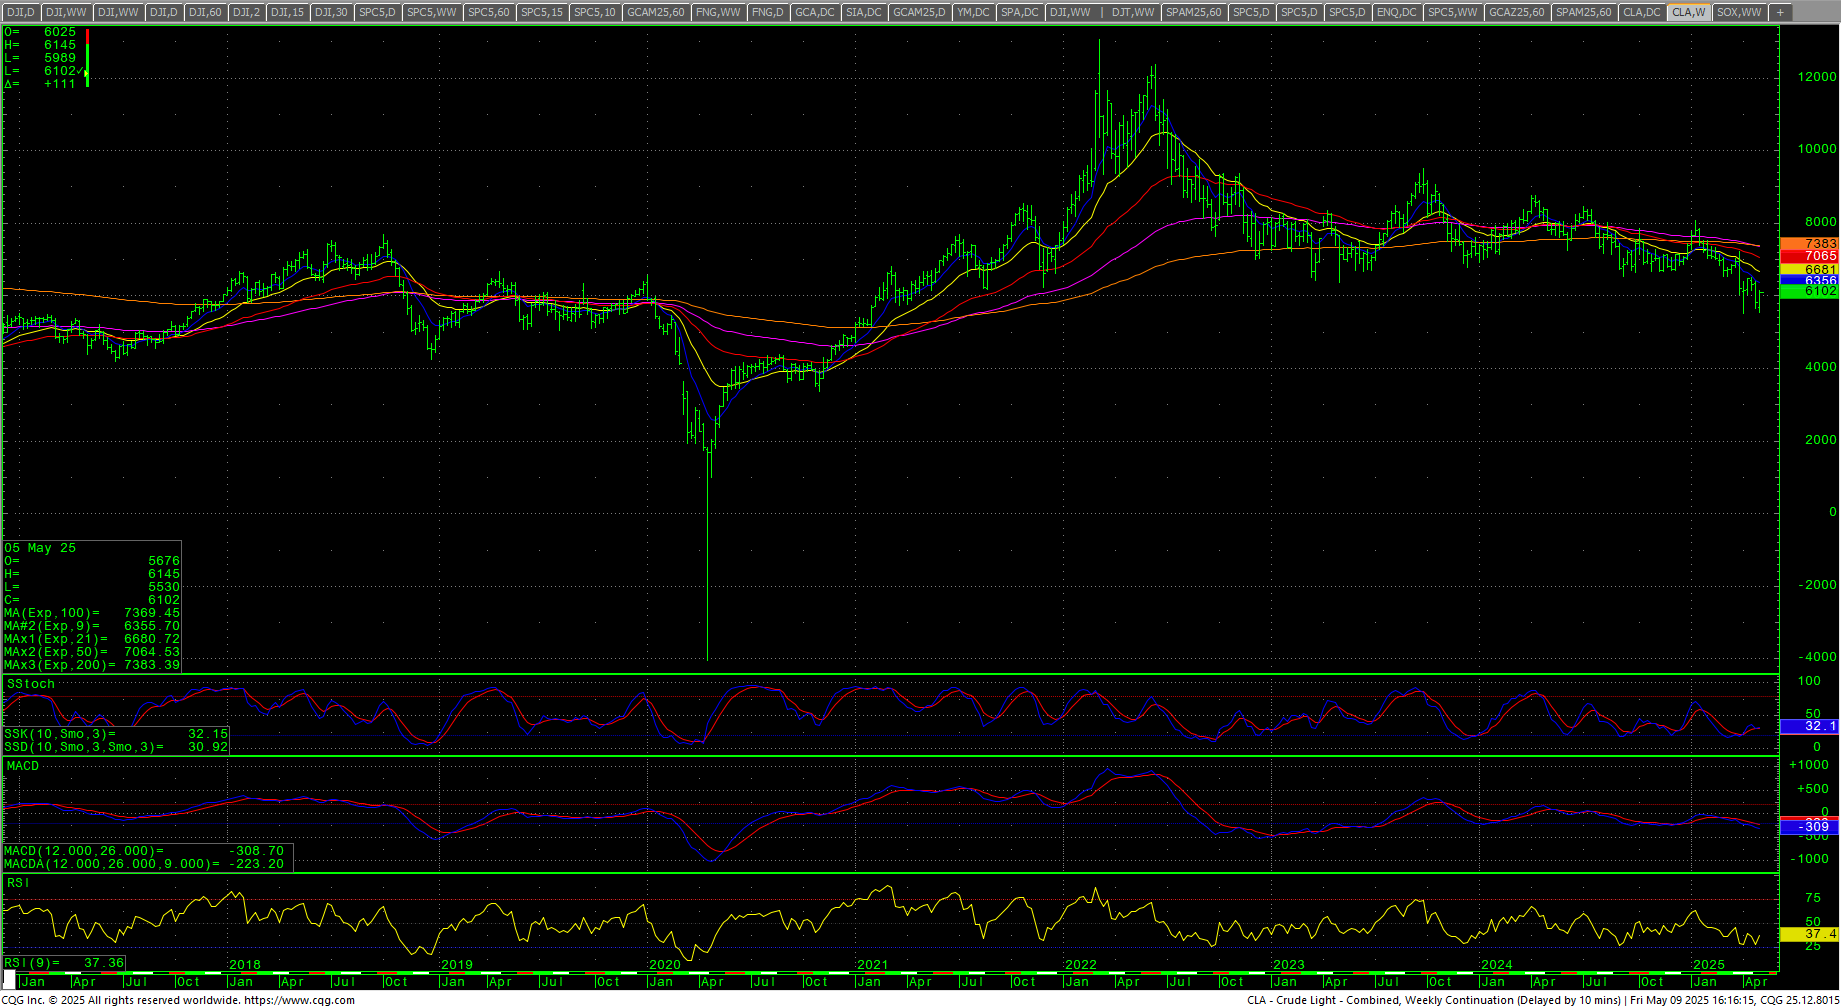
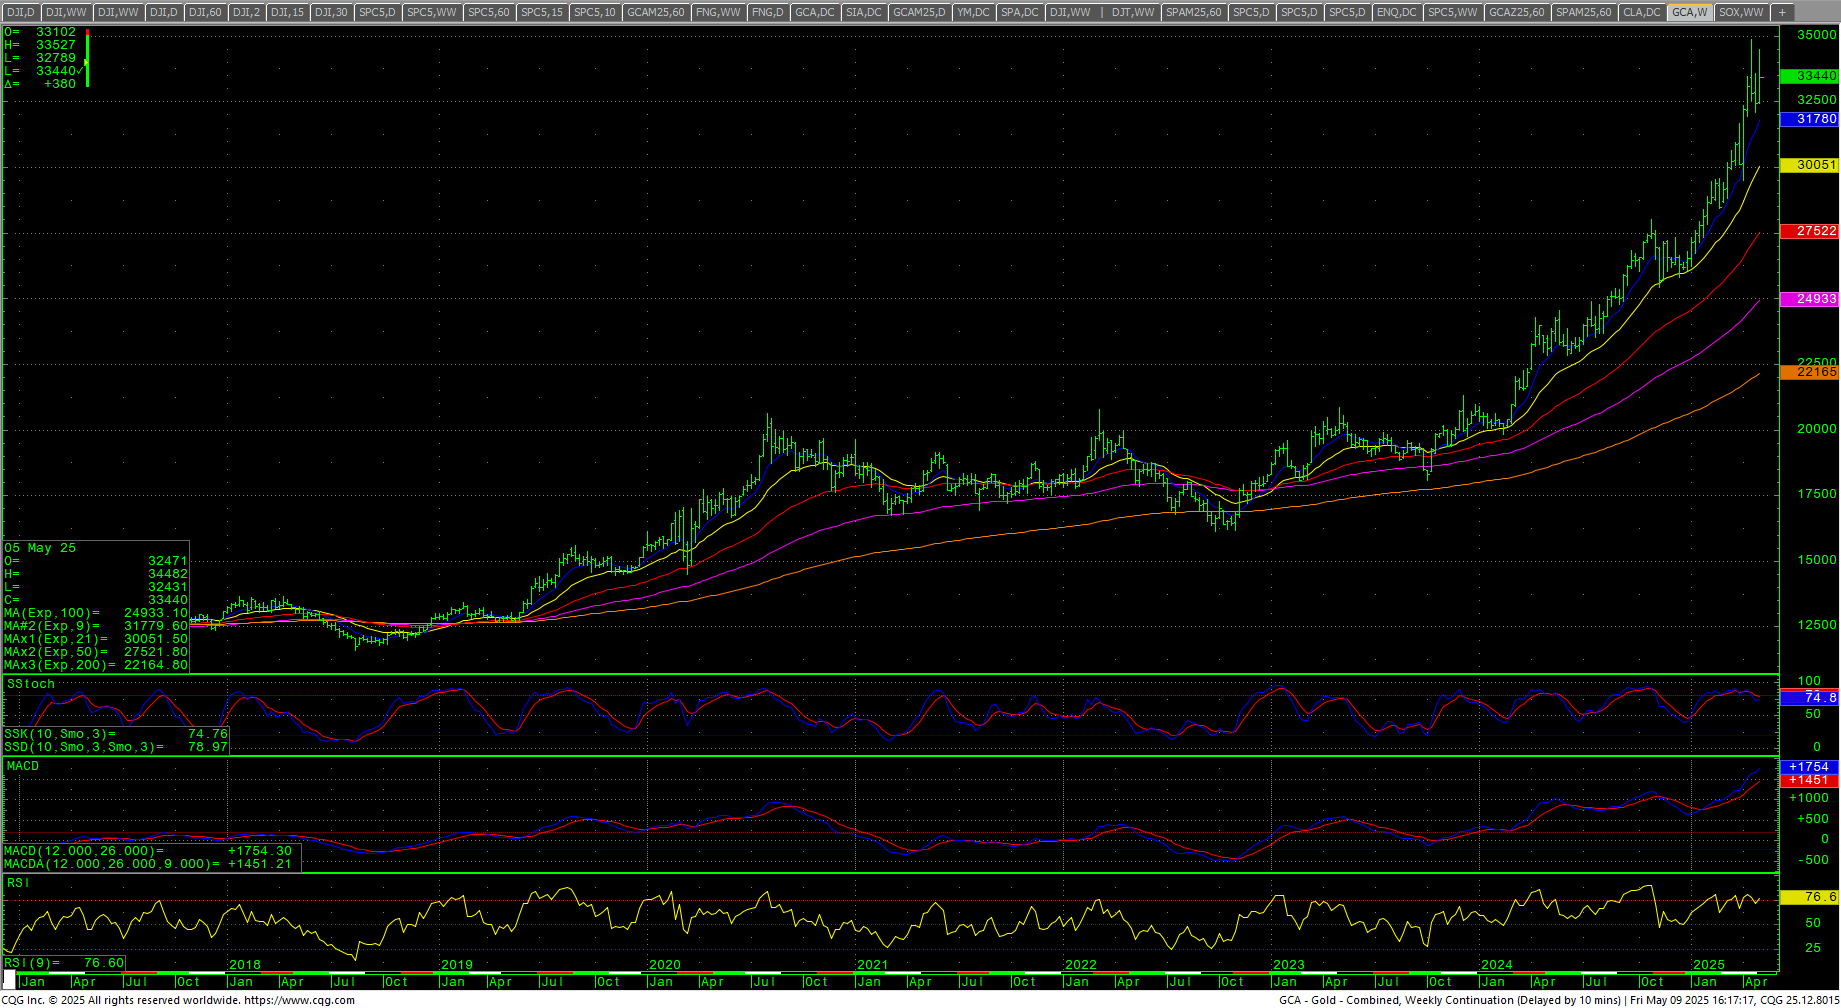
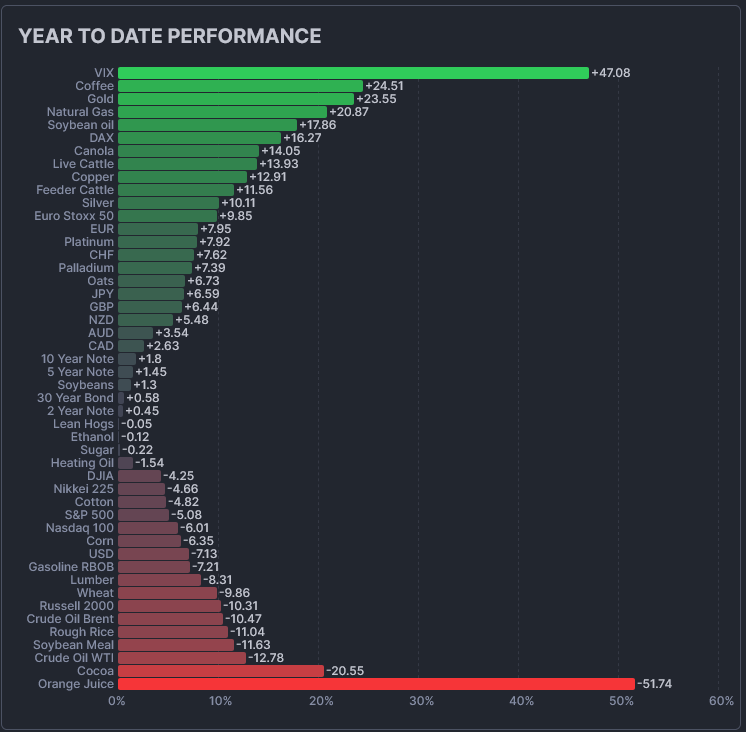 The CRB Index bounced slightly as crude oil reversed from multi-year lows and regained the $60 level. The CRB was up +0.90%. Crude oil reversed higher as it regained the critical $60 level. Gold closed higher in a volatile week, in the middle of the week’s range at a new all-time weekly high close. The CoT for the S&P 500 saw very little shift in positioning. The CFTC S&P 500 Non-Commercial Net Positions dropped to -76.4K. It looks like there may still be traders willing to short the market here. Sellers have a 6 day window.
Timing Points
Monday/Tuesday mark CRITICAL timing (see above). Monday, we get the April Federal Budget numbers (est: $256B). Tuesday is CPI (est: +0.2%) and YOY (est: +2.3%) with Core CPI (est: +0.3%). Thursday is Retail Sales (est: +0.1%) and PPI (est: +0.3%), Core PPA (est: +0.3%) and YOY. Friday sees Housing Starts and Building Permits along with May Consumer Sentiment. 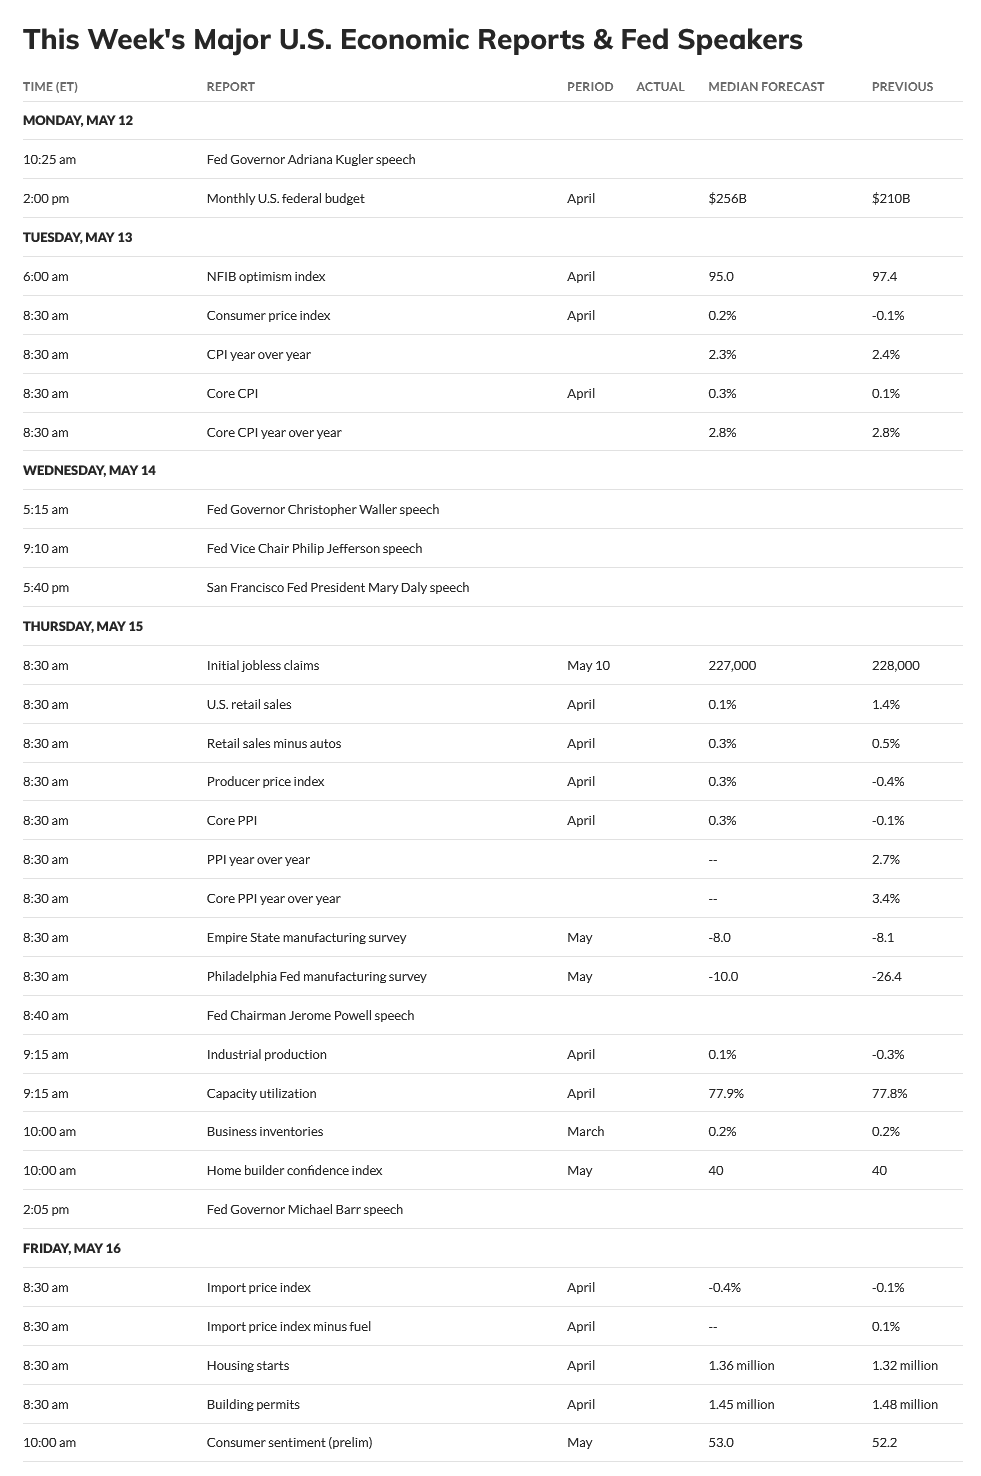
- 05/13 *** X critical, fast moves
- 05/20 **
- 05/29 *** X critical
Dow Jones Industrial Average
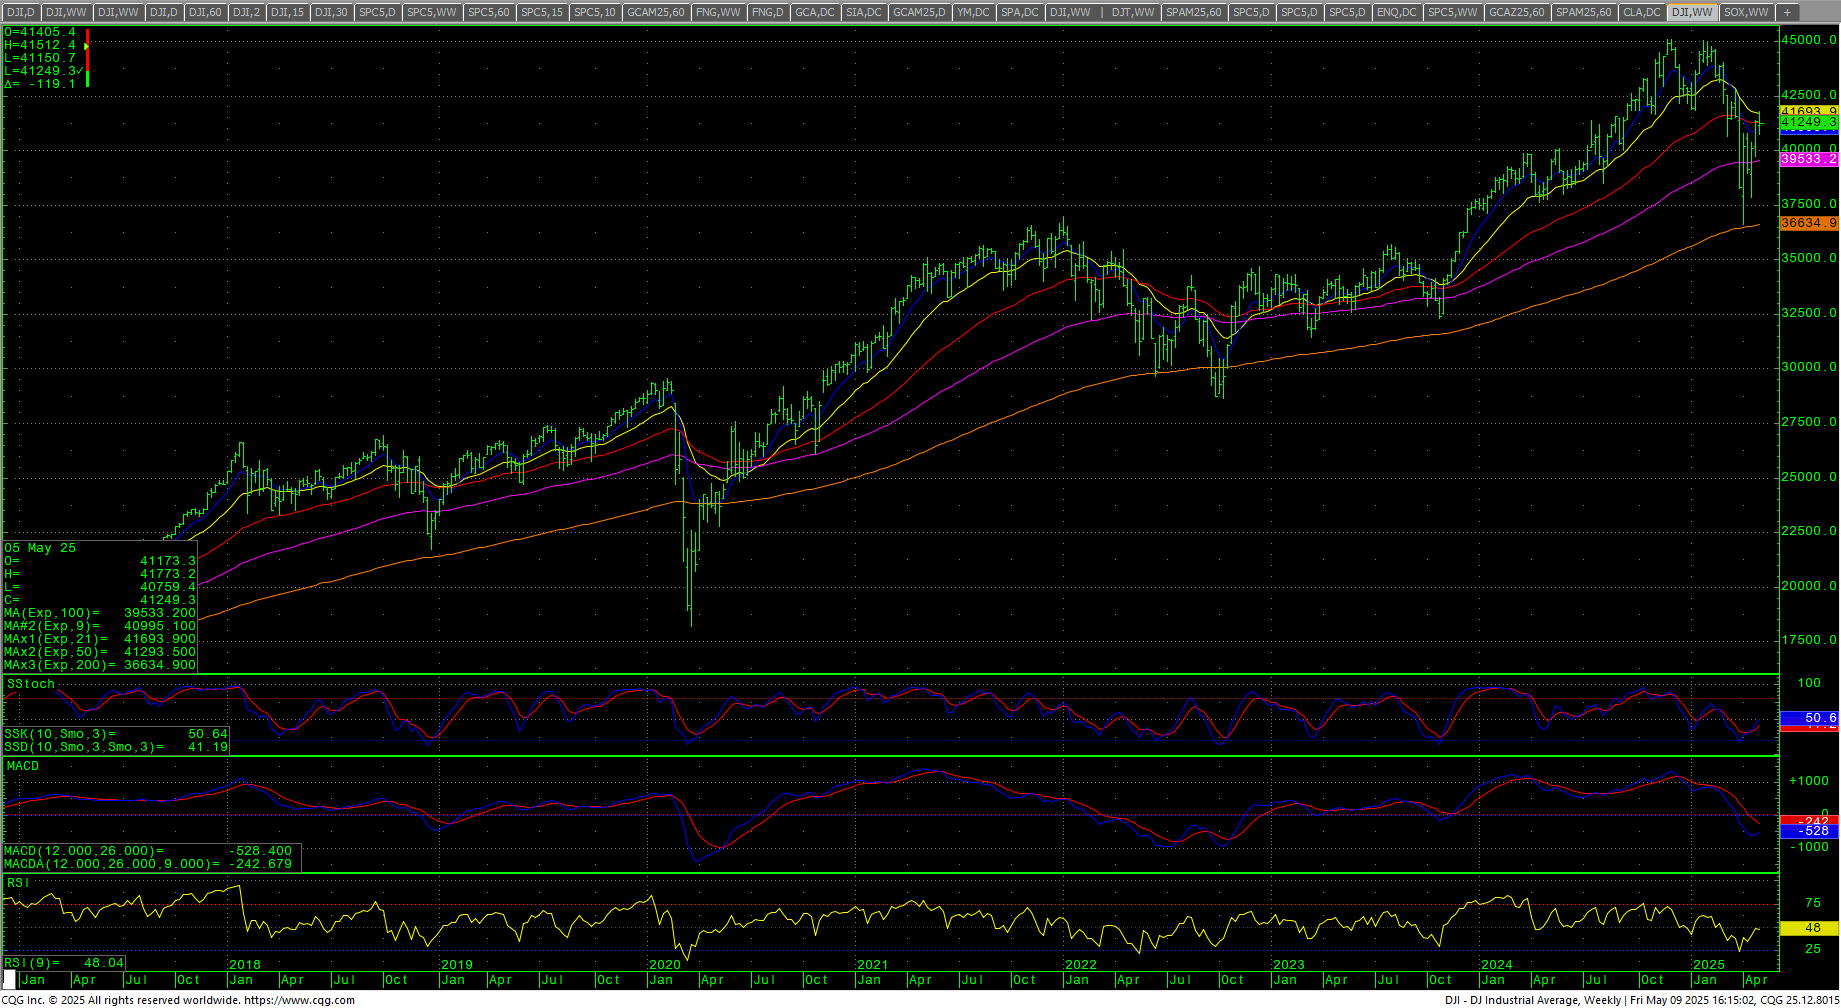
Dow Jones Industrial Average Weekly Candles
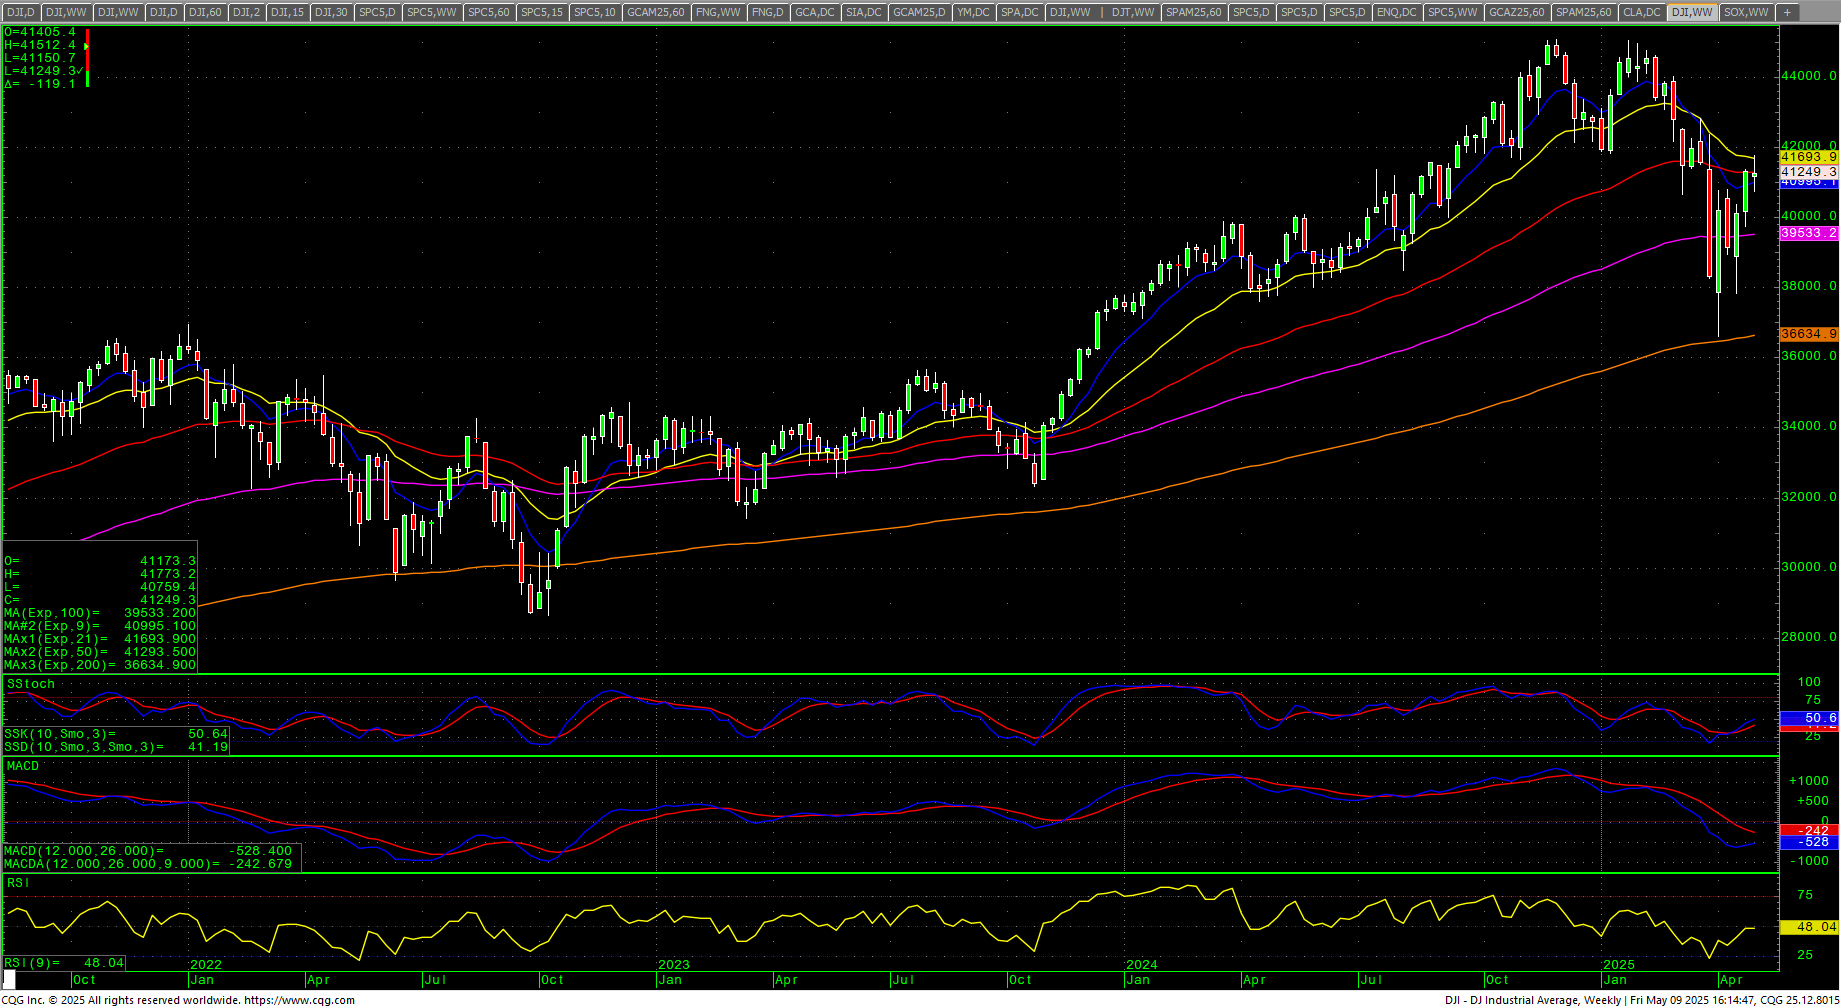 The Dow closed down -0.16% in the middle of the weekly range. The daily is just above the 50-day MA and just under the 200-day MA and those averages remain in a Death Cross. The daily stochastics are now extremely overbought and the MACD is reaching overbought conditions. The RSI is now at 59.70. The weekly stochastics have hooked higher from oversold conditions. Prices settled right back into the “Death Zone” from the 26 March 2025 high to the 7 April 2025 low. That zone remains 41269 through 41356. The 200-day MA starts the week at 41569 and is flattening out. The gap on 2 April 2025 is now filled at 41629.7 (see above).
Dow Jones Industrial Average Weekly H-L-C
 Resistance remains critical in this Death Zone level through 41356 area. Daily closes above 41356 should minimally test critical resistance at 41829/41835 with gap resistance at 41629/41630 and swing resistance at 41773. Closes over 41835 opens counts to 42822 and 42943 through 43061. A breakout above 43061 sets up a retest of the record highs at 45050/45054 with key resistance at 44033/44034.
Dow Jones Industrial Average Hourly H-L-C
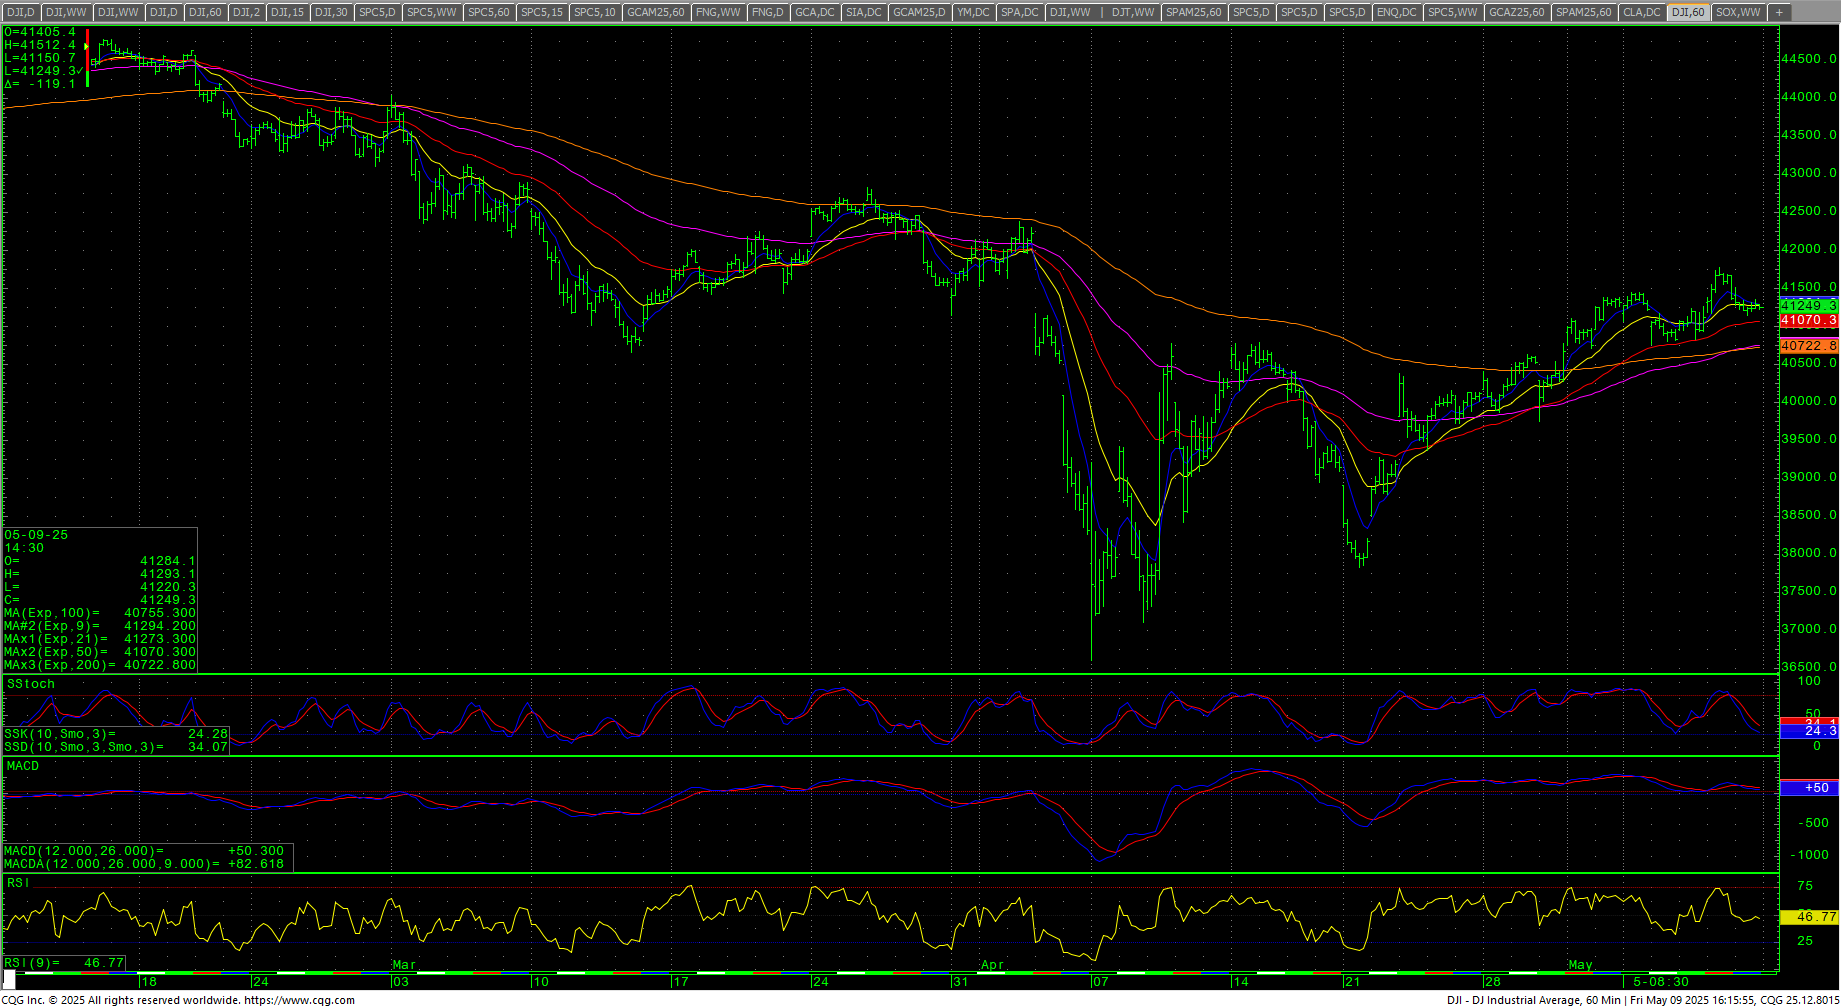 The hourly is neutral on Friday’s close. Support is at 40998 and a breakdown under that level should test 40759 with counts to pivotal near-term support at 40549 through 40520/40515. A breakdown under 40515 sets up 40262 with full counts to pivotal short-term support of 39333/39330. A breakdown under 39330 are bearish for a test of 39188 into critical support at 38580/38575. Closes below that support should minimally test 37900 through 37828 and would open counts to retest the 36611 low with support at 37103.
| Resistance | Support |
|
|
S&P 500 Cash Index: SPX
S&P 500 Index Weekly H-L-C
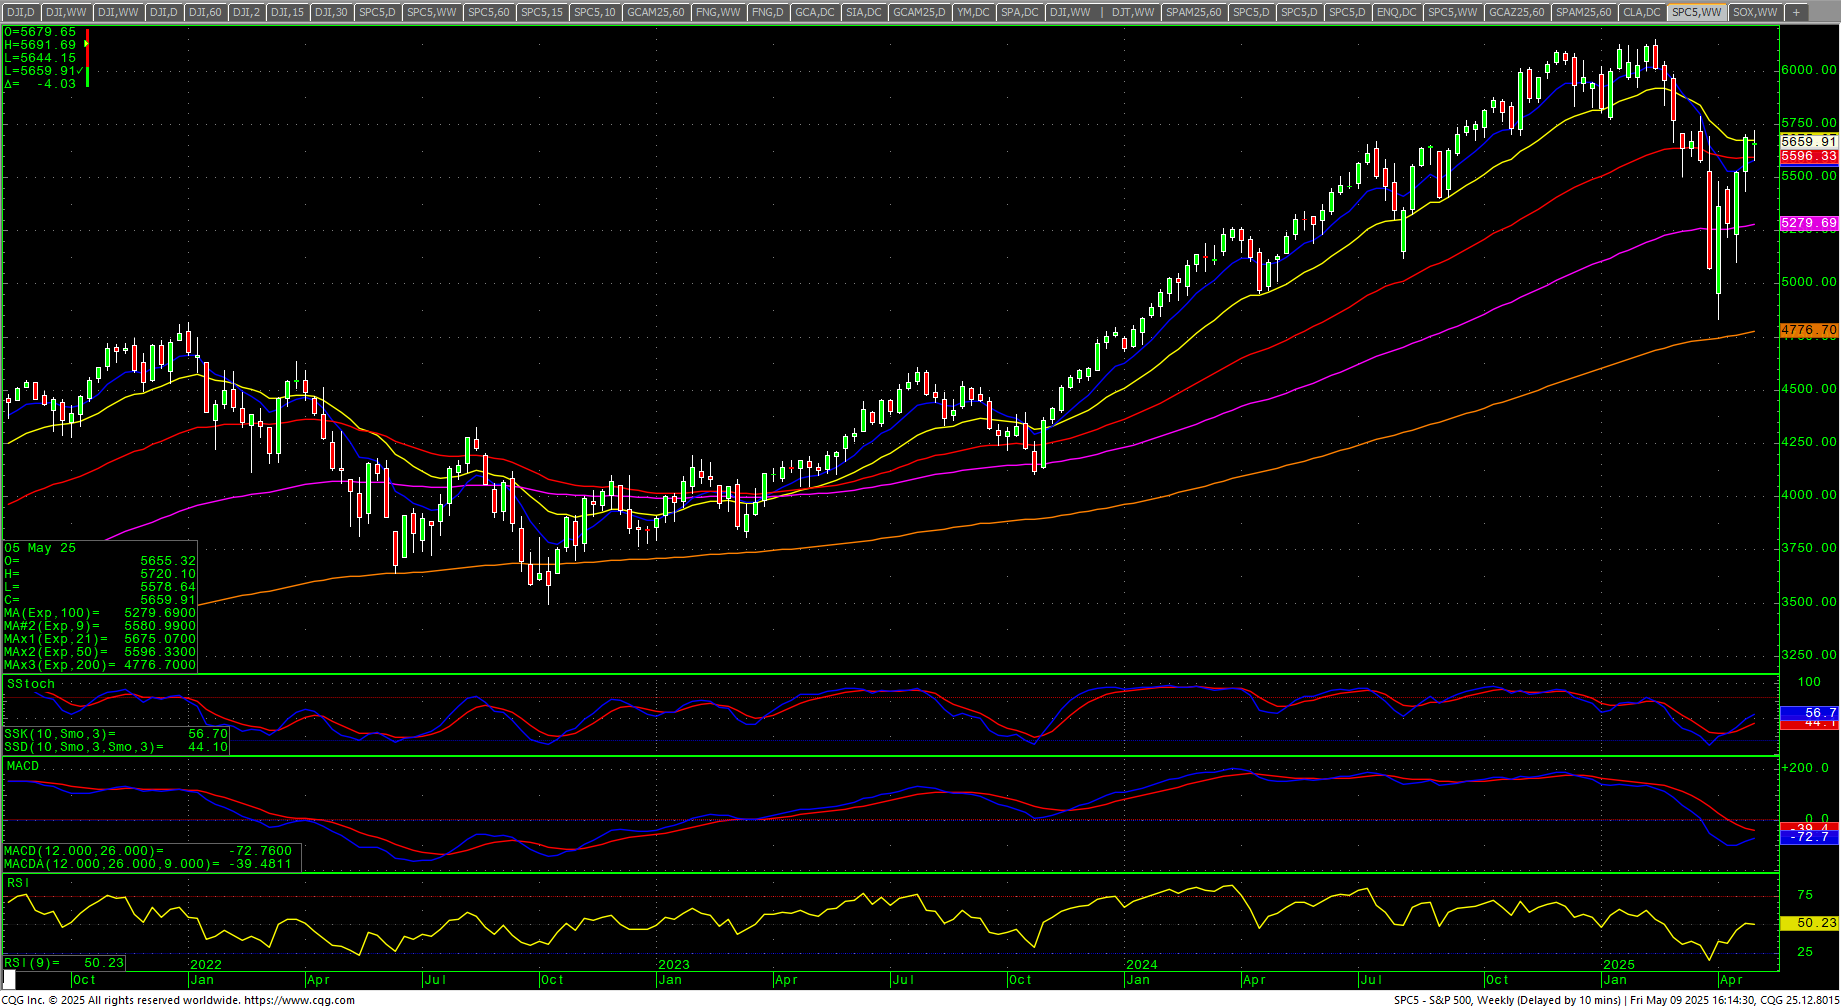
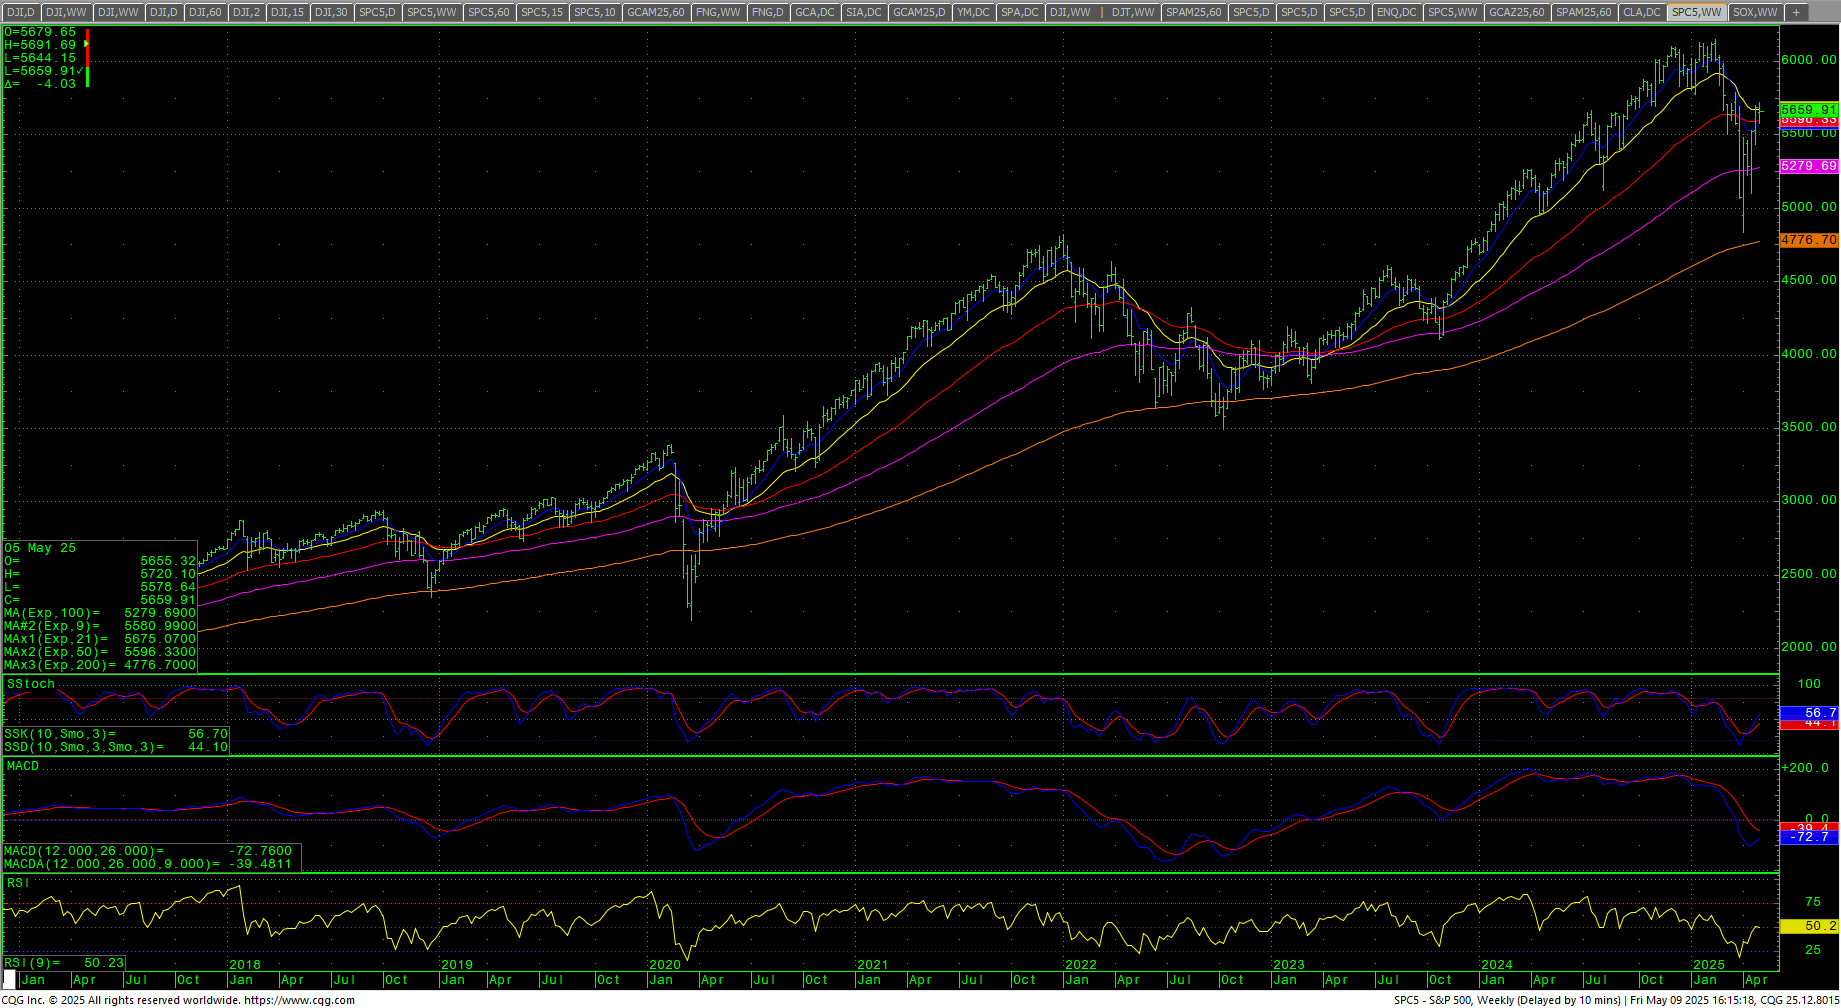 The S&P closed the week slightly lower in a weekly reversal toward the middle of the week’s range. Prices are above the 50-day MA and the 200-day MA and set a swing high in Thursday’s minor timing. Volume has dried up. The daily is overbought with a preliminary bearish divergence and the MACD has reached an overbought condition while the RSI sits at 62.8. The market was able to briefly trade above the 2 April 2025 “Liberation Day” high before falling back late in the week and is now down fractionally from the close 2 April 2025. The daily still has a Death Cross. The weekly has turned up from oversold conditions. The hourly is neutral on Friday’s close. The 200-day MA is 5639.55 and has stalled out in its down trend.
S&P 500 (SPX) Weekly Candles
 SPY Weekly
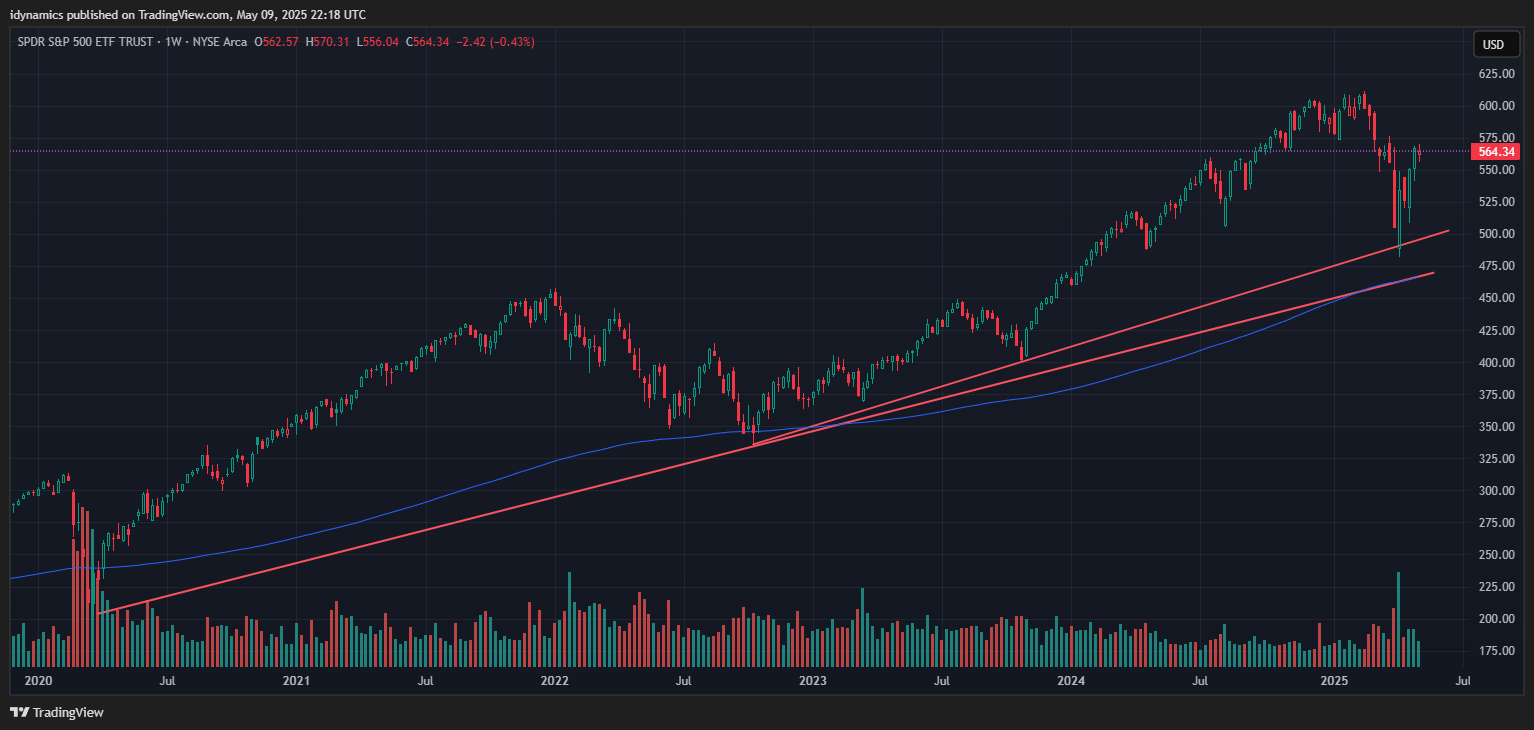 Further rallies with daily closes above 5650 should minimally test 5819/5837 with resistance at 5720, 5735/5740 and 5783/5787. A breakout over 5837 will open counts to 5986 with full potential to 6043 and opens counts to 6112/6114 and full counts into critical resistance at the intraday high of 6147.43. Rallies through 6148 should test 6160 with a shot at a target of 6180.35/6181. Closes over 6181 open counts to 6224 and 6296. Above 6296 can carry to 6368 with counts into the 6440 area. Closes over 6440 will open counts to 6584.
S&P 500 Index Hourly H-L-C
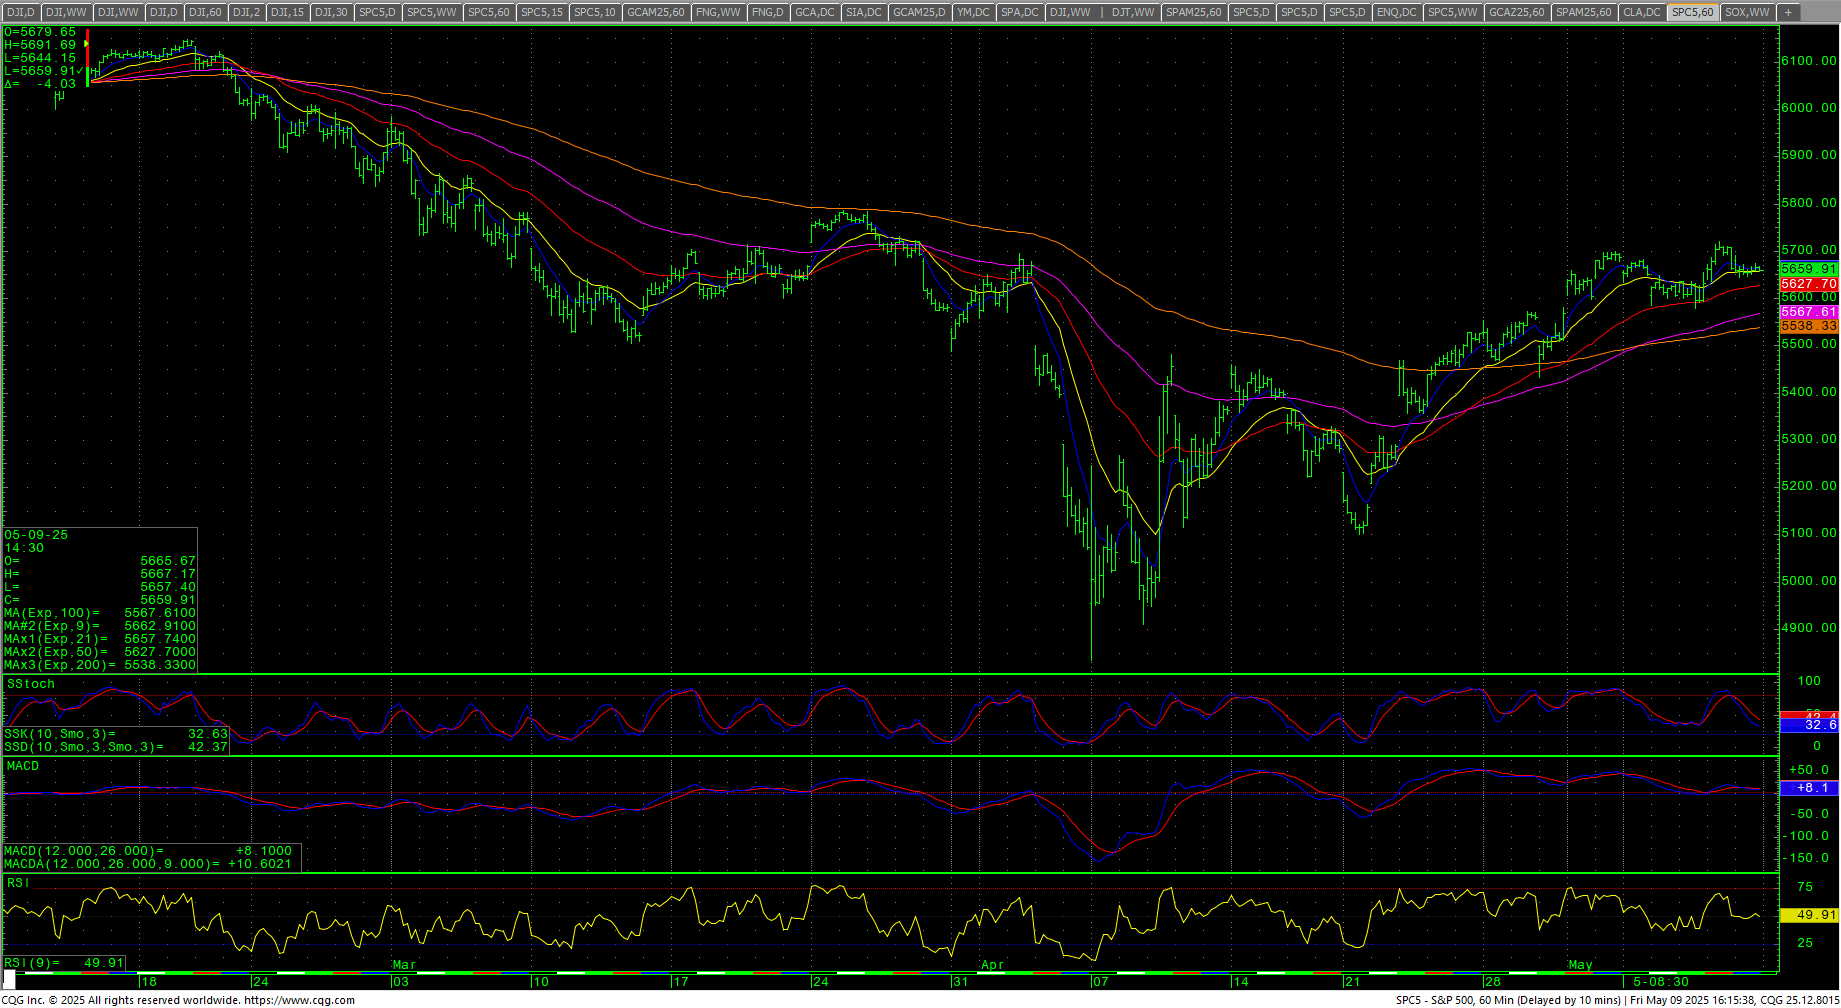 Support is 5644 and 5610. A breakdown under 5610 can test 5576 with counts to 5543/5540. Closes under 5540 suggest 5382. A breakdown under 5382 will open counts to 5277 with potential to pivotal near-term support at 5173/5170. A breakdown under 5170 sets up 5056/5043 with potential to open intermediate-term counts for a retest of the 4835 swing lows with support still at 4884/4880. Closes under 4880 are bearish and open counts to 4614 through 4586.
| Resistance | Support |
|
|
Charts courtesy of CQG, Inc., CNN, Koyfin, Trading View and AAII