
CYCLE TIMING UPDATE (by Intraday Dynamics)
June 14, 2025
As mentioned in the recent weekly update, we are entering a period where long cycles will start to dominate trade in the markets and geopolitical events.
While we have a critical flashpoint right here, into the 18th, the thing to note is that July and August is where things start to “heat up.” Not just summer temperatures, but the geopolitical landscape in general.
The attack by Israel on Iran may be a harbinger of the tensions these cycles are looking toward. The month of July stands out as the starting blocks for these mega cycles, so we should know much more after the first two weeks of July progress. If the first few months of 2025 were the “Eff Around” phase, then July will be the “Find Out” portion of the equation.
Bottom line, Buckle Up. July could be a wild one. Traditionally, the summer months are quiet in the financial world. These cycles indicate that this summer will be anything but quiet.
Then, as we head into August, the first half of the month is a cavalcade of longer cycles that pile up and will stay hot until at least September/October…and most of these longer cycles will not finish playing out until Q2 2026 at the least.
Dow Jones Industrial Average Daily Candles
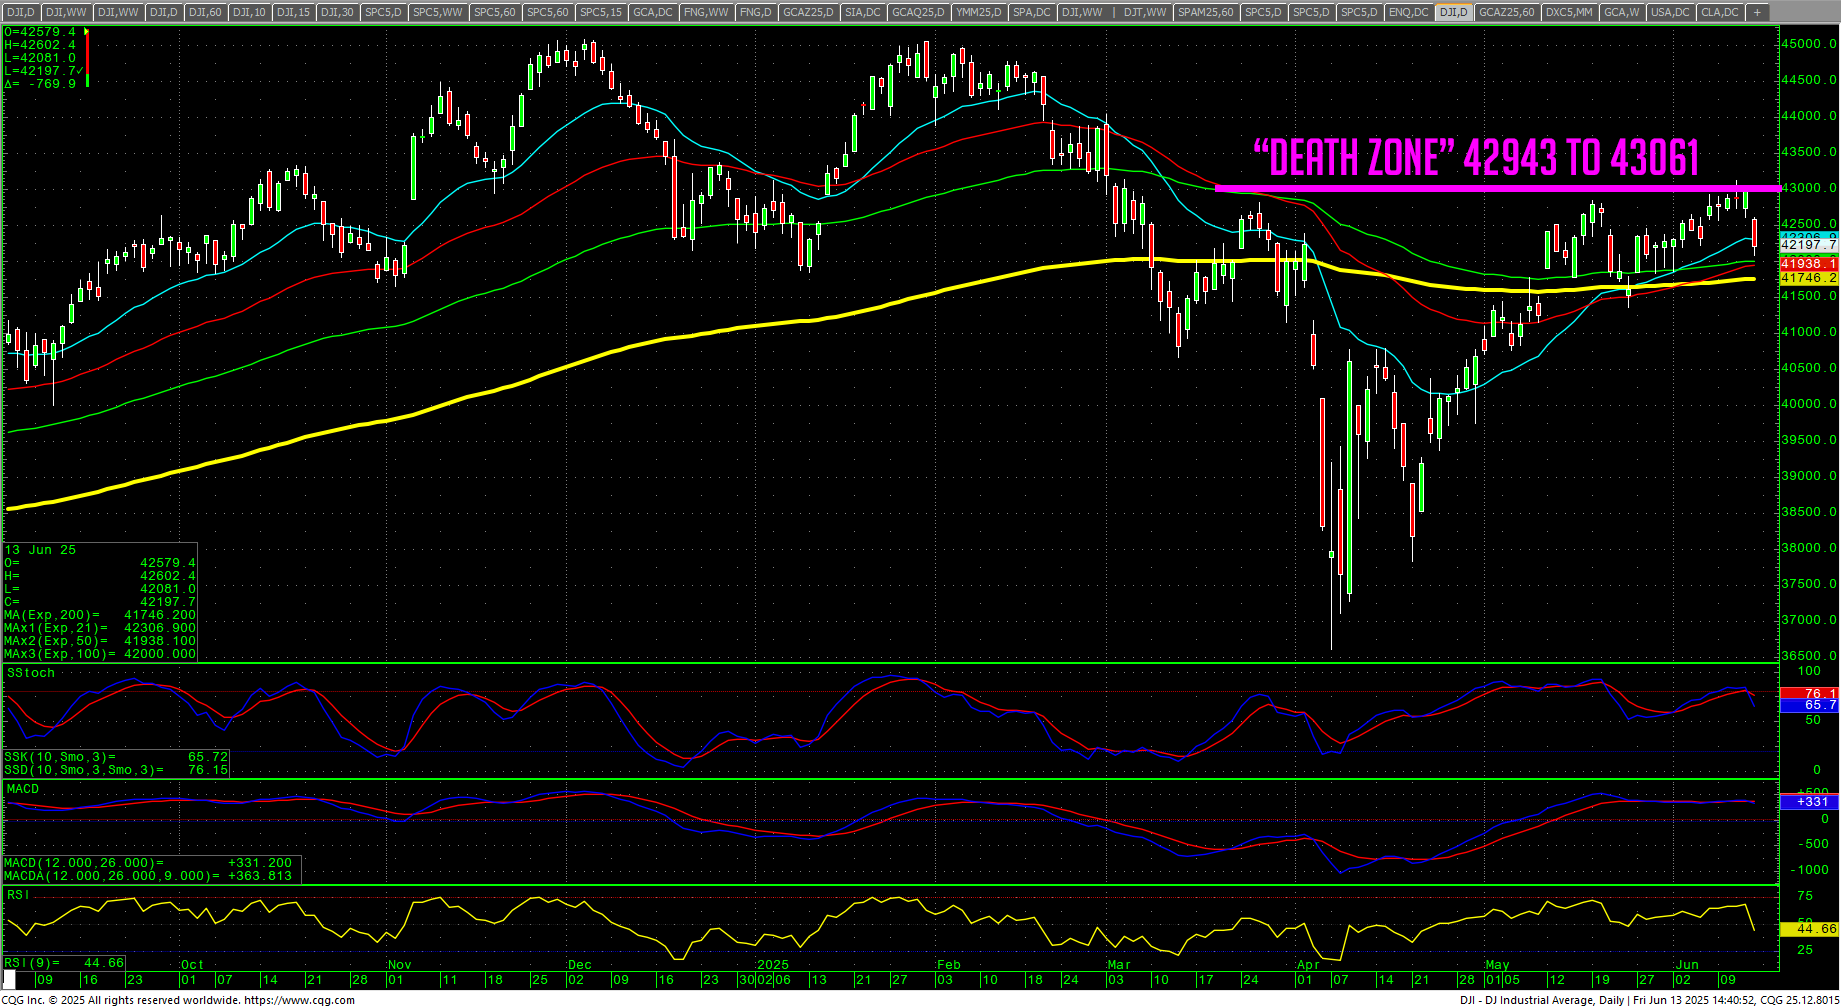 In the past few reports, I have been talking about what I refer to as the “Death Zone” for the Dow/DJIA. This past week, prices extended just above the upper end of this range but could not achieve a close over the upper end. Then the Middle East conflict hit late Thursday and prices reversed lower with the daily chart in a significant bearish divergence on the stochastics…and extreme overbought readings on the RSI and the MACD.
Short-term, we simply have a trading range established with the 200-day MA now sitting near the recent swing low of 23 May 2025 at (intraday) 41354.00. The 200-day MA currently sits at 41746.20. The 42025/42020 area is critical short-term and taking that out should see a retest of the 200-day and the 41354.00 swing low.
Overhead, the 42720/42725 area must be cleared for a retest of the Death Zone.
Long term, we need to ask; If this is the beginning of another move down, what is the longer-term potential for prices?
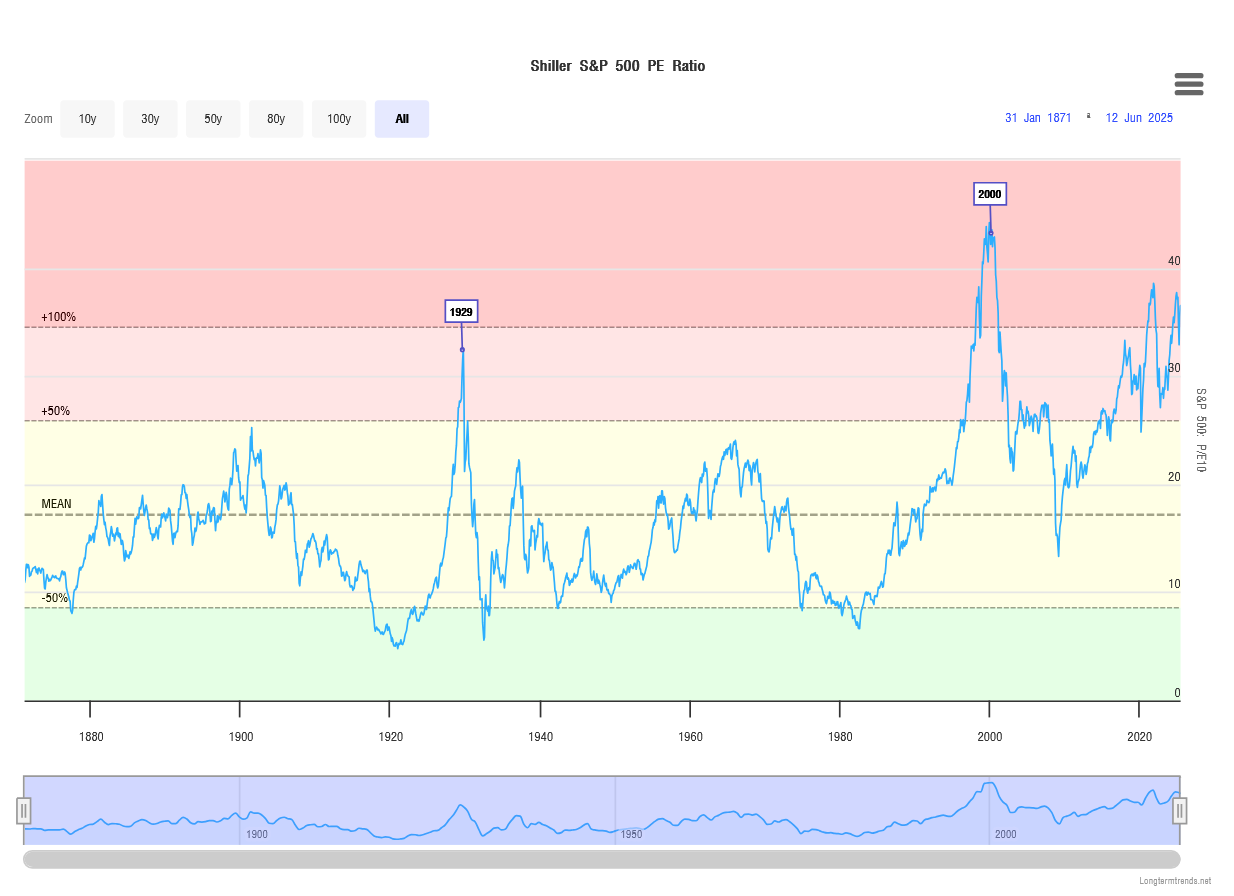 When it comes to stocks, there is only one indicator that matters: “Value.”
We can look at prices, trends, underlying fundamentals…but the reality is value/valuations.
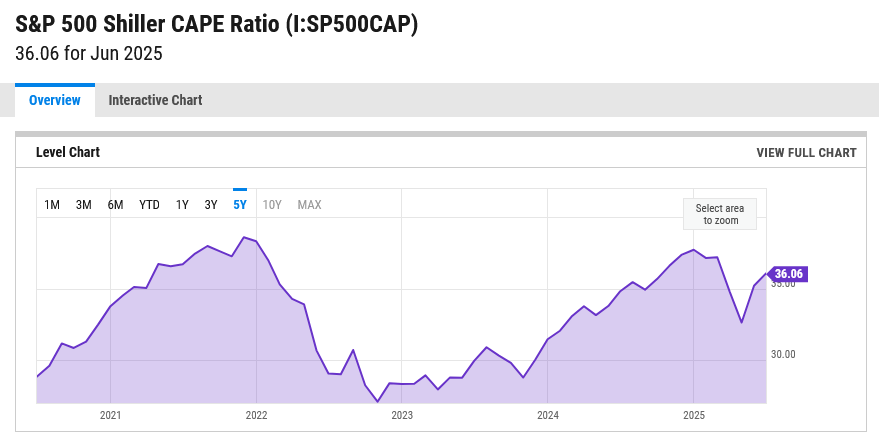
In December 2024, the Shiller CAPE Ratio topped at 37.71 and has clawed back to 36.06 here in June.
The historical “mean” for P/E (price to earnings) is around 16.
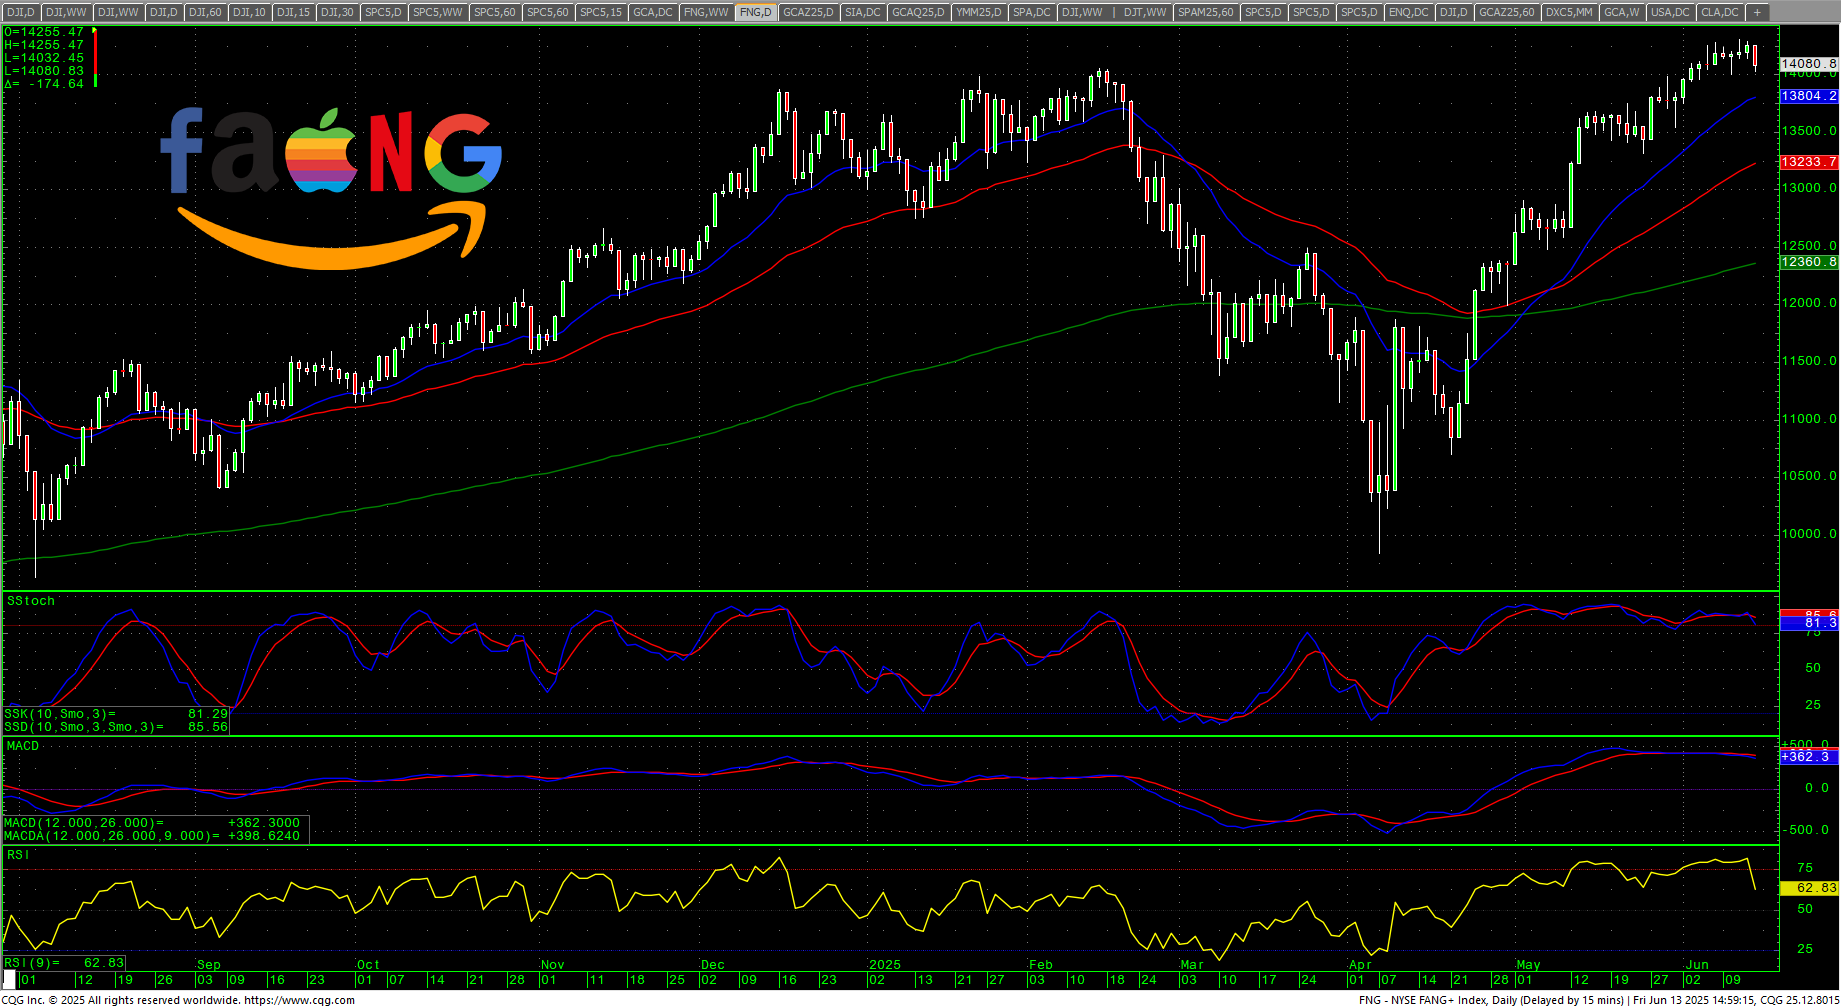
In the S&P 500 today, over 50% of the ENTIRE value of the index rests in just seven stocks. “The Magnificent Seven” as they are called…all technology-driven stocks. These have been the focus of the retail traders and have rewarded them handsomely in the past few years.
The returns on the NYSE FANG, an index the best represents the concentration of technology stocks, since the 2020 lows have been +455%. Yes, the FANG has rallied 4.5X the base in 2020…one of the most meteoric rises in market history.
This valuation has been driven by the emergence of “AI” and the promise of “AGI.” We may be on the precipice of discovering that this is a bubble to rival the bubbles in the late 1920s and the late 1990s/early 2000. This AI ‘bubble’ also includes crypto and massive increases in meme coins and digital ‘currencies.’
While prices have risen, the P/E ratios of some of the MAG7 have remained far above median value. NVDA, for example, is at 45.80, while the industry median is 20.87. Simple math would tell us that fair value for NVDA is closer to $50/$70, not the $140+ at which it is currently trading.
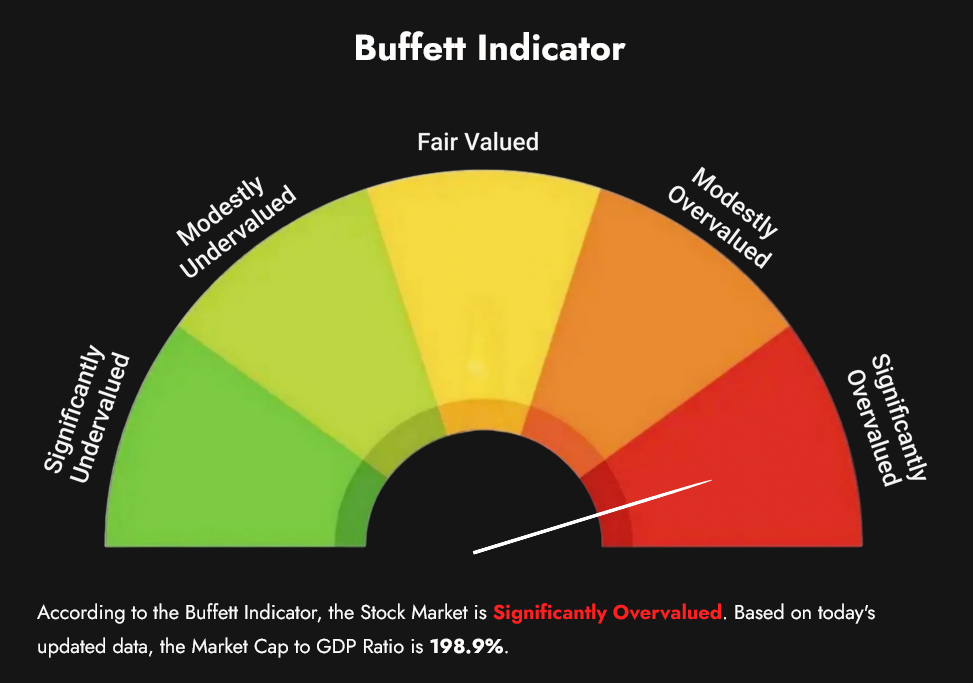 Valuations are the main reason that Buffet has $340+ billion in cash right now. The U.S. stock market is trading at 100-105% OVER the median valuation. Could the markets stay at 2X the historical? Perhaps.
It is more likely that we are moving into a period of revaluation/devaluation.
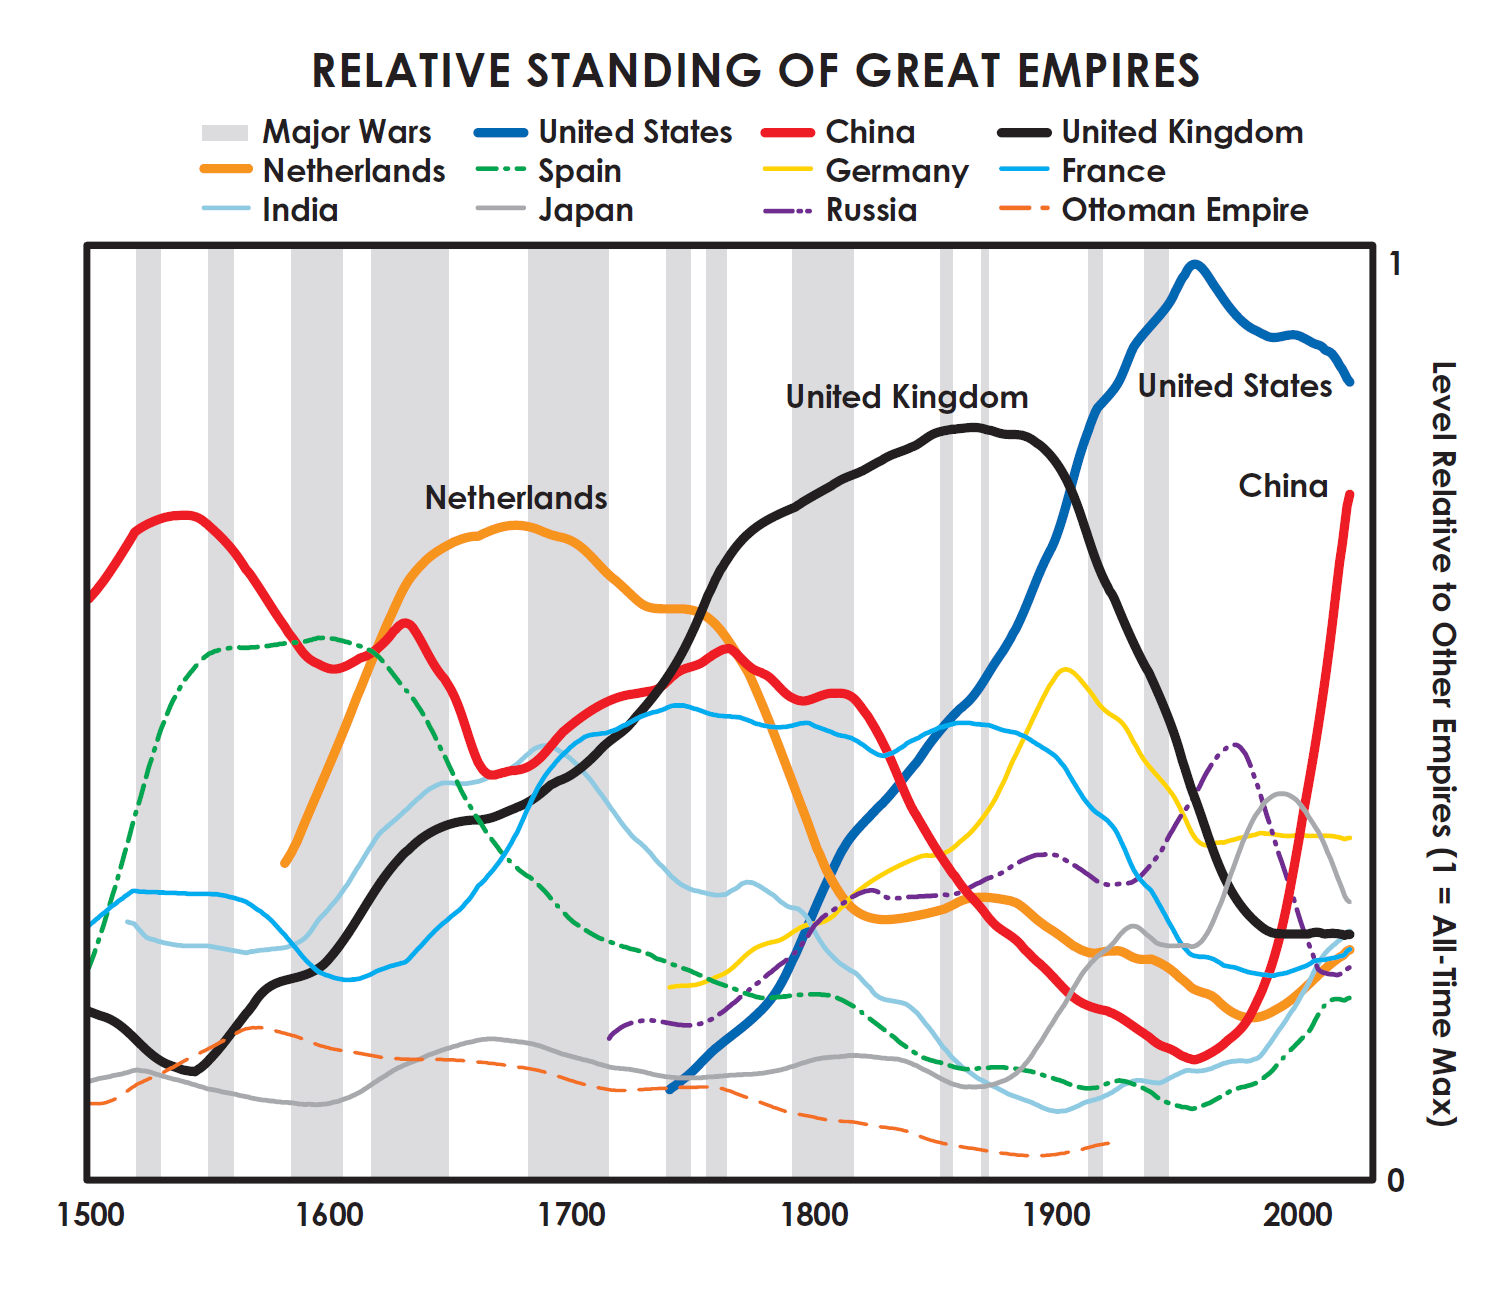
Some big names have been sounding the alarm on debt and bonds. Jamie Dimon most recently sent out a warning. Michael Burry, of The Big Short fame, has recently placed bets against the market. Ray Dalio has been beating the drum for over a half decade now. Dalio’s latest few books have been centered on the potential for dynastic change in the global world order. I would encourage you to watch his 30-minute video on long cycles:
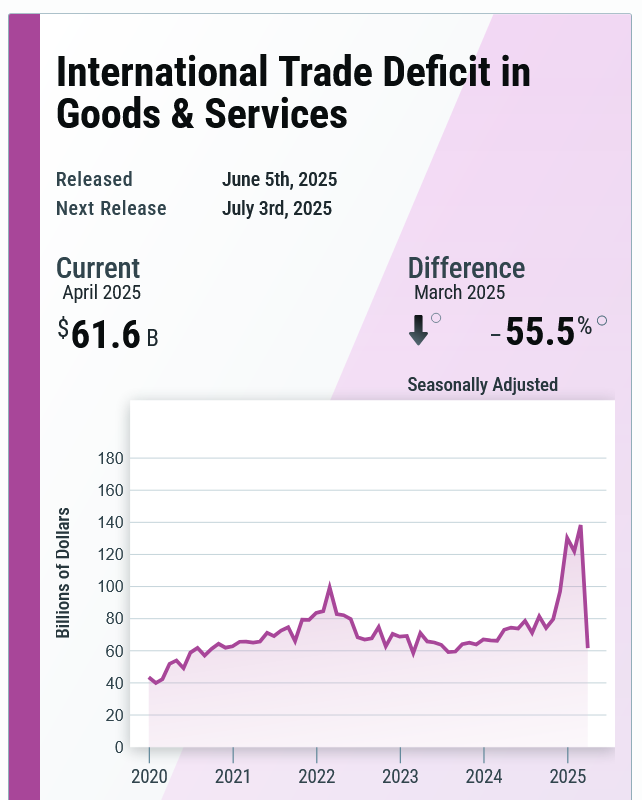
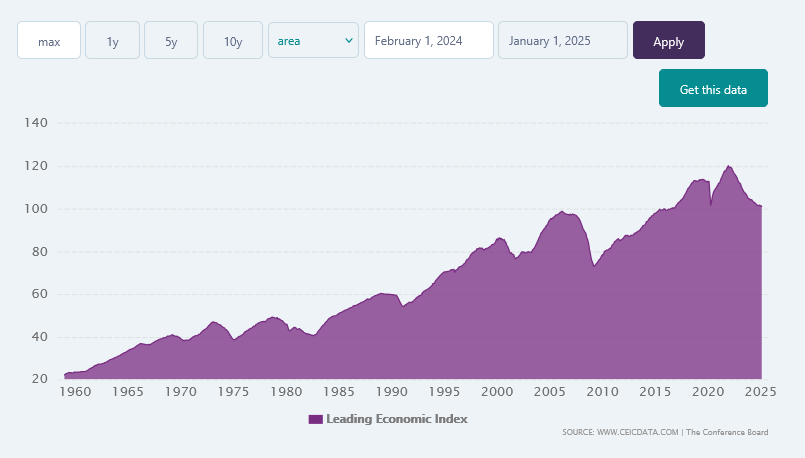
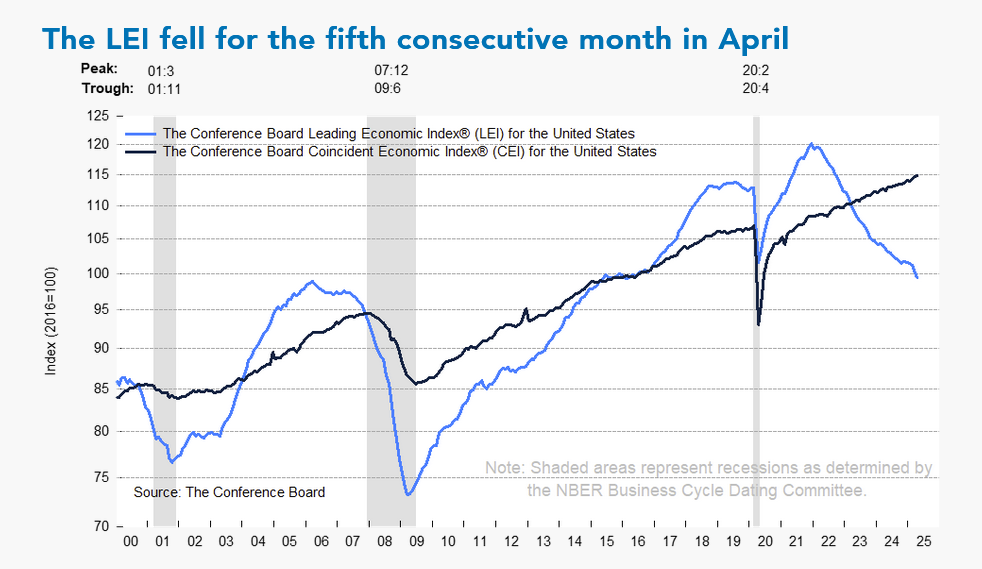
 Again, so much focus right now is on tariffs and bonds and debt. Big picture, the LEI (Leading Economic Indicators) are really the key to the health of the U.S. economy. With labor markets looking fragile (to say the least), it’s a safe bet that LEI is going to continue the current downtrend. The current LEI have declined below the 2020 lows. In addition, narrowing trade would accelerate economic problems.
United States Leading Economic Indicators
For the next couple of months, here is what the timing indicators look like for short-term activity.
Timing Points
- 06/16-18 *** X critical, volatility/volume/wide ranges/extremes
- 06/20-24 *** X
- 07/03 *** X
- 07/10 **
- 07/17 **
- 07/23-24 *** X
- 08/01 *** X
- 08/05 *** X kicks off critical week through
- 08/08 *** X through
- 08/11 *** X critical week
- 08/18 **
- 08/25-26 *** X
For reference, I am including the latest technical comments for the Dow:
Dow Jones Industrial Average
Dow Jones Industrial Average Weekly H-L-C
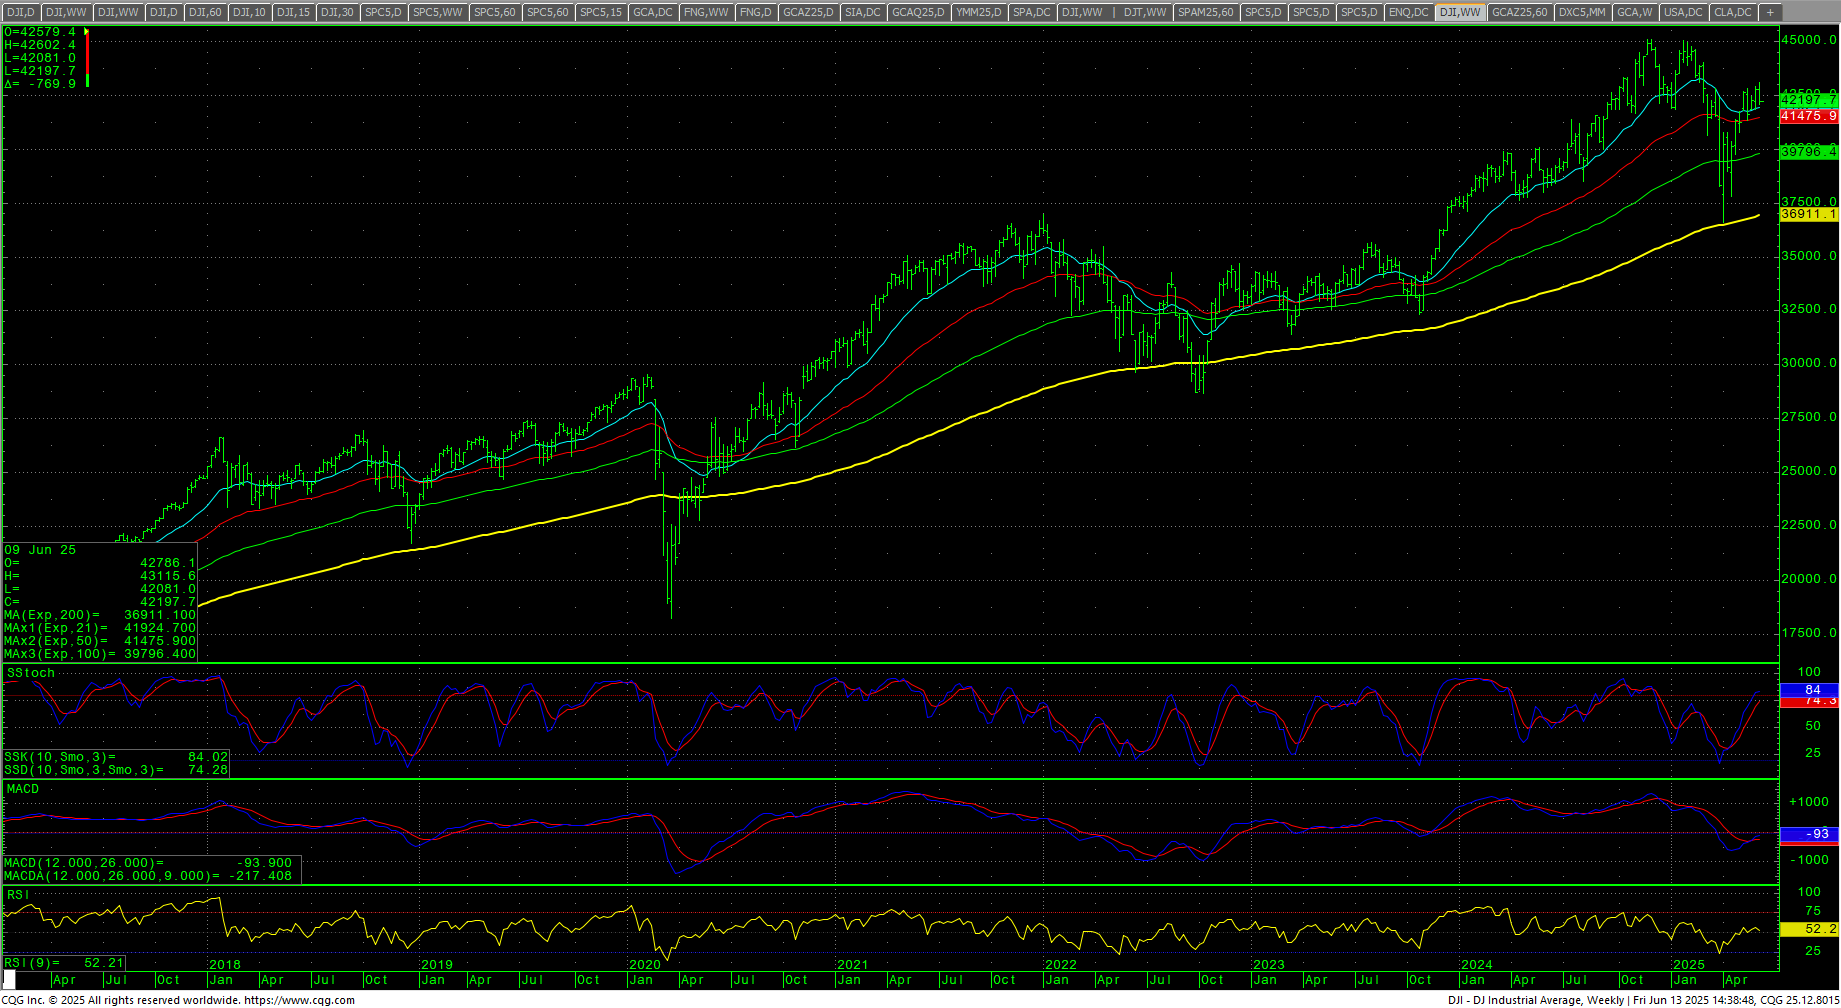 The Dow closed the week down -1.32% on the bottom of the weekly range after prices traded to, and rejected the ‘final’ “Death Zone” from record highs. That zone remains at 42943 through 43061 (intraday high on Wednesday was 43115.6). The 50-day and 200-day MAs remains in a Golden Cross. The weekly stochastics are still in an uptrend. The daily stochastics are hooking lower from a bearish back up with a preliminary bearish divergence. The MACD is also in a bearish divergence. The RSI came down from and overbought reading and a bearish divergence. The 200-day MA starts the week at 41746.20 and is trending higher.
Dow Jones Industrial Average Daily Candles
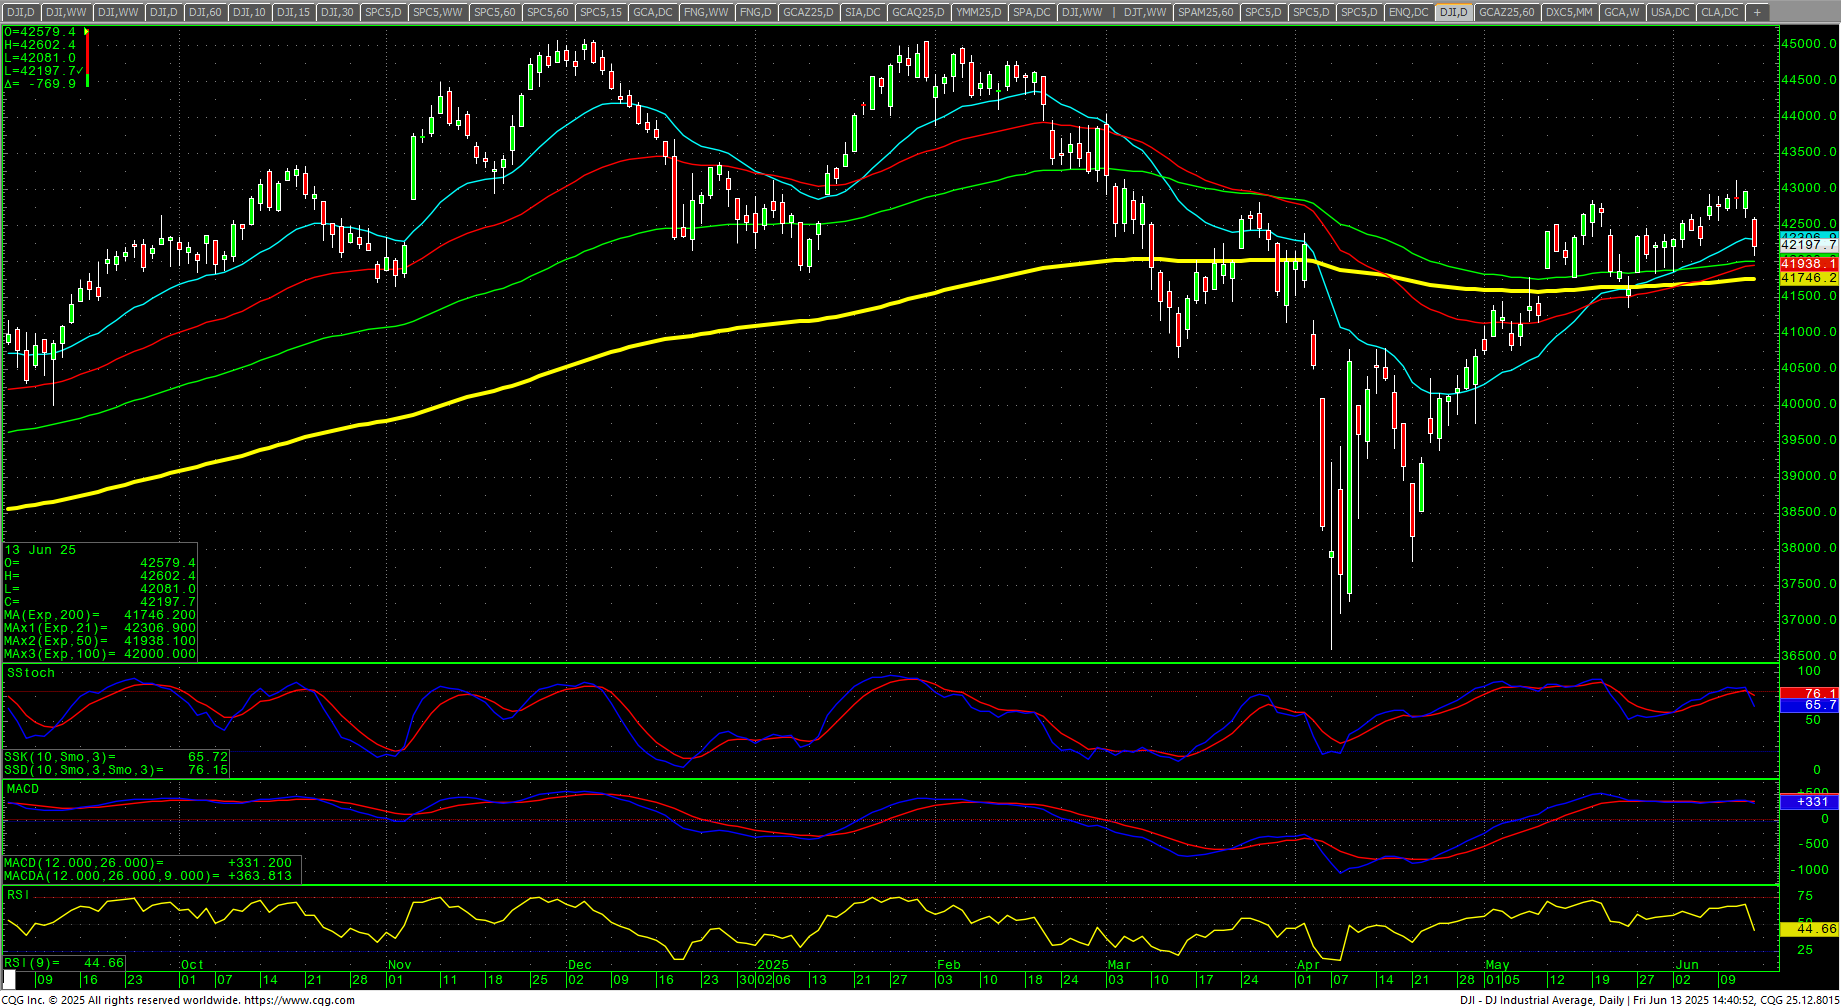 The hourly is oversold on Friday’s close. Support is near-term pivotal support at 42025/42020. Closes under 42020 set up 41580 through 41427. A breakdown under the 41427 area will set up 41105 with counts to critical short-term support at 40631/40628. Closes under 40628 are near-term bearish for test of 39096/39864. Closes under 39864 offer full counts to 38237/38146. Closes below 38146 should minimally test 37828 and would open counts to retest the 36611 low with support at 37103.
Dow Jones Industrial Average Hourly H-L-C
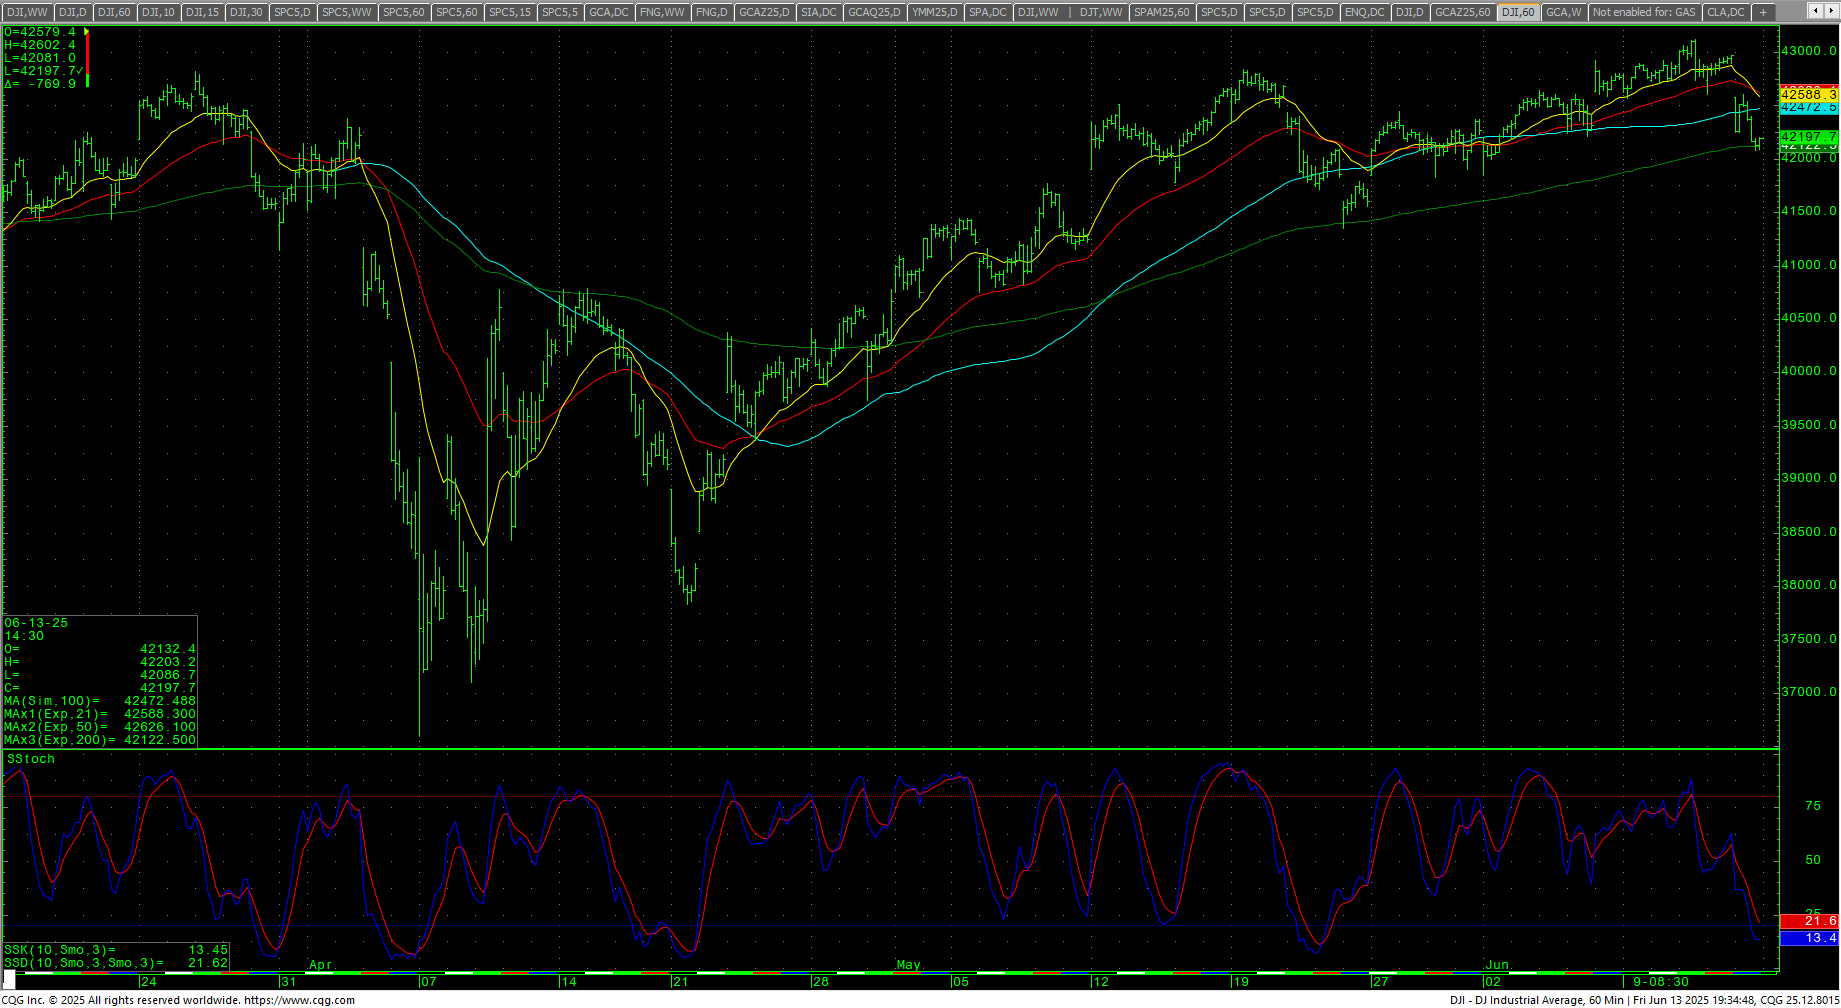 Resistance is 42325, 42477, 42598 and pivotal at 42720/42725. A drive above 42725 can test 42856/42871 and suggest a test of critical resistance at the Death Zone level at 42943 through 43061/43115 area. Daily closes above 43115 should minimally test 44034 and will open potential for a test of the all-time highs at 45050/45054/45074. Closes over 45074 opens counts toward 45244 and 45426 (Fibonacci target). Rallies with closes over 45426 will reopen longer-term monthly targets in the 47400 level with targets of 46568 and 46954.
| Resistance | Support |
|
|
Charts courtesy of CQG, Inc.,