TECHNICAL ANALYSIS (by Intraday Dynamics)
Have a Happy 4th of July!

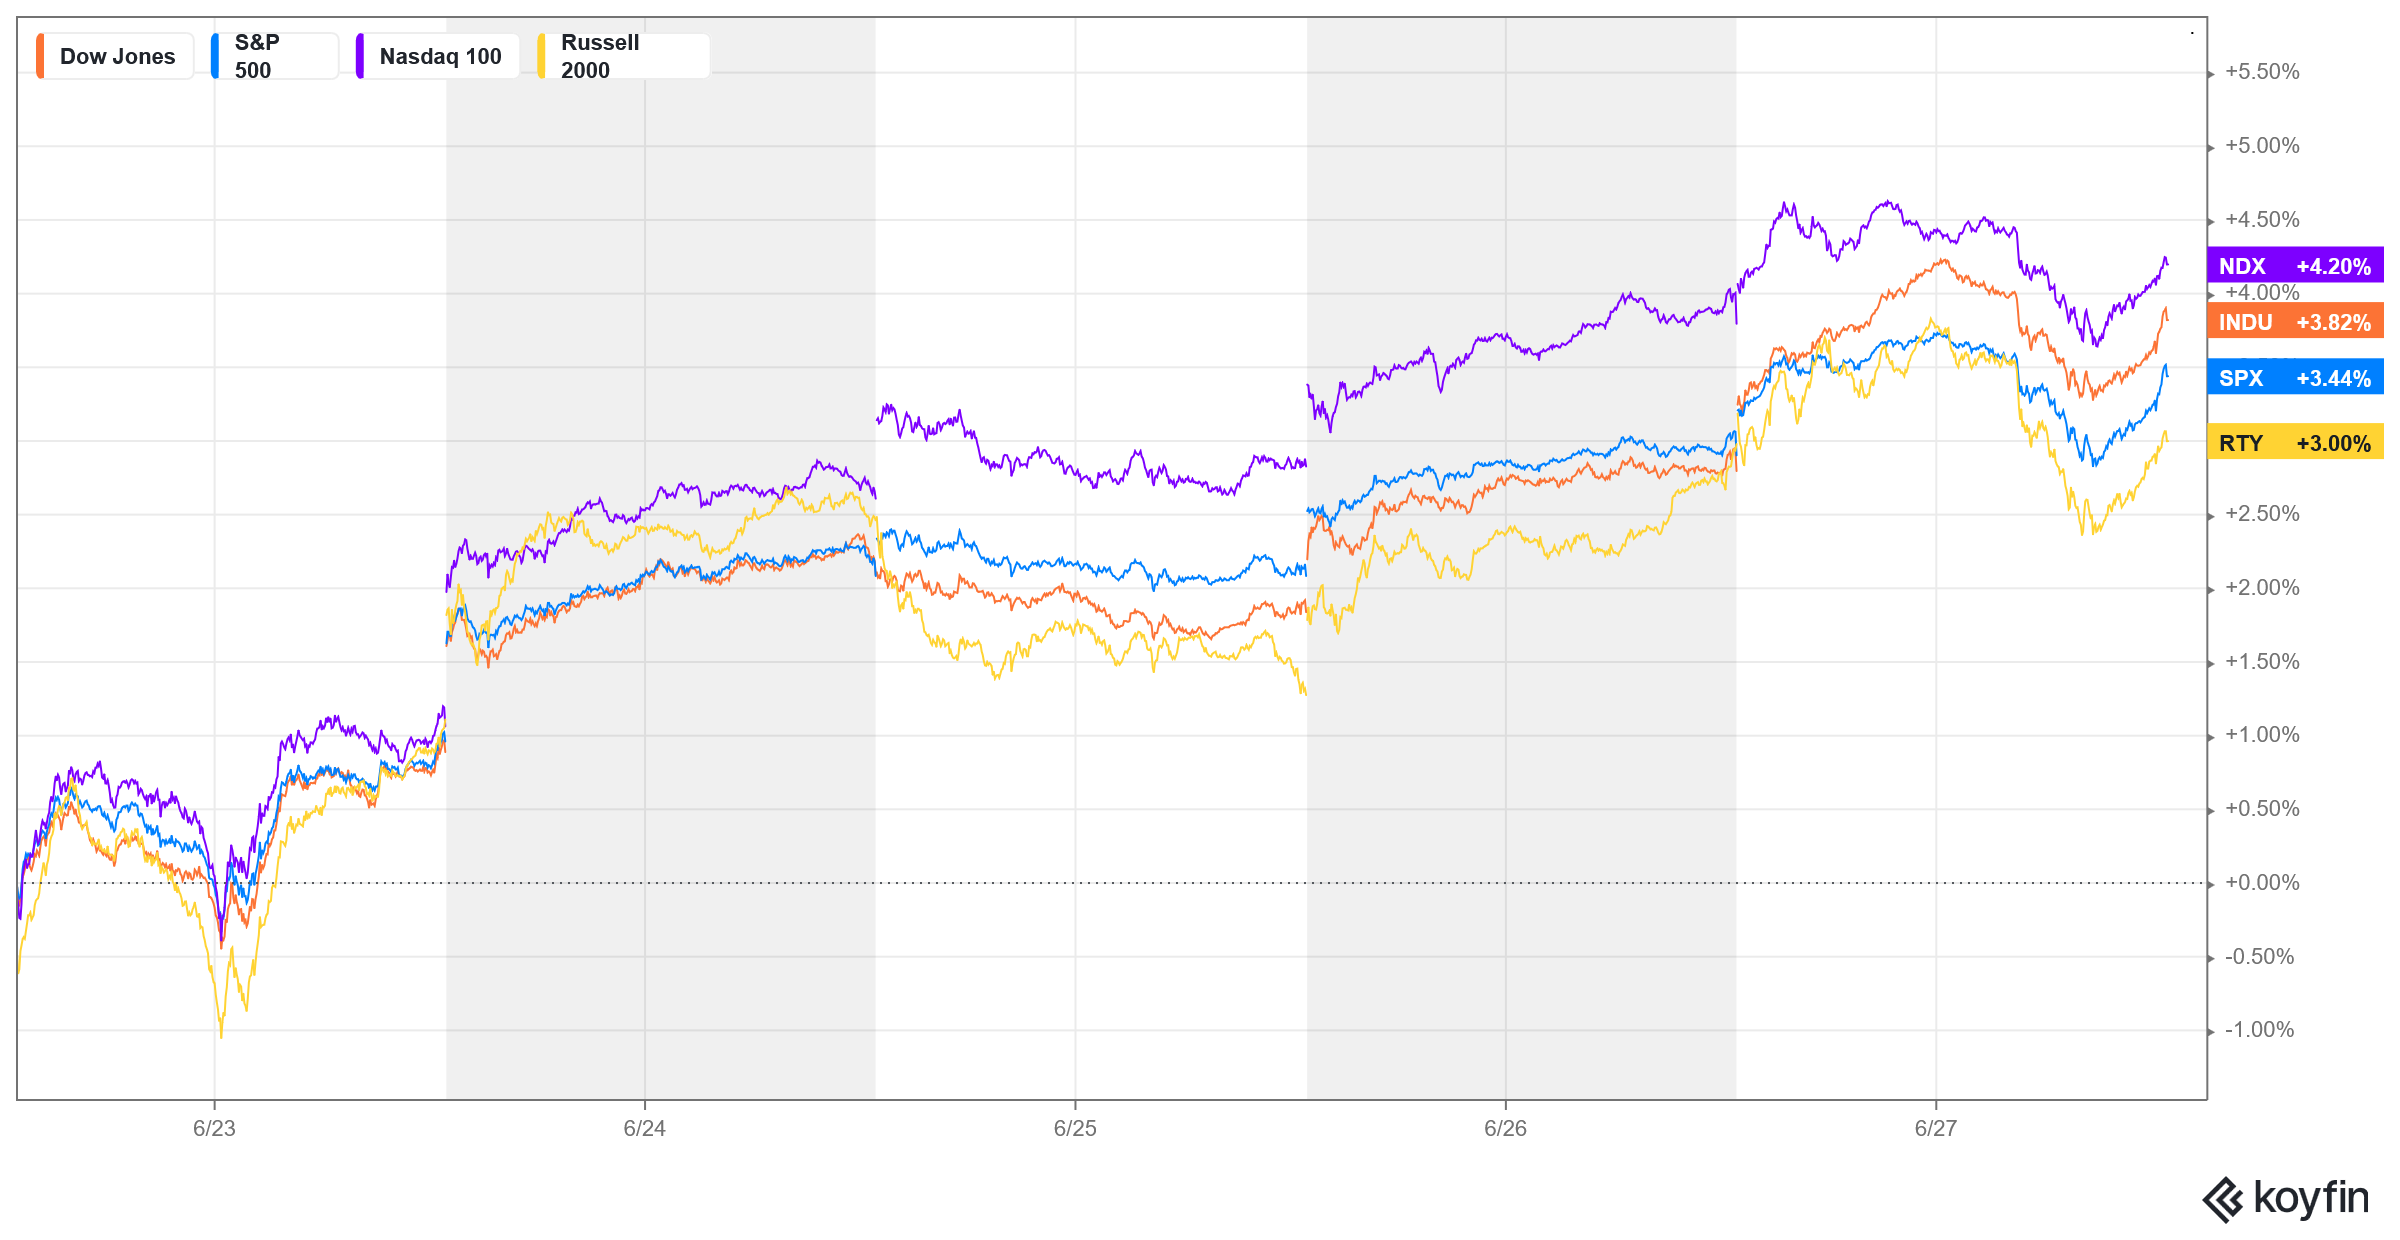
Major Indices Week of June 27, 2025
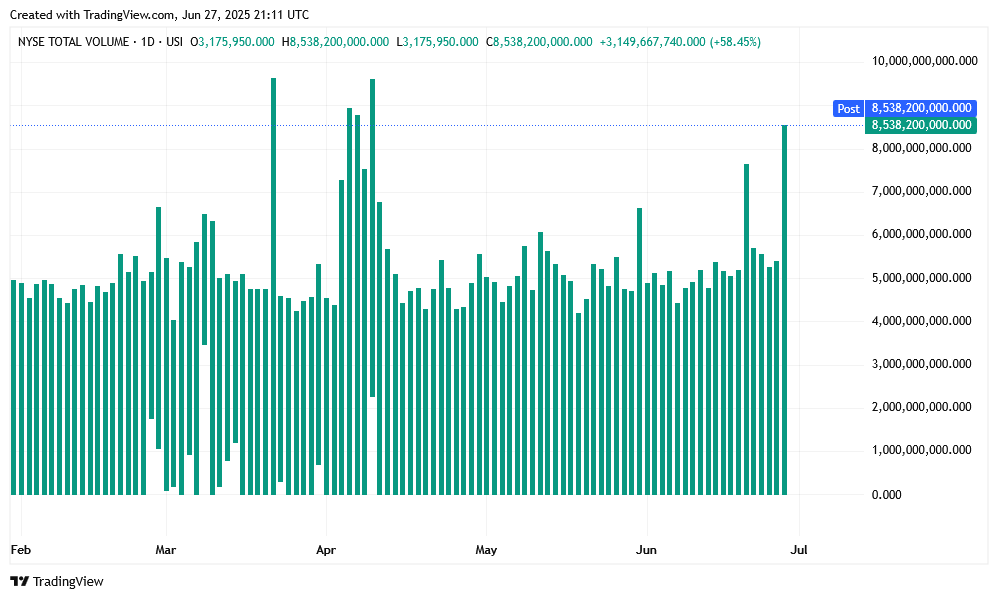
 NYSE Volume
 Stocks started off Monday on the defensive, following the US bombing of Iran, and then rocketed sharply higher in outside weeks up with many indexes setting record highs and the Dow and the MAGS taking out critical “last gasp” technical areas. Last week, I postulated the axiom: “When the missiles are flying, you should be buying.” We can add the one used by FX Evolution: “If it’s in the media, it’s in the market.”
NYSE FANG Weekly Candles
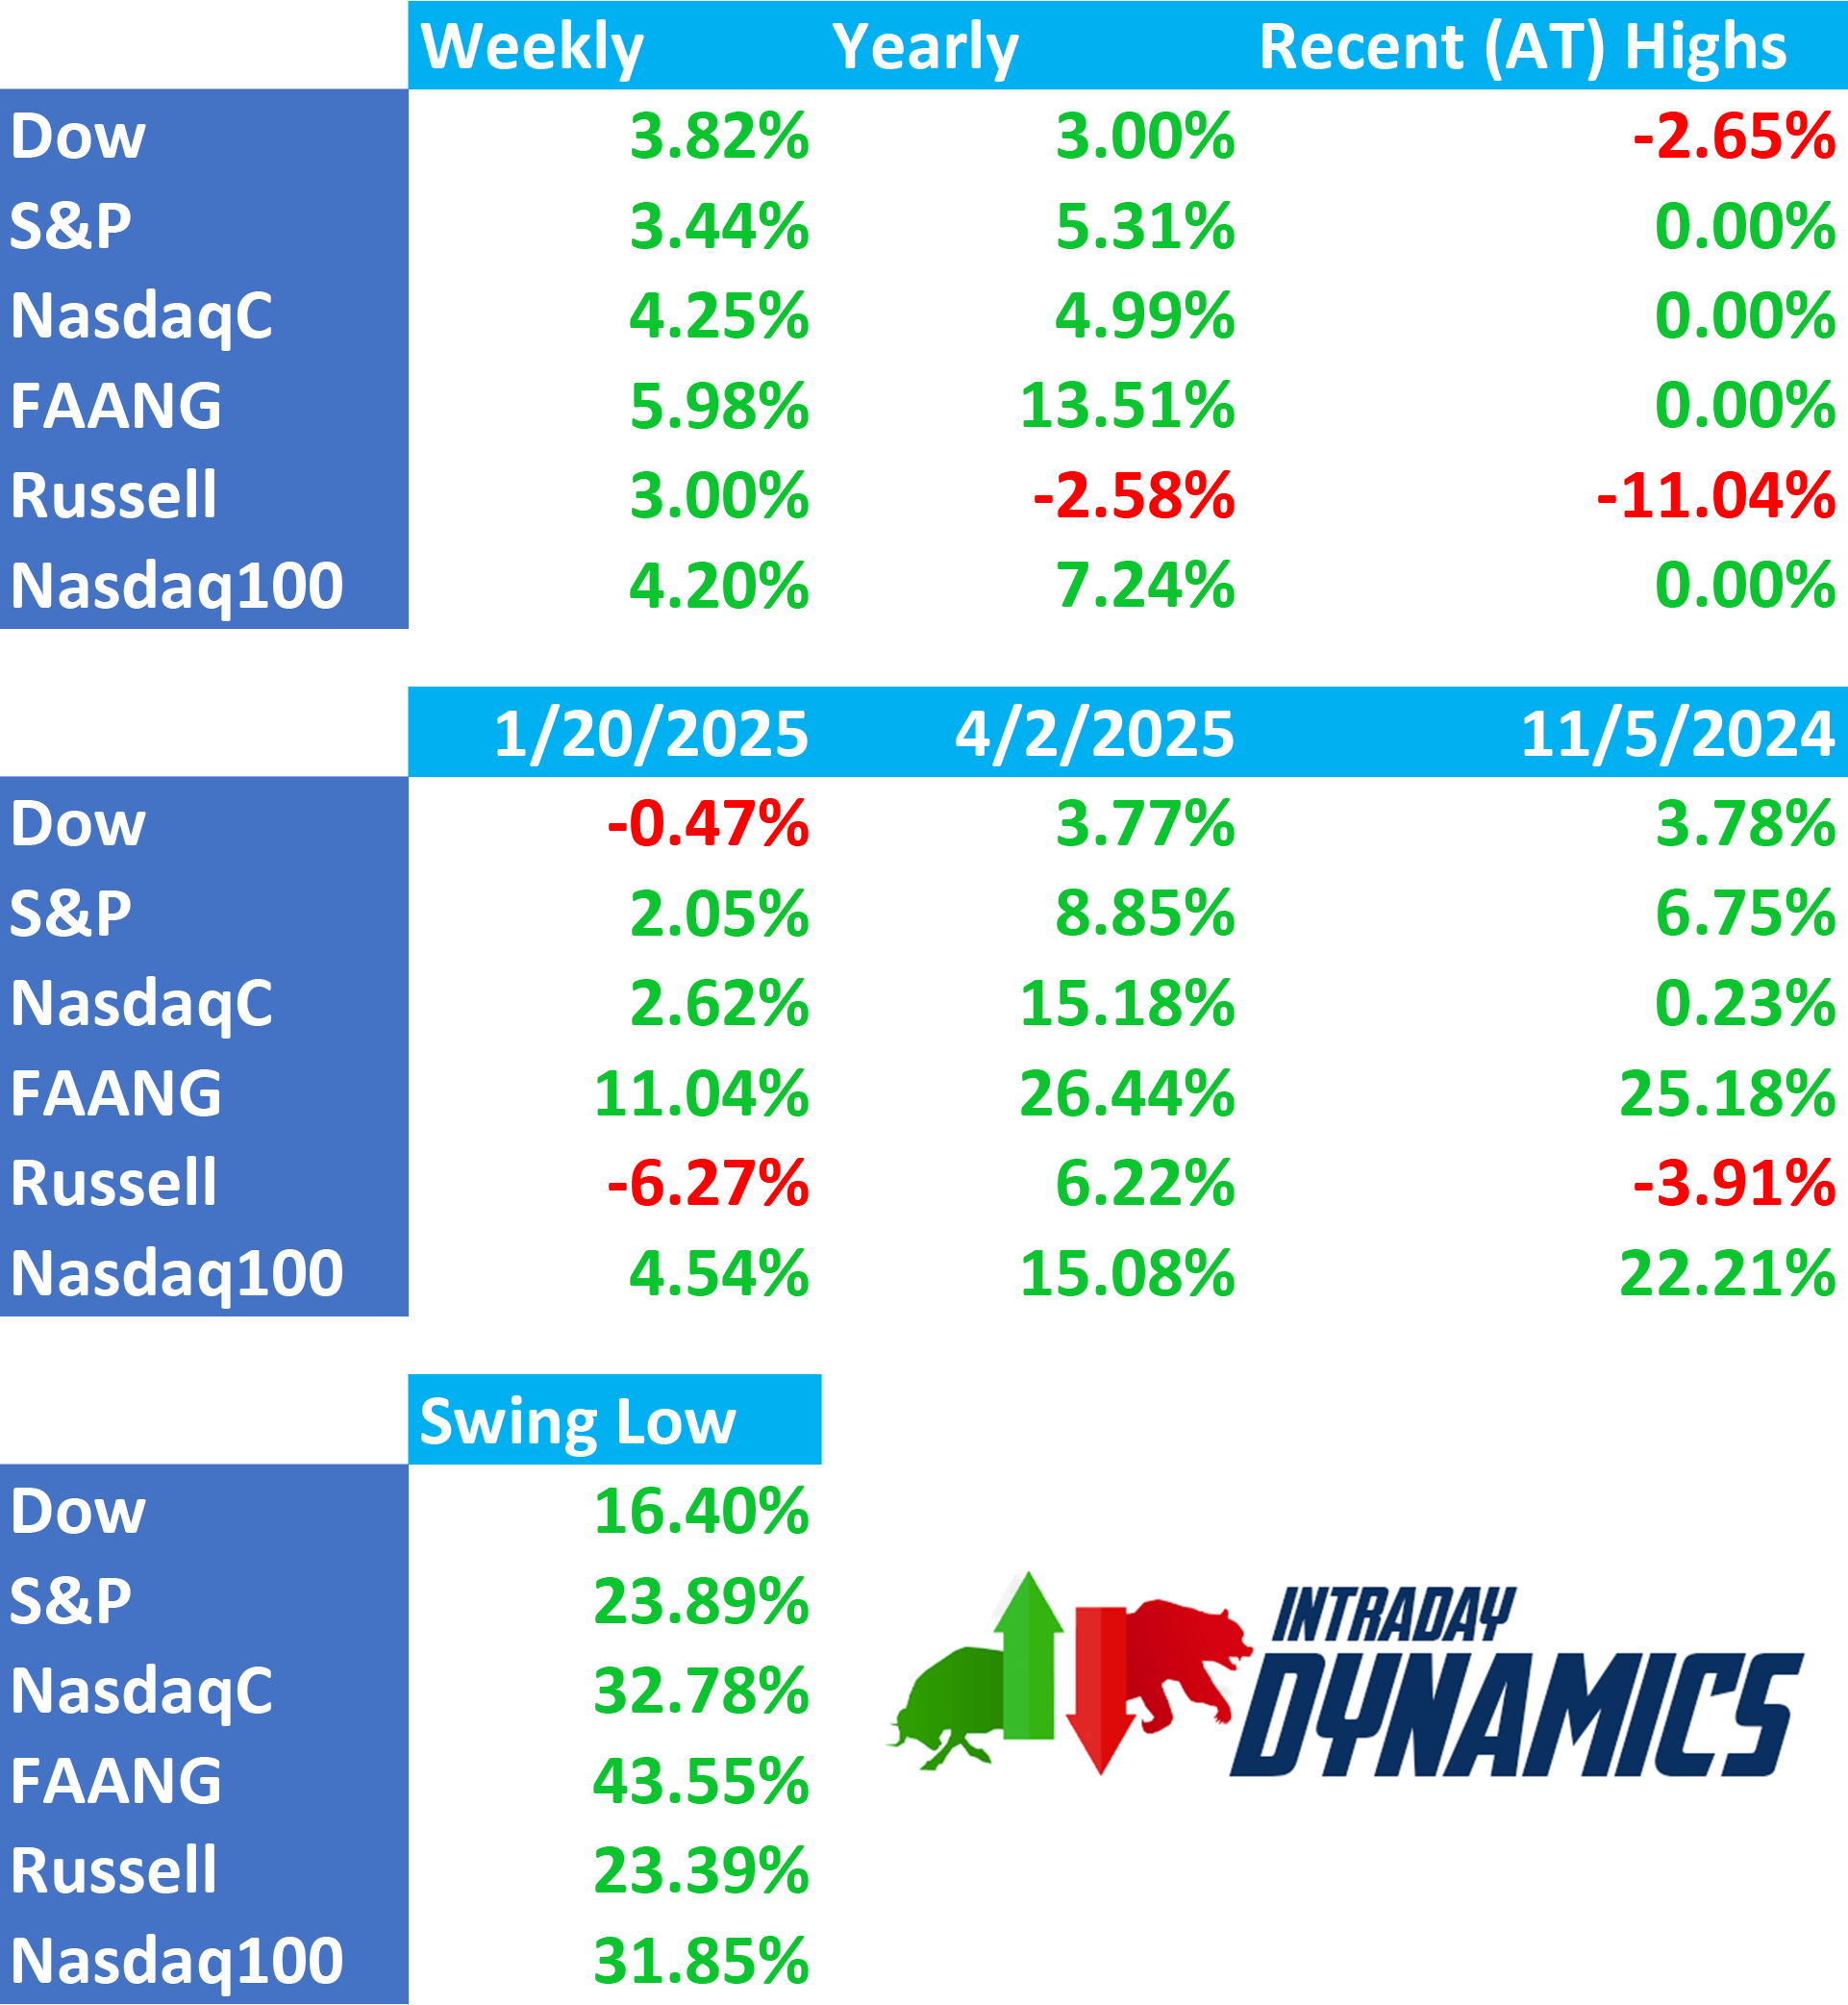
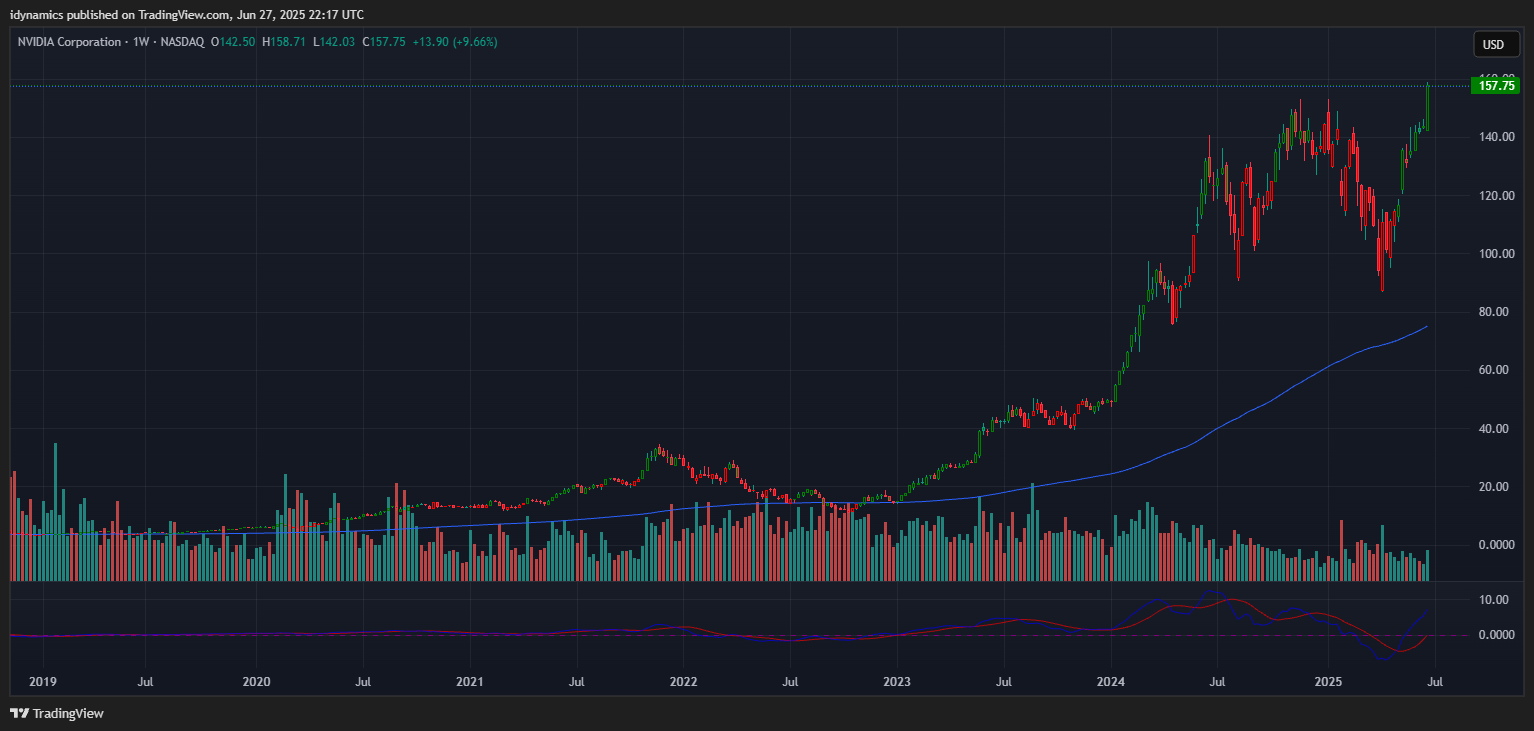
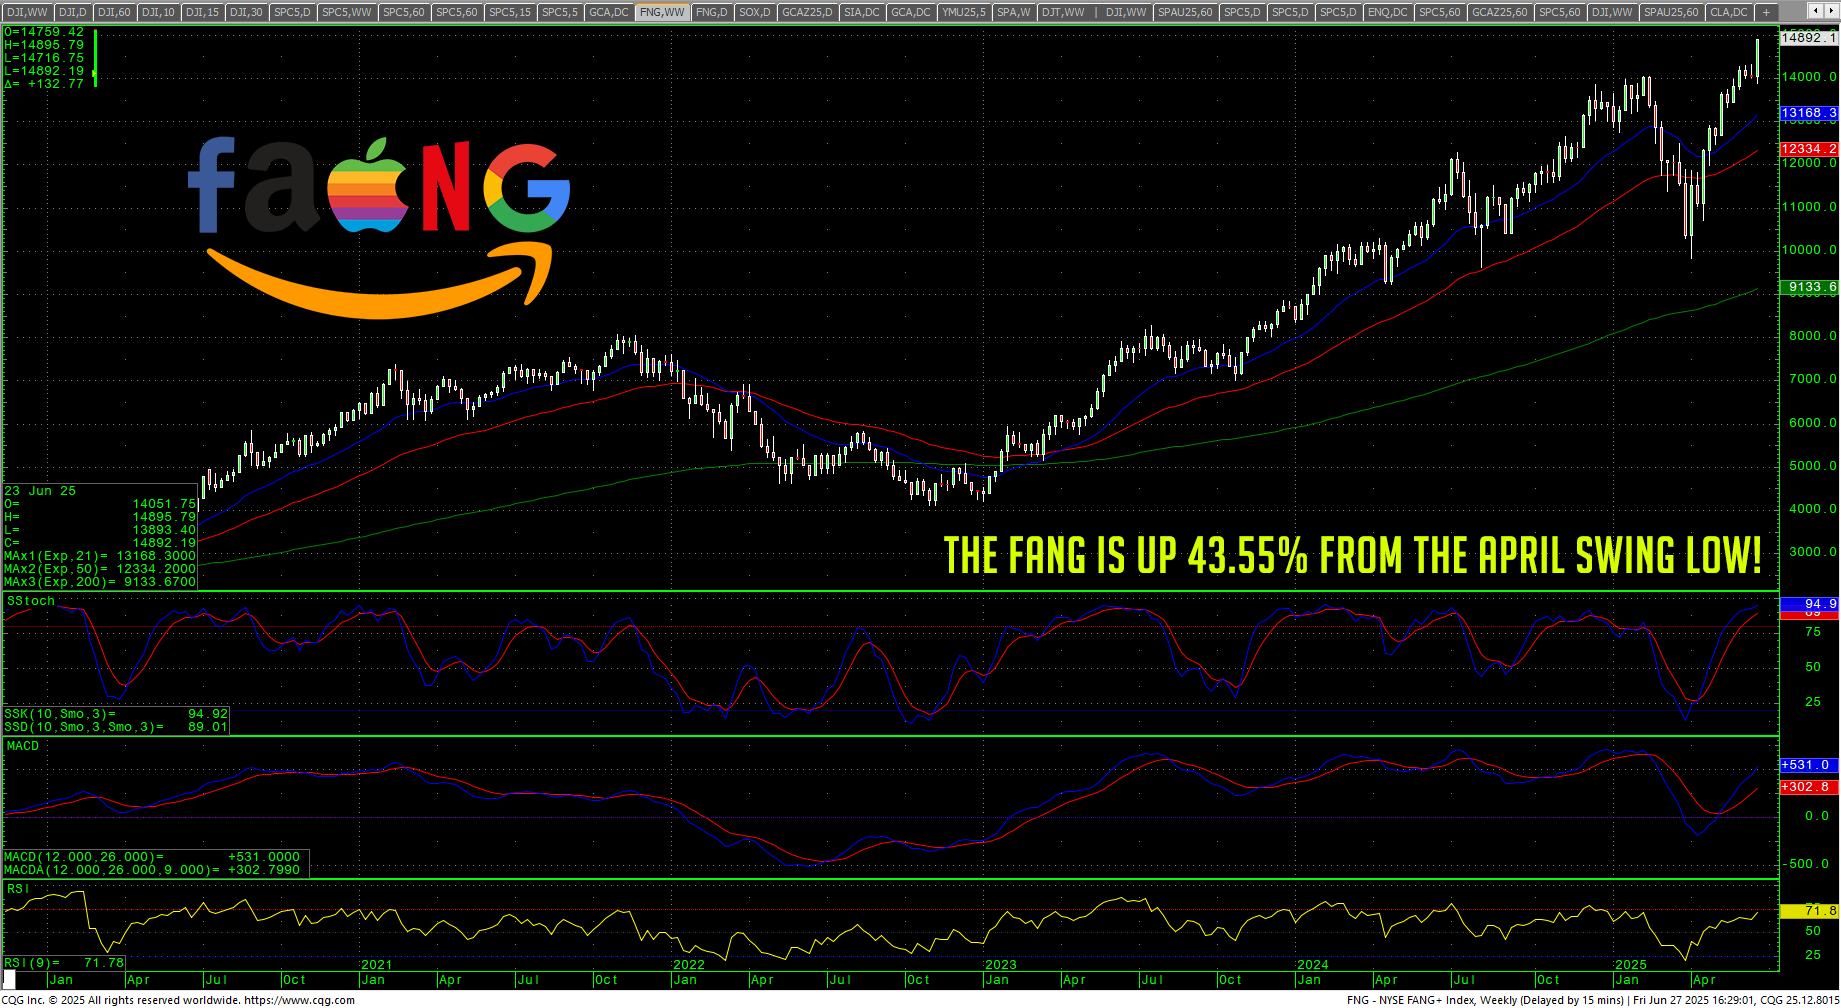 One thing is for certain, hedge funds have been WRONG on this market and, for now, smaller traders have outsmarted the so-called “smart money.” The “Buy the Dip” crowd is ruling. Funds have been either short or horribly under-invested and, with the quarter ending on Monday, they spent the week scrambling to get a piece of the pie and quell the FOMO. Another certainty is that when tech stocks are leading the way, this market is bullish. NVDA soaring to a new record helped fuel the bullishness as well as making Michael Burry look more and more like a one hit wonder. His $100M bet against NVDA isn’t looking so good right about now. The FANG is up 43.55% from the April swing low!
Prices briefly traded lower intraday Friday in a MASSIVE volume day, but the FOMO kicked in during the final hour of trade sending the Nasdaq, the SPX and the FANG to record highs. Yes, with the Dow taking out the “Death Zone” on the chart, coupled with massive volume to new highs, this changes the technical structure of the markets.
Another bullish chunk, ALA 2007, the massive deregulation coming for the banks. No big issues. That ended well?:
“Large U.S. global banks can expect as much as $6 trillion in additional balance sheet capacity and billions in freed-up capital under a Federal Reserve plan to relax leverage rules, Wall Street brokerages estimated on Thursday.”
That said, I am sticking to my timing analysis for now, which suggests that rough sailing is coming for the markets…well into early 2026.

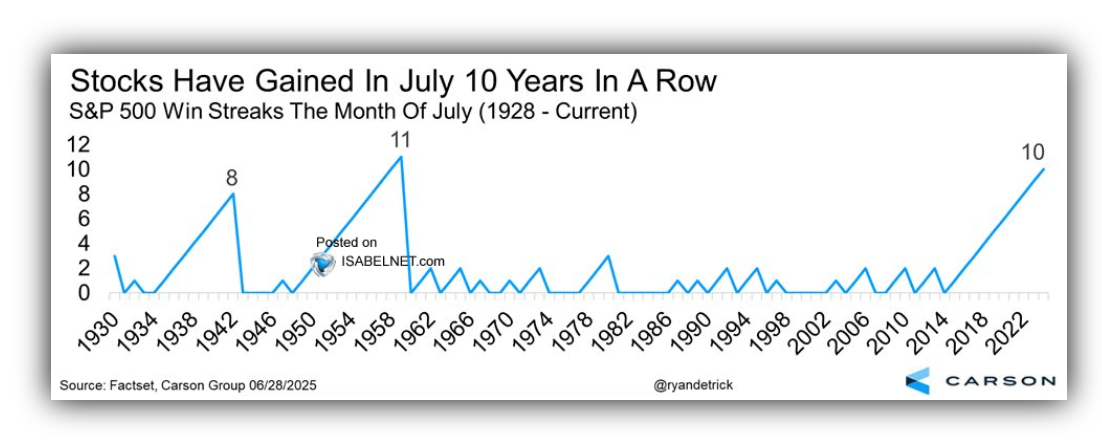 We are about to enter July, a month that brings some massive long-term cycles into play for stocks and geopolitical movement. July is also historically a bullish month for stocks. In fact, it is by far one of the best performing months and has been reliable over time. Will this July be different? Time will tell.
So far, sentiment is far from manic, although Friday’s volume throws open a flag. Normally, high volume is a sign of continued strength. Conversely volume like we saw on Friday, north of 8.5 million shares on the NYSE, may be a preliminary signal of caution here. We will know more after the coming week. The VIX is back into extreme complacency levels.
Dow Jones Industrial Average Weekly Candles
 For an update on the longer-term timing outlook, please see the latest update. Early July kicks off a massive longer-term window where the confluence of potential tariffs coupled with invocations to “Listen to the Voice of God” will converge. That is, unless the magic of “two weeks” happens yet again.
From the recent posts:
The reality is that we are now entering a 6-9 month window of extremely volatile longer-term cycles.
S&P 500 Stocks Above the 200-day MA with SPX
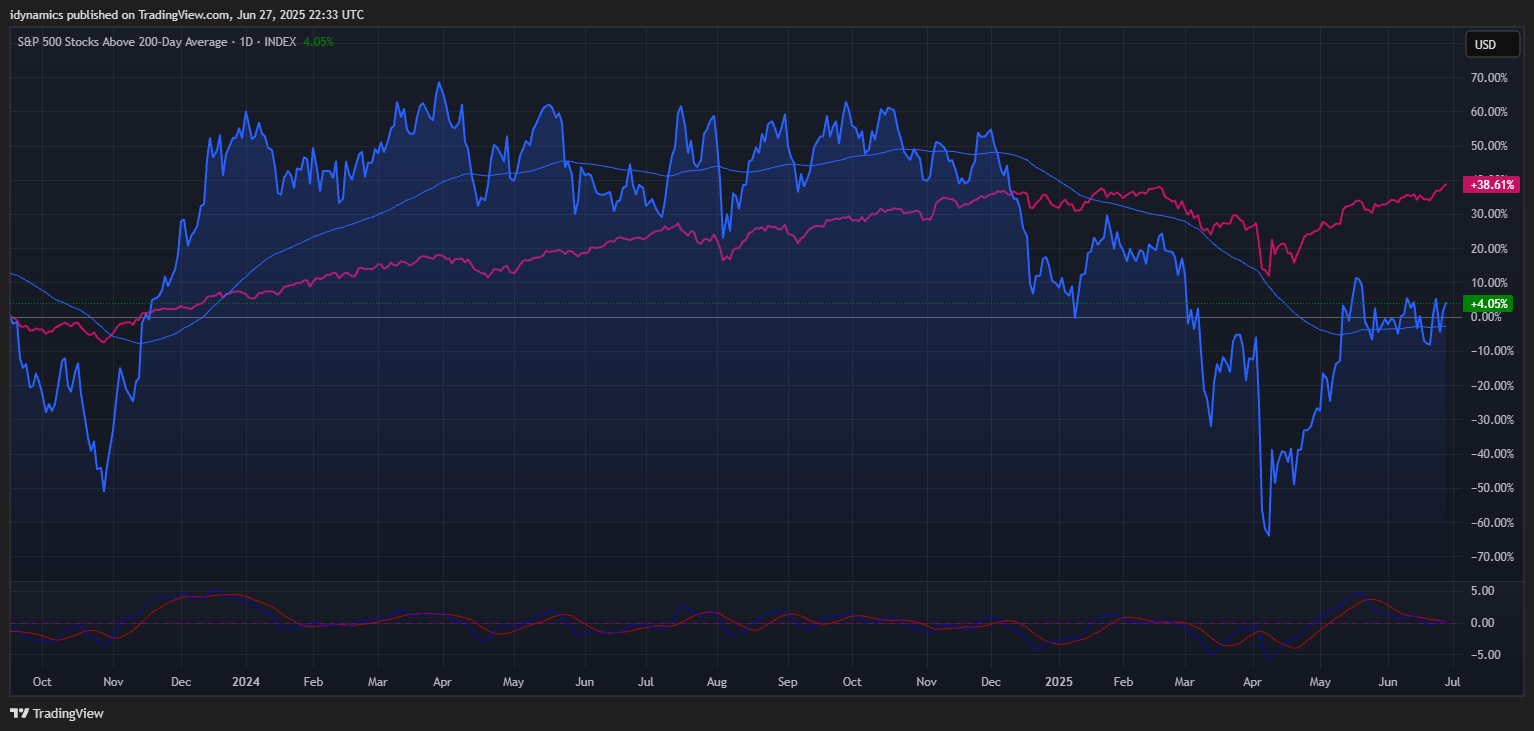 As pointed out recently, the market is rallying under a massive divergence in breadth. The percentage of SPX stocks above their 200-day MA ended Friday at 51.09%. It hit a high of 63.61% in February 2025 and 72.92% in September 2024 and 82.70% in March of 2024.
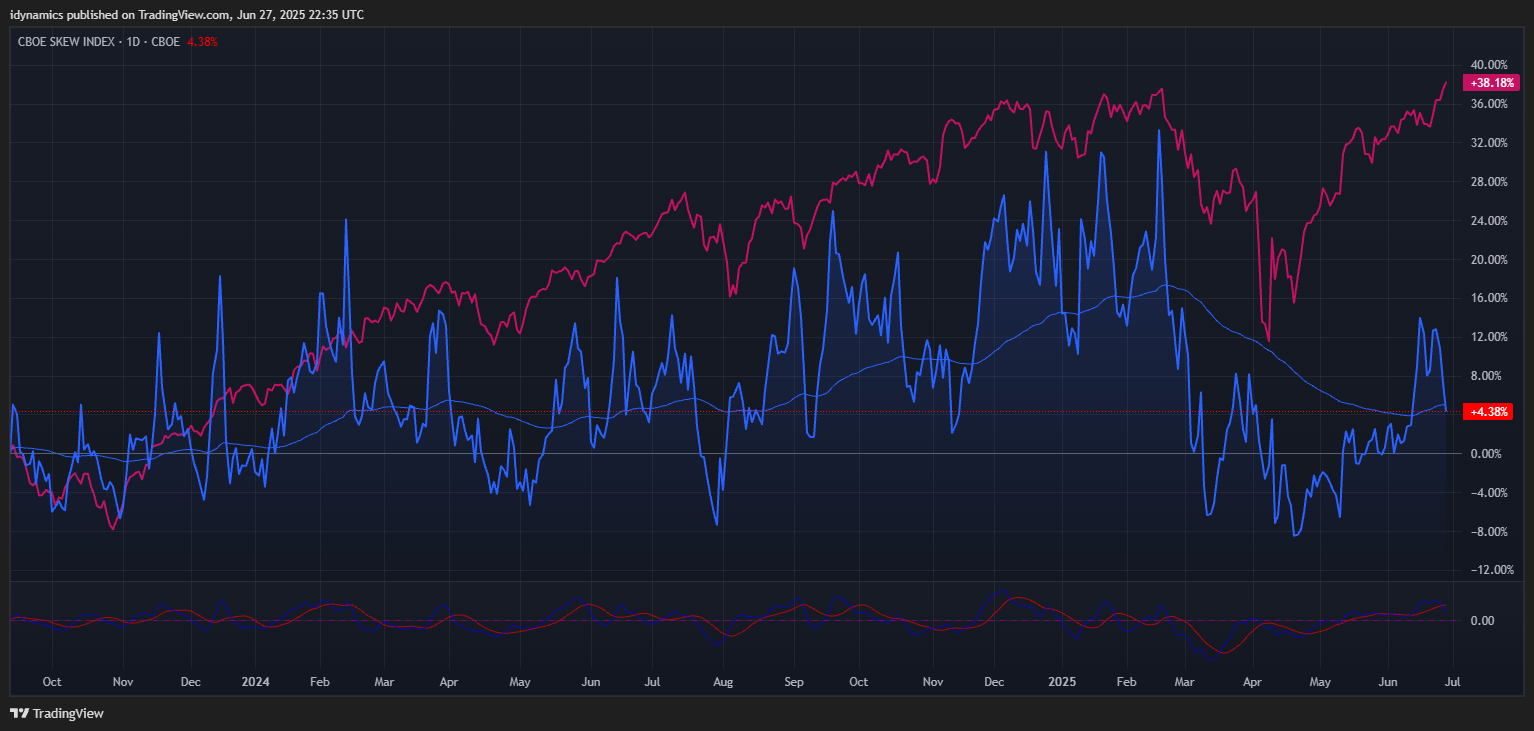
SKEW & SPX
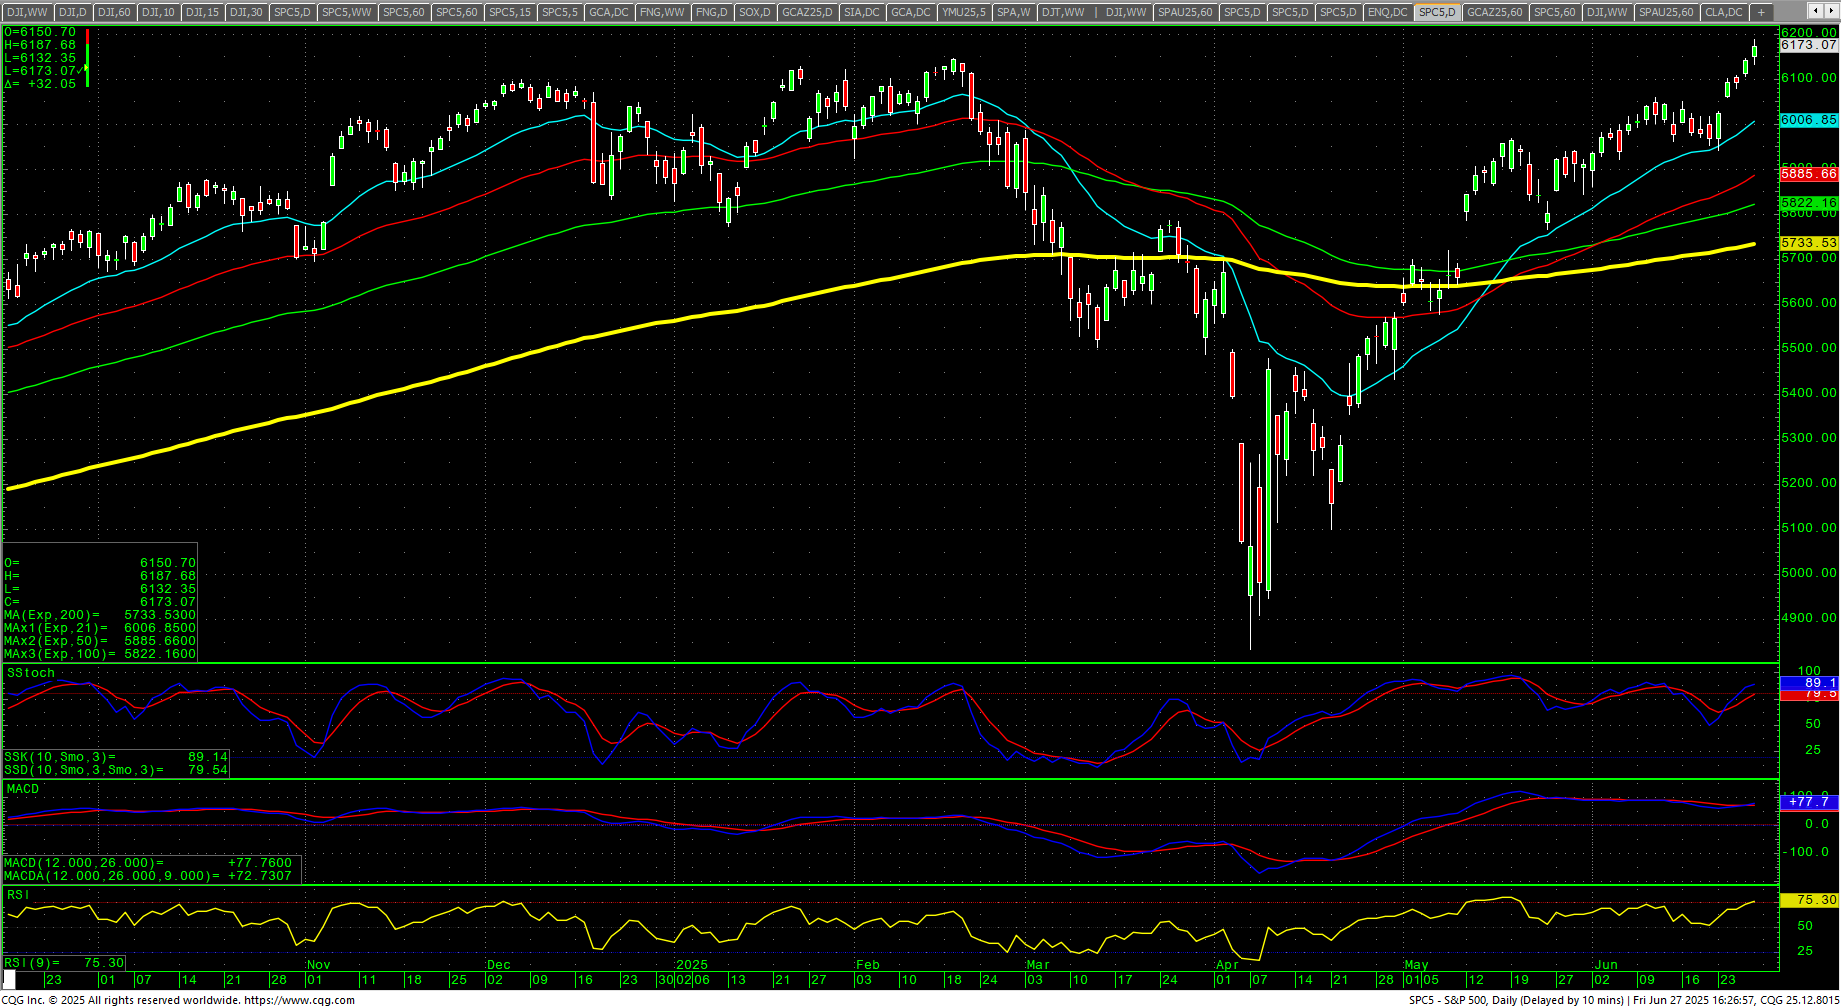
 SPX Daily Candles
 MAGS (Magnificent 7) Daily Candles
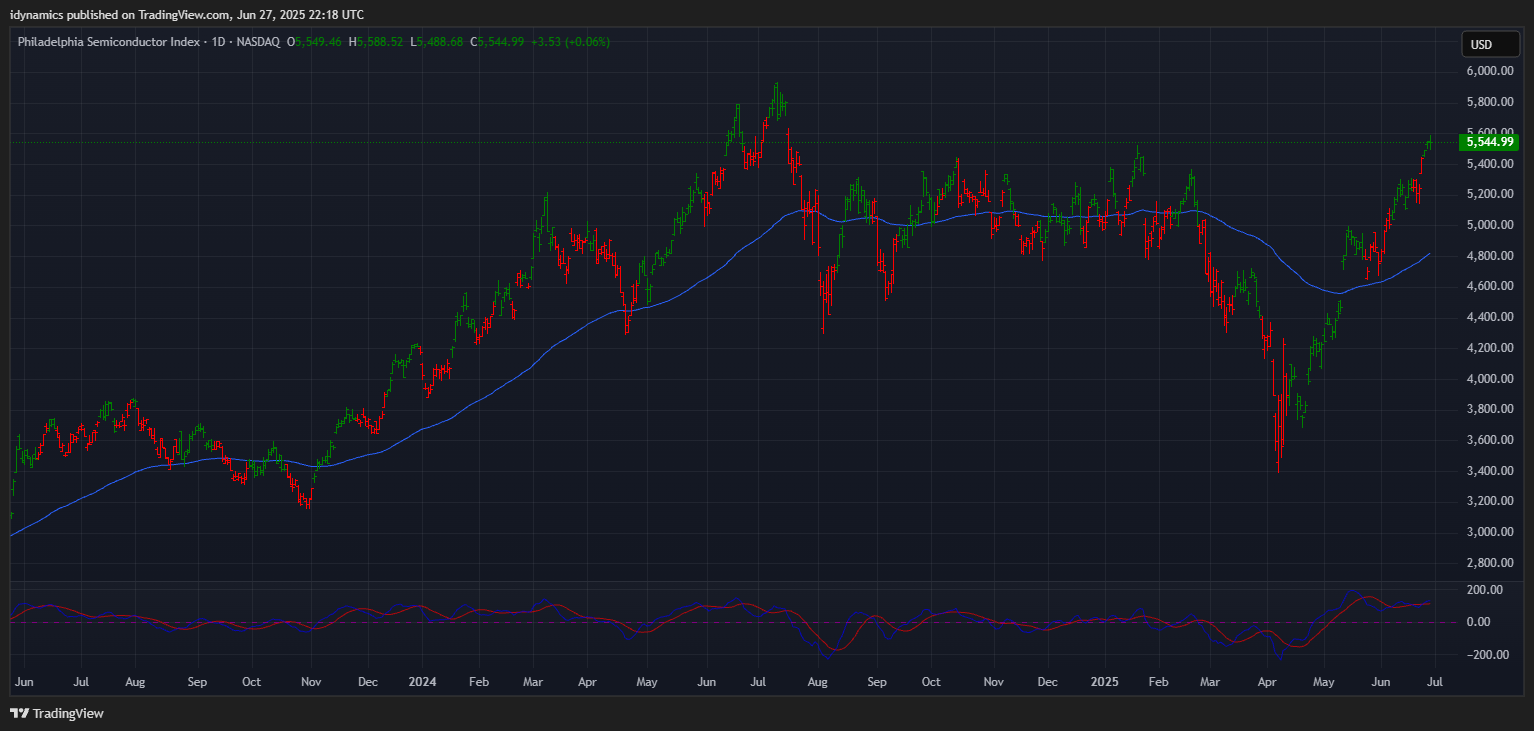
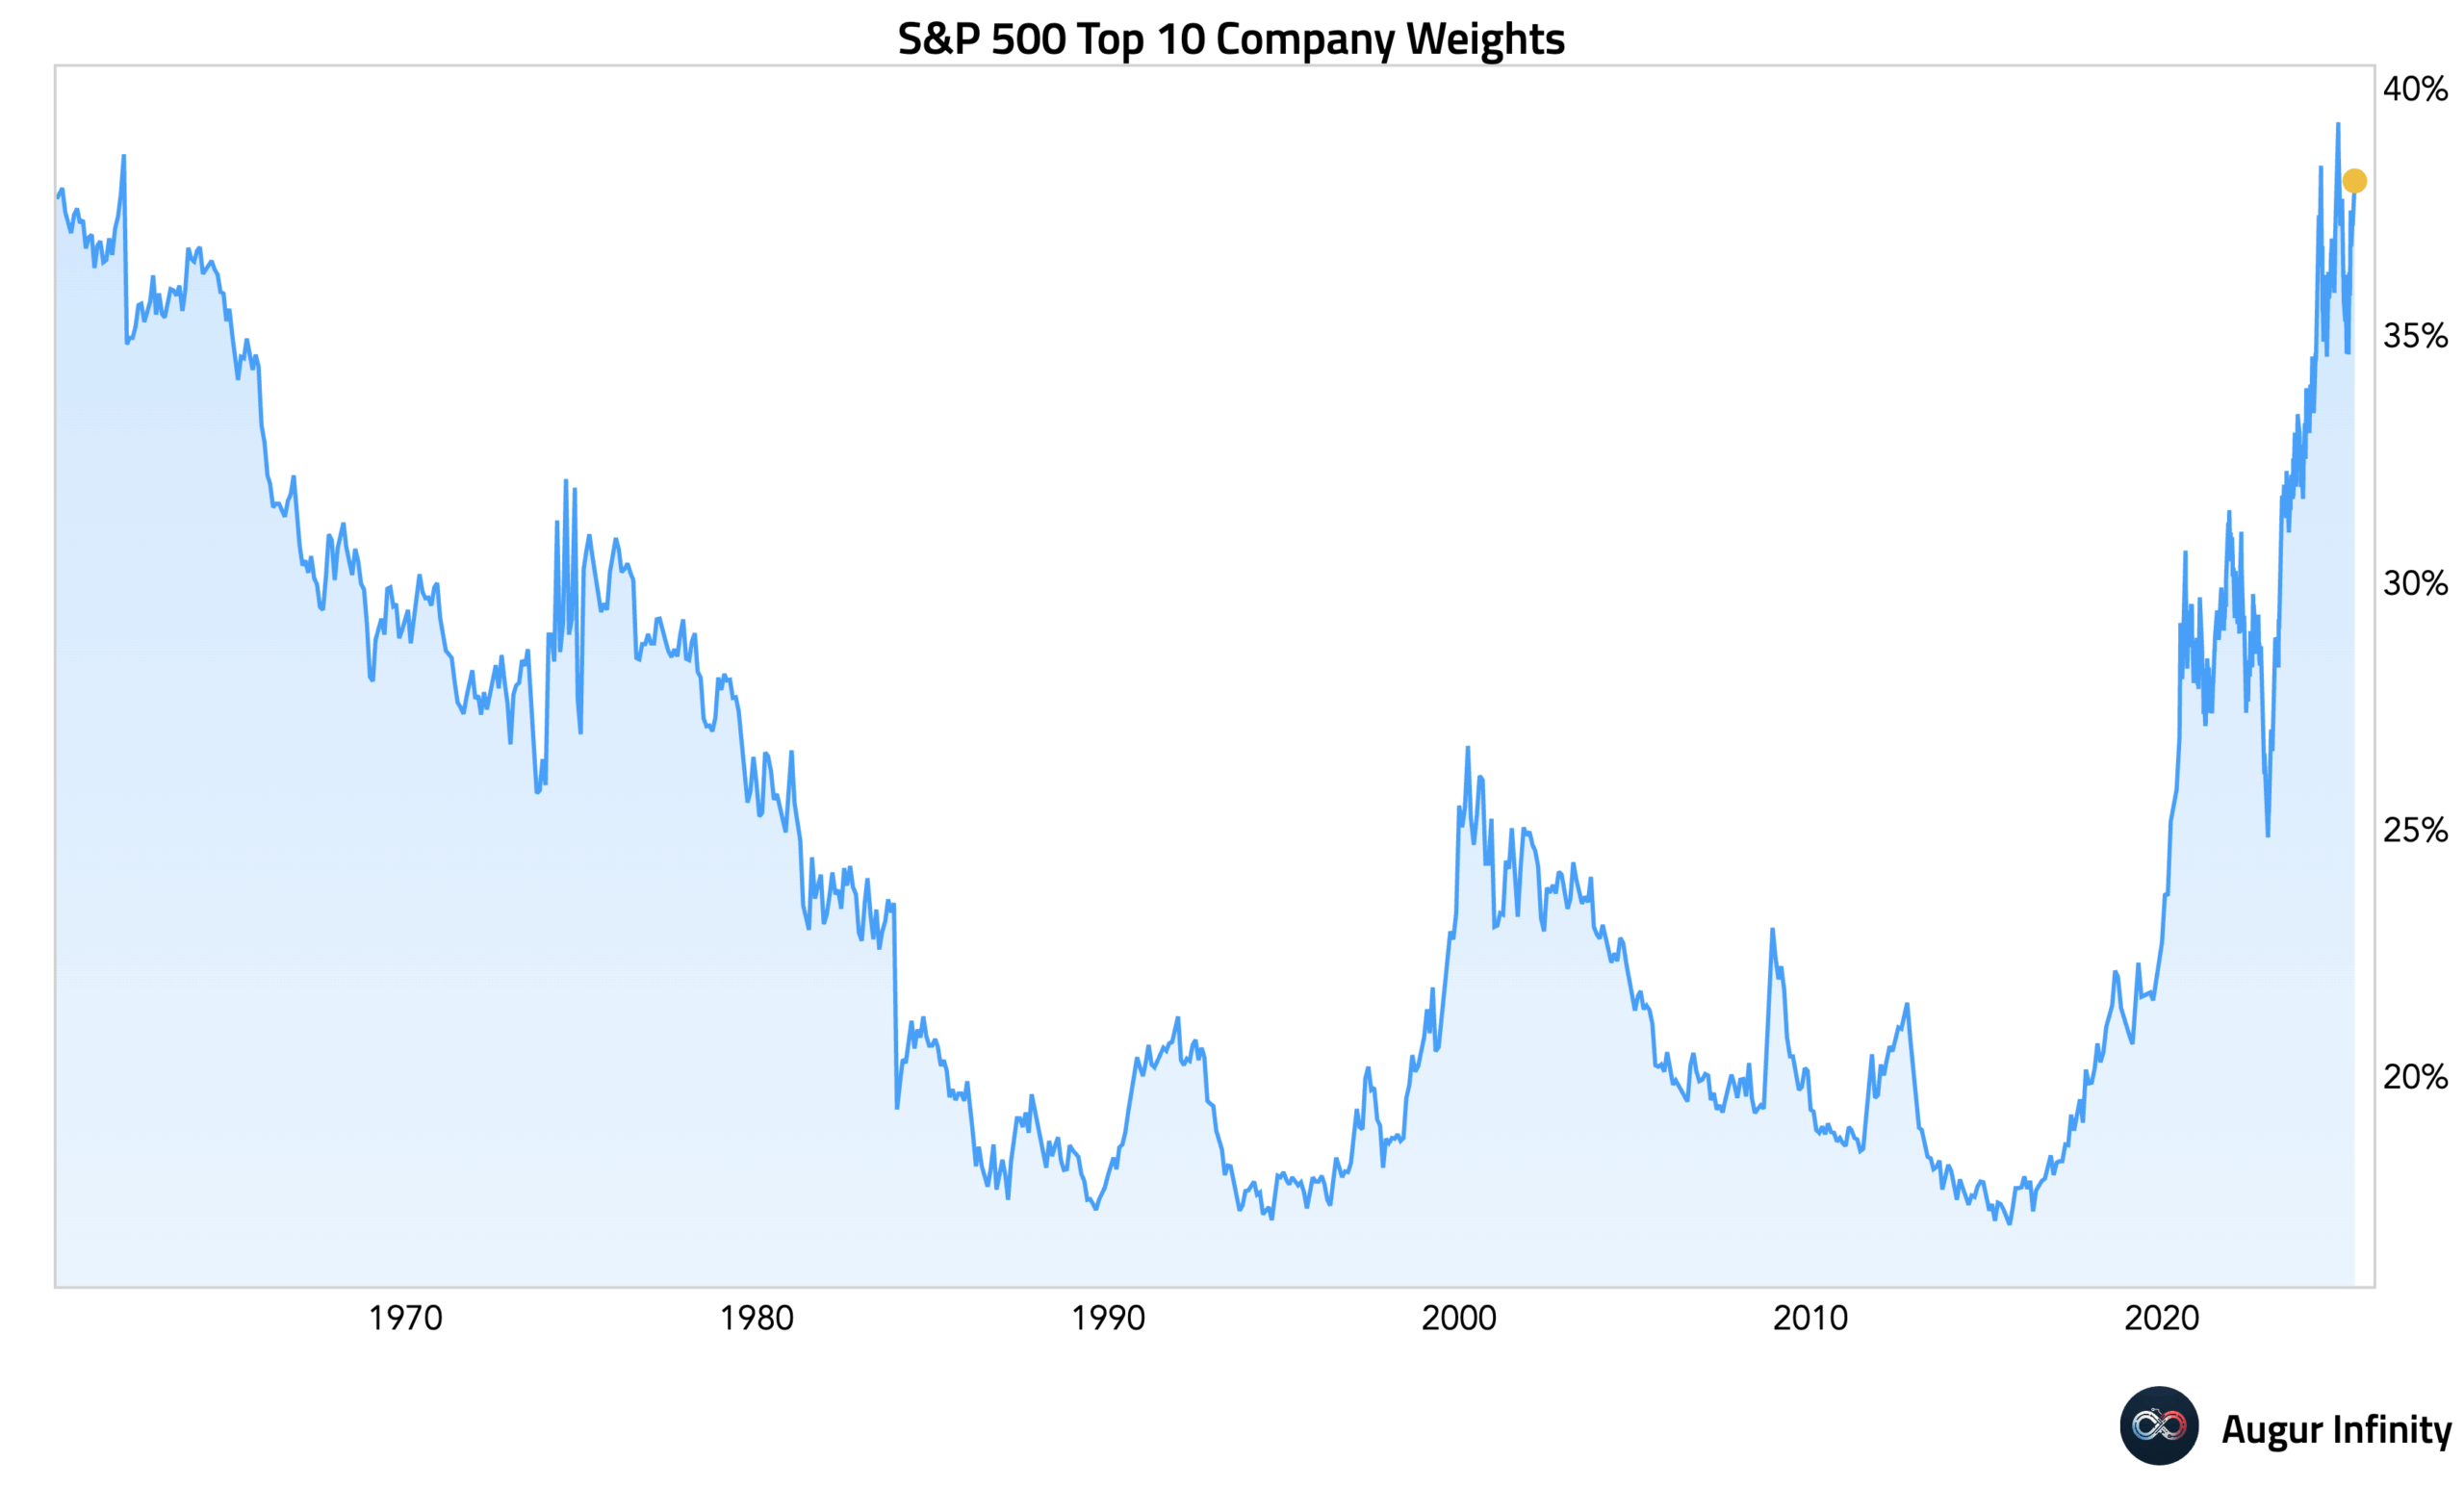
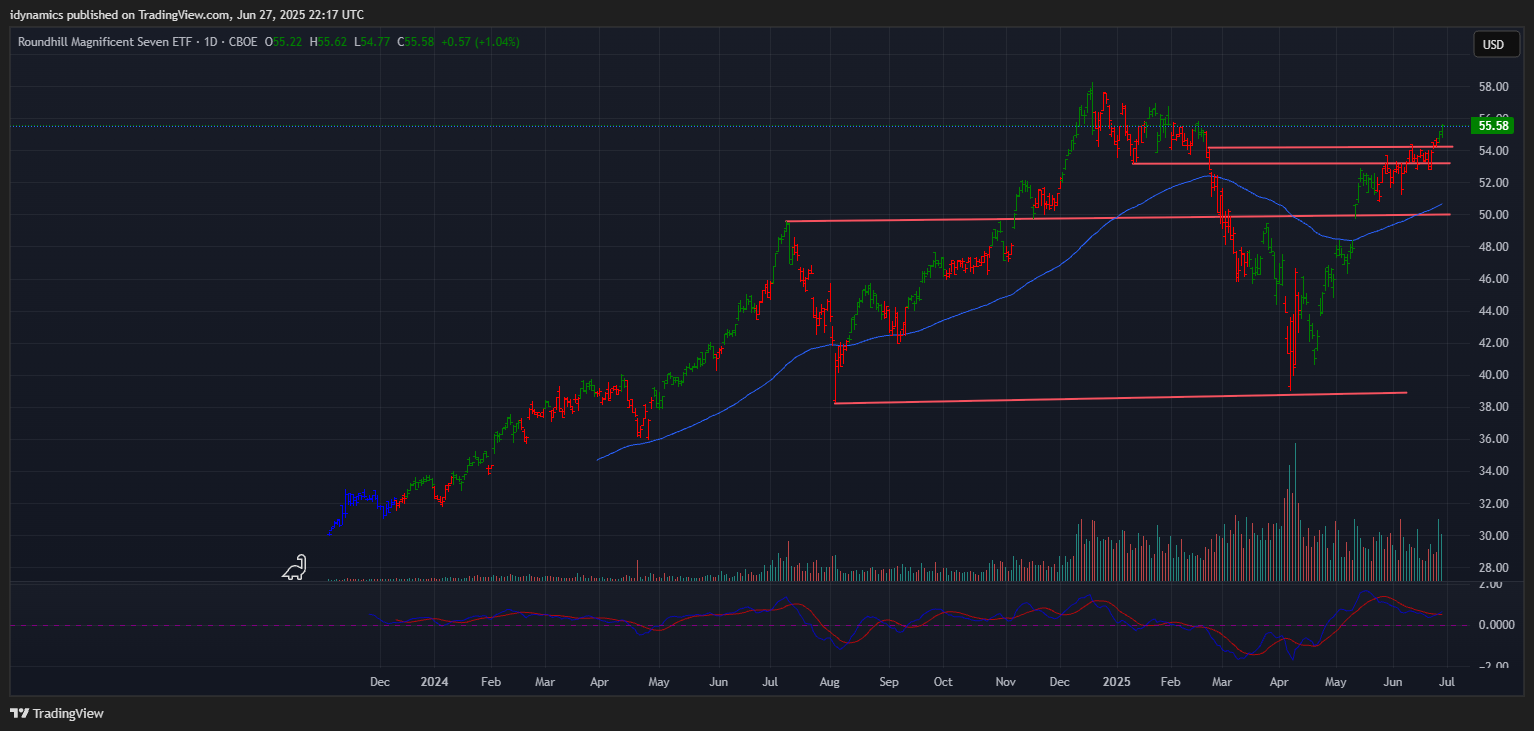 The MAGS followed the globe’s most valued company (NVDA) and cleared, and closed above critical resistance at 54.16…settling up +5.15% on the top of the week’s range. The action opens potential for a test of the highs above 58. Another chart that turned quite bullish is the SOX, which moved into new highs for 2025 and new recovery highs. While it lags the FANG, the SOX has repaired most of the damage that chart had seen. The reality is that the top 10 stocks in the S&P 500 account for almost 40% of the entire index. These are numbers not seen since the 1960s.
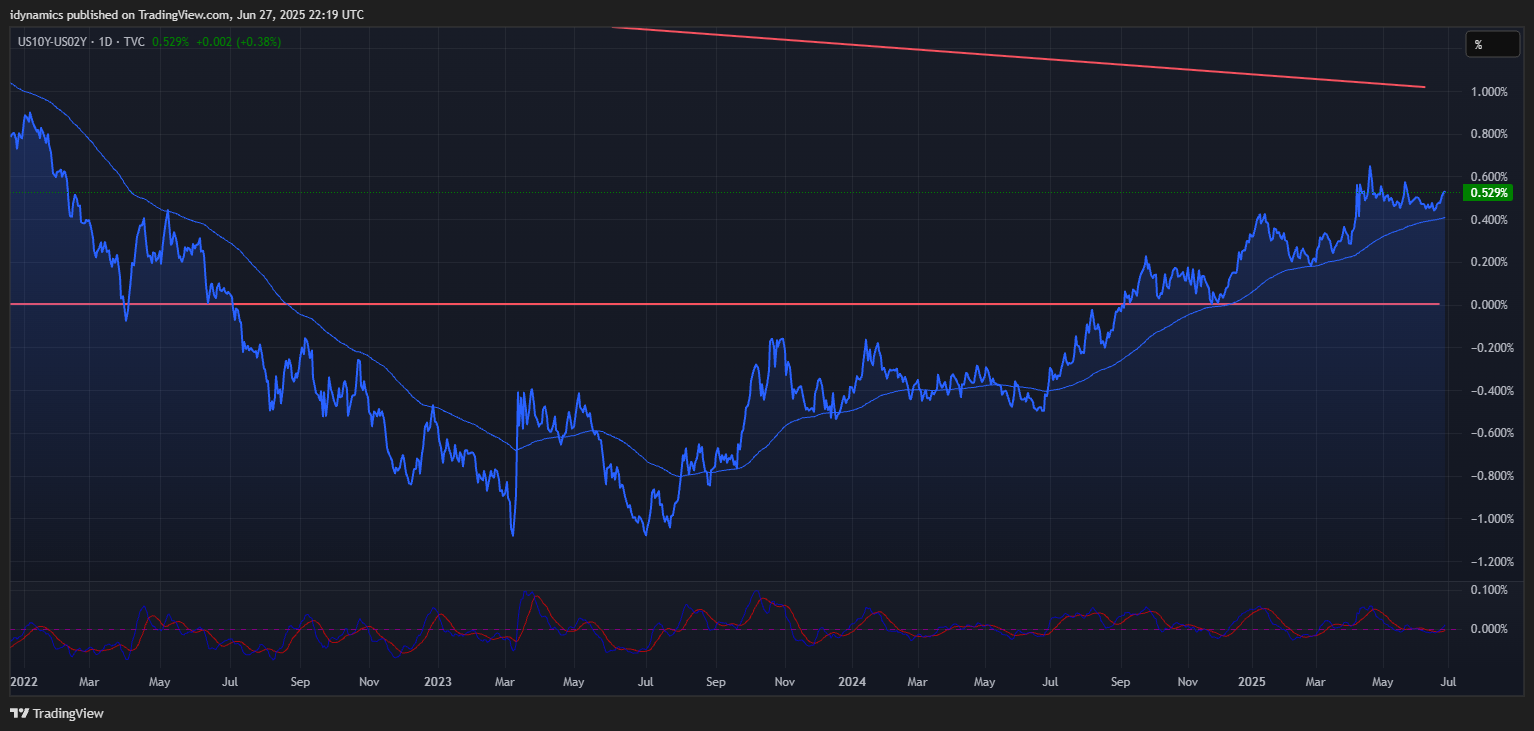
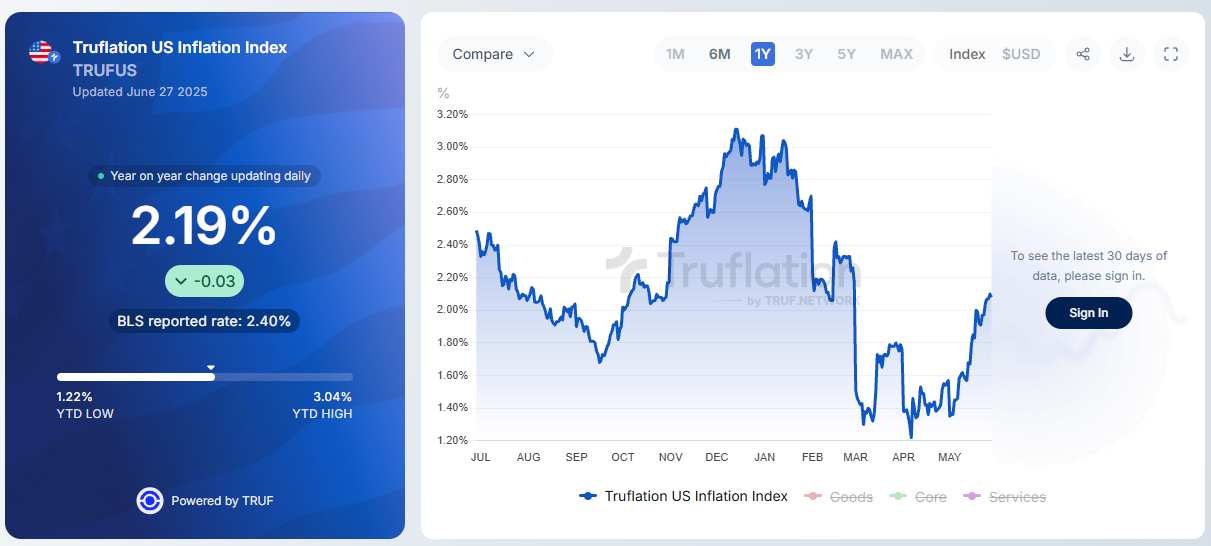
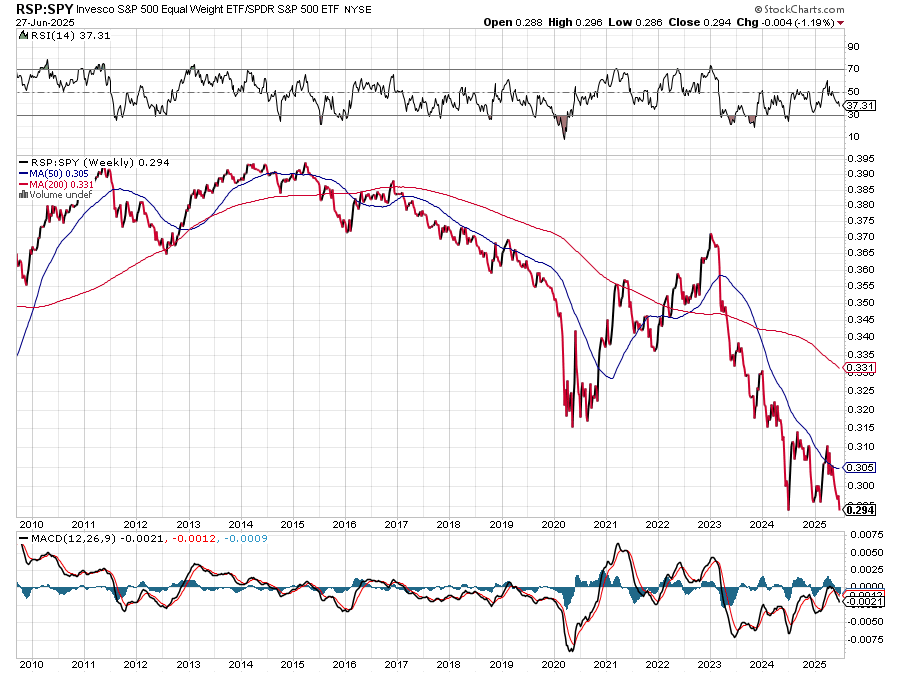
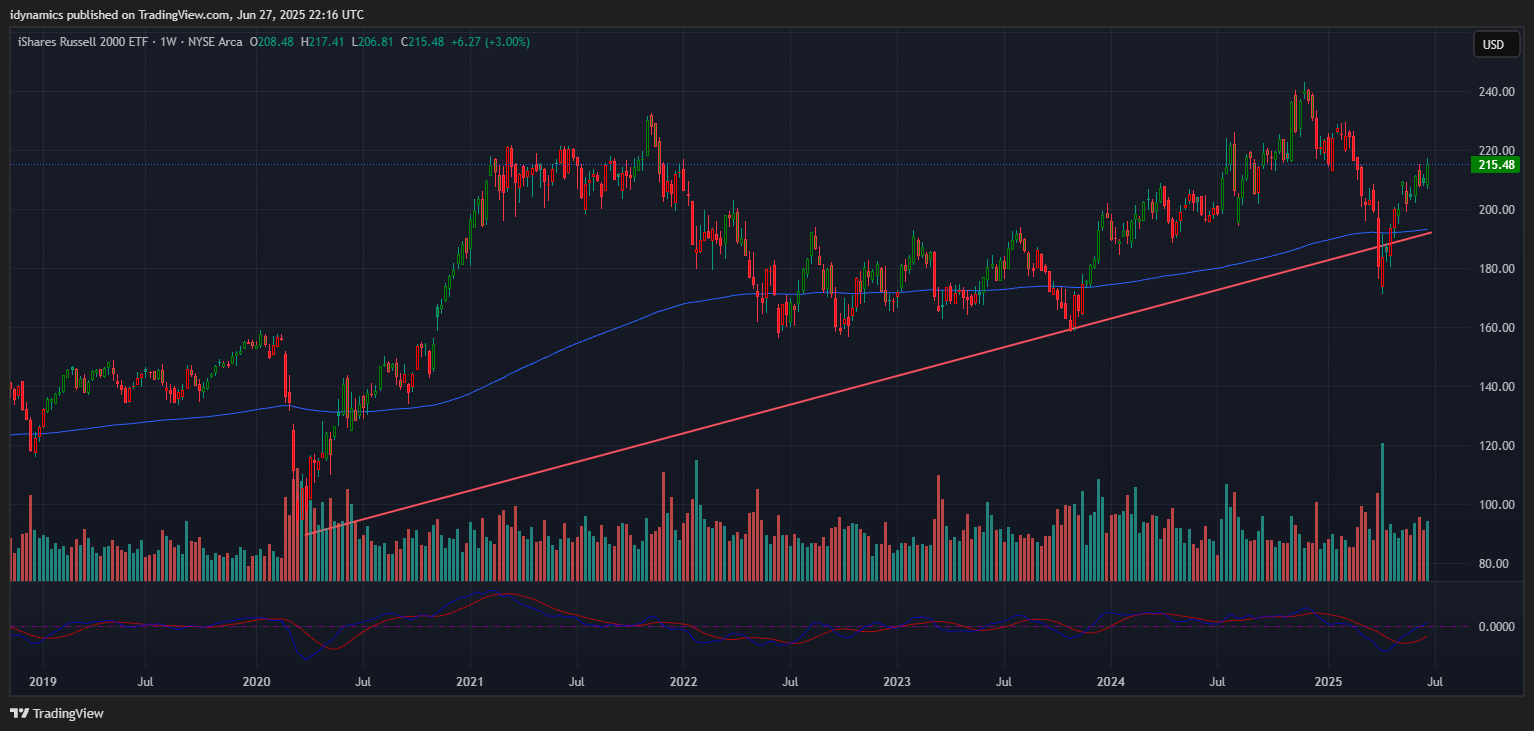
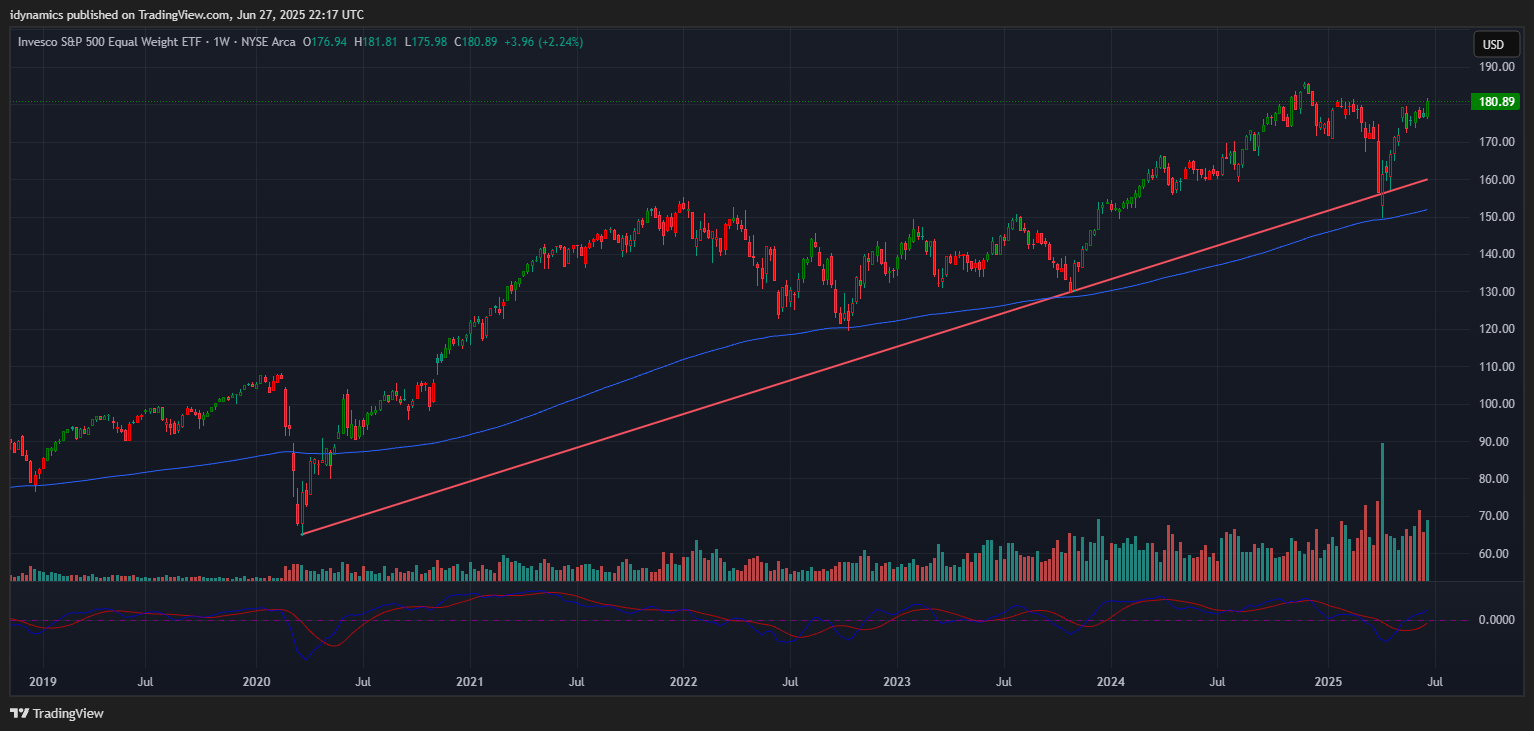
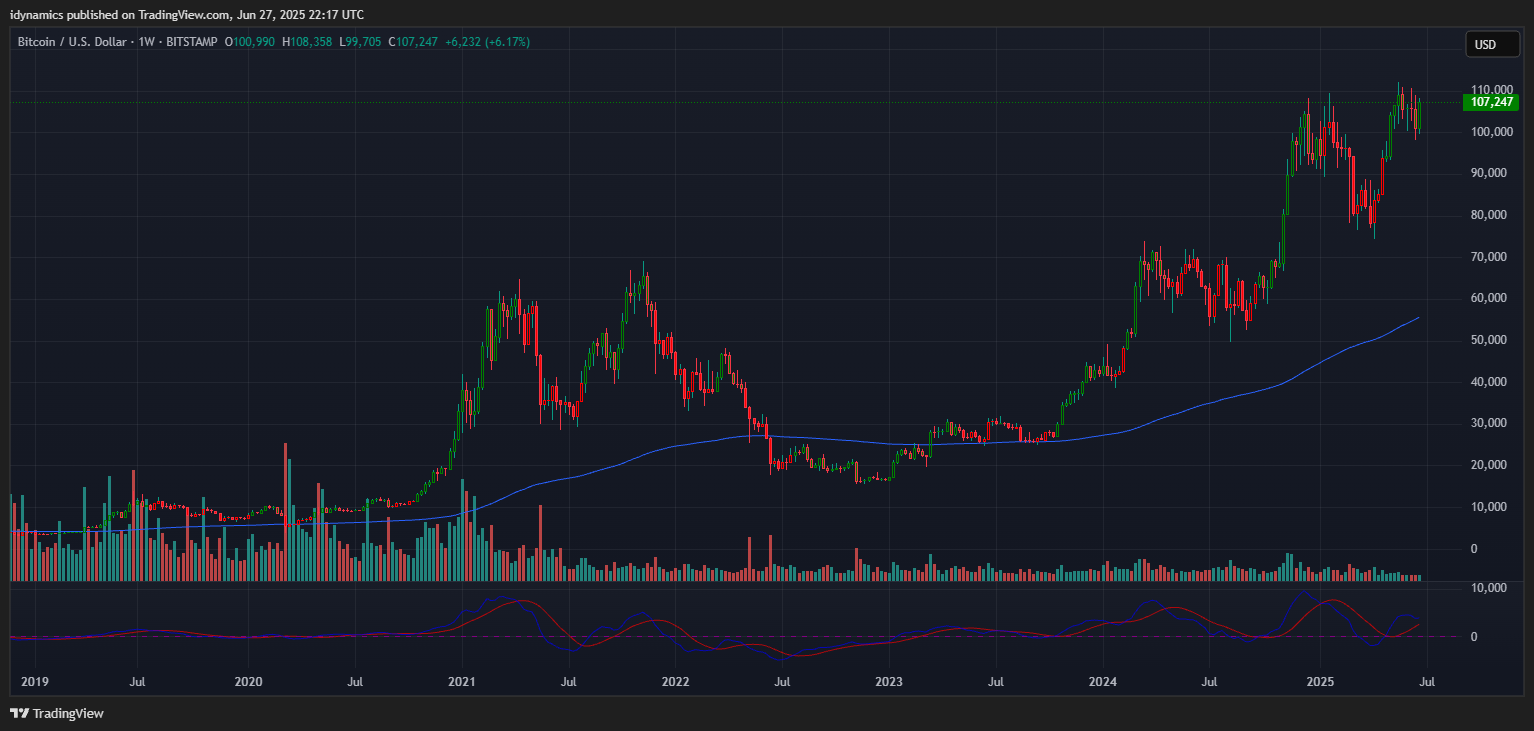
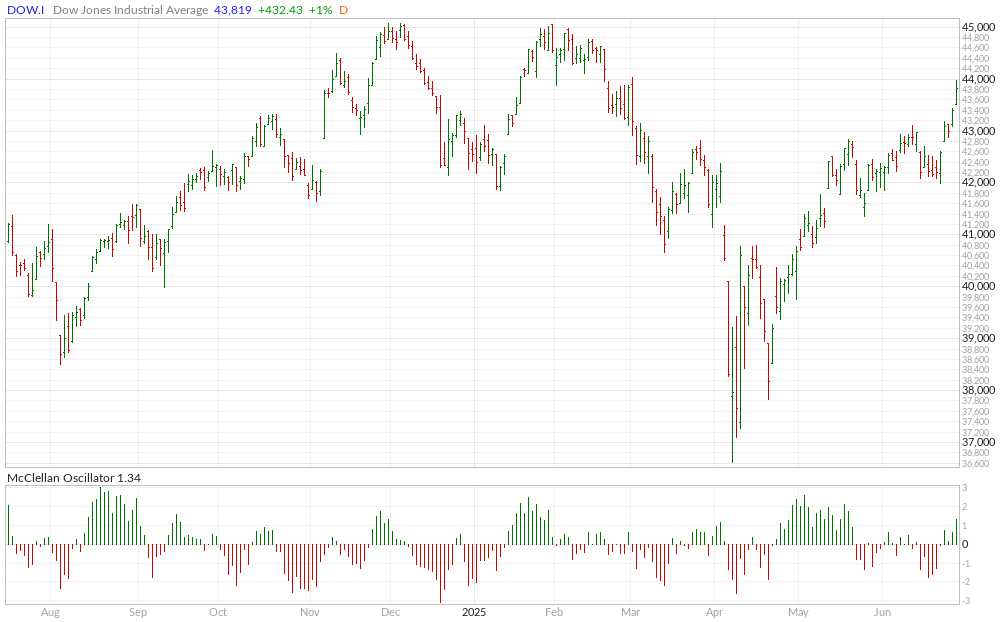
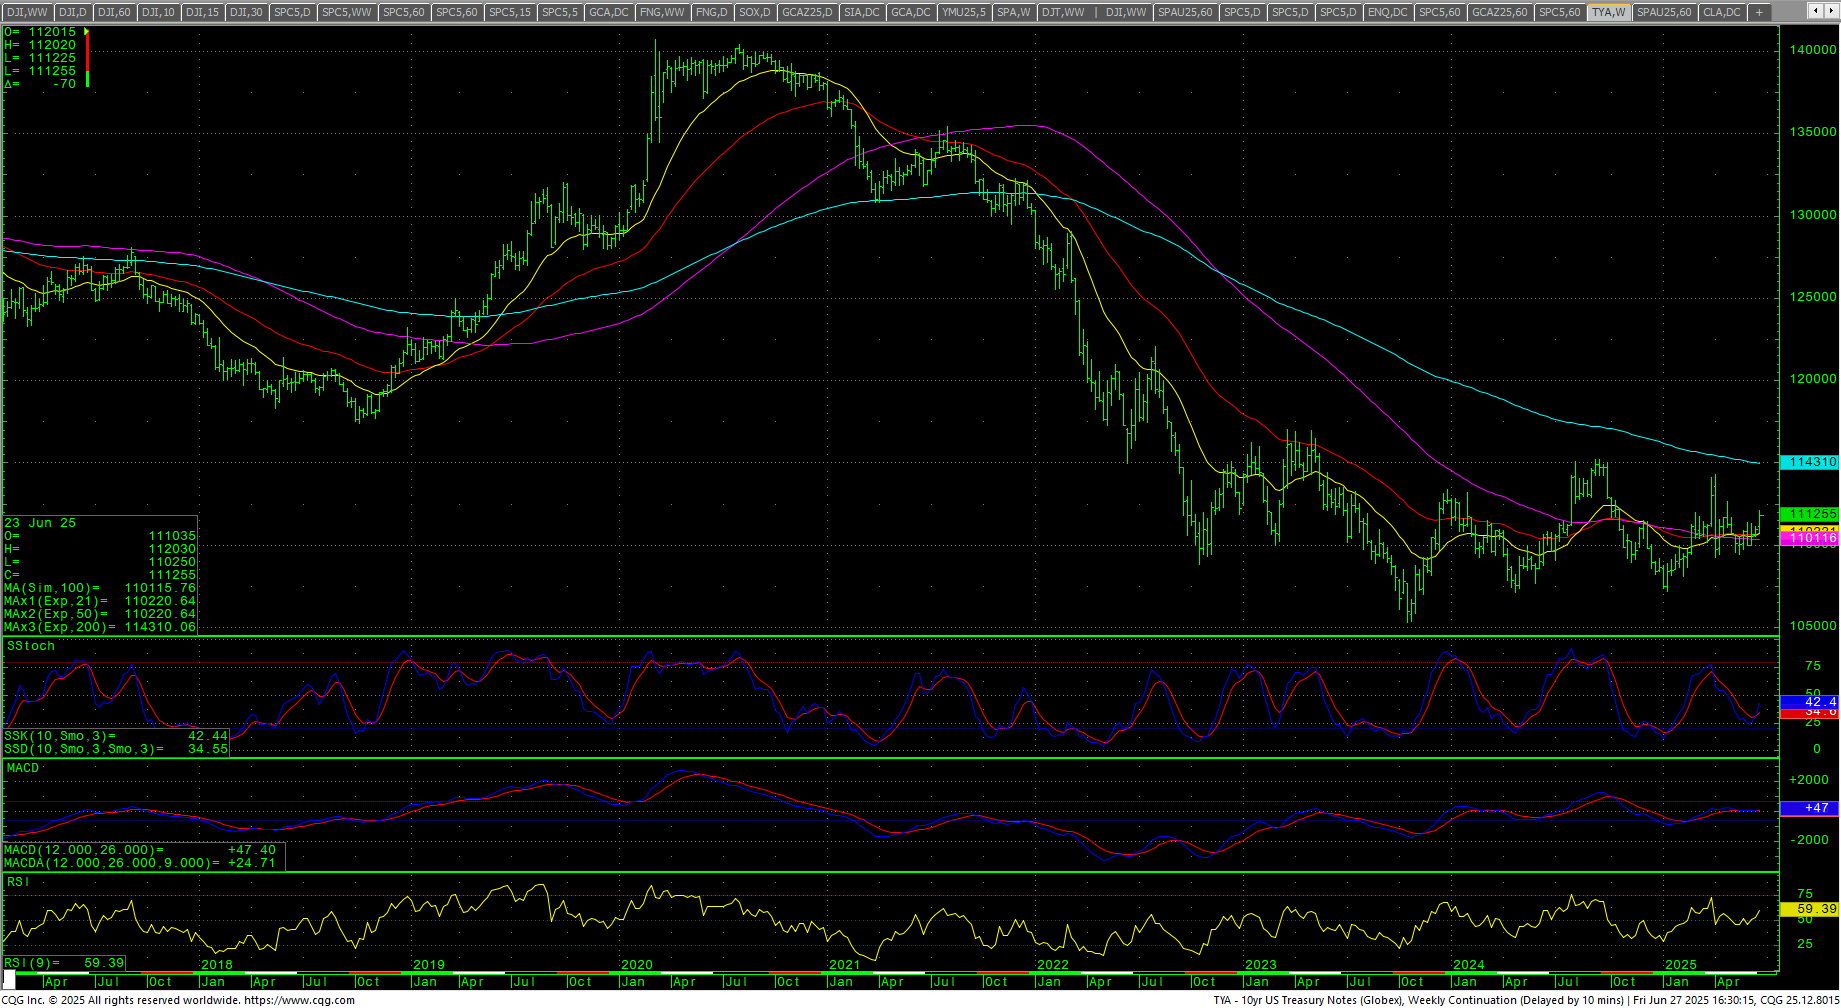
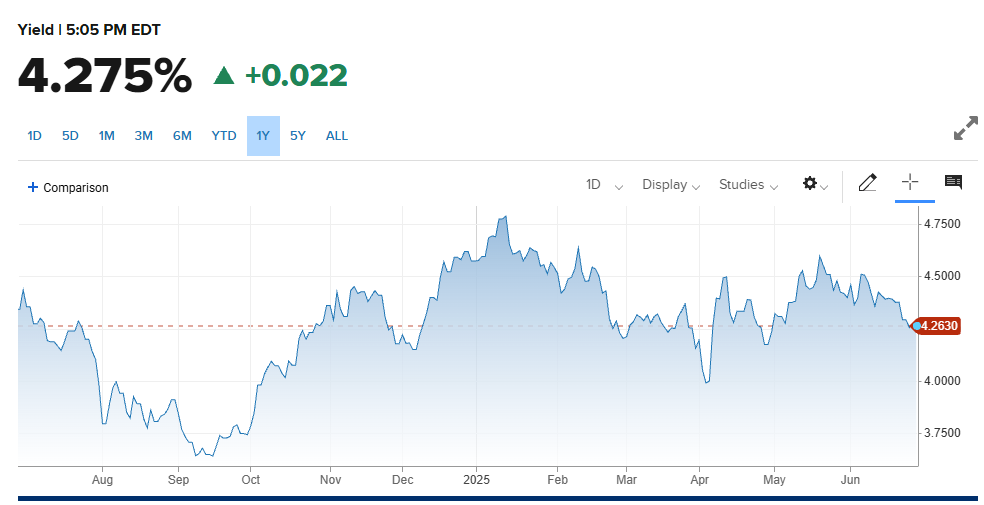
 The RSP:SPY remains extremely weak (another signal of weak breadth). The weekly is hooking lower in an oversold position and the MACD is turning back down. The IWM closed higher, +3.00% on the top of an outside week up at a new recovery high. The RSP was up +2.24% on the top of an outside week up as it nears the 2025 highs. NVDA soared to a new all-time high, closing up +9.66% on the top of the weekly range. Bitcoin recovered from a plunge under 100K and closed on the weekly high, on an inside week, settling up +5.99%. McClellan Oscillators are confirming the new A/D highs in the Dow. The Yield Curve expanded more on the week, closing at +0.529%. The 10YR yield declined throughout the week, testing two-month lows and closed lower at 4.275%. Truflation rose to 2.19%.
10YR-2YR Yield Curve Daily
 VIX Weekly Candles
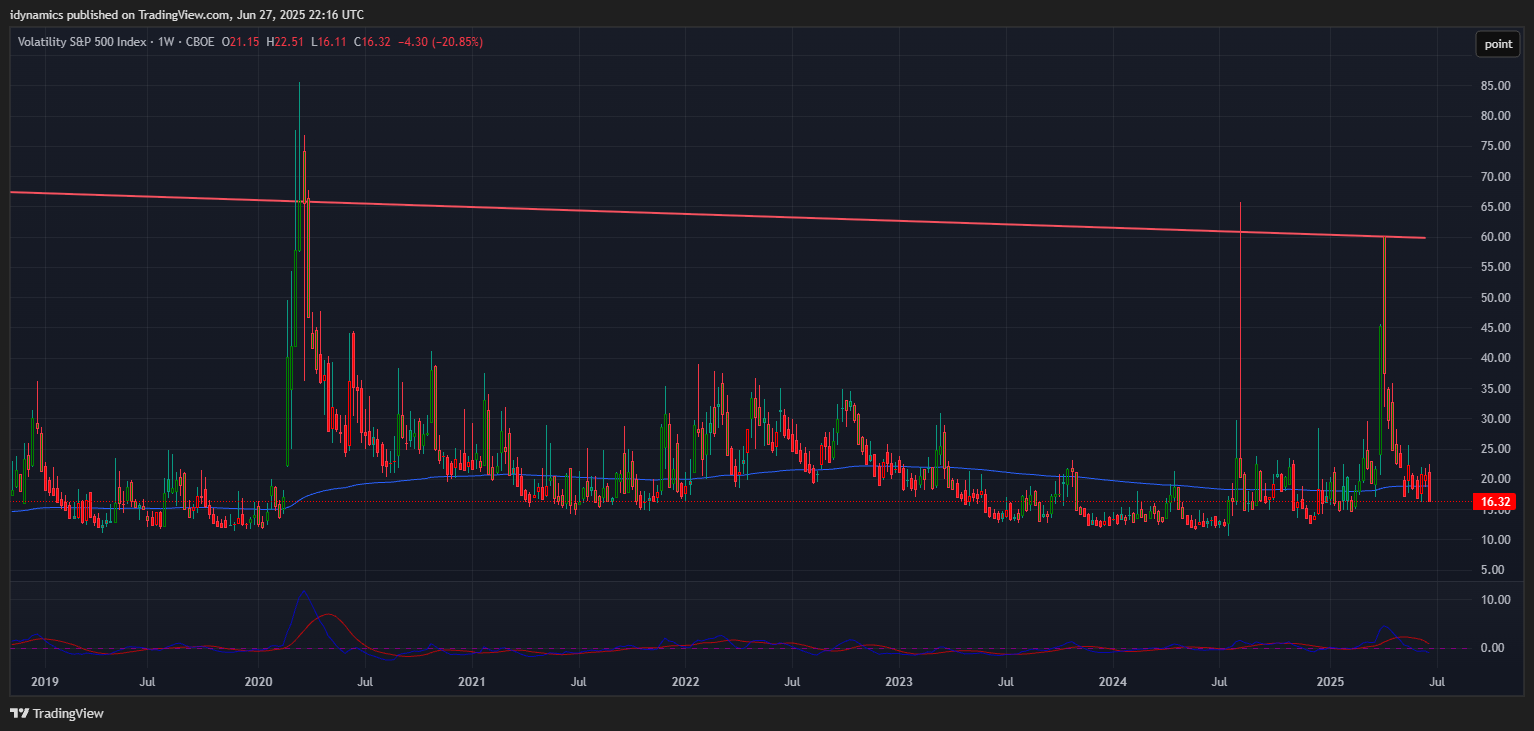
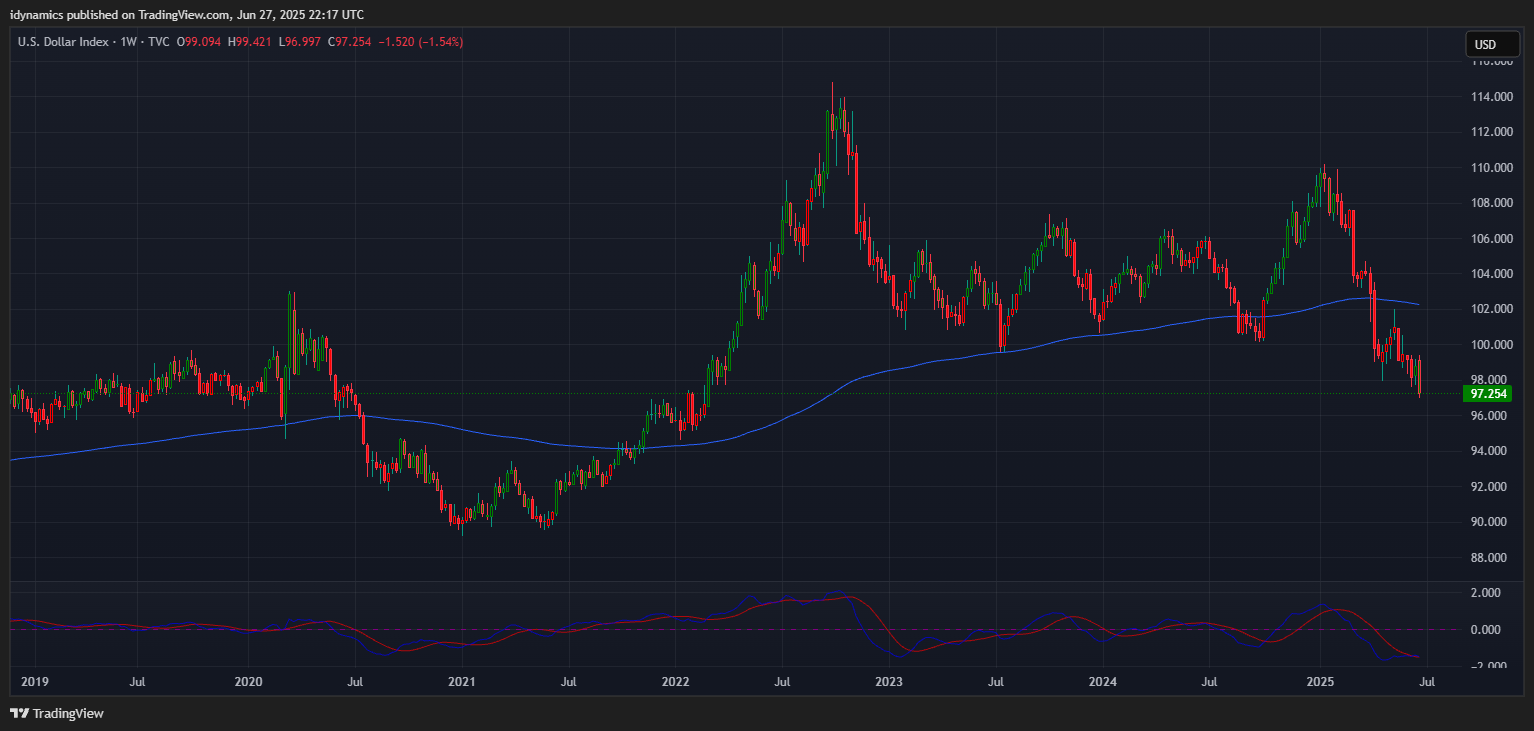
The VIX plunged and is back toward the 2025 lows and in “complacency” levels again at 16.32. The US Dollar traded an outside week down and closed on the lows, down -1.54%. The close is the lowest since 22 February 2022.
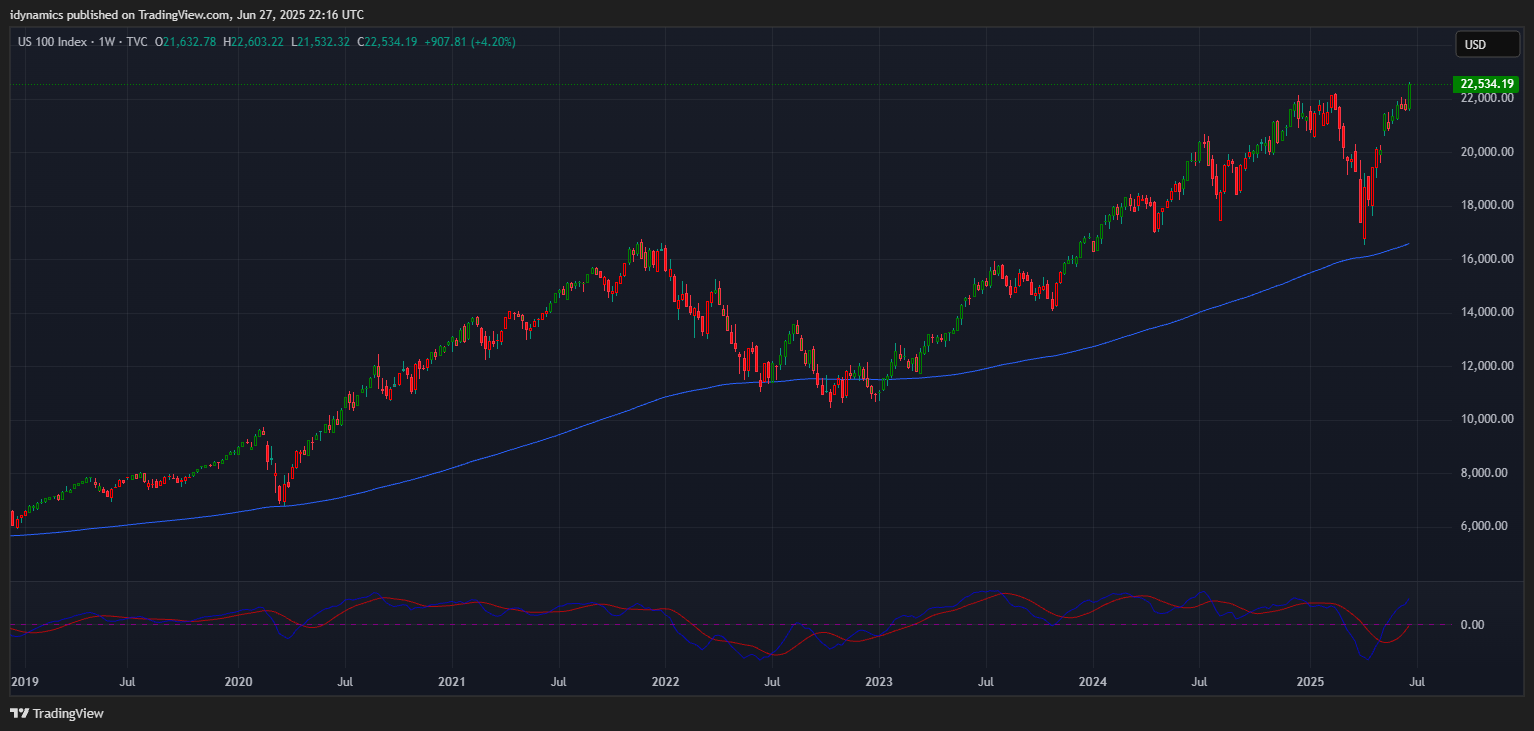
 Nasdaq 100 Weekly Candles
Daily Breadth 
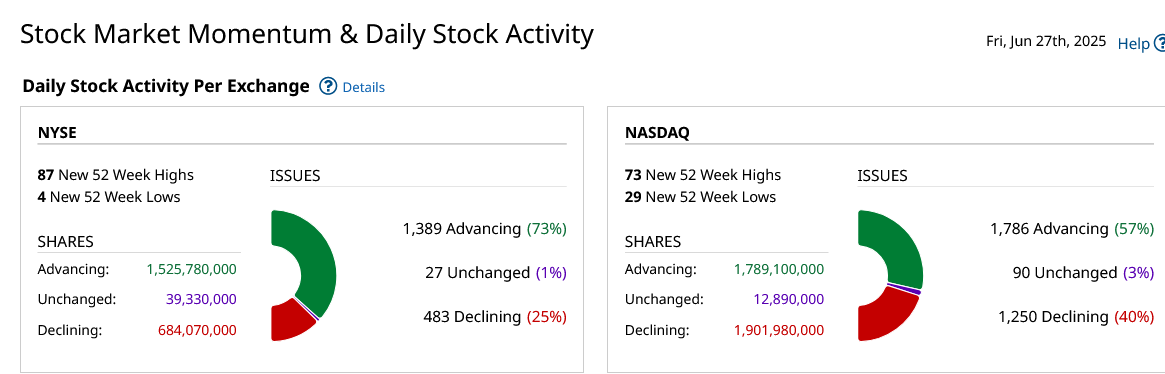
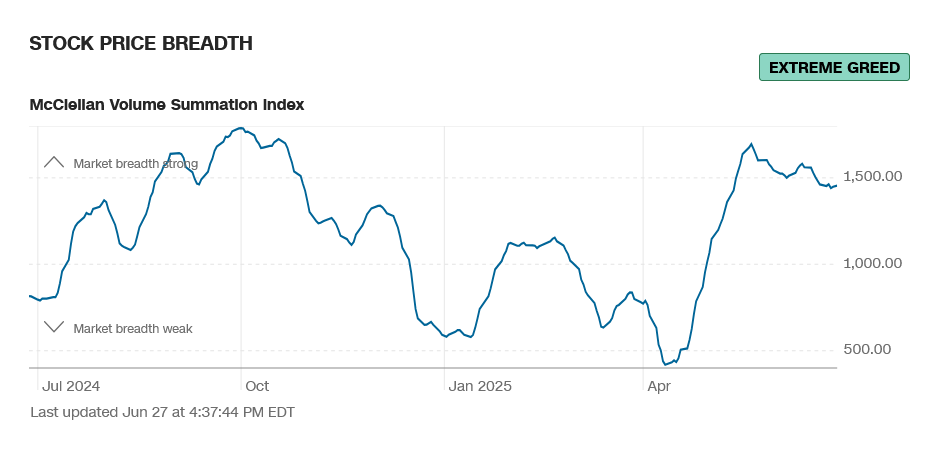
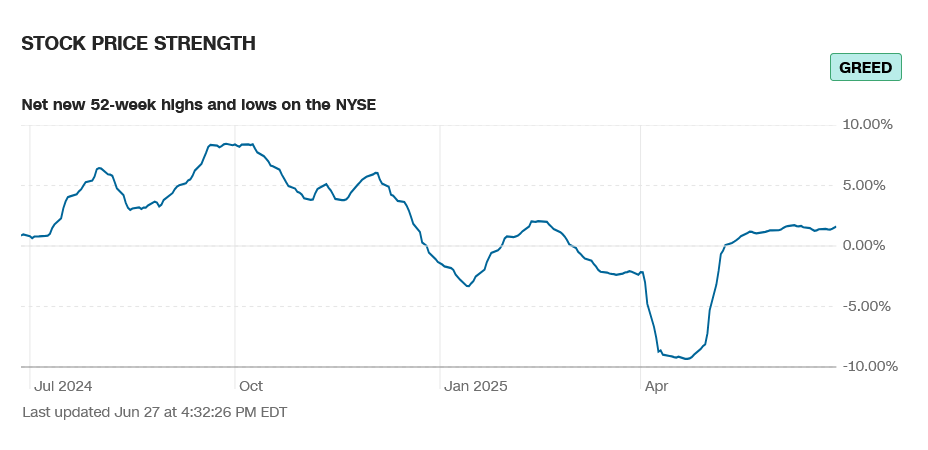
Breadth was strong on Friday. Sentiment remains in extreme greed.
CNN Fear & Greed Index
 AAII Investor Sentiment Survey
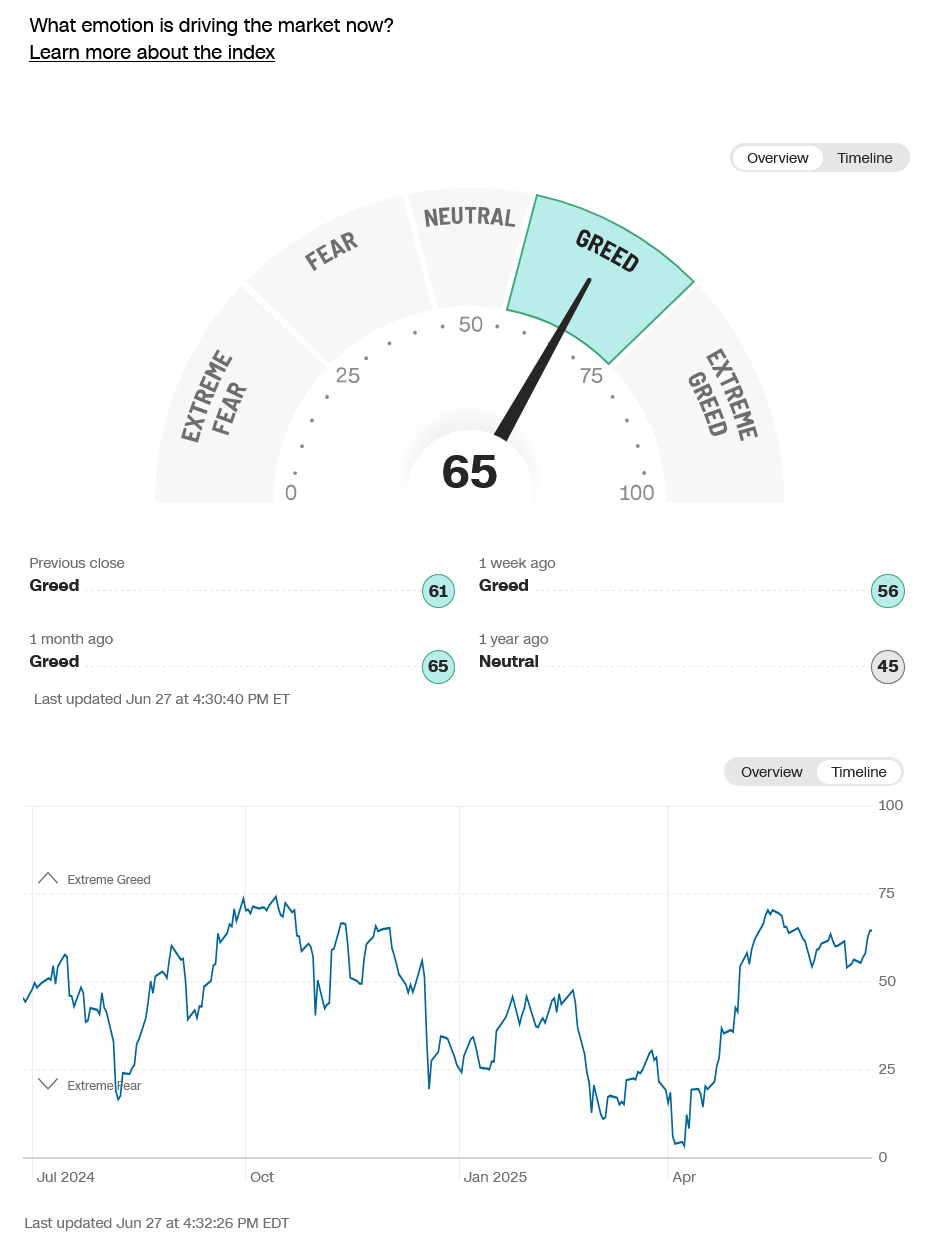
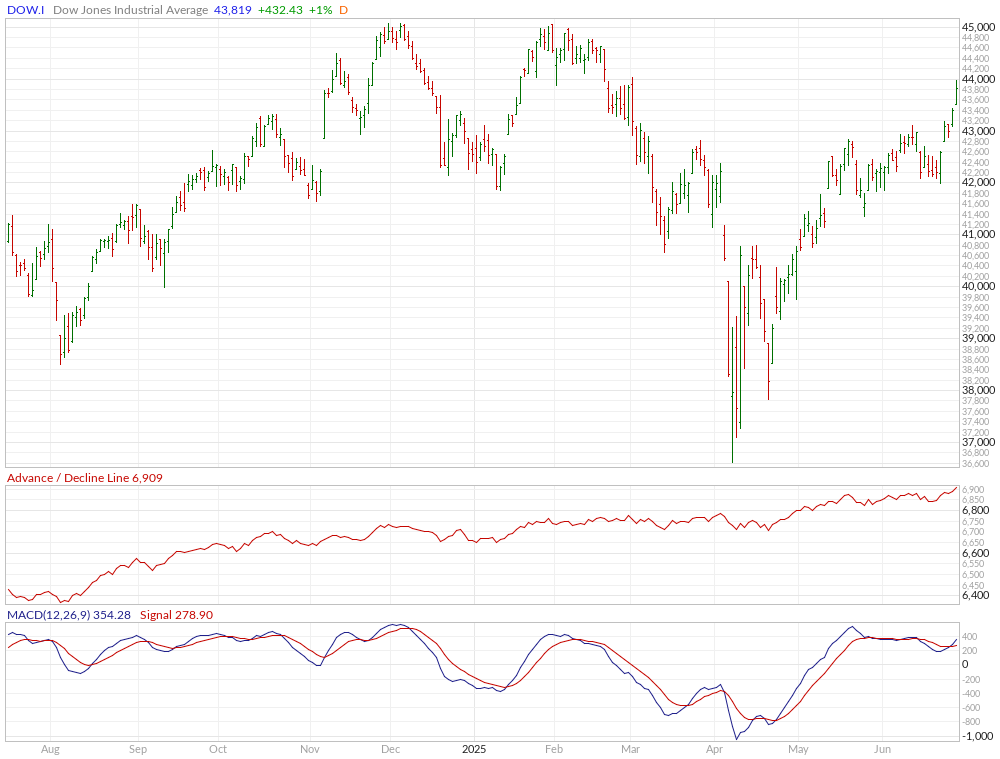
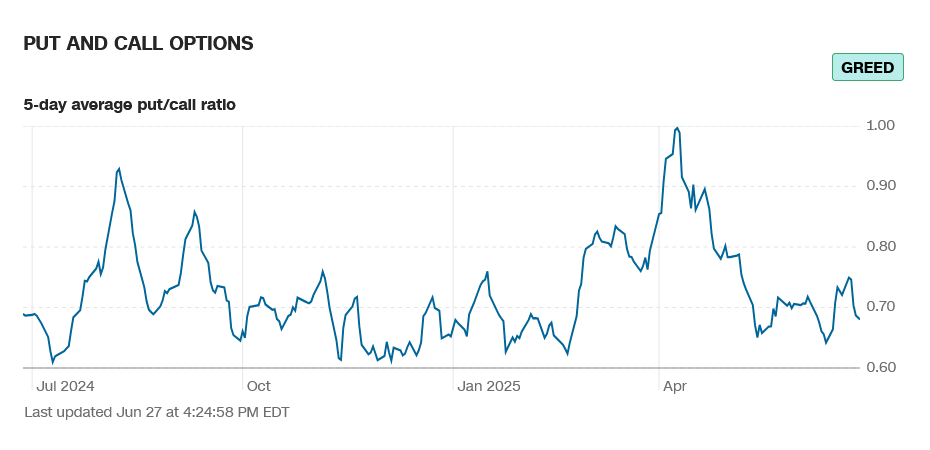
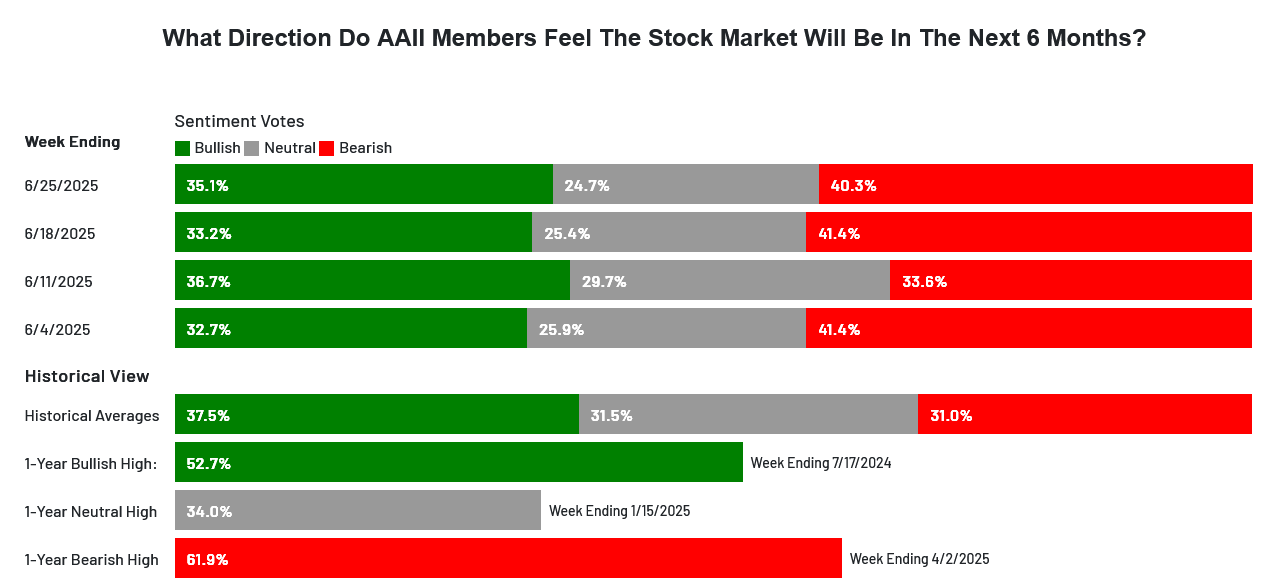 Sentiment remains in greed and extreme greed on most fronts. The CNN Fear and Greed Index moved up to 65 and now reads greed. Breadth improved on the week and sentiment reads extreme greed. Latest AAII Sentiment Survey: Optimism Creeps Up as the bulls remain under the bears still. The Dow A/D moved to a record high at 6909. The VIX closed the week lower and remains below 20, ending the week down -20.85%. The Put/Call closed at 0.68 and reads greed. The 52-week, A/D rose to +1.60% and reads greed. The Dow closed the week up +3.82%, closing on the top of an outside week up. The S&P soared +3.44% ending in the top of an outside week up. The Nasdaq Composite rose sharply, +4.25% and the Nasdaq 100 was up +4.20%. The NYSE FANG exploded to record highs and closed up +5.98%. The Russell was up +3.00% on the top of a reversal week up. The 10-year notes closed higher, in the top of the weekly range at the highest weekly close since 31 March 2025. The yield on the 10YR decreased to 4.275%.
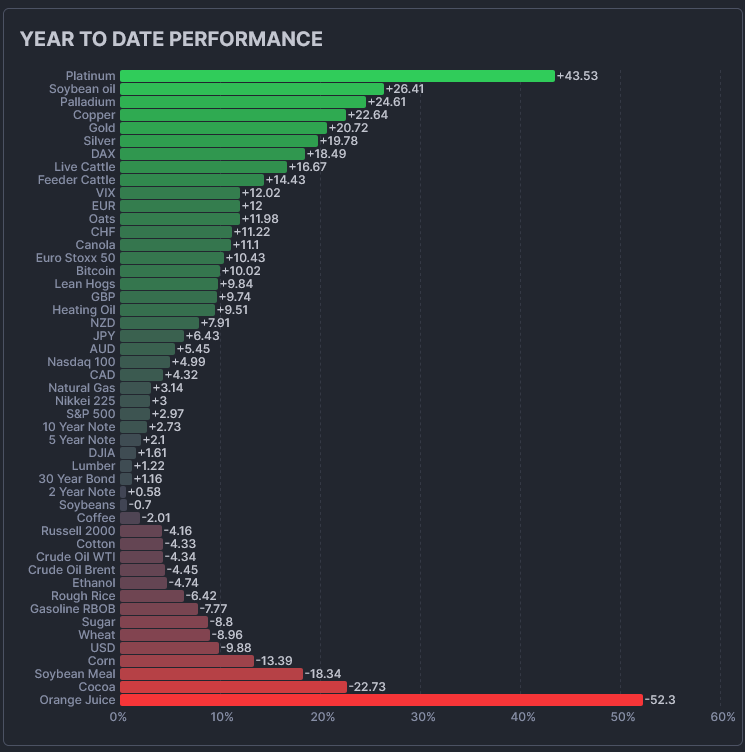
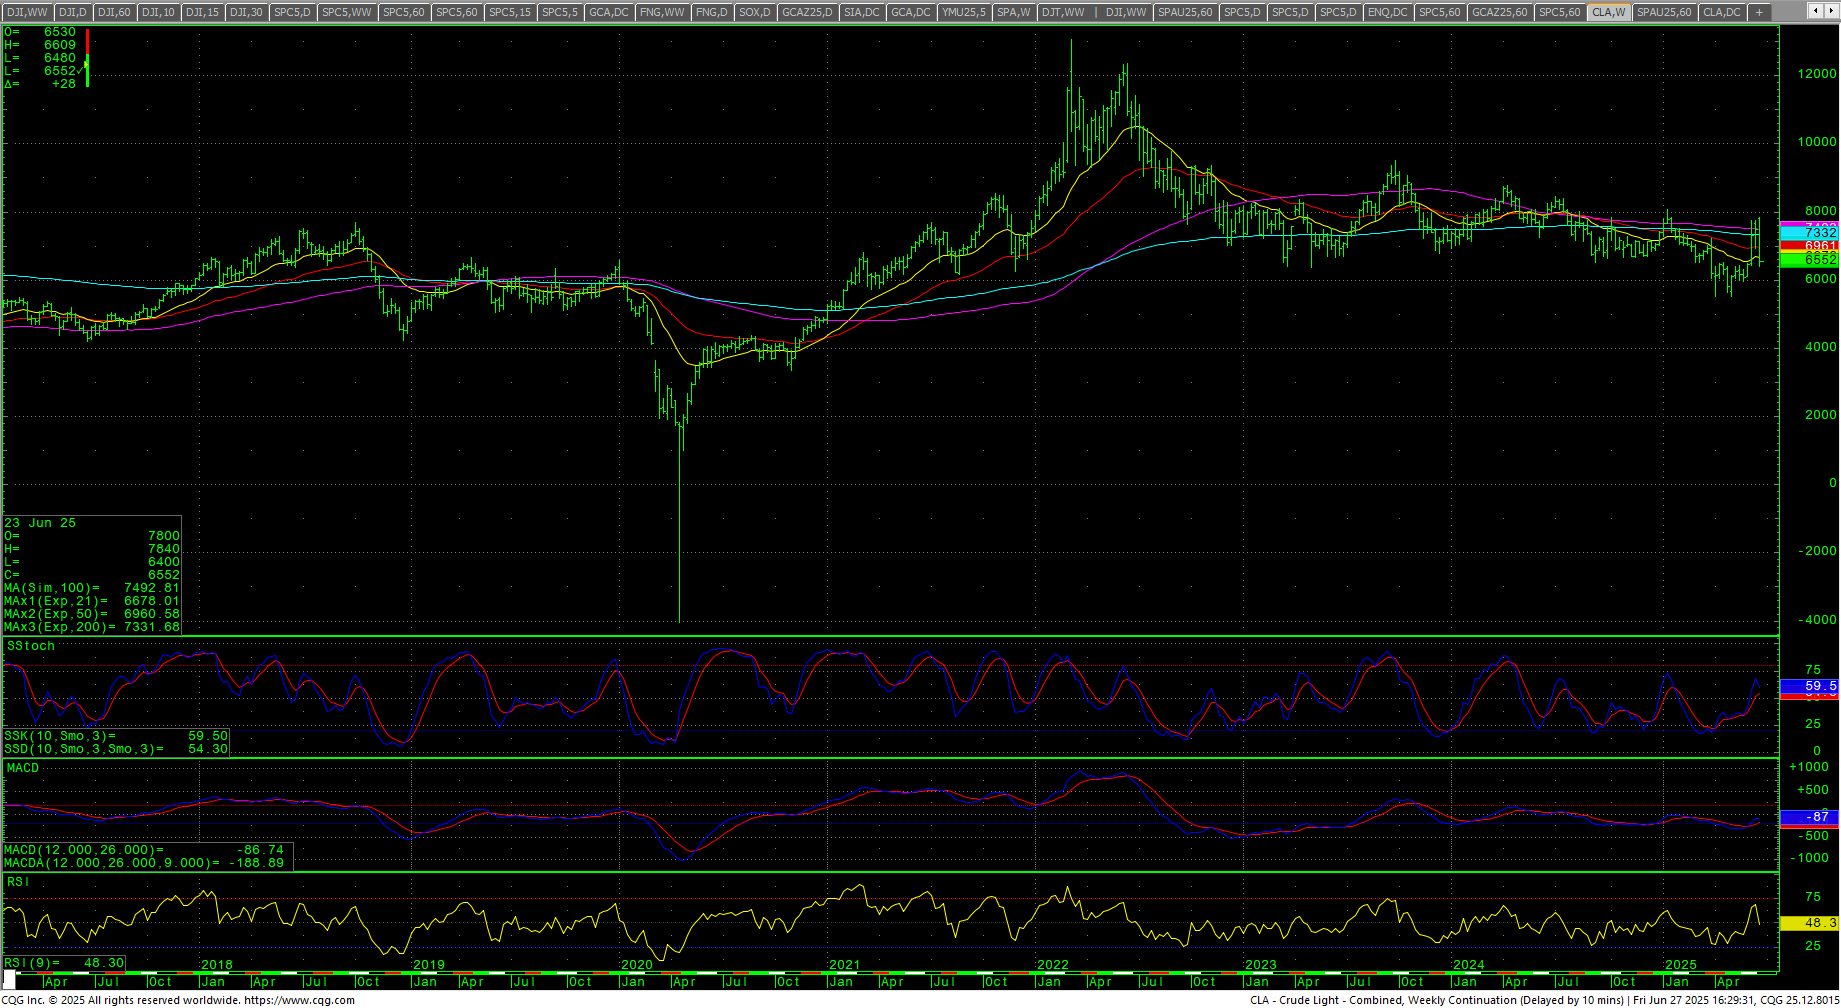
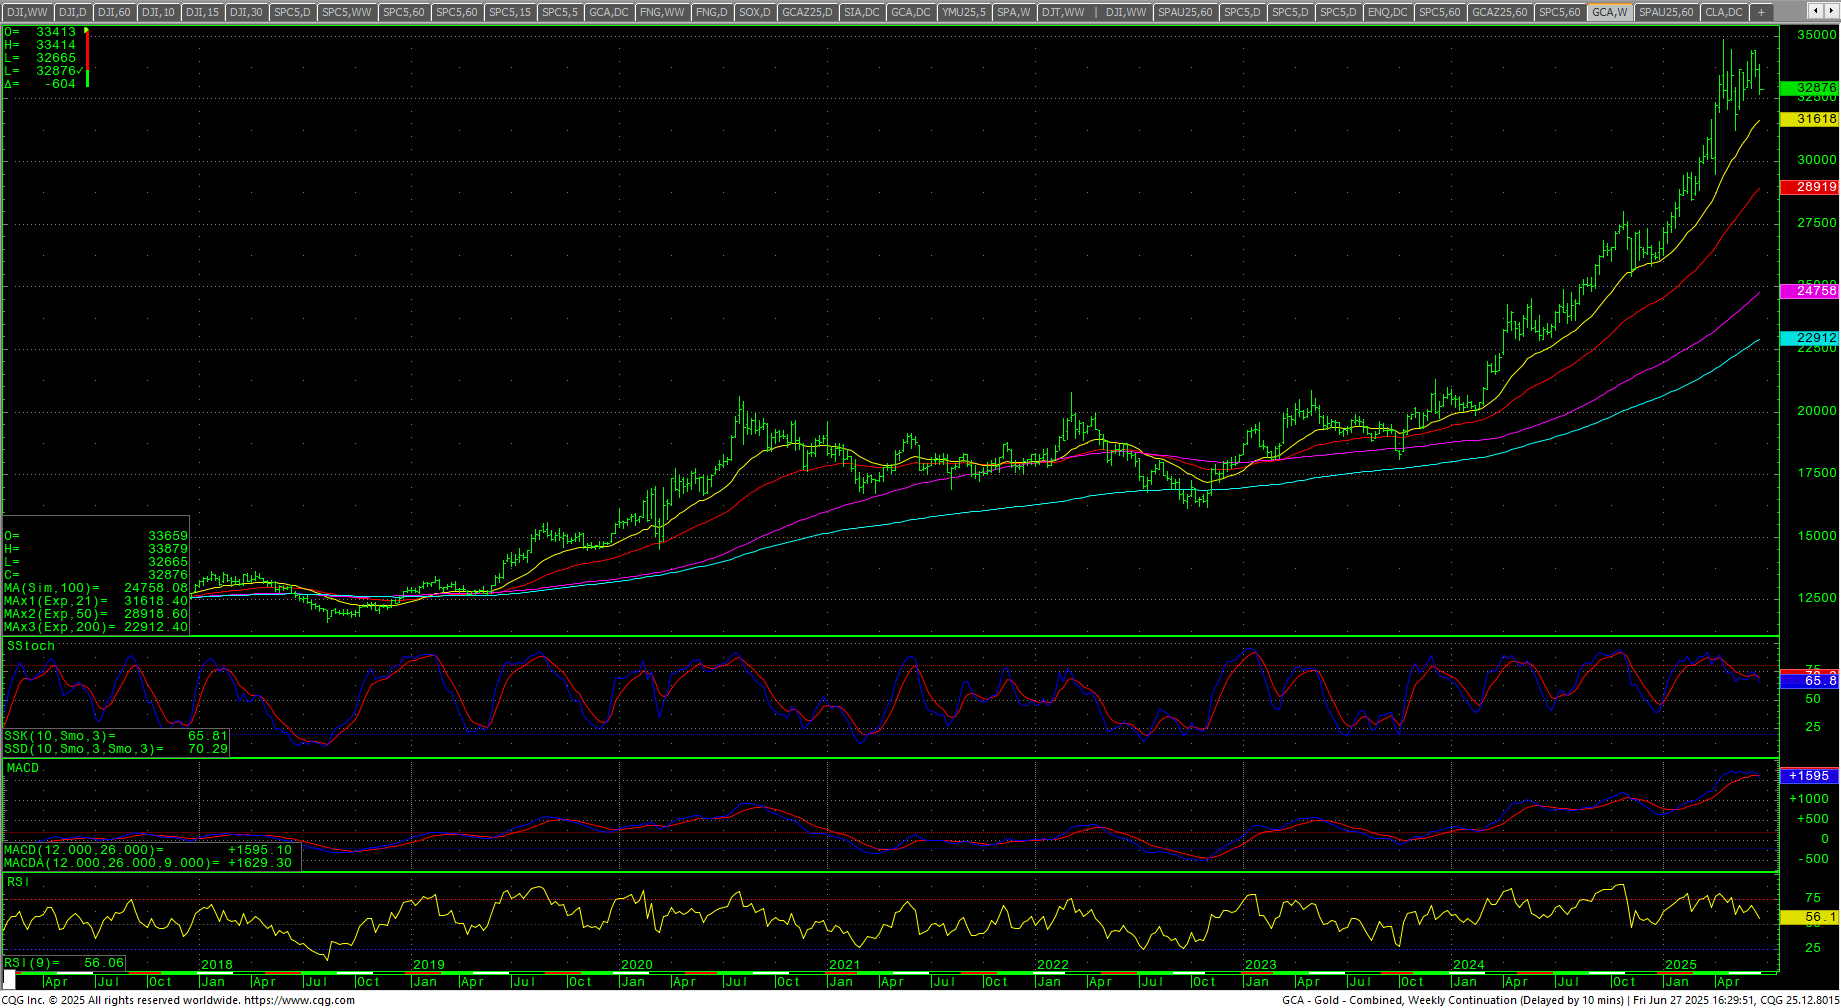
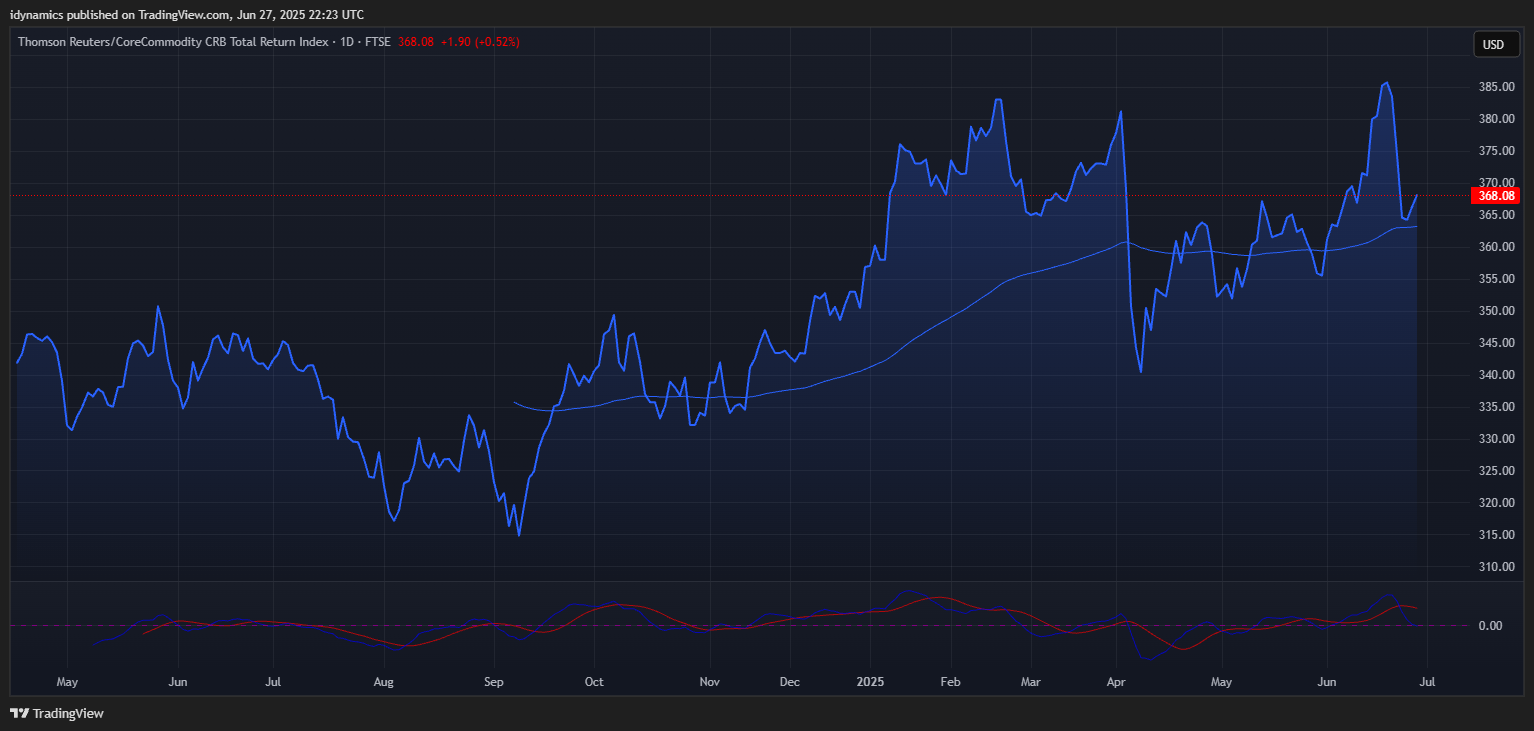 The CRB Index plunged sharply, down -5.05%. Crude oil traded a massive outside week down and is testing the June lows. Gold plunged sharply, down -2.80%, closing on the bottom of the weeks range. Platinum declined Friday after trading 14-year highs and settling the week up +5.74%. The CoT for the S&P 500 saw non-commercials flattening while dealers piled in sharply. The CFTC S&P 500 Non-Commercial Net Positions came back to -144.8K and looks like there was short covering.
Timing Points
Critical cycle falls on Thursday, just prior to the long 4th of July weekend and Payrolls data day. We are now in a period of heightened cycle activity that runs into Fall of this year and continued into Q1/Q2 of 2026. For an update on the longer-term timing outlook, please see the latest update. Tuesday is Construction Spending (est: -0.1%) and ISM Manufacturing (est: 4.86). Wednesday is ADP Employment (est: +120K). Thursday is Non-Farm Payrolls, Unemployment and Initial Jobless Claims (est: 115K, 4.3% and 240K).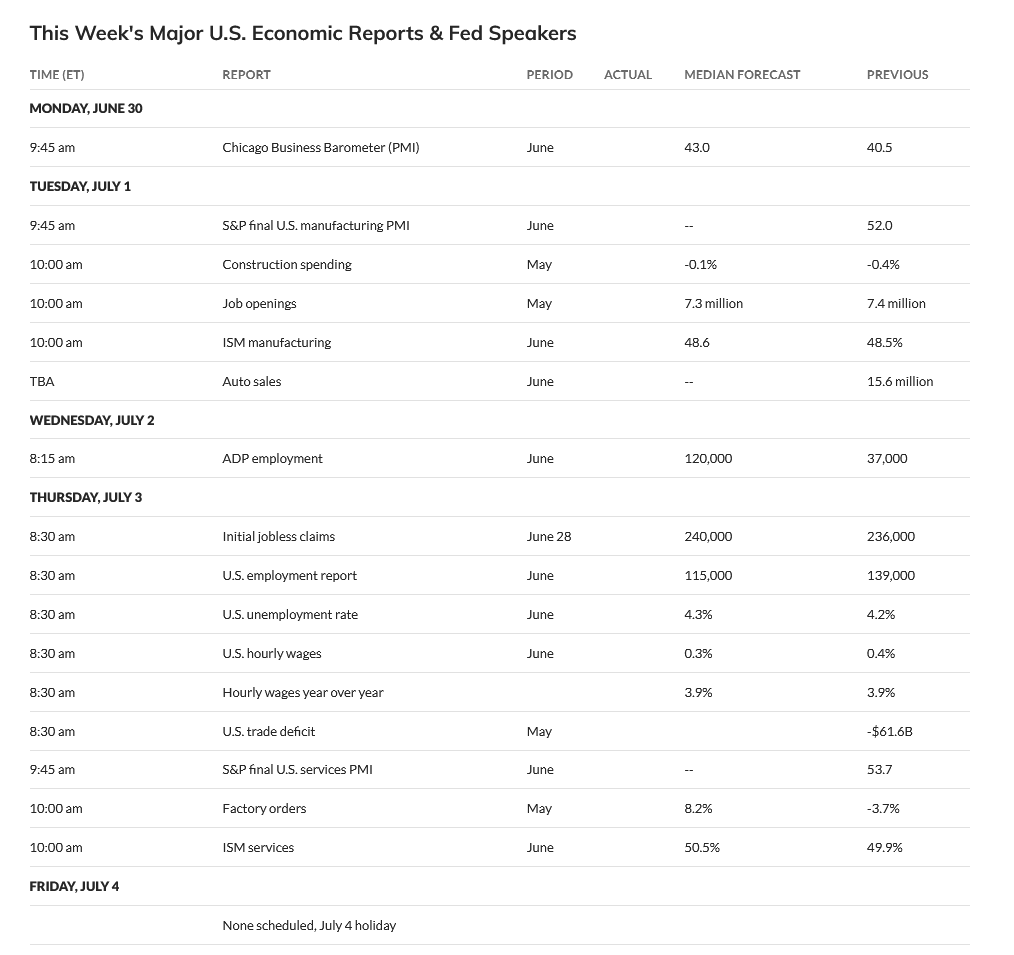
- 07/03 *** X
- 07/10 **
- 07/17 **
- 07/23-24 *** X
- 08/01 *** X
- 08/05 *** X kicks off critical week through
- 08/08 *** X through
- 08/11 *** X critical week
Dow Jones Industrial Average
Dow Jones Industrial Average Weekly H-L-C
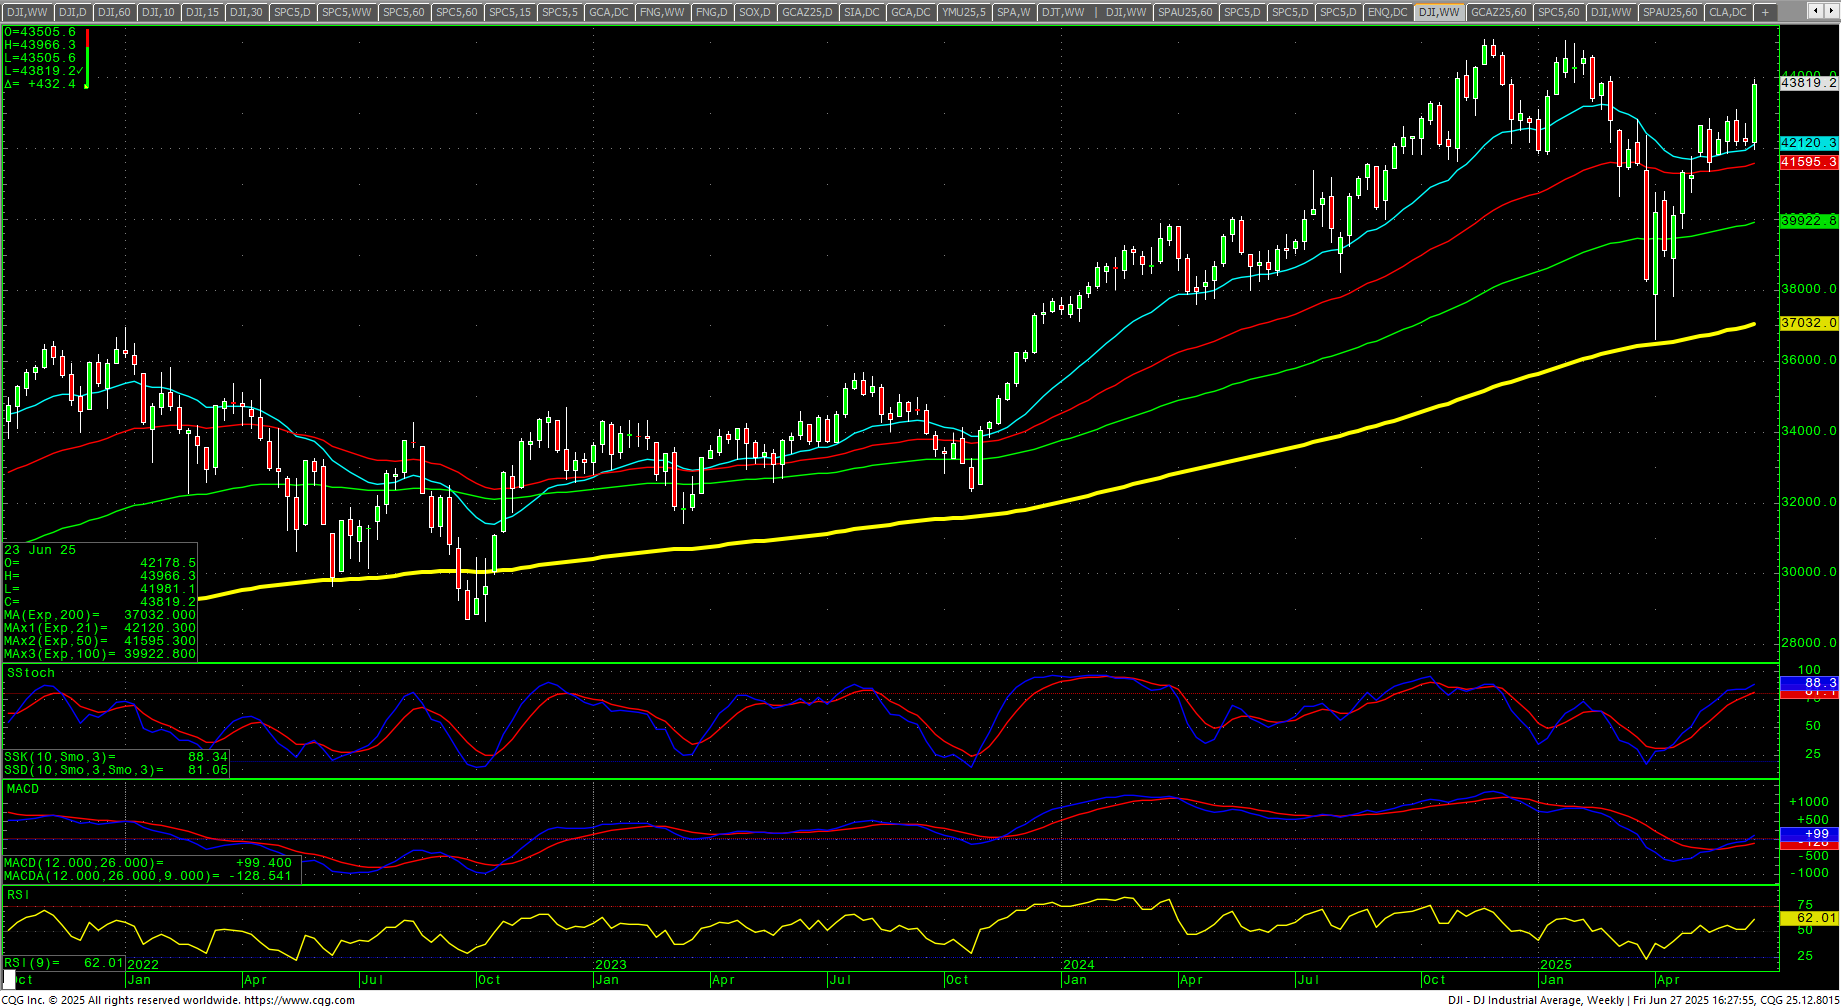
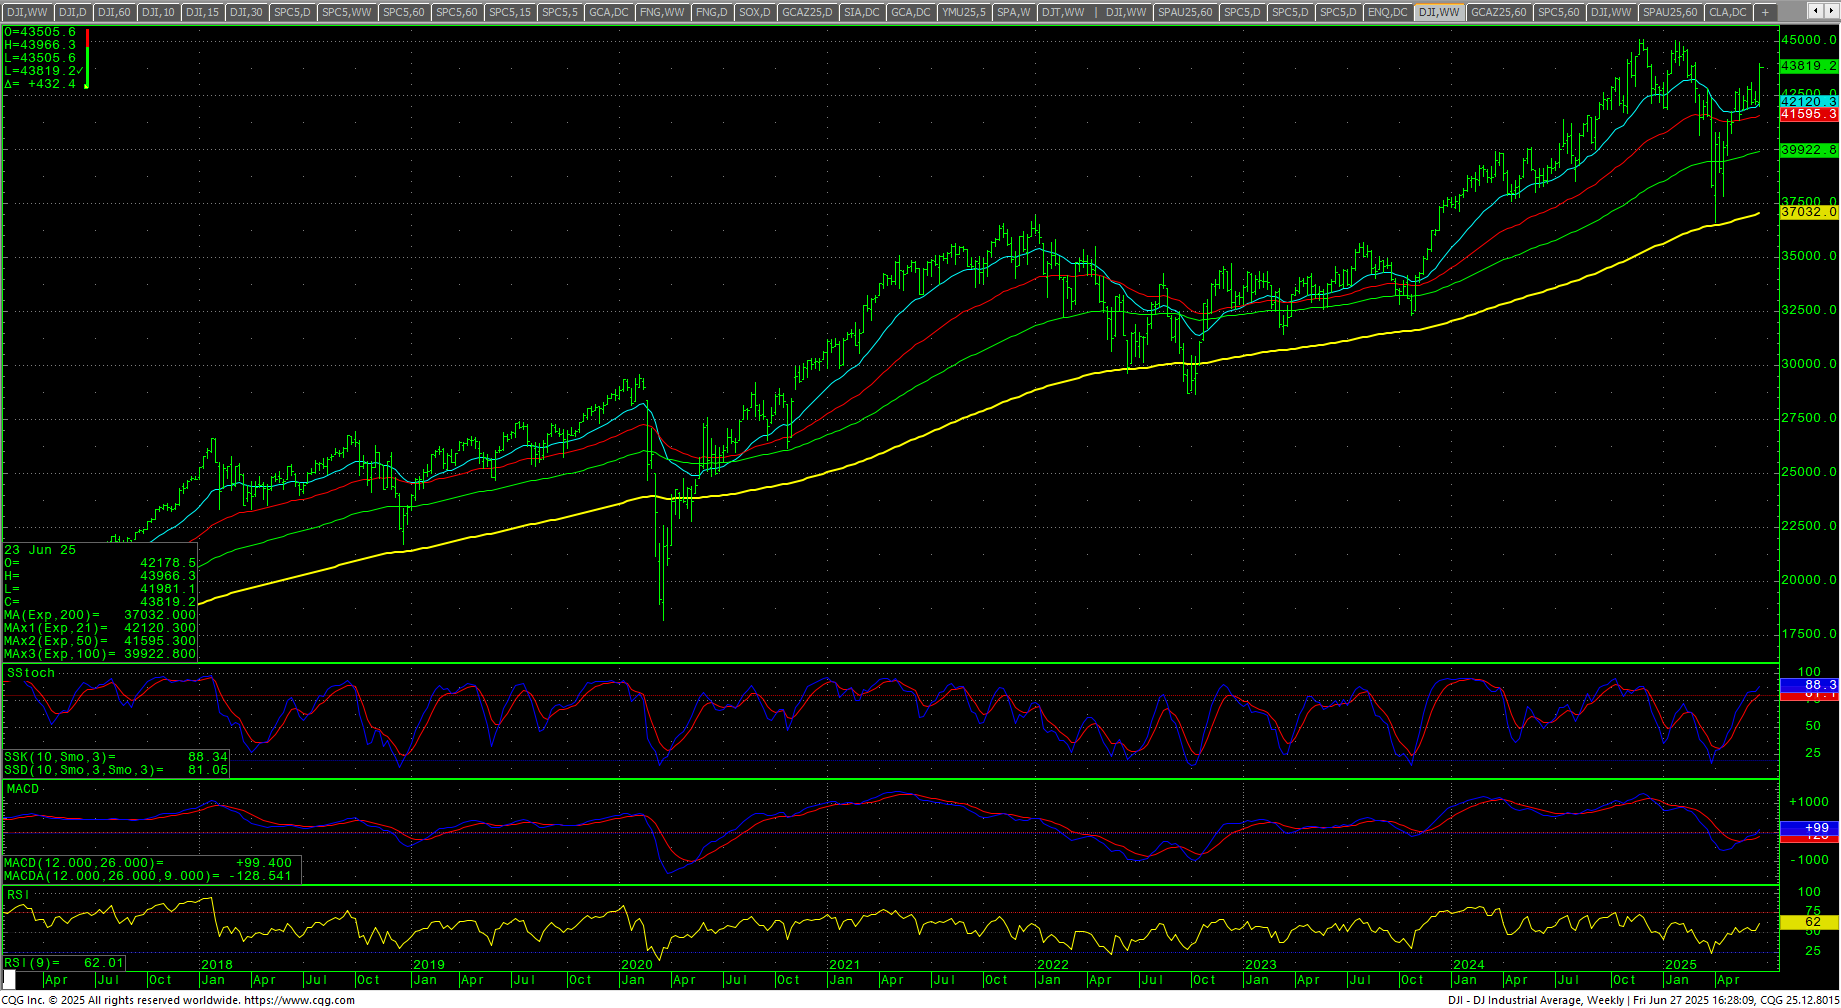 The Dow closed the week up sharply +3.82% on the top of a wide outside week up. The market cleared the critical ‘final’ “Death Zone” from record highs. The extremely high volume on Friday may signal exhaustion and/or confirming a thrust toward the record highs. The weekly stochastics are still in an uptrend but have reached overbought numbers. The daily stochastics have hooked back up and remain in a bearish divergence. The MACD is also in a bearish divergence. The RSI has moved back to an overbought reading at 73.9. The 200-day MA starts the week at 41835.70 and is trending higher.
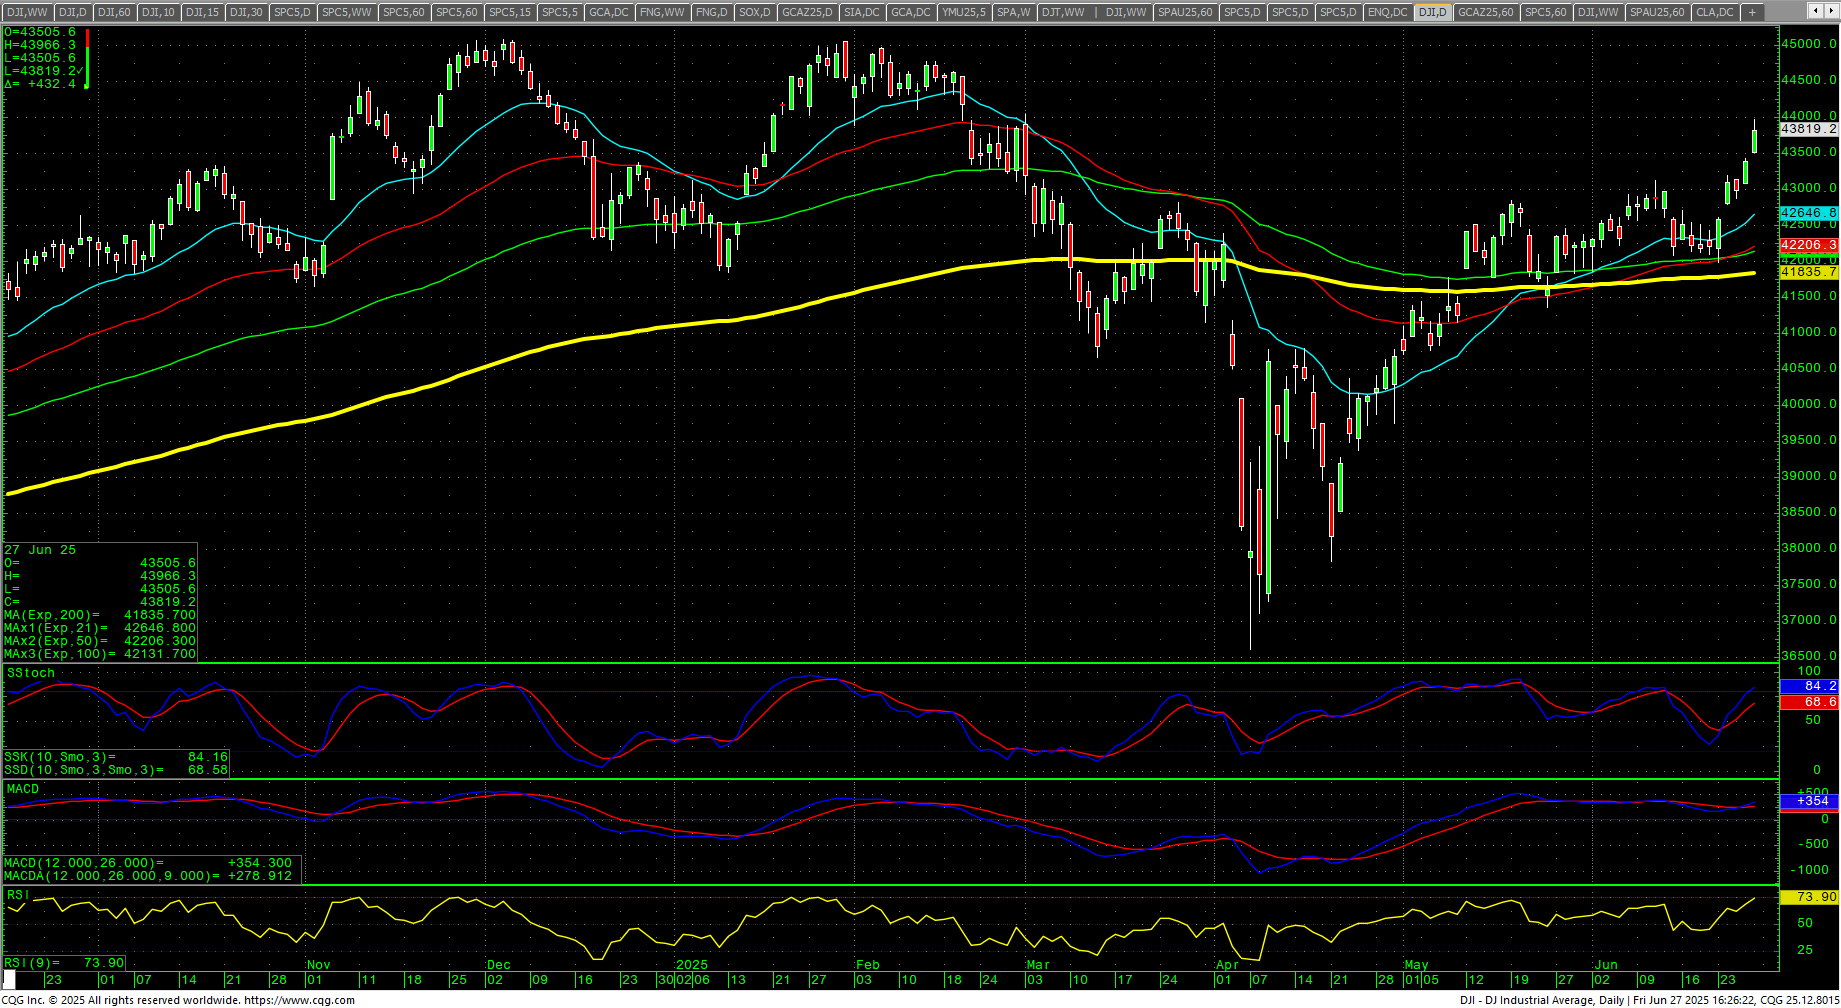
Dow Jones Industrial Average Daily Candles
Dow Jones Industrial Average Hourly H-L-C
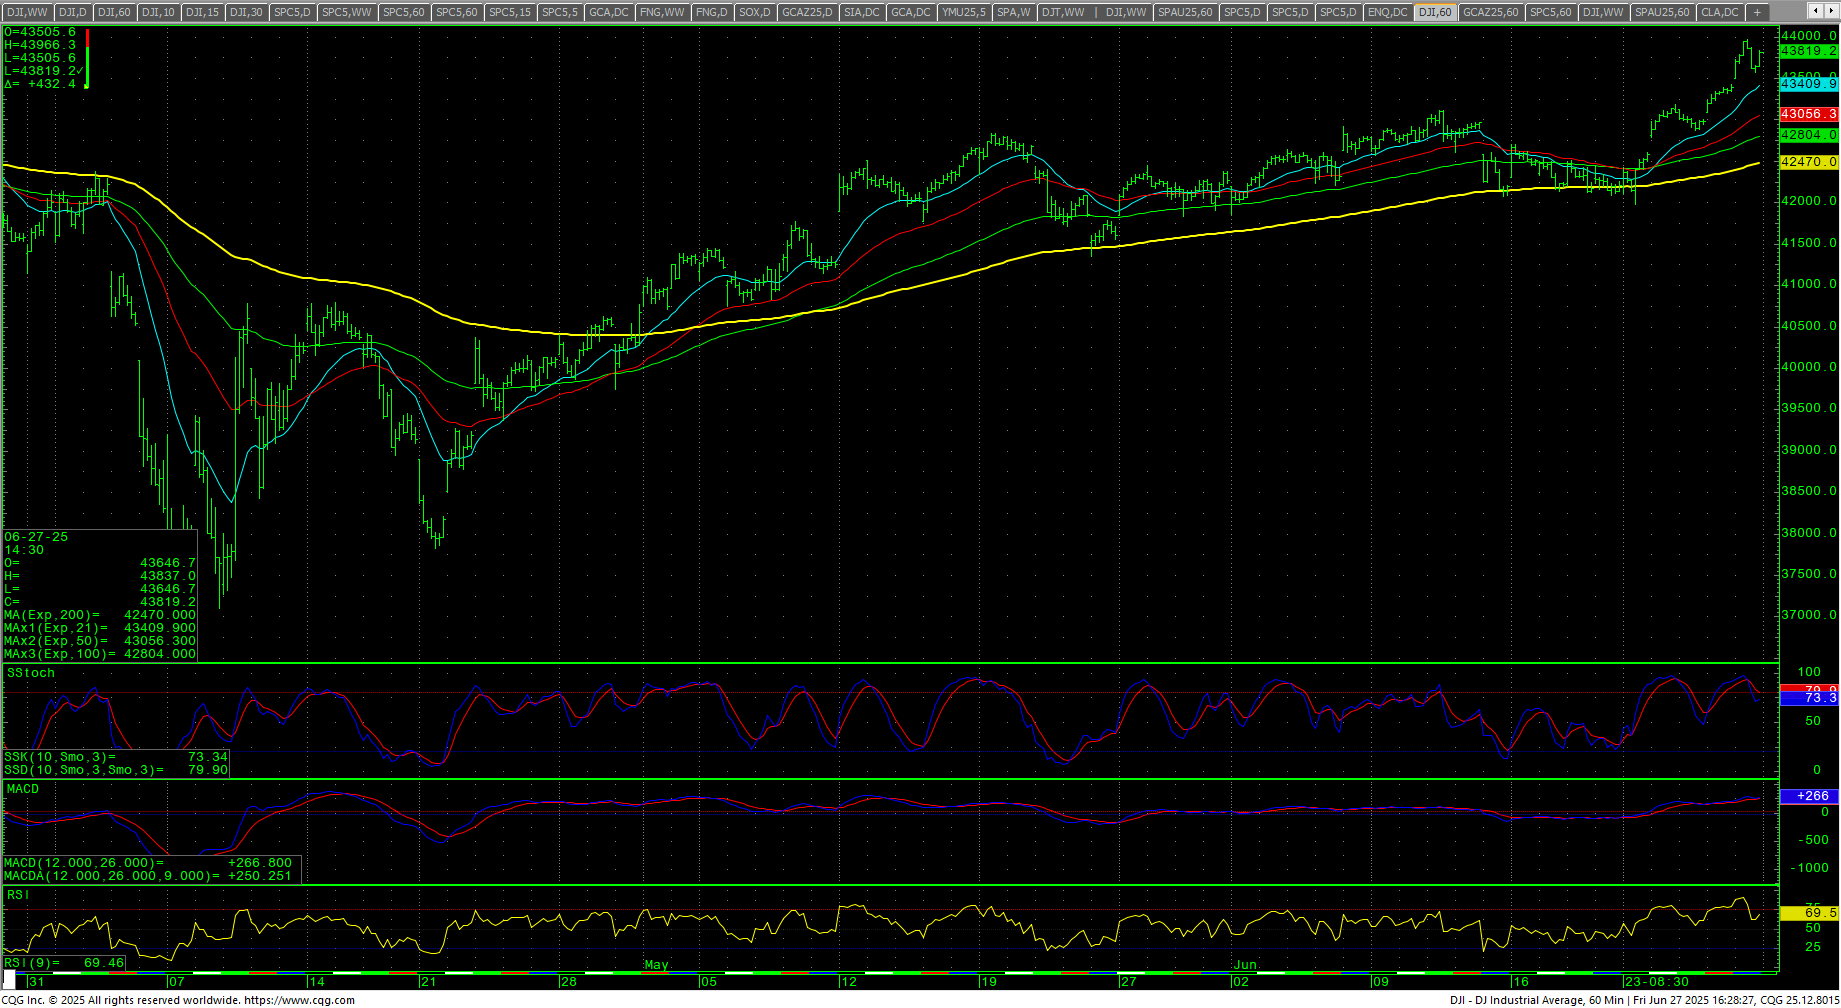 The hourly is reacting to overbought conditions on Friday’s close. A target is now open to test 44034. Closes over 44034 will open potential for a test of the all-time highs at 45050/45054/45074. Closes over 45074 opens counts toward 45244 and 45426 (Fibonacci target). Rallies with closes over 45426 will reopen longer-term monthly targets in the 47400 level with targets of 46568 and 46954.
Support is 43505/43497, 43352 and 43208/43205. A breakdown under 43207 counts to 42973 with counts to near-term pivotal support at 42739/42735. Closes under 42735 should test 42230 and 41981. Closes under 41981 should minimally test 41156. A breakdown under the 41156 area will set up 40877 with counts to key support at 40289. Closes below 40289 count to critical short-term support at 39421/39415. Closes under 38415 are -term bearish for test of 38450/38347. Closes below 38347 should minimally test 37828 and would open counts to retest the 36611 low with support at 37103.
| Resistance | Support |
|
|
S&P 500 Cash Index: SPX
S&P 500 Index Weekly H-L-C
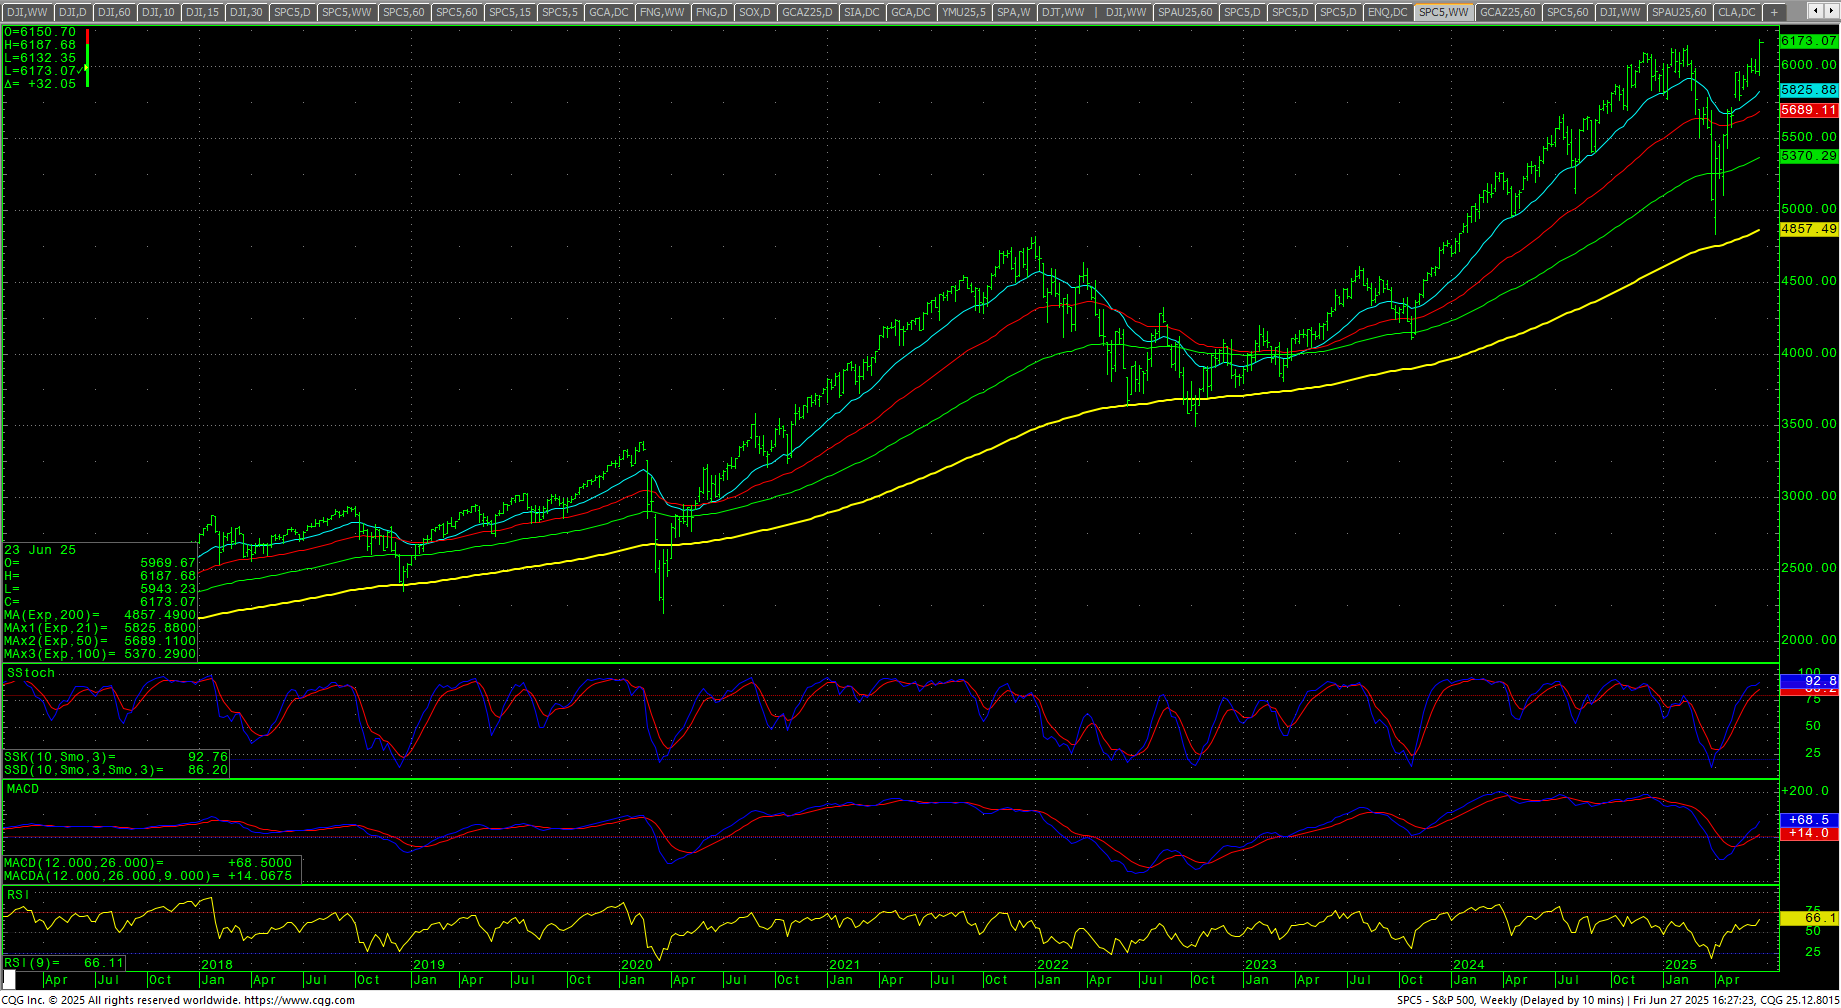 The S&P traded the low on Monday and then gapped higher Tuesday to carry the index into record high territory. The daily is up again with multiple bearish divergences. The RSI and the MACD are in bearish divergences. The weekly is still in an uptrend and has reached overbought conditions. The hourly is overbought on Friday’s close. The 200-day MA is 5733.53 and is trending higher as it sets a new record high.
SPY Daily Candles
 Prices ran into a key band of resistance at 6180.35/6181 through 6188. Further rallies open counts to 6224 and 6296. Above 6296 can carry to 6368 with counts into the 6440 area. Closes over 6440 will open counts to 6584. A breakout over 6584 sets up 6638 and 6692.
S&P 500 Index Hourly H-L-C
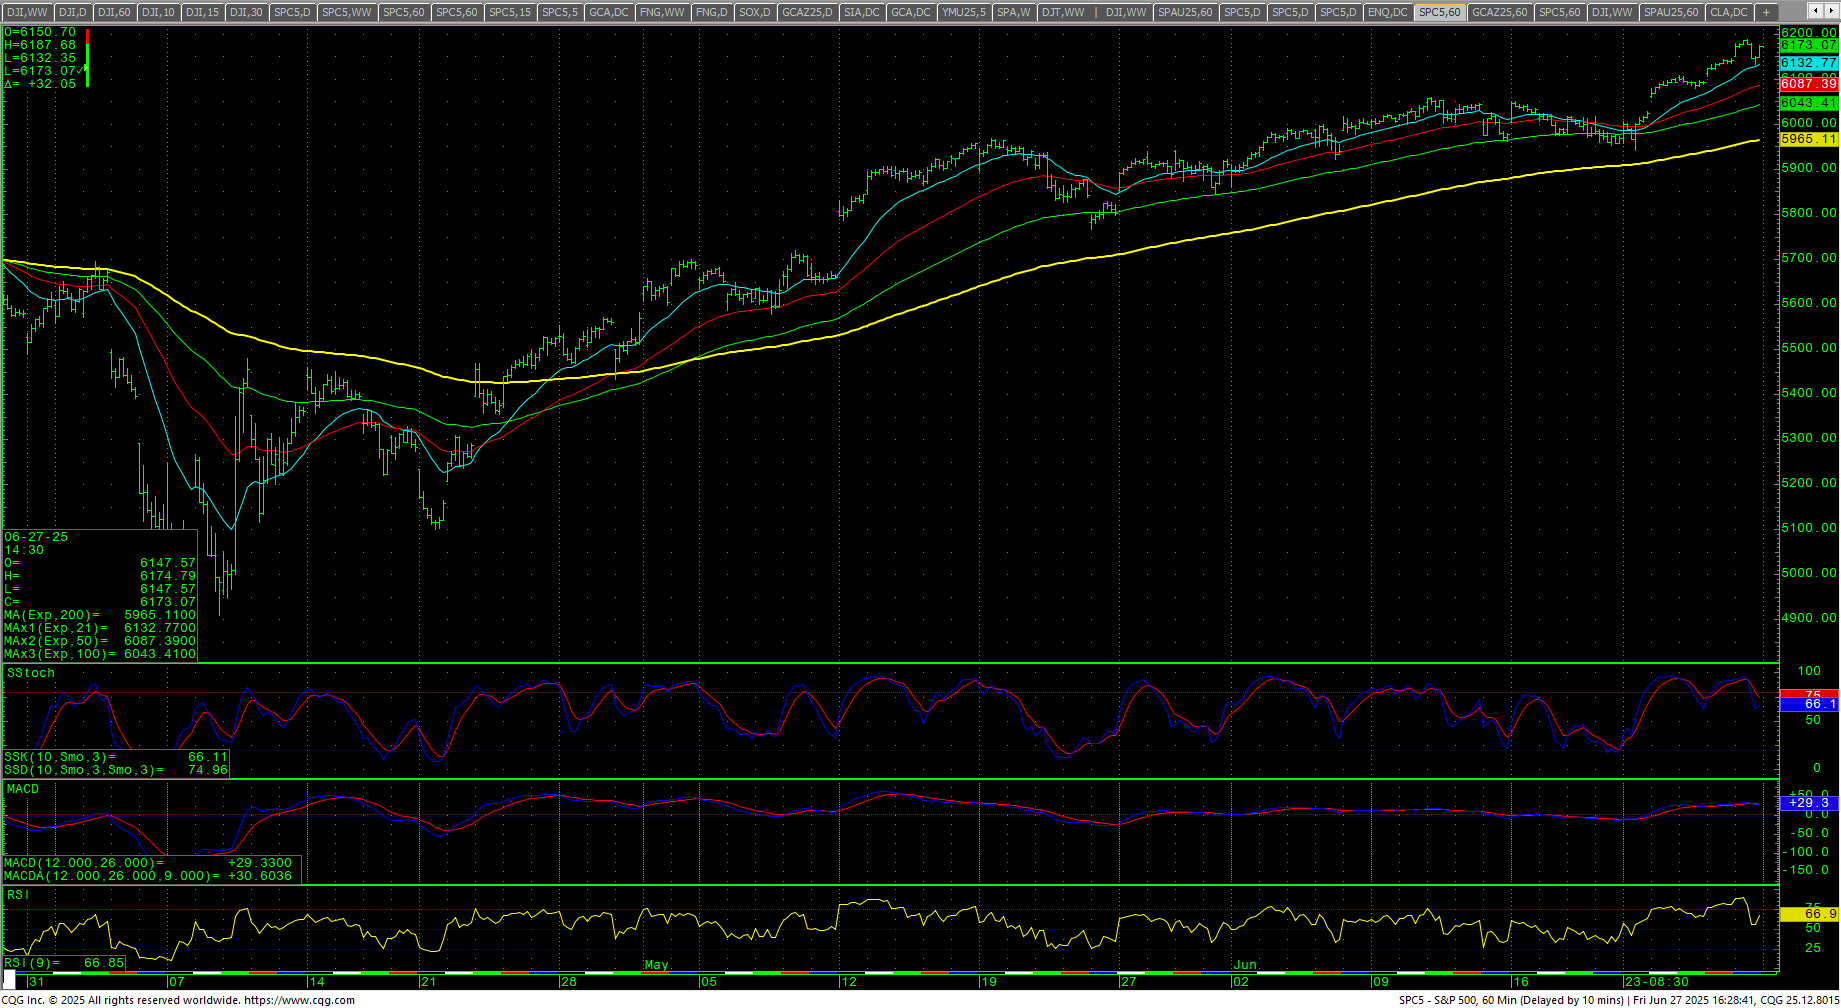 Support is 6065 and 5991/5990. A move under 5990 sets up 5929 with counts to 5929/5926. Closes under 5926 should test 5870 with potential to 5829 and 5771/5768 with pivotal short-term support against the 5673/5670 area. A breakdown under 5670 sets up 5552 and 5511 with counts to critical short-term support at 5356/5348. Daily closes under 5348 are bearish for a move to 5157. Closes under 5157 will open counts to 4885 and 4839 and full counts to 4521/4515. Closes under 4515 can see 4165/4127.
| Resistance | Support |
|
|
Charts courtesy of CQG, Inc., CNN, Koyfin, Trading View and AAII