
TECHNICAL ANALYSIS (by Intraday Dynamics)
Major Indices Week of July 4, 2025
 NYSE Volume

 NYSE FANG Weekly Candles
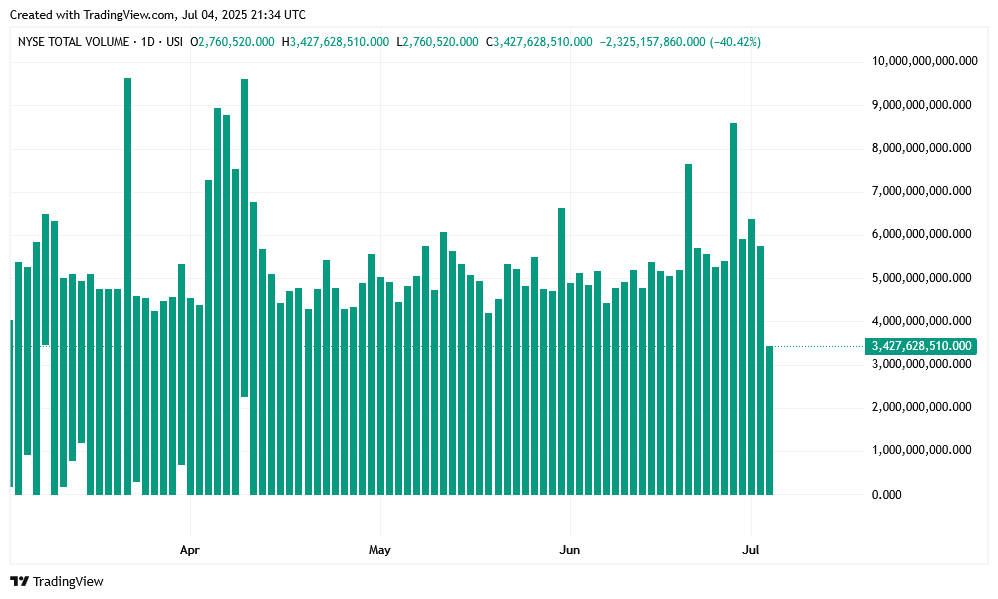
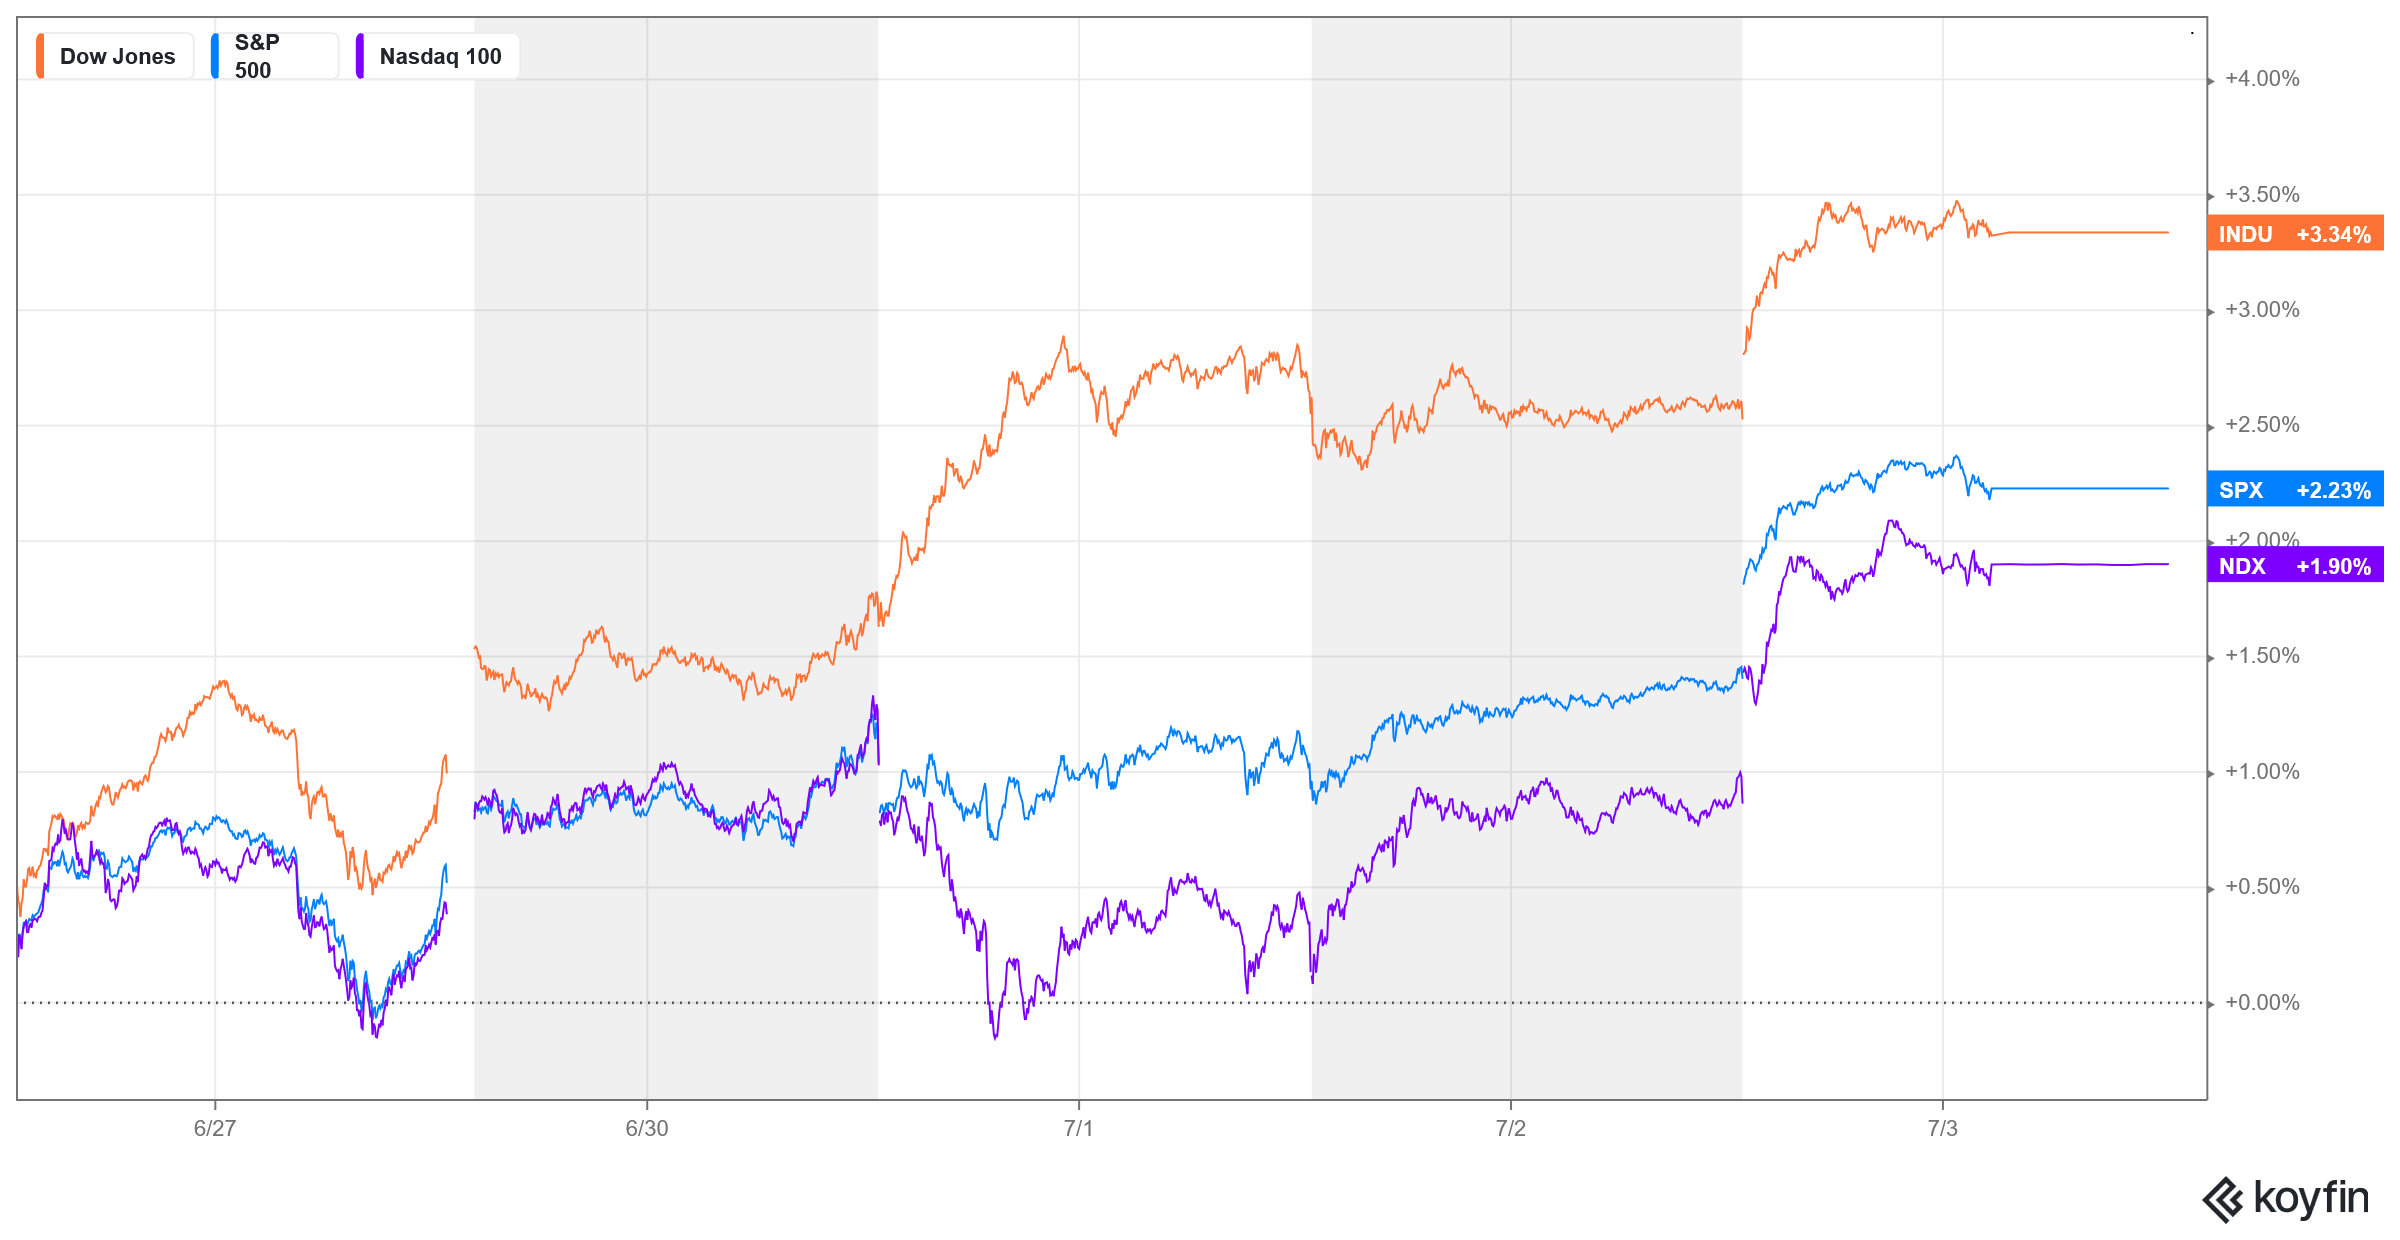
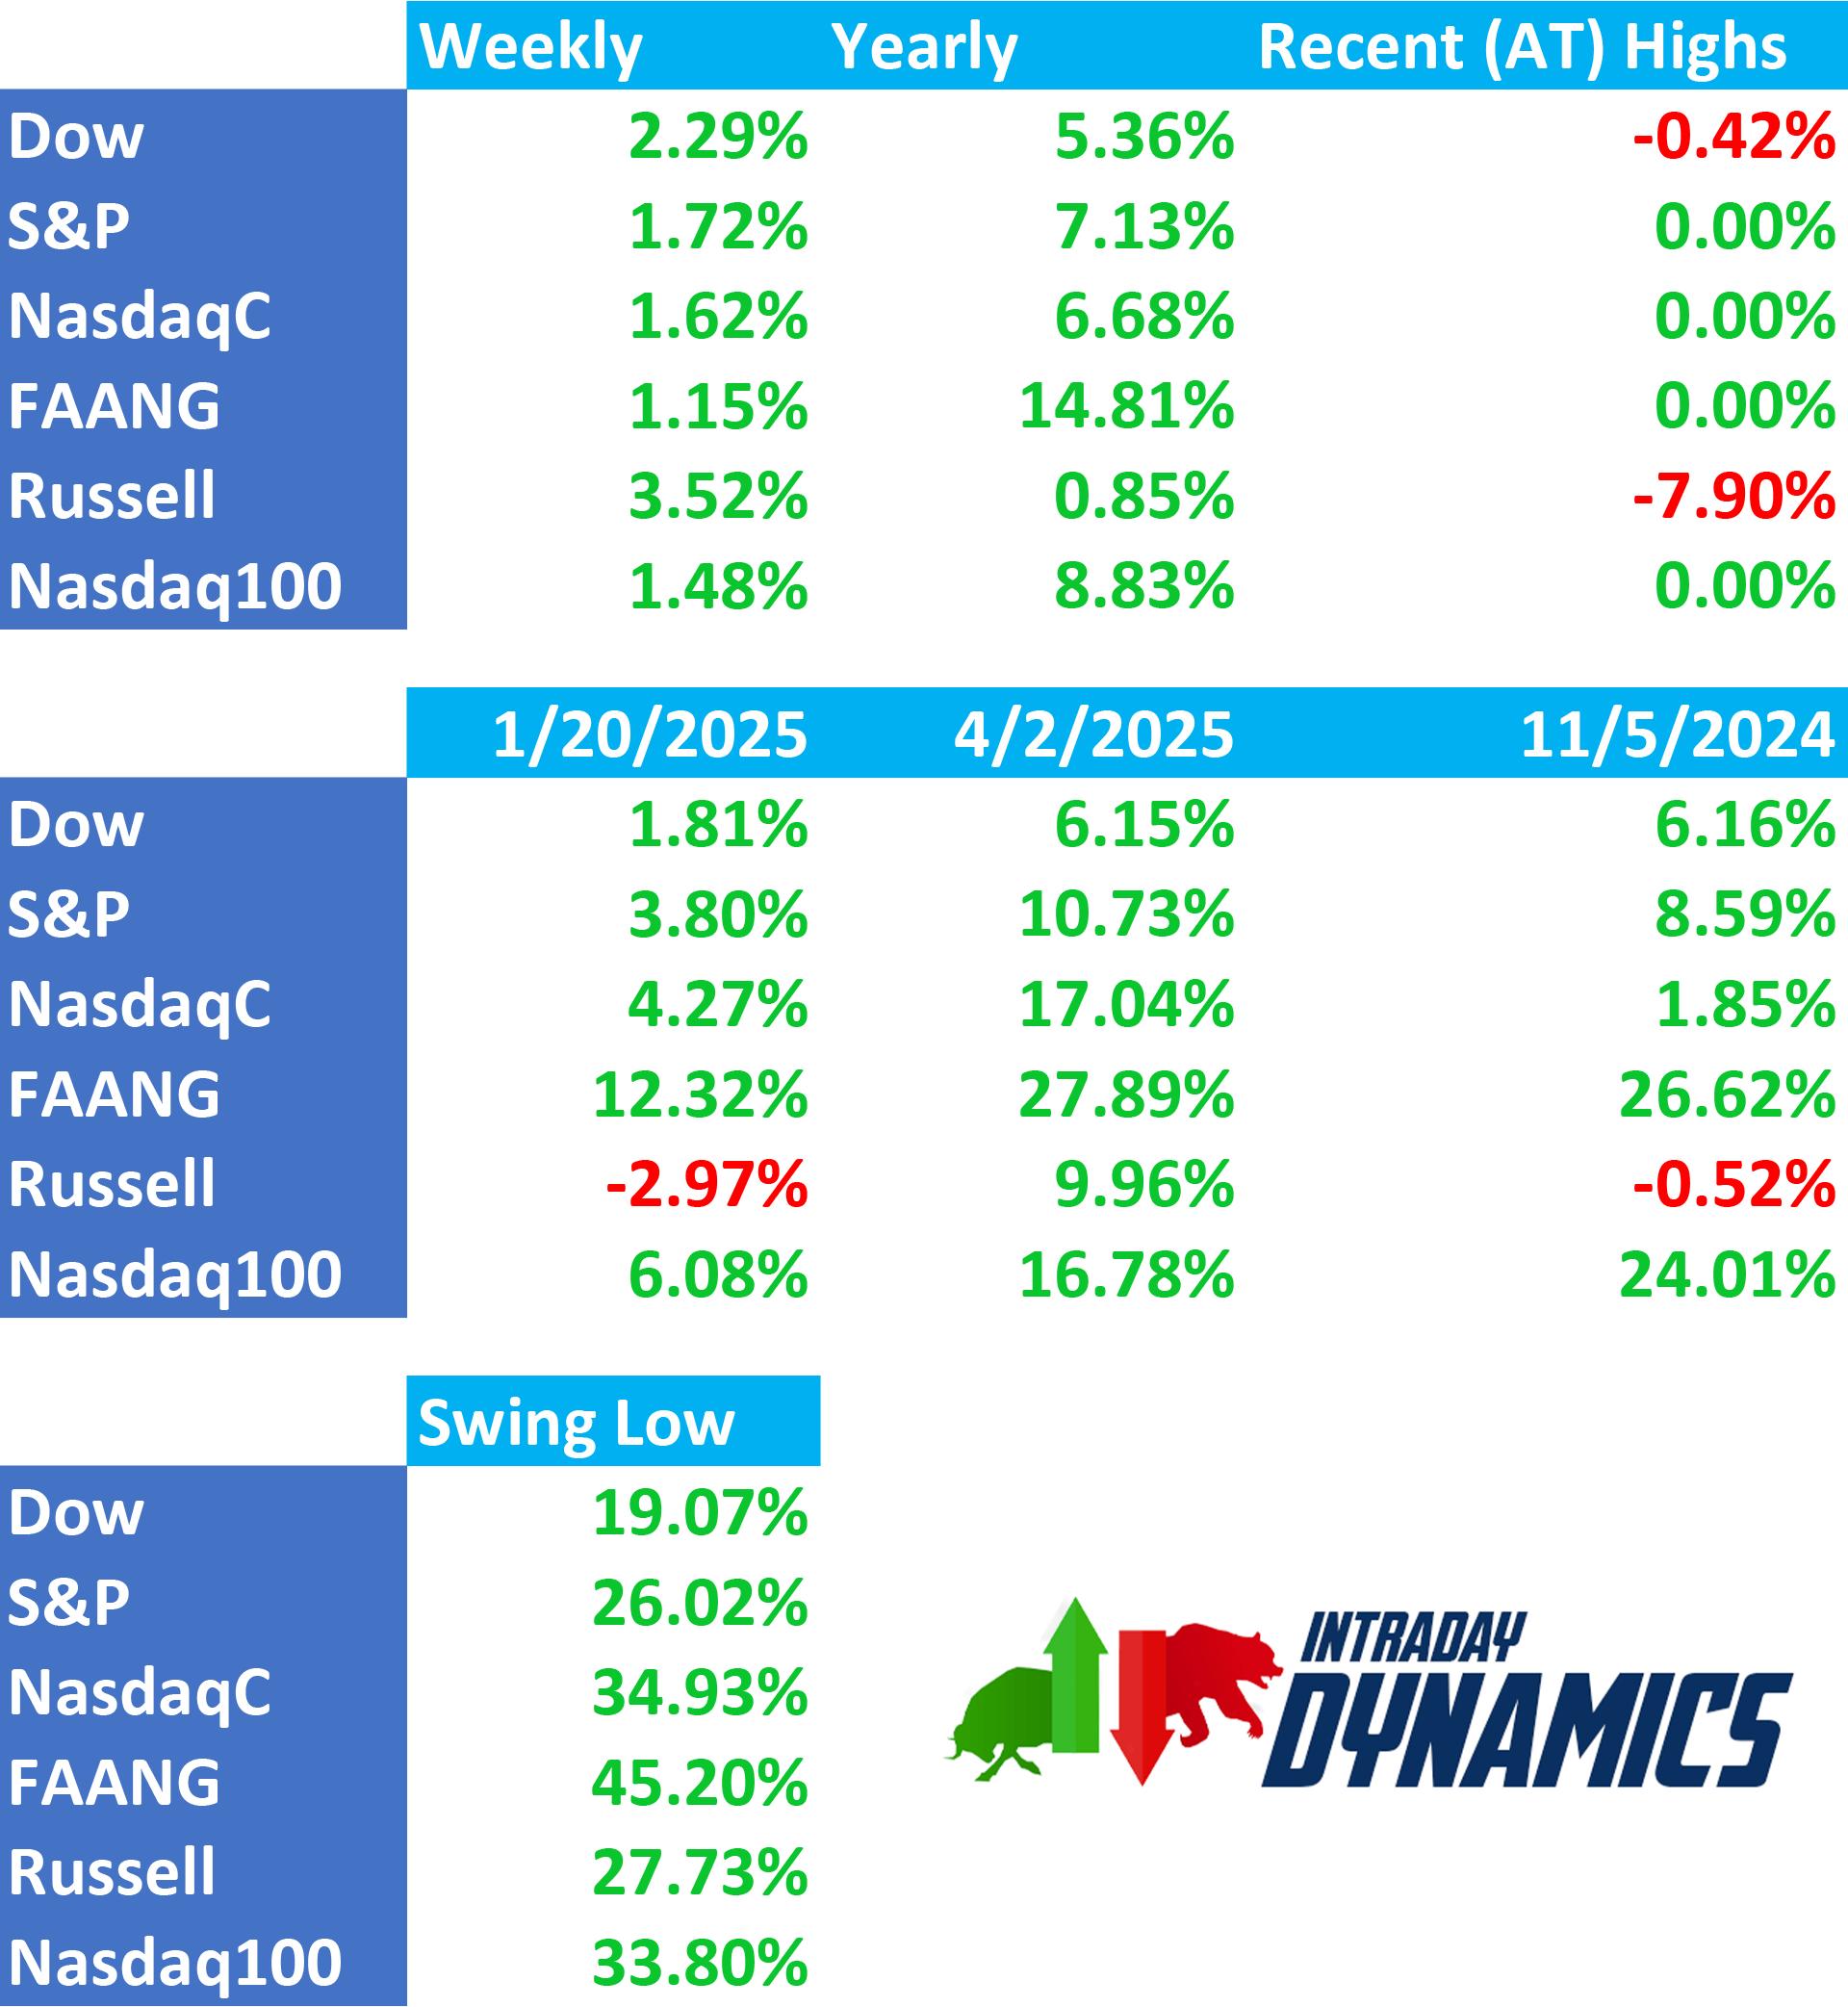
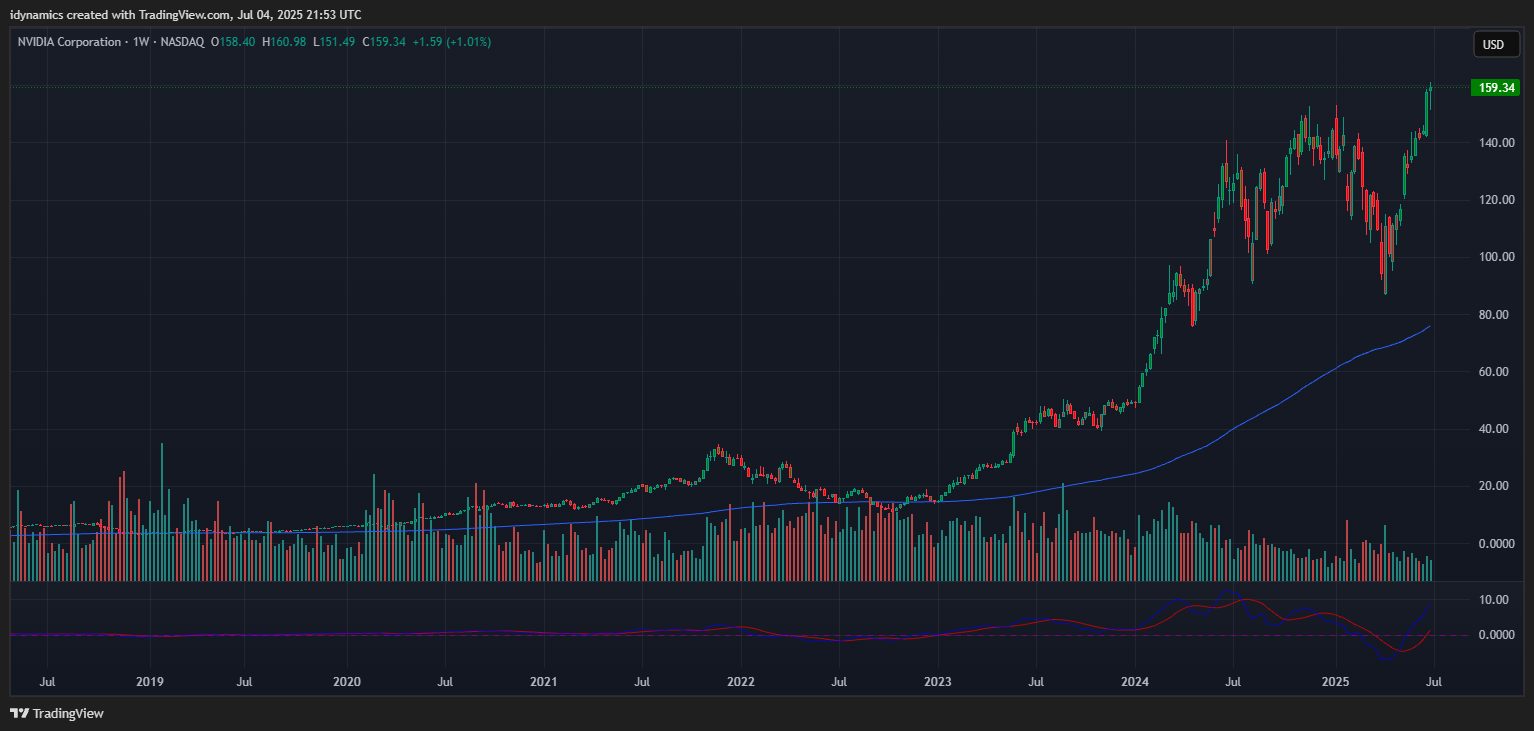
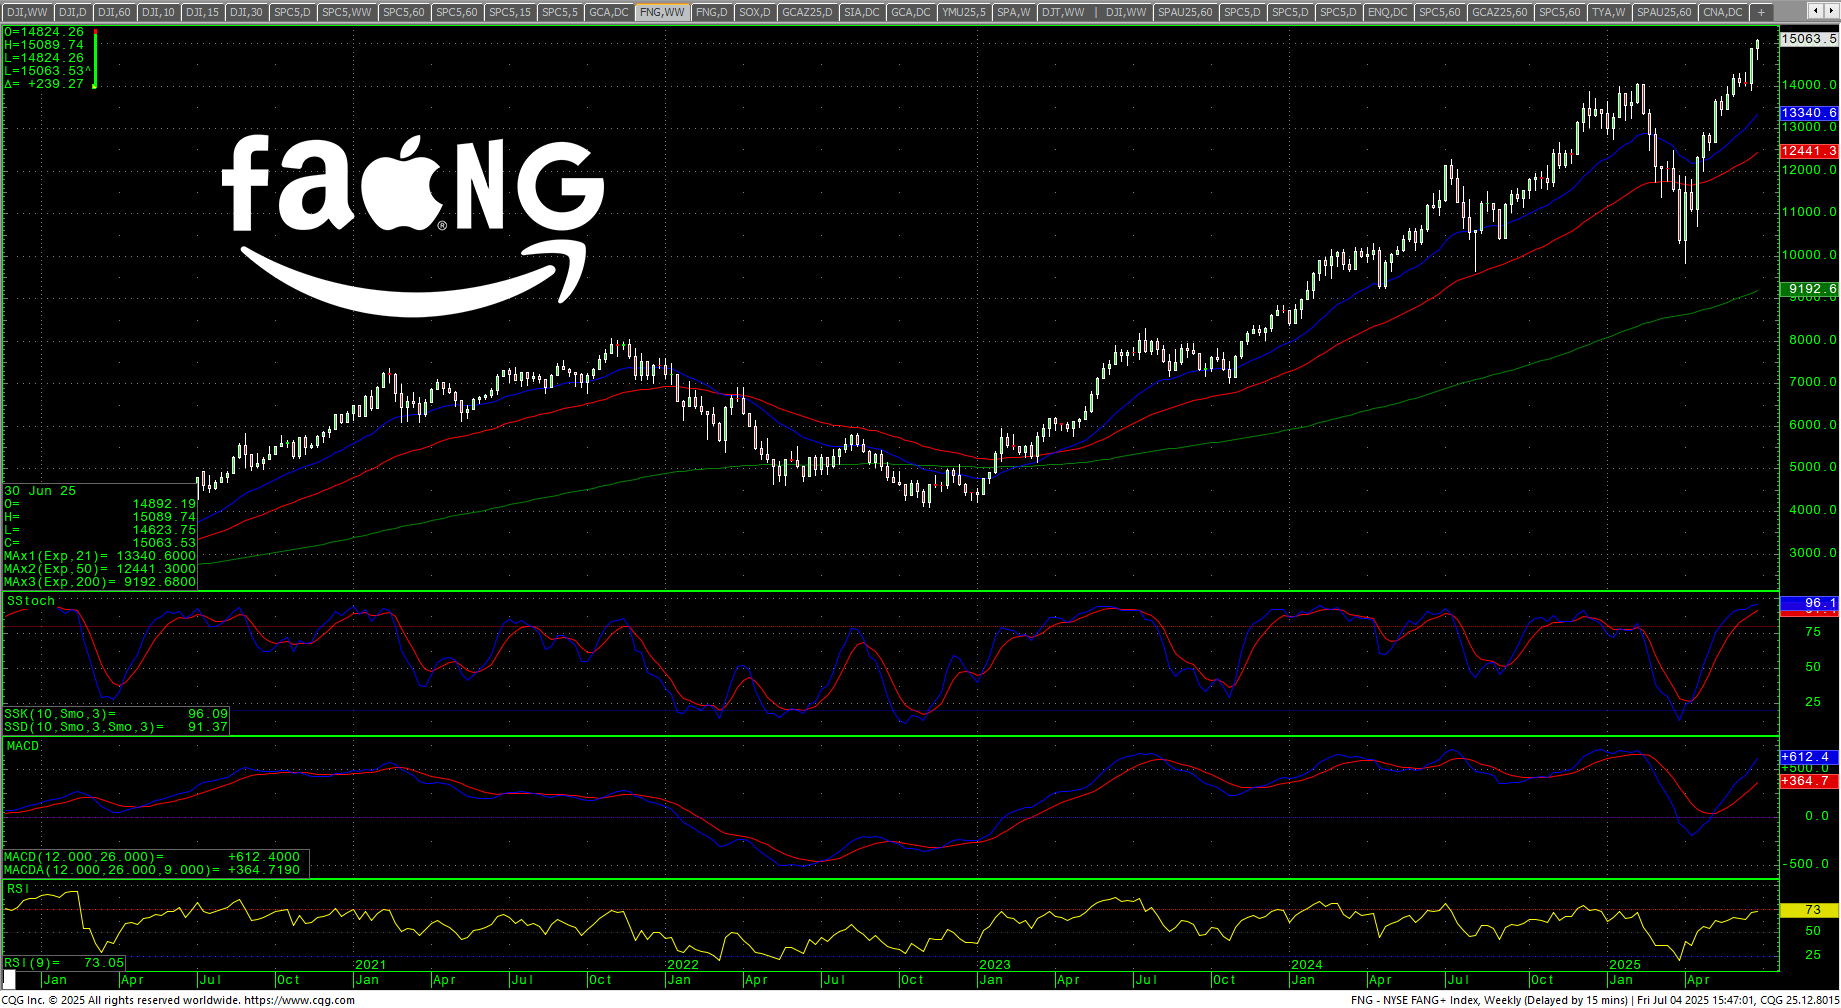
 Stocks traded a lower volume holiday week as the beat goes on with record highs for technology stocks and the SPX, the Dow and even the RSP now near its record high. Last week, I talked about how July is historically a bullish month (94% win rate) and the hedge funds continue to buy on FOMO as the “dumb money” has outsmarted the professionals for two months straight. As long as tech stocks are leading the way, this market is bullish. NVDA and the FANG moved to ATH again last week and the RSP closed only a few ticks off the ATH close set 29 November 2024. The FANG is up 45.20% from the April swing low! Another sector to jump on this vertical are stocks in private prison companies as it appears the USA is about to do a major infrastructure investment in detention centers.
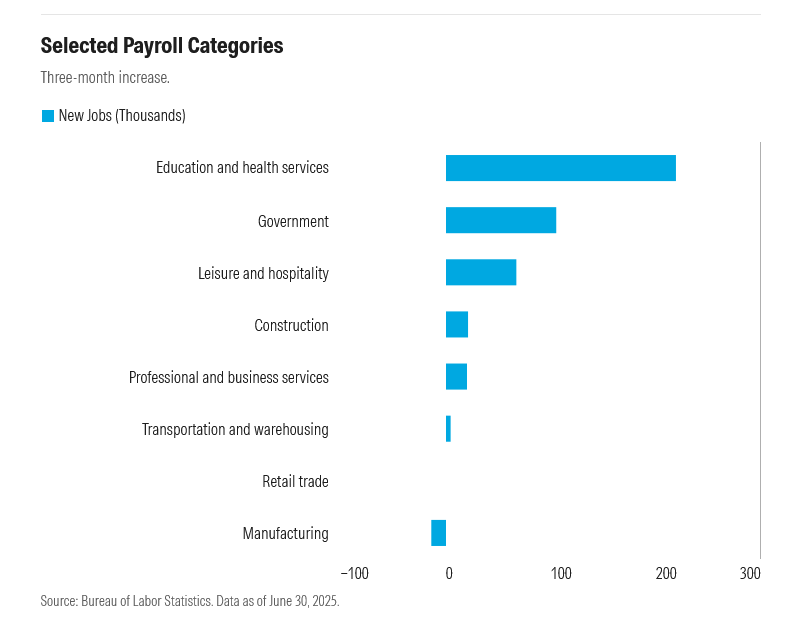
The market got good news on the Non-Farm Payrolls data…but just like May, when you dig into the data it looks weak for private sector jobs. The bulk of the jobs came in State and Local government jobs and healthcare and education while jobs were shed again in manufacturing and the general private sector. The Unemployment Rate moved to 4.1%. This came on the heels of the ADP Report which showed losses of -33K jobs. ADP seems to be far more in line with the Household Surveys, which show as much as -800K jobs lost over the past 12 months.
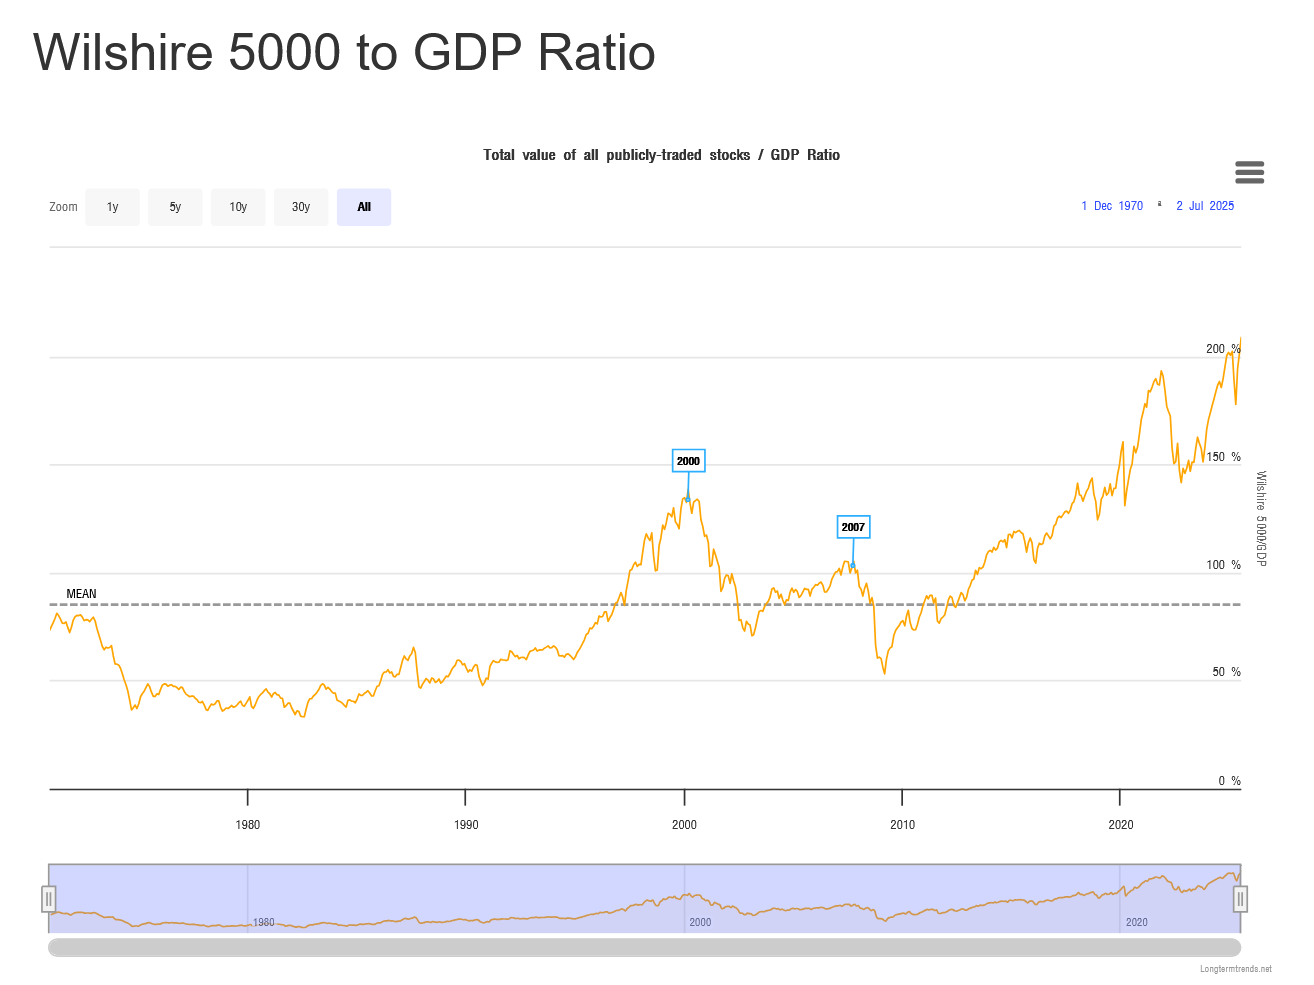
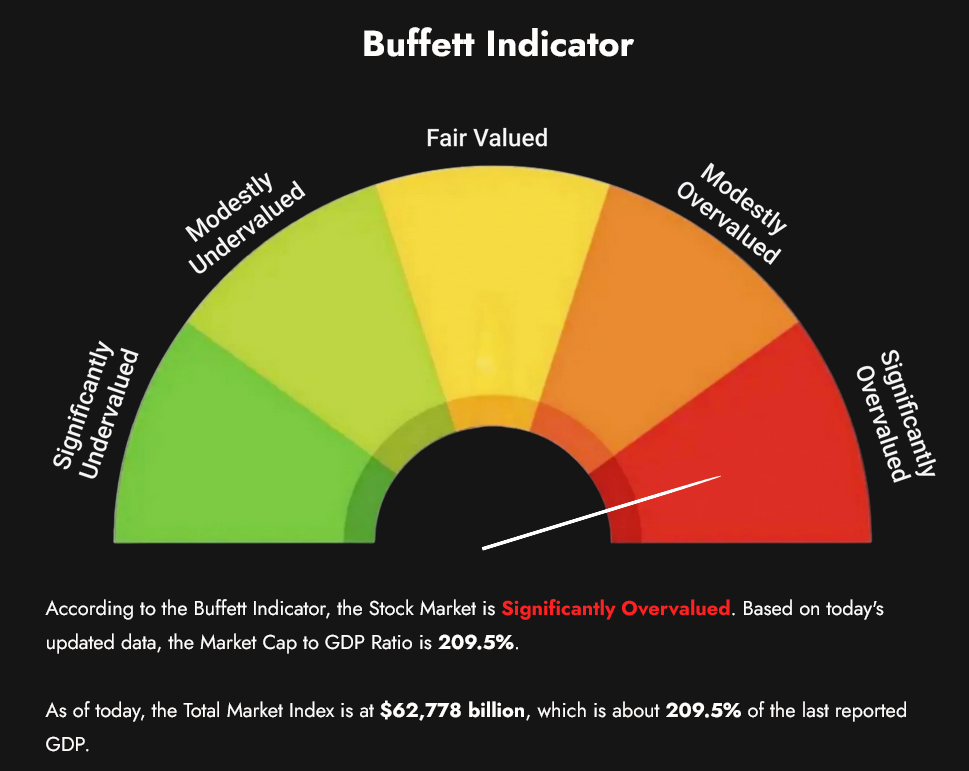
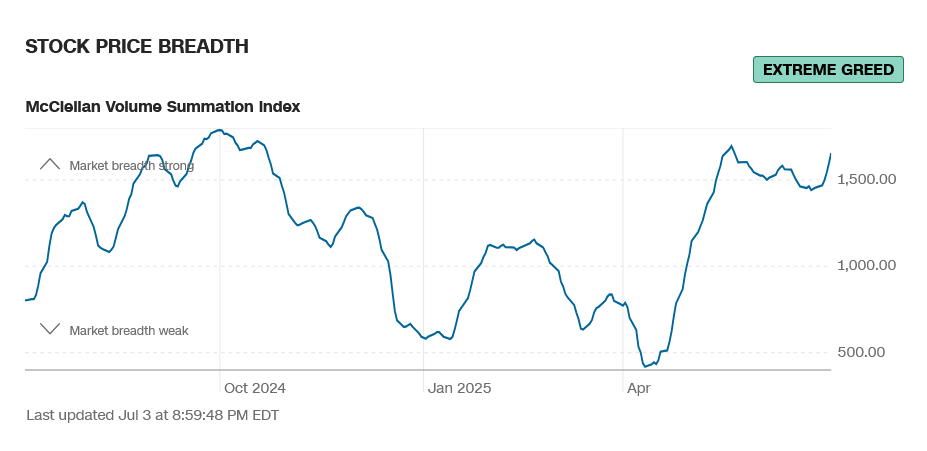
The market action has now taken sentiment into primarily extreme greed readings. The Buffet Indicator has moved to an all-time record at +209.5%. While there is extreme greed and multiple bearish divergences on the charts and the VIX is showing extreme complacency, this does not mean that the uber rally needs to be trimmed. The market can run hot regardless of the massive froth that has formed.
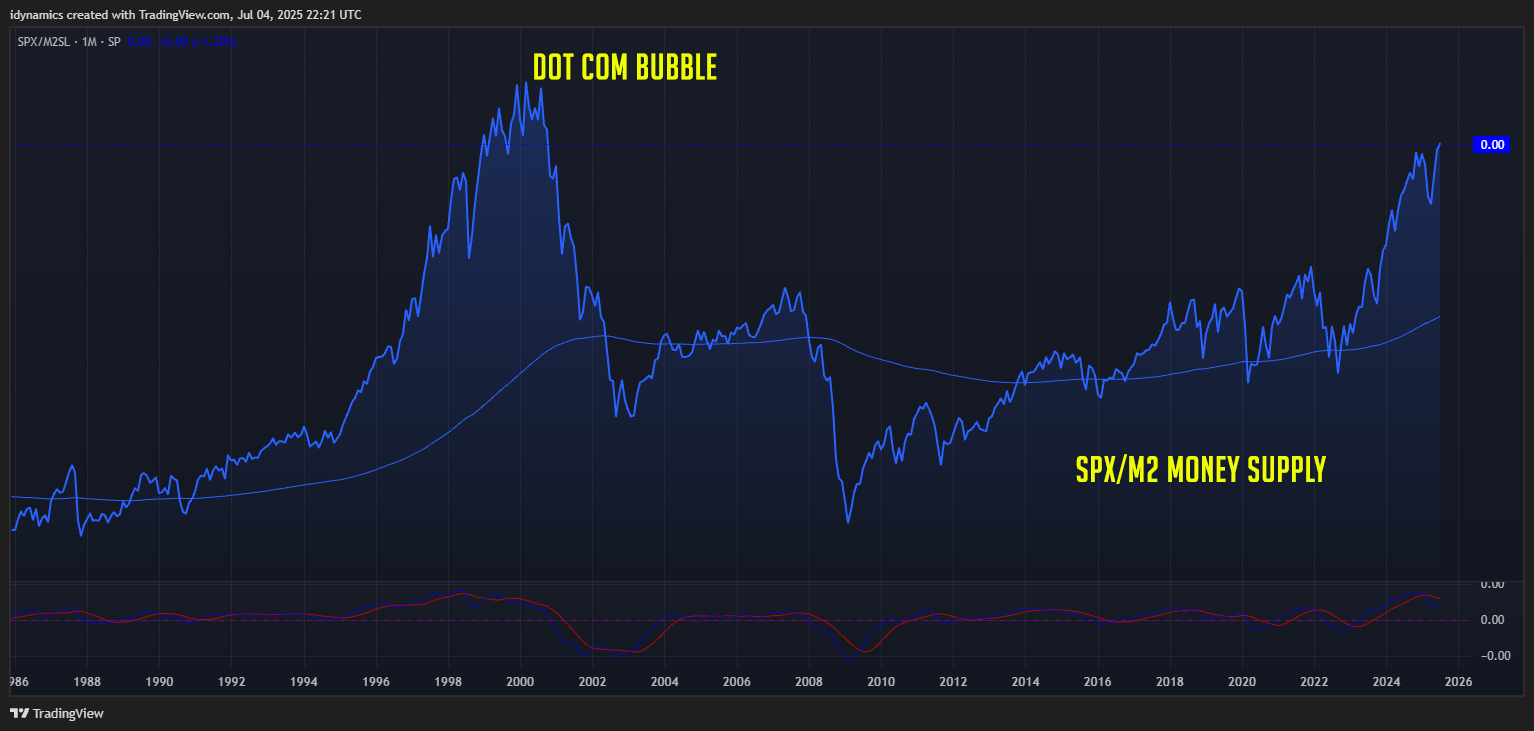
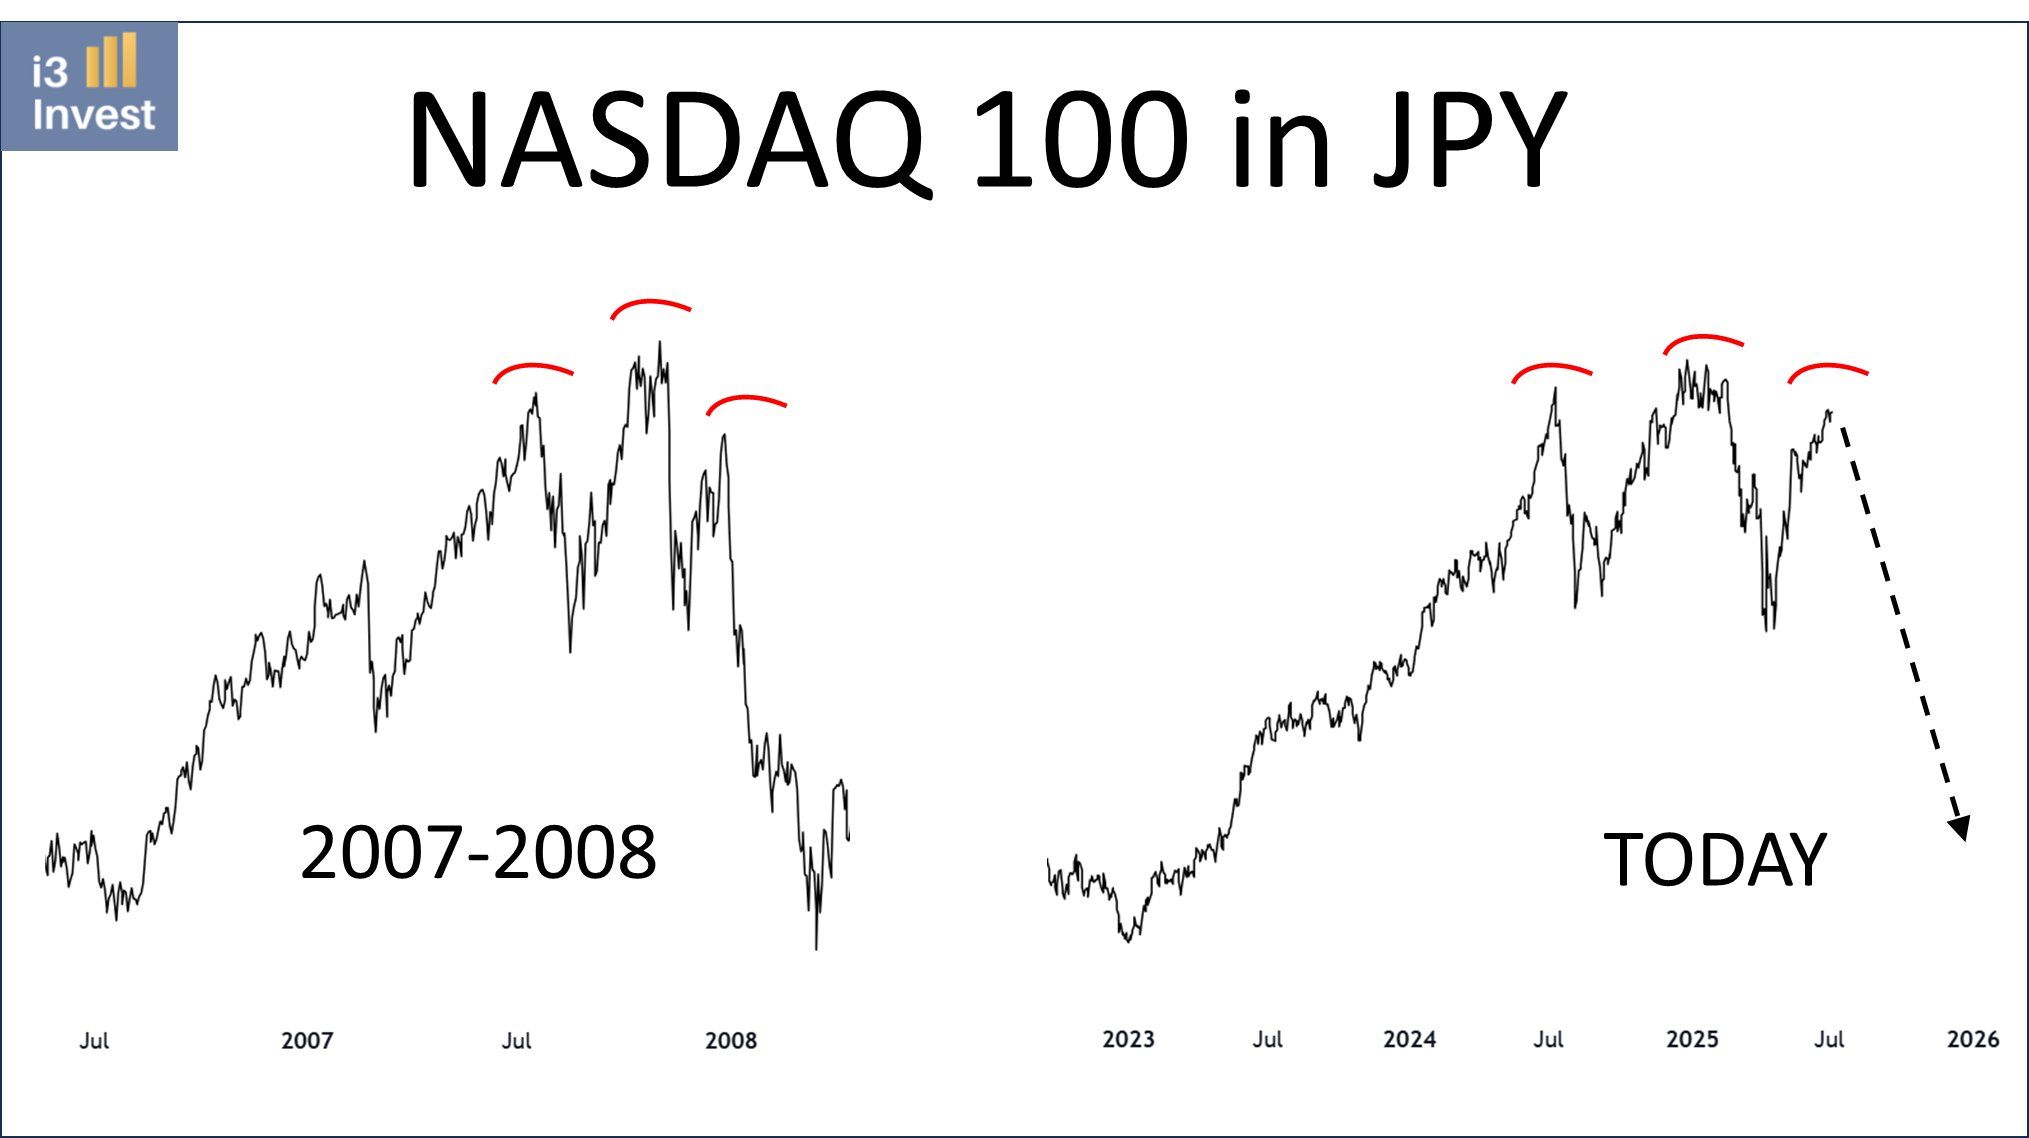
 Another headline making the rounds is M2 hitting an ATH in May. This data is bringing the SPX ratio to levels that haven’t been seen since the Dot Com Bubble of 1999/2000. Another chart that is throwing out a warning is the Nasdaq/JPY, showing an eerie similarity to the 2007/2008 time frame.
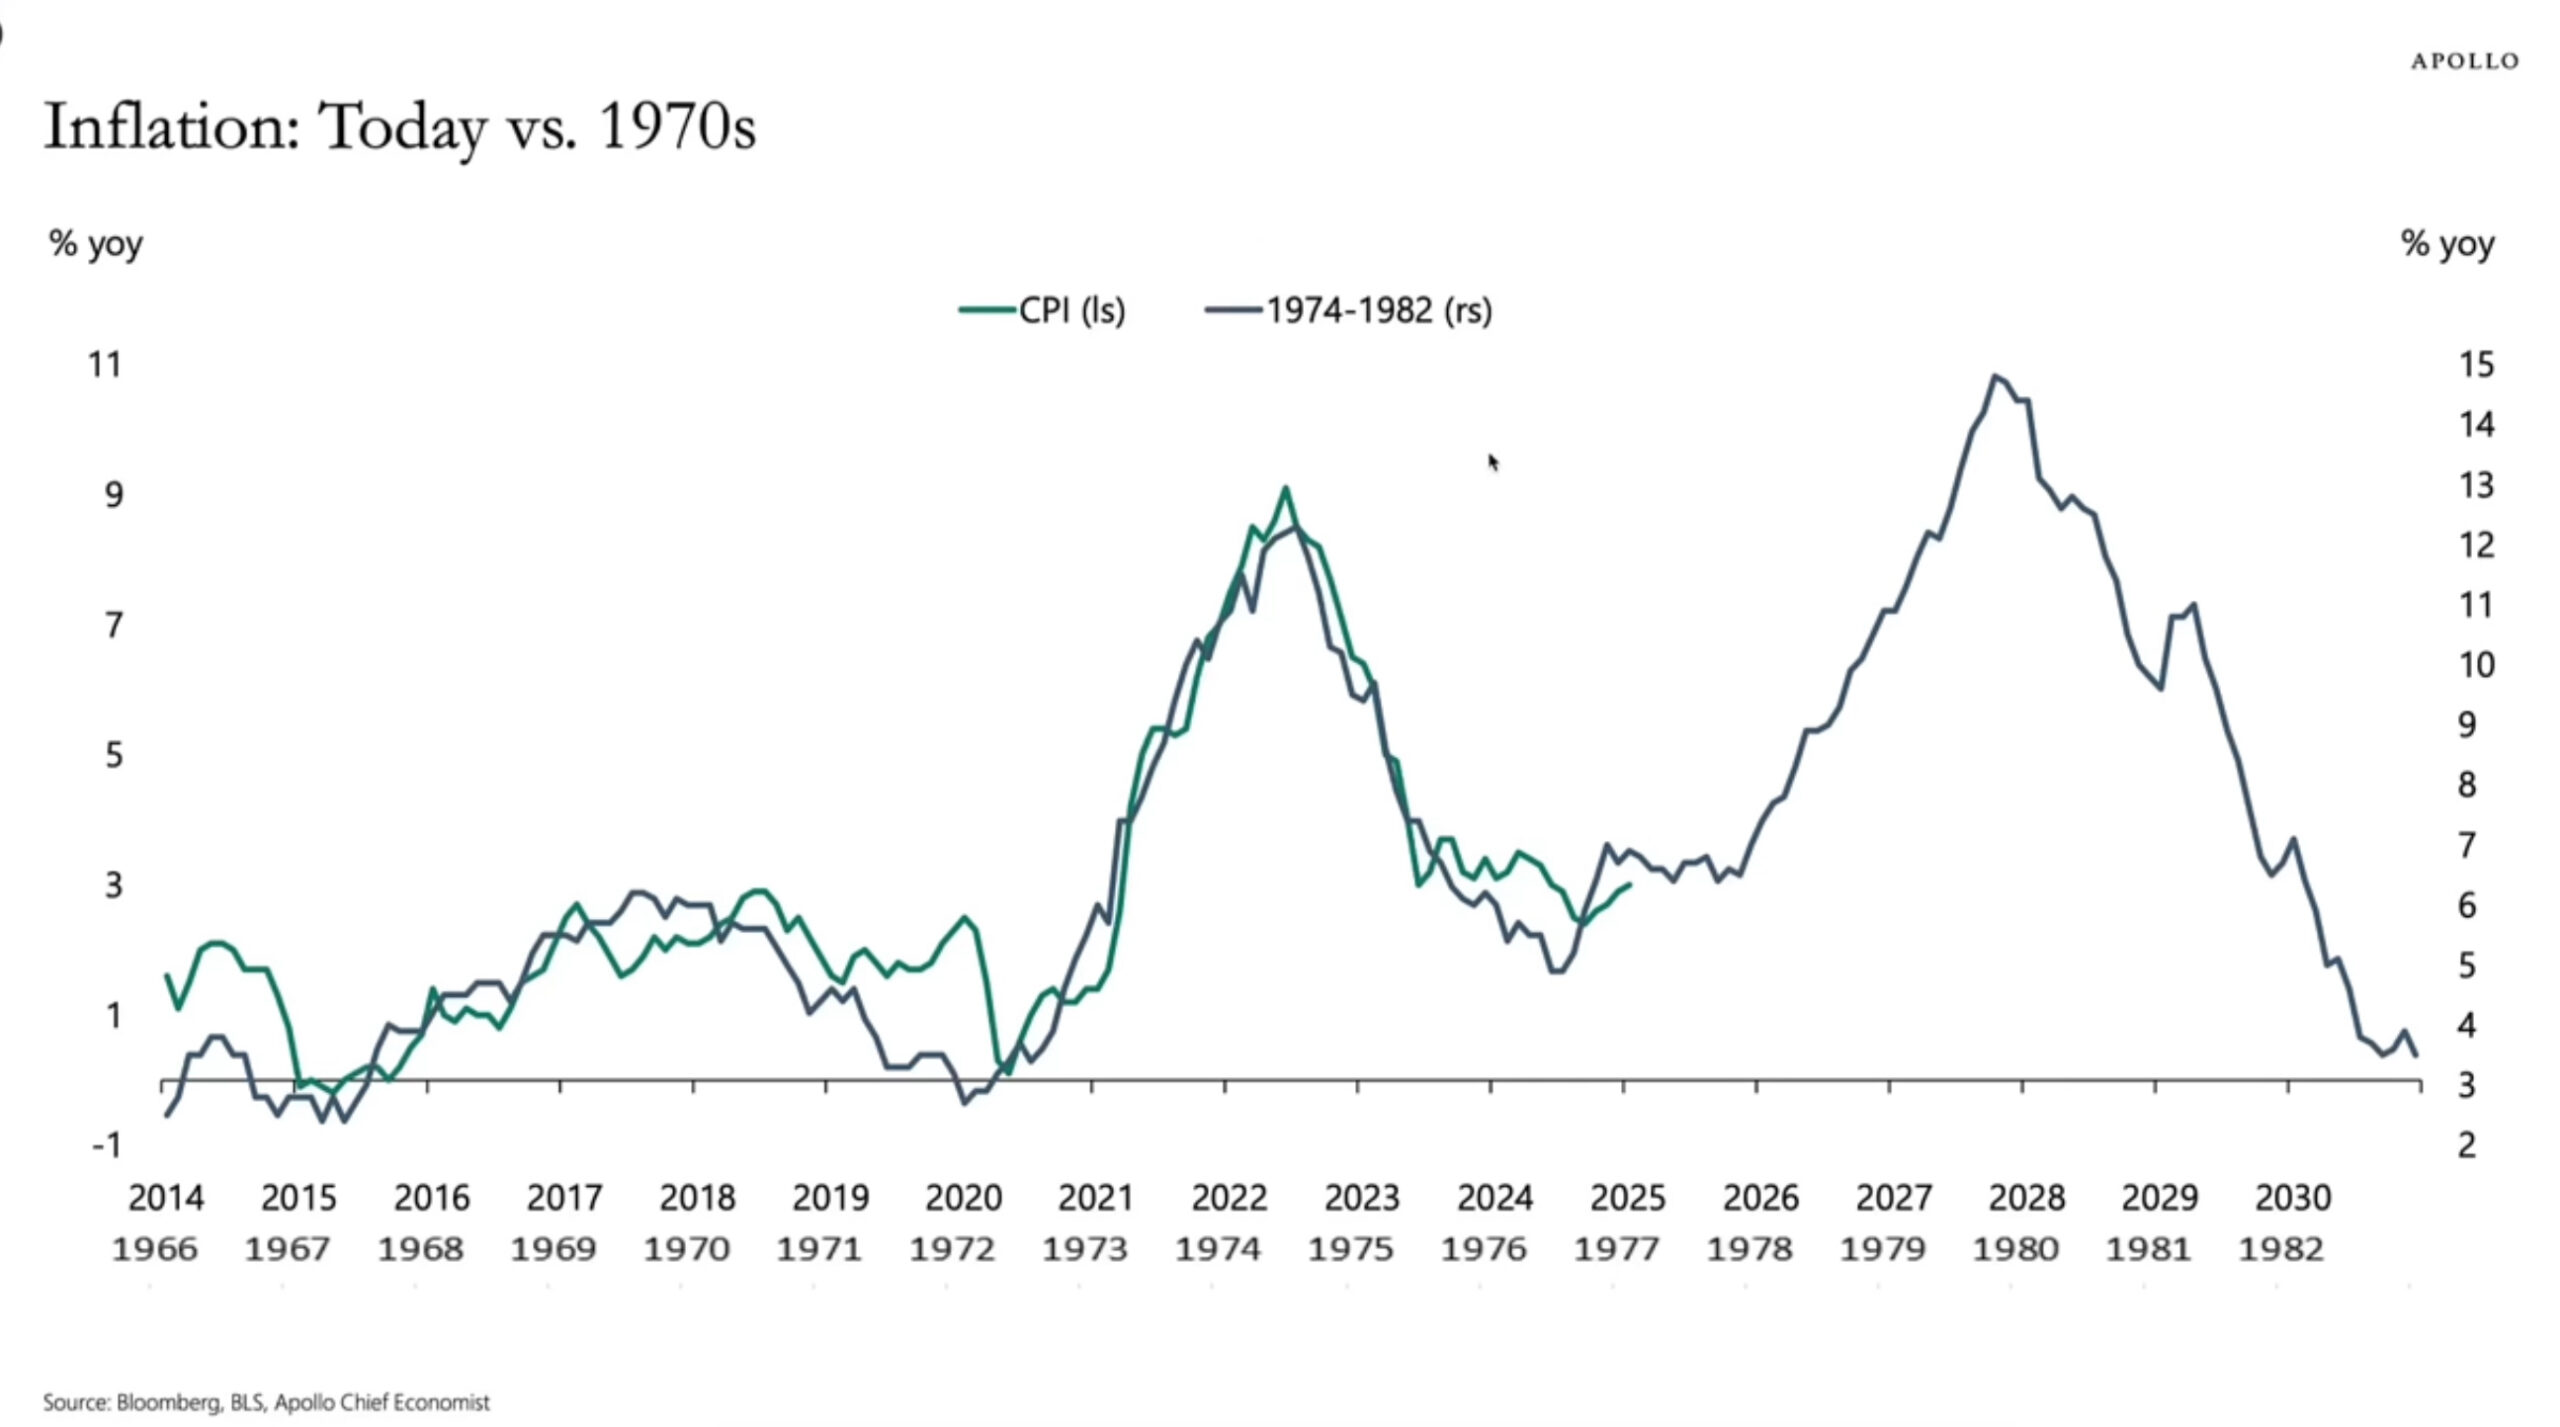
 Another chart making the rounds is the 1970s inflation cycle. It is an interesting chart but has no basis in reality other than a deep correlation to the present trends.
 Dow Jones Industrial Average Daily Candles
 For an update on the longer-term timing outlook, please see the latest update. July 2025 kicks off a massive longer-term window where the confluence of long-term cycles begin to collide. This risk for an exogenous event is heightened in this time frame. August is a month where there is a strong potential for an exogenous event to occur.
From the recent posts:
The reality is that we are now entering a 6-9 month window of extremely volatile longer-term cycles. I am going to issue a cycle timing update this weekend outlining the patterns as we head into Fall 2025. August is when things really heat up with the cycles.
S&P 500 Stocks Above the 200-day MA
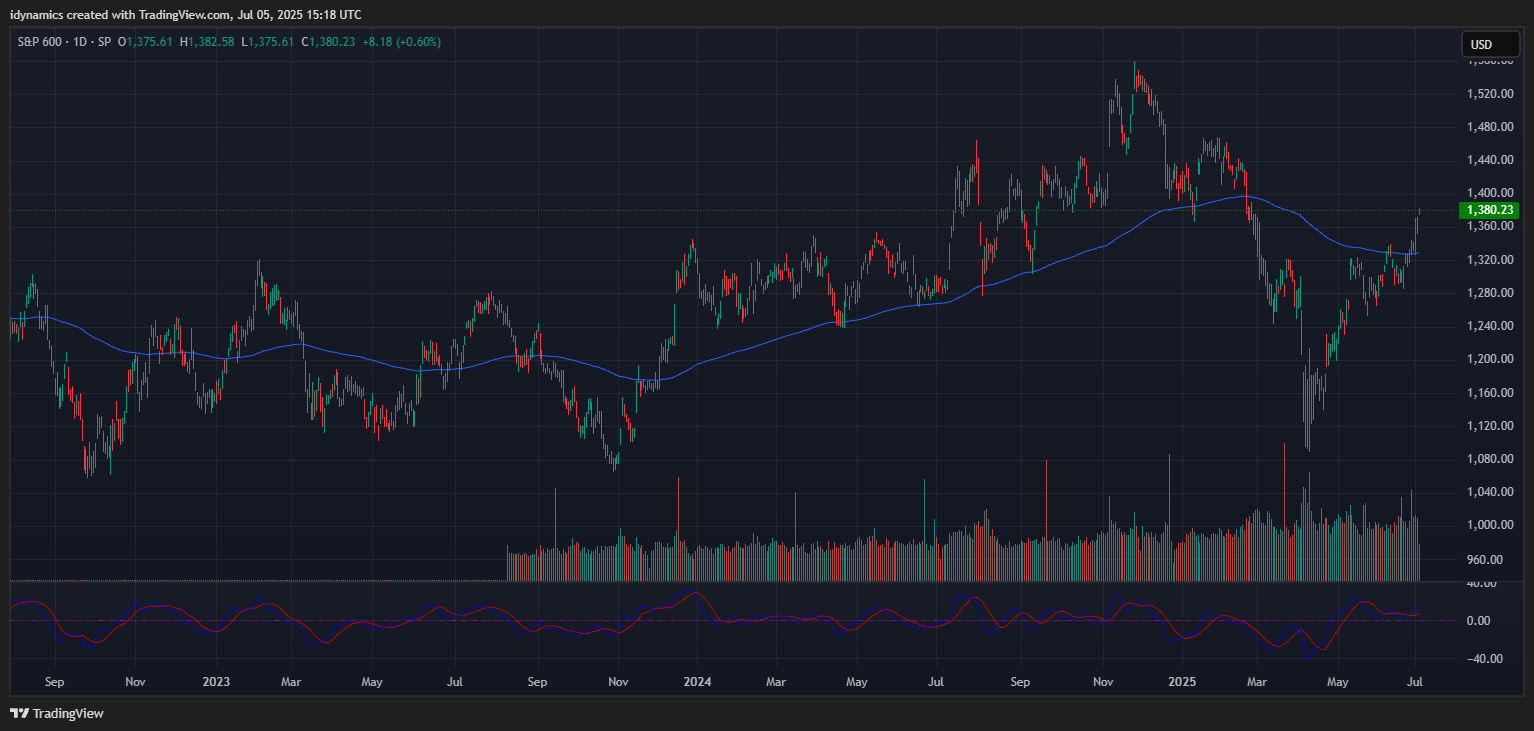
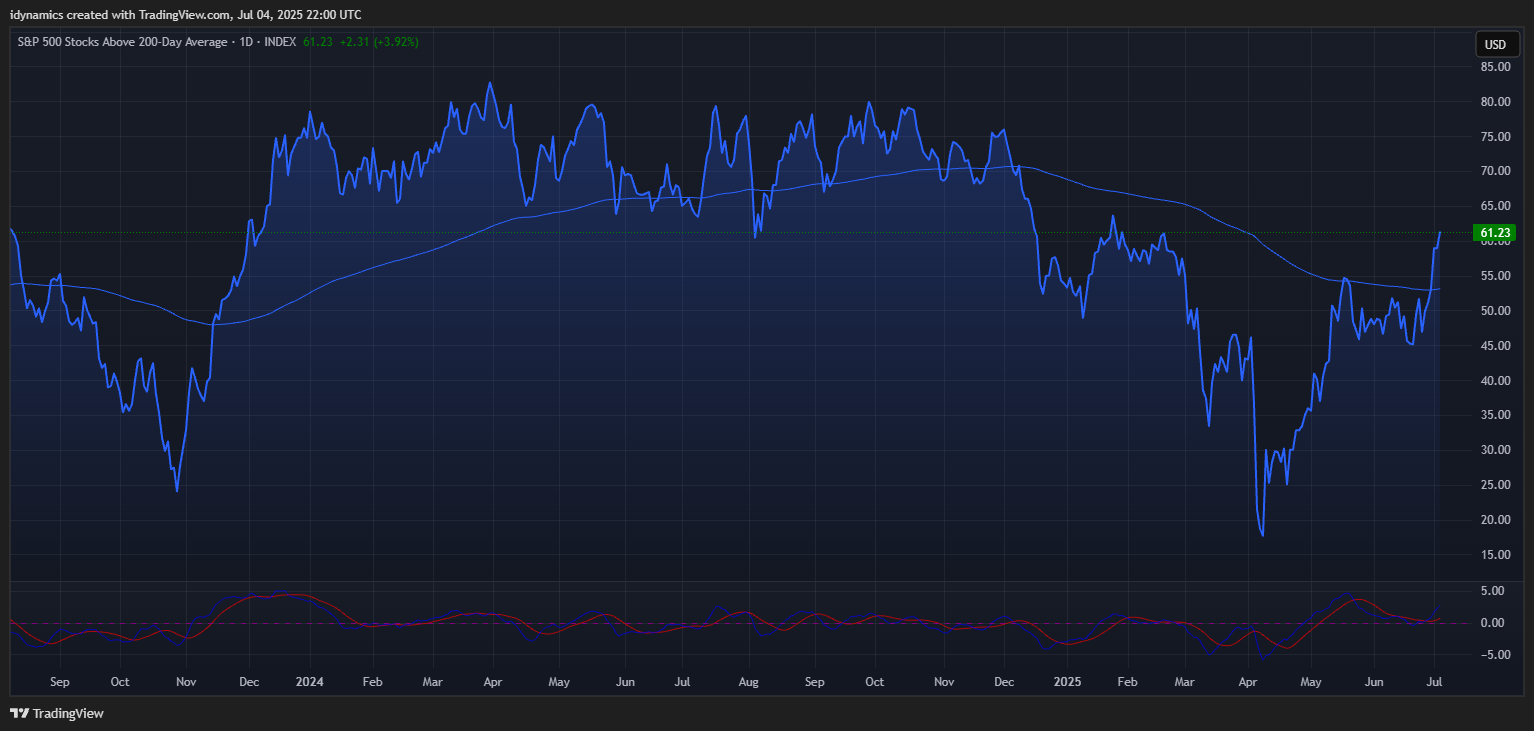 Breadth in the SPX improved dramatically the past two weeks of vertical rise. The percentage of SPX stocks above their 200-day MA ended Thursday at 61.23% and is still in a significant divergence. It hit a high of 63.61% in February 2025 and 72.92% in September 2024 and 82.70% in March of 2024. The S&P 600 continues to lag significantly. While we have positive gamma, the call walls above the market is getting ridiculously frothy. Put/Call is back into extreme greed.
S&P 600 Daily Candles
 SPX Daily Candles
 MAGS (Magnificent 7) Daily Candles
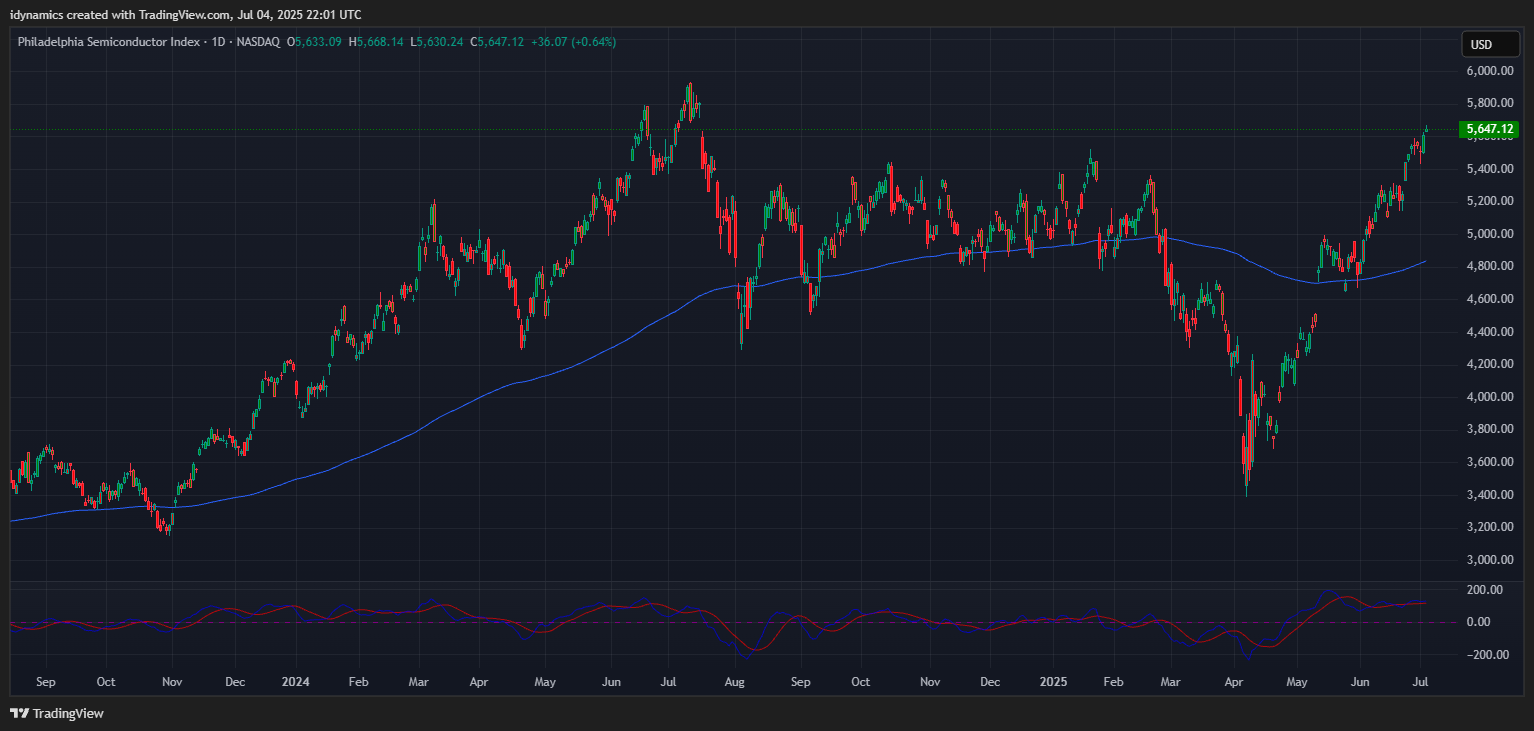
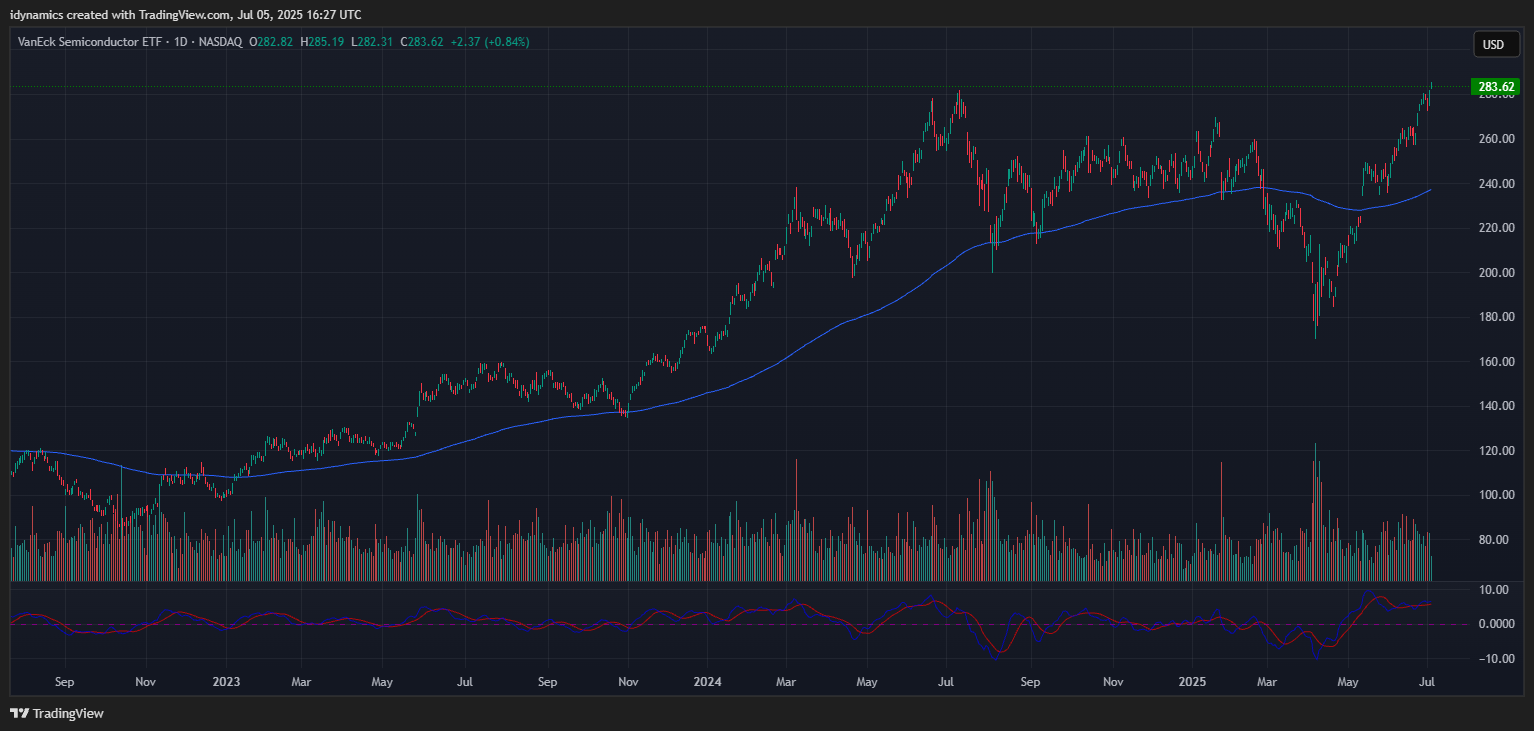
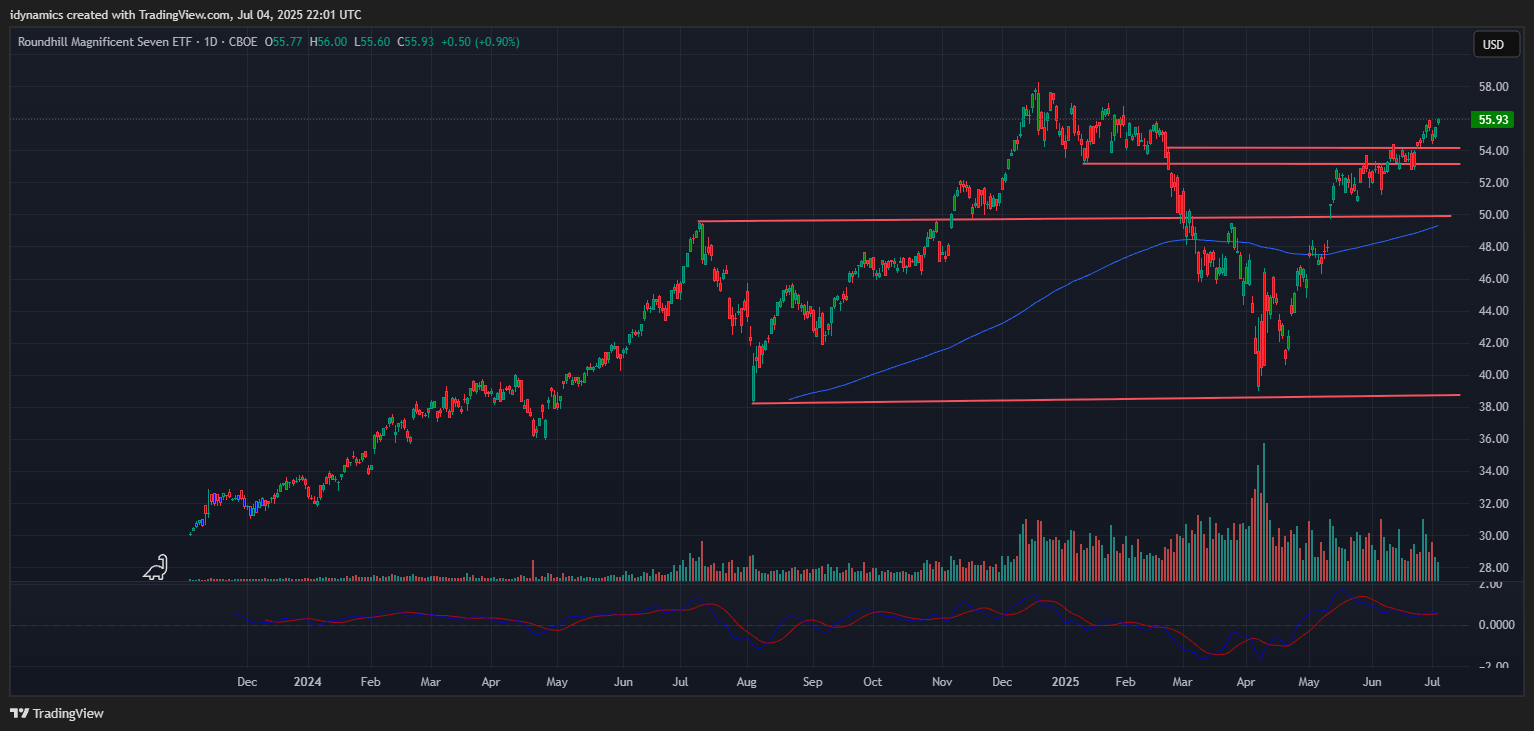 The MAGS remains bullish after taking out critical resistance at 54.16 and is now using the 54.16/53.14 area as support. MAGS closed the week up +0.63% on the top of the week’s range at the top of a hammer pattern…which a signal that a reversal may be imminent. Prices are poised for a test of the highs above 58. Another chart that remains bullish is the SOX, which continued into new highs for 2025 and is testing the gap area on the daily left on 17 July 2024. The SOX continues to lag the FANG and is also extremely overbought. SMH hit record highs last week.
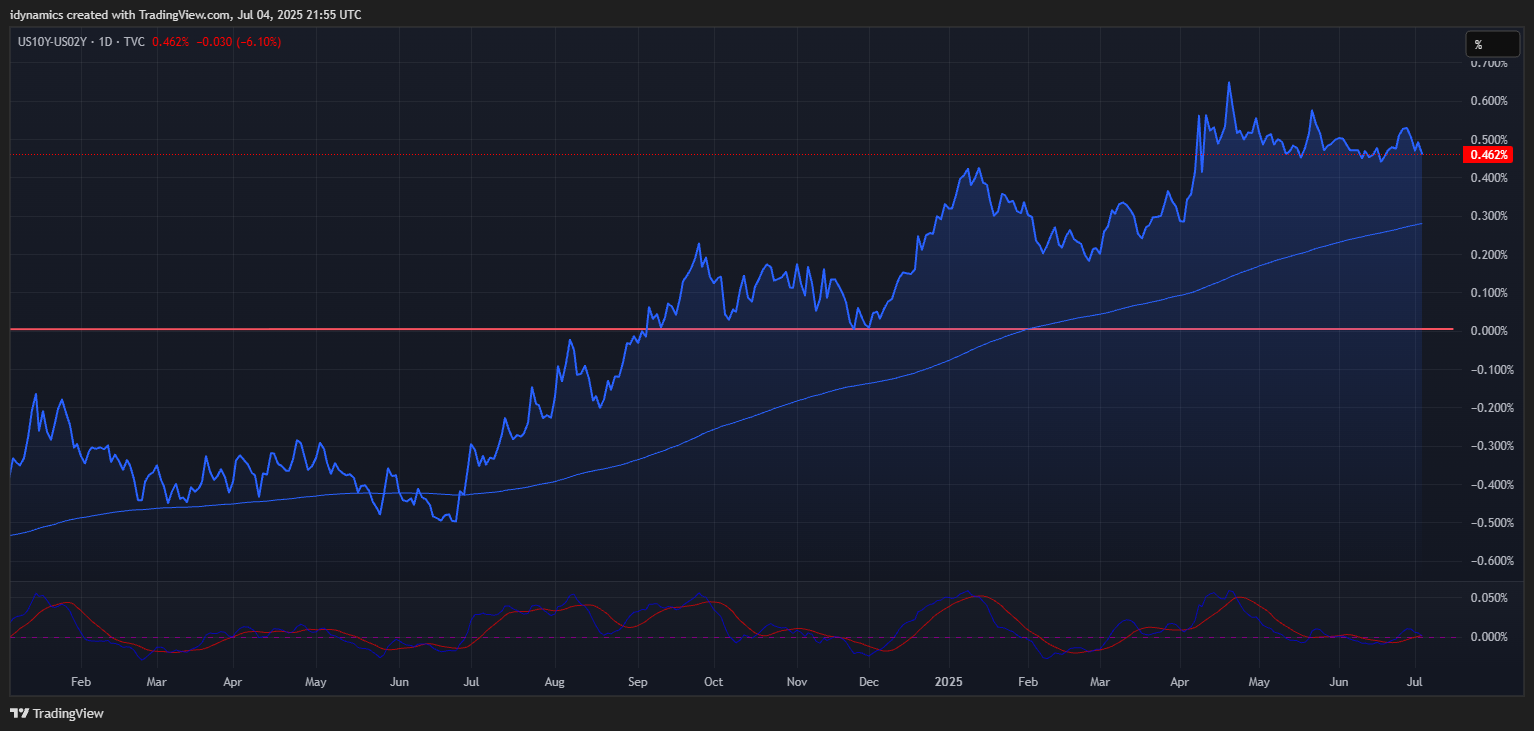
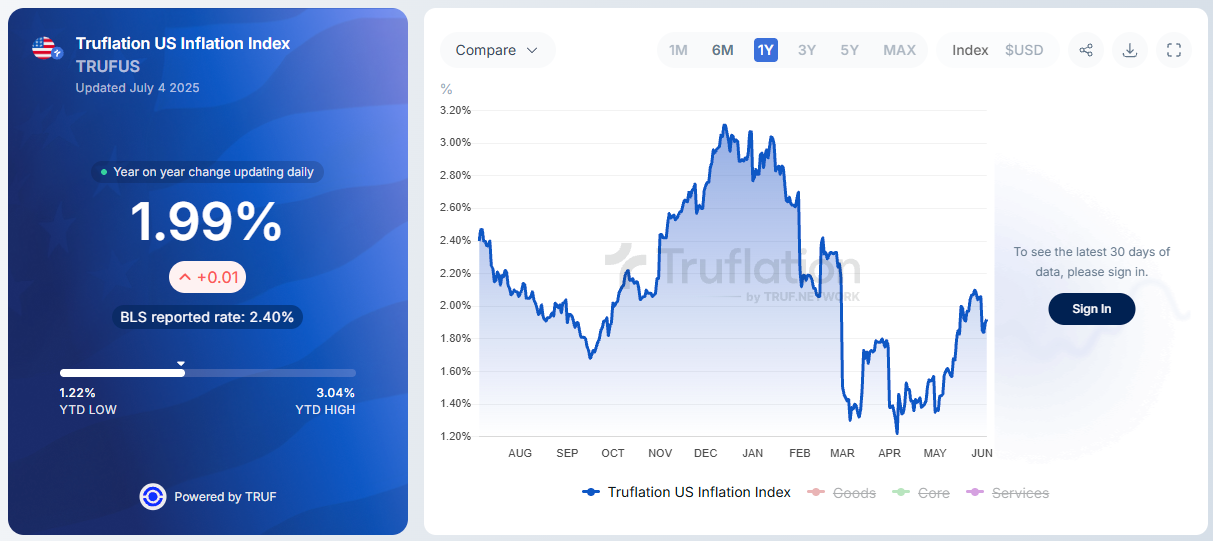
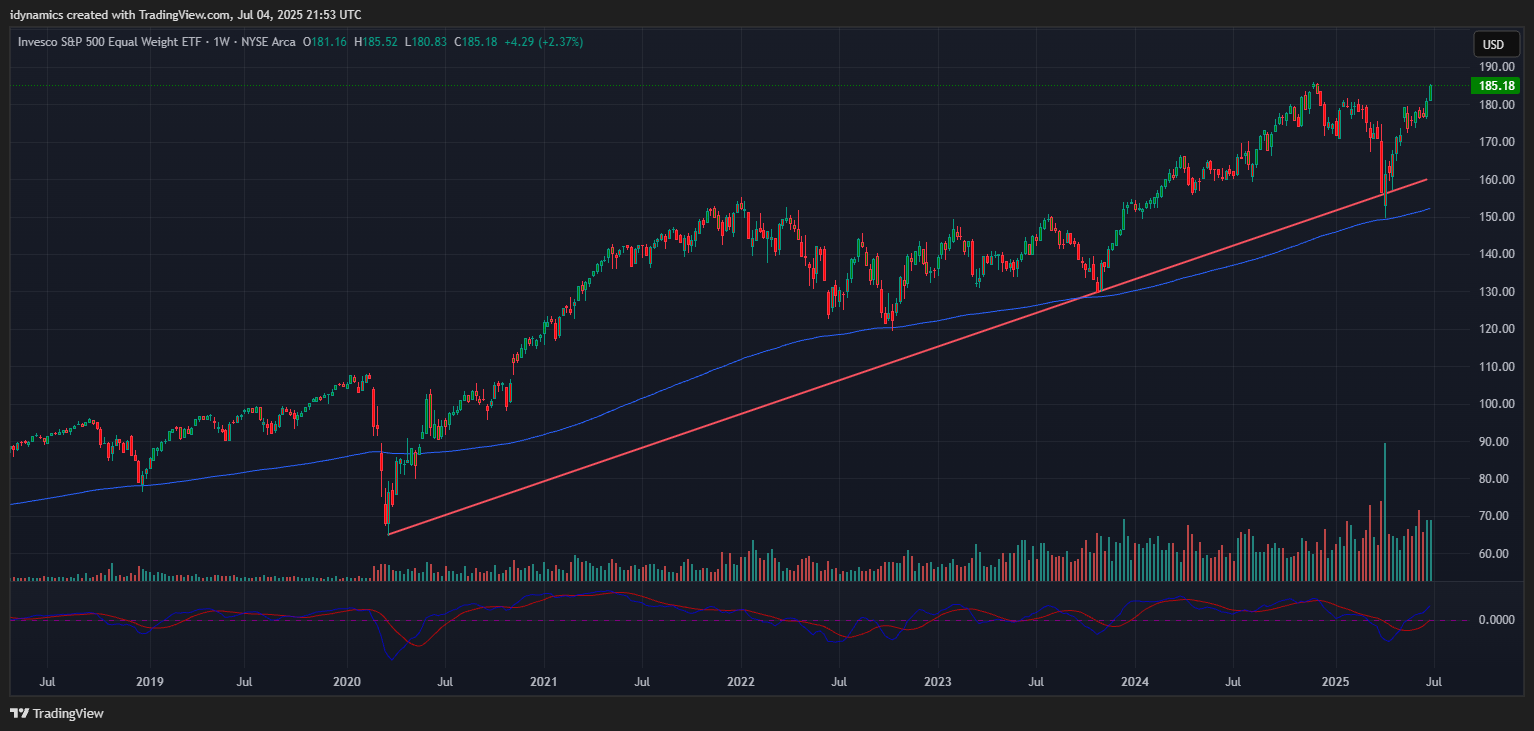
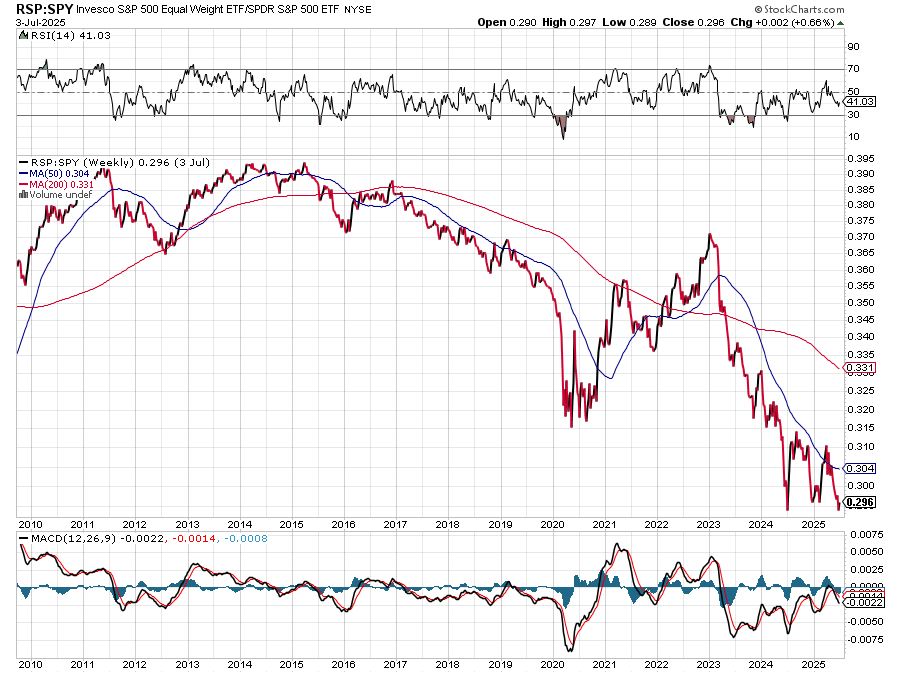
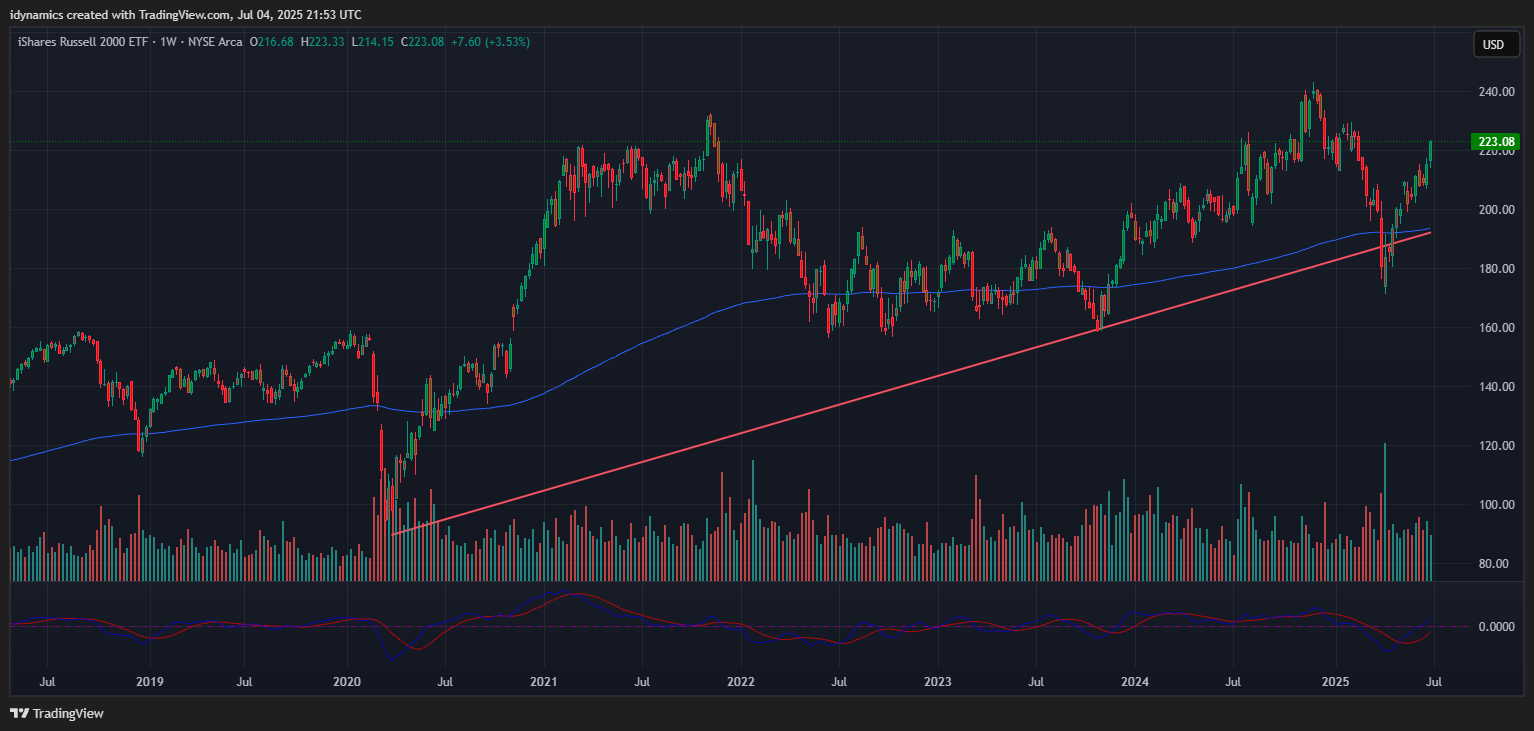
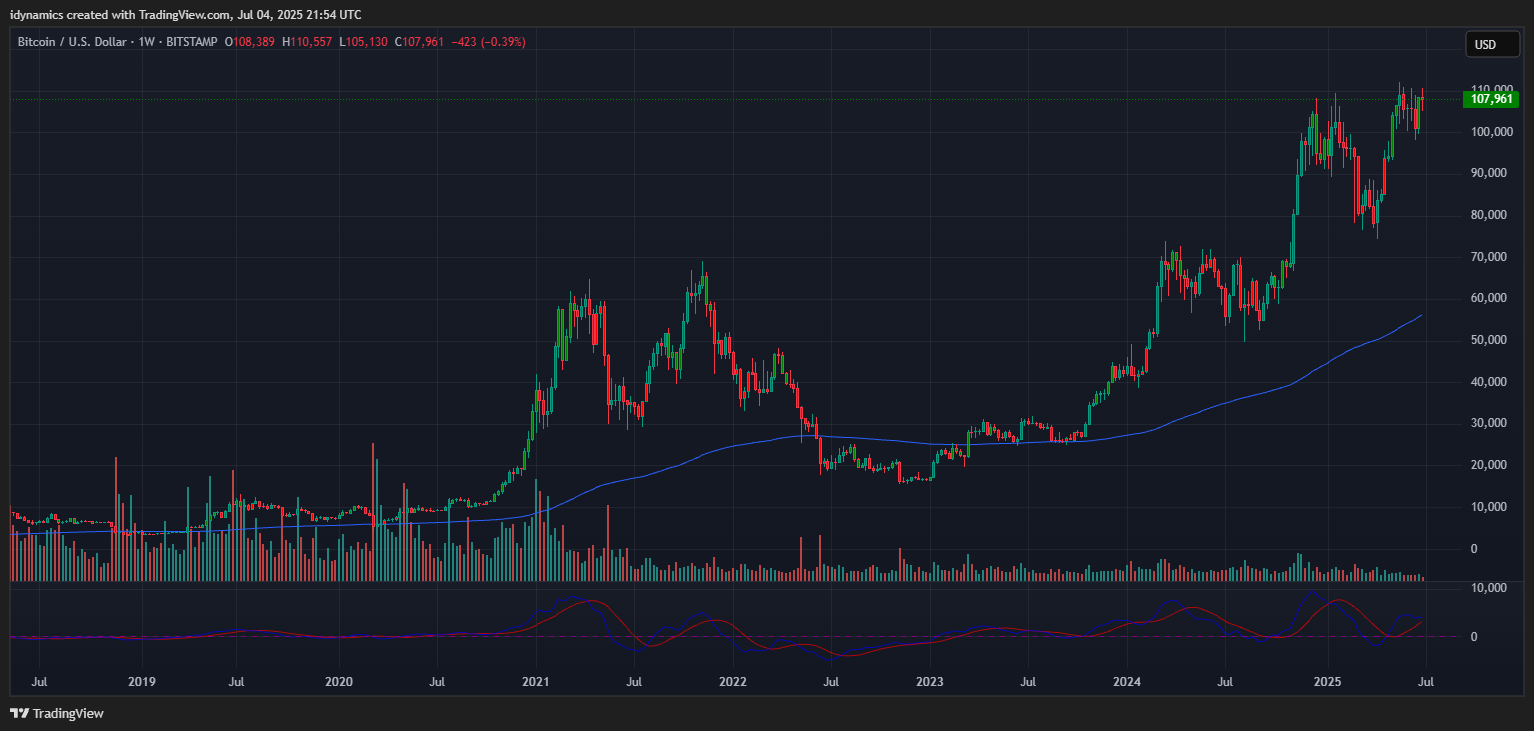
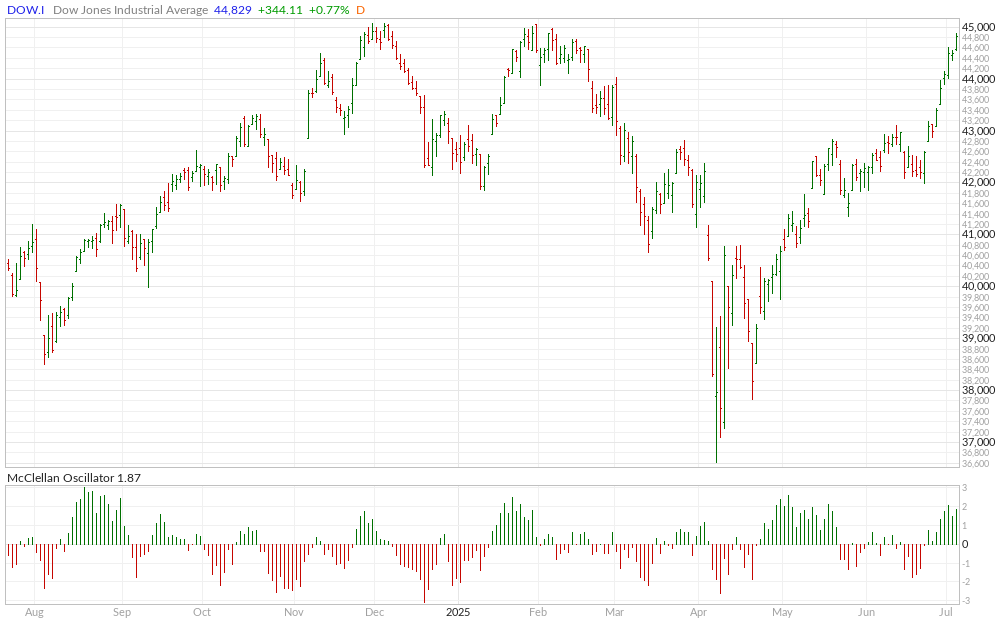
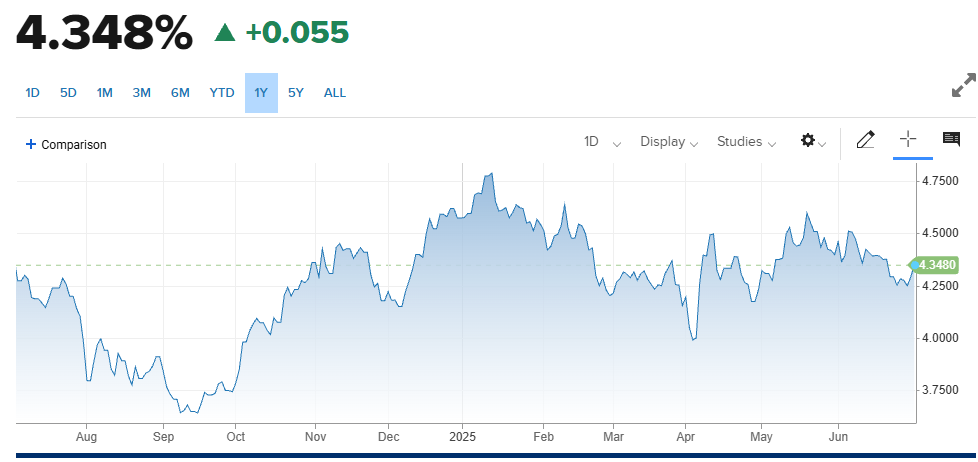
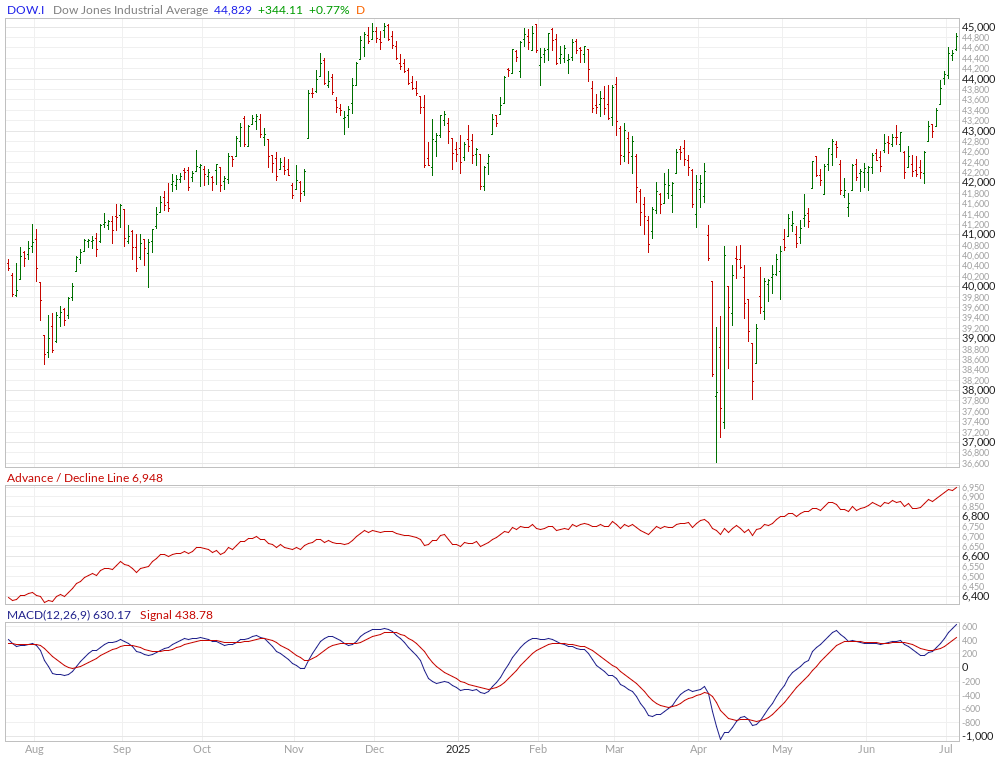
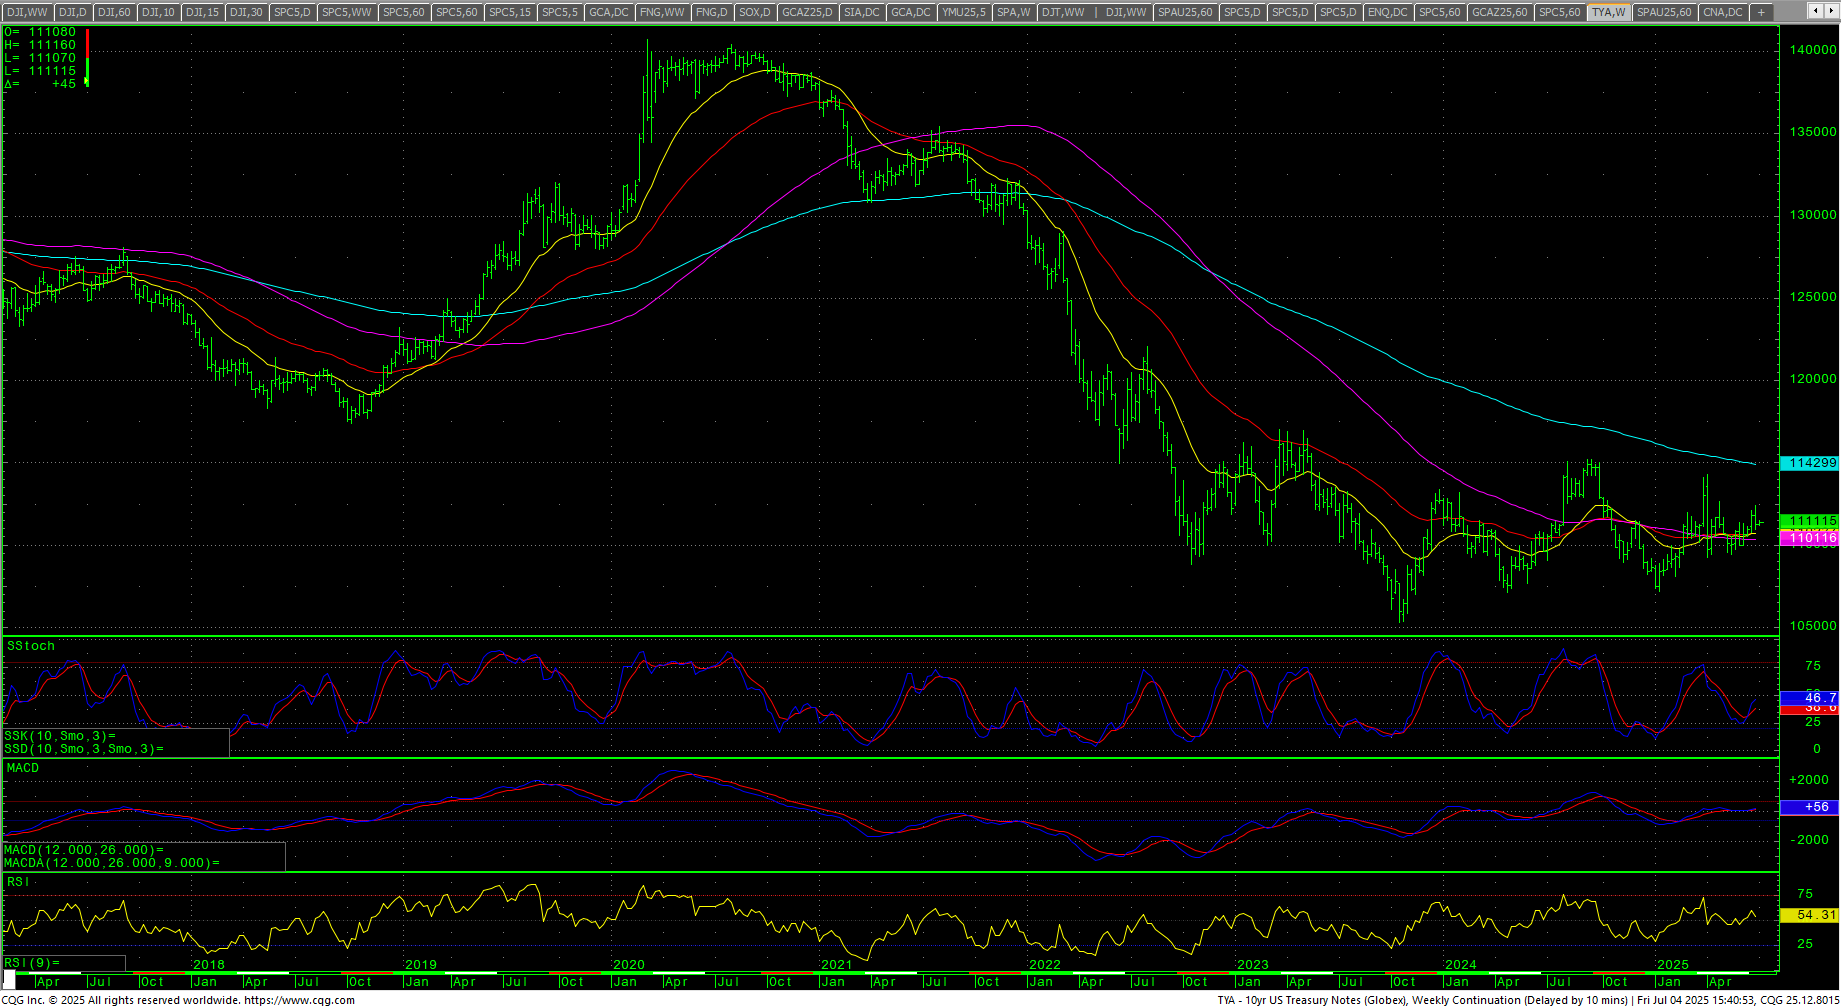
The RSP:SPY gained slightly last week as the RSP is almost into a new ATH. The chart remains extremely weak. The weekly is hooking lower in an oversold position and the MACD is turning back down. The IWM rose sharply and is testing the 2025 highs, settling up +3.53% on the top of the weekly range. The RSP was up +2.37% on the top of the range and closed just a few ticks off the ATH. NVDA was up +1.59% at a new ATH as prices moved toward a massive call wall at the 160 level. Volume is declining with the chart extremely overbought. Bitcoin tested the record highs above $110K and has bearish divergences, settling down -0.22%. McClellan Oscillators are confirming the new A/D highs in the Dow. The Yield Curve contracted last week on some bond volatility, closing at +0.462%. The 10YR yield rose on the week, closing at 4.348%. Truflation declined to 1.99%.
10YR-2YR Yield Curve Daily
 VIX Weekly Candles
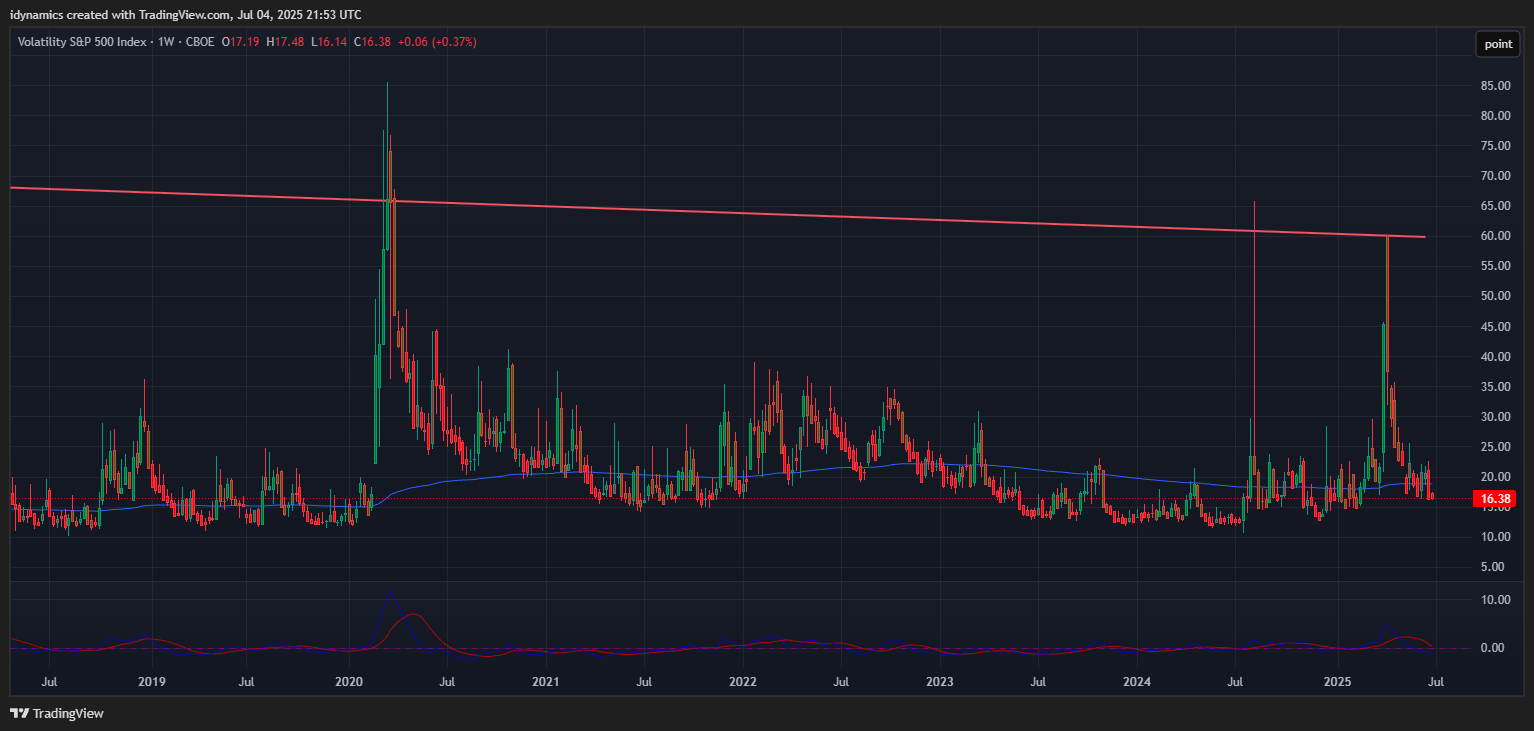
The VIX held in an extremely tight range and ended the week up +0.37% on the bottom of the range as it holds hear the February 2025 lows. The US Dollar closed down -0.28% on the week as it test the lows from February 2022.
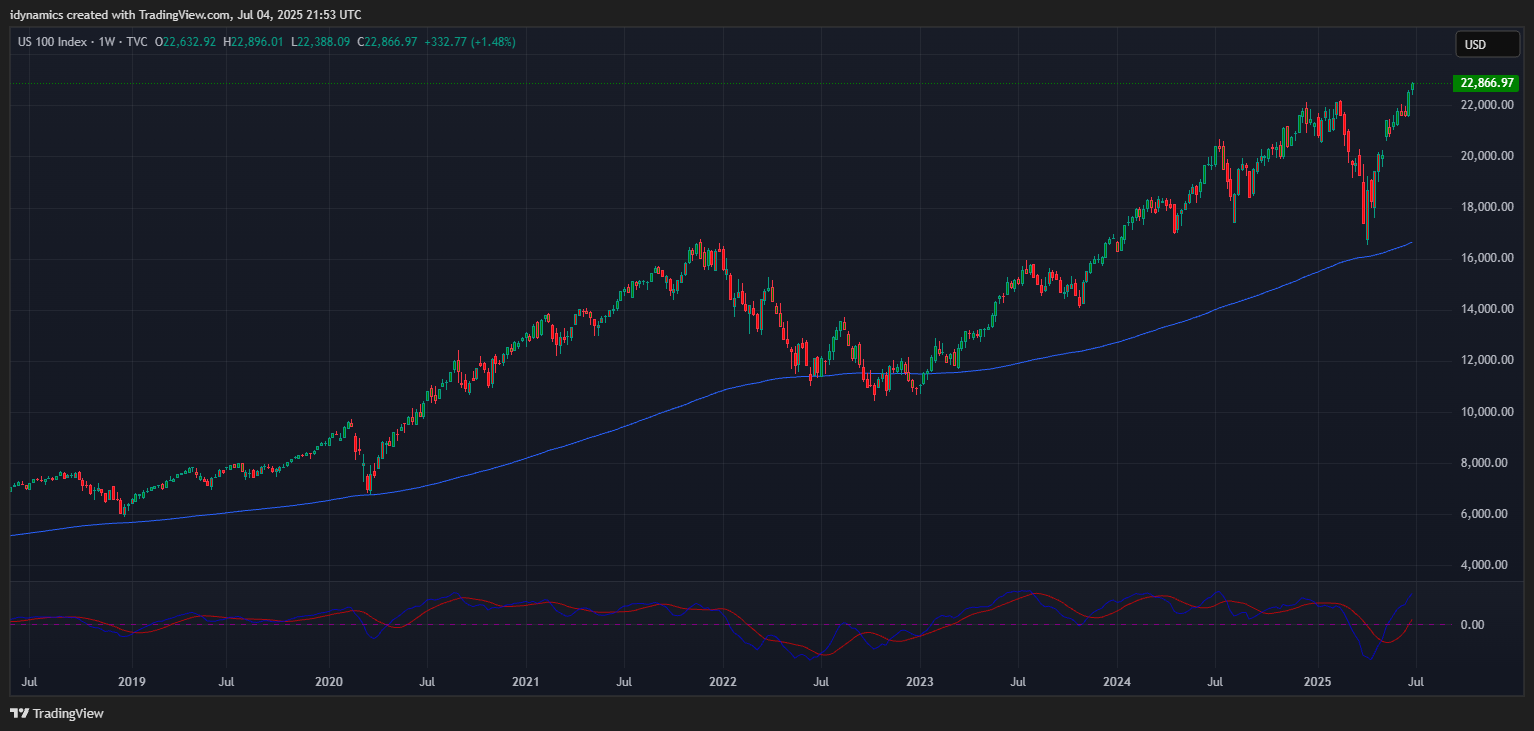
 Nasdaq 100 Weekly Candles
Daily Breadth 
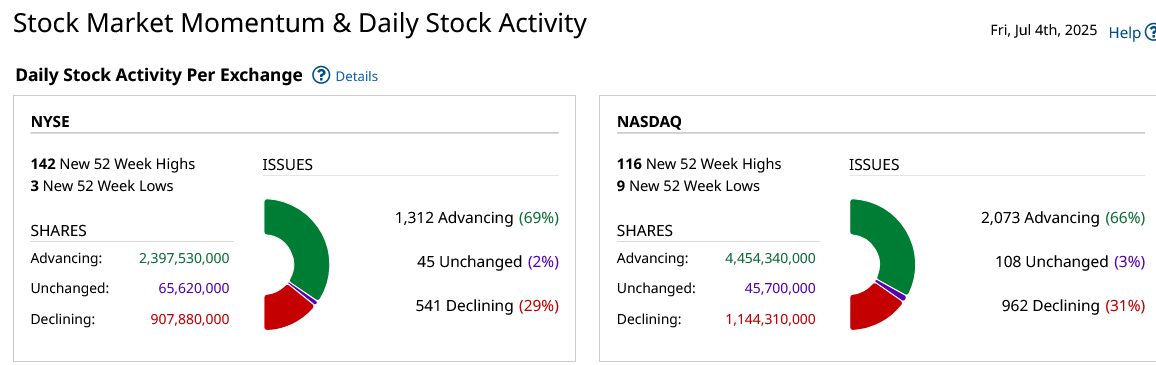
Breadth was strong on Thursday. Sentiment remains in extreme greed.
CNN Fear & Greed Index

 AAII Investor Sentiment Survey
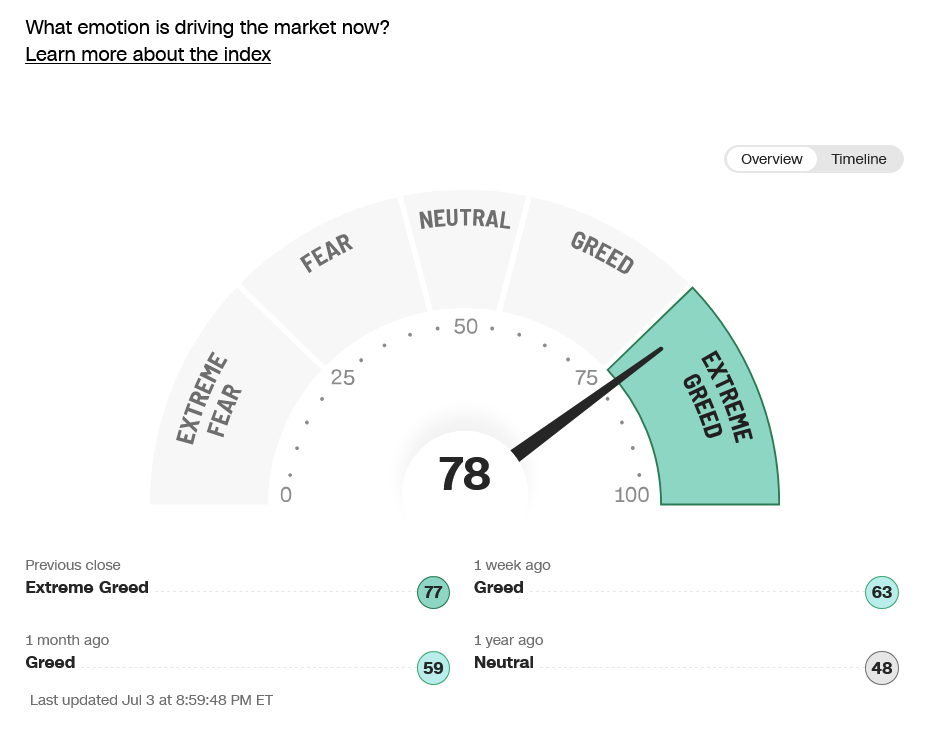
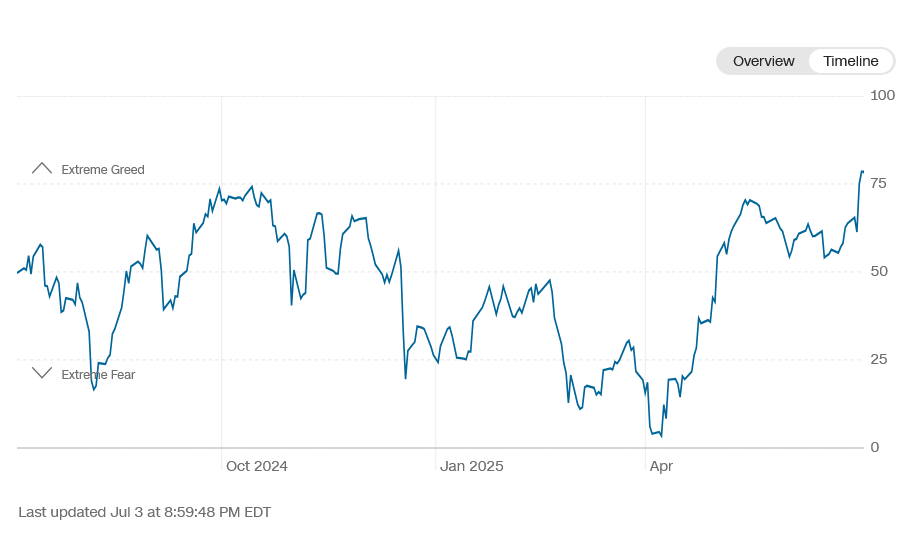
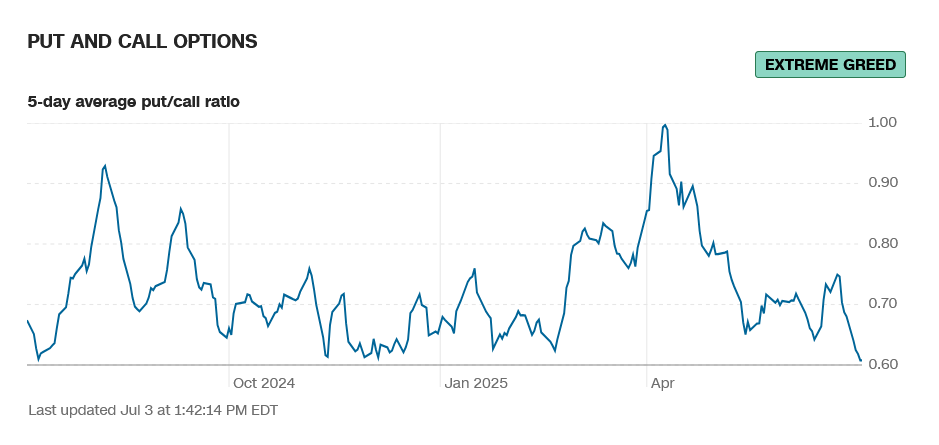
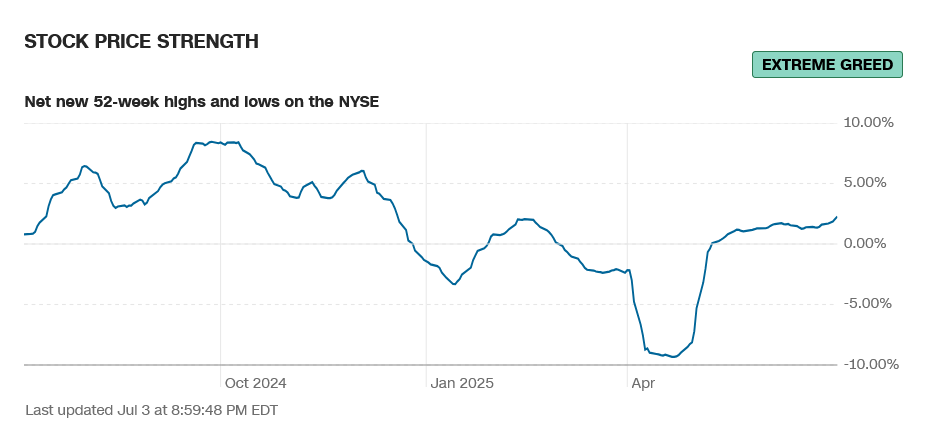
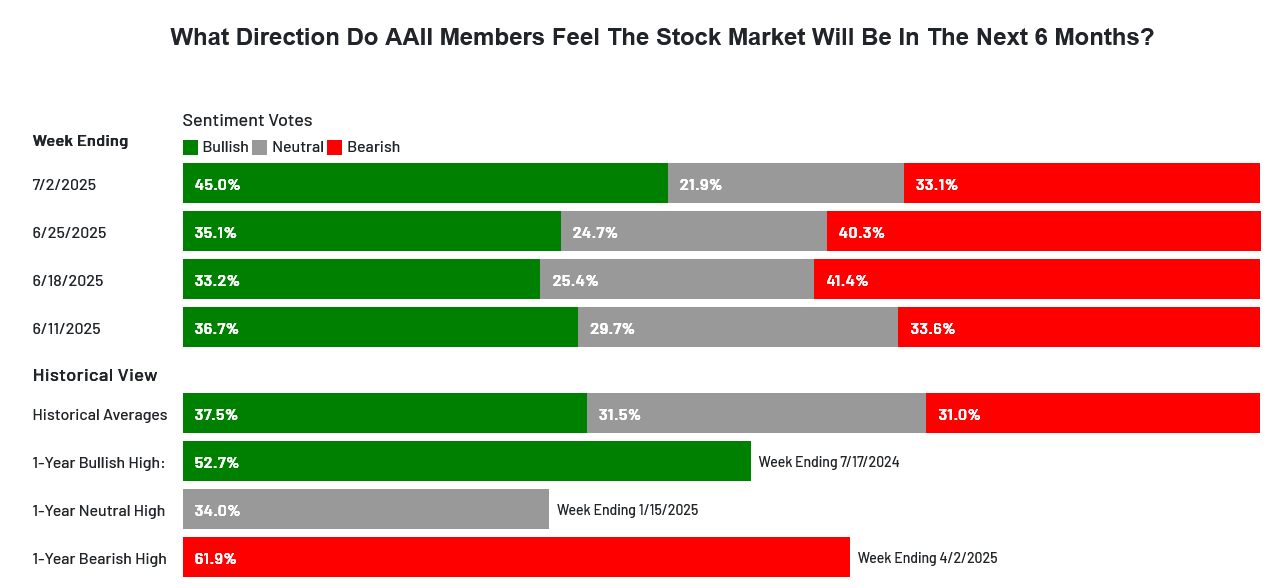 Sentiment is mostly in extreme greed. The CNN Fear and Greed Index moved up to 78 and now reads extreme greed and is now at the highest reading in over a year. Breadth improved sharply on the week and continues to read extreme greed. Latest AAII Sentiment Survey: Optimism Makes a Breakthrough and the bulls are now reaching the highest levels recorded for 2025. The Dow A/D moved to a record high at 6948. The VIX closed the week slightly higher and remains under 20, ending the week up +0.37%. The Put/Call closed at 0.61 and reads extreme greed. The 52-week, A/D rose to +2.28% and reads extreme greed. The Dow closed the week up +2.29%, closing on the top of a low volume week’s range. The S&P settled up +1.72% ending in the top of the weekly range. The Nasdaq Composite was up +1.62% and the Nasdaq 100 was up +1.48%. The NYSE FANG rallied to record highs and closed up +1.15%. The Russell was up +3.52% on the top of the range. The 10-year notes reversed lower, settling in the bottom of the week’s range. The yield on the 10YR increased to 4.348%.
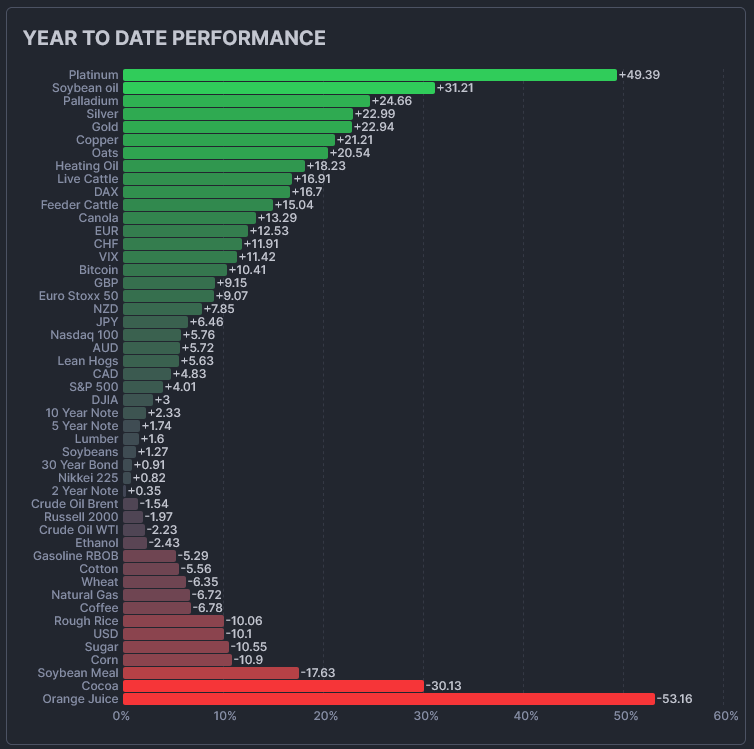
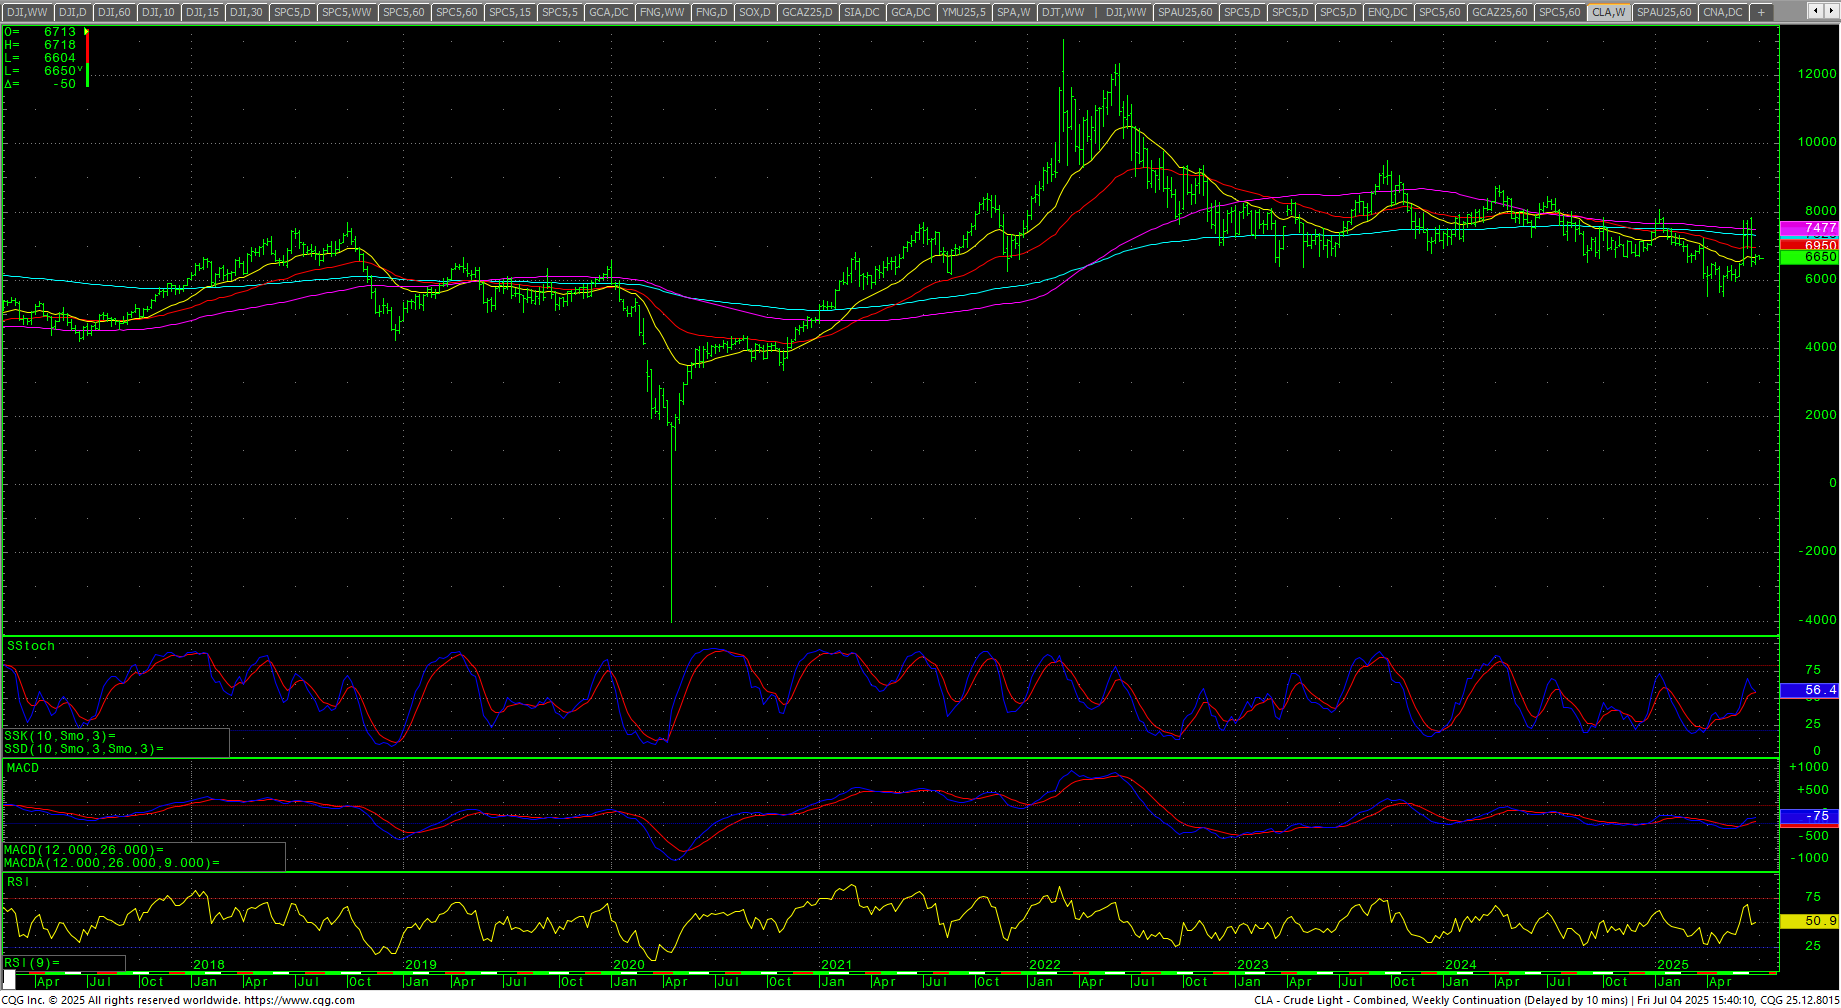
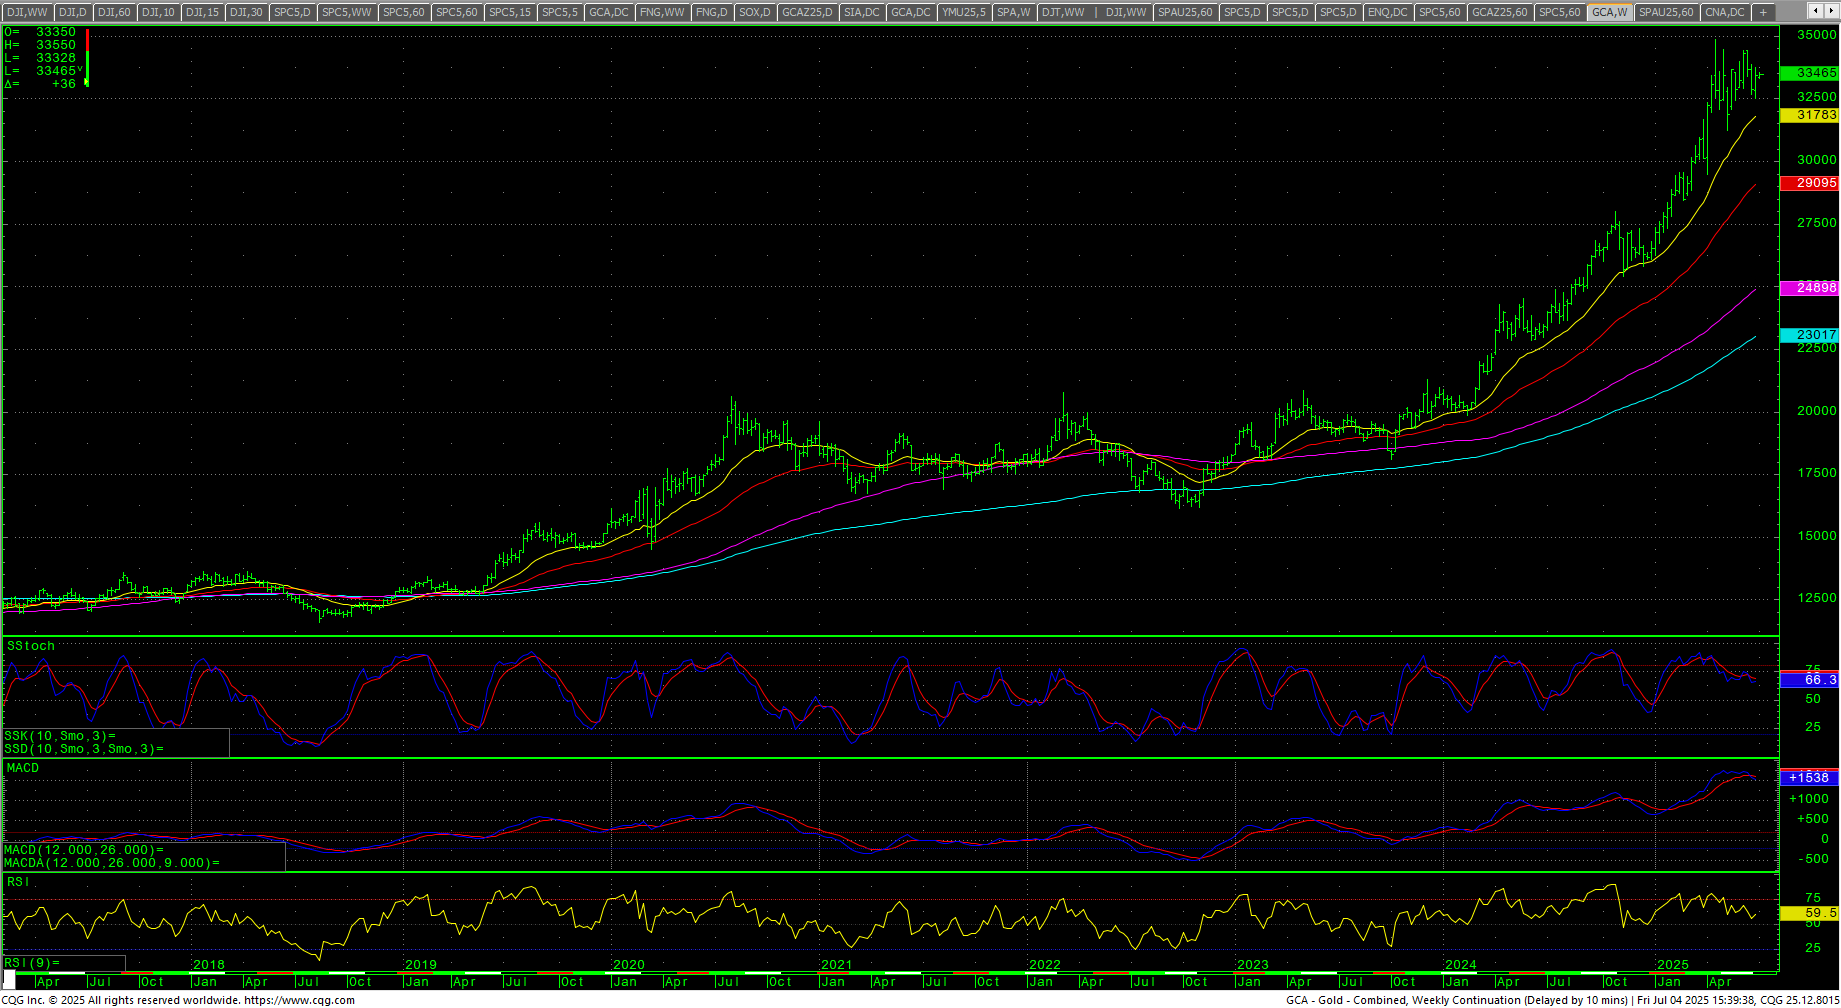
The CRB Index was up +0.65%. Crude oil held in a tiny inside week’s range and settled up +2.21%. Gold closed higher on the top of a reversal range, up +1.59%, closing on the top of the weeks range. The CoT for the S&P 500 saw dealers adding while non-commercials flattened. The CFTC S&P 500 Non-Commercial Net Positions releases next on 7 July 2025.
Timing Points
Minor timing falls on Thursday. Critical cycle timing falls on the 23rd/24th. For an update on the longer-term timing outlook, please see the latest update. There are no major reports this week except initial claims Thursday (est: 235K). 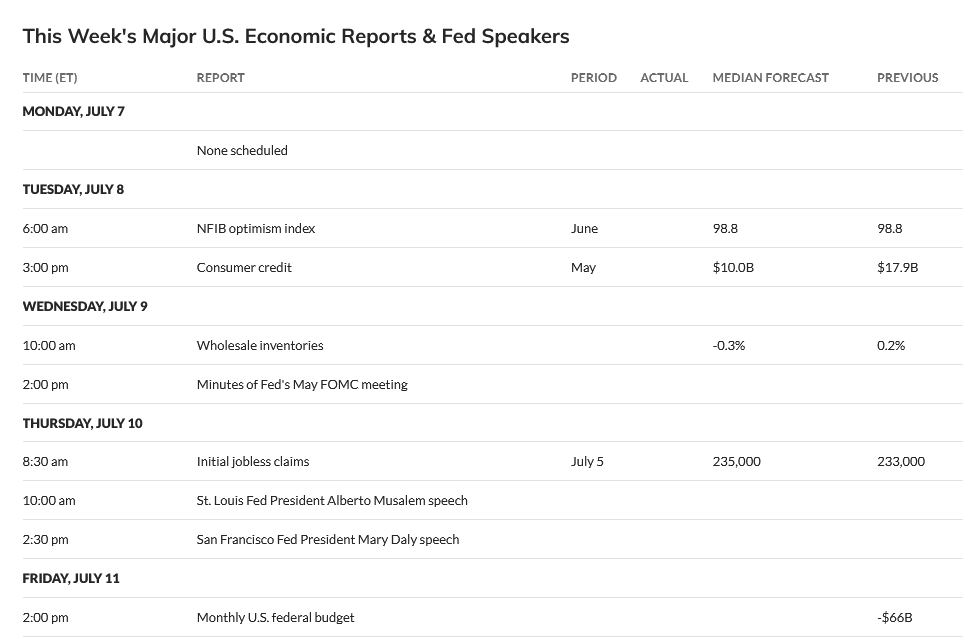
- 07/10 **
- 07/17 **
- 07/23-24 *** X
- 08/01 *** X
- 08/05 *** X kicks off critical week through
- 08/08 *** X through
- 08/11 *** X critical week
Dow Jones Industrial Average
Dow Jones Industrial Average Weekly H-L-C
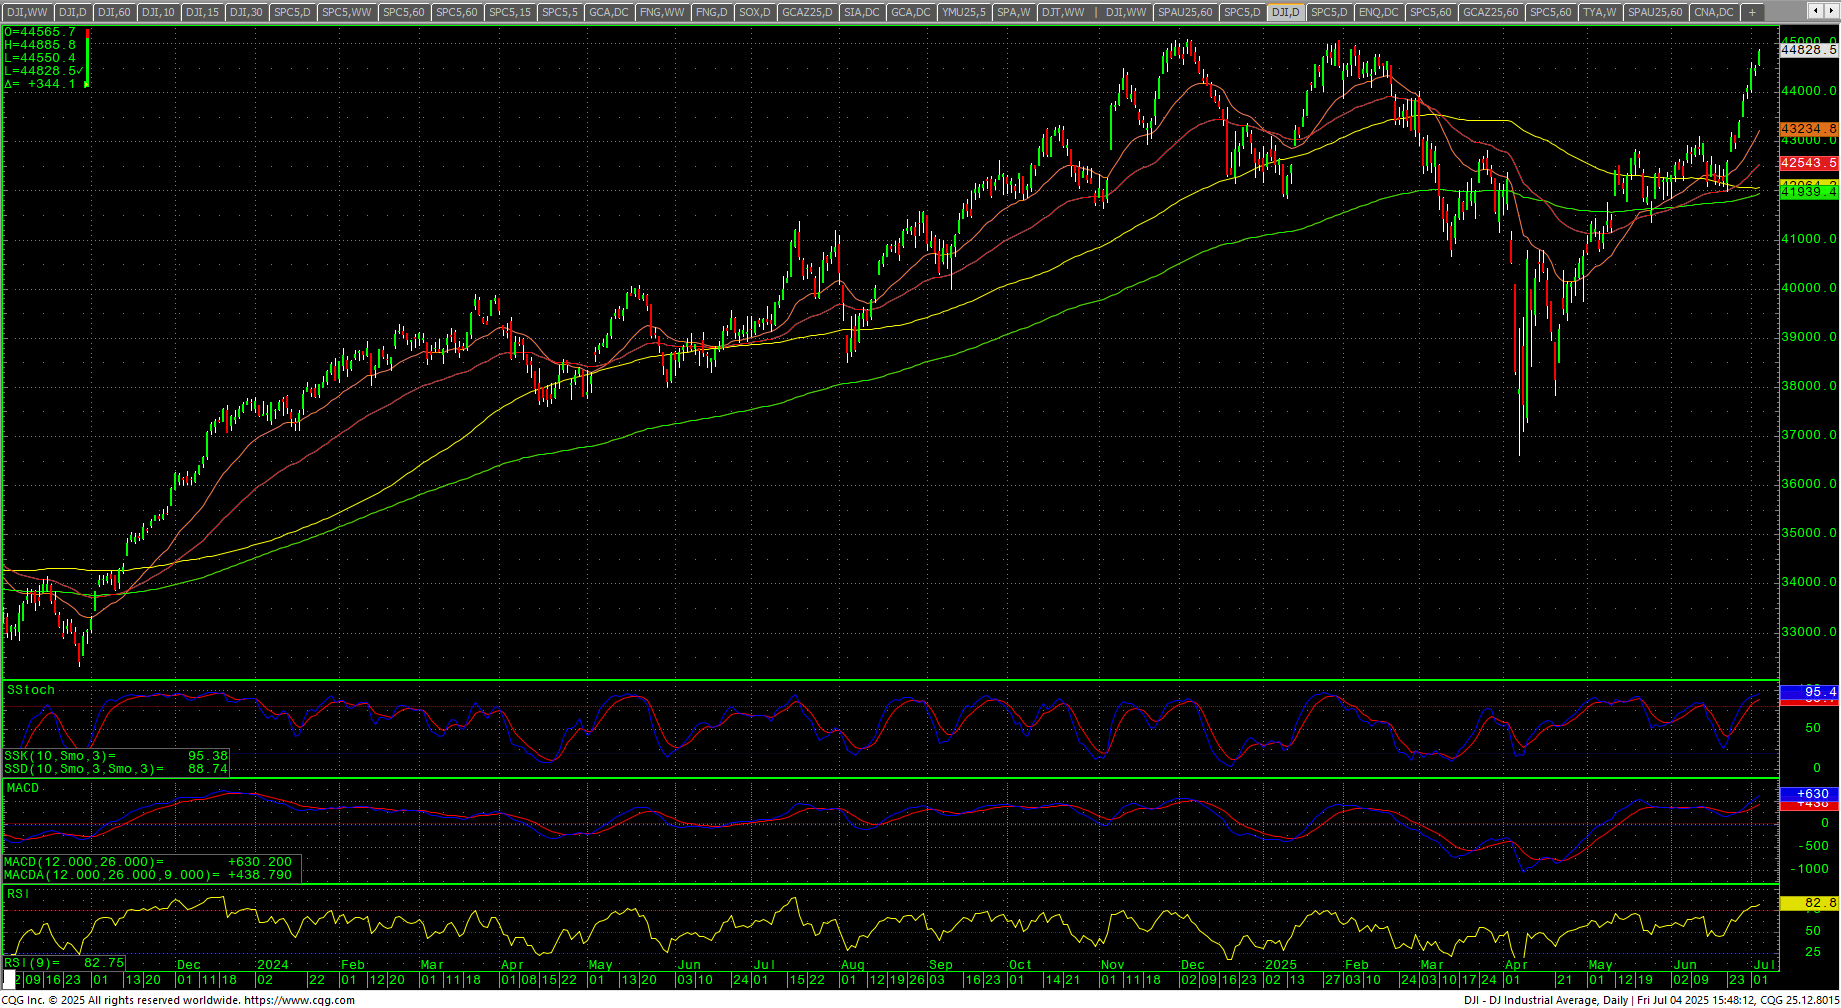
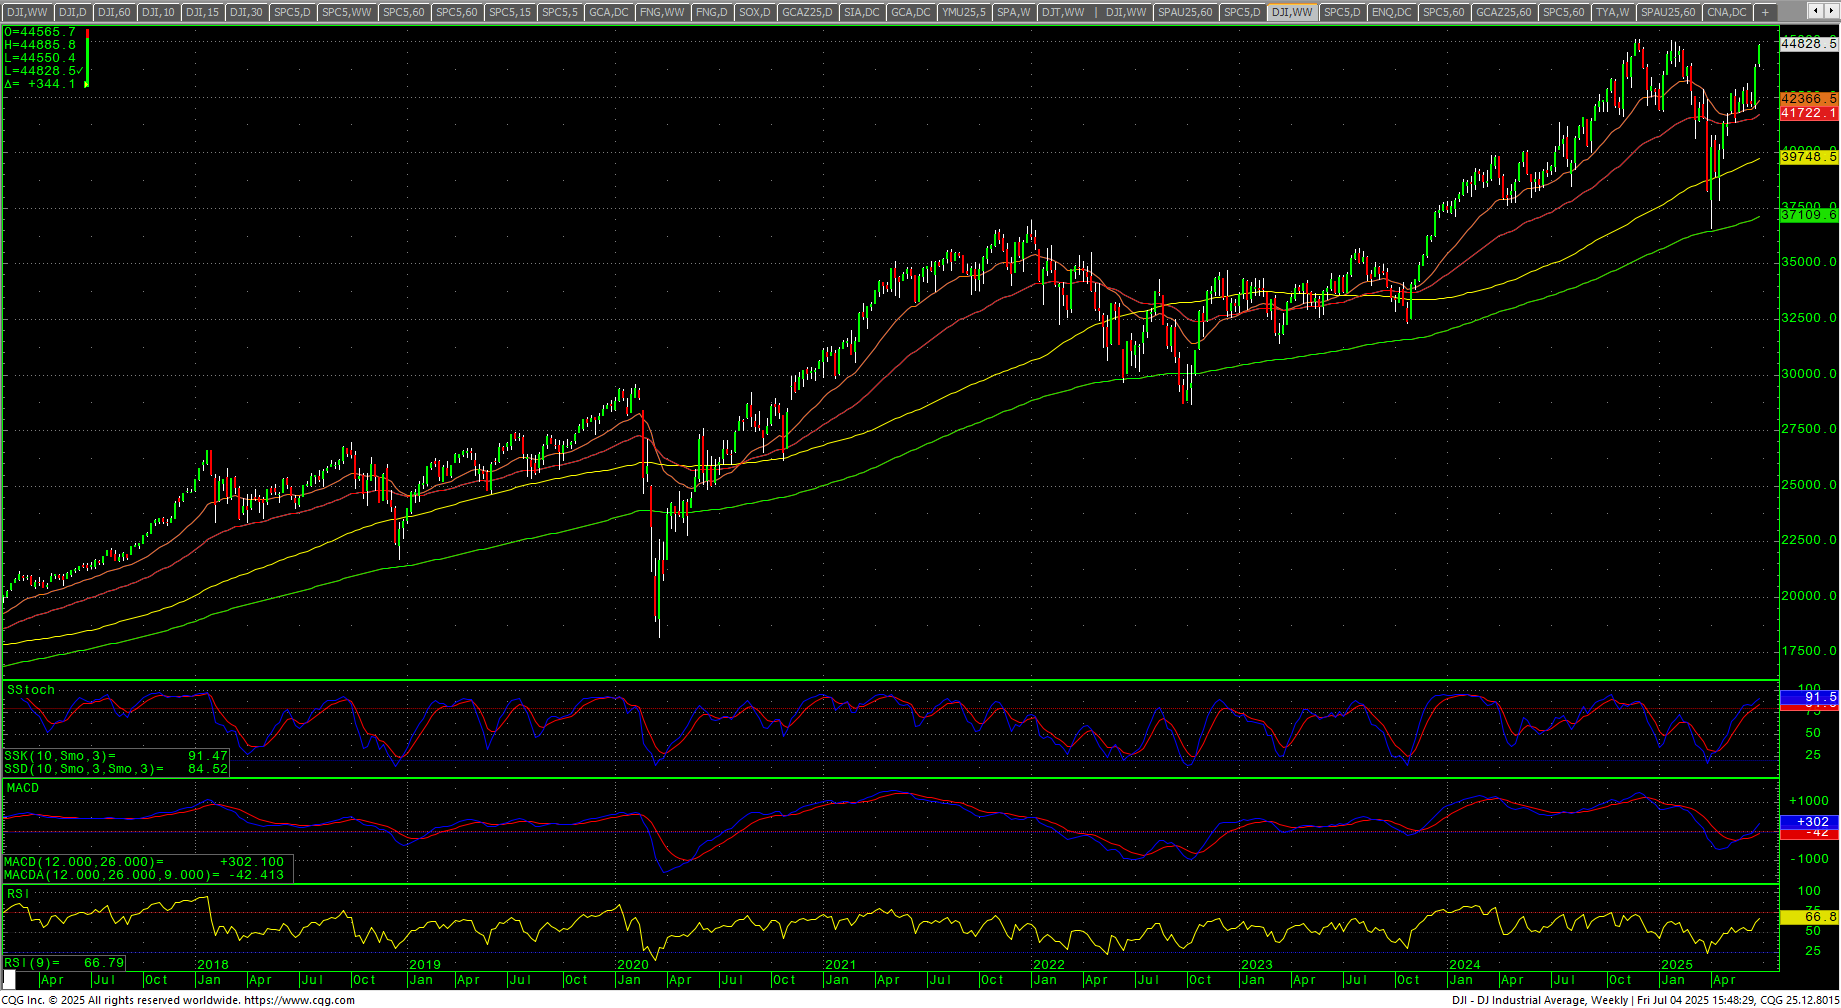
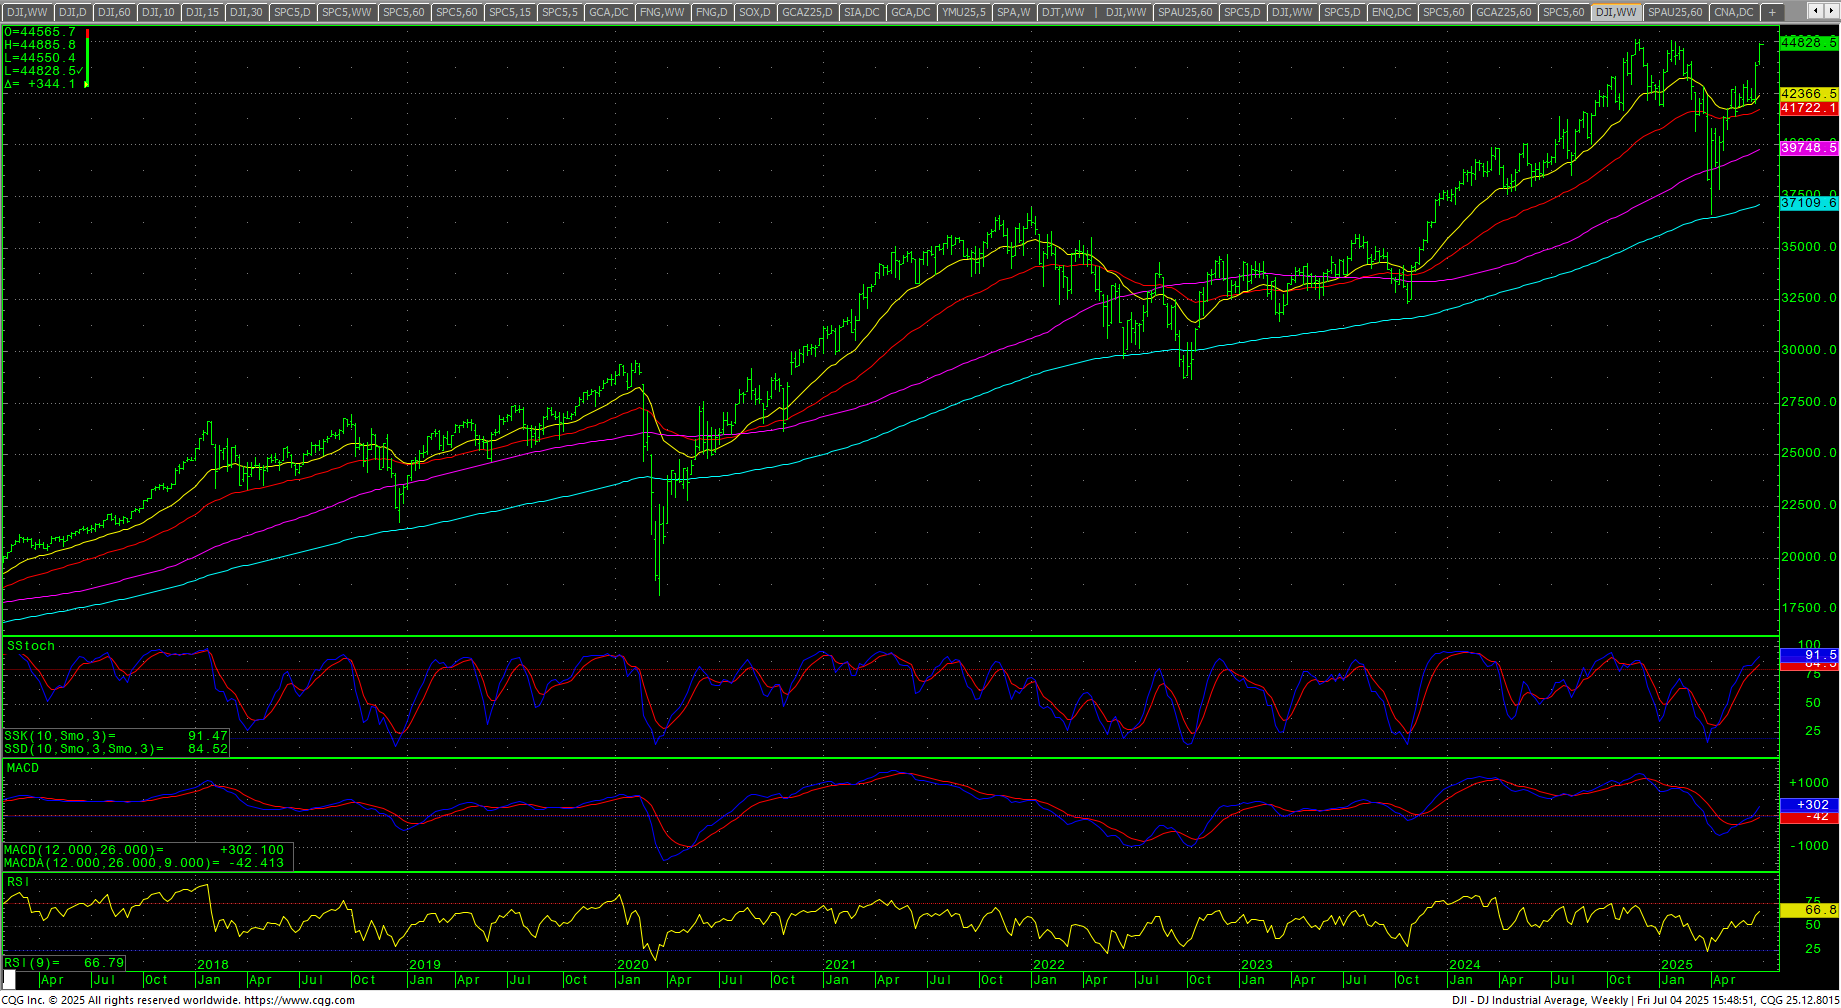 The Dow closed the week up +2.29% on the top of the range, settling at the second highest weekly close on record. The market is positioned for a test of the ATH set in November 2024. The weekly stochastics are still in an uptrend but have reached overbought numbers. The daily stochastics are up and have reached overbought readings. The MACD is overbought but set new highs with the rally. The RSI is at an extreme overbought reading at 82.75. The 200-day MA starts the week at 41939.40 and is trending higher and nearing a record high.
Dow Jones Industrial Average Weekly Candles
Dow Jones Industrial Average Hourly H-L-C
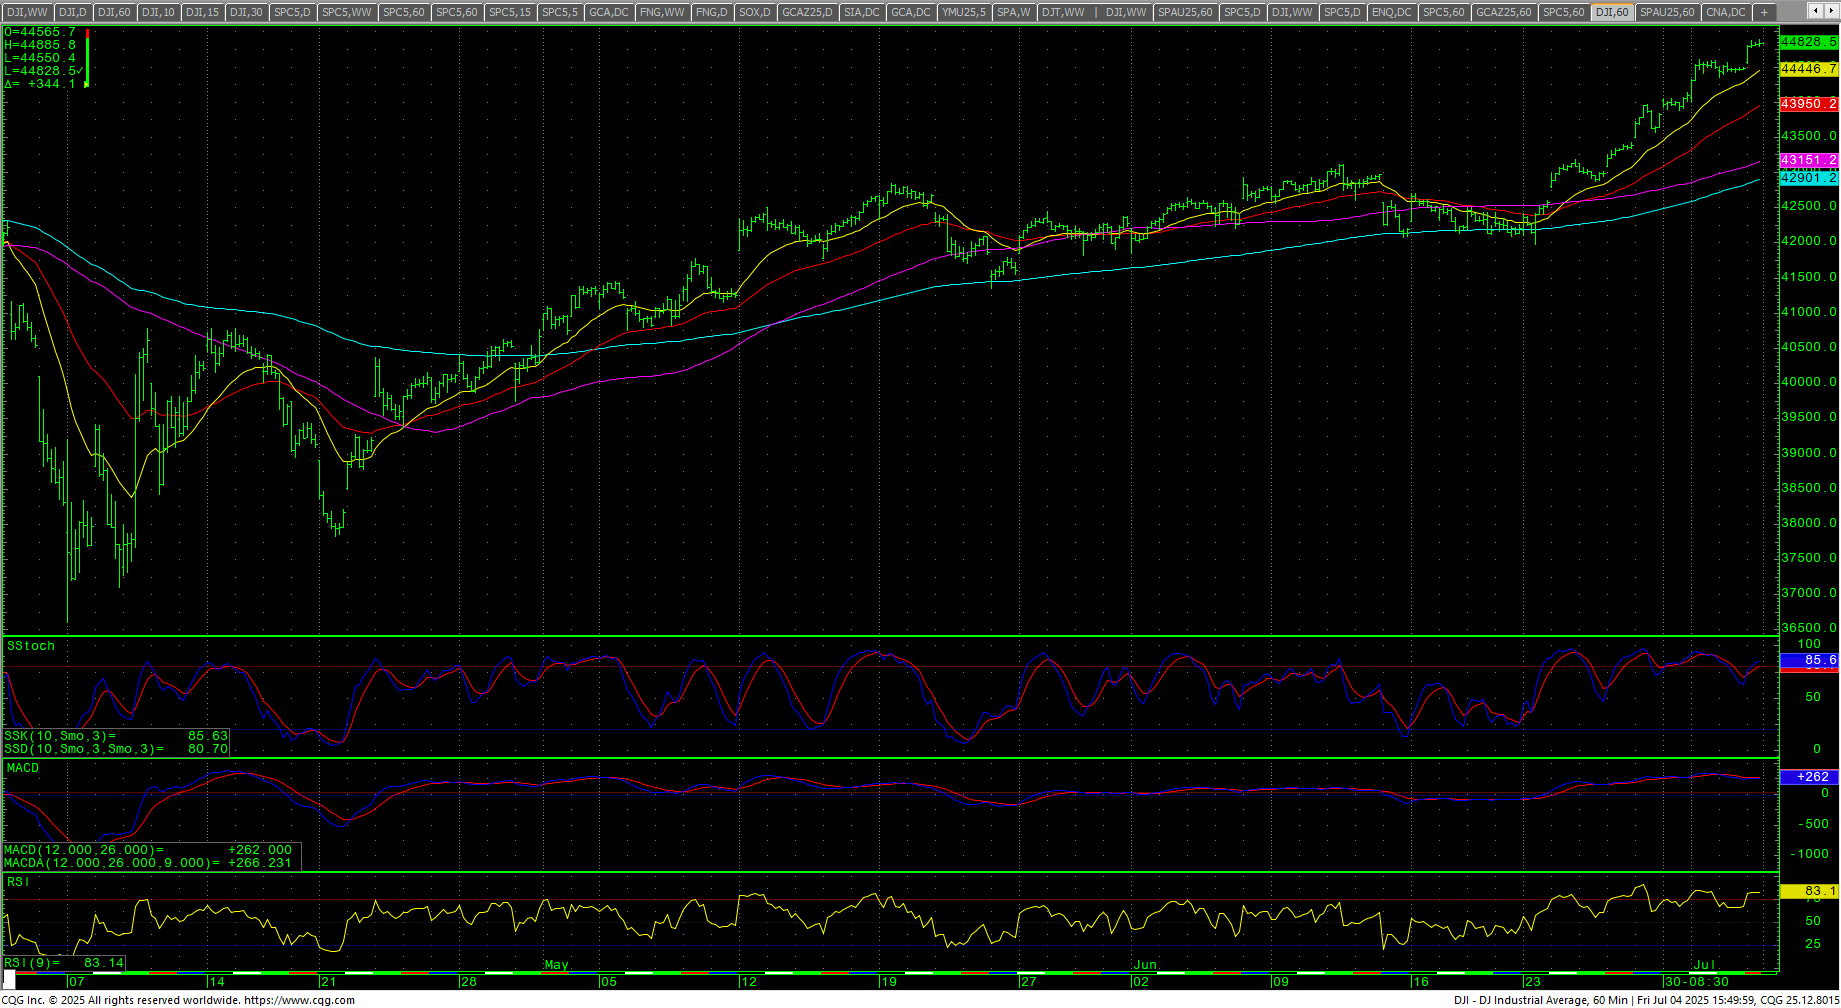 The hourly is overbought with bearish divergence on Thursday’s close. Prices are positioned for a test of the all-time highs at 45050/45054/45074. Closes over 45074 opens counts toward 45244 and 45426/45450 (Fibonacci target) and resistance at 45306 and 45378. Rallies with closes over 45450 will reopen longer-term monthly targets in the 47400 level with targets of 46568 and 46954.
Support is 44462 and 44200. A breakdown under 44200 counts to 43988 with counts to near-term pivotal support at 43776/43773. Closes under 43773 should test 43433/43430 with counts to critical near-term support at 43090/43085. Closes under 43085 should minimally test 42707/42666. A breakdown under the 42666 area will set up 42236/42187. Under 42187 sets up 41725. Closes under 41725 are bearish to 40758 with full potential to critical support of 39772/39668.
| Resistance | Support |
|
|
S&P 500 Cash Index: SPX
S&P 500 Index Weekly H-L-C
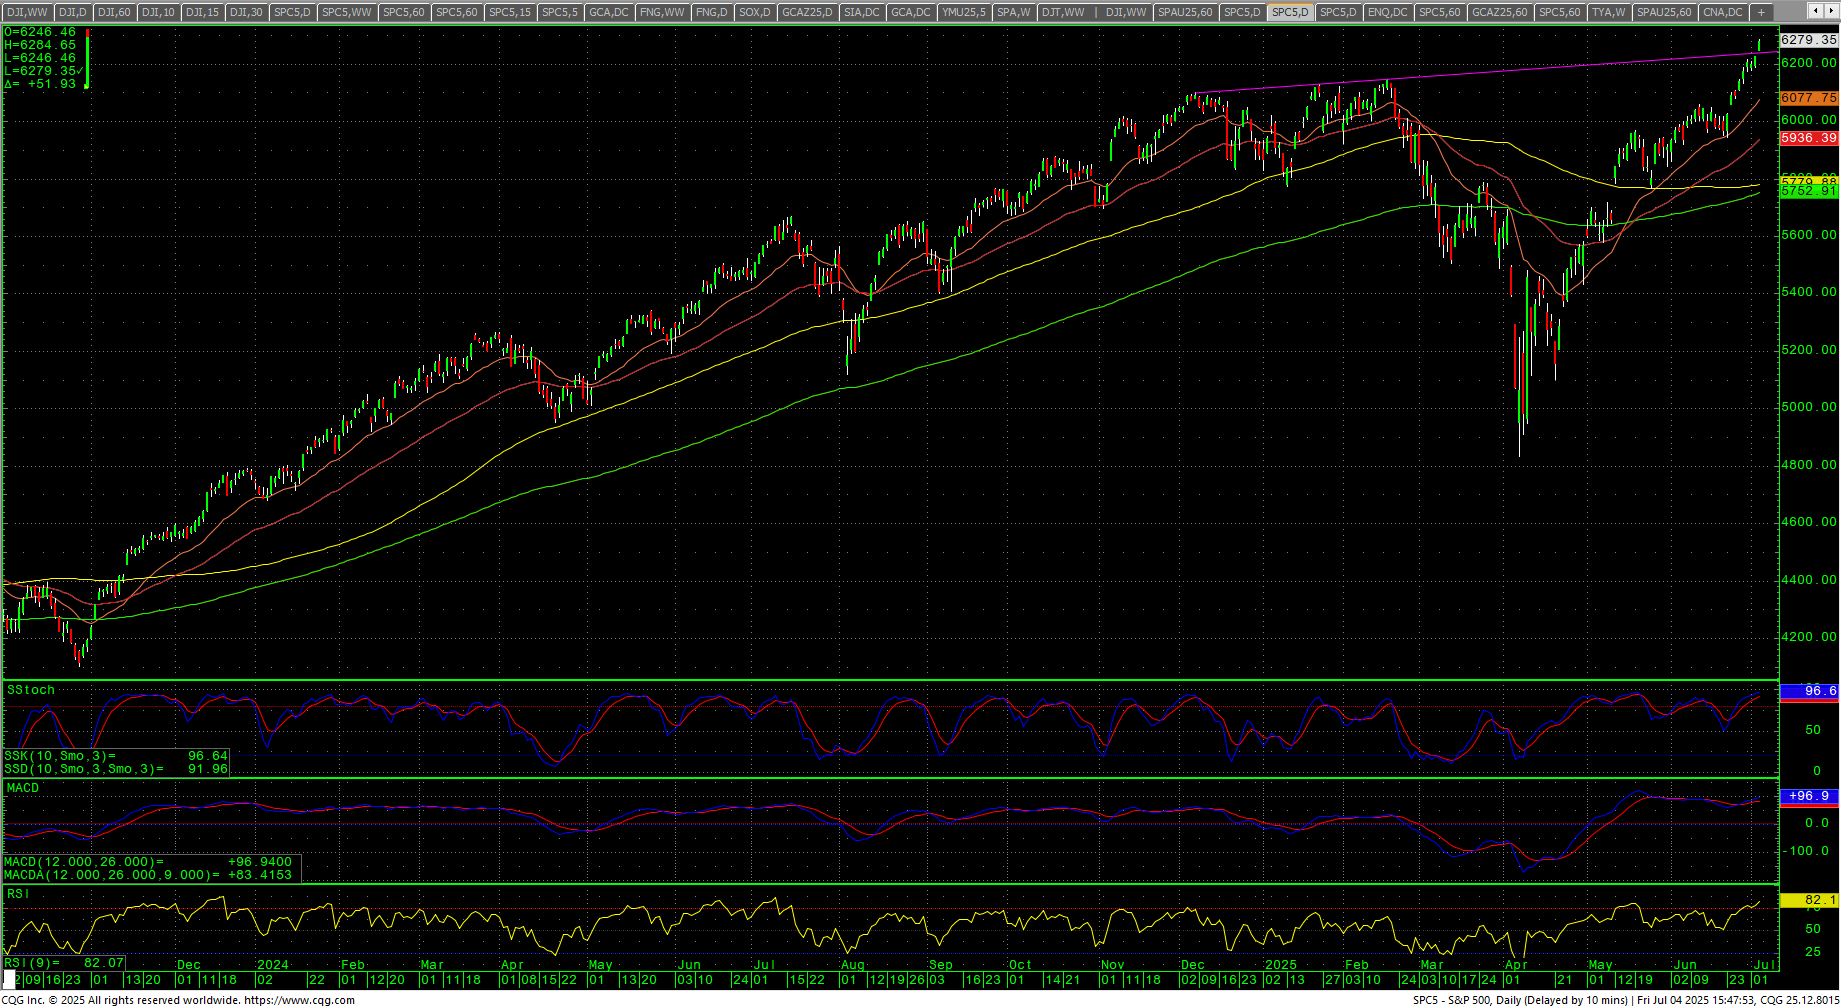
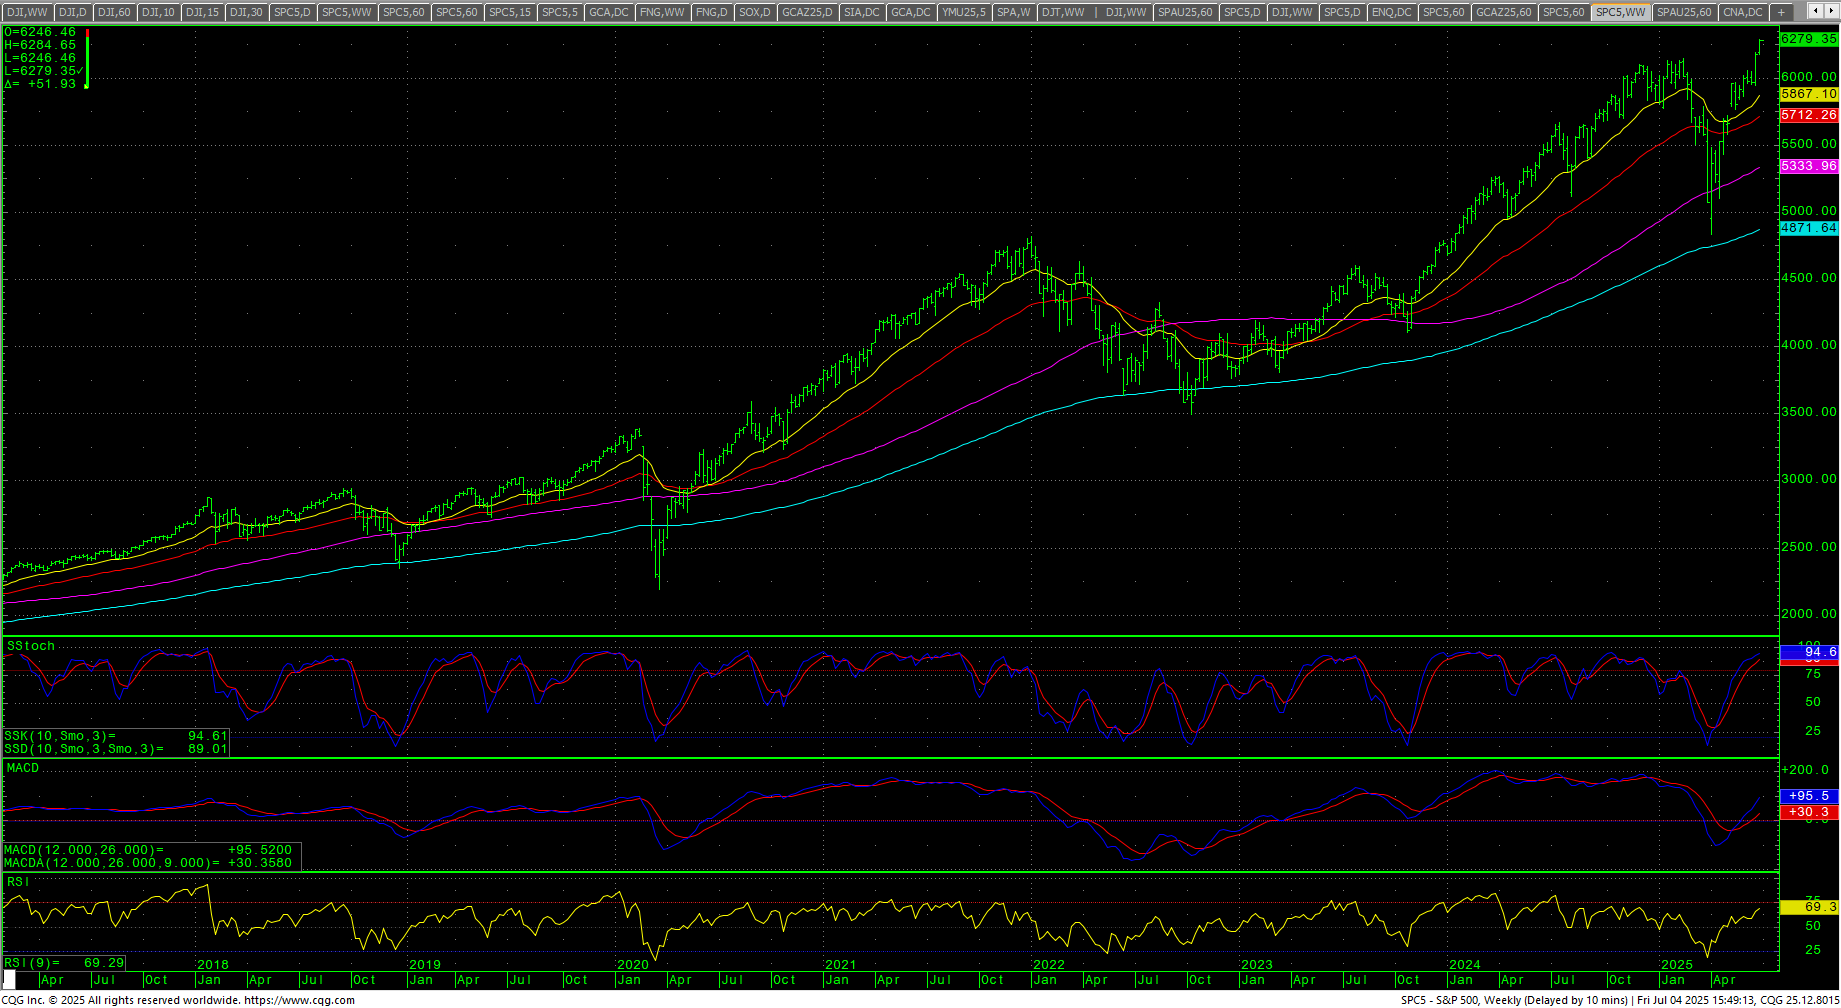 The S&P continued the surge to new highs as prices gapped higher on Thursday, taking out a trendline that everyone was watching and prices surged toward the next massive call wall for the futures at 6300 with a target on the SPX at 6296. The daily is in a vertical move up with all the oscillators pegged at extreme overbought levels and sentiment is in extreme greed. The weekly is in an uptrend and reached overbought conditions. The hourly is extremely overbought on Thursday’s close. The 200-day MA is 5752.81 and is trending higher as it sets a new record high.
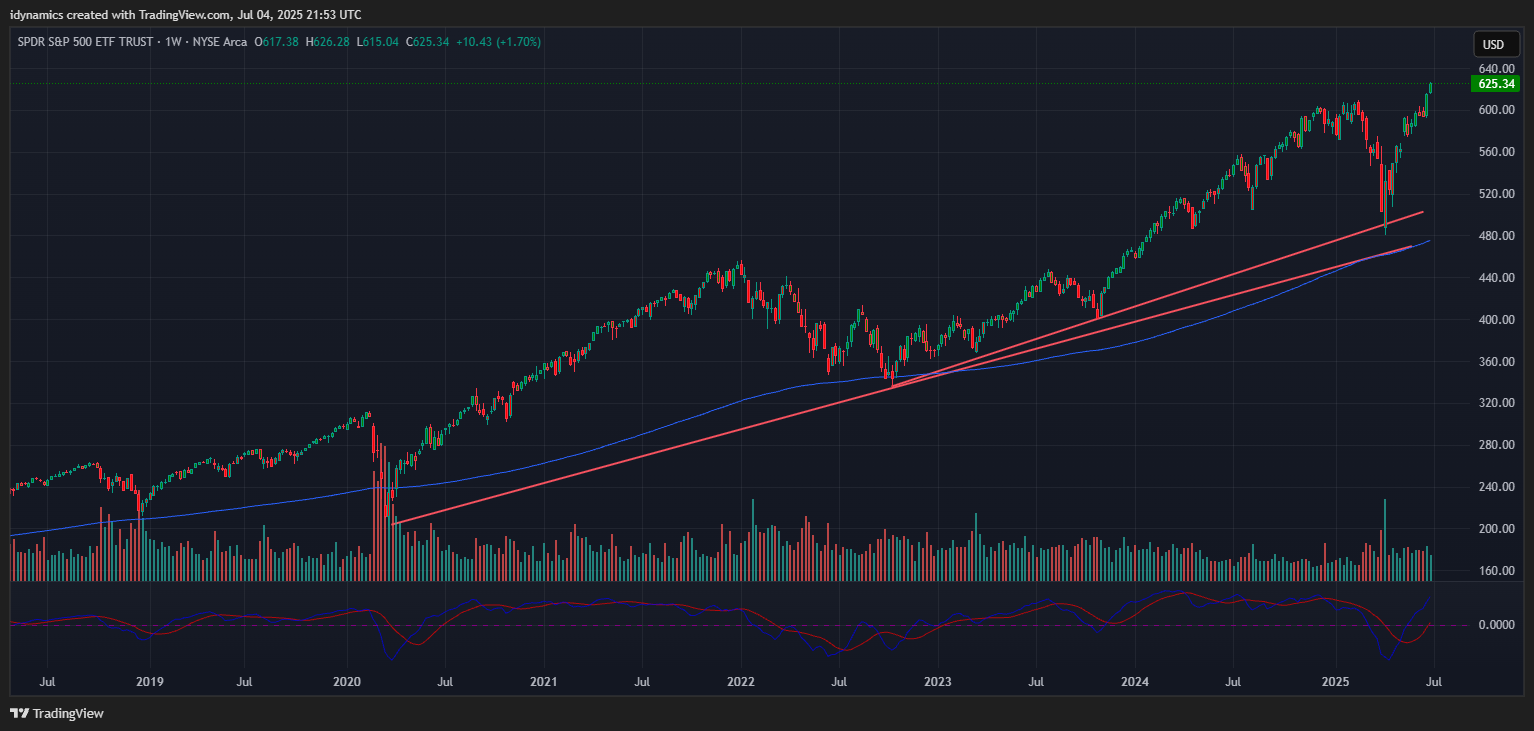
SPY Weekly Candles
 Prices moved toward a target at 6296 and closed just under that area. Continued rallies with closes above 6296 can carry to 6368 with counts into the 6440 area. Closes over 6440 will open counts to 6584. A breakout over 6584 sets up 6638 and 6692. A breakout with closes over 6692 sets up 6764 and 6800. Closes over 6800 can carry to 6872 and 6908.
S&P 500 Index Hourly H-L-C
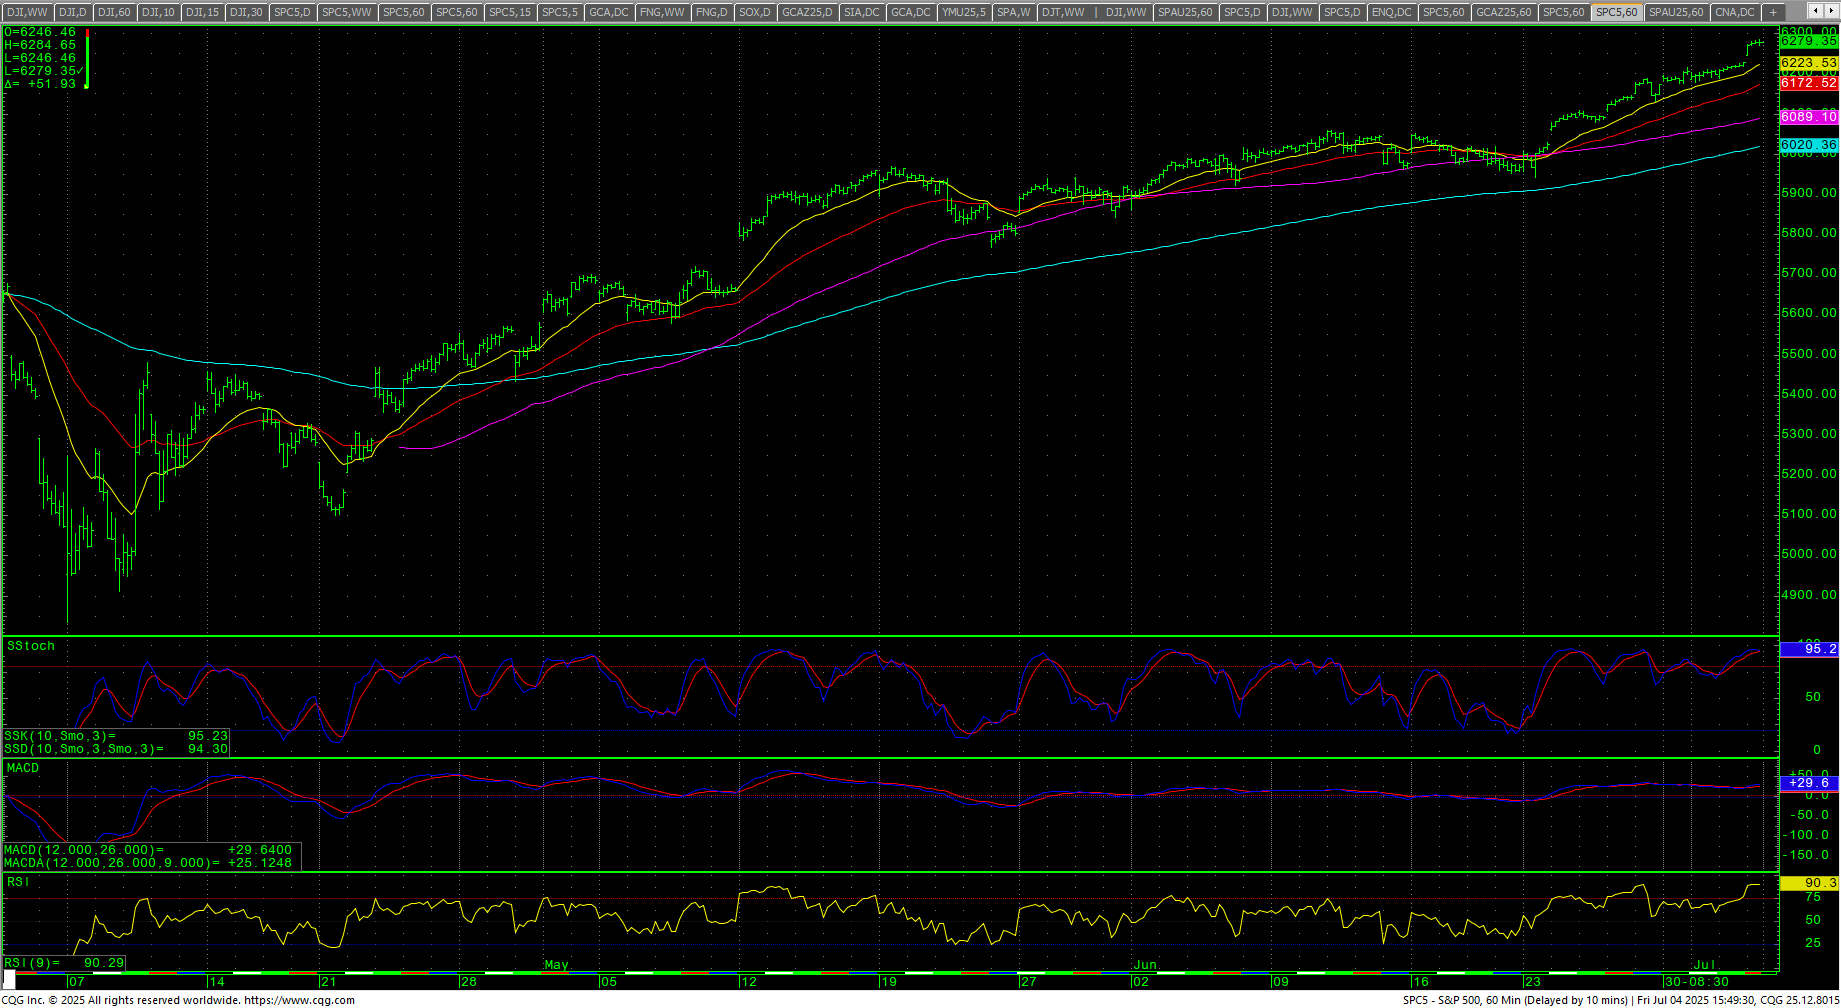 Support is 6234 and 6205/6203. A move under 6203 sets up 6178/6175 with counts to 6152/6150. Closes under 6154 should test 6113 with potential to pivotal short-term support against the 6073/6070 area. A breakdown under 6070 sets up 6028/6023 with full counts to 5943. Closes under 5943 are bearish to 5730, 5552 and 5511 with counts to critical short-term support at 5356/5348. Daily closes under 5348 are bearish for a move to 5157. Closes under 5157 will open counts to 4885 and 4839 and full counts to 4521/4515. Closes under 4515 can see 4165/4127.
| Resistance | Support |
|
|
Charts courtesy of CQG, Inc., CNN, Koyfin, Trading View and AAII