
TECHNICAL ANALYSIS (by Intraday Dynamics)
Major Indices Week of July 11, 2025
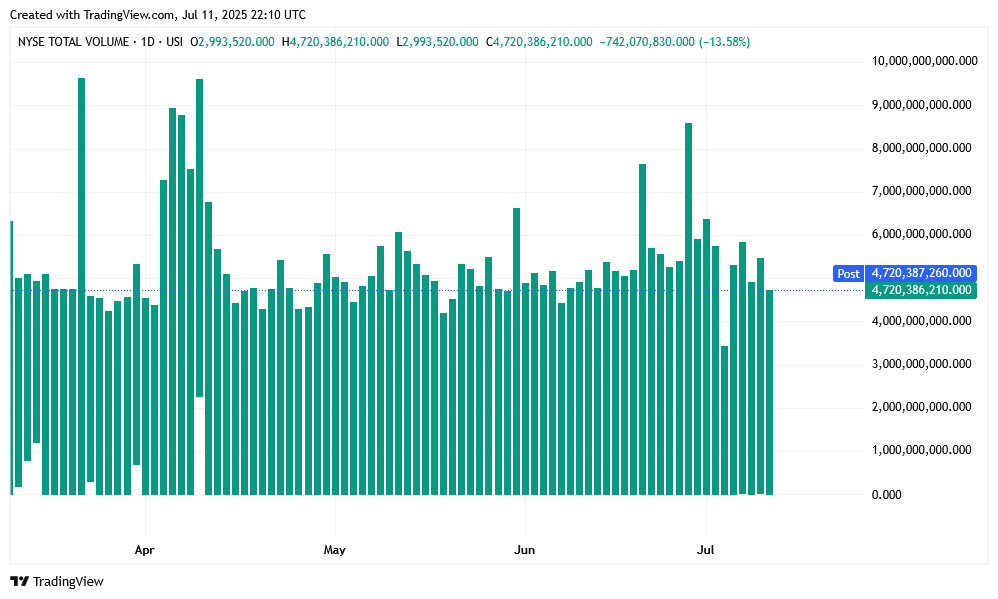
 NYSE Volume

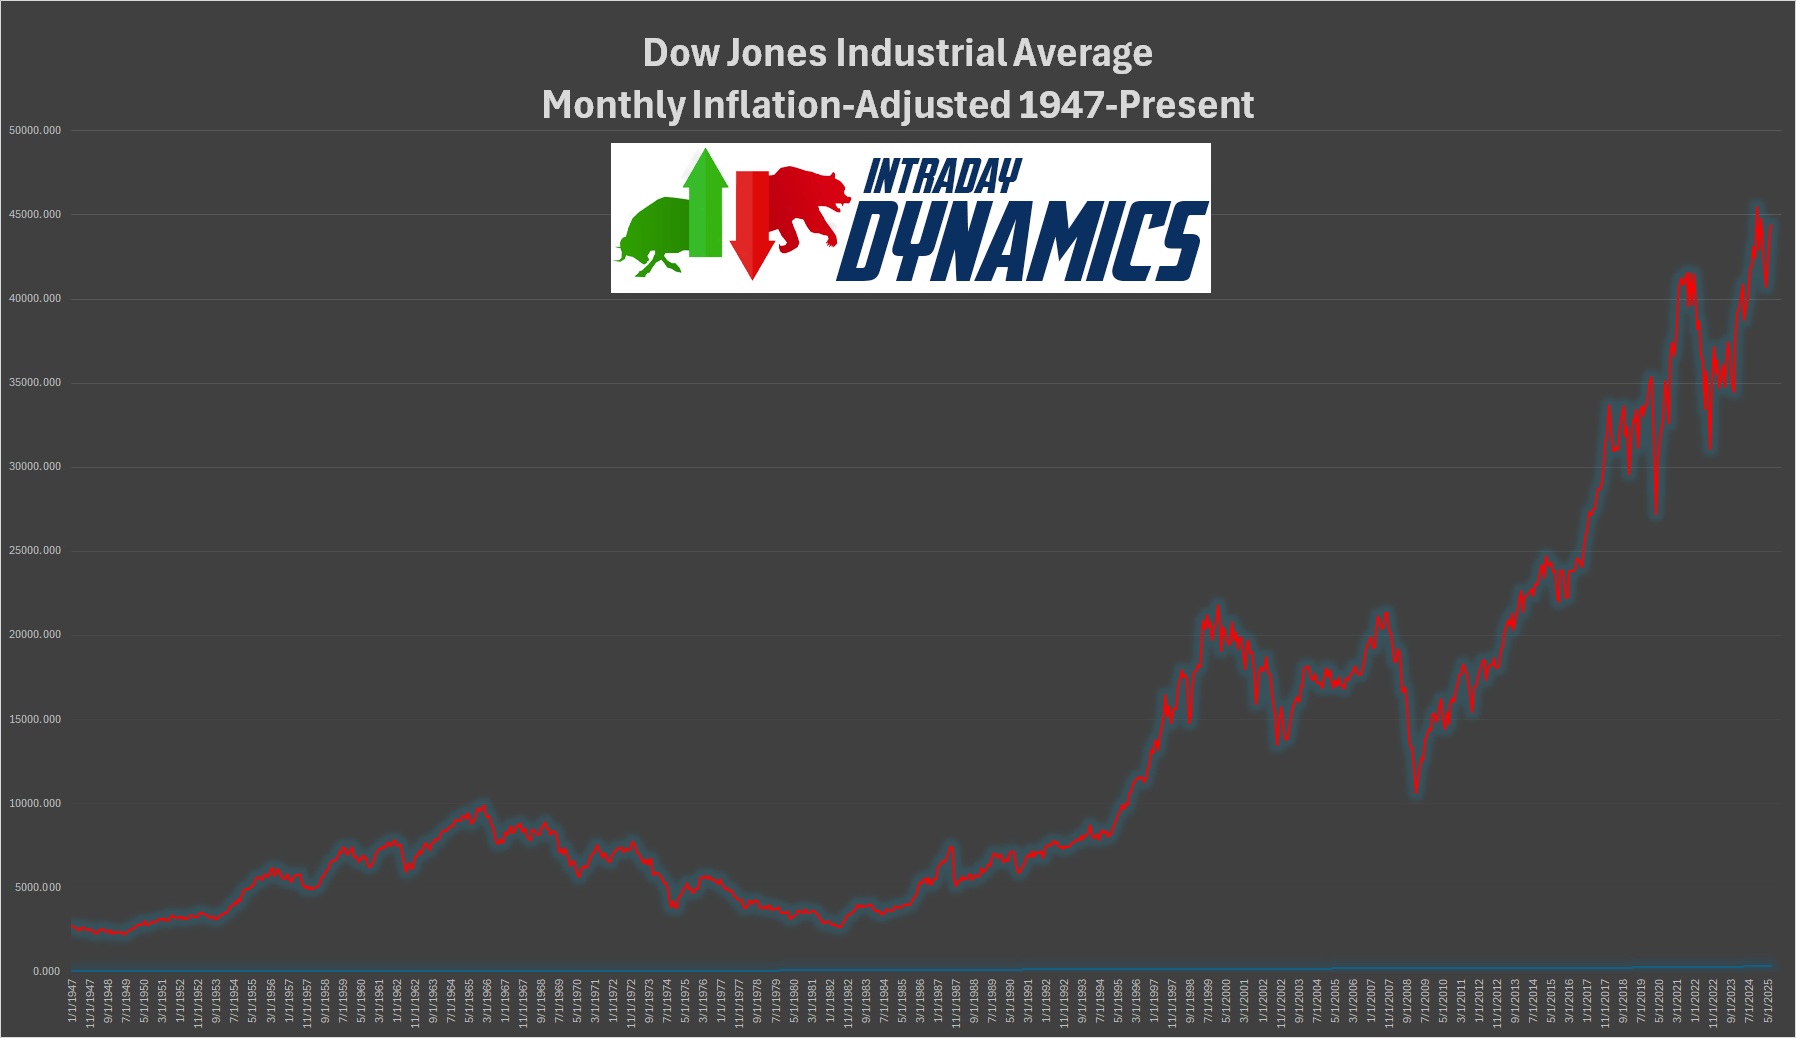
 DJIA Inflation-Adjusted Monthly
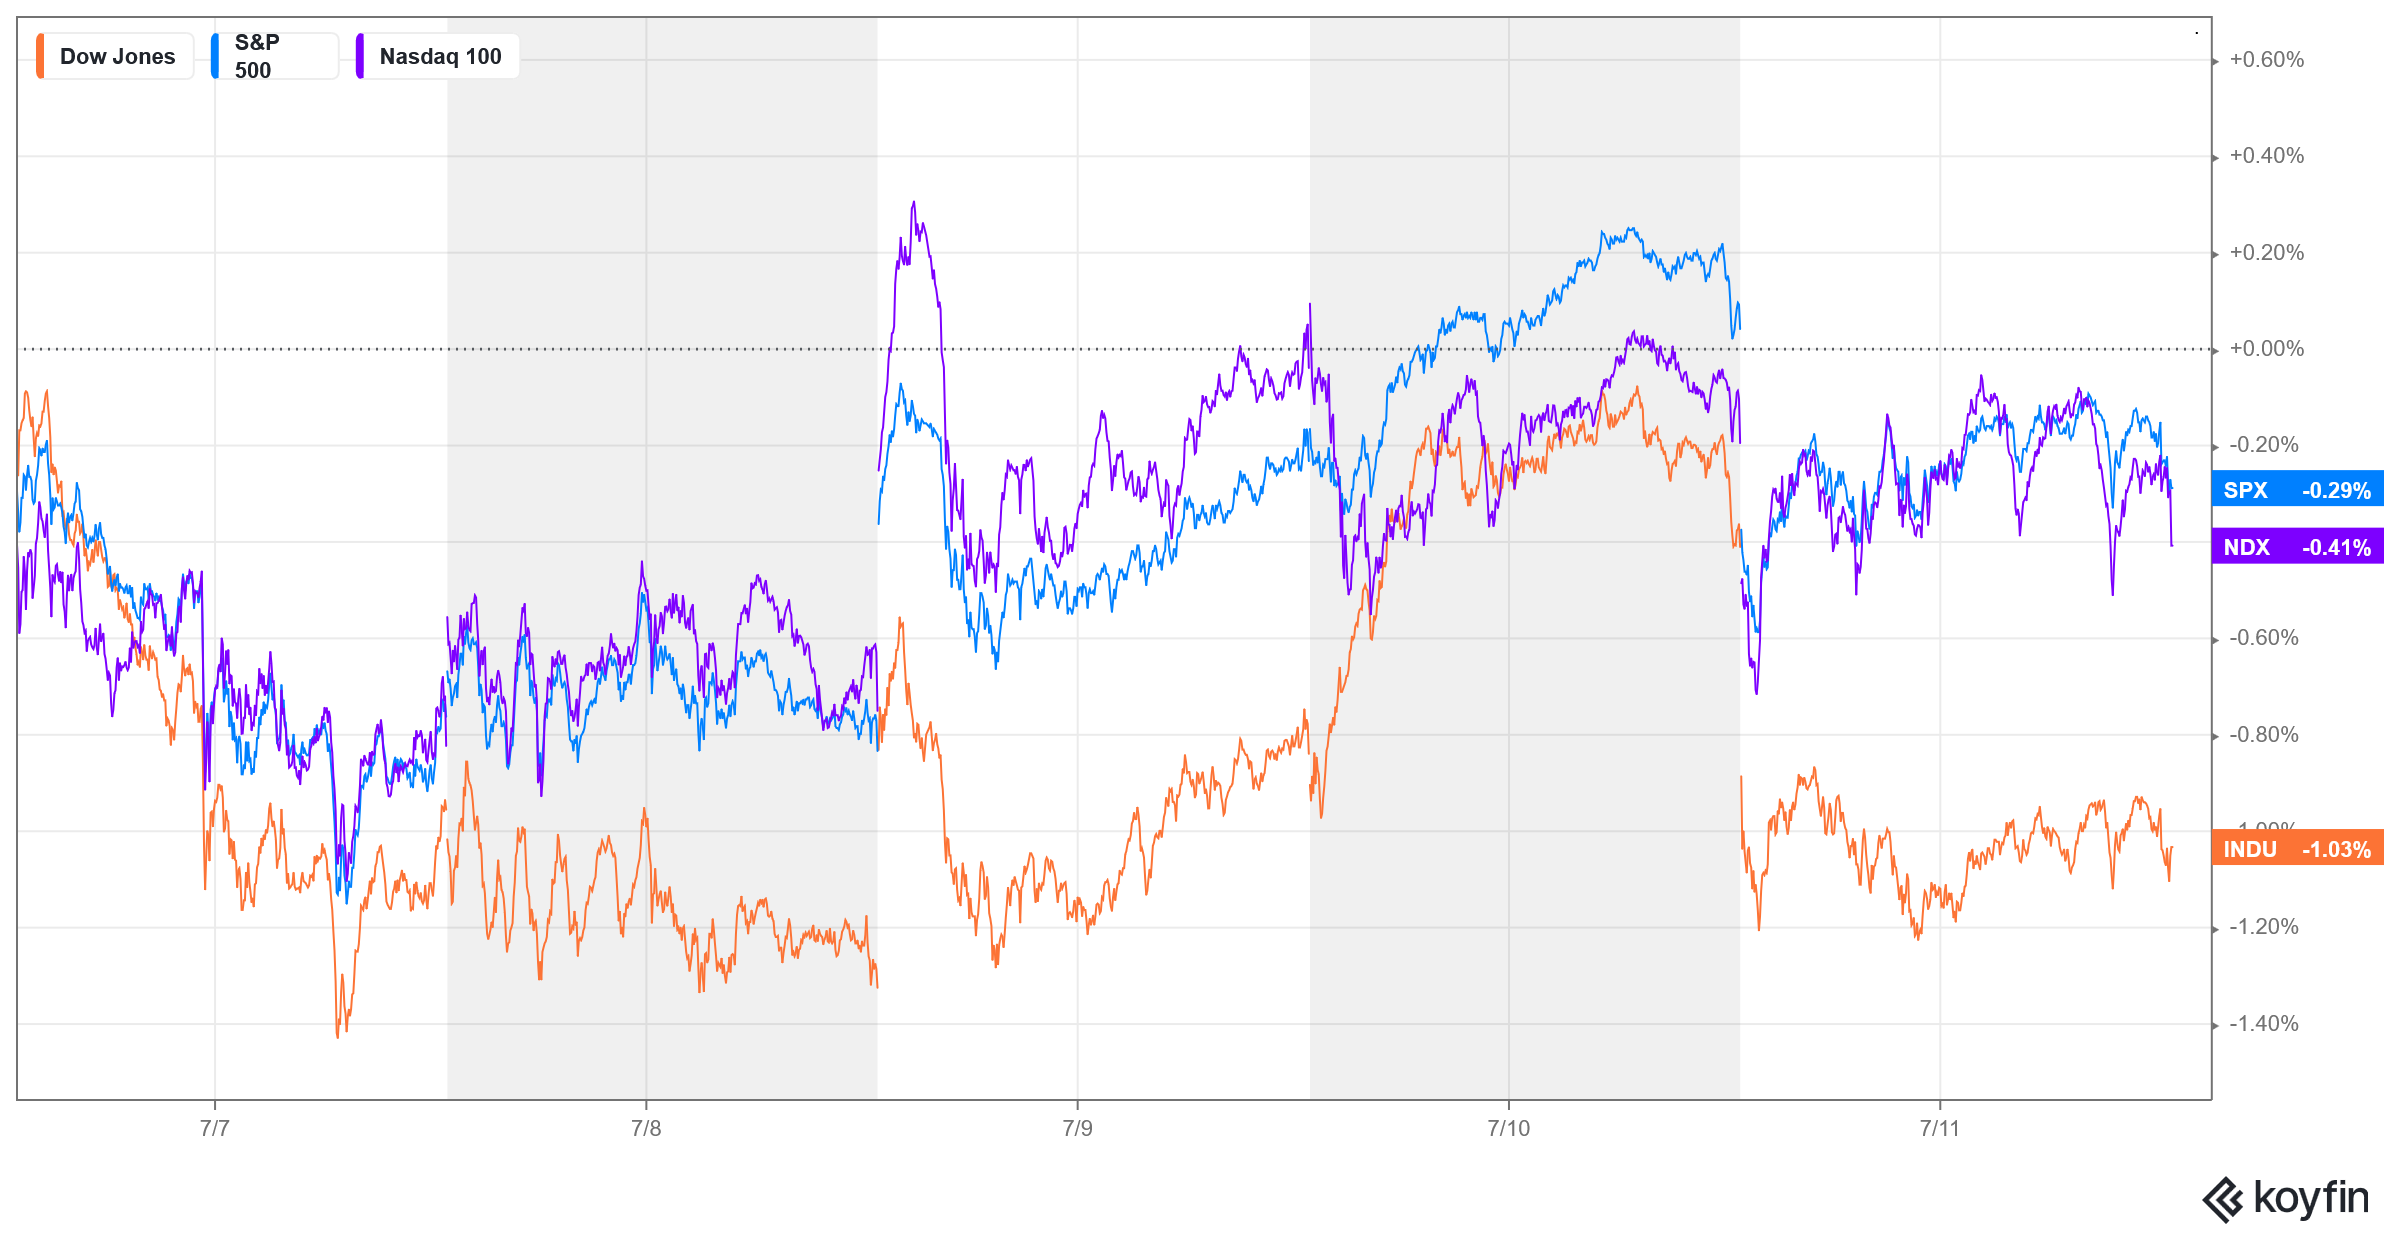
 Stocks closed out the week mostly lower across the board. Prices took a dive early in the week on the return of Tariff Man. Then Wall Street banks issued memos telling investors to ignore TACO Trump, and tech stocks and the SPX moved into record highs before retreating late in the week on renewed tariff threats and rumors that Jerome Powell would quit the Federal Reserve.
Now it looks like a standoff between hedge funds which have been caught under invested in the past month and the TACO meme. There have been close to thirty (30) about faces on tariffs since Liberation Day and the new date of August 1st happens to coincide with the critical cycle timing kicking off in August.
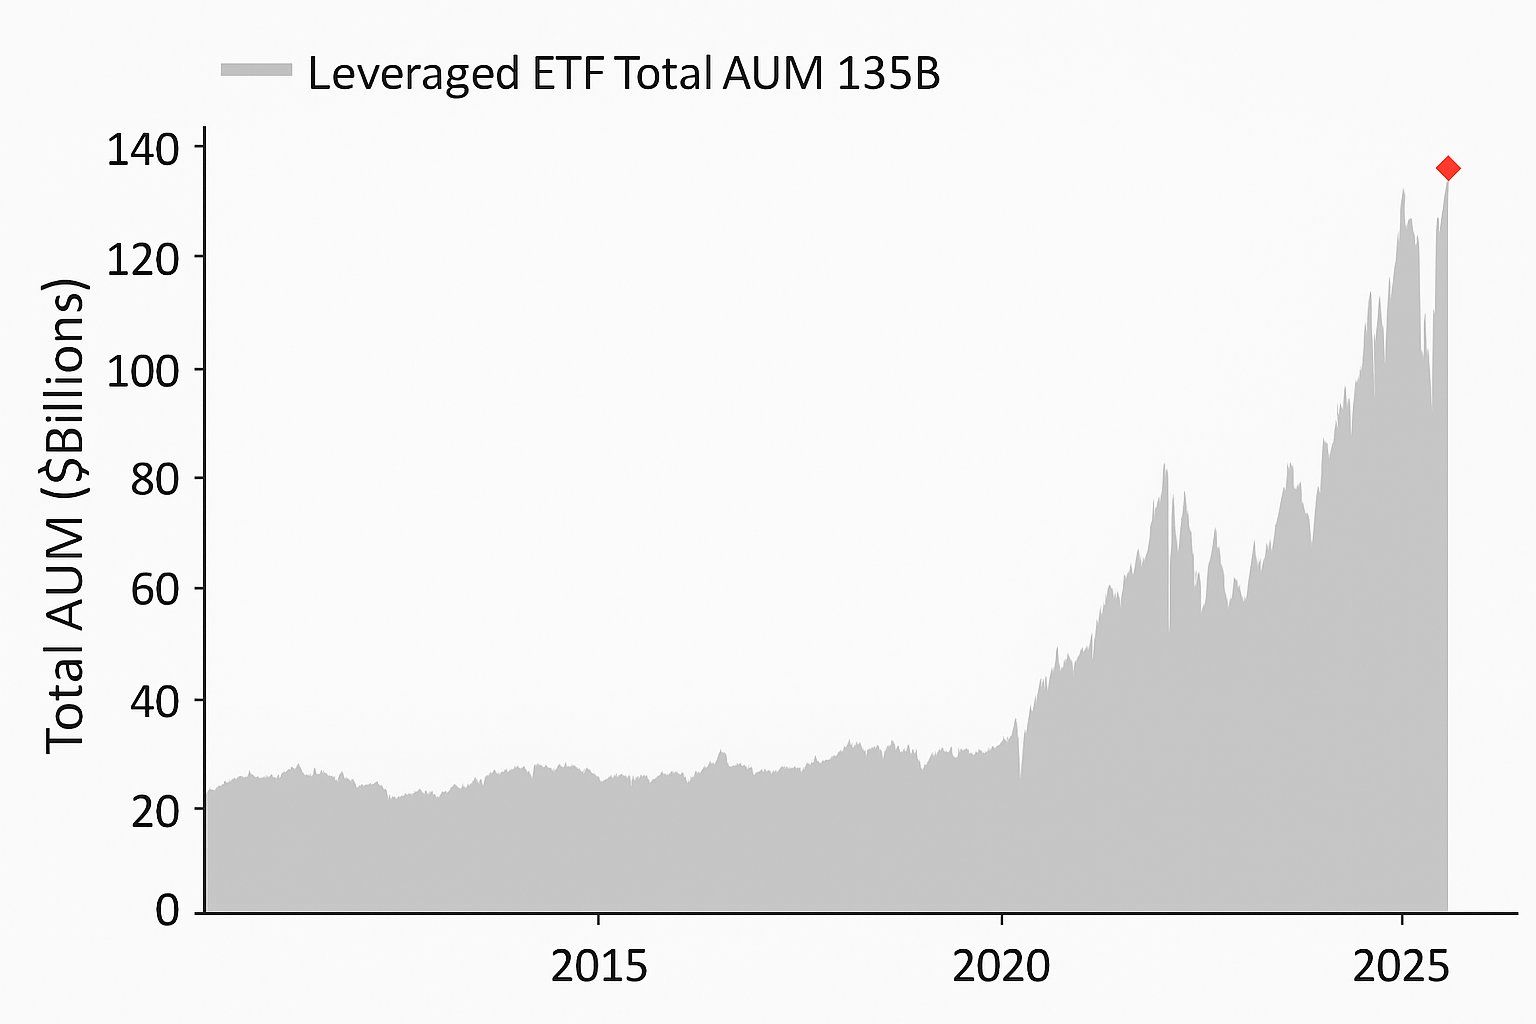
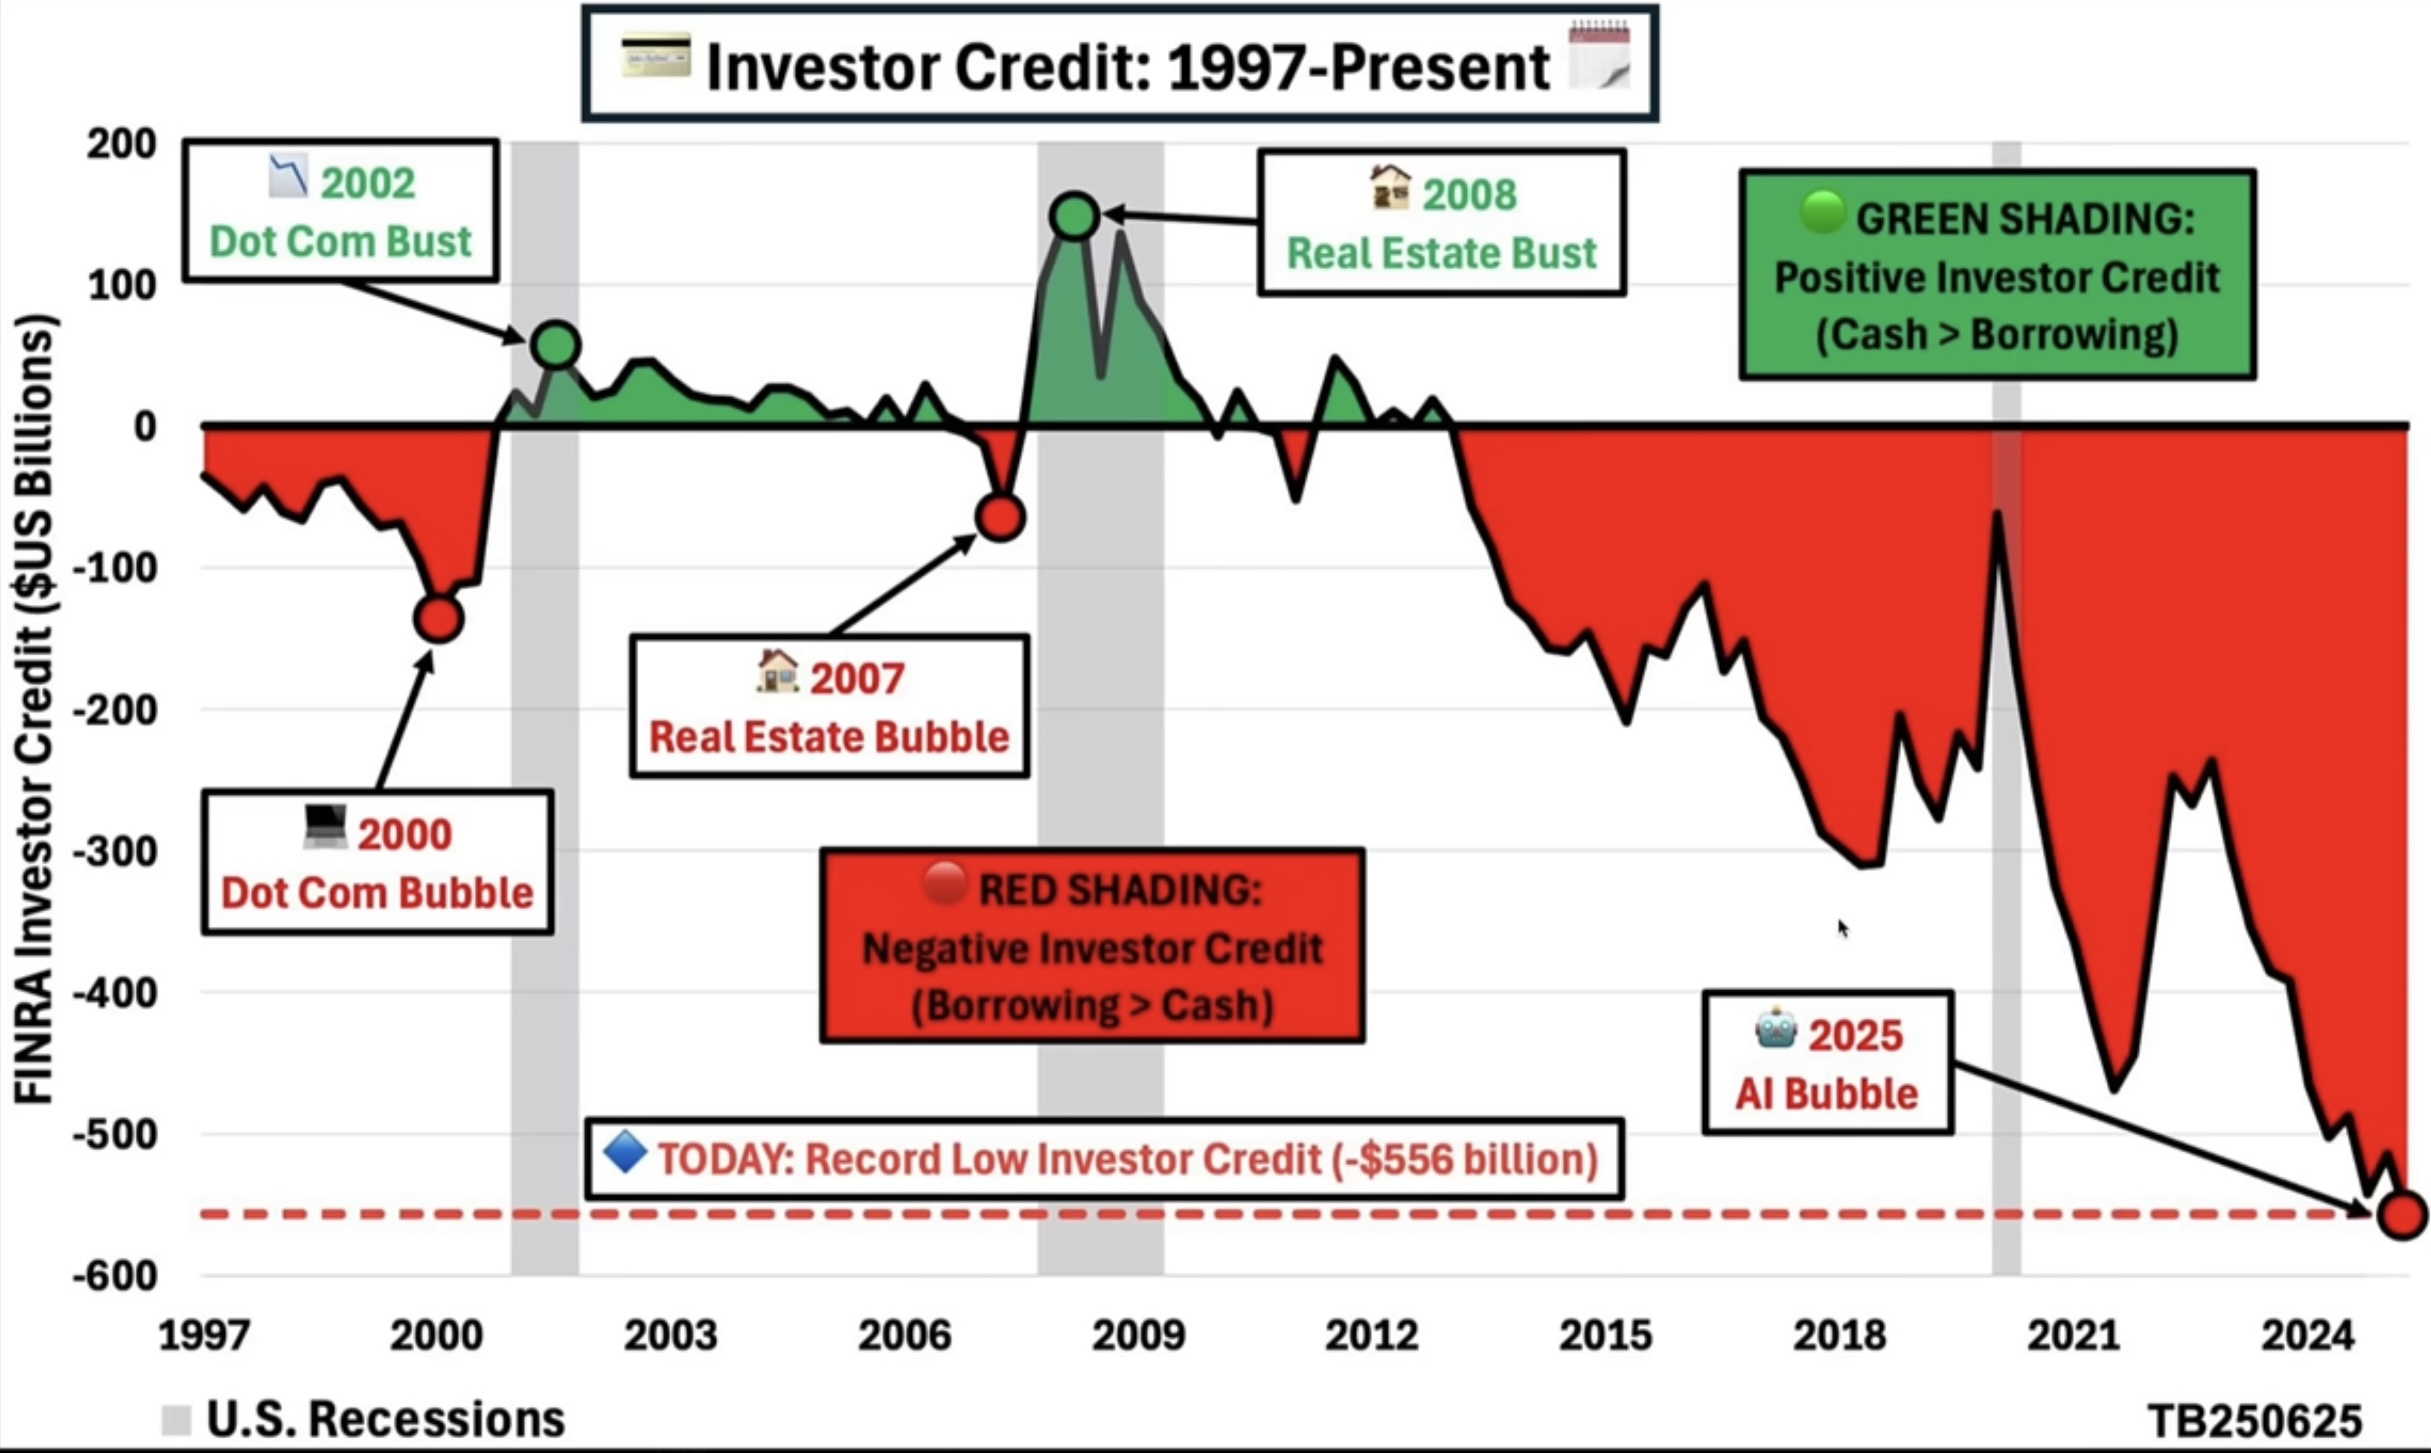
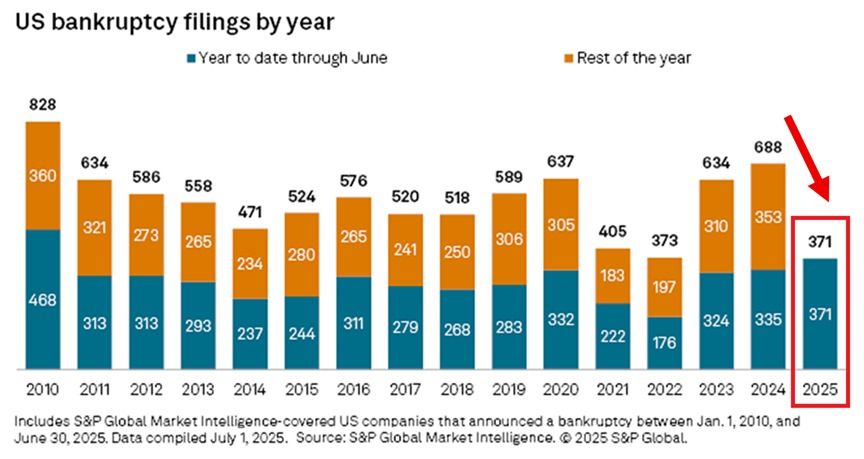
Leverage is at insane levels right now, with ETFs hitting record highs and record inflows in crypto the past week. Calls are radically outweighing Puts again with massive call walls in the SPX between 6300/6400. In addition, the first half of 2025 has seen the highest number of bankruptcies since 2010.
 Sentiment remains primarily in extreme greed readings. The Buffet Indicator has touched all-time records and dipped only slightly to +208.7%.
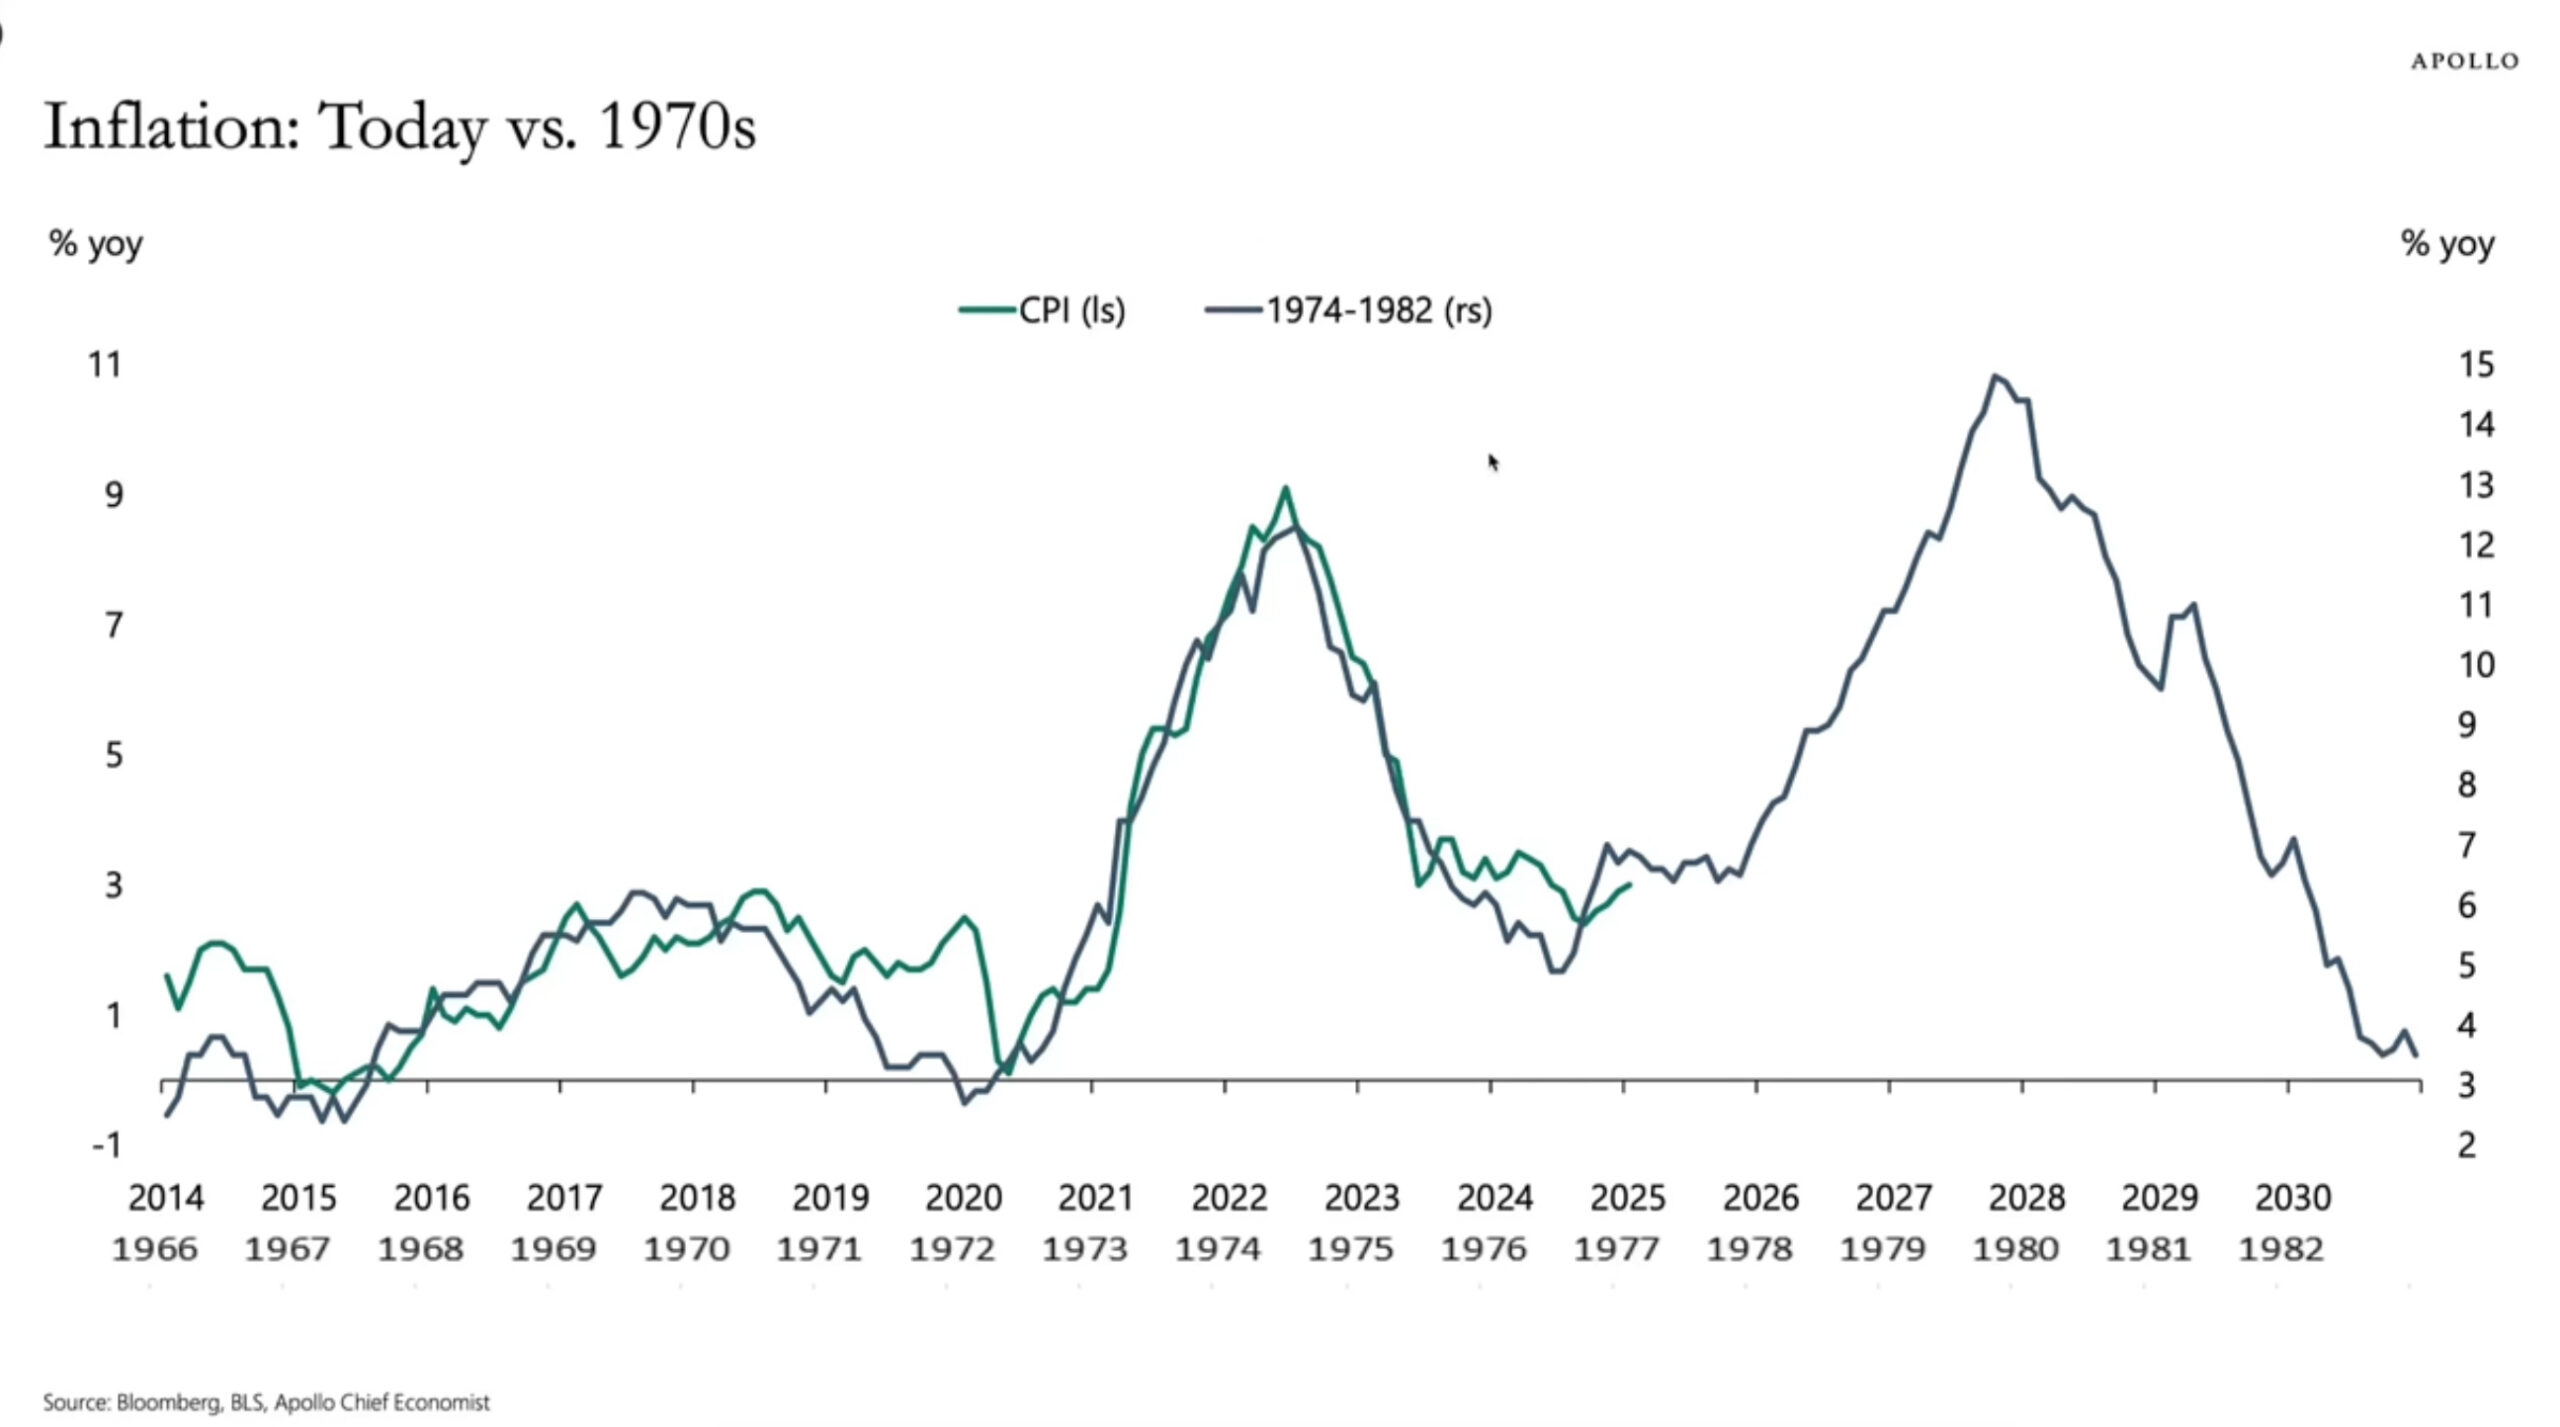
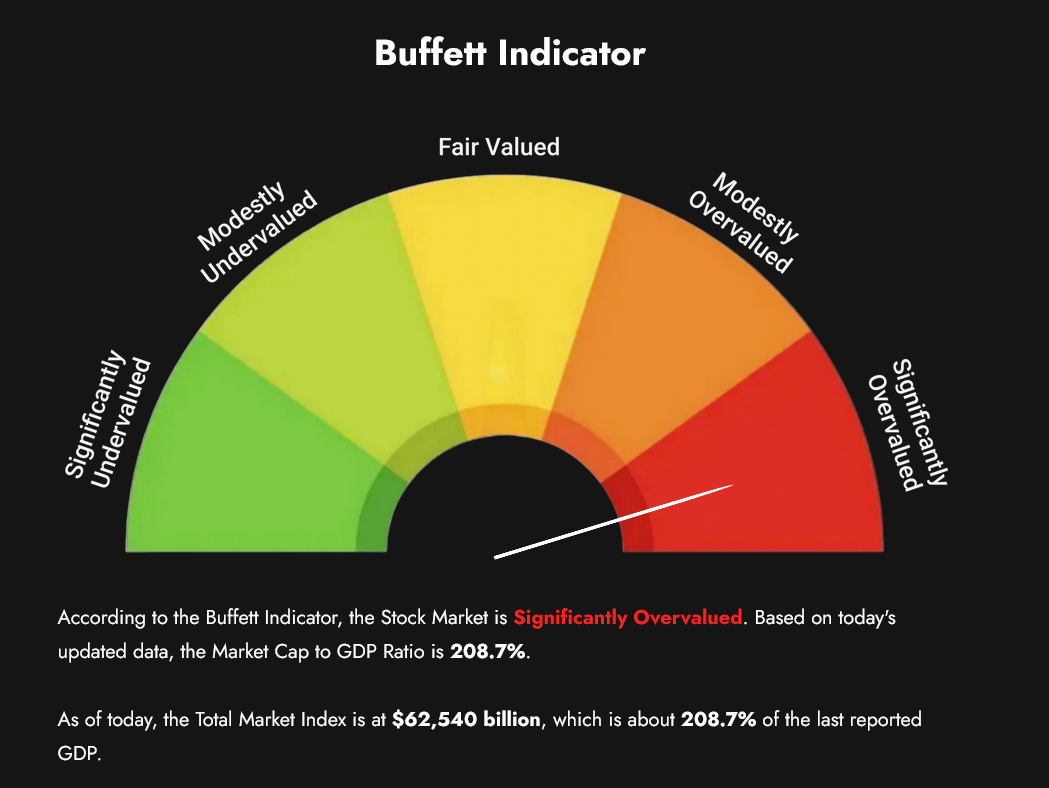 Is there a threat of renewed inflation if Tariff Man follows through with the threats this time and doesn’t TACO? Tariffs. Are. Taxes. “Over time, they are a tax on goods. I mean, the tooth fairy doesn’t pay ’em! And then what? You always have to ask that question in economics. You always say, ‘And then what?’” —Warren Buffet
 Tourism to the USA is collapsing.

Indonesia has officially become a full member of BRICS during the 17th BRICS Summit held at the Museum of Modern Art in Rio de Janeiro, Brazil. BRICS countries continue to load up on gold. BRICS now includes 20 countries, representing 44% of global GDP
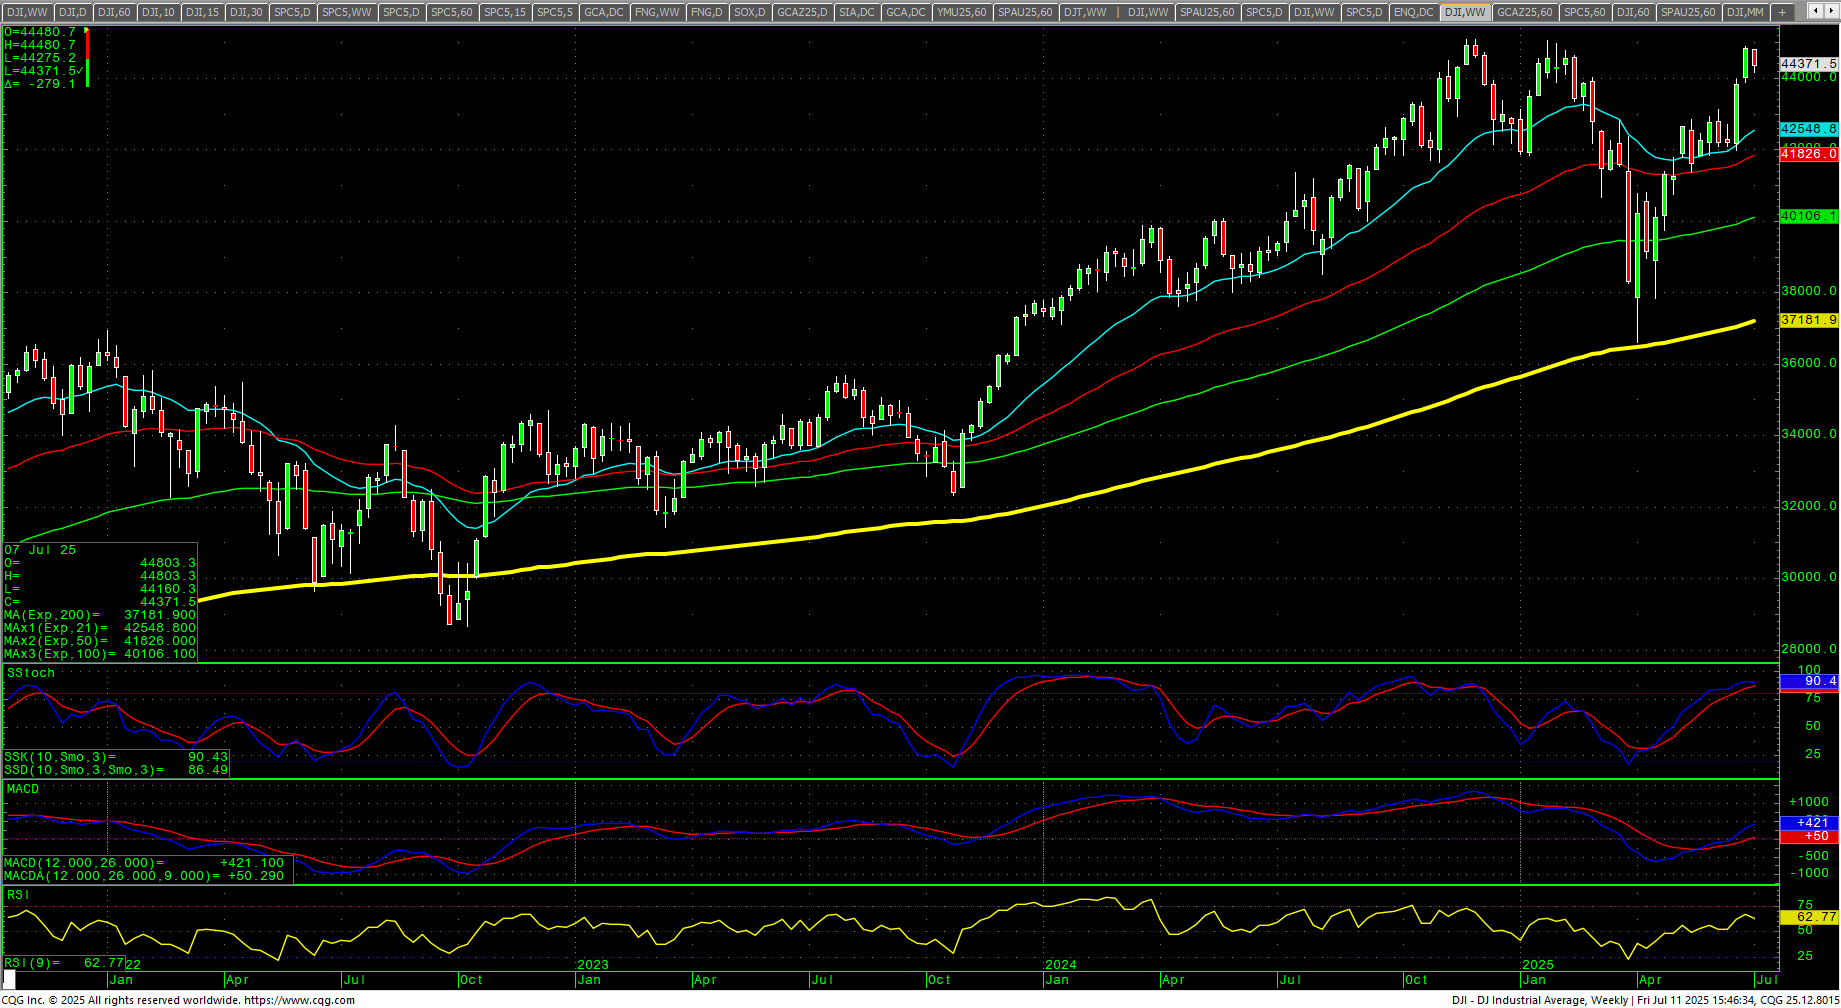
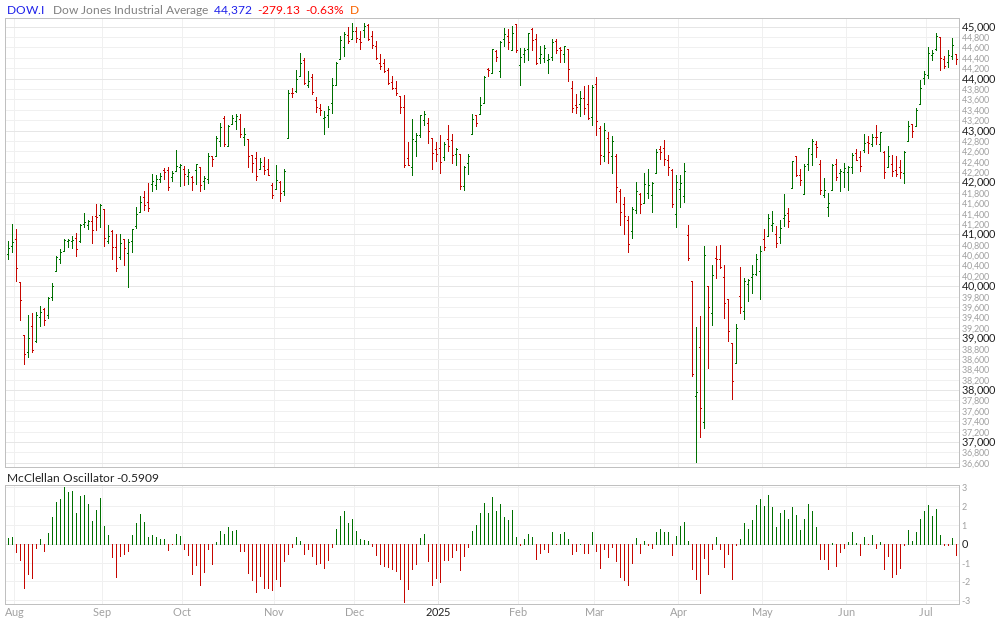
 Dow Jones Industrial Average Weekly Candles

 For an update on the longer-term timing outlook, please see the latest update. We are now in a massive longer-term window where the confluence of long-term cycles begins to collide. This risk for an exogenous event is heightened in this time frame. August is a month where there is strong potential for an exogenous event to occur.
From the recent posts:
The reality is that we are now entering a 6-9 month window of extremely volatile longer-term cycles. August is when things really heat up with the cycles.
S&P 500 Stocks Above the 200-day MA
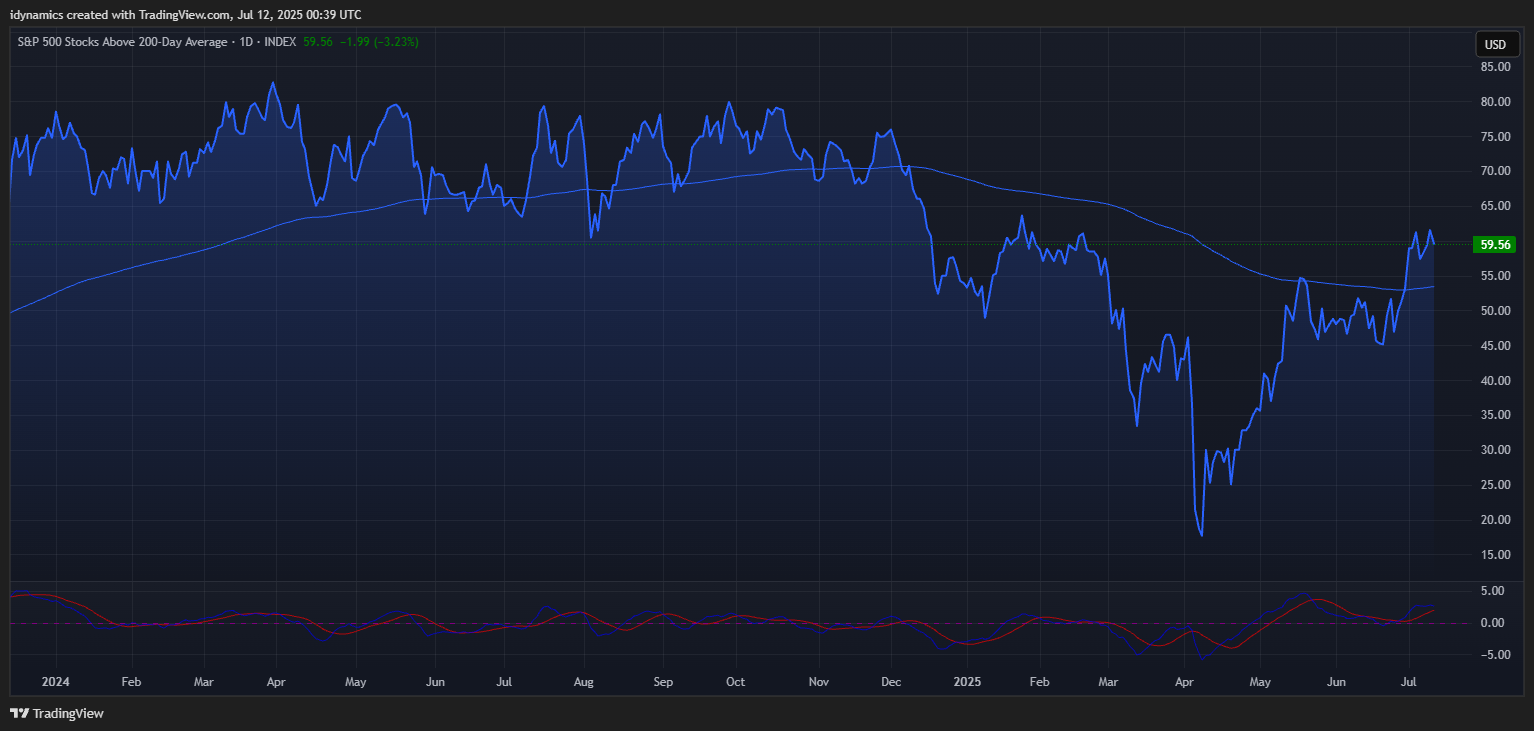 Breadth in all stocks improved last week and the SPX tapered slightly. The percentage of SPX stocks above their 200-day MA ended Friday at 59.56% and is still in a significant divergence. It hit a high of 63.61% in February 2025 and 72.92% in September 2024 and 82.70% in March of 2024.
SPX Daily Candles
 MAGS (Magnificent 7) Daily Candles
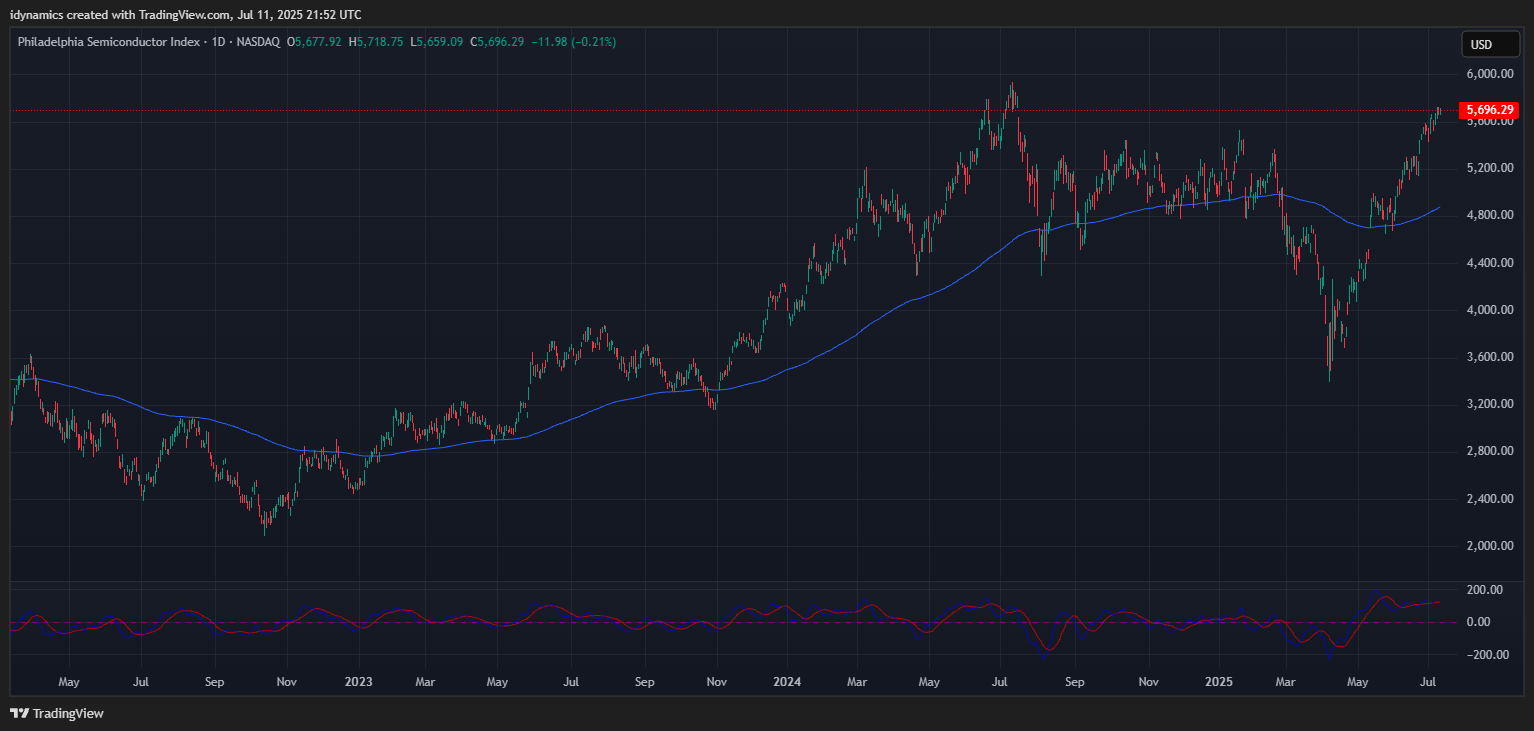
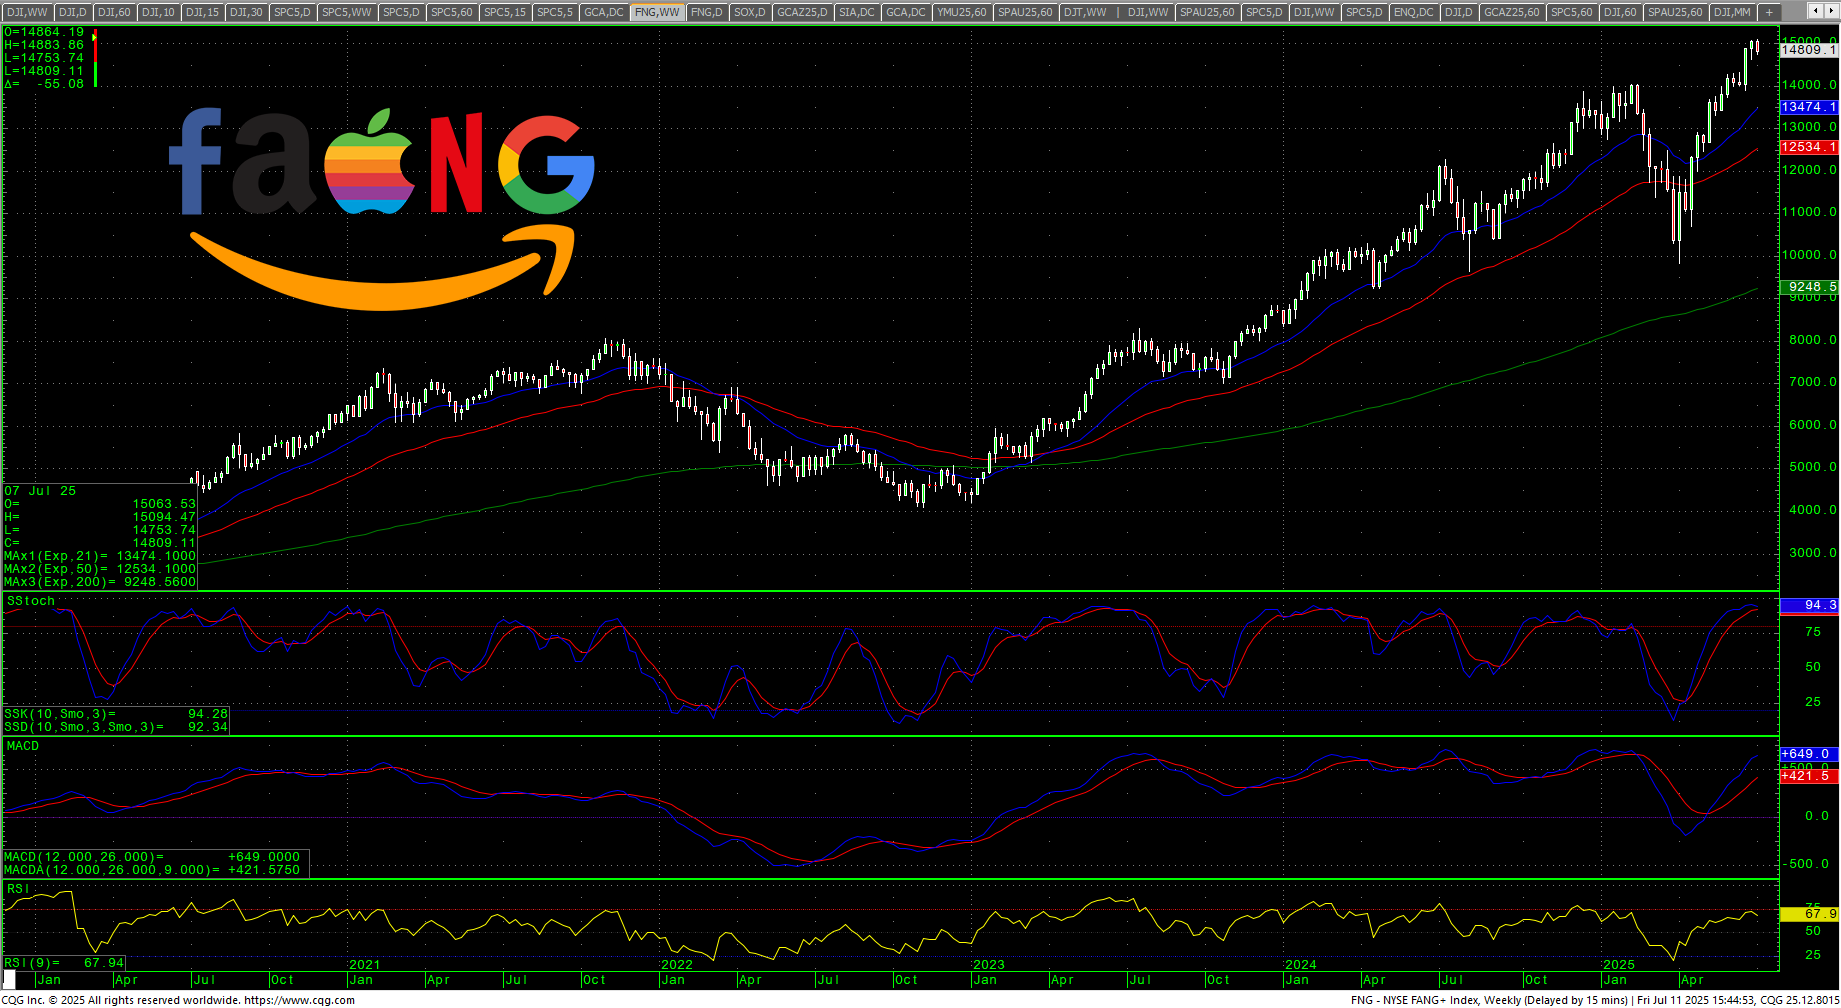
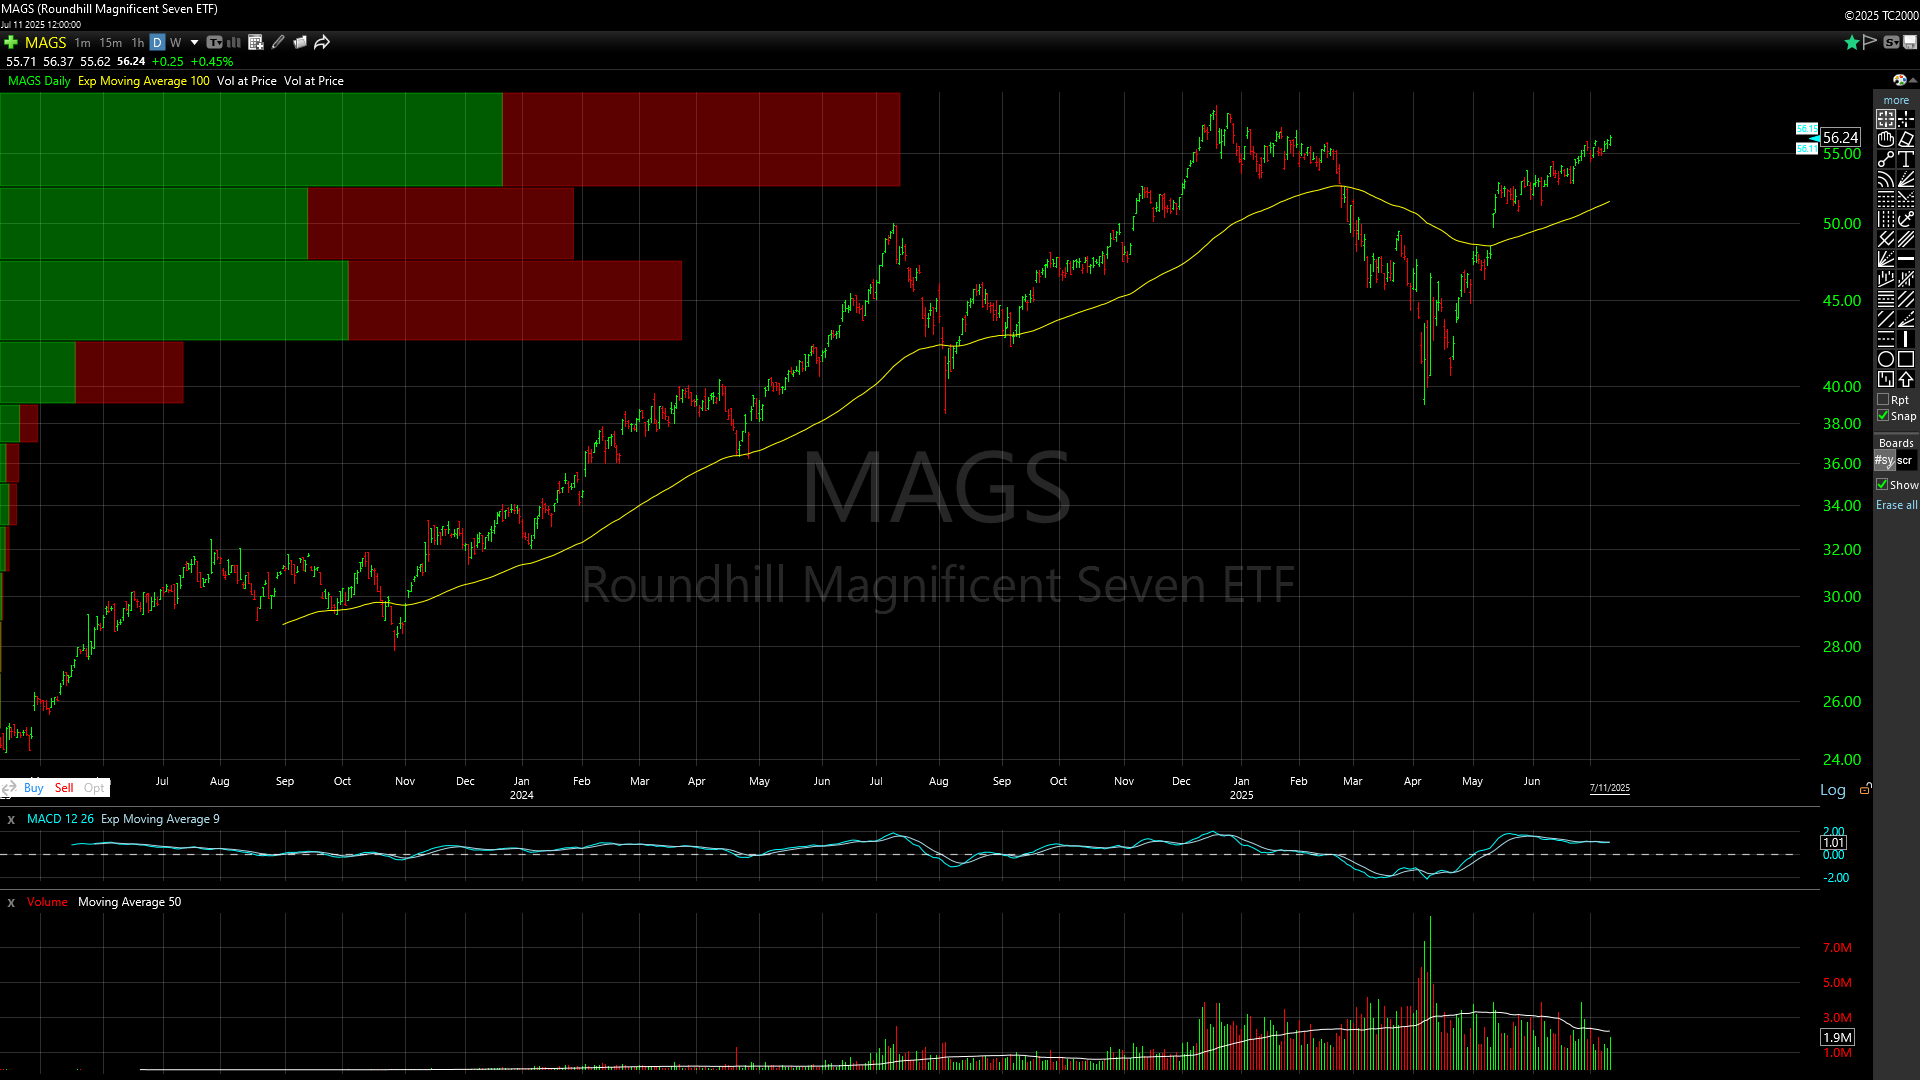 The MAGS moved to a new recovery high and close, settling at the highest close since 24 January 2025. The market is using the 54.16/53.14 area as support now. MAGS closed the week up +0.55% on the top of the week’s range. Prices are poised for a test of the highs above 58. Another chart that remains bullish is the SOX, which continued into new highs for 2025 and is testing the gap area on the daily left on 17 July 2024. The SOX continues to lag the FANG and is also extremely overbought.
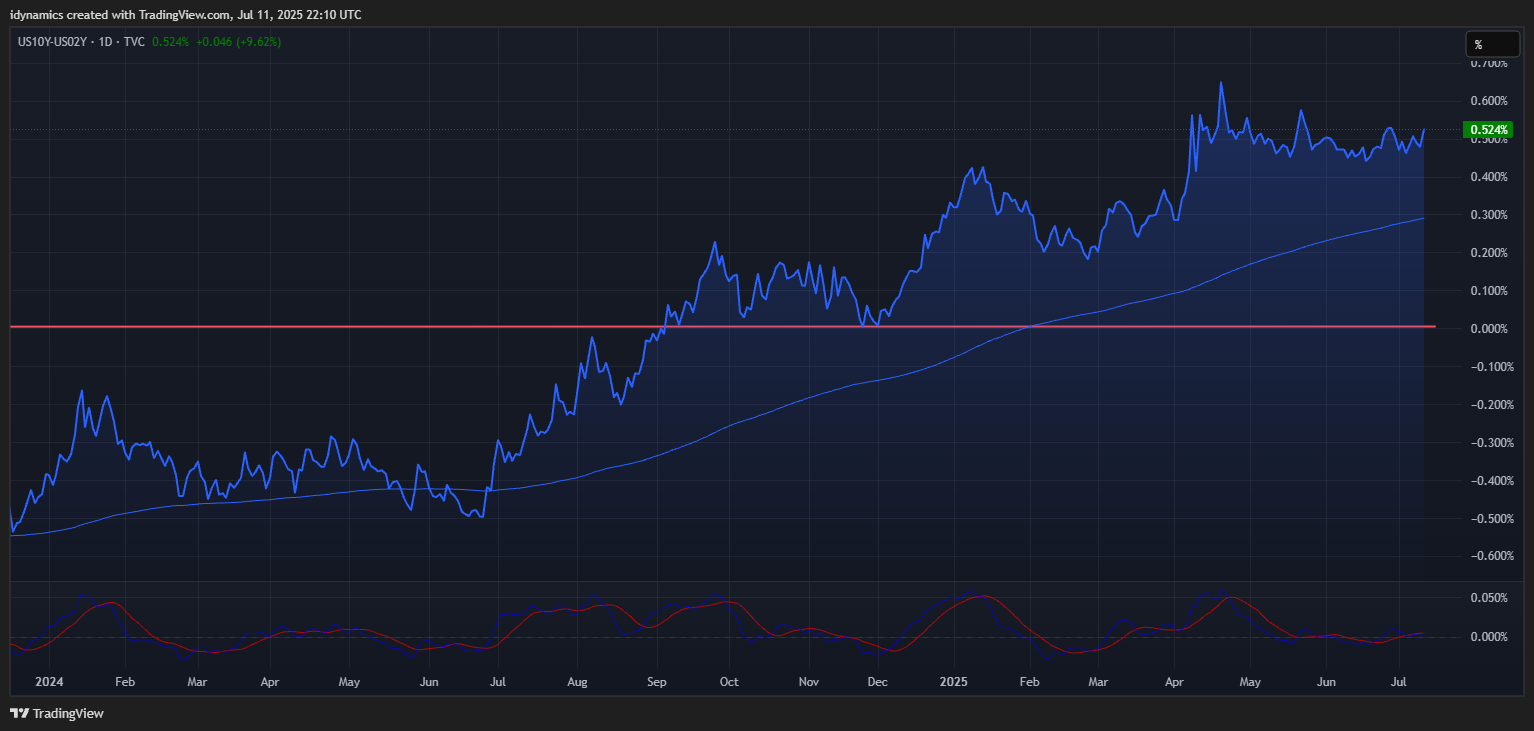
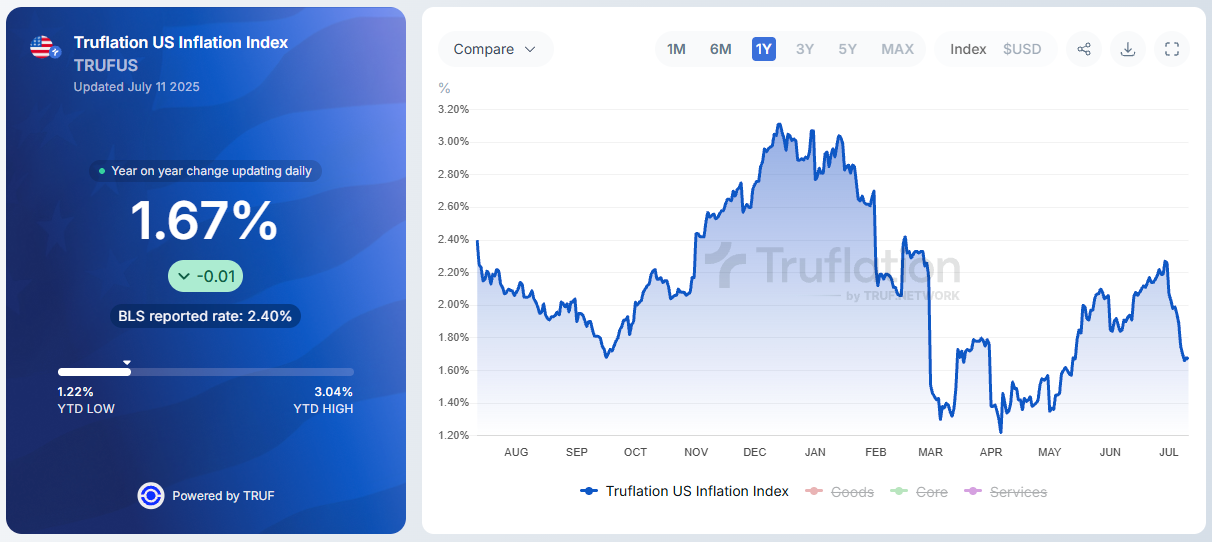
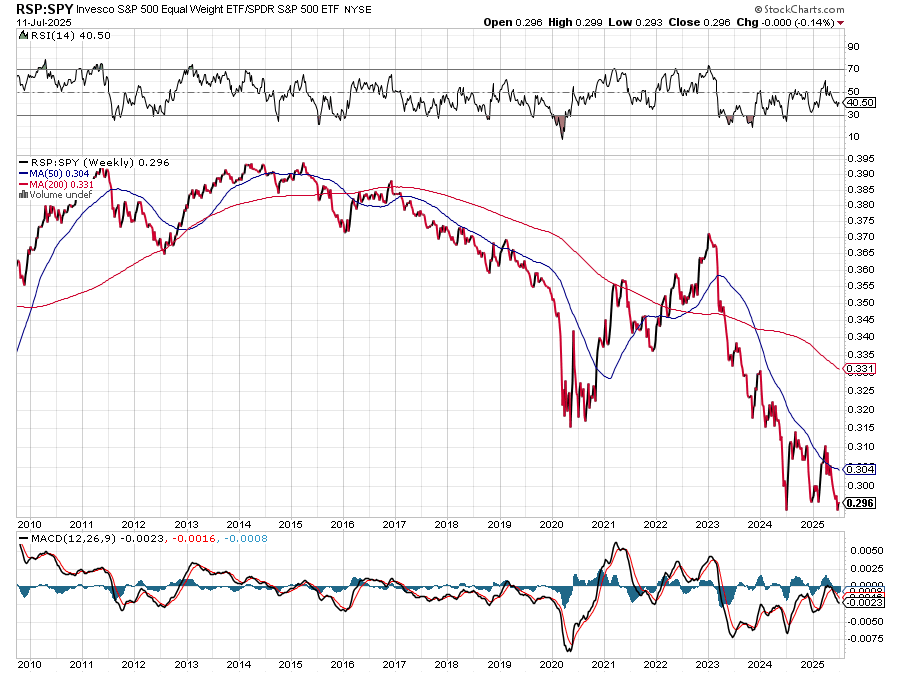
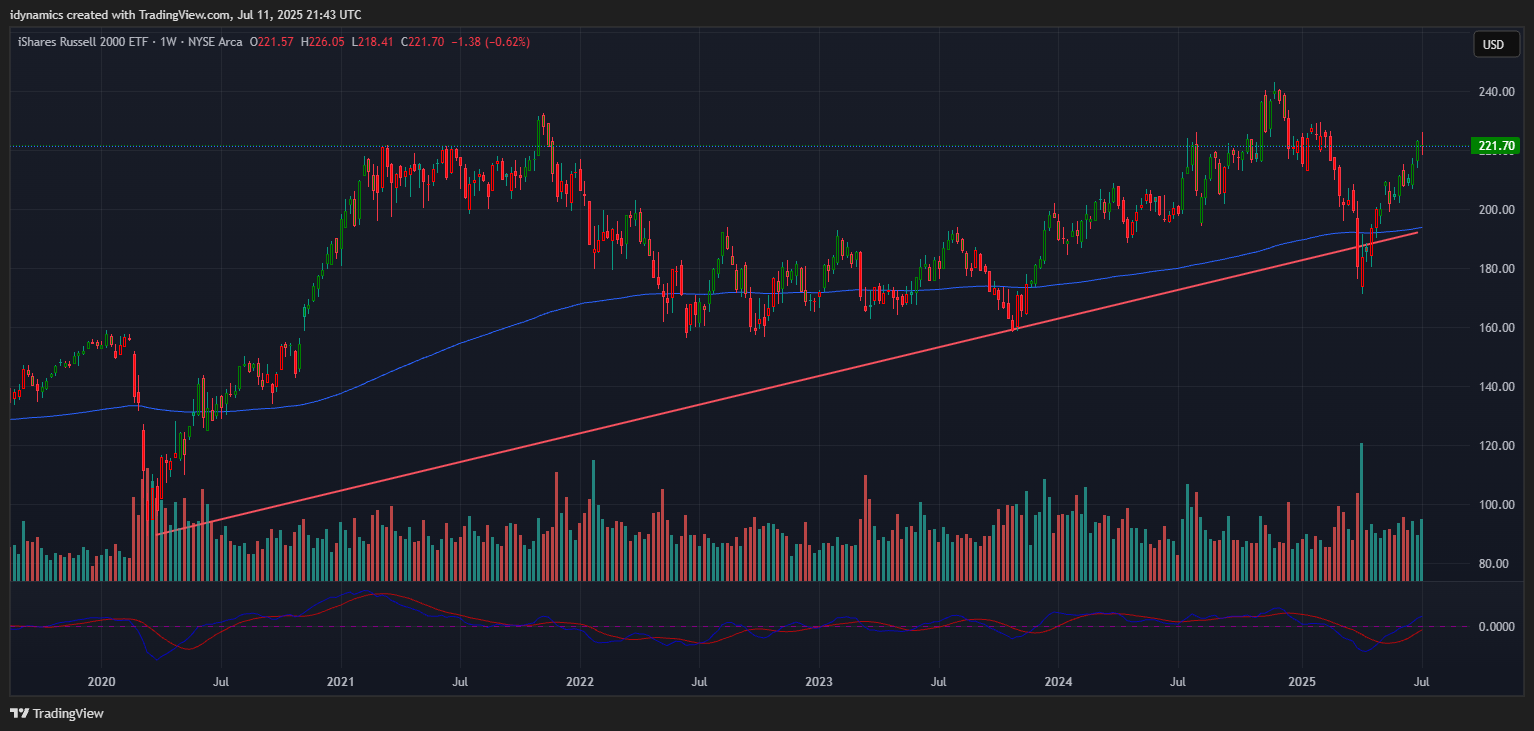
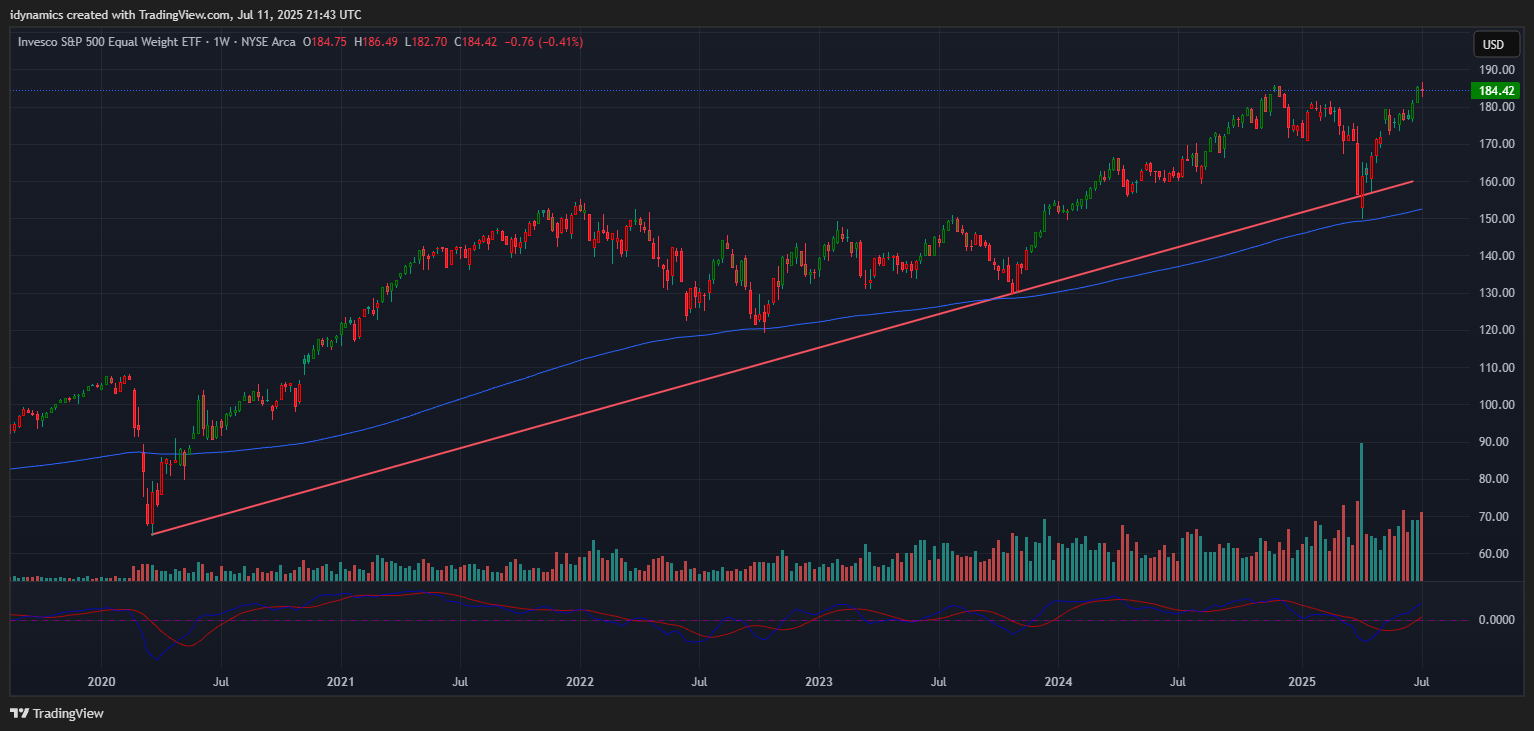
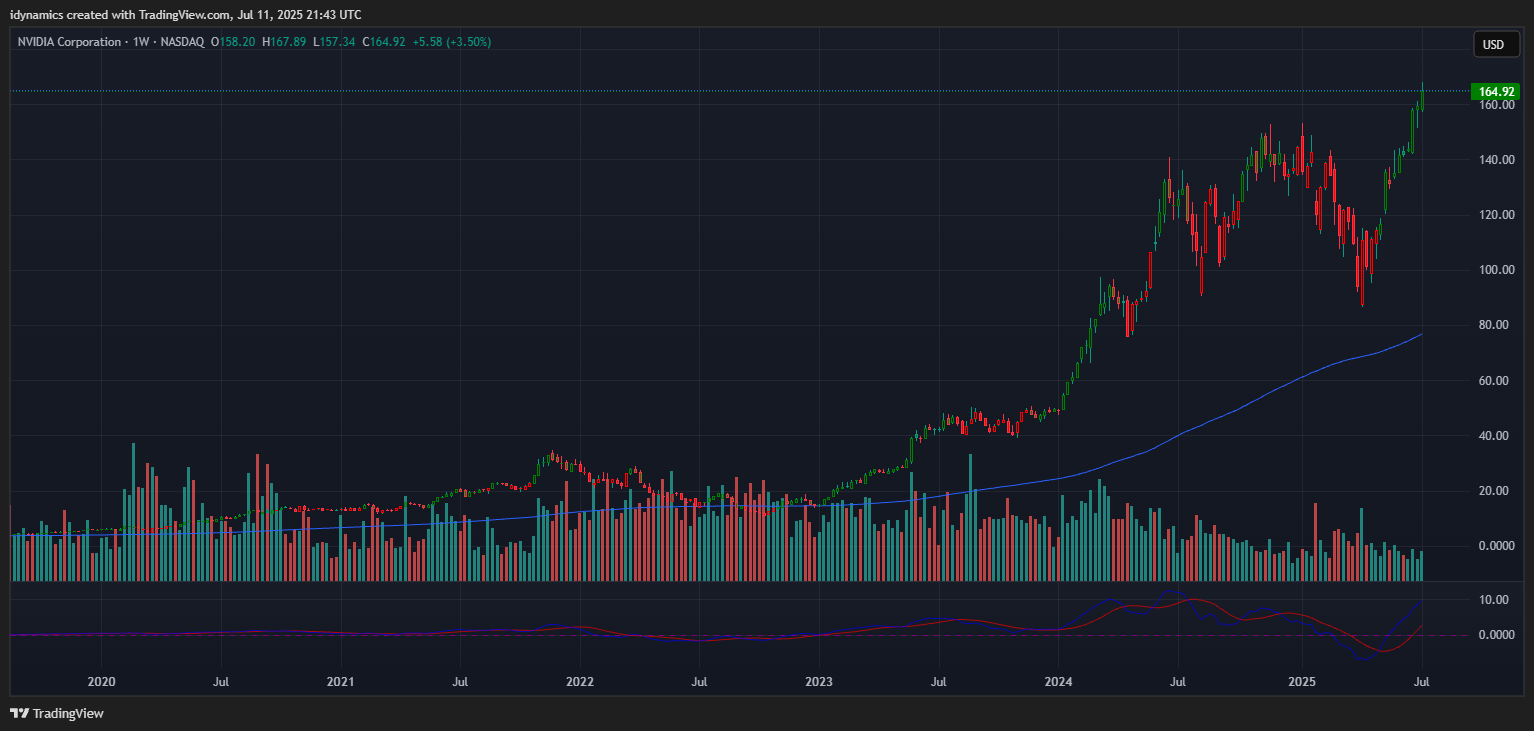
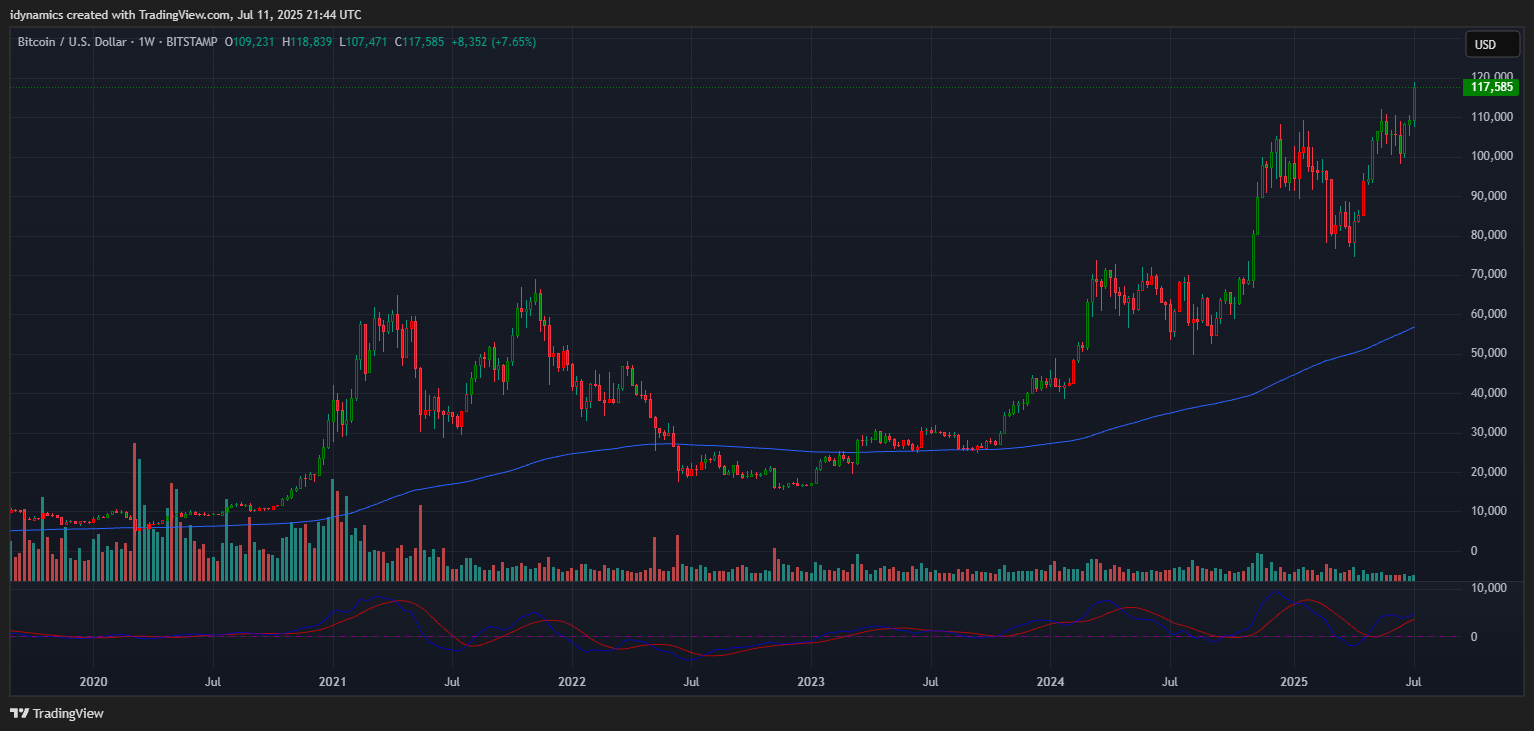
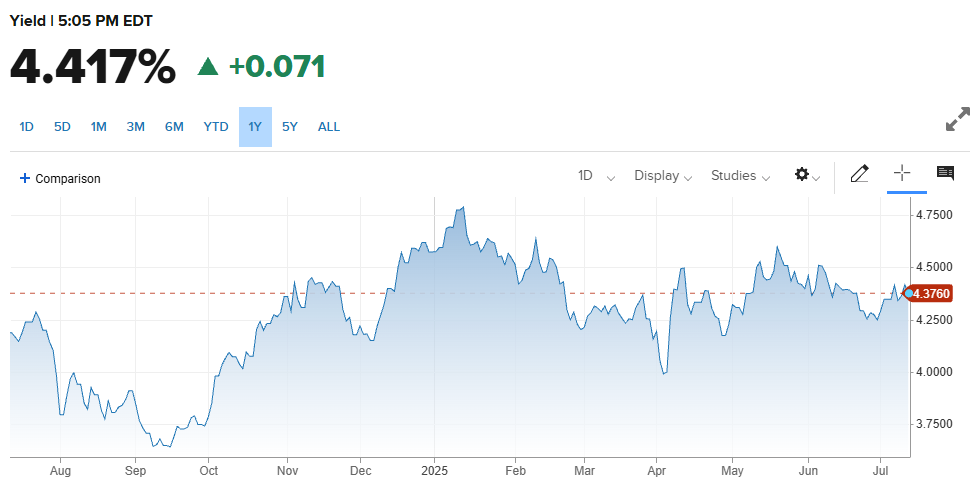
The RSP:SPY gained slightly last week as the RSP traded a new ATH last week. The chart remains extremely weak. The weekly is hooking lower in an oversold position and the MACD is turning back down. The IWM closed lower in a reversal week, settling down -0.62% in the middle of the weekly range. The RSP was down -0.41% in the middle of a reversal range on the week. NVDA was up +3.50% at a new ATH as prices took out a massive call wall at the 160 level. Volume is declining with the chart extremely overbought. Bitcoin rocketed to ATHs, up +7.47% on the top of the week’s range. McClellan Oscillators are following the short-term trends in the Dow. The Yield Curve expanded last week, closing at +0.524%. The 10YR yield rose on the week, closing at 4.417%. Truflation declined to 1.67%.
10YR-2YR Yield Curve Daily

 VIX Weekly Candles
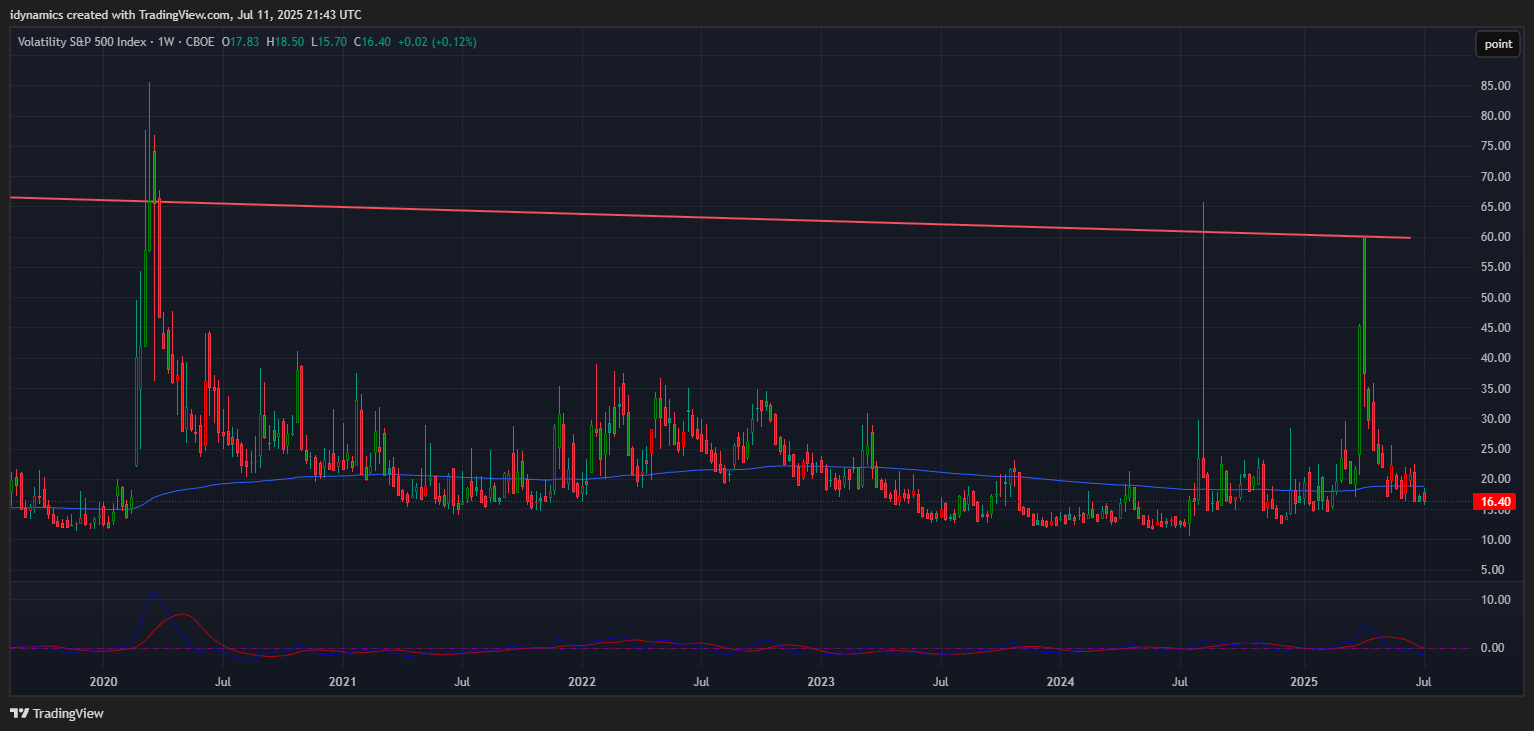
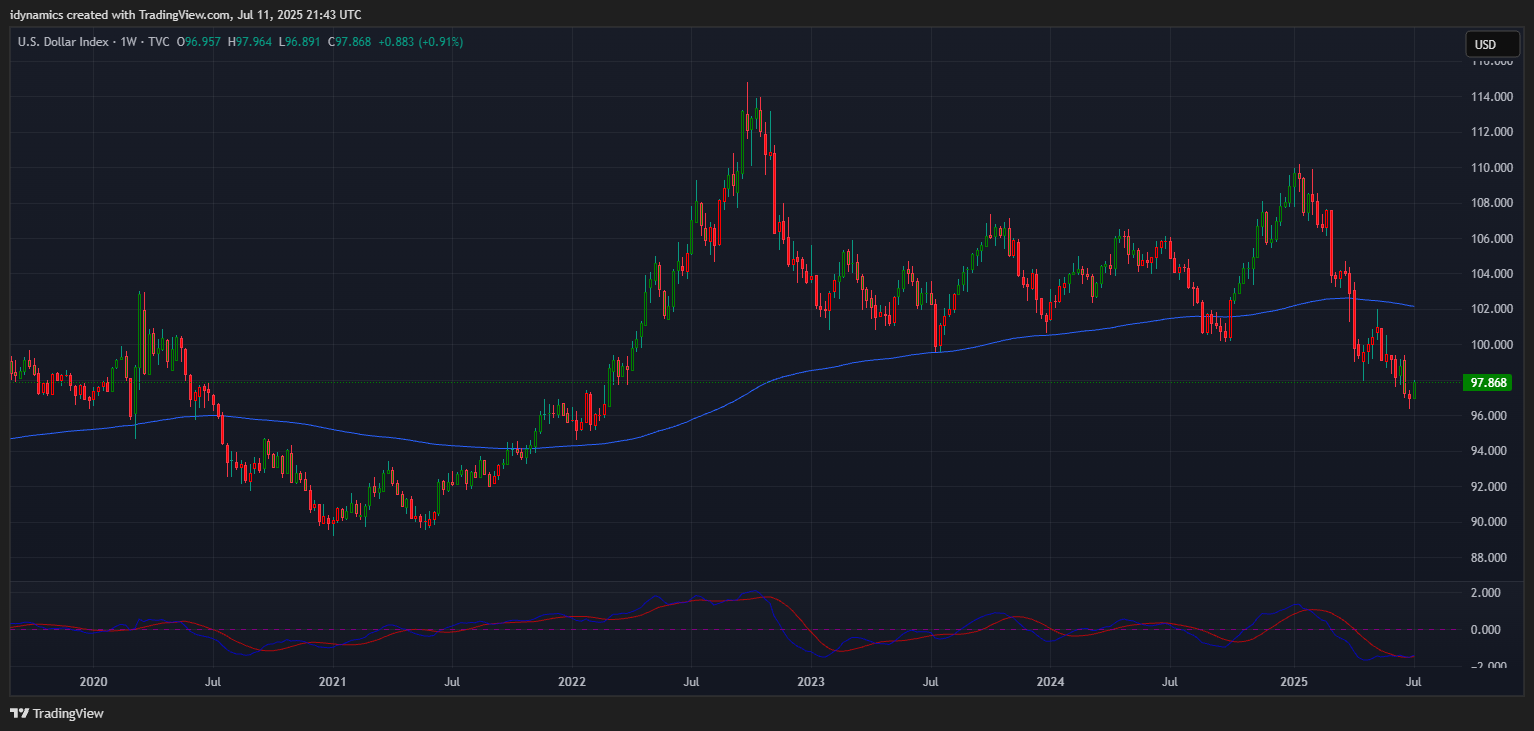
The VIX traded an outside week and closed up +0.12% in the lower end of the range as it holds near the February 2025 lows. The US Dollar rallied and closed up +0.91% on the top of the weekly range.
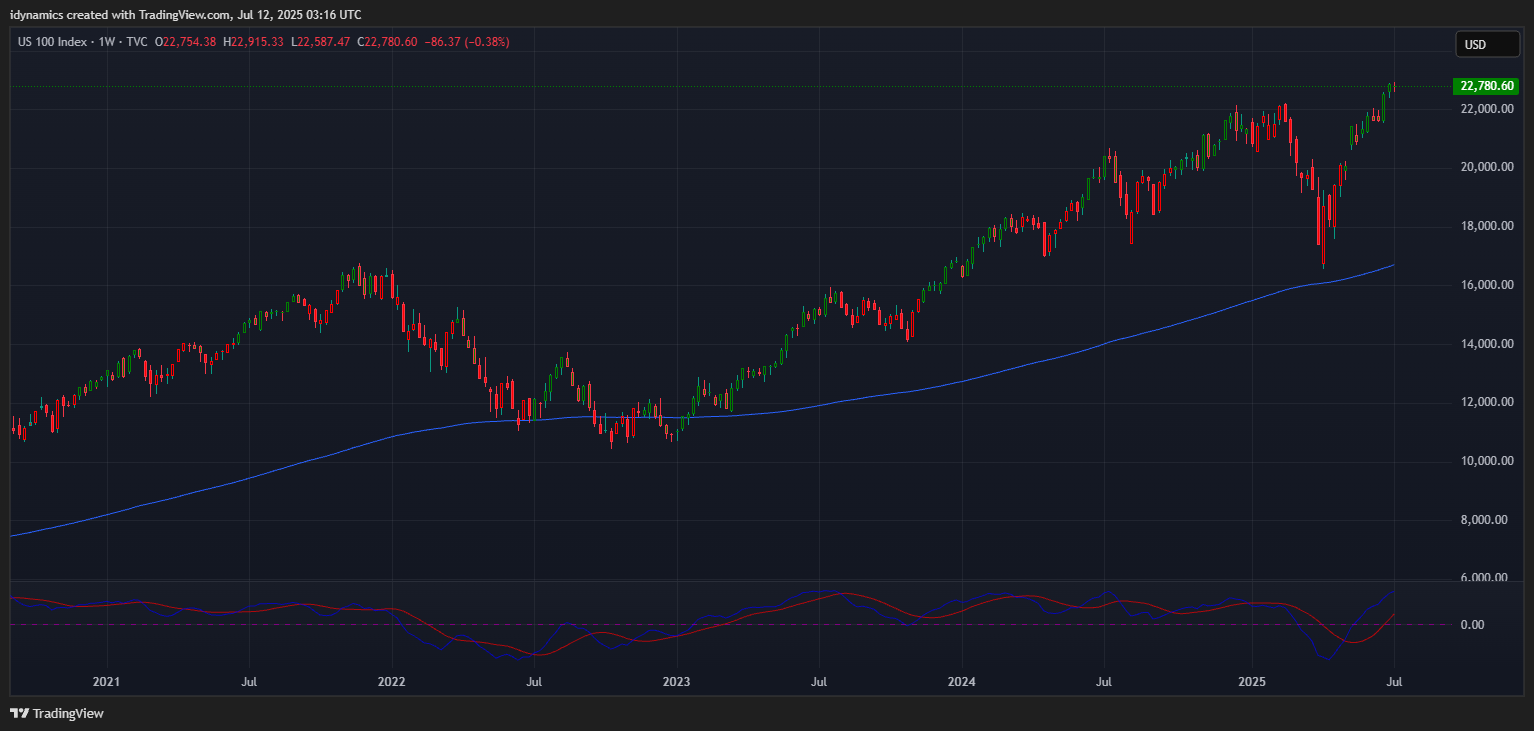
 Nasdaq 100 Weekly Candles
Daily Breadth 
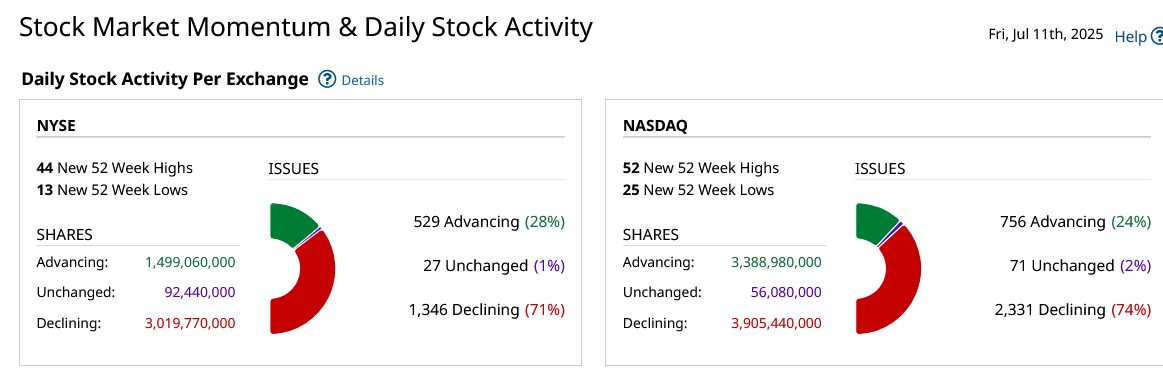
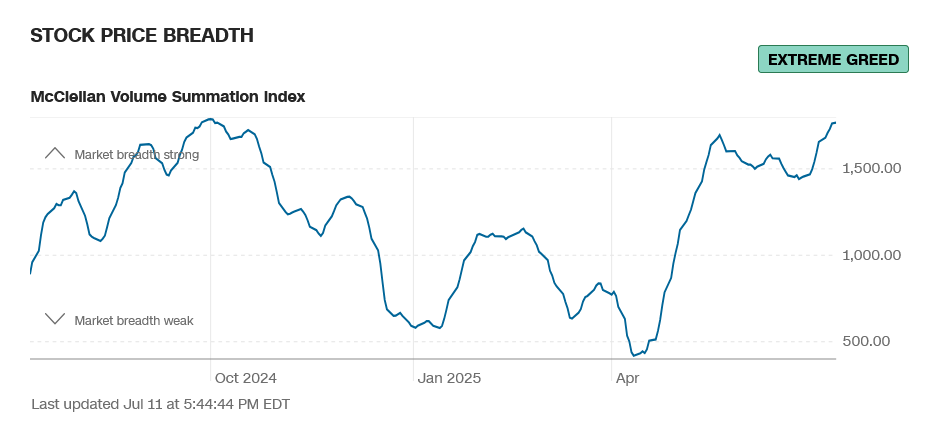
Breadth was strong on Friday and set a one year high on the week. Sentiment remains in extreme greed.
CNN Fear & Greed Index
 AAII Investor Sentiment Survey
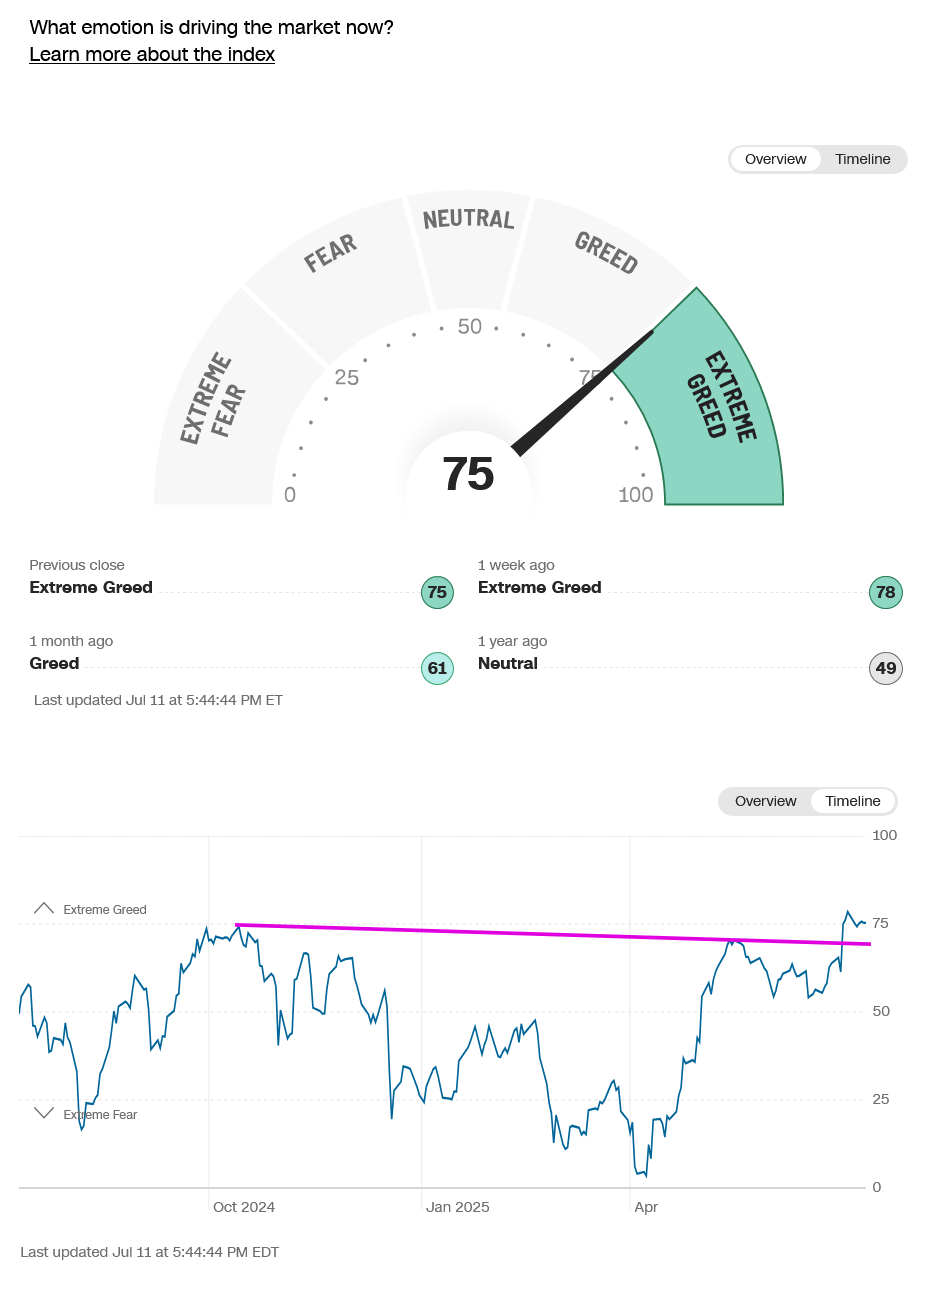
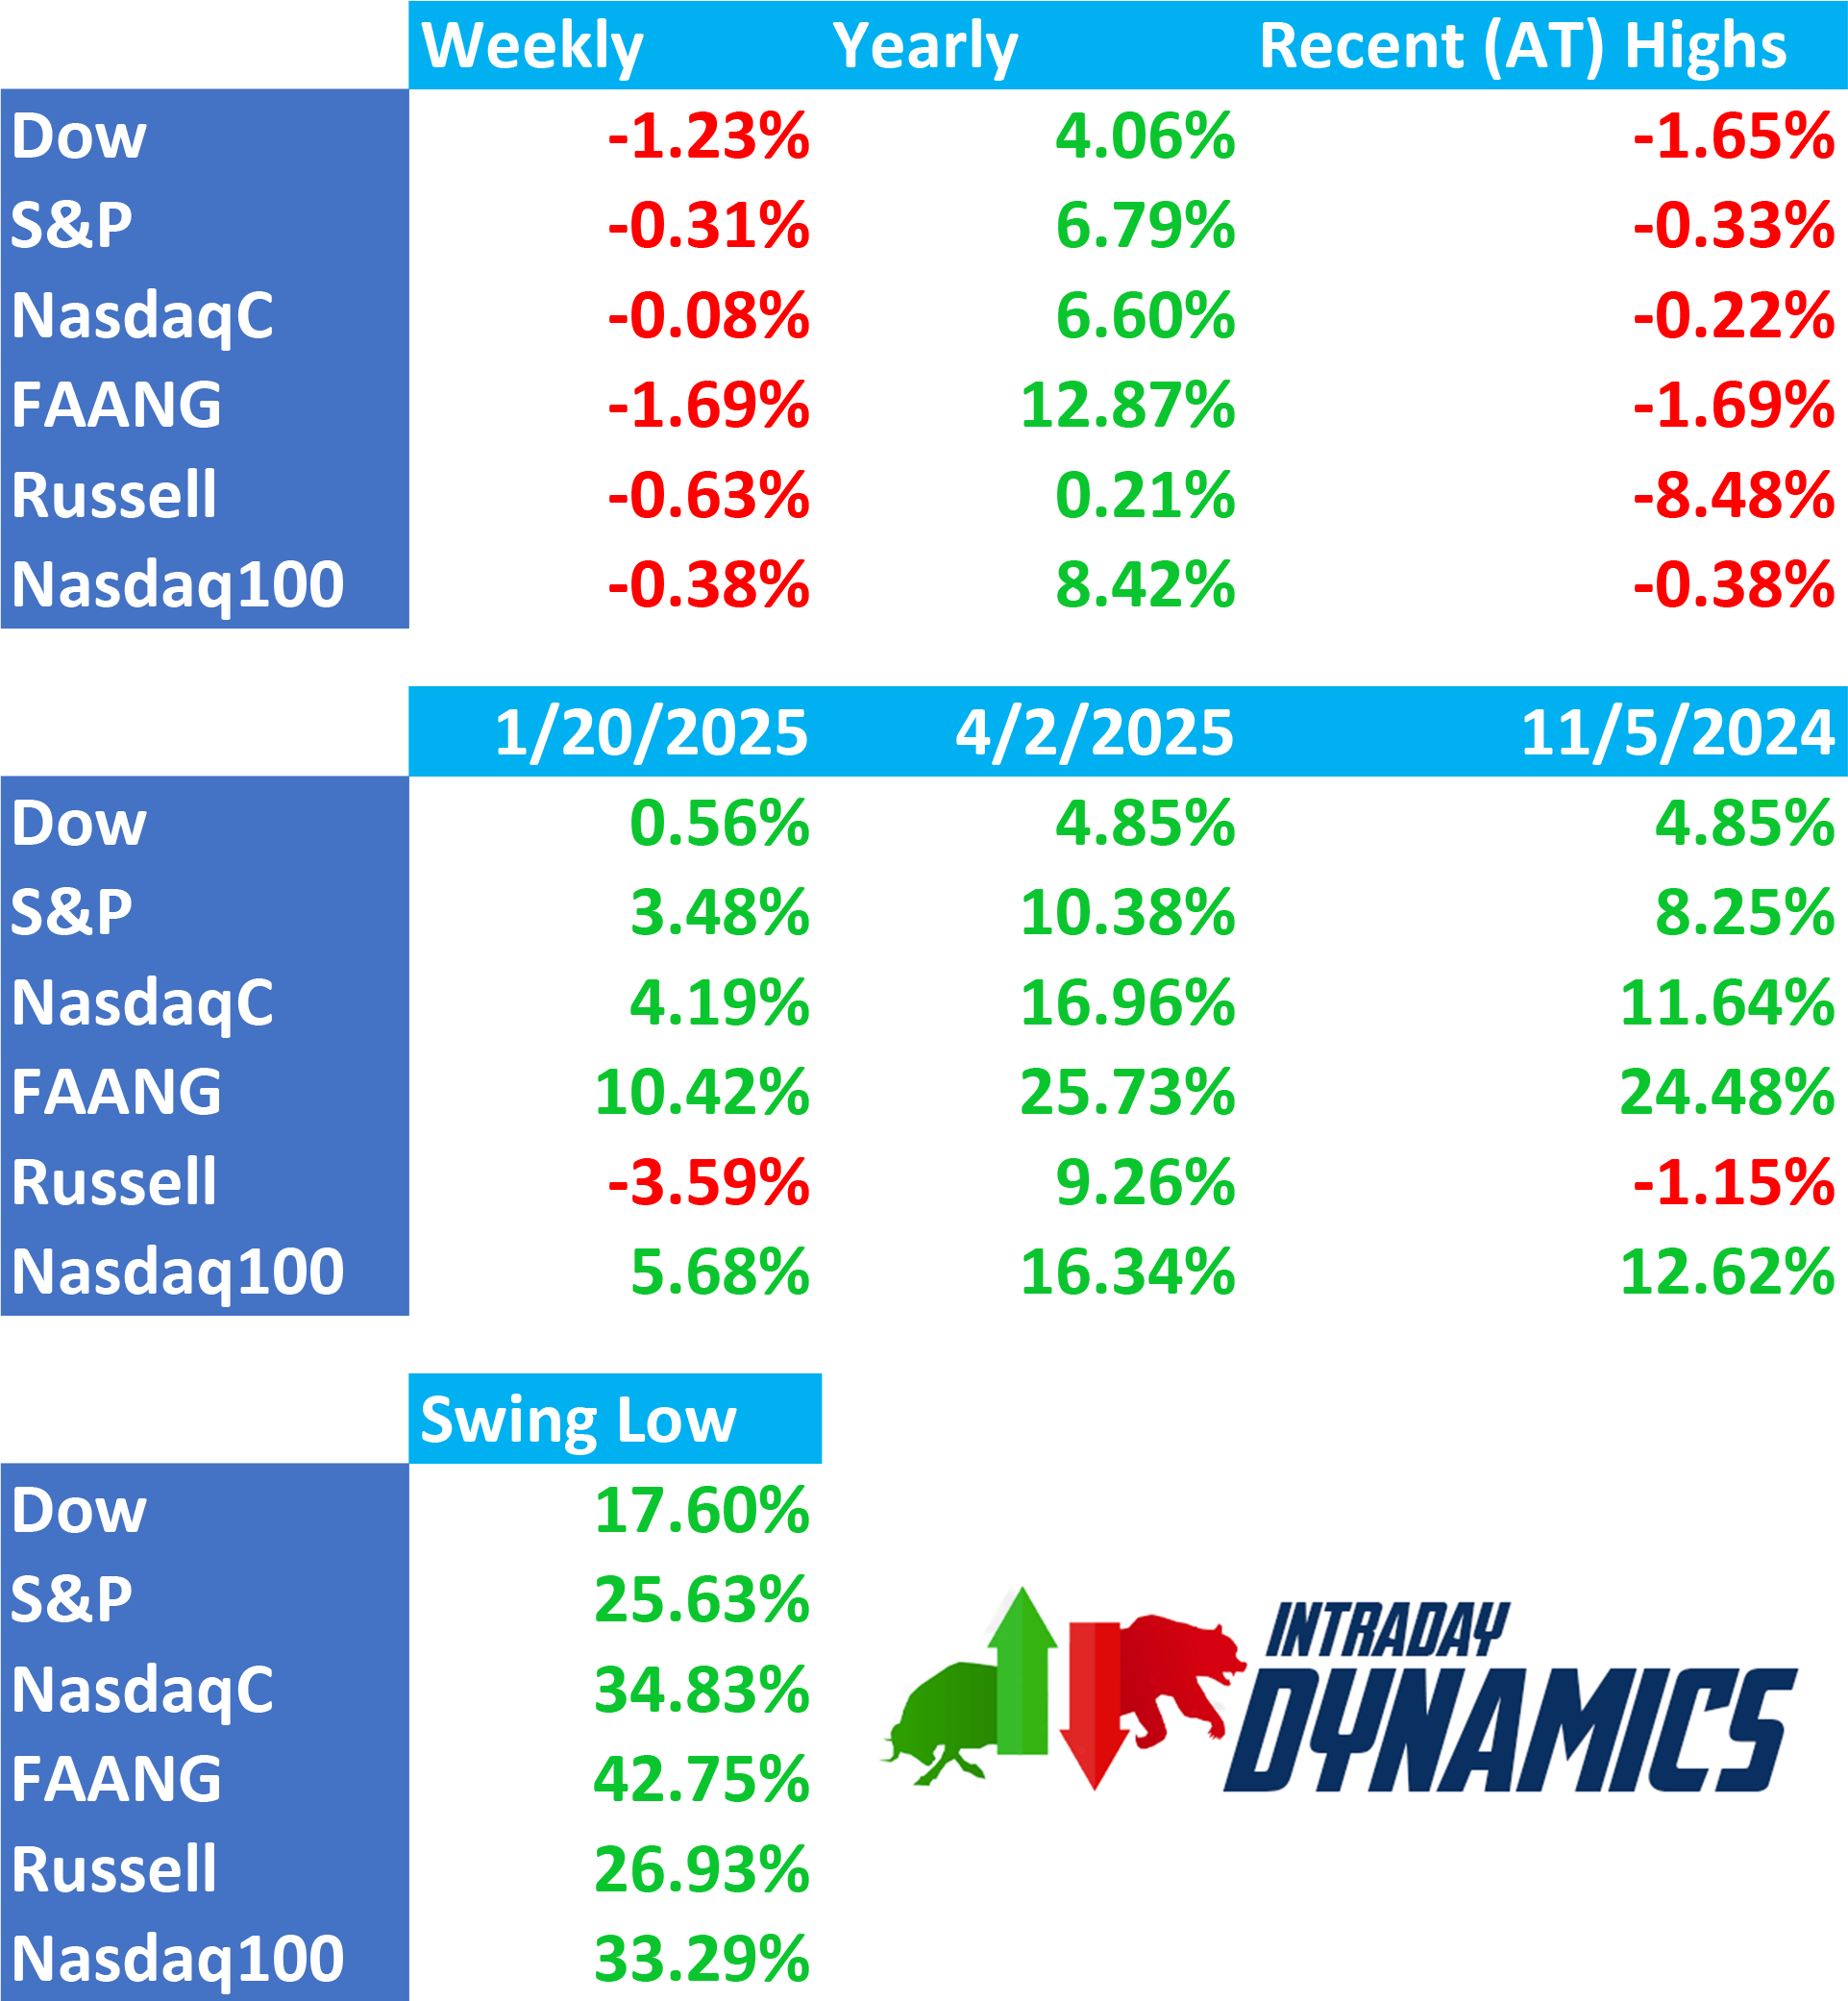
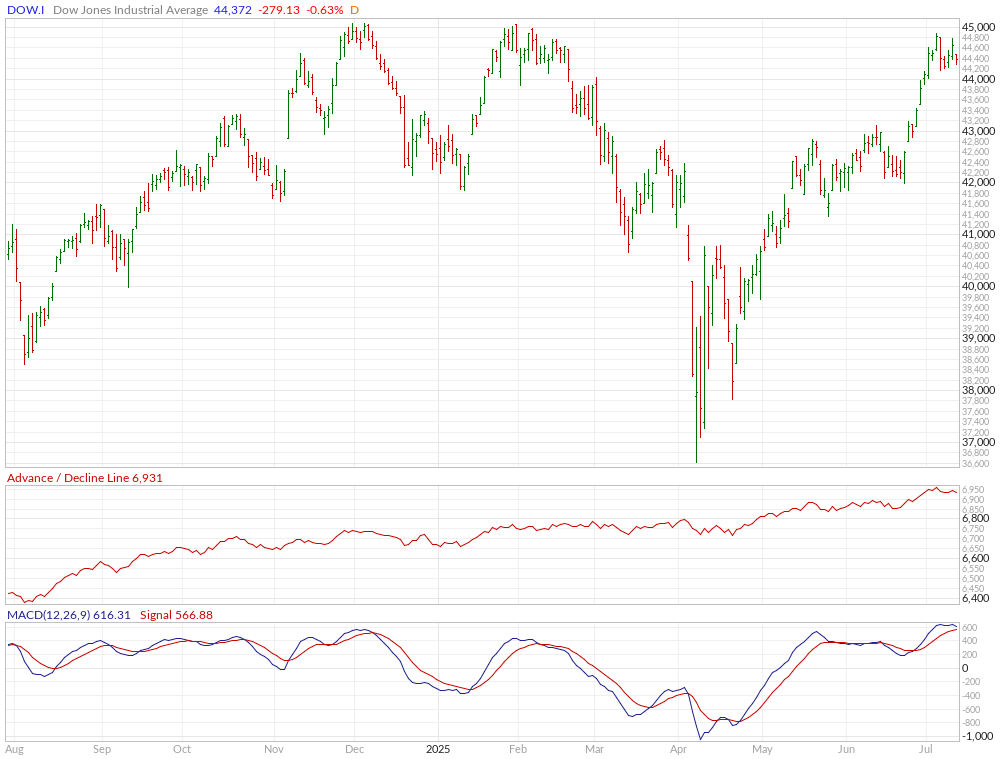
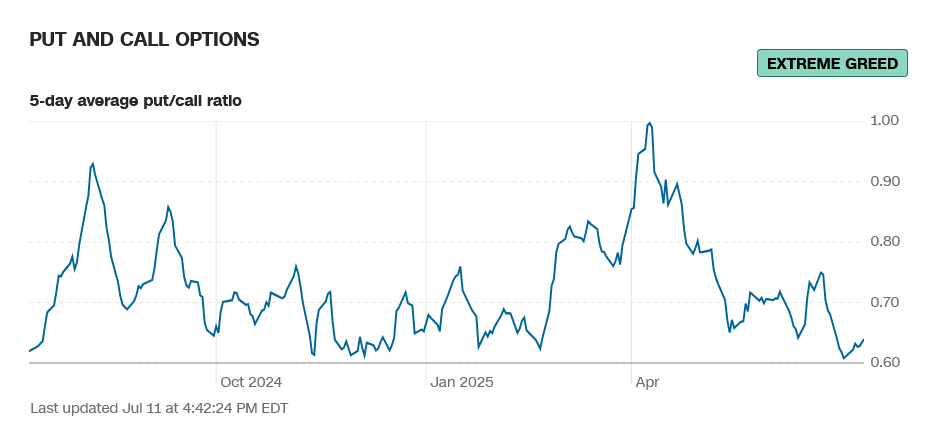
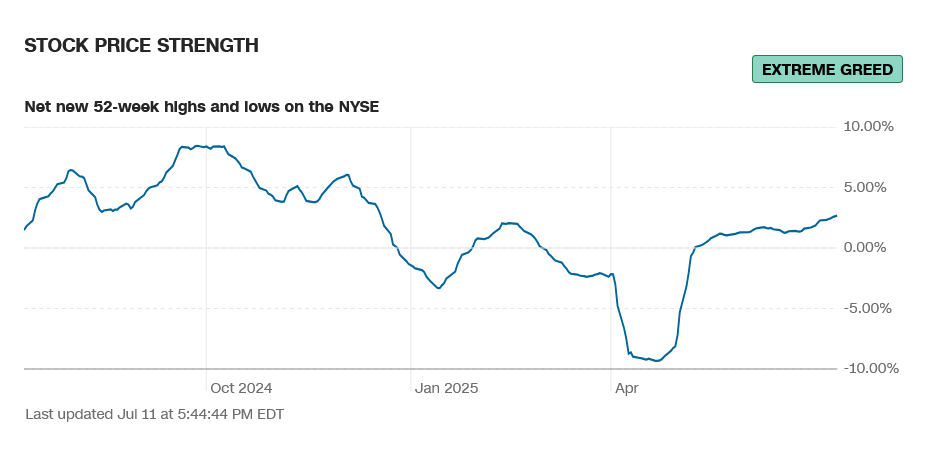
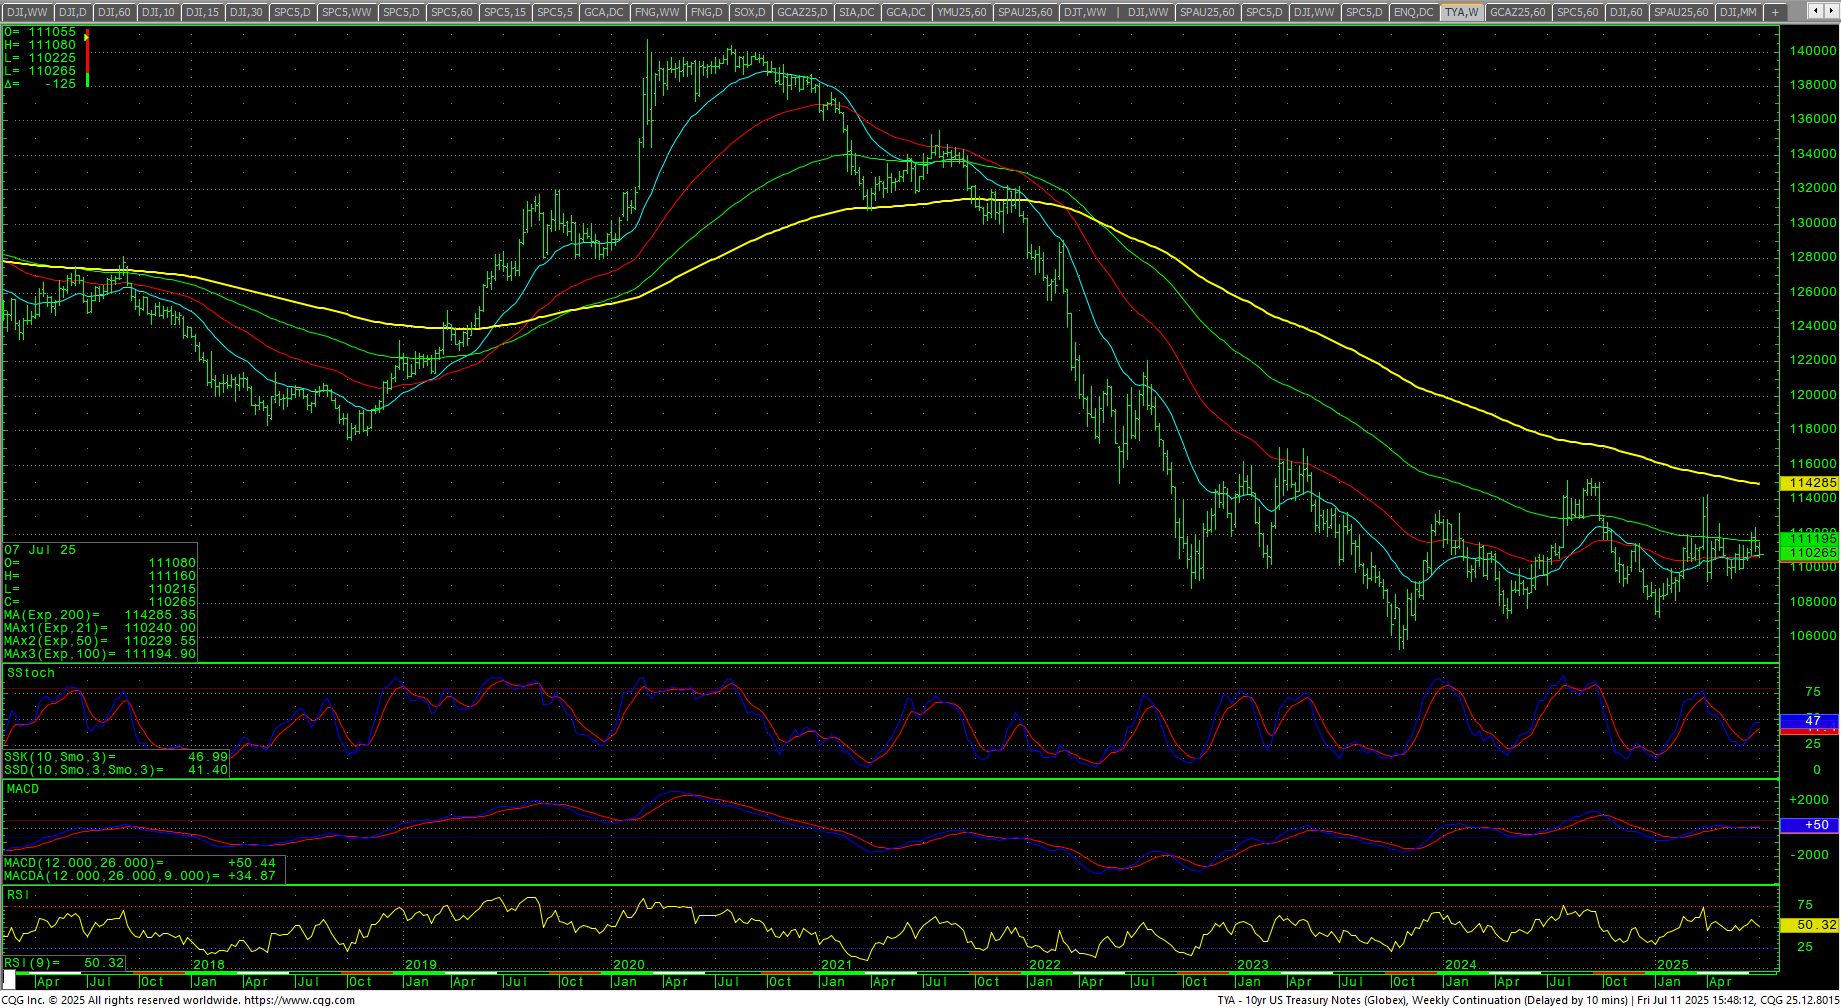
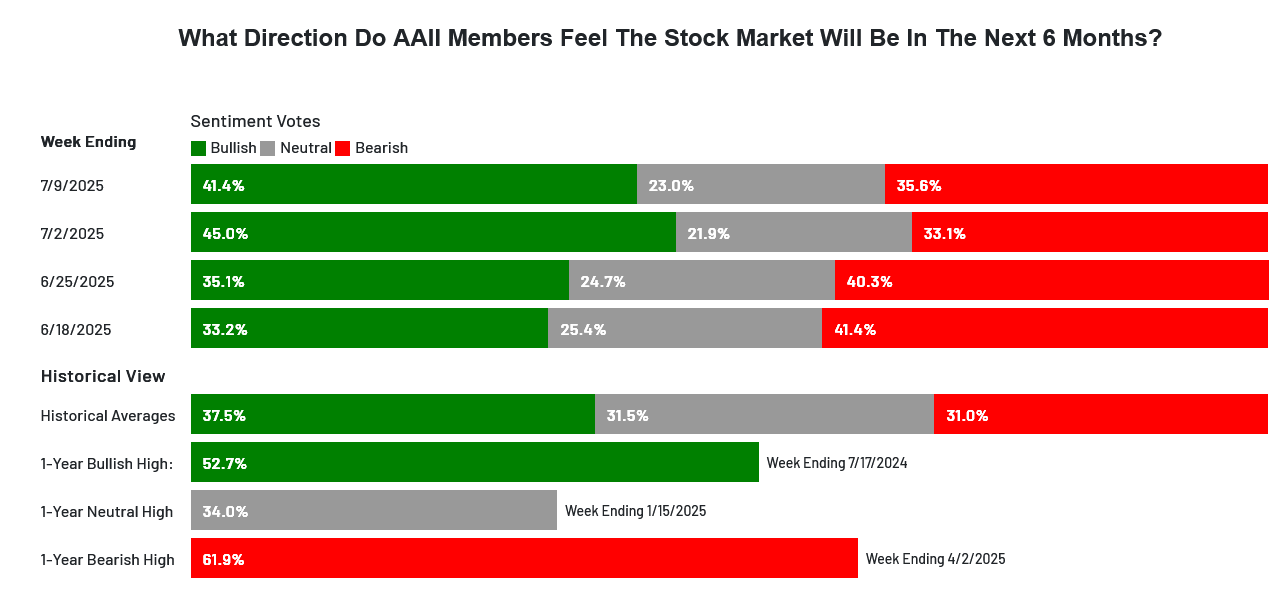 Sentiment is mostly in extreme greed. The CNN Fear and Greed Index moved down to 75 and reads extreme greed and is at the highest reading in over a year. Breadth improved on the week to the highest levels since Fall of 2024 and continues to read extreme greed. Latest AAII Sentiment Survey: Optimism Pulls Back and the bulls backed off the previous week’s highest levels recorded for 2025. The Dow A/D pulled back from a record high and ended at 6931. The VIX traded an outside week and closed up +0.12% in the lower end of the range as it holds near the February 2025 lows. The Put/Call closed at 0.64 and reads extreme greed. The 52-week, A/D rose to +2.68% and reads extreme greed. The Dow closed the week down -1.23%, closing on the bottom of an inside week’s range. The S&P settled down -0.31% ending in the upper 50% of a reversal week down. The Nasdaq Composite was down -0.08% and the Nasdaq 100 was down -0.38%. The NYSE FANG led the declines, settling down -1.69%. The Russell was down -0.38% in the middle of a reversal week down. The 10-year notes sold off and closed on the bottom of the week’s range. The yield on the 10YR increased to 4.417%.
Silver Spot Futures Monthly H-L-C
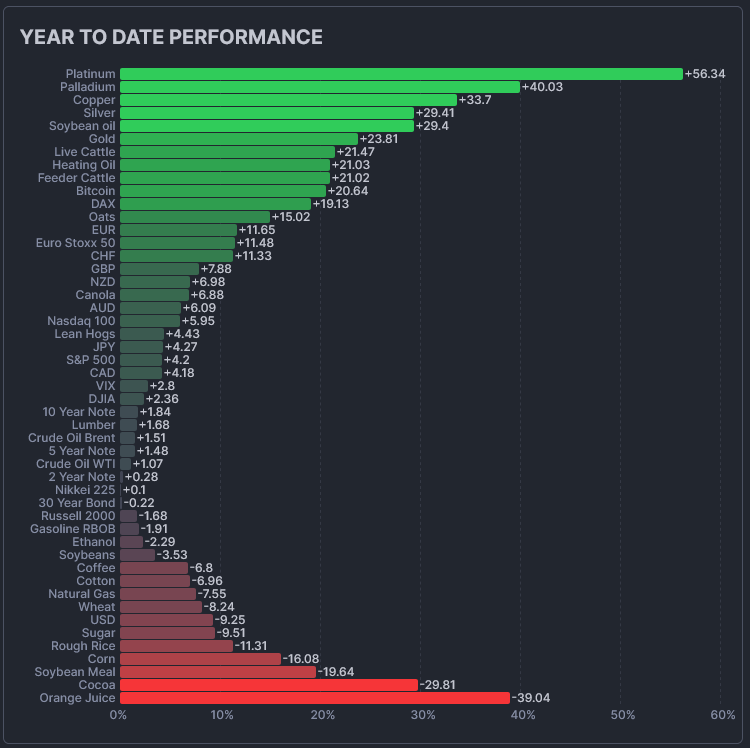
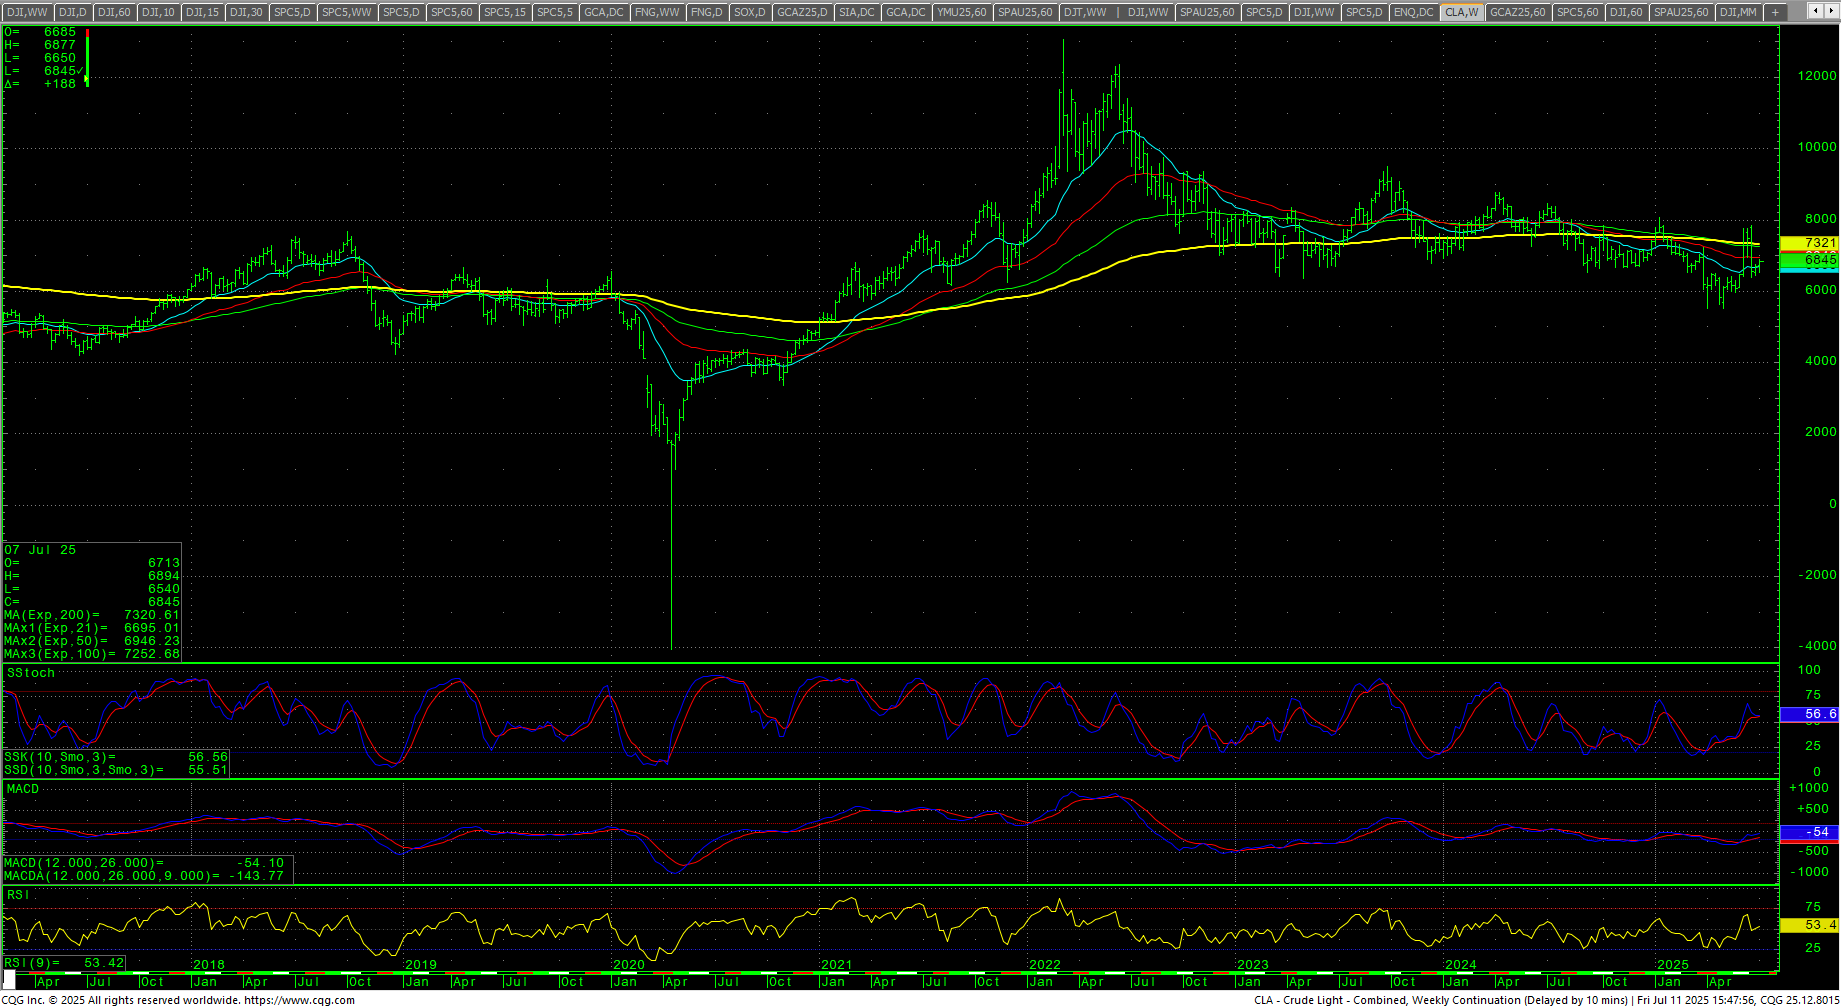
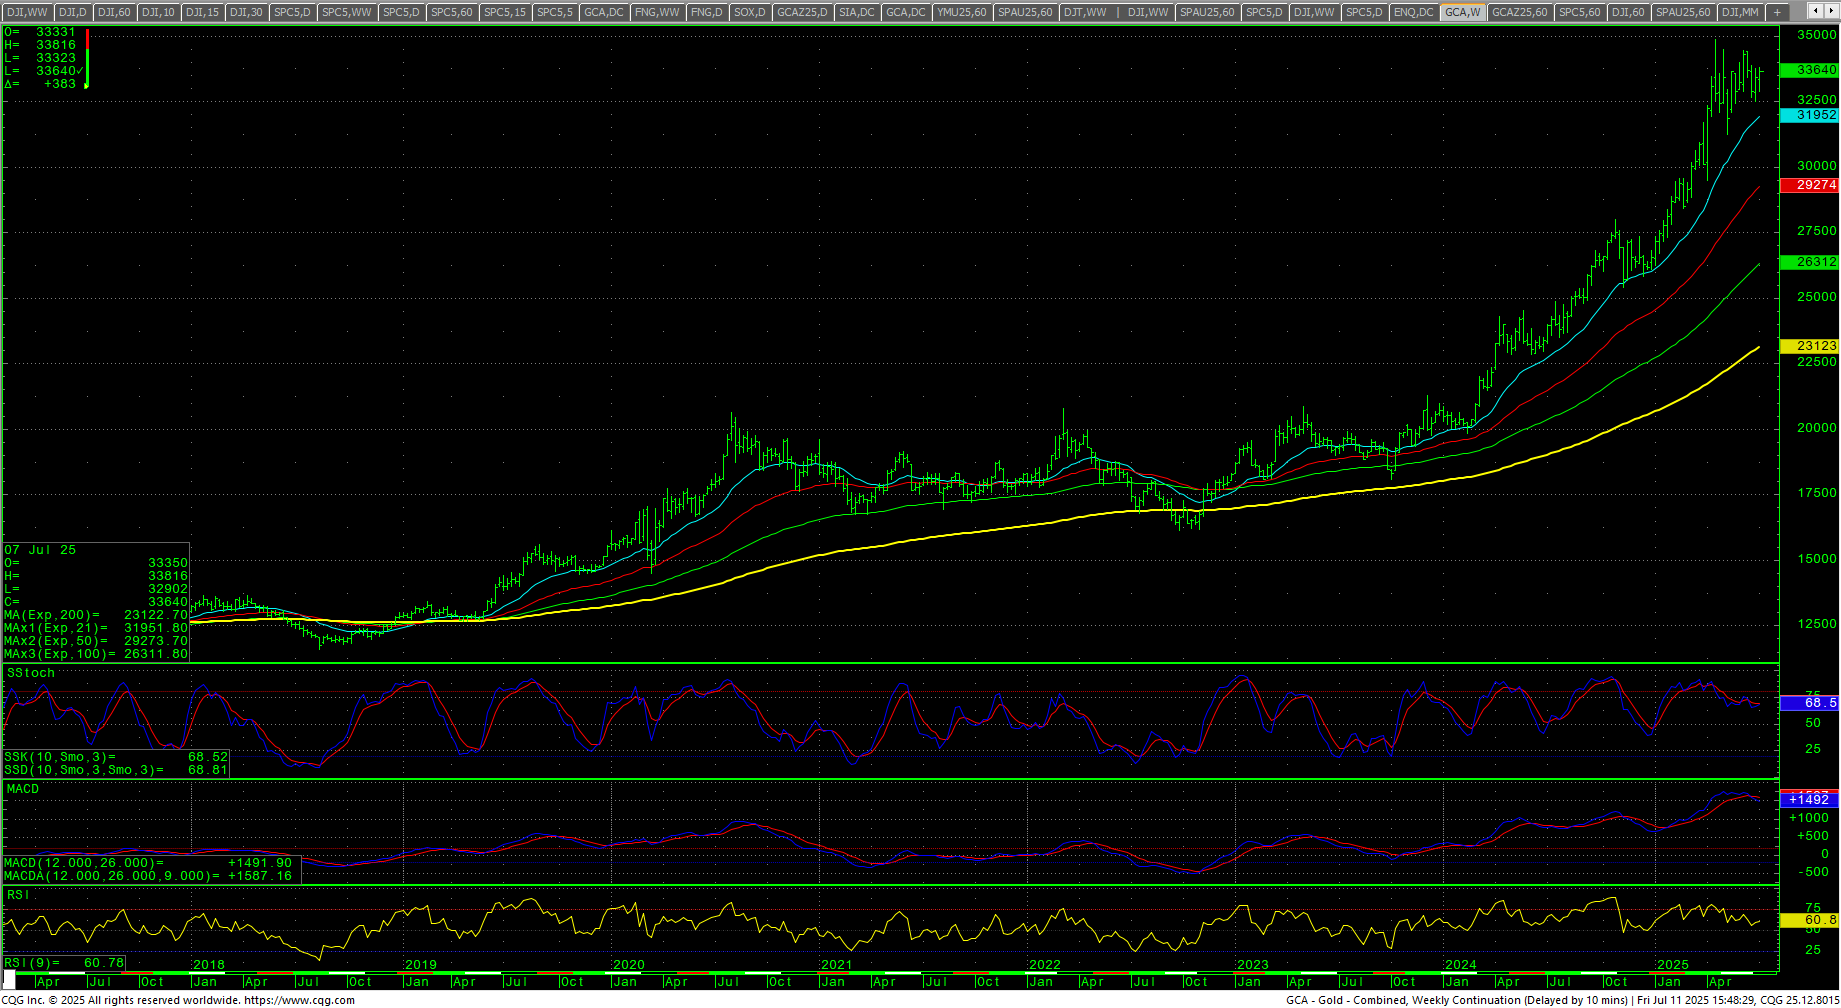
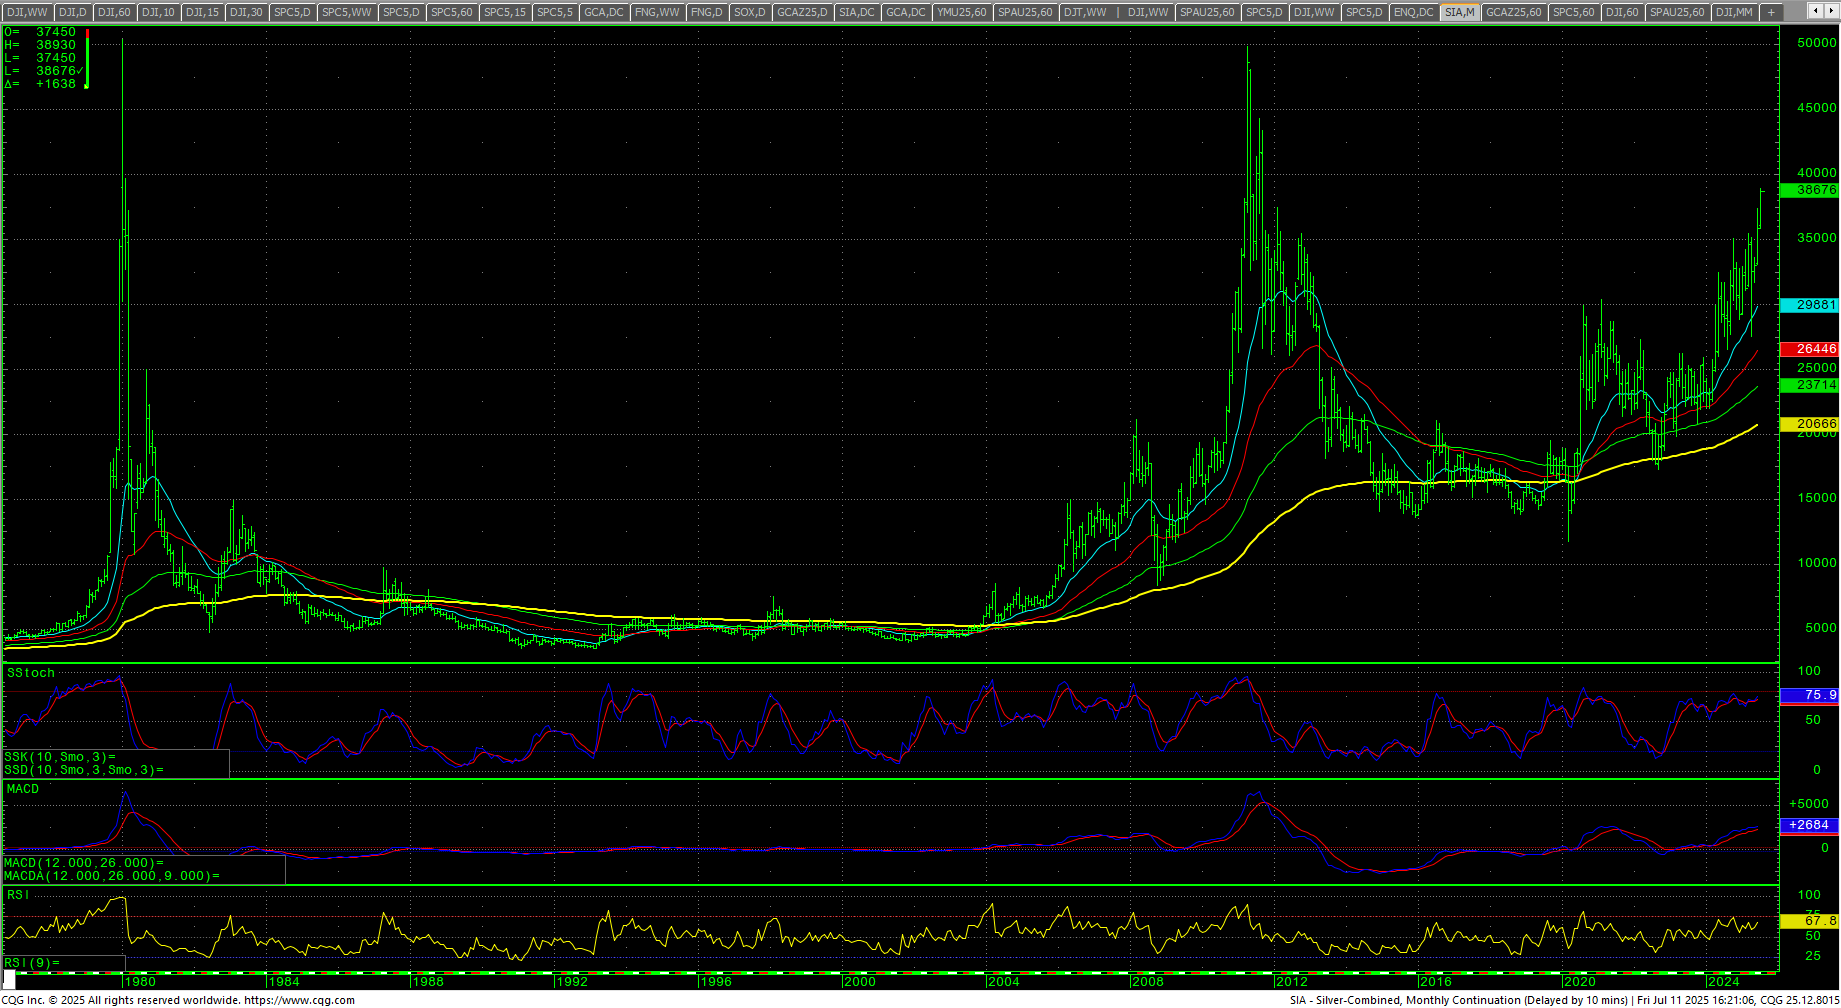 The CRB Index was flat, up +0.23%. Crude oil closed higher on the top of the week’s range. in a tiny inside week’s range and settled up +2.21%. Gold rallied late in the week to close on the top of the weekly range and Silver exploded to the highest levels since September of 2011. The CoT for the S&P 500 saw very little changes in positioning. The CFTC S&P 500 Non-Commercial Net Positions ended at -140K after a sharp drawdown the previous week.
Timing Points
Minor timing falls on Thursday and Tuesday we get the CPI Report. Critical cycle falls on the 23rd/24th. For an update on the longer-term timing outlook, please see the latest update. Tuesday is CPI and Core CPI (est: +0,3% and YOY +2.7%). Wednesday is PPI and PPI Core (est: +0.2%) and also Industrial Production and Capacity Utilization as well as the Beige Book. Thursday is Retail Sales (est: +0.2%). Friday is Housing Starts. 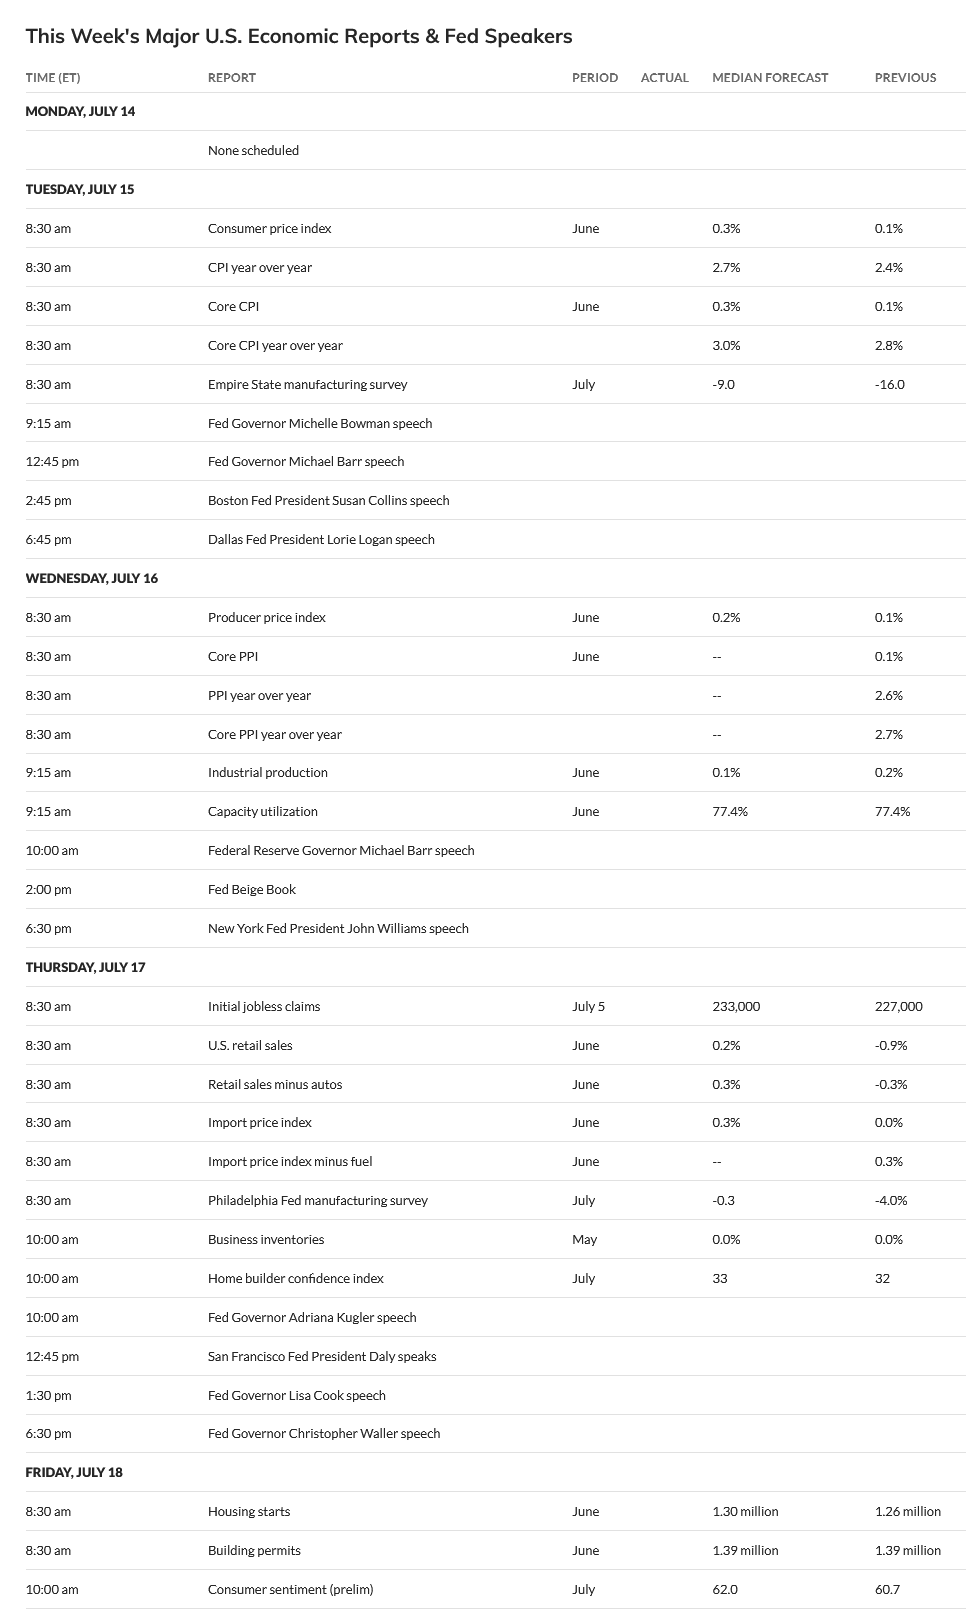
- 07/17 **
- 07/23-24 *** X
- 08/01 *** X
- 08/05 *** X kicks off critical week through
- 08/08 *** X through
- 08/11 *** X critical week
Dow Jones Industrial Average
Dow Jones Industrial Average Weekly H-L-C
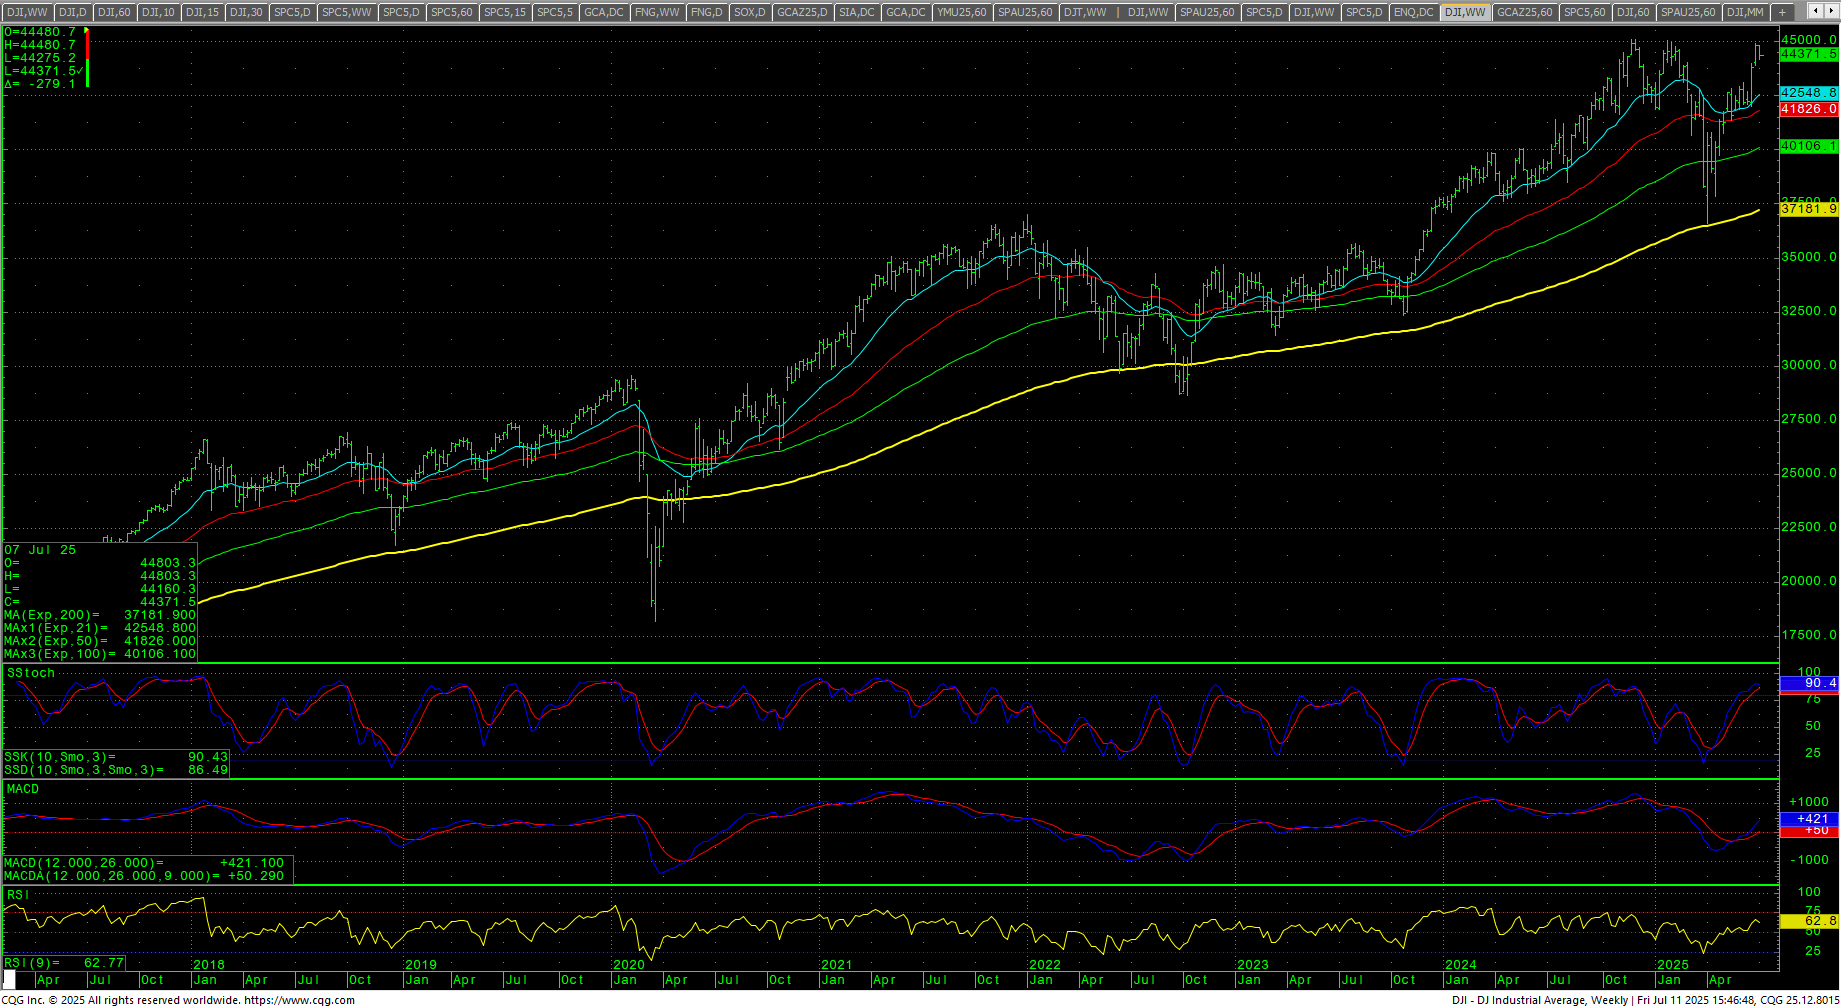 The Dow closed the week down -1.23% on the low of an inside week’s range. It’s a bearish weekly candle as a very overbought market takes a breather after testing record highs. The weekly stochastics are still in an uptrend but have reached overbought numbers. The daily stochastics have hooked lower from overbought readings. The MACD is extremely overbought. The RSI is pulled back to 62.1. The 200-day MA starts the week at 42060.60 and is trending higher and has now notched a record high.
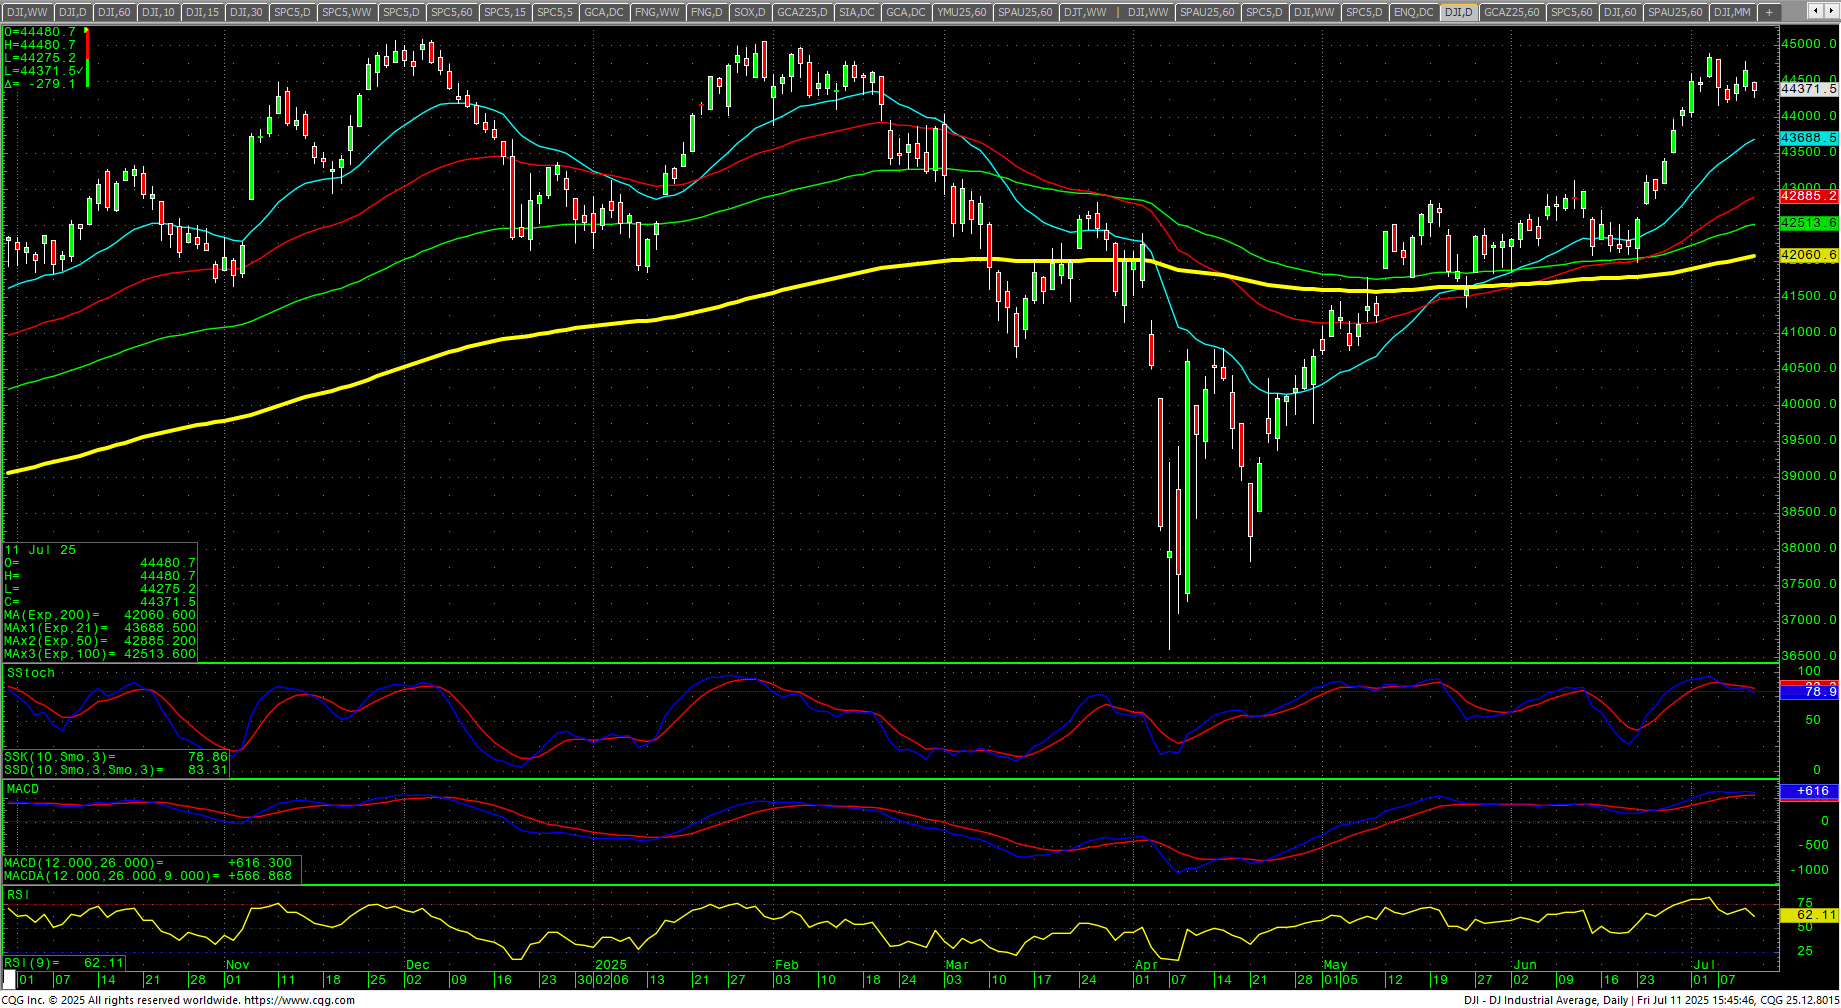
Dow Jones Industrial Average Daily Candles
Dow Jones Industrial Average Hourly H-L-C
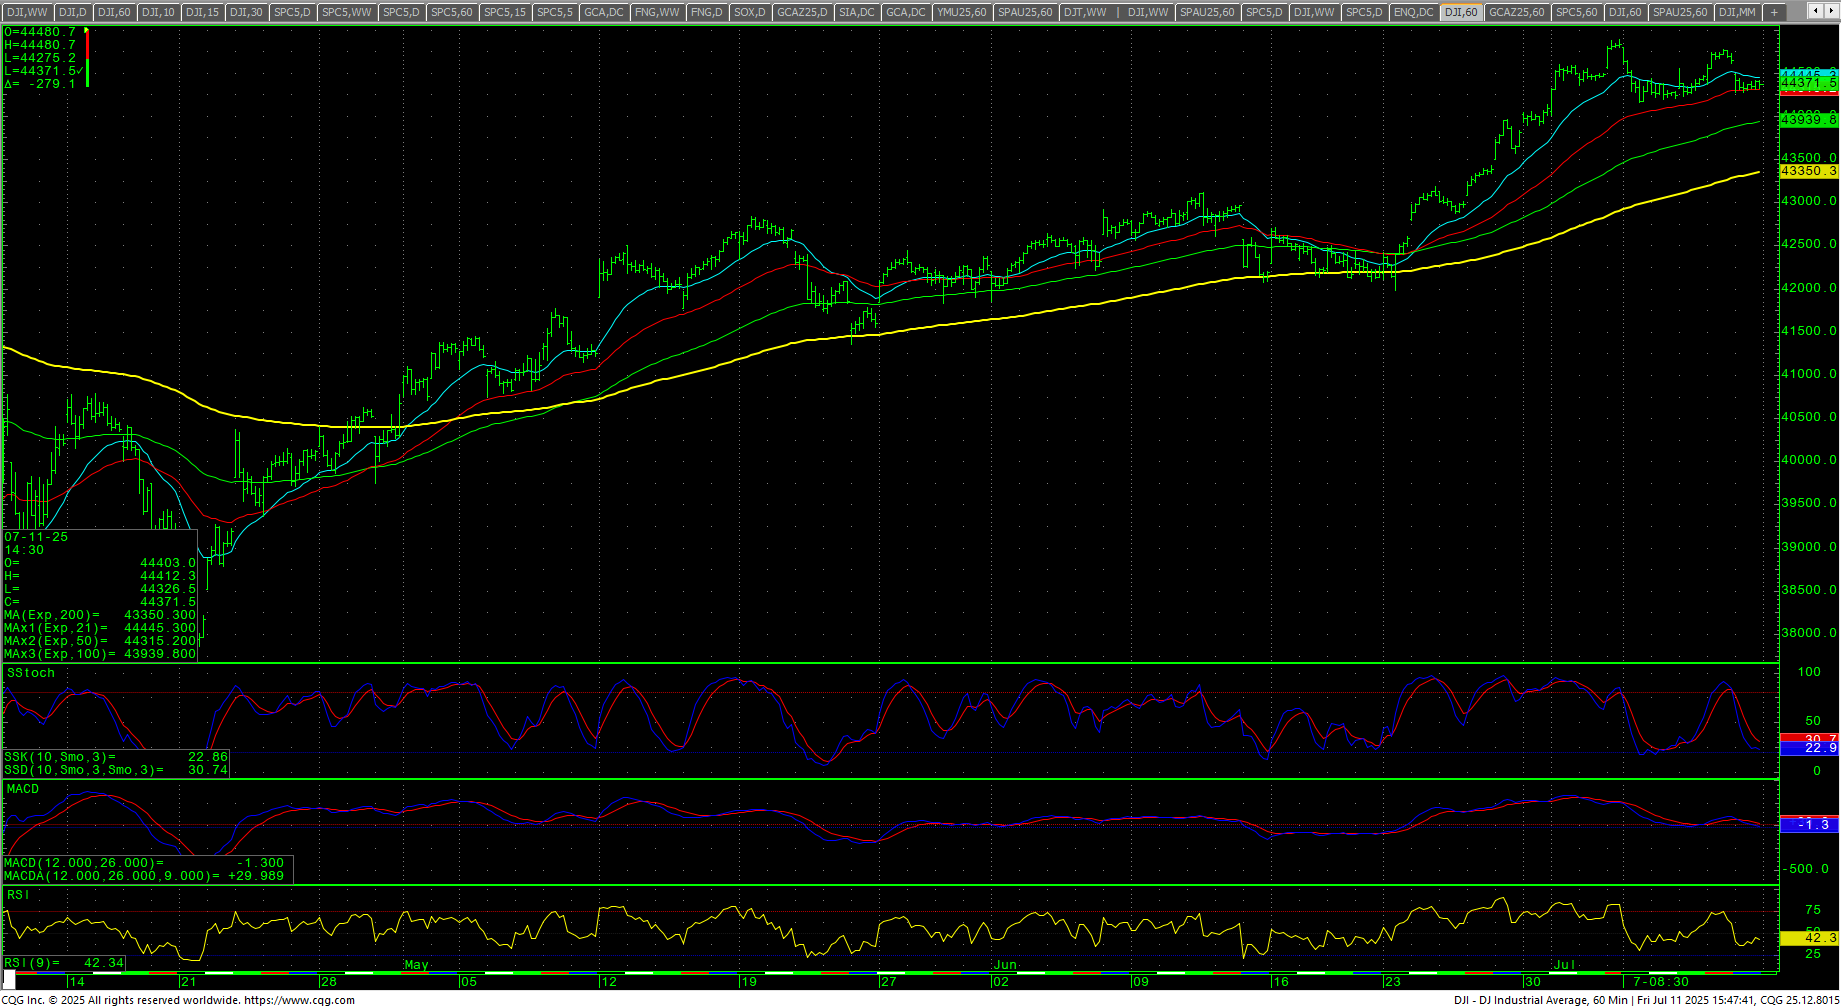 The hourly is slightly oversold on Friday’s close. Resistance is 44437, 44532 and 44608/44612. A drive above 44612 sets up 44704/44714 and 44885 with a shot at the all-time highs at 45050/45054/45074. Closes over 45074 opens counts toward 45244 and 45426/45450 (Fibonacci target) and resistance at 45306 and 45378. Rallies with closes over 45450 will reopen longer-term monthly targets in the 47400 level with targets of 46568 and 46954.
Support is pivotal at 44200. A further breakdown under 44200 counts to 43988 with counts to near-term pivotal support at 43776/43773. Closes under 43773 should test 43433/43430 with counts to critical near-term support at 43090/43085. Closes under 43085 should minimally test 42707/42666. A breakdown under the 42666 area will set up 42236/42187. Under 42187 sets up 41725. Closes under 41725 are bearish to 40758 with full potential to critical support of 39772/39668.
| Resistance | Support |
|
|
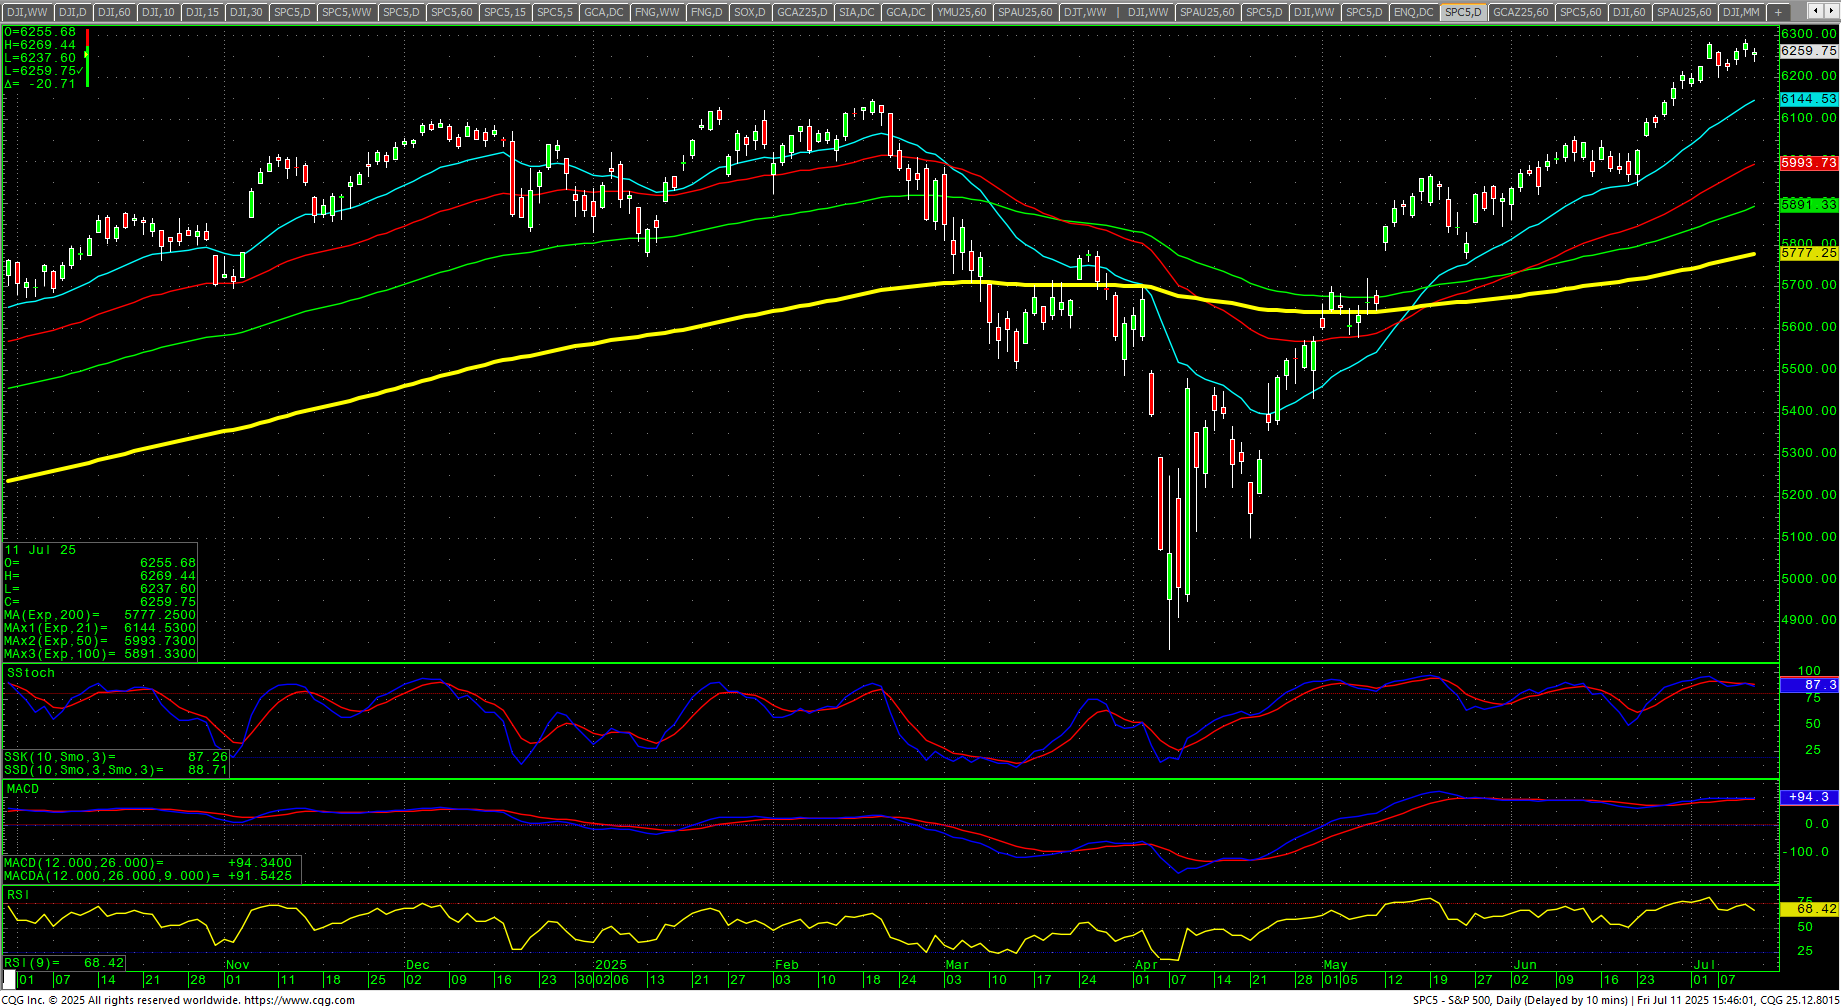
S&P 500 Cash Index: SPX
S&P 500 Index Weekly H-L-C
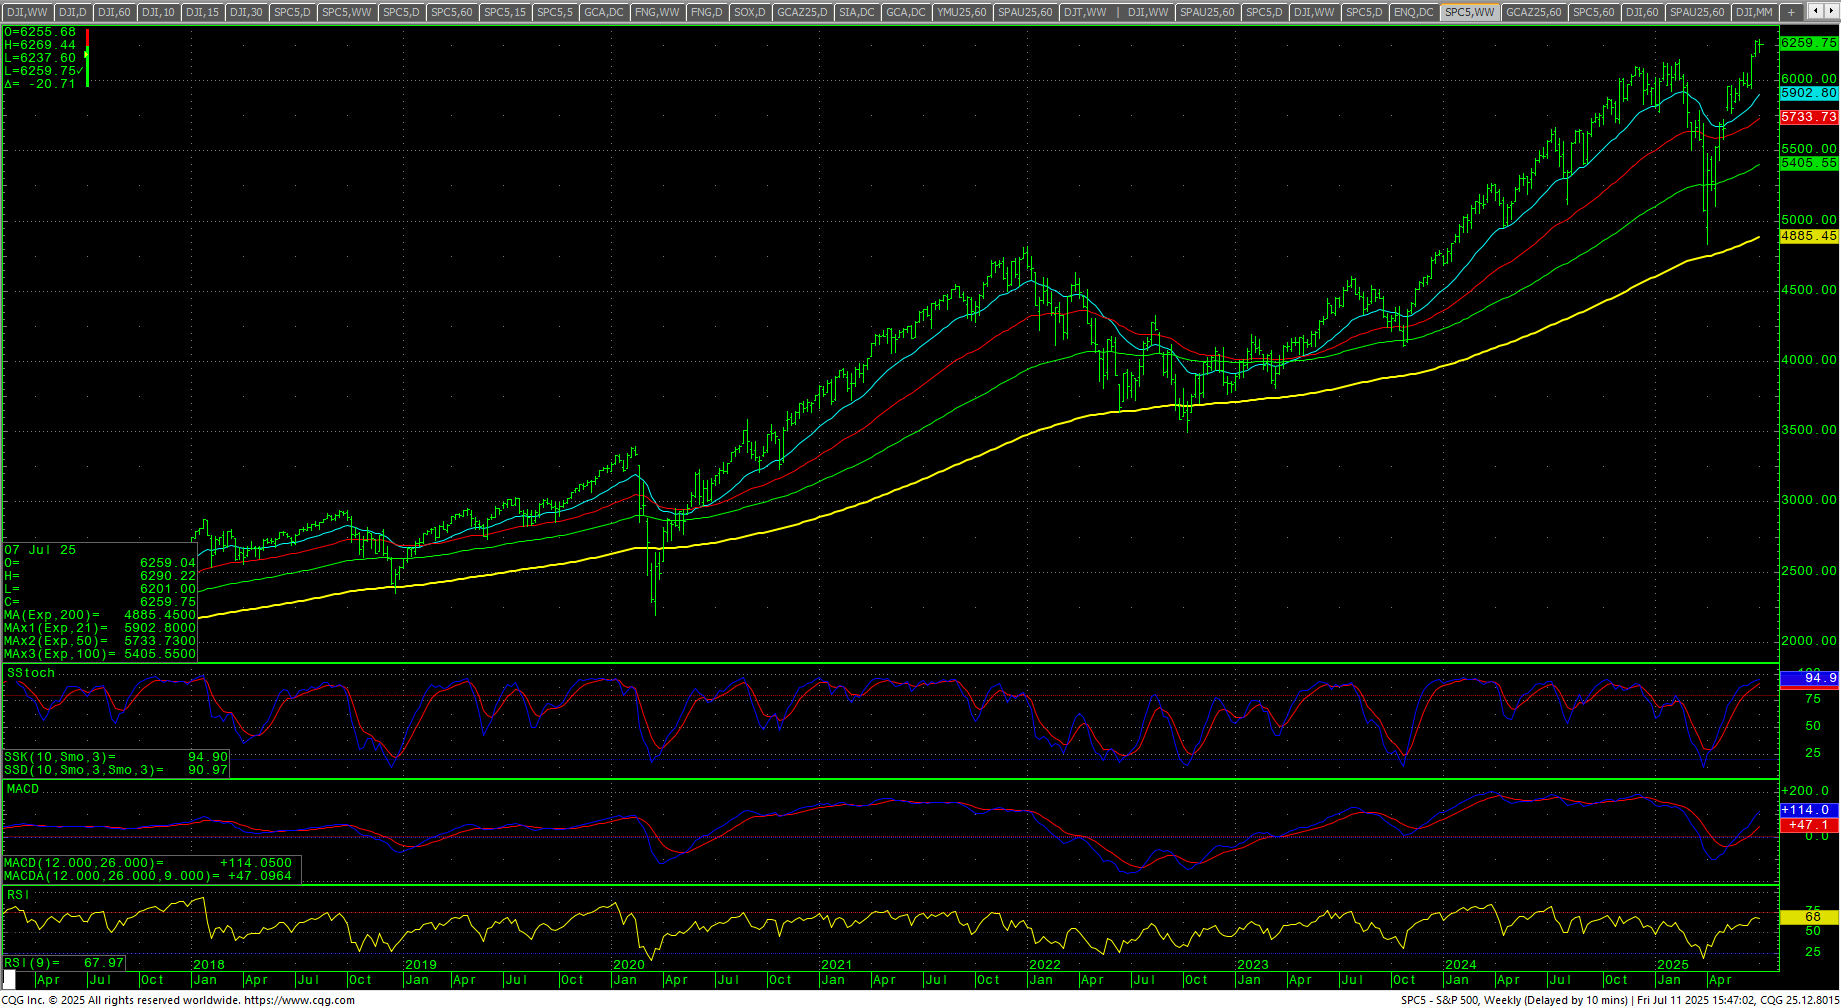 The S&P traded a record high intraweek before losing ground on Friday to settle lower in a tight reversal week. Prices moved toward humungous call walls between 6300/6400 as positive gamma eluded the bulls (for now). The weekly is extremely overbought but still in an uptrend. The daily is severely overbought in its vertical move from the gap on 24 June 2025. The hourly is neutral on Friday’s close. The 200-day MA is 5777.25 and is trending higher as it sets a new record high.
SPY Daily Candles
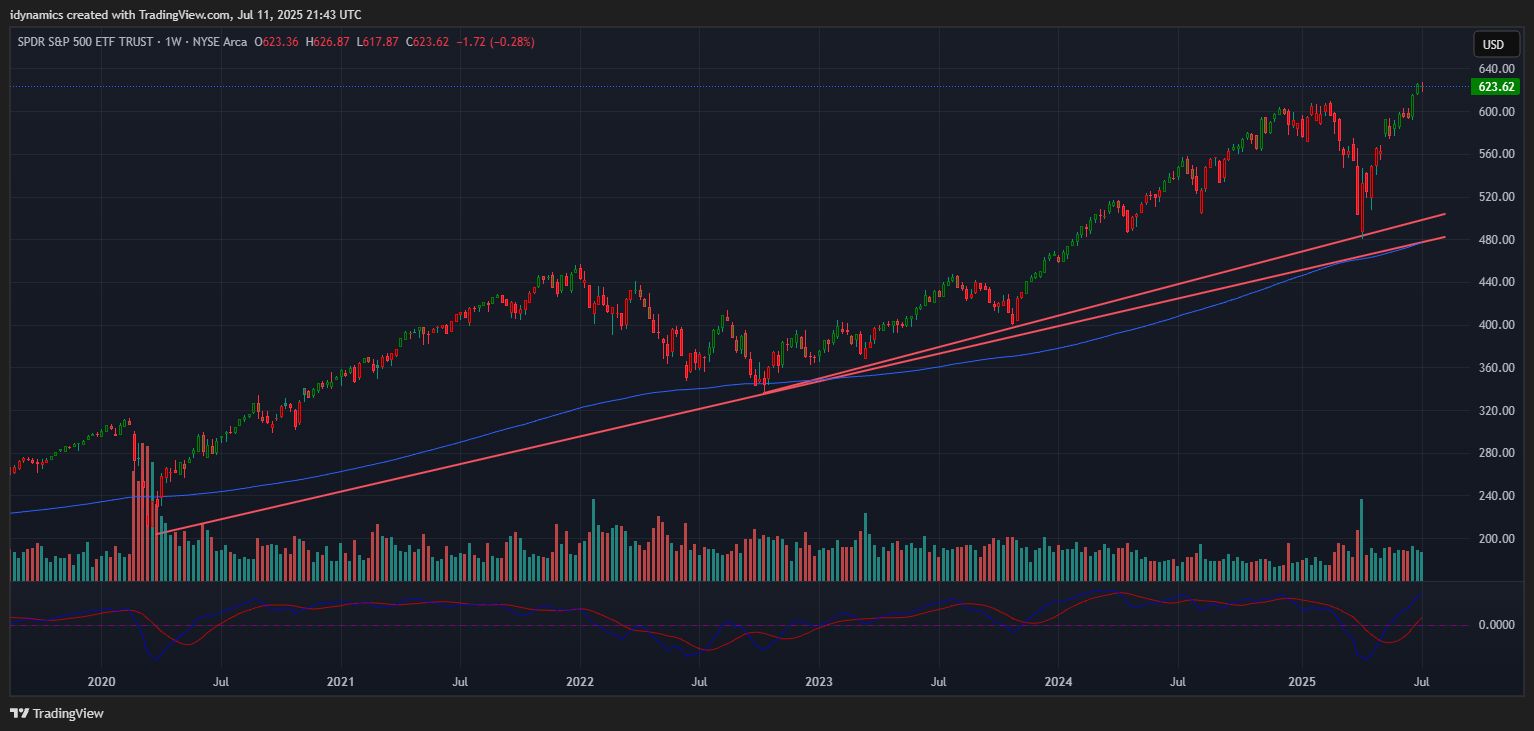 Resistance is 6269/6272 and a drive above that level should fill the gap left Friday at 6280 and sets up a retest of the 6290/6291 level with target resistance at 6296. Rallies with closes above 6296 can carry to 6368 with counts into the 6440 area. Closes over 6440 will open counts to 6584. A breakout over 6584 sets up 6638 and 6692. A breakout with closes over 6692 sets up 6764 and 6800. Closes over 6800 can carry to 6872 and 6908.
S&P 500 Index Hourly H-L-C
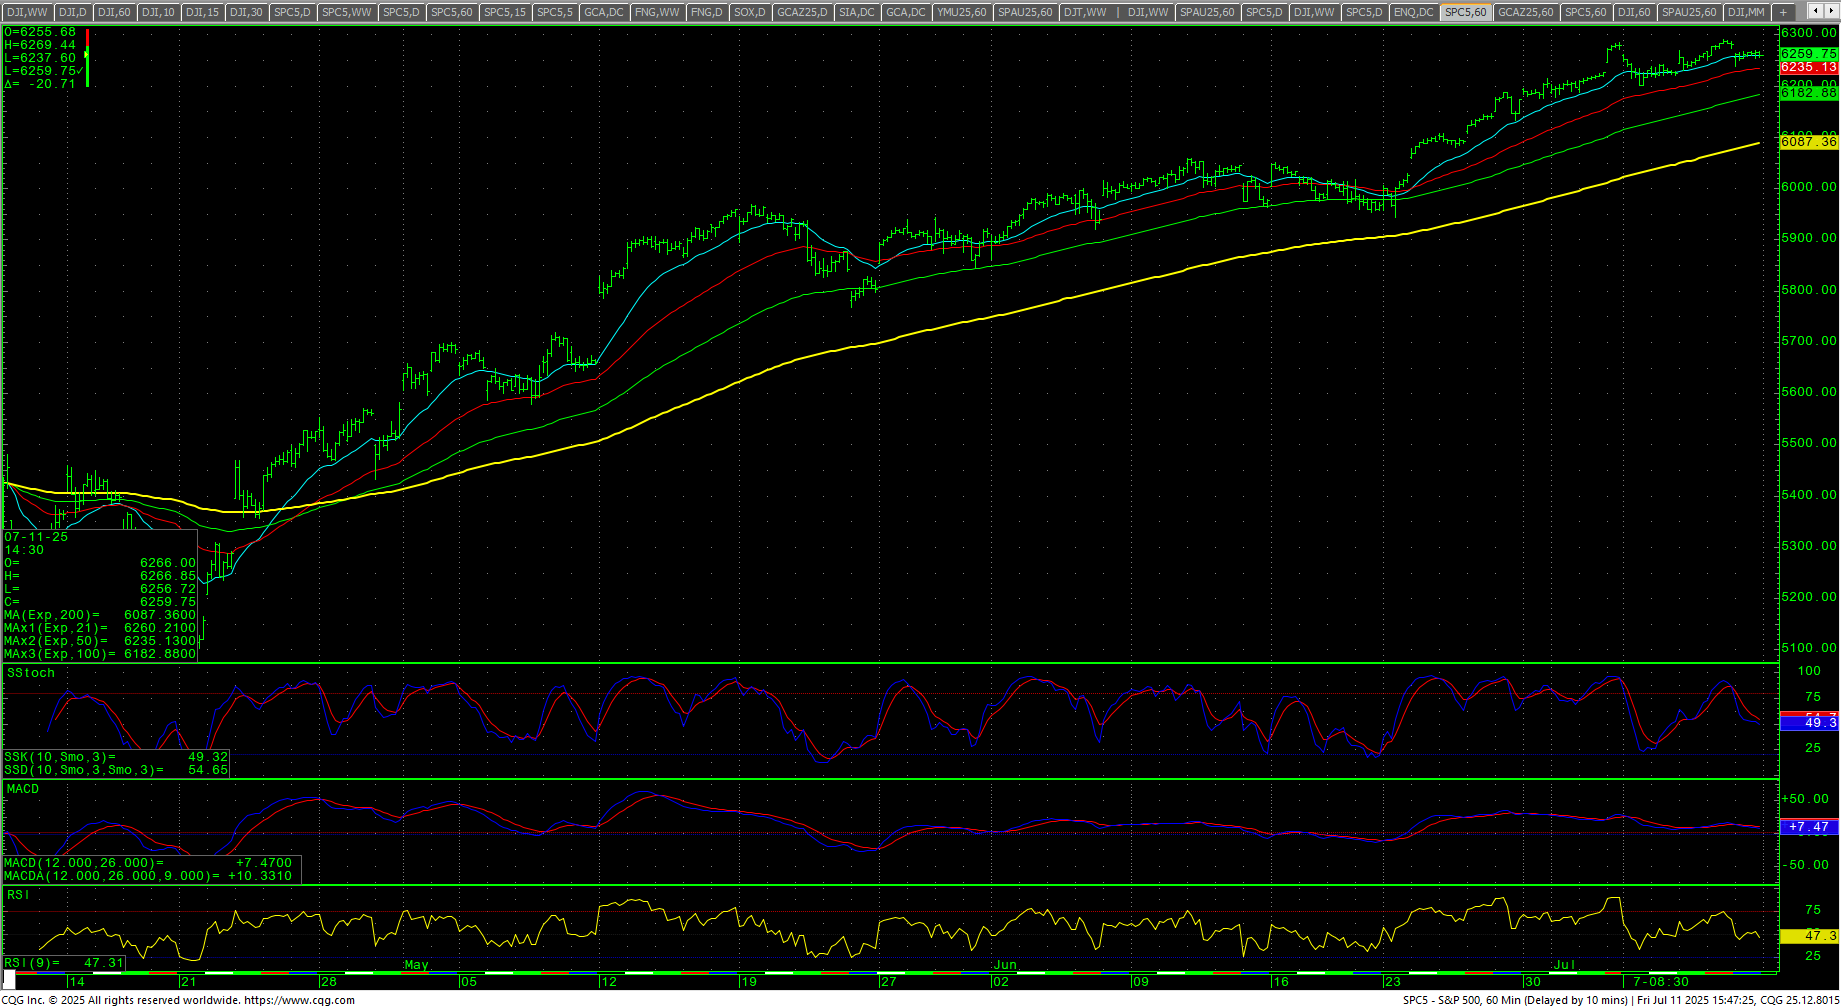 Support is 6208 and 6157. A move under 6157 should test 6116 with potential to pivotal short-term support against the 6075/6072 area. A breakdown under 6072 sets up 6025 with full counts to 5947. Closes under 5947 are bearish to 5734, 5562 and counts to critical short-term support at 5390/5385. Daily closes under 5385 are bearish for a move to 5221 with support of 5629. Closes under 5221 will open counts to 4890/4885 with full counts to 4560/4655. Closes under 4655 can see 4191/4152.
| Resistance | Support |
|
|
Charts courtesy of CQG, Inc., CNN, Koyfin, Trading View and AAII