
TECHNICAL ANALYSIS (by Intraday Dynamics)
Major Indices Week of July 18, 2025
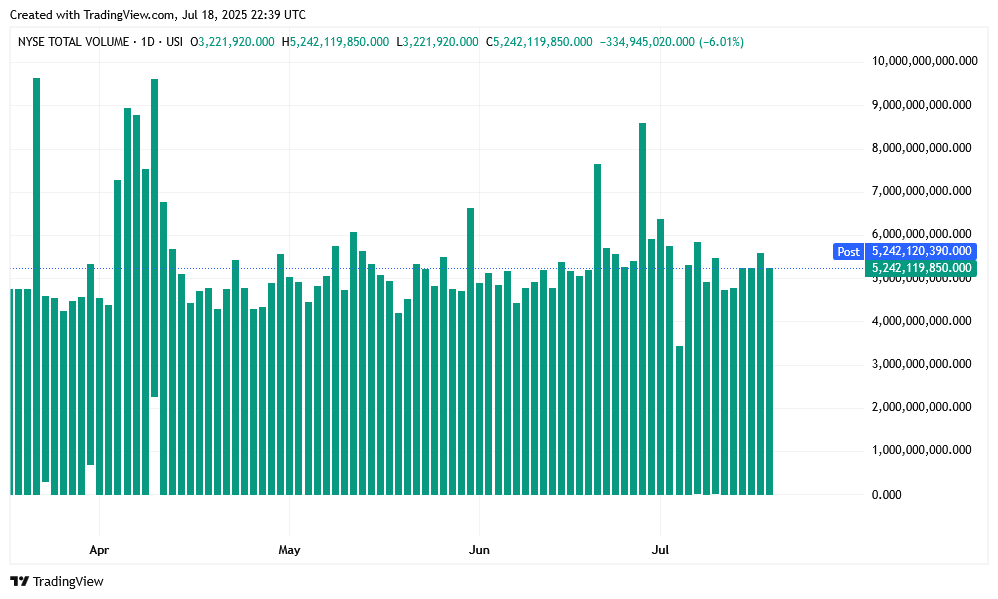
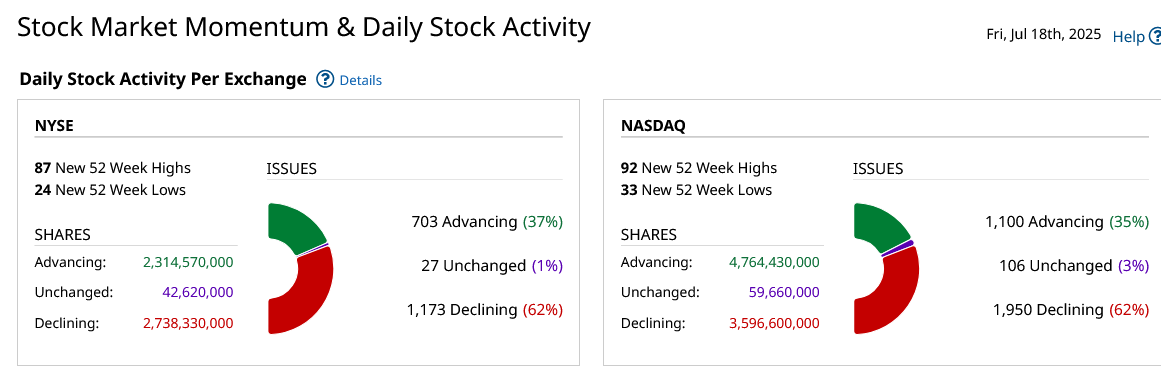
 NYSE Volume
SPX Daily Candles
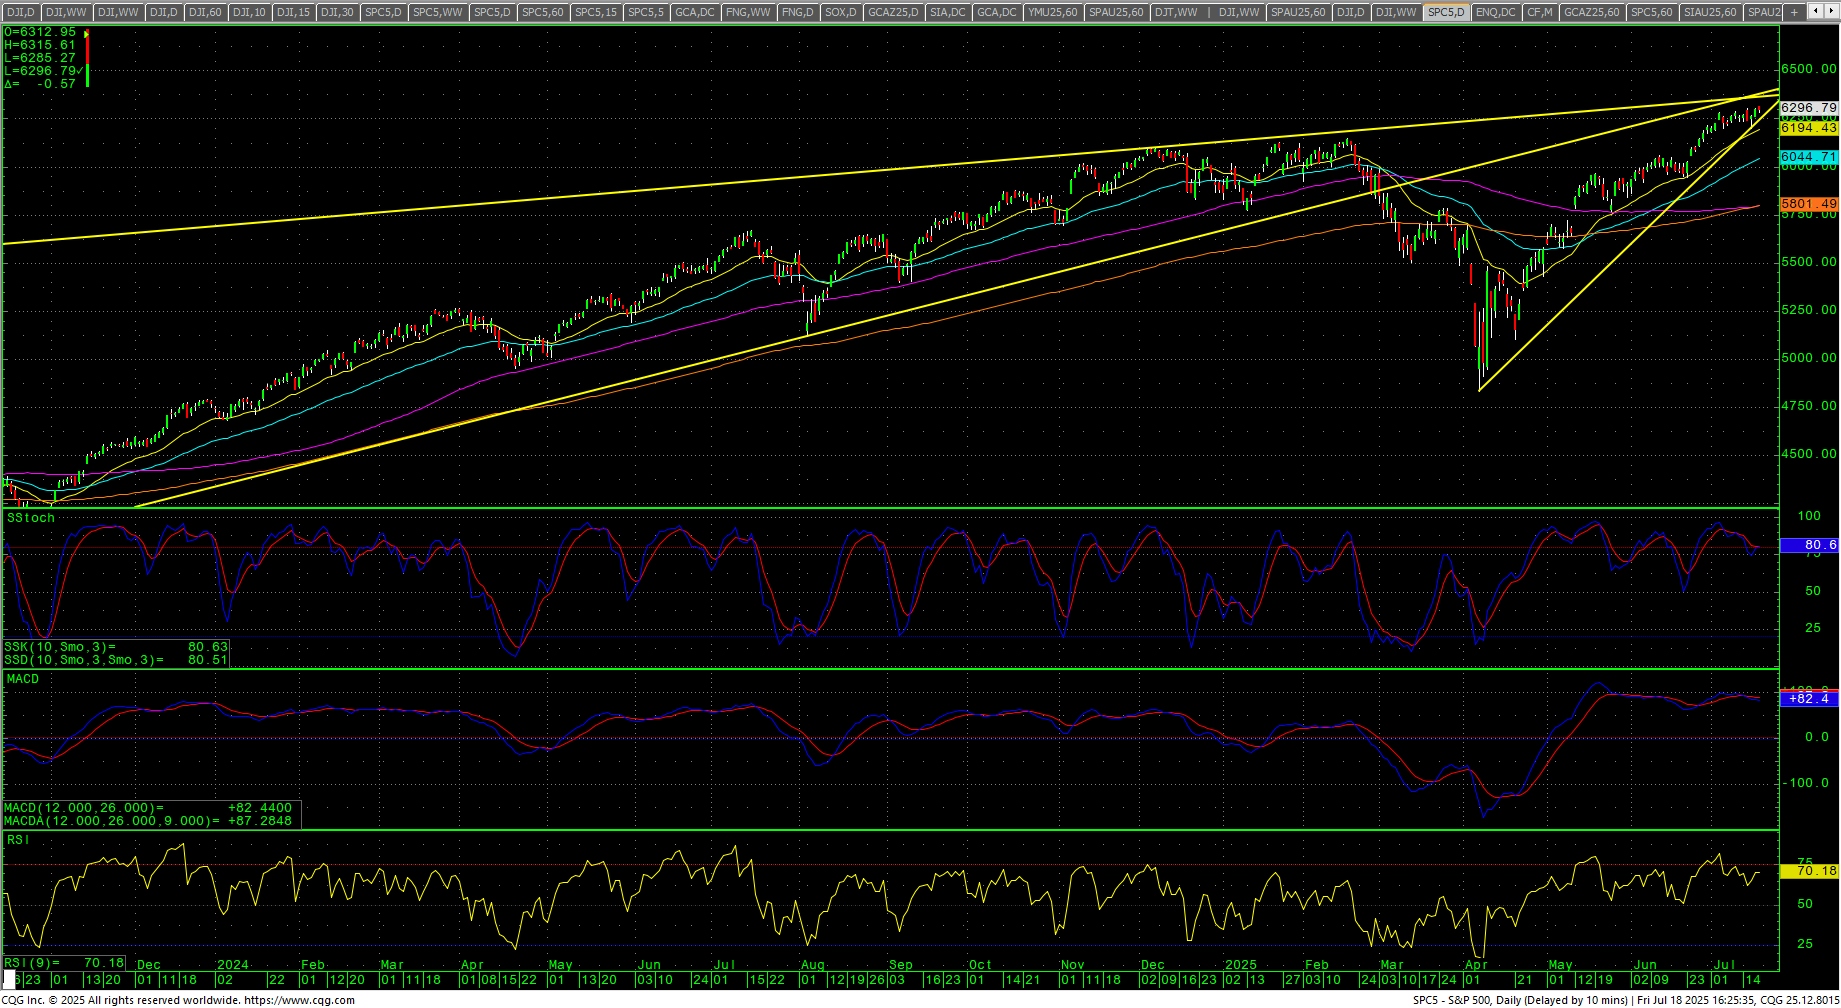 Stocks closed out the week mostly higher across the board with all-time highs in tech and top-tier indices. As goes tech, so goes the market. Retail traders continue to dominate the asset managers and, as long as tech stays strong, they are in the drivers seat. On the SPX Daily Candle above, you can see that the two major trendlines have intersected here in time…while also being extremely close to price against the 6300 level.
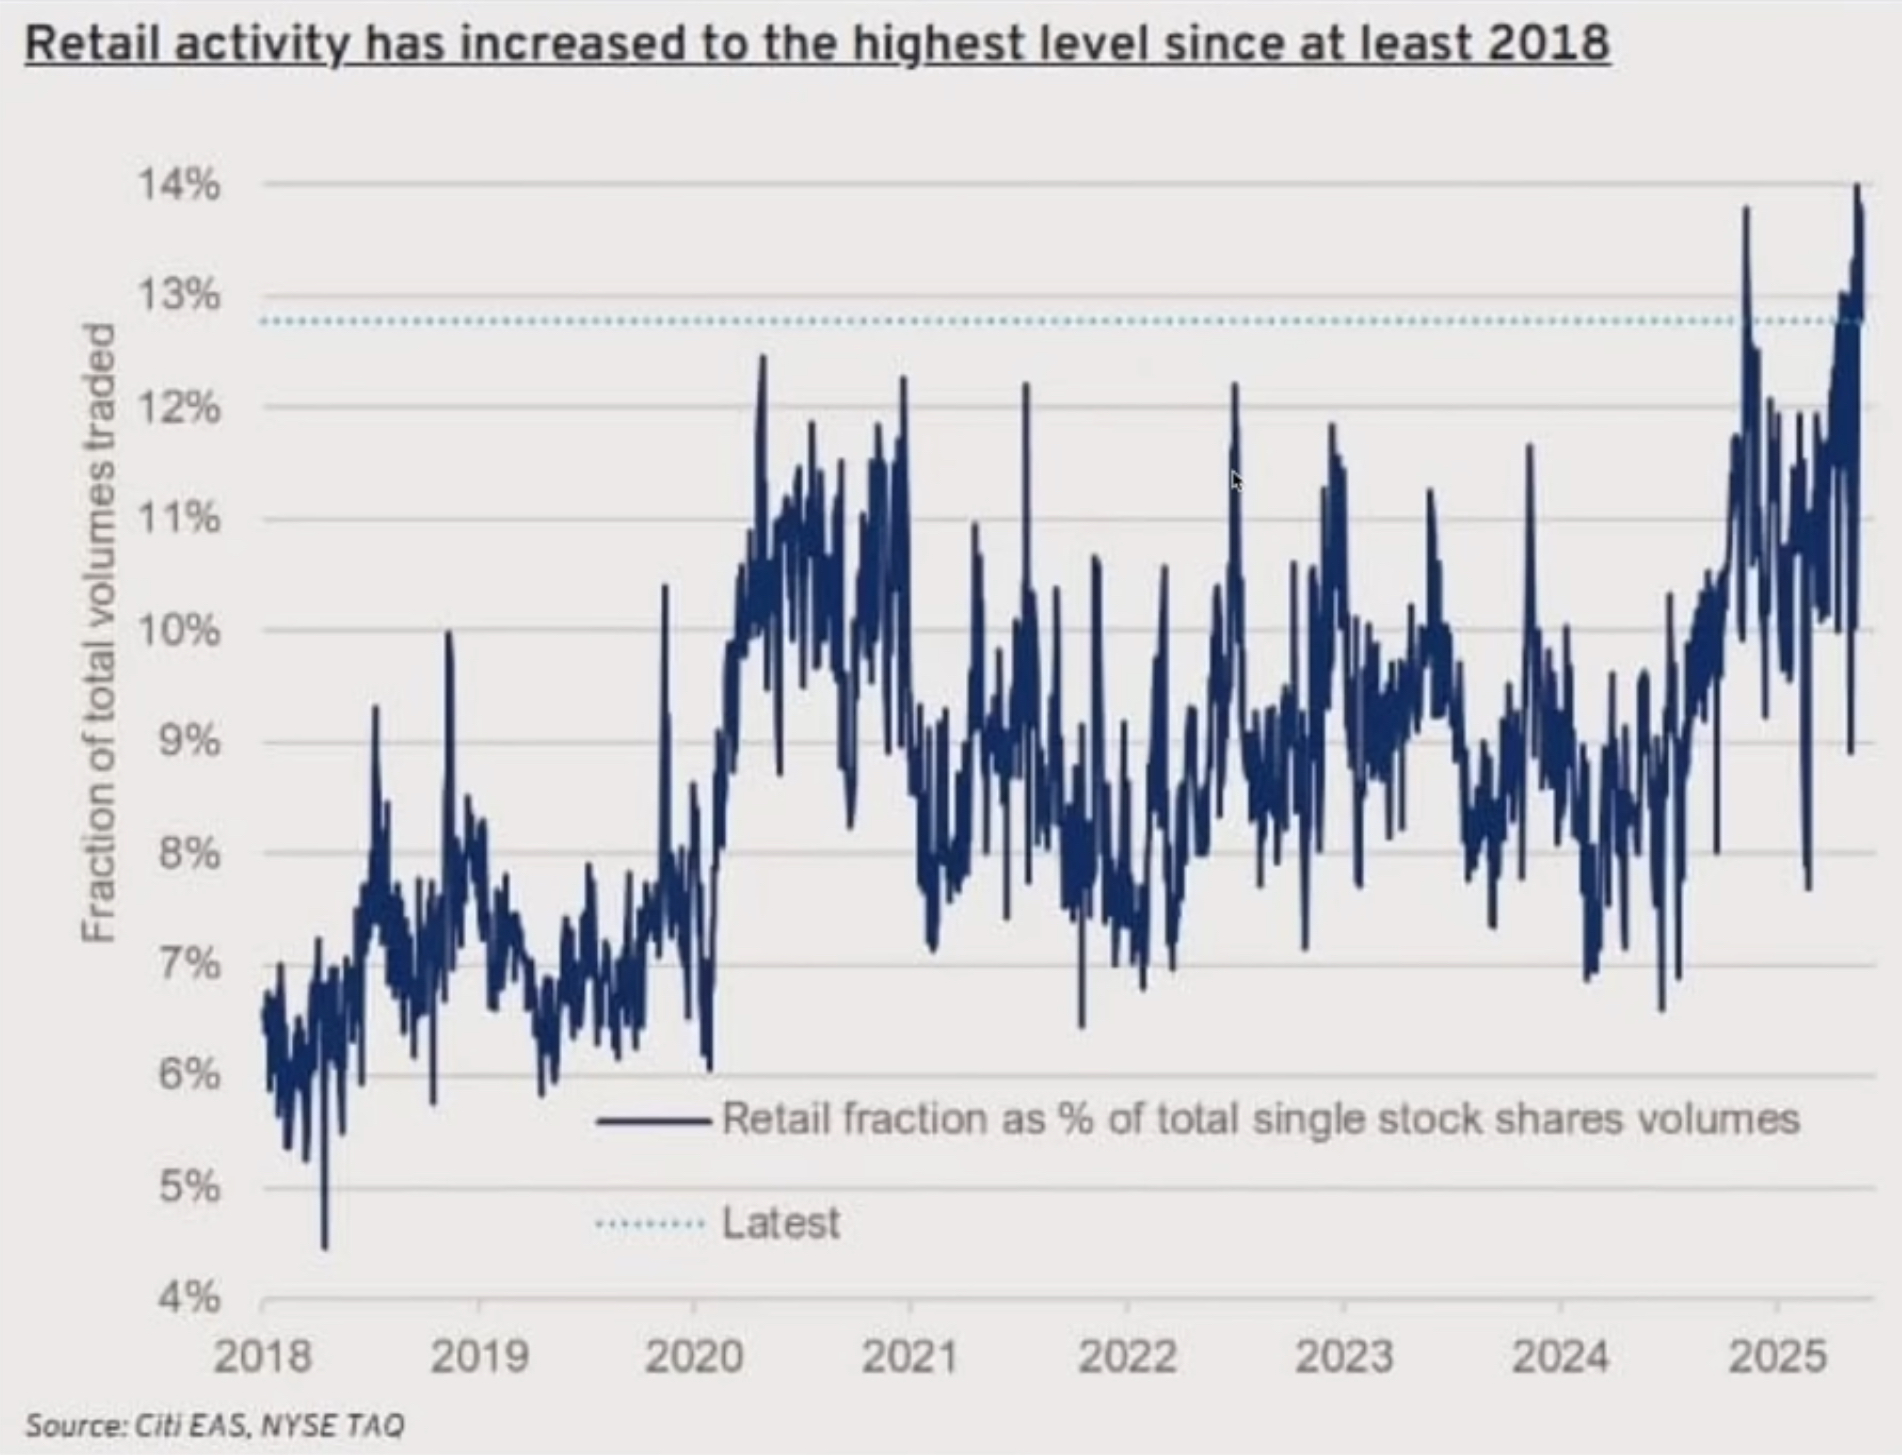
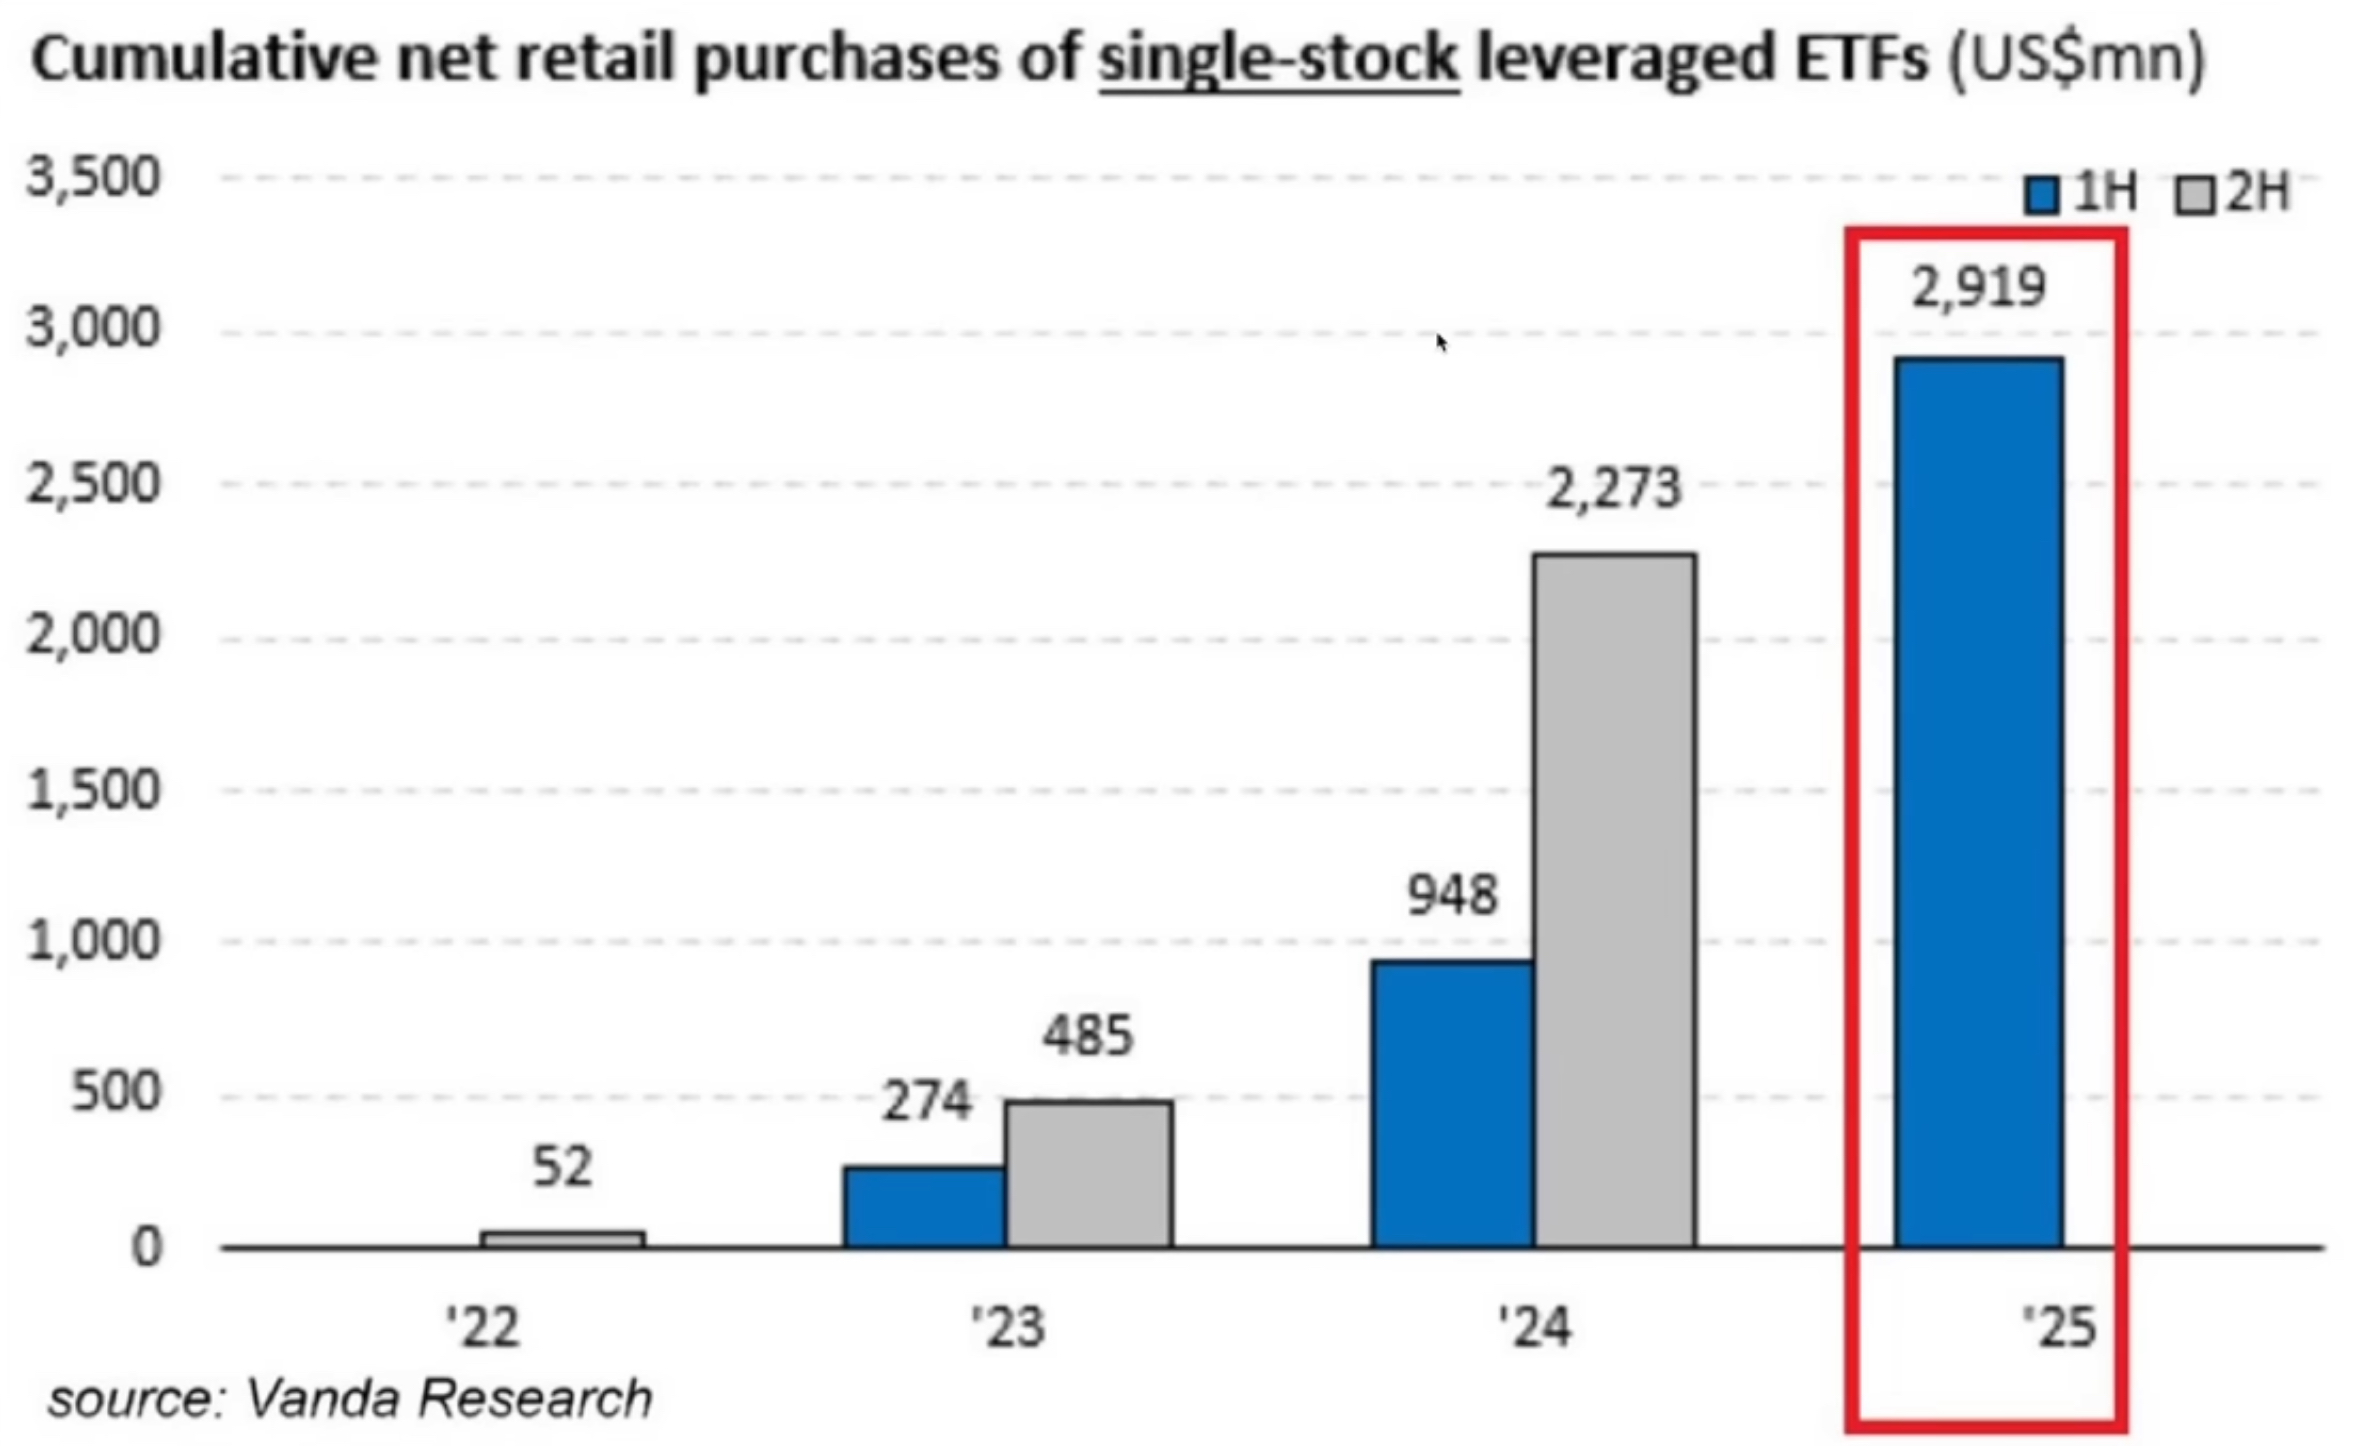 Wall Street, and the smaller “dumb” money traders, have shrugged off the August 1 “Tariff Date” and are betting on yet another TACO. Another strange occurrence this time around is a cottage industry that has sprung up outlining the “best stocks to trade when tariffs go into effect.” The reality is the first two weeks of August kick off a massive storm of cycles that run well into late fall. The critical cycle timing in August is a hurricane of activity that should see increased volume and volatility.
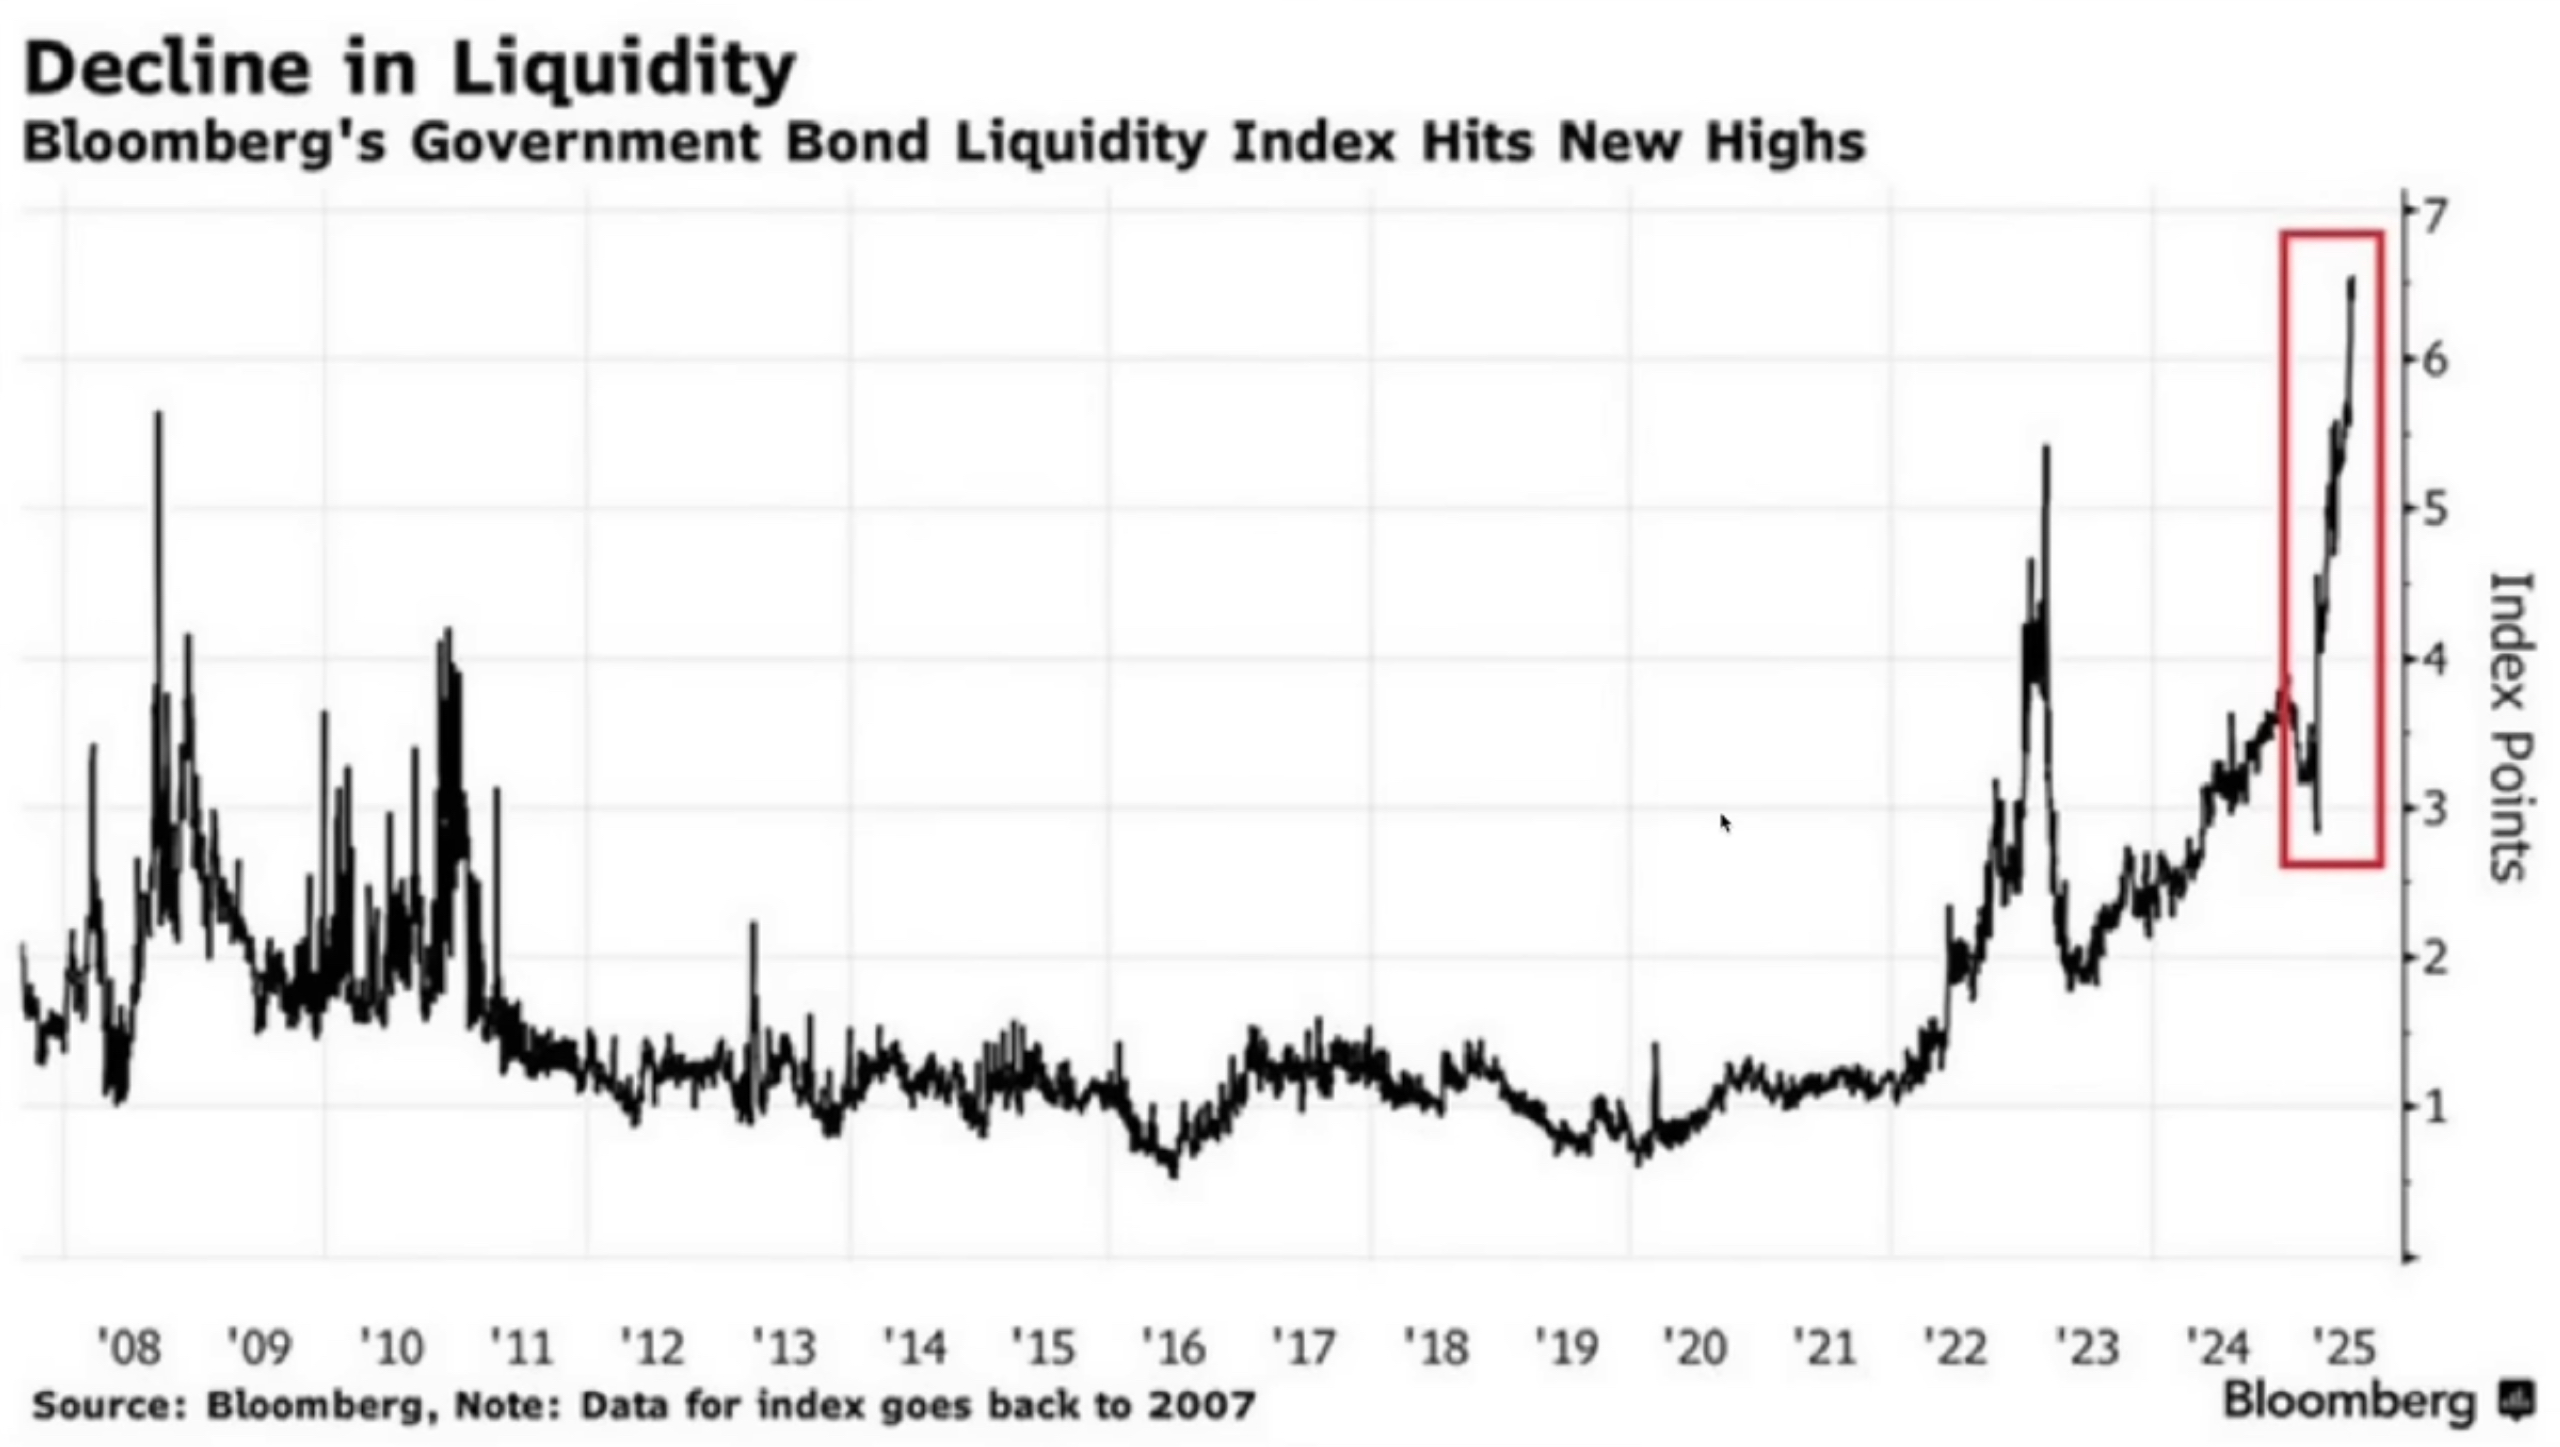
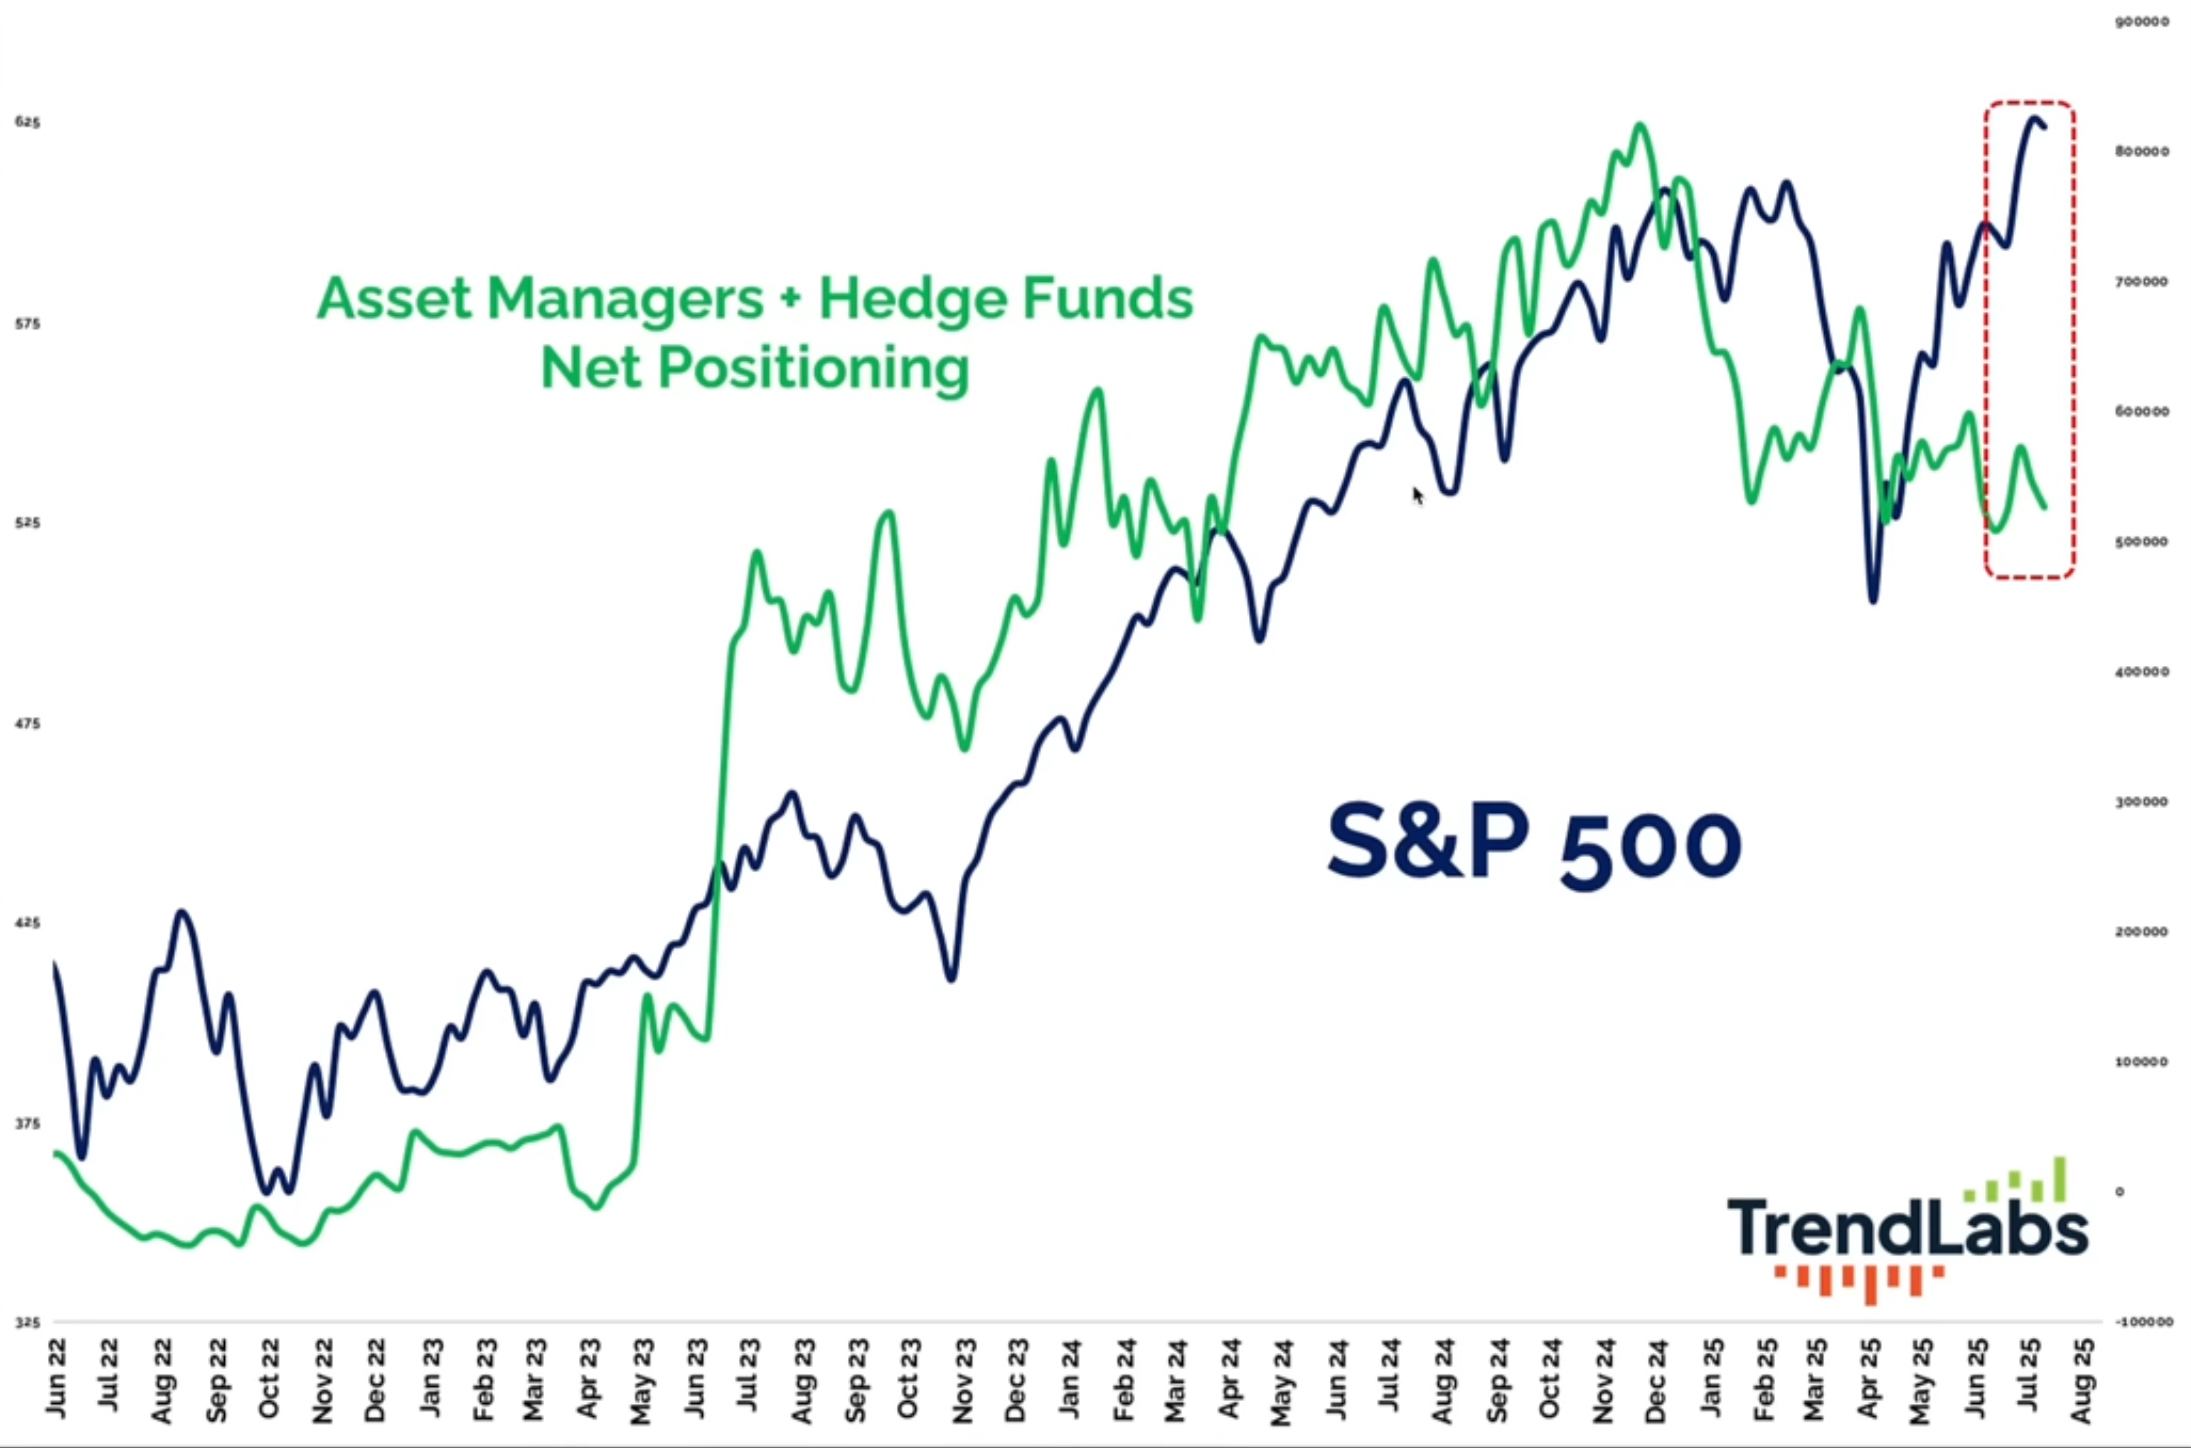
Liquidity has reached extremes above the 2008 GFC levels. A higher index value signifies poorer liquidity, suggesting that the current liquidity conditions are worse than those experienced during the 2008 financial crisis. Yet, asset managers and funds are way behind the market right now and it is clear that the small traders are driving prices to new highs.
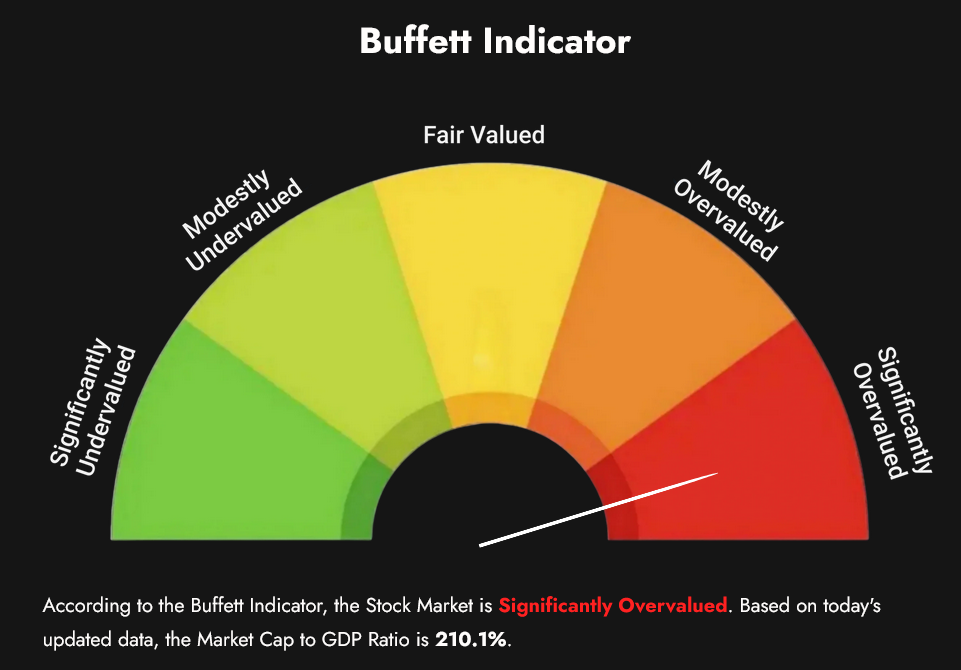
 Sentiment remains primarily in extreme greed readings. The Buffet Indicator has touched an all-time record high, hitting +210.1%.
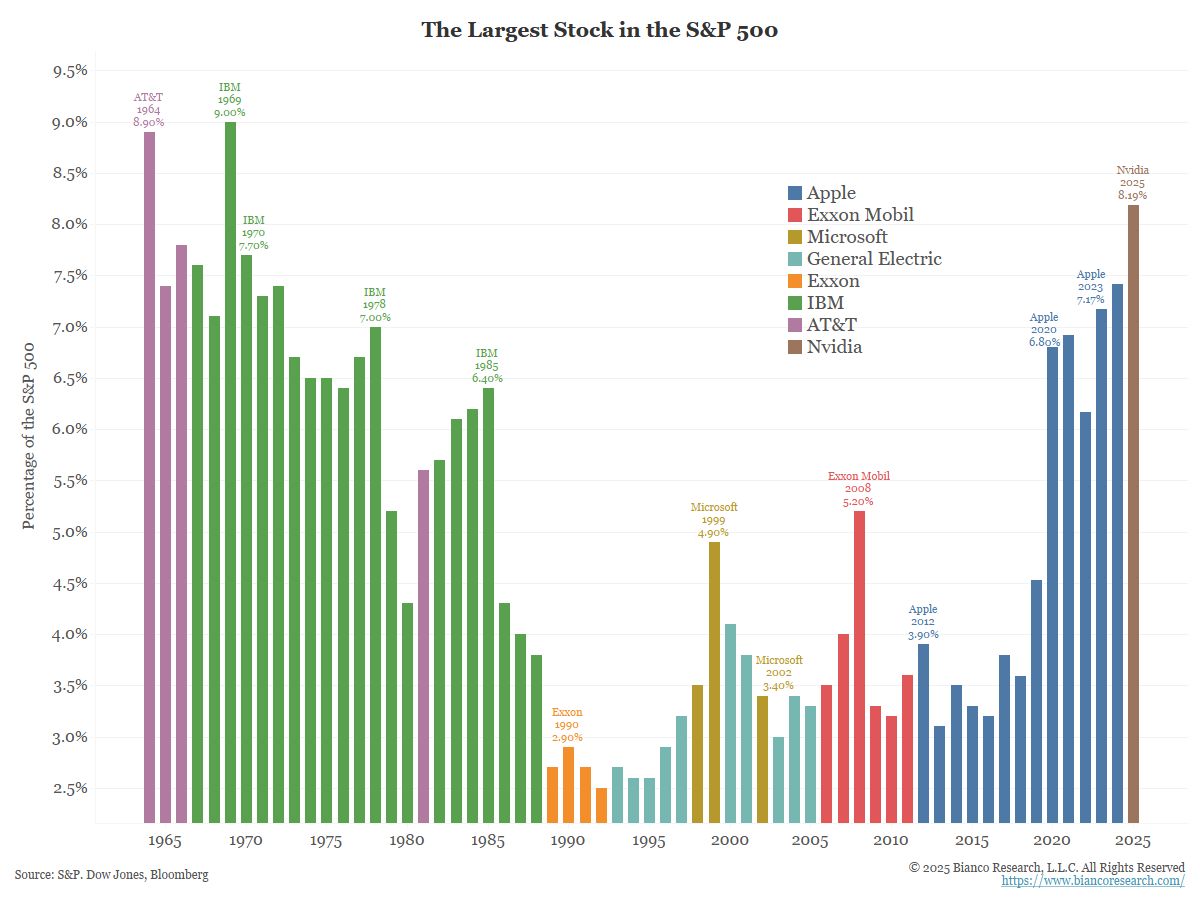
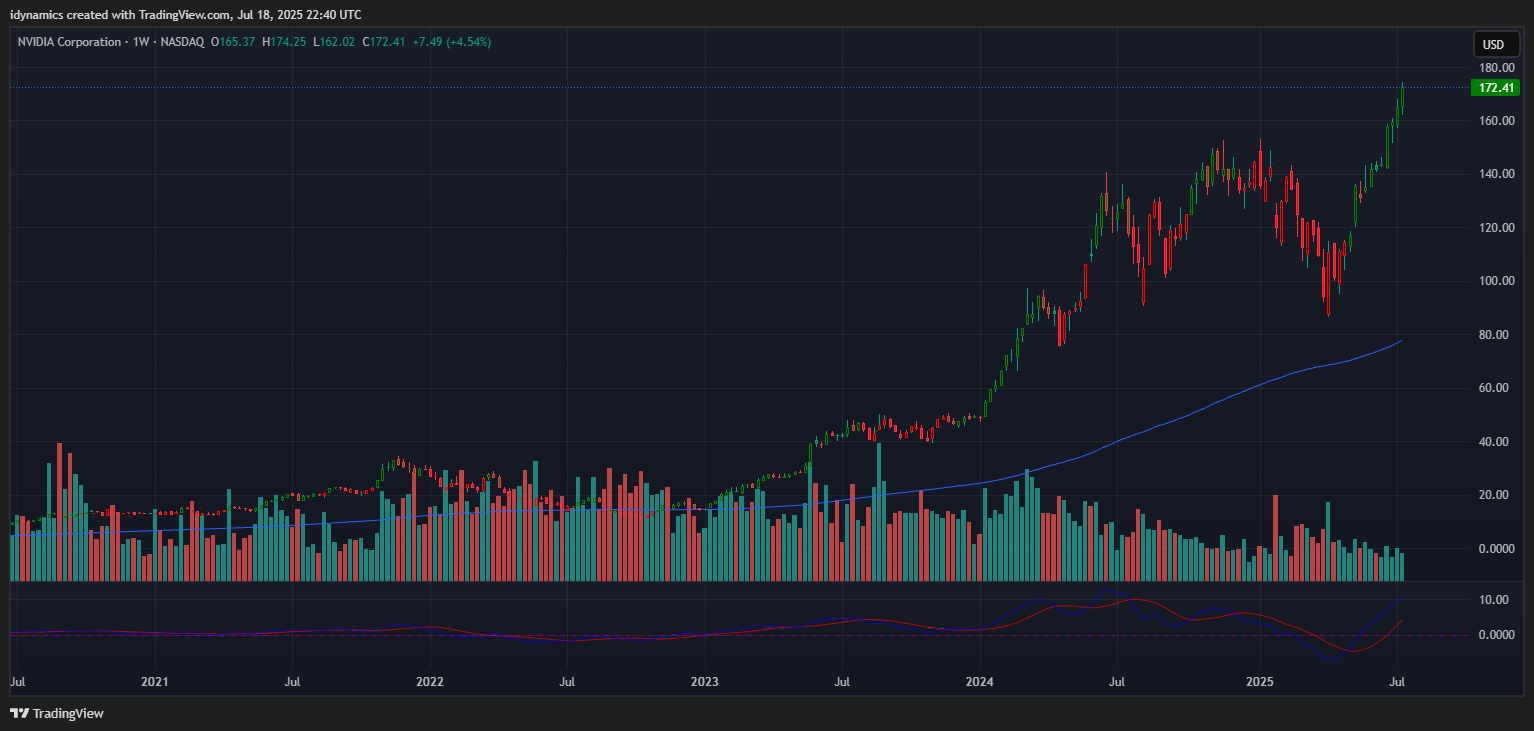
The last time a single stock in the S&P 500 accounted for over 8% of the entire index was 1969 with IBM. NVDA has taken that spot in 2025.
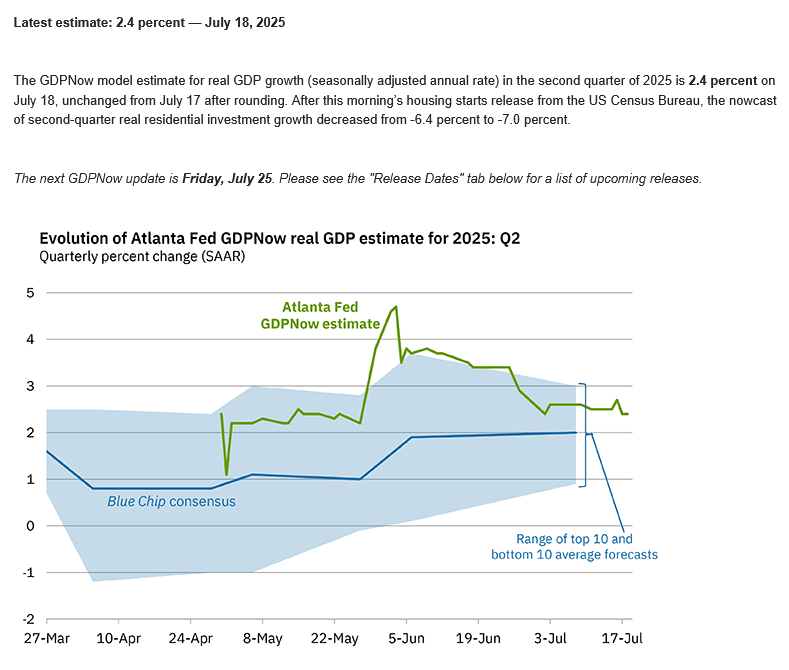
 Since GDP is measured against the previous quarter, Q2 ’25 is now estimated to come in around +2.4% from the Atlanta Fed.
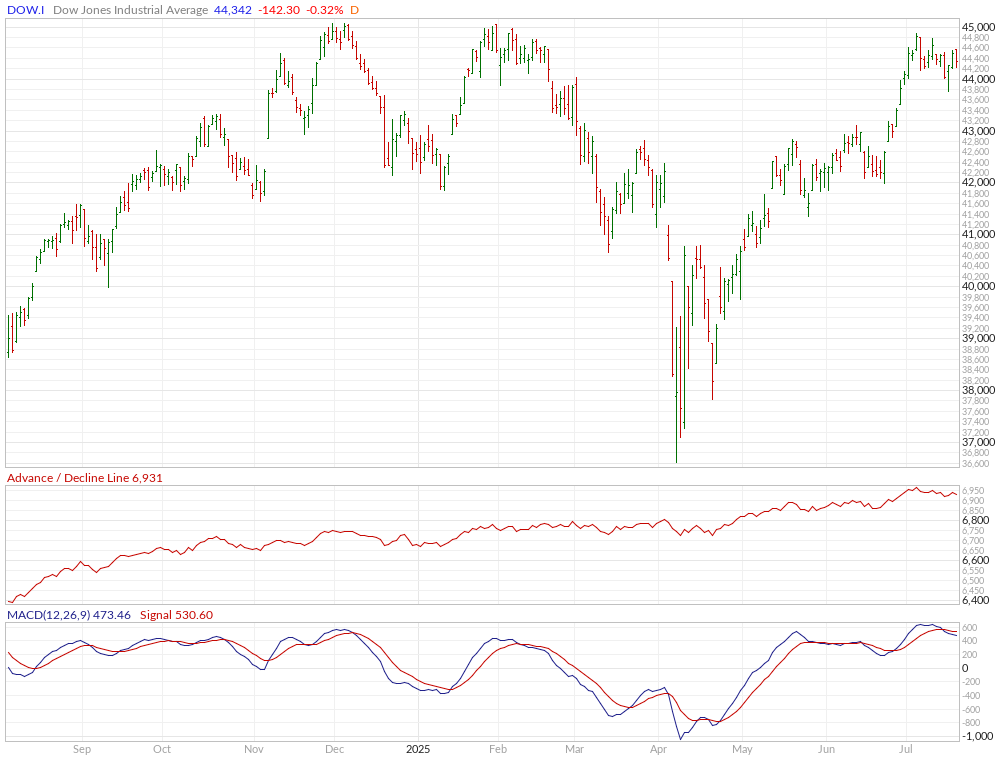
Dow Jones Industrial Average Weekly Candles
 For an update on the longer-term timing outlook, please see the latest update. We are now in a massive longer-term window where the confluence of long-term cycles begins to collide. This risk for an exogenous event is heightened in this time frame. August is a month where there is strong potential for an exogenous event to occur.
From the recent posts:
The reality is that we are now entering a 6-9 month window of extremely volatile longer-term cycles. August is when things really heat up with the cycles. The Dog Days of summer are directly ahead.
S&P 500 Stocks Above the 200-day MA
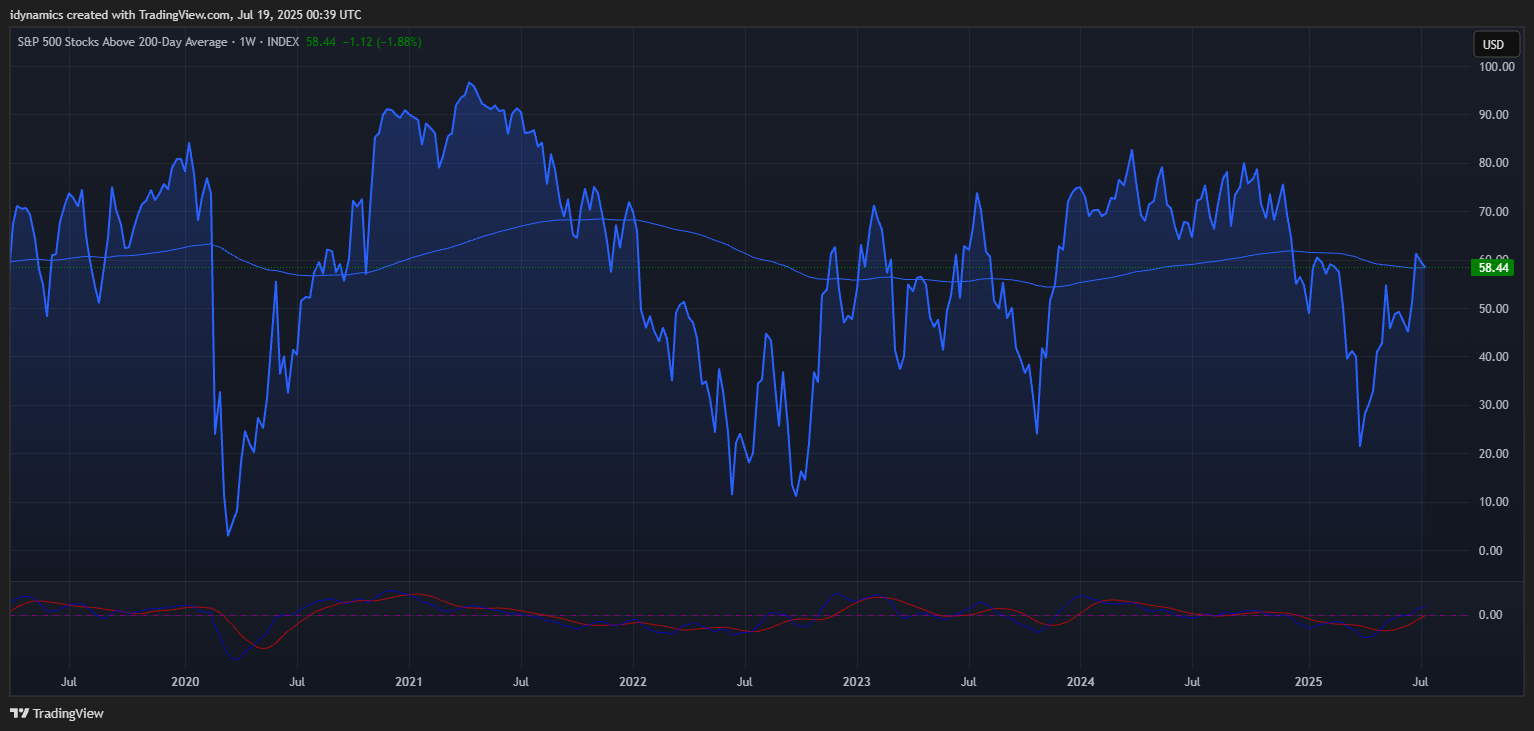 Breadth continues to diverge with the new highs. The percentage of SPX stocks above their 200-day MA ended Friday at 58.44% and is still in a significant divergence. It hit a high of 63.61% in February 2025 and 72.92% in September 2024 and 82.70% in March of 2024.
MAGS (Magnificent 7) Daily Candles
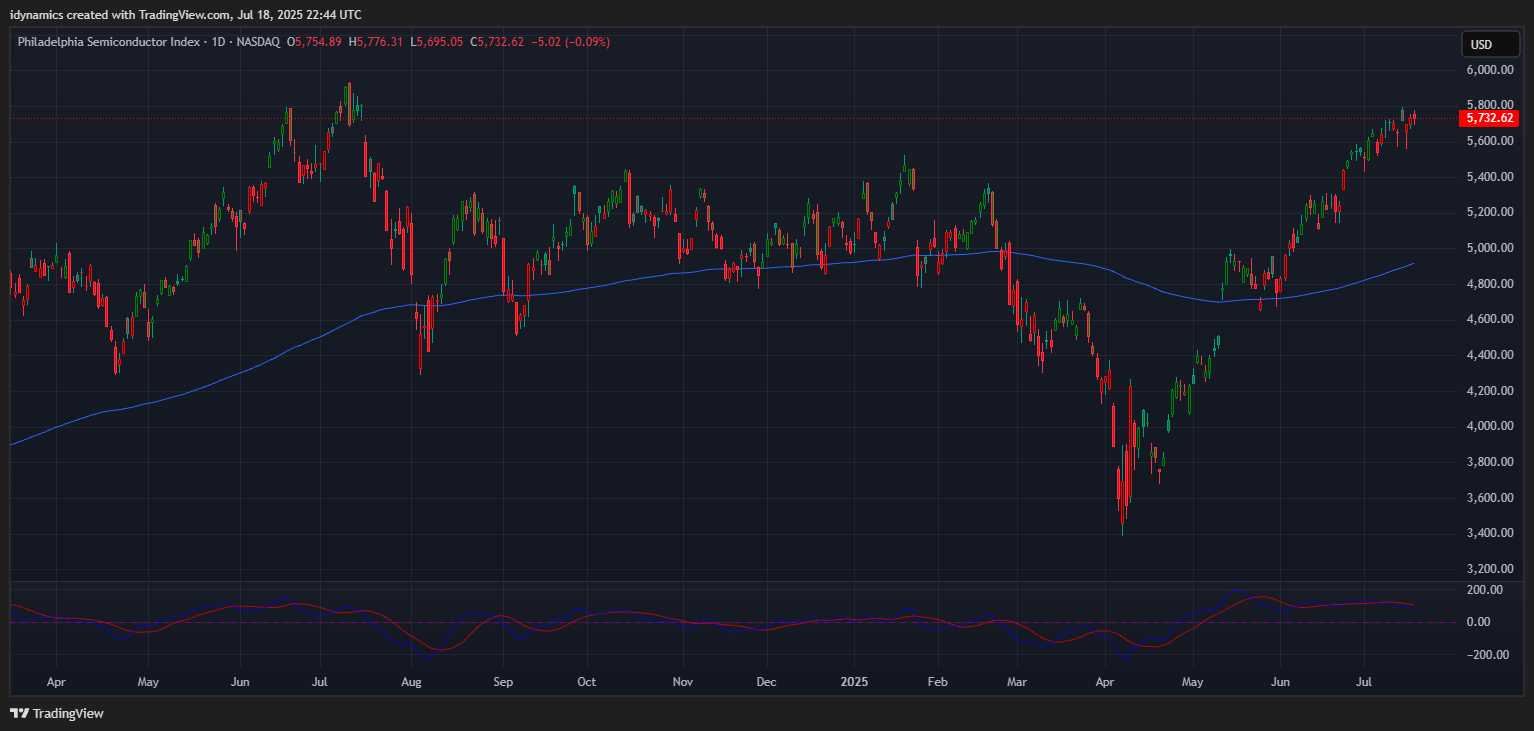
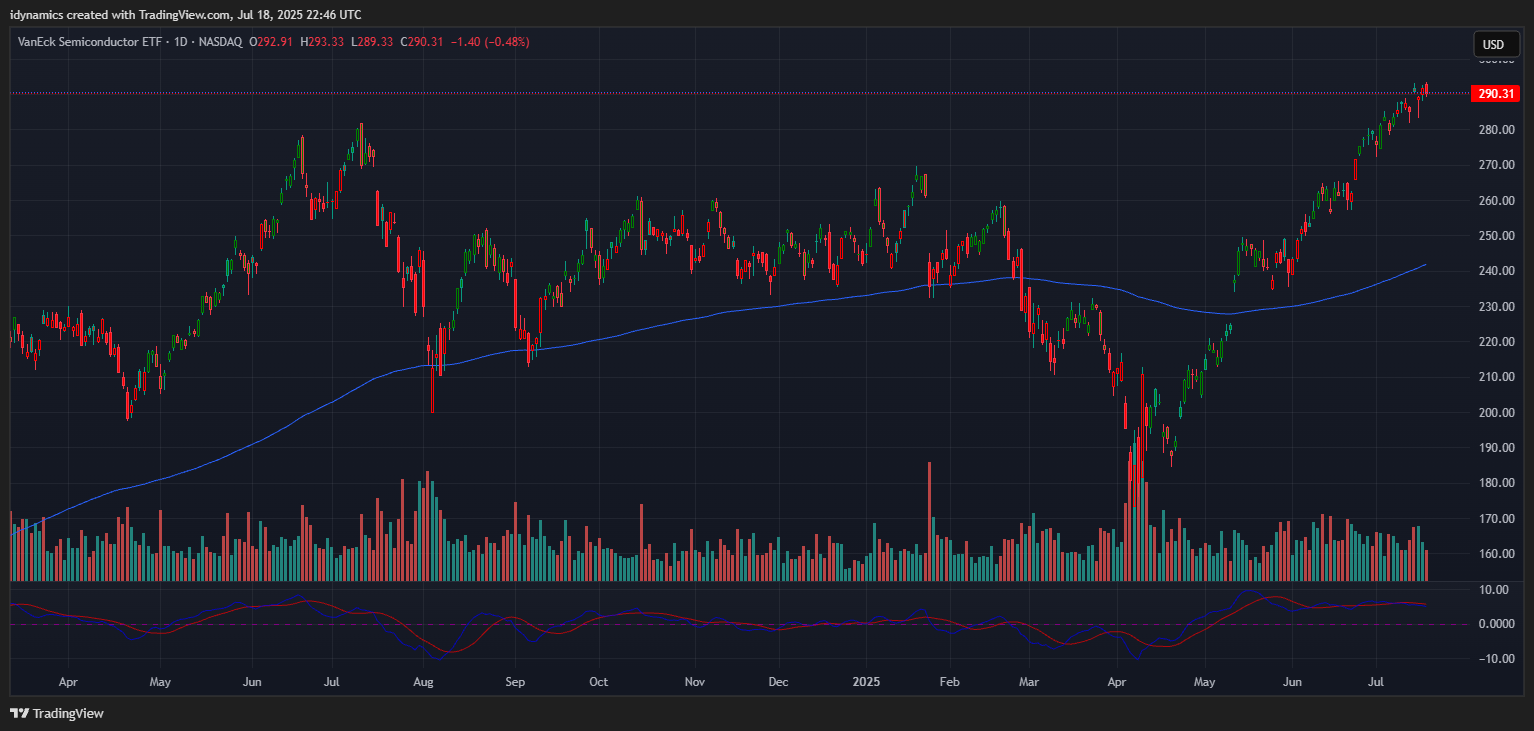
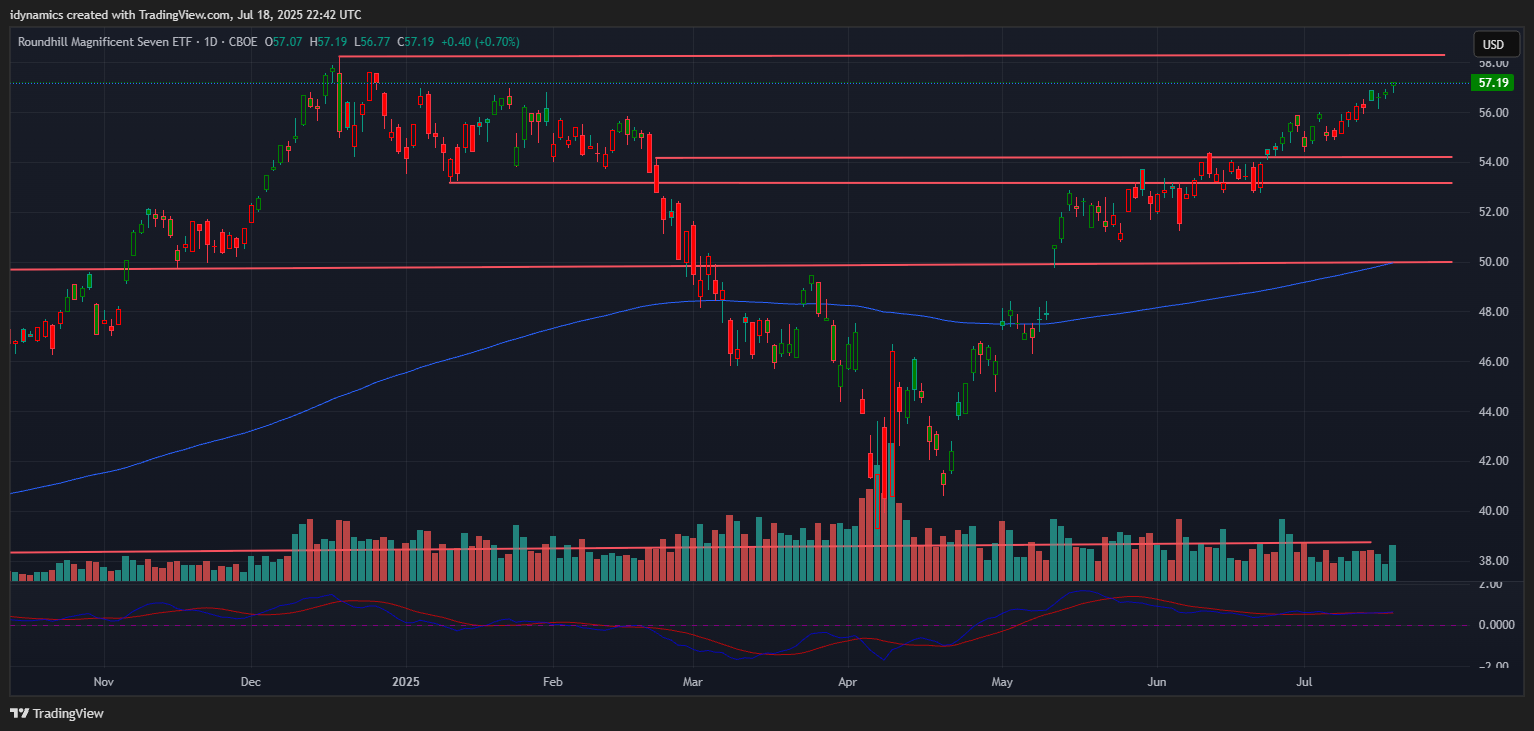 The MAGS moved to a new recovery high and close, settling at the highest close since 24 December 2024. The market is using the 54.16/53.14 area as support now. MAGS closed the week up +1.69% on the top of the week’s range. Prices are poised for a test of the highs above 58. Closes over 58 suggest a push above 60. Another chart that remains bullish is the SOX, which is now just ticks away from the ATH. SMH moved to record highs last week. As goes tech, so goes the market.
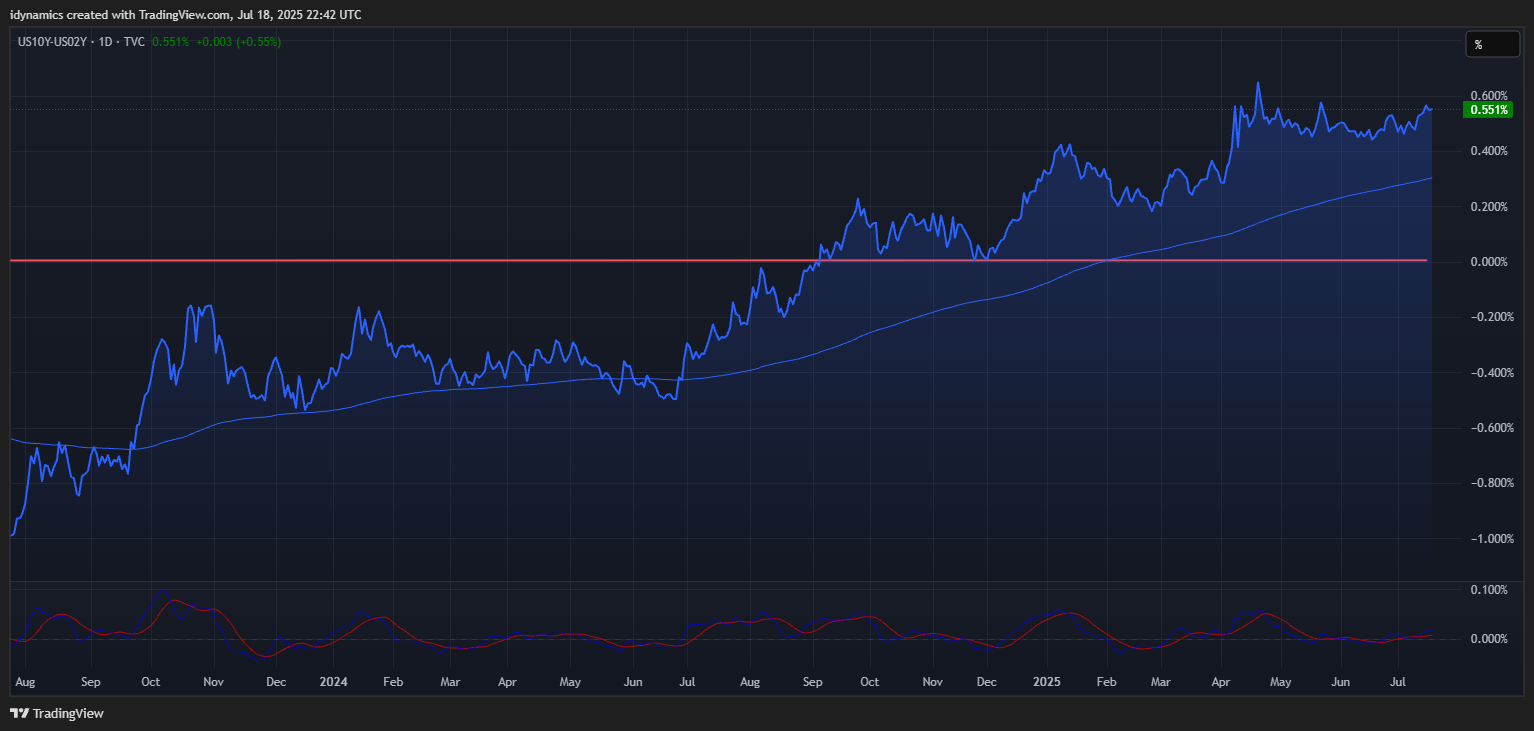
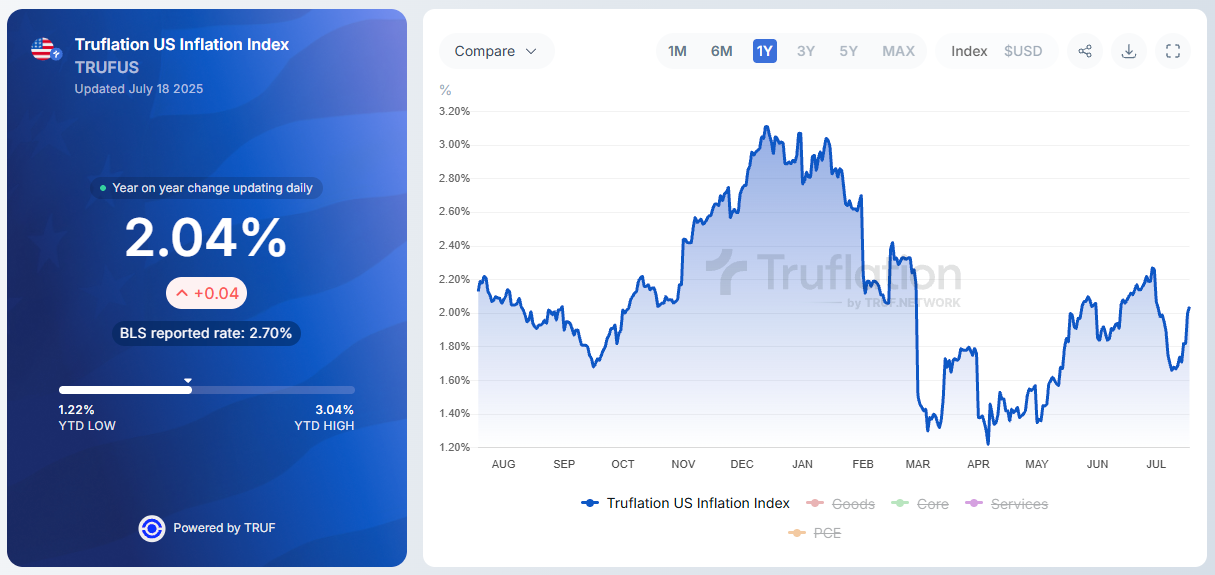
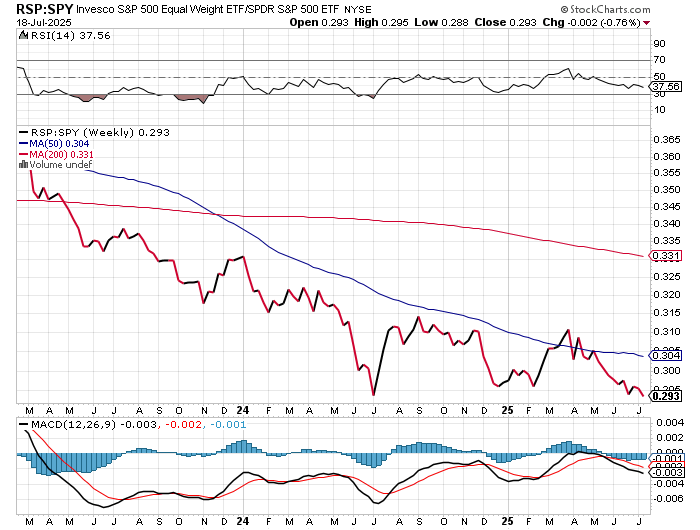
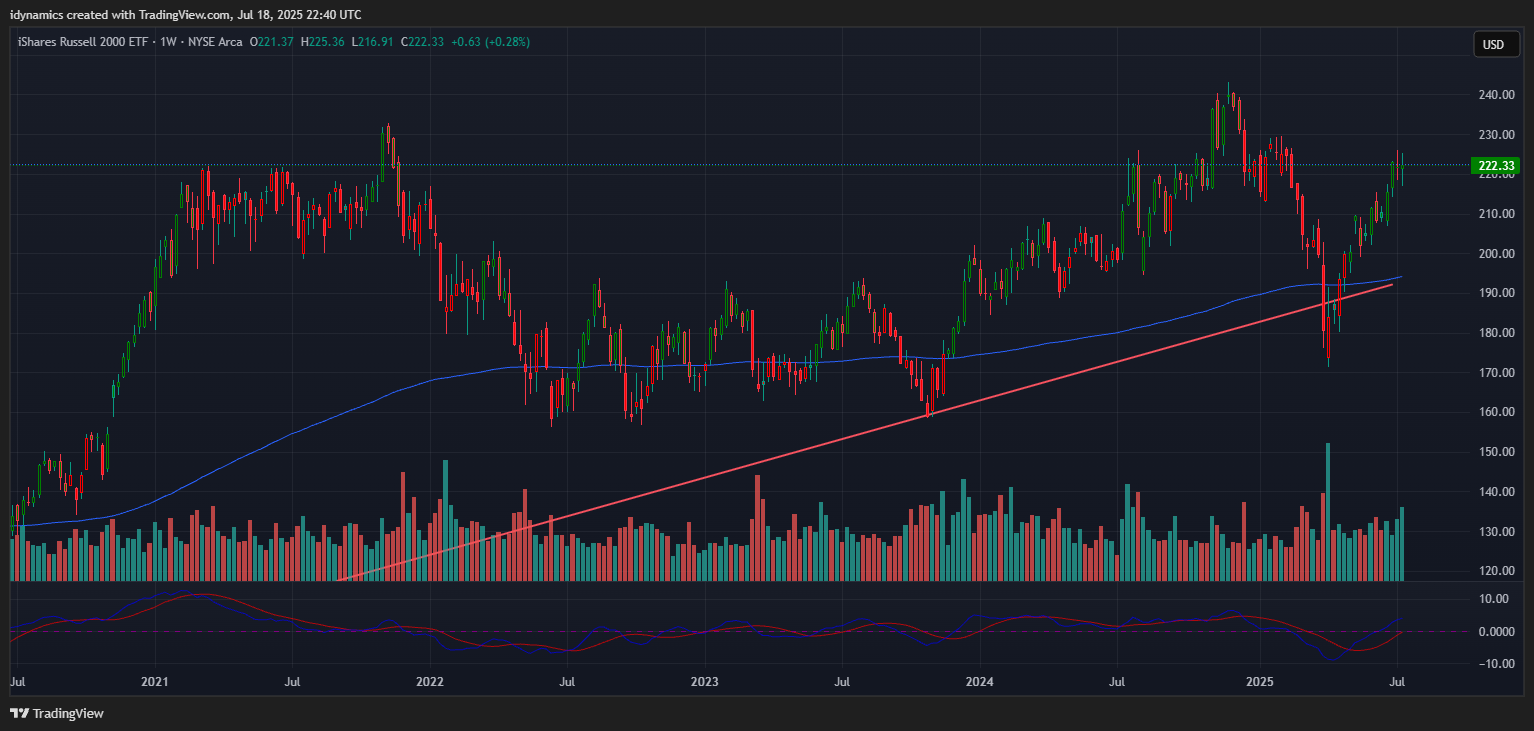
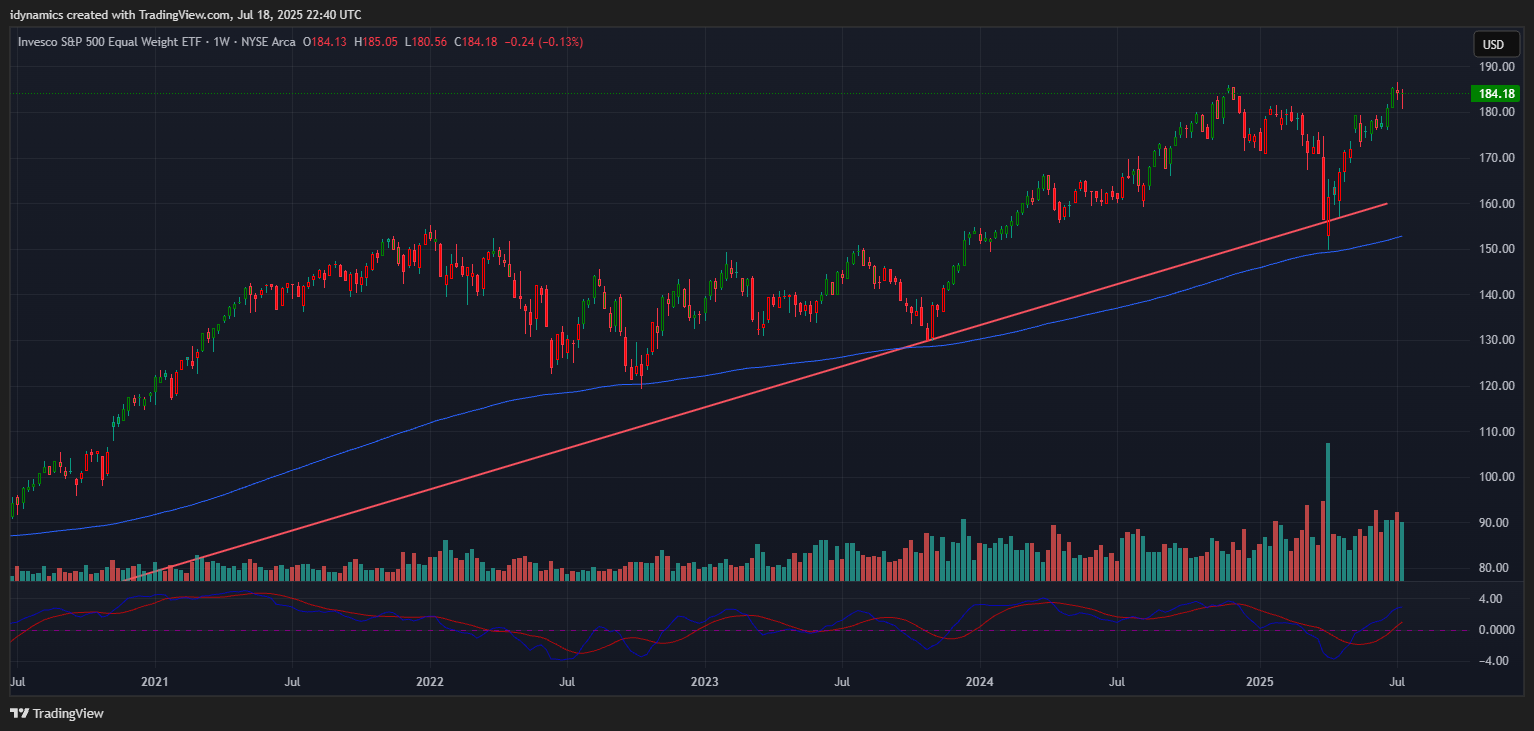
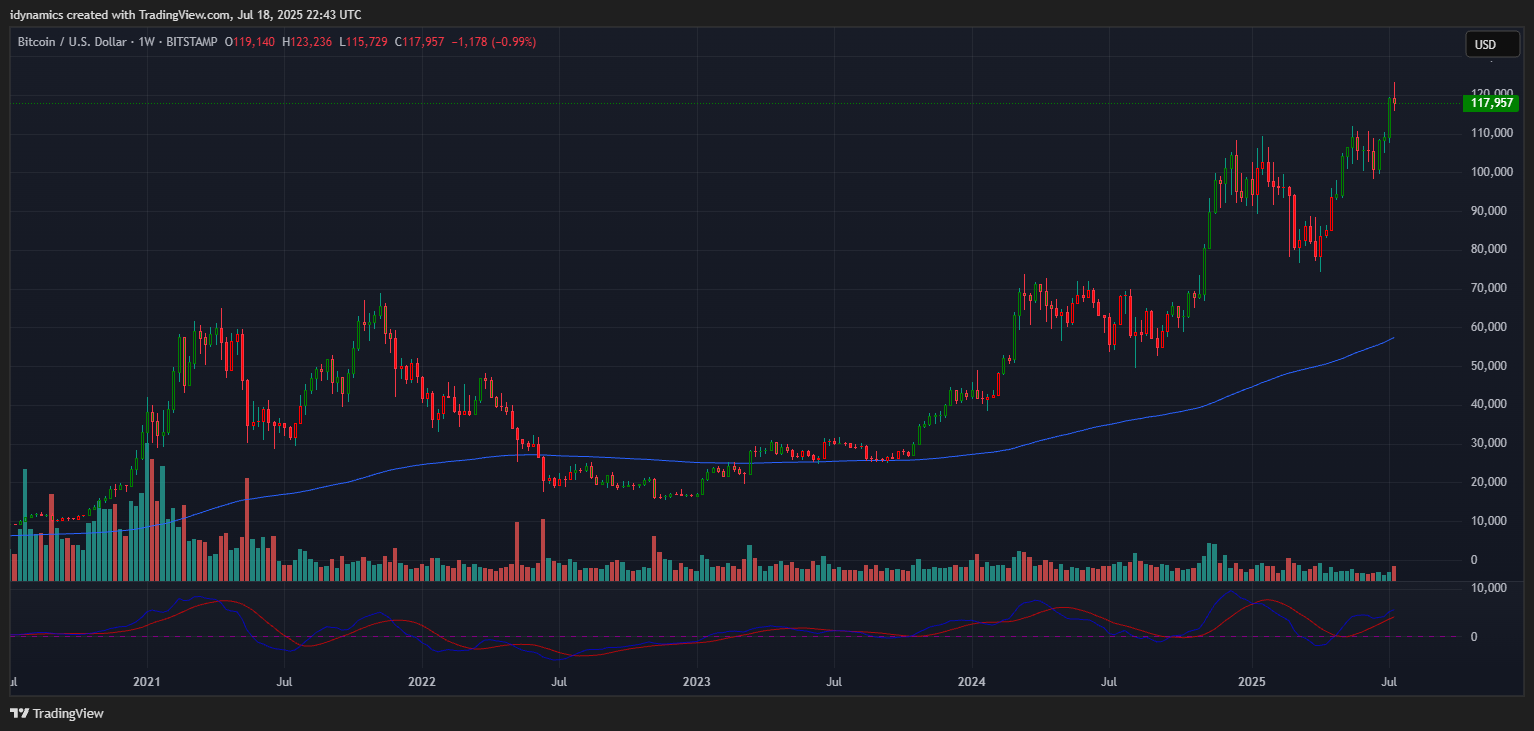
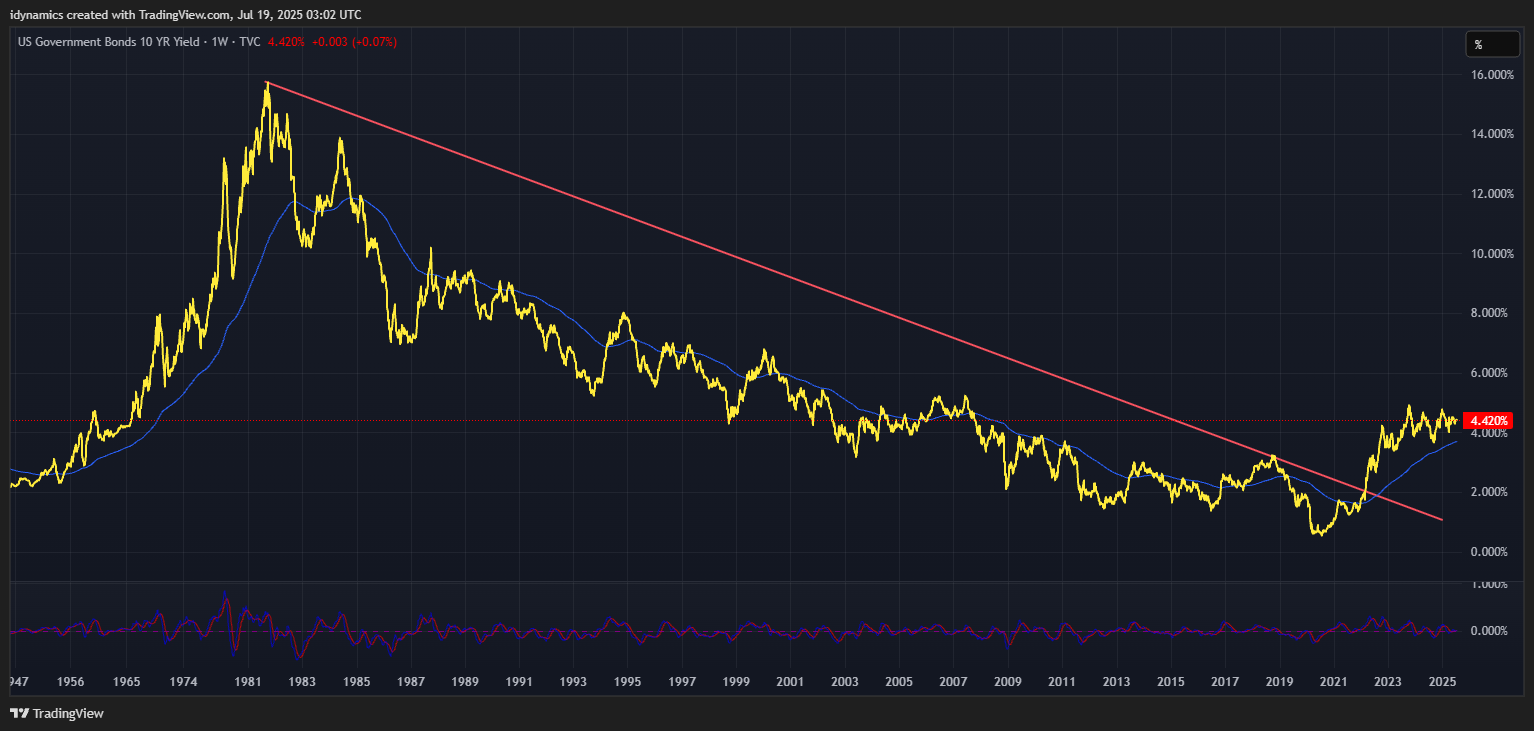
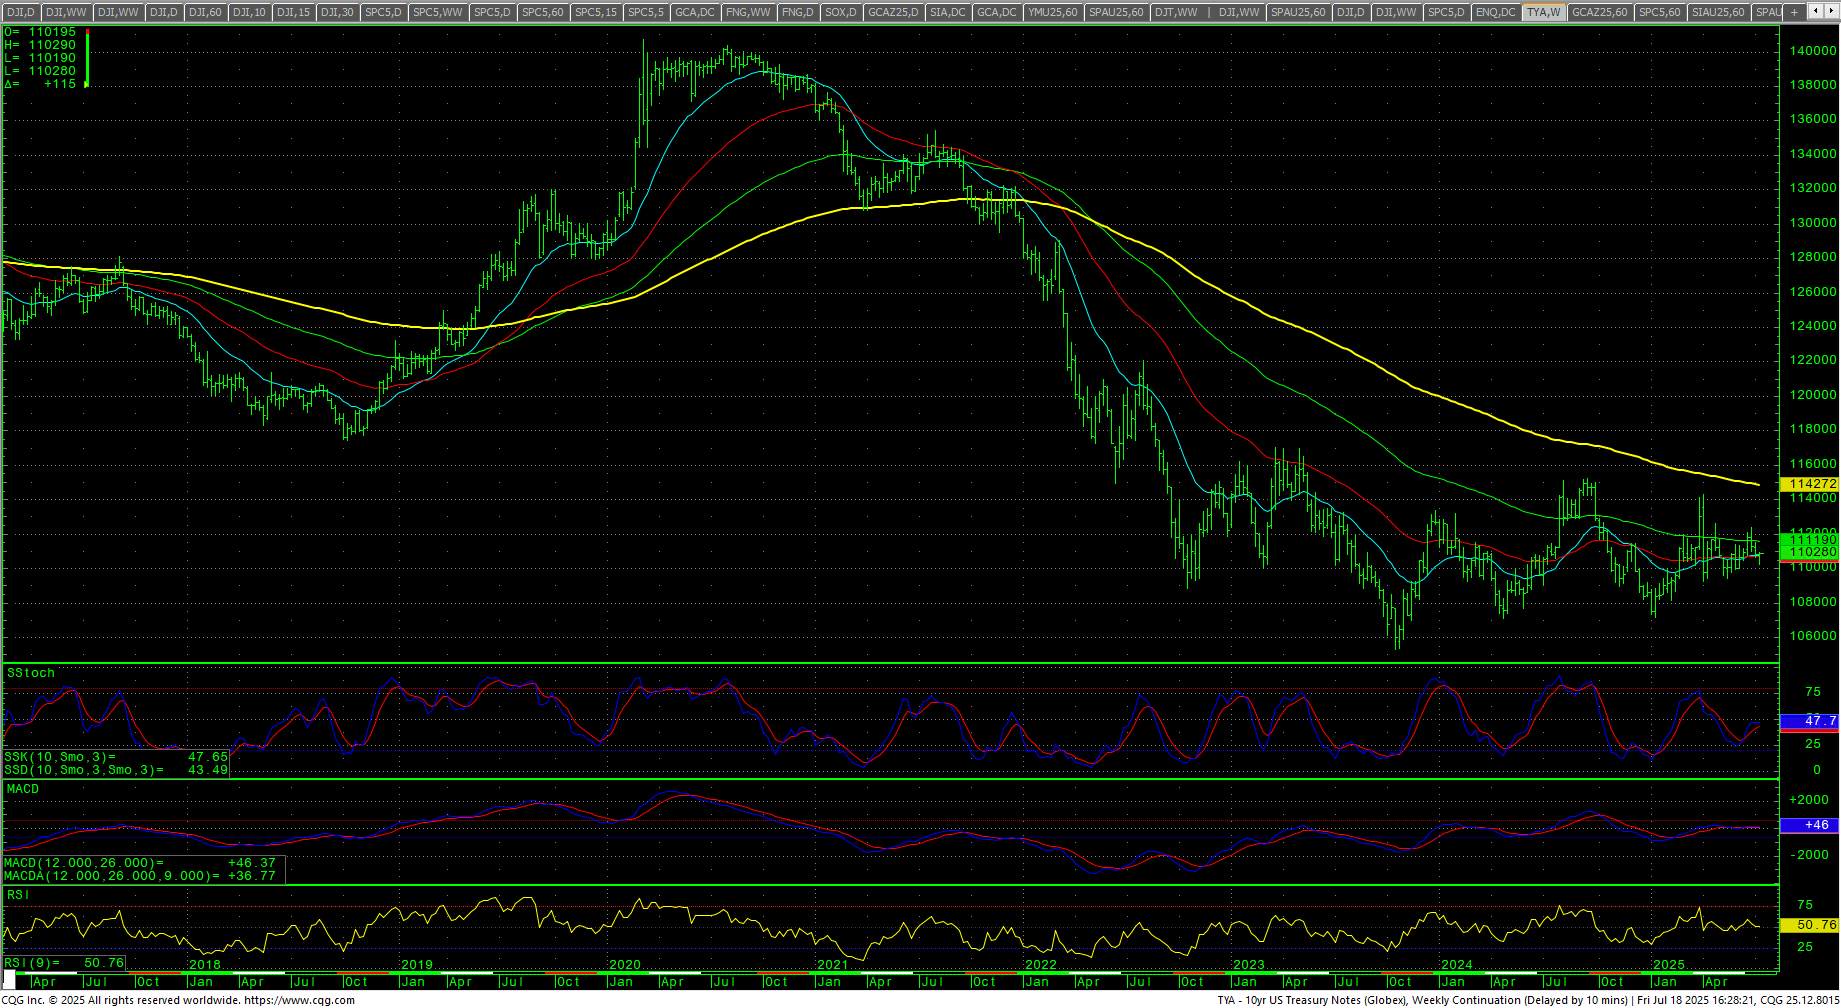
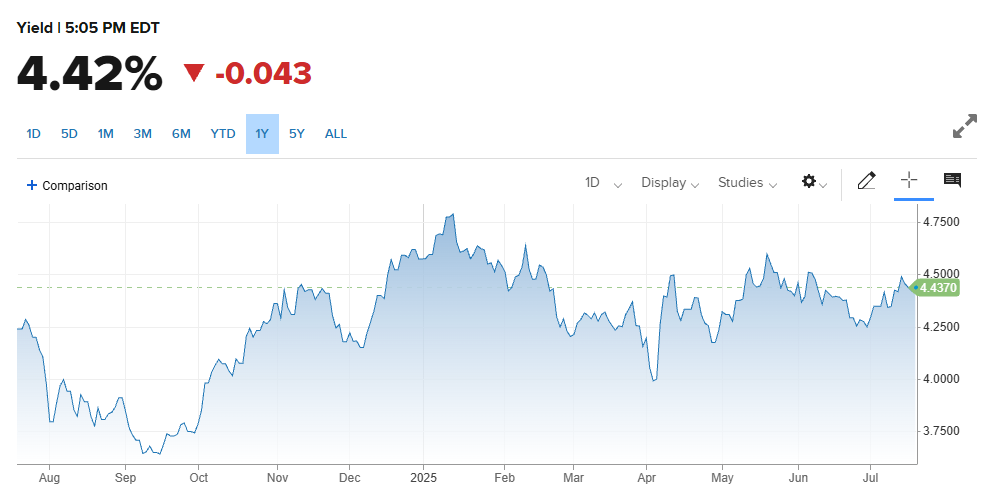
The RSP:SPY lost slightly last week as the RSP reacted to the previous week’s ATH. The spread chart remains extremely weak. The weekly is hooking lower in an oversold position and the MACD is turning back down. The IWM closed higher in the upper 50% of a reversal week, settling up +0.28%. The RSP was up +0.13% in the upper end a reversal range on the week. NVDA was up +4.54% to another ATH as prices are moving toward the next massive call walls in the 175/180 level in positive gamma. Volume is declining with the chart extremely overbought. Bitcoin reversed lower from record highs above 123K, closing down -0.99% on the low end of the week’s range. McClellan Oscillators are following the short-term trends in the Dow. The Yield Curve expanded slightly last week, closing at +0.524%. The 10YR yield was basically flat on the week, closing at 4.42%. Truflation jumped to 2.04%.
10YR-2YR Yield Curve Daily

 VIX Weekly Candles
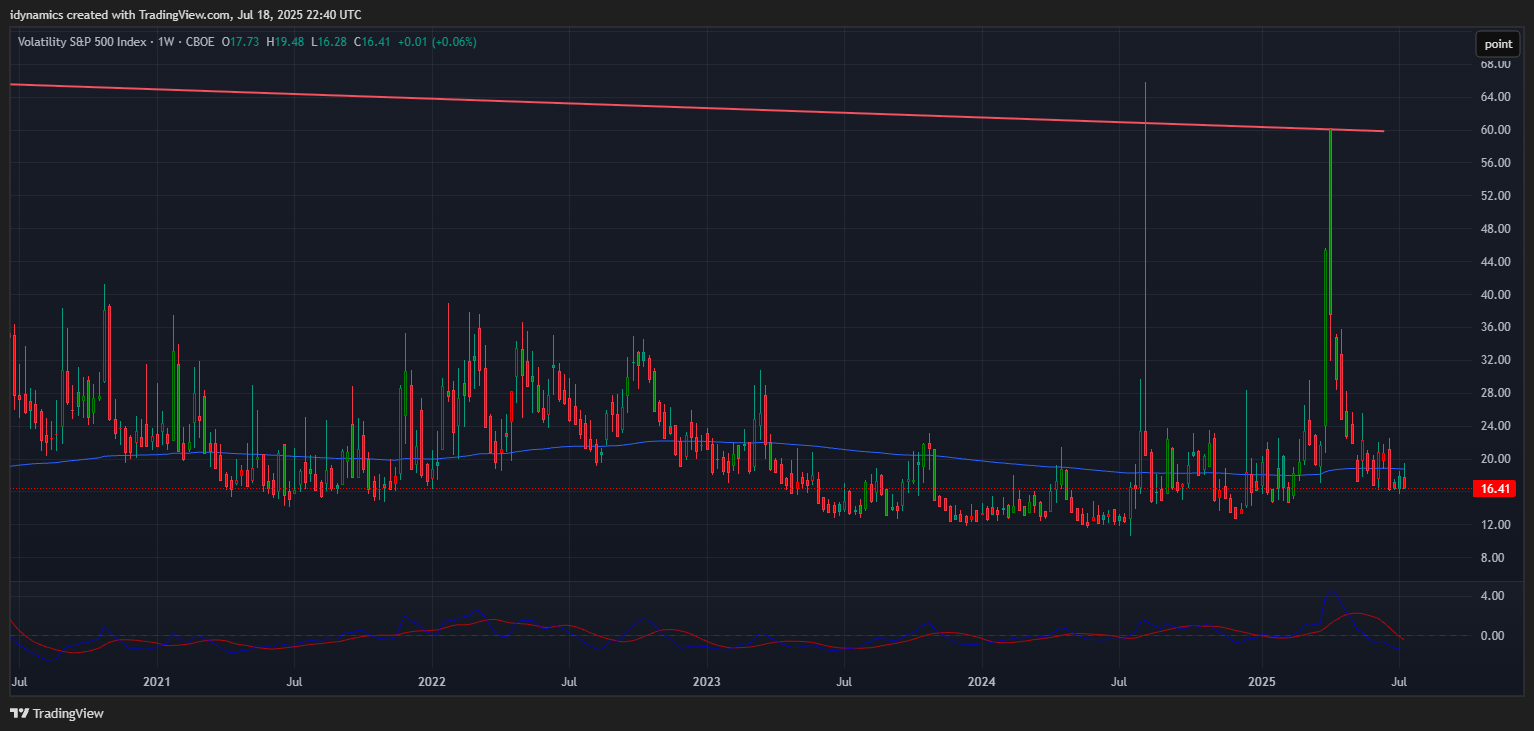
The VIX closed the week up +0.06% on the bottom of a reversal week and holds near the February 2025 lows. The US Dollar rallied and closed up +0.61% in the top of the weekly range.
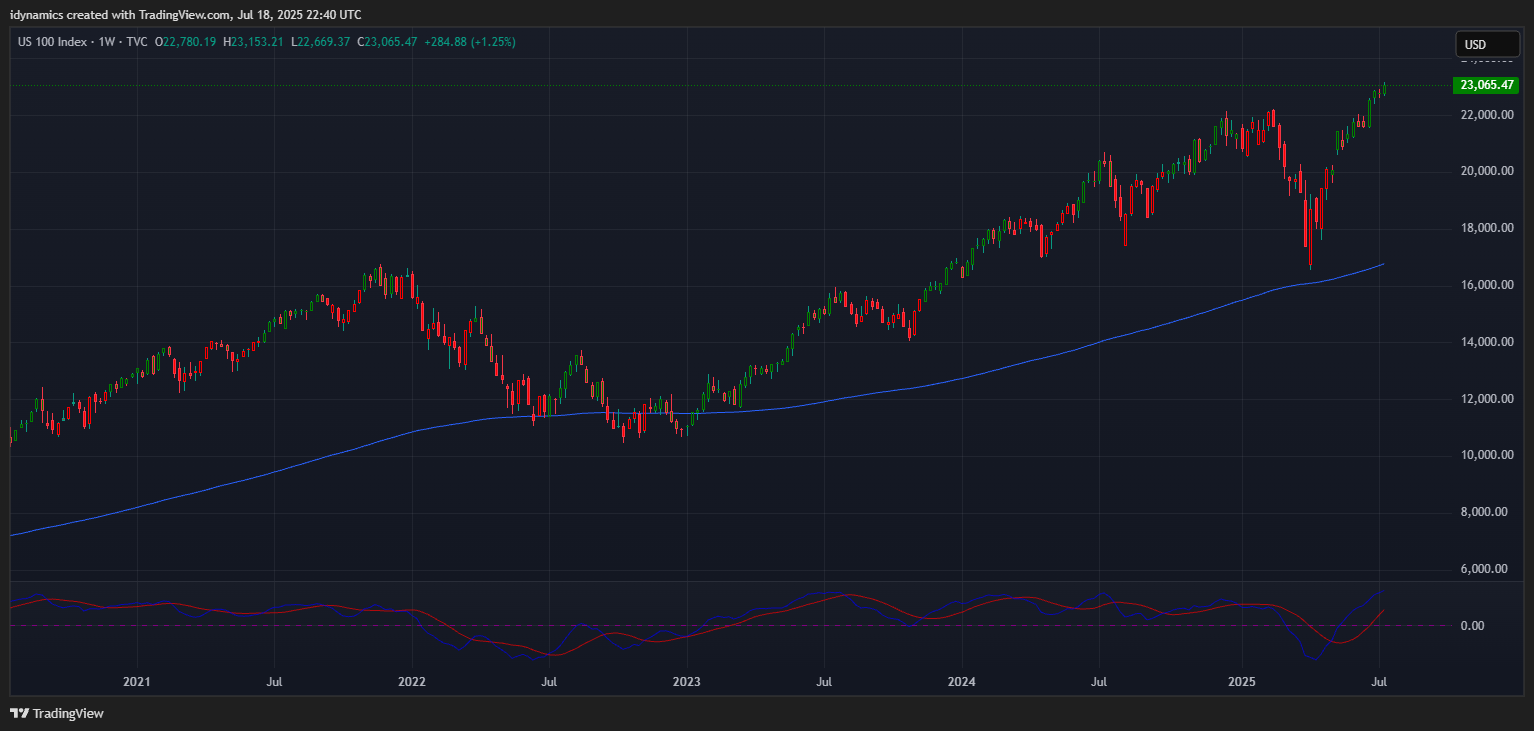
 Nasdaq 100 Weekly Candles
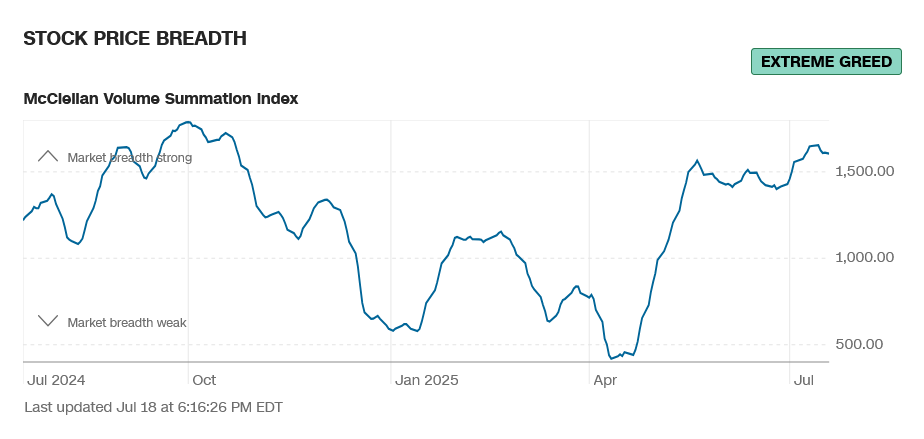
Daily Breadth 
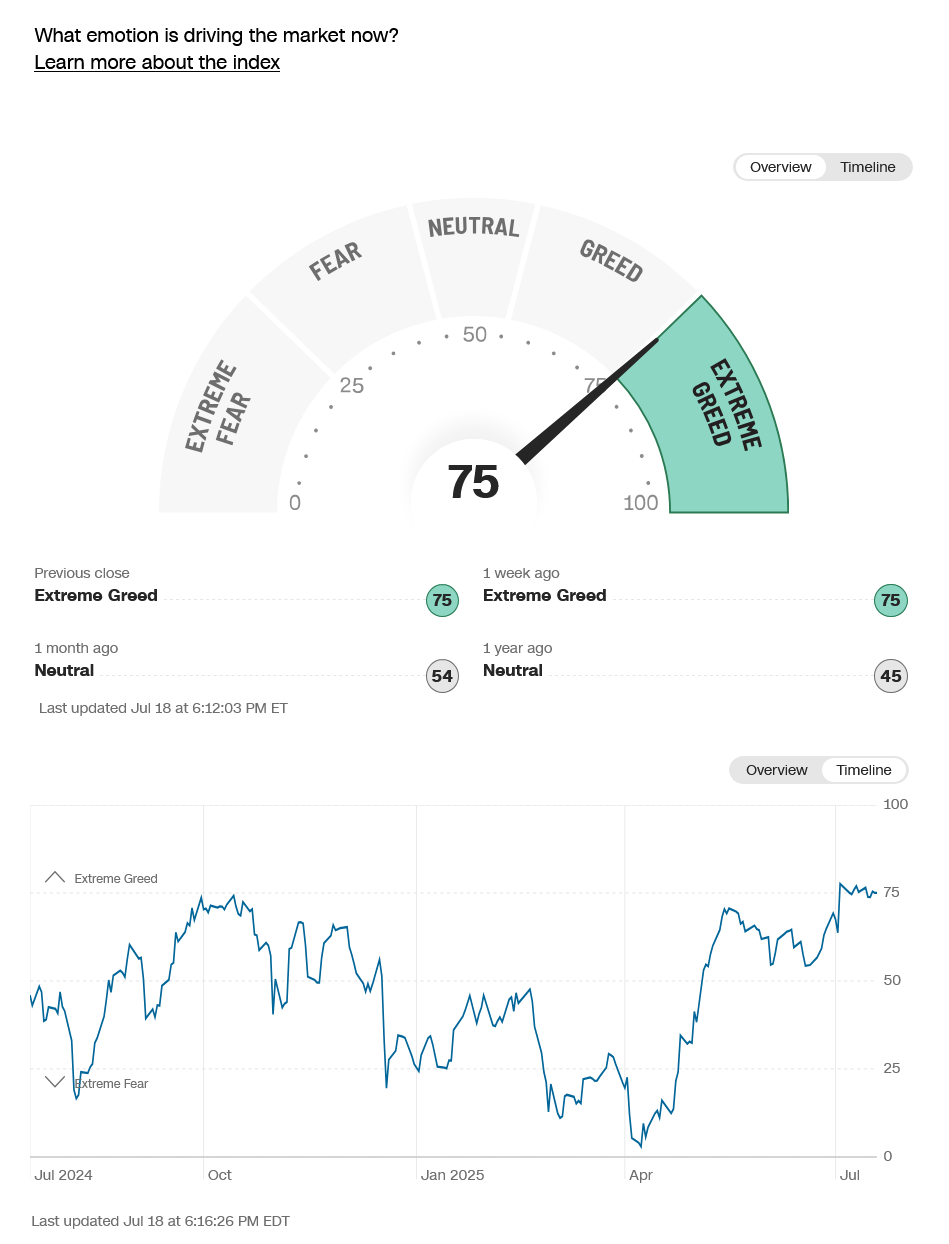
Breadth was weaker Friday and a bit weaker overall during the week, coming off a one year high on the weekly. Sentiment remains in extreme greed.
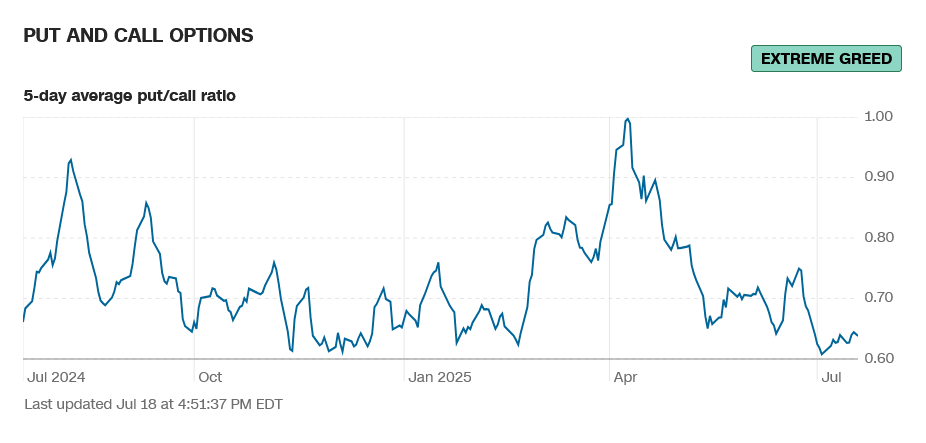
CNN Fear & Greed Index
 AAII Investor Sentiment Survey
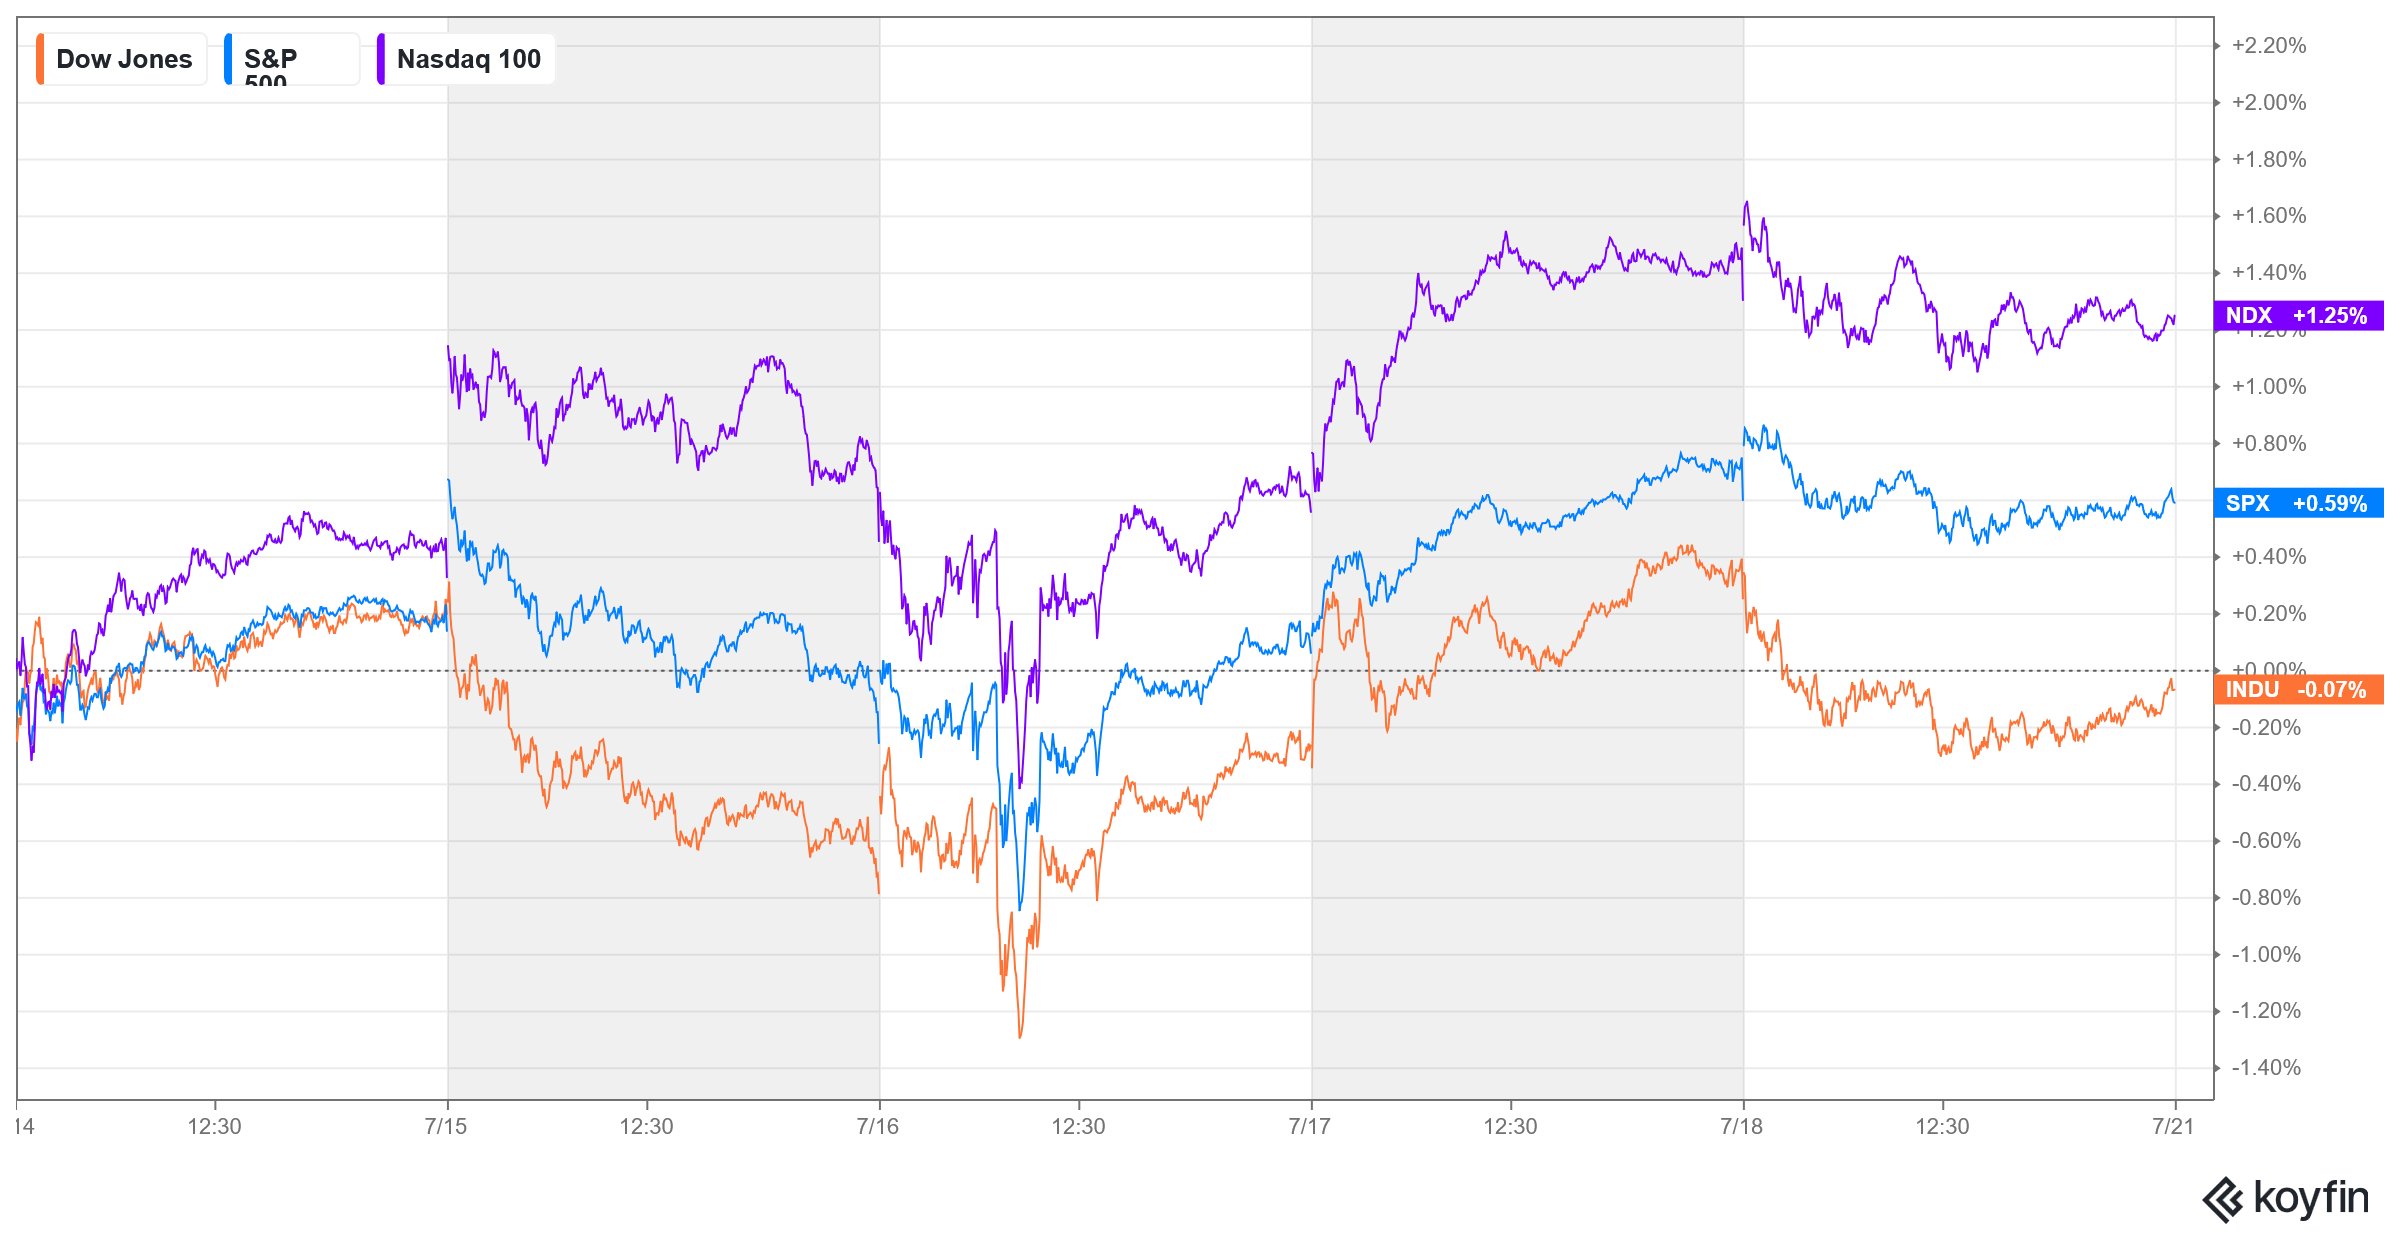
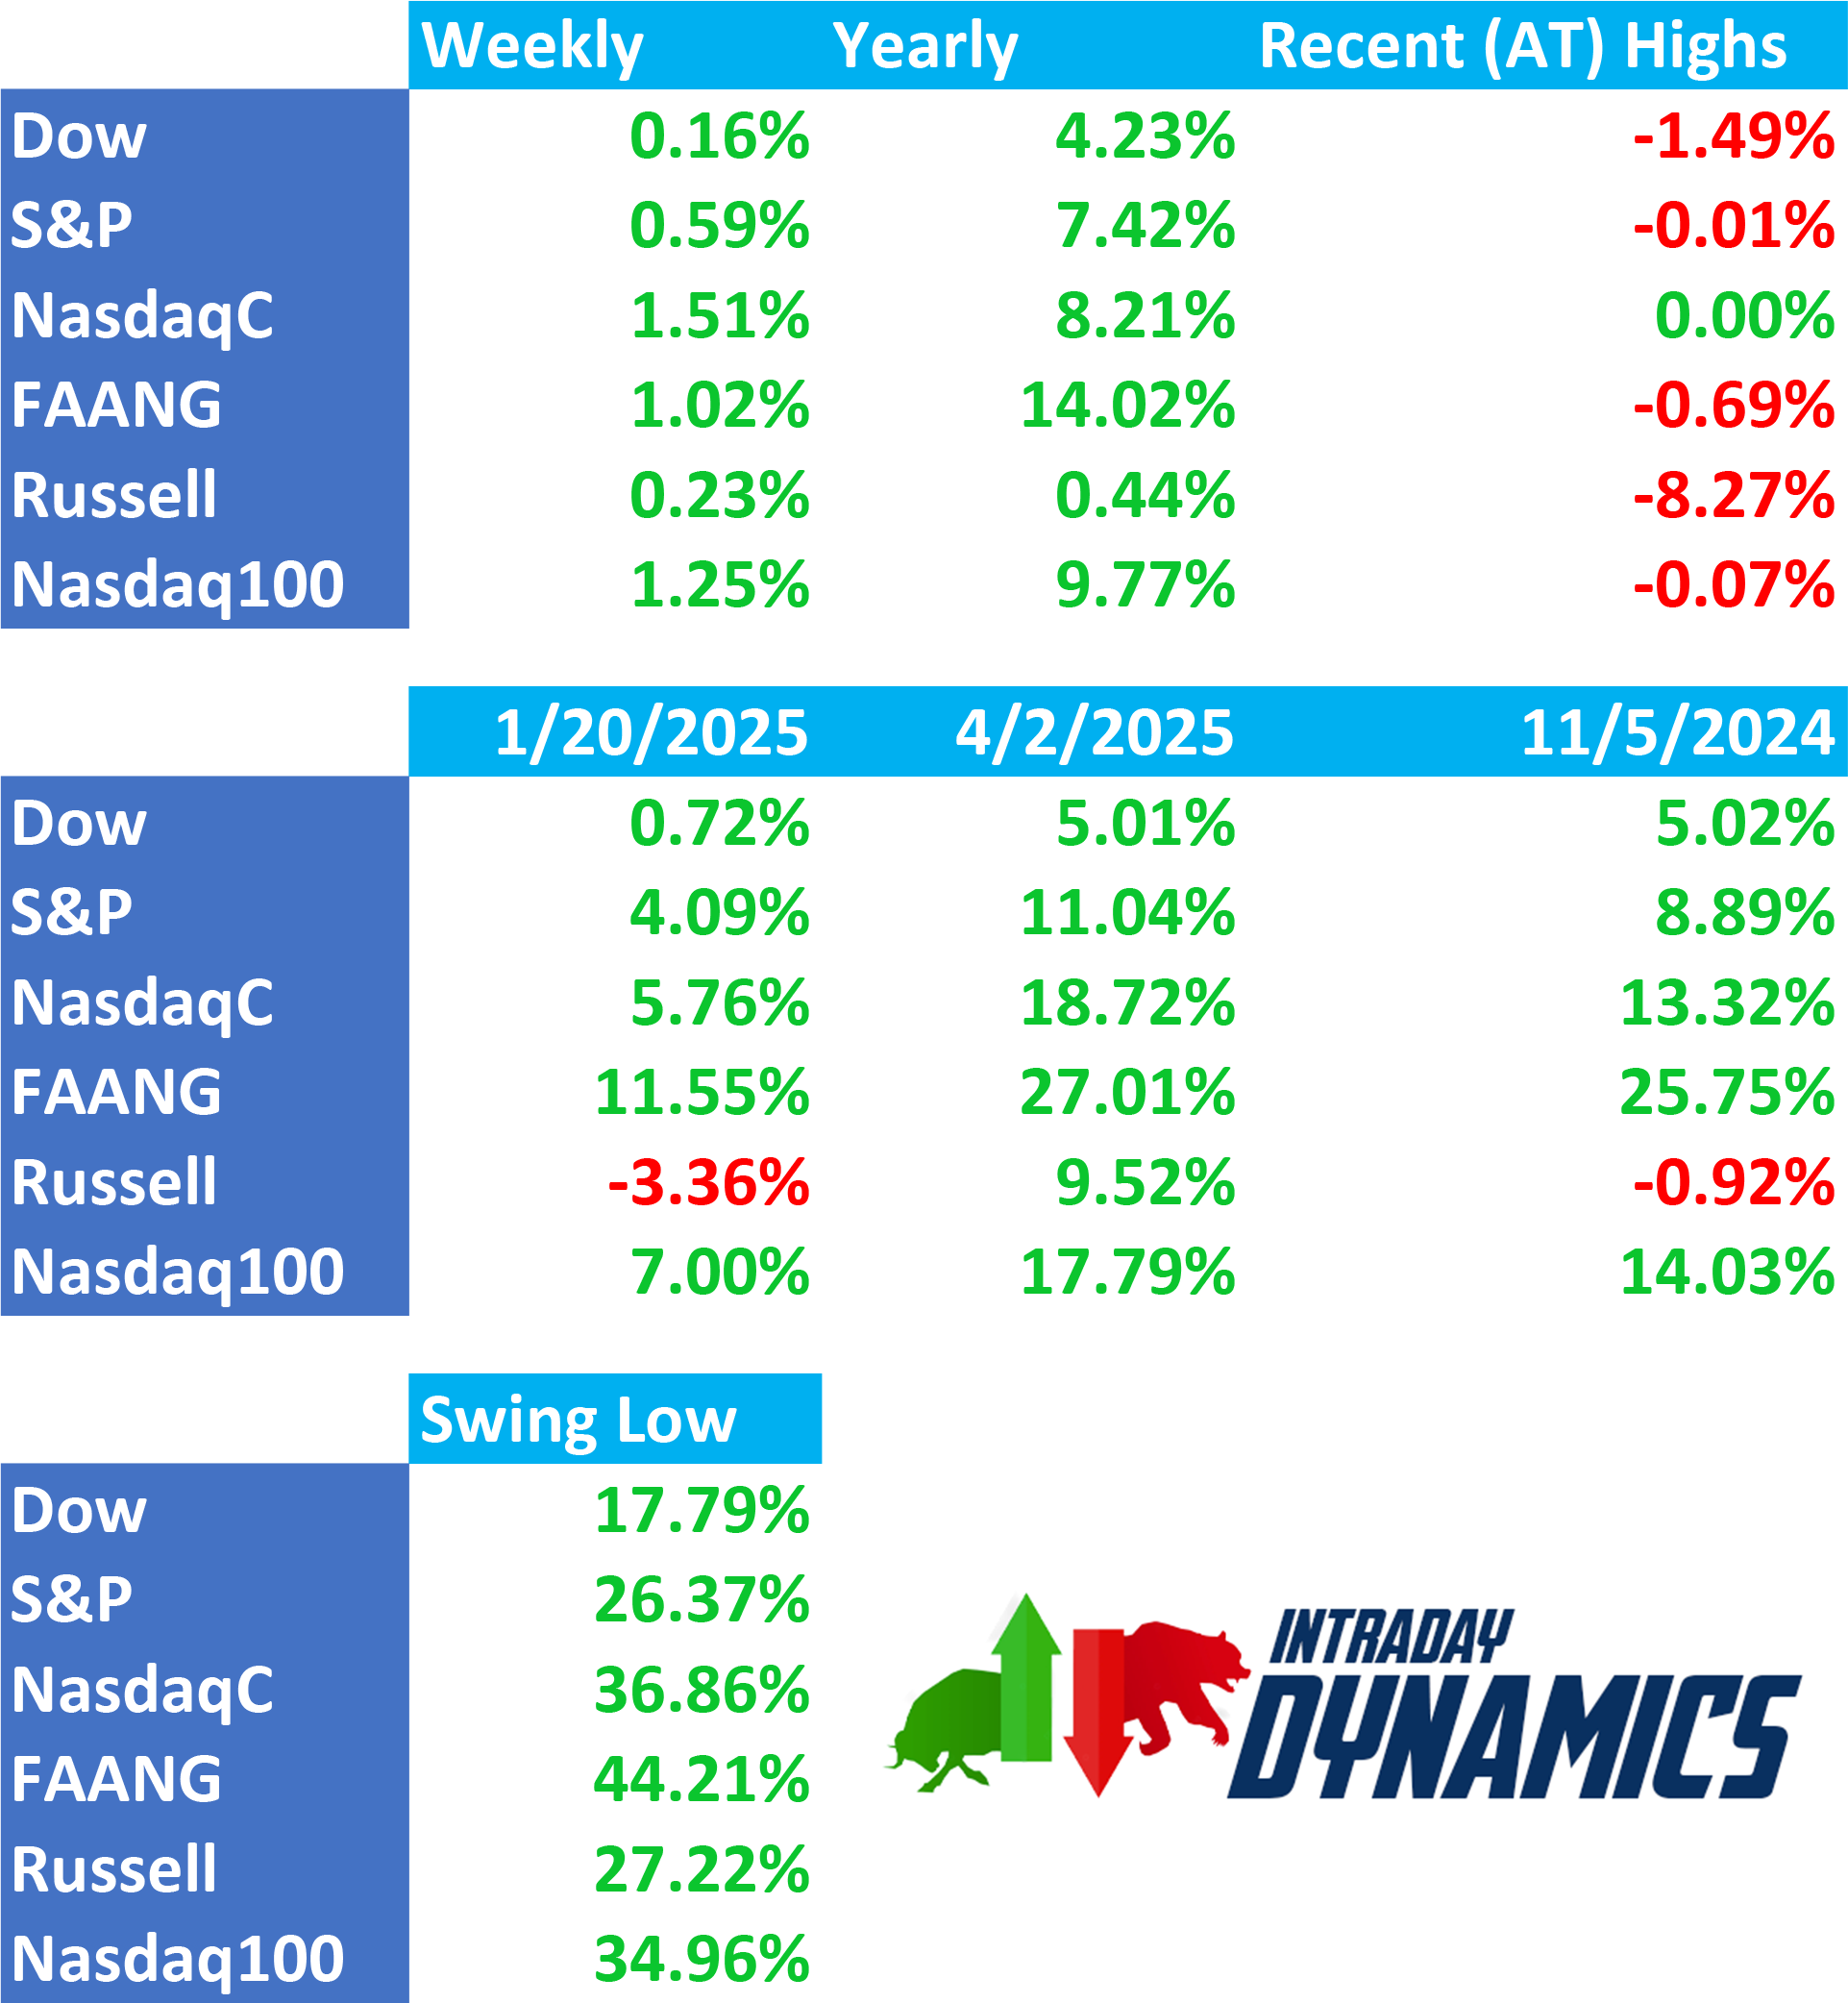
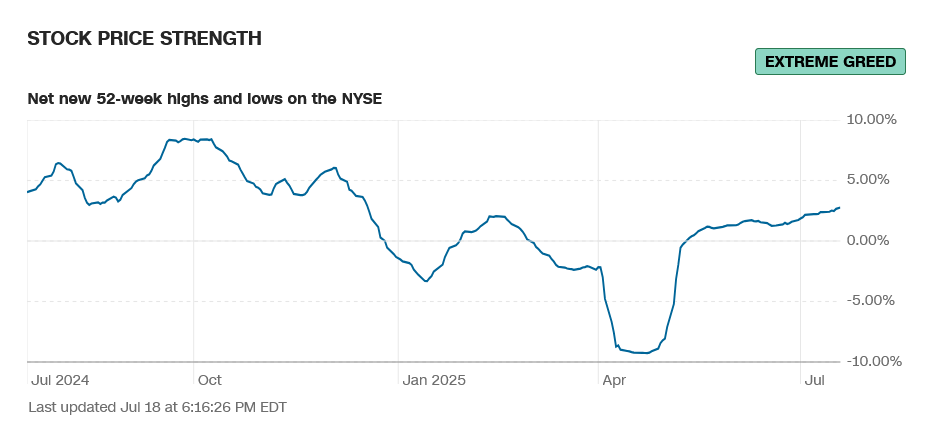
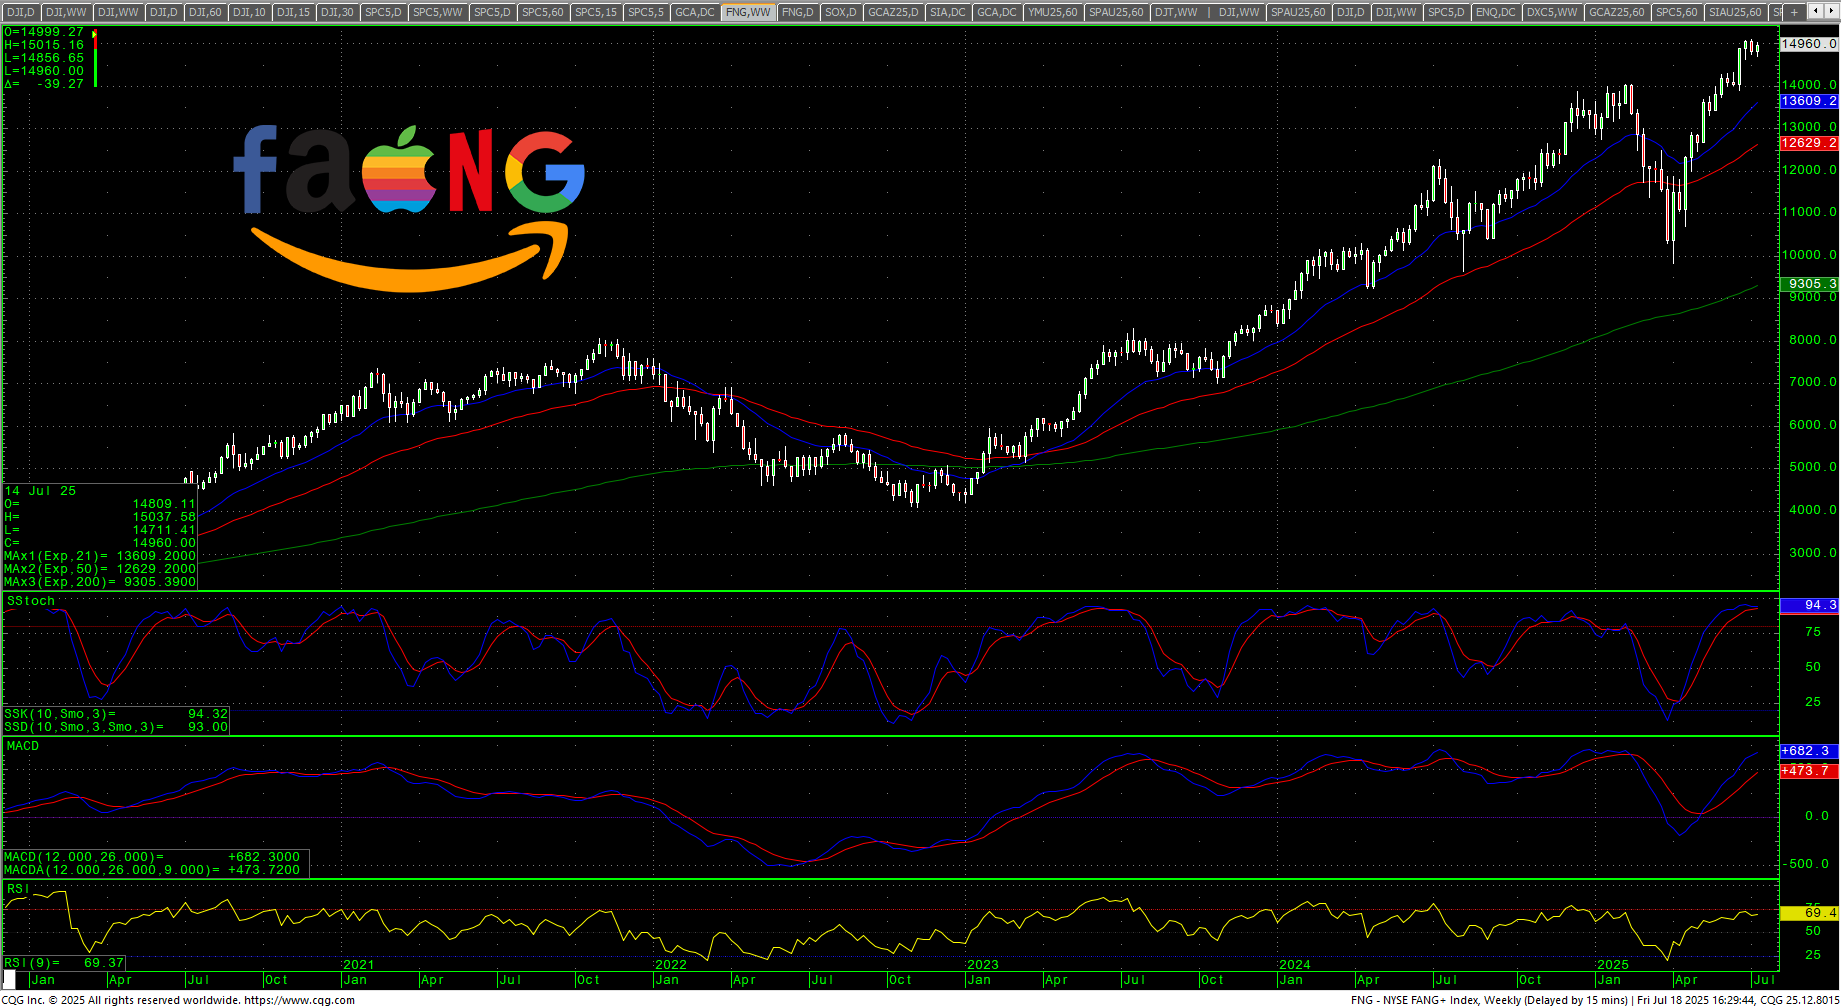
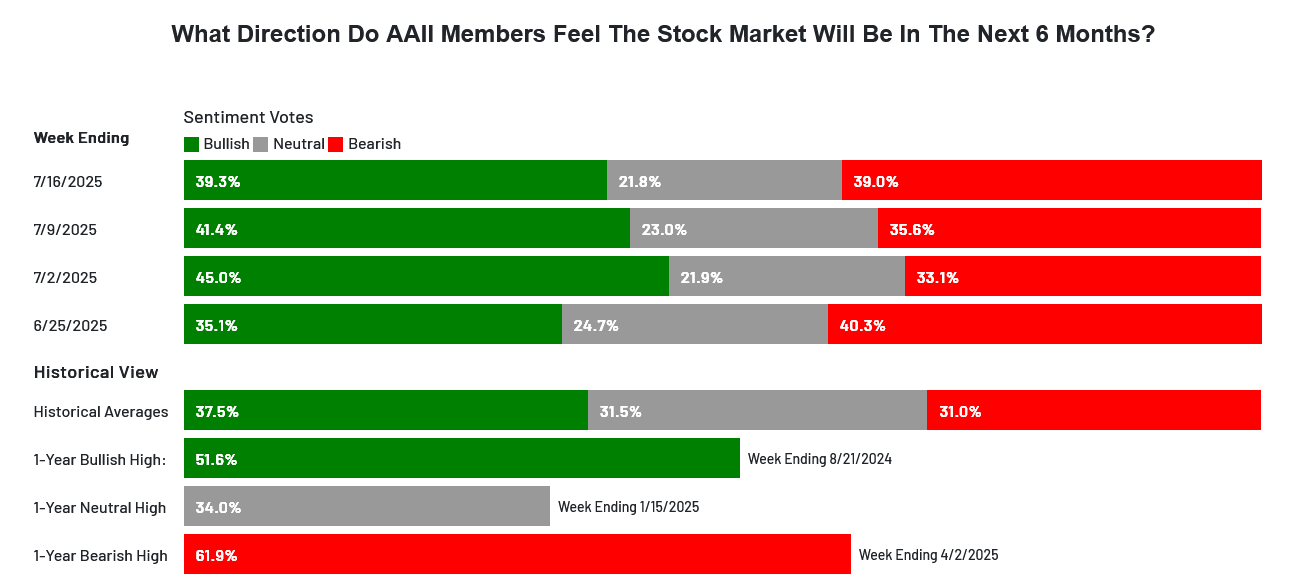 Sentiment is mostly in extreme greed. The CNN Fear and Greed Index remains at 75 and reads extreme greed and is at the highest reading in over a year. Breadth declined on the week from the highest levels since Fall of 2024 and continues to read extreme greed. Latest AAII Sentiment Survey: Pessimism Pushes Through as the bulls backed off the previous week’s levels and bears increased slightly. The Dow A/D was flat at 6931. The VIX traded a reversal week and closed on the lows up +0.06% in the bottom end of the range as it holds near the February 2025 lows. The Put/Call closed at 0.64 and reads extreme greed. The 52-week, A/D rose to +2.77% and reads extreme greed. The Dow closed the week up +0.16%, closing on the upper end of a reversal range. The S&P settled up +0.59% ending in the upper portion of the weekly range at a new weekly ATH. The Nasdaq Composite was up +1.51% and the Nasdaq 100 was up +1.25%. The NYSE FANG closed up +1.02% on the top of a reversal range. The Russell was down -0.13% in the top of the week’s range. The 10-year notes closed flat in the upper end of the weekly range. The yield on the 10YR increased to 4.42%.
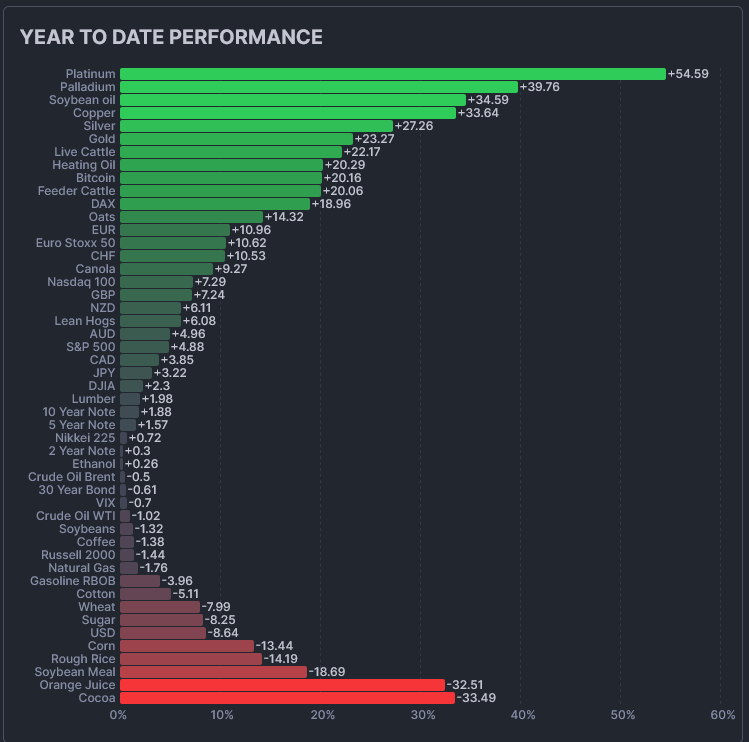
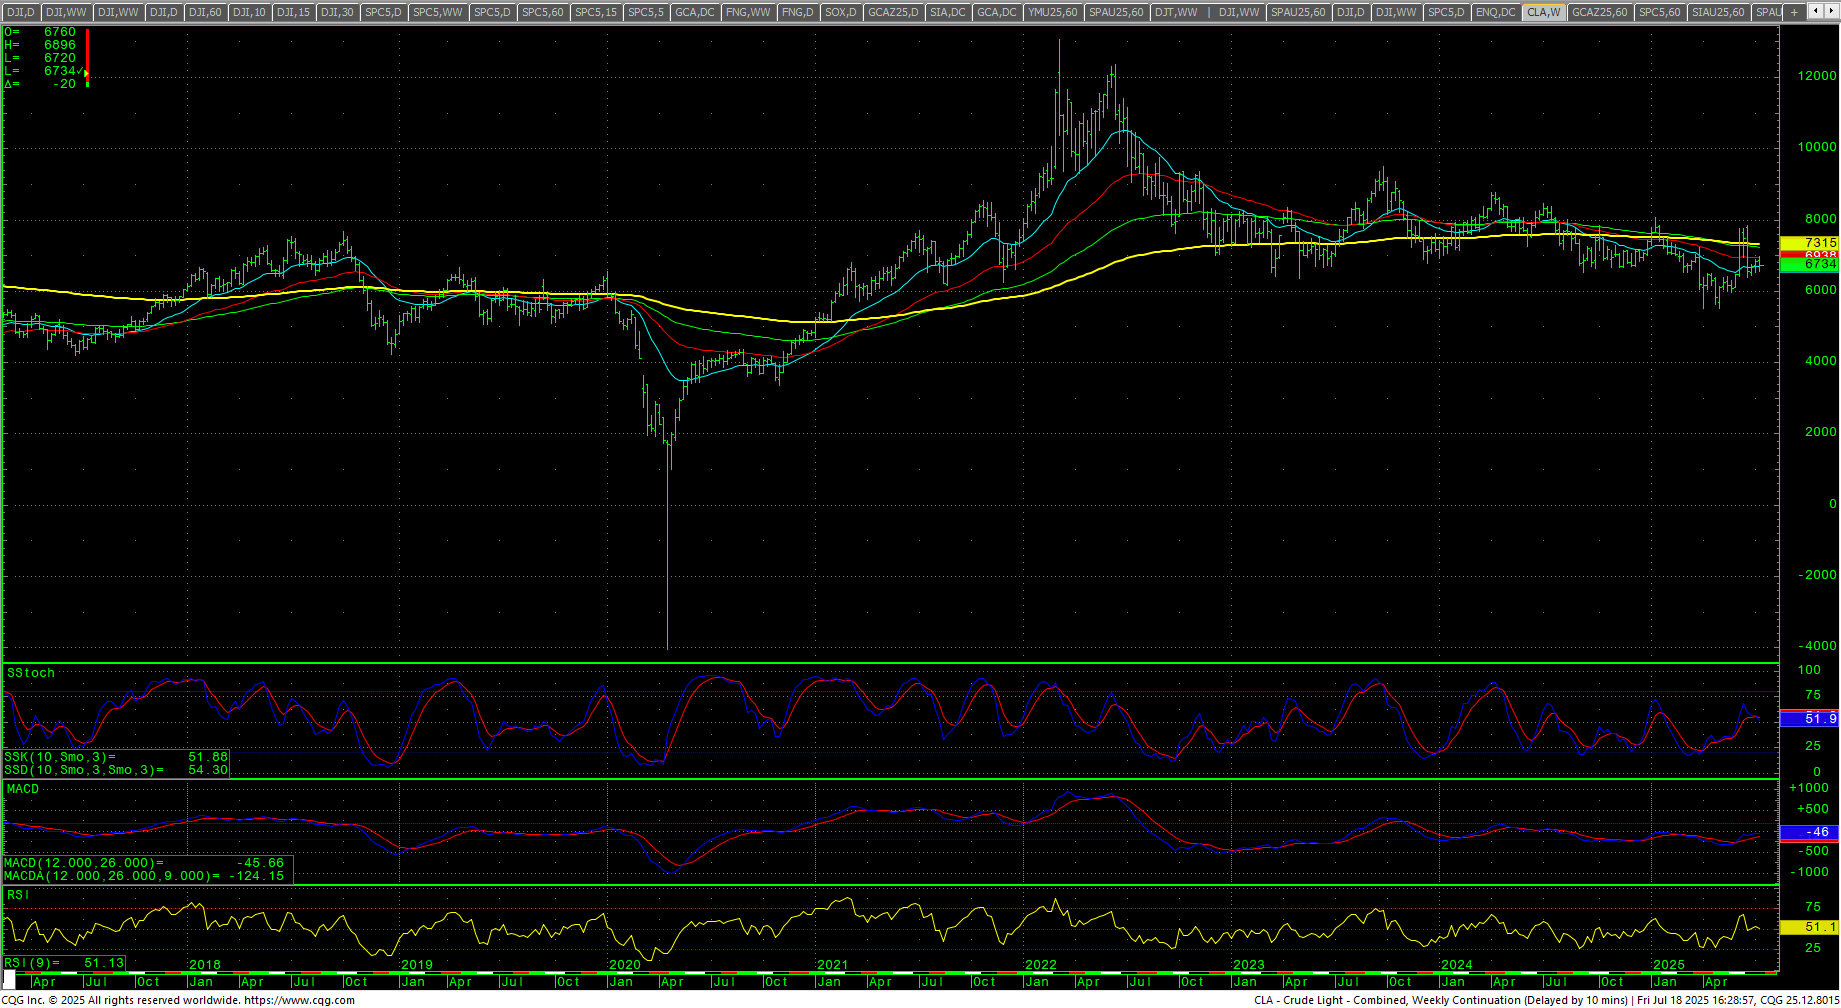
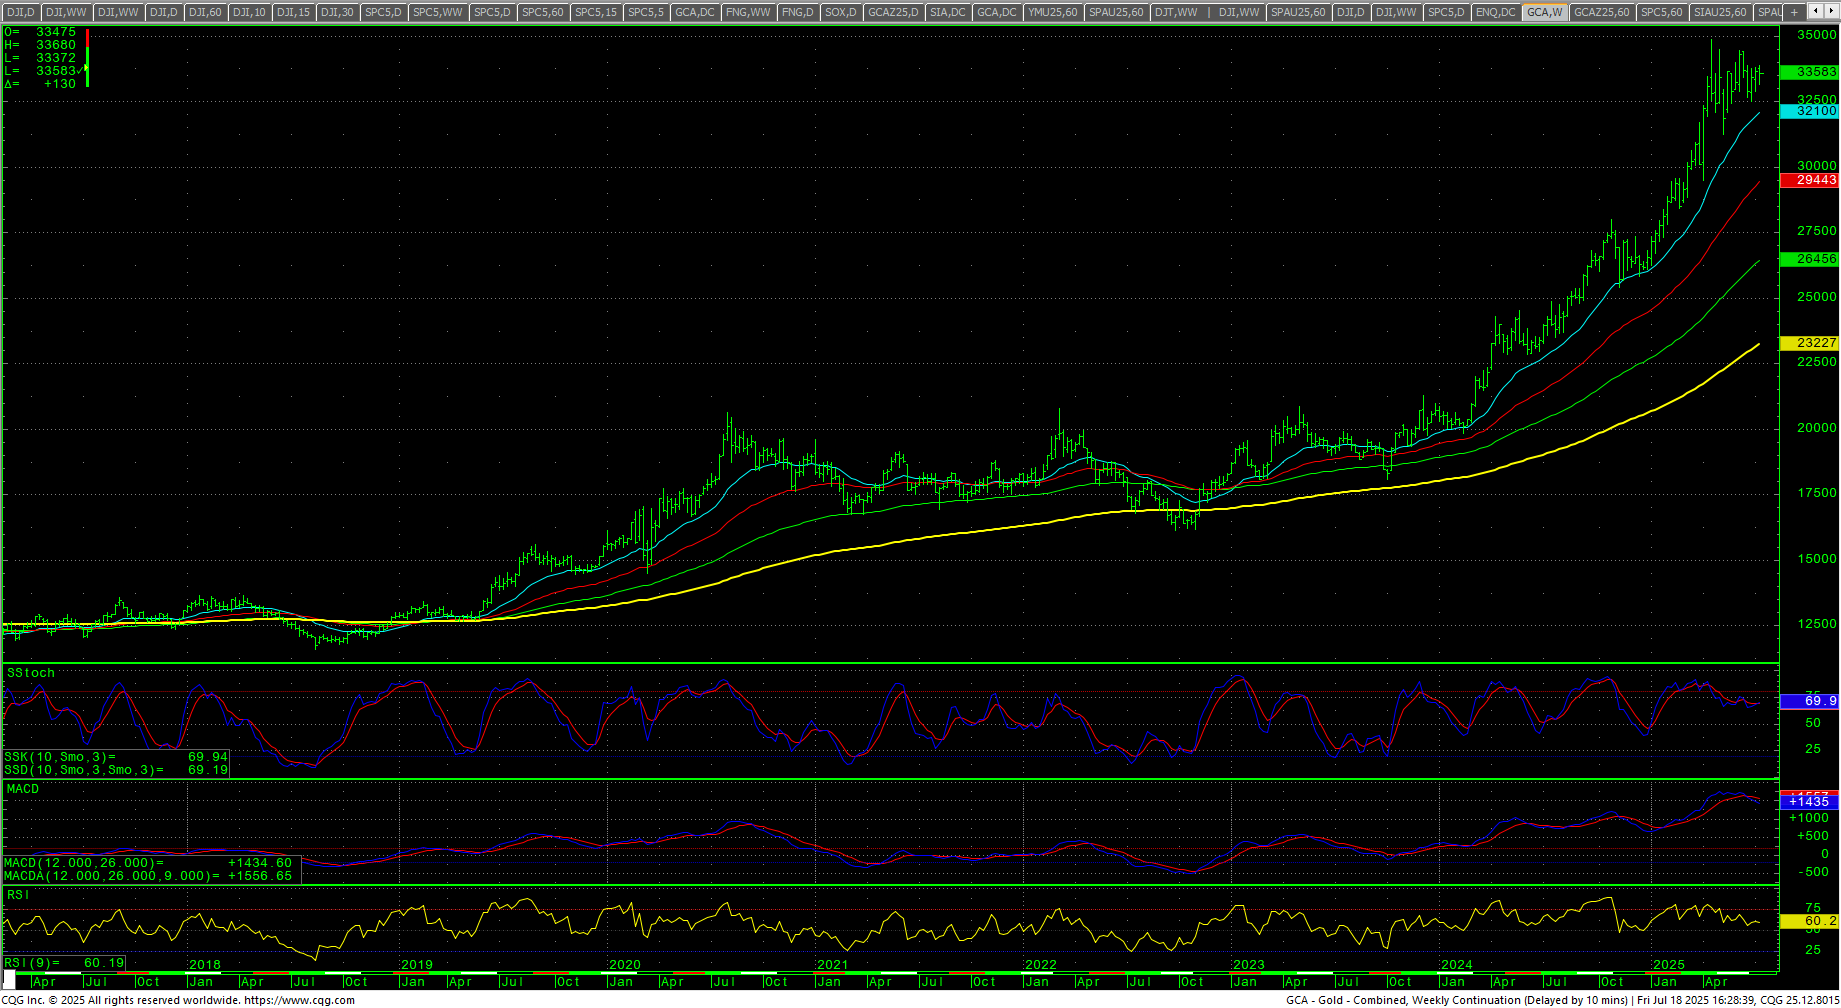
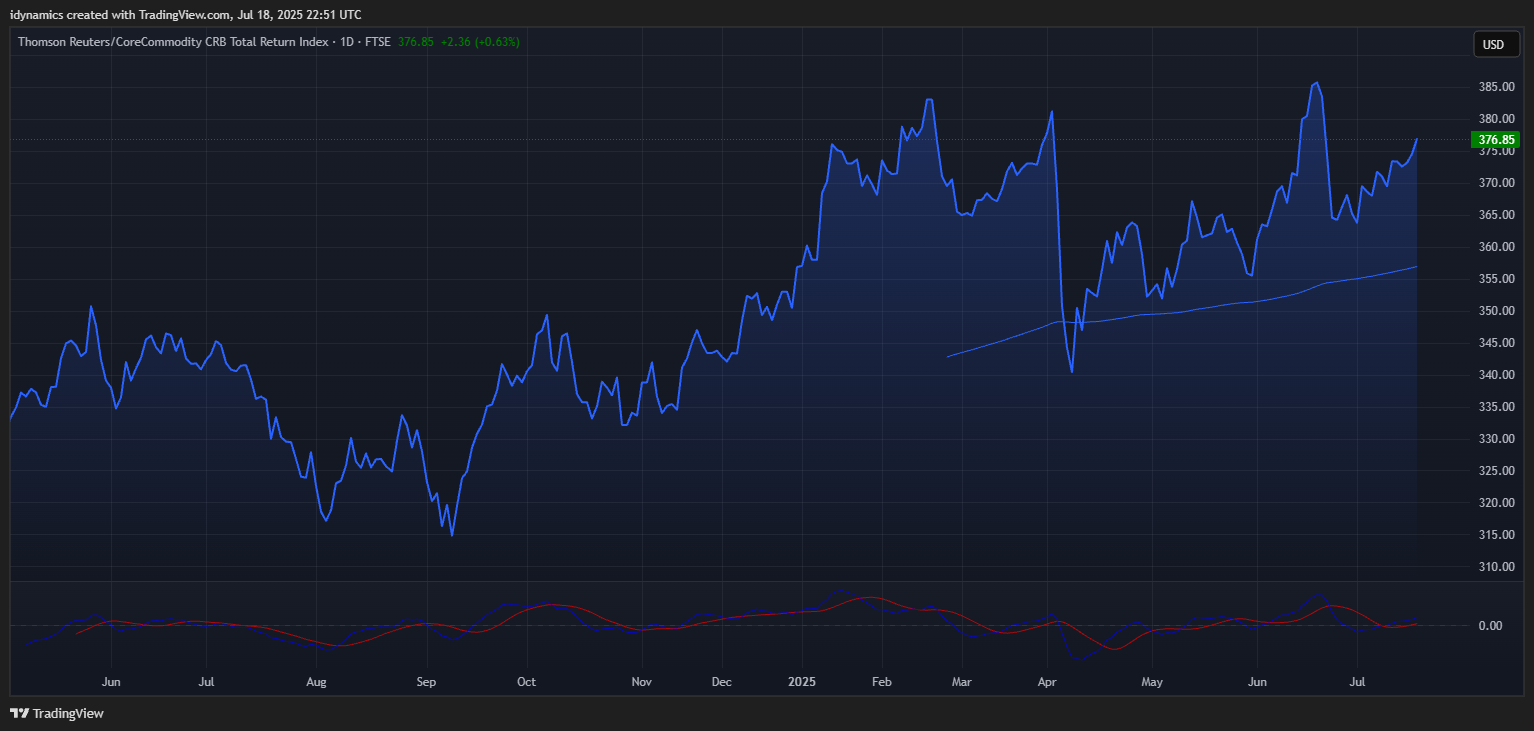 The CRB Index was up +1.00%. Crude oil the week lower, in the middle of a reversal range. Gold closed fractionally lower but in the upper half of the weekly range. The CoT for the S&P 500 saw dealers nibbling while asset managers remain flat. Non-commercials liquidated and commercials saw slight increases. The CFTC S&P 500 Non-Commercial Net Positions ended at -167.8K which might be a sign of renewed selling in the futures. Whether these are hedges or shorts remains to be seen.
Timing Points
Critical cycle falls on the 23rd/24th where we can see expanded ranges and heightened activity. For an update on the longer-term timing outlook, please see the latest update. Tuesday, Powell speaks. Wednesday is Existing Home Sales (est: 4M). Thursday is Flash PMI (est: 53.2) and Initial Claims (est: 229K) along with New Home Sales (est 650K). Friday is Durable Goods (est: -11.0%).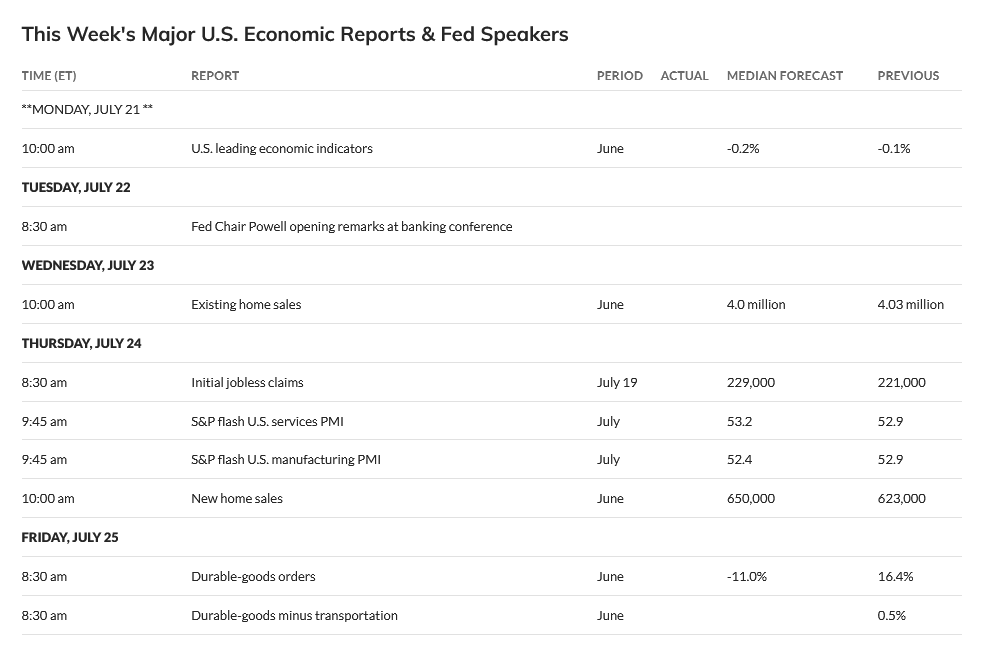
- 07/23-24 *** X critical
- 08/01 *** X
- 08/05 *** X kicks off critical week through
- 08/08 *** X through
- 08/11 *** X critical week
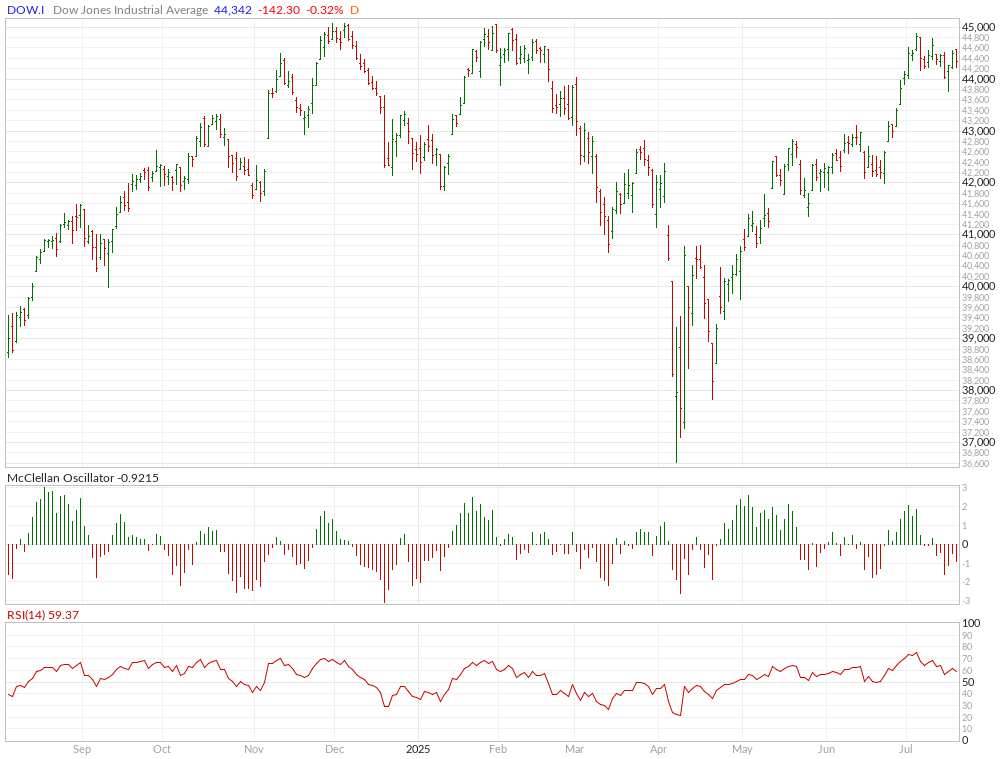
Dow Jones Industrial Average
Dow Jones Industrial Average Weekly H-L-C
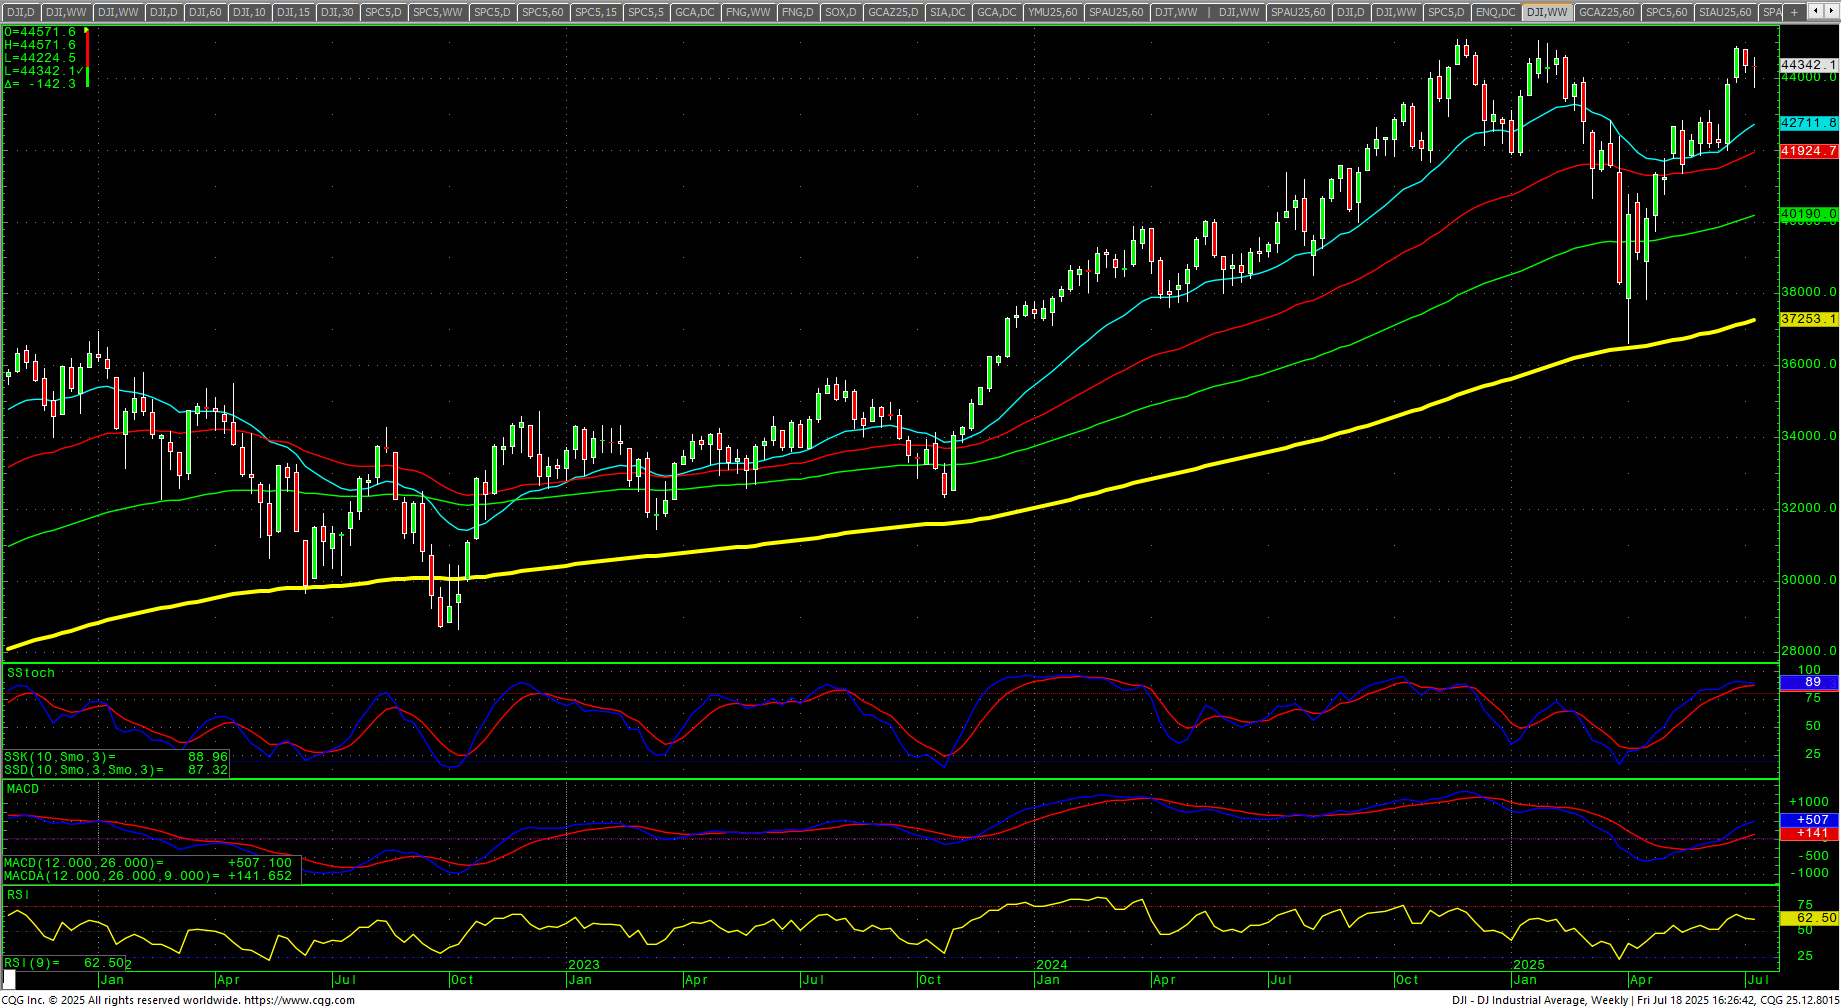
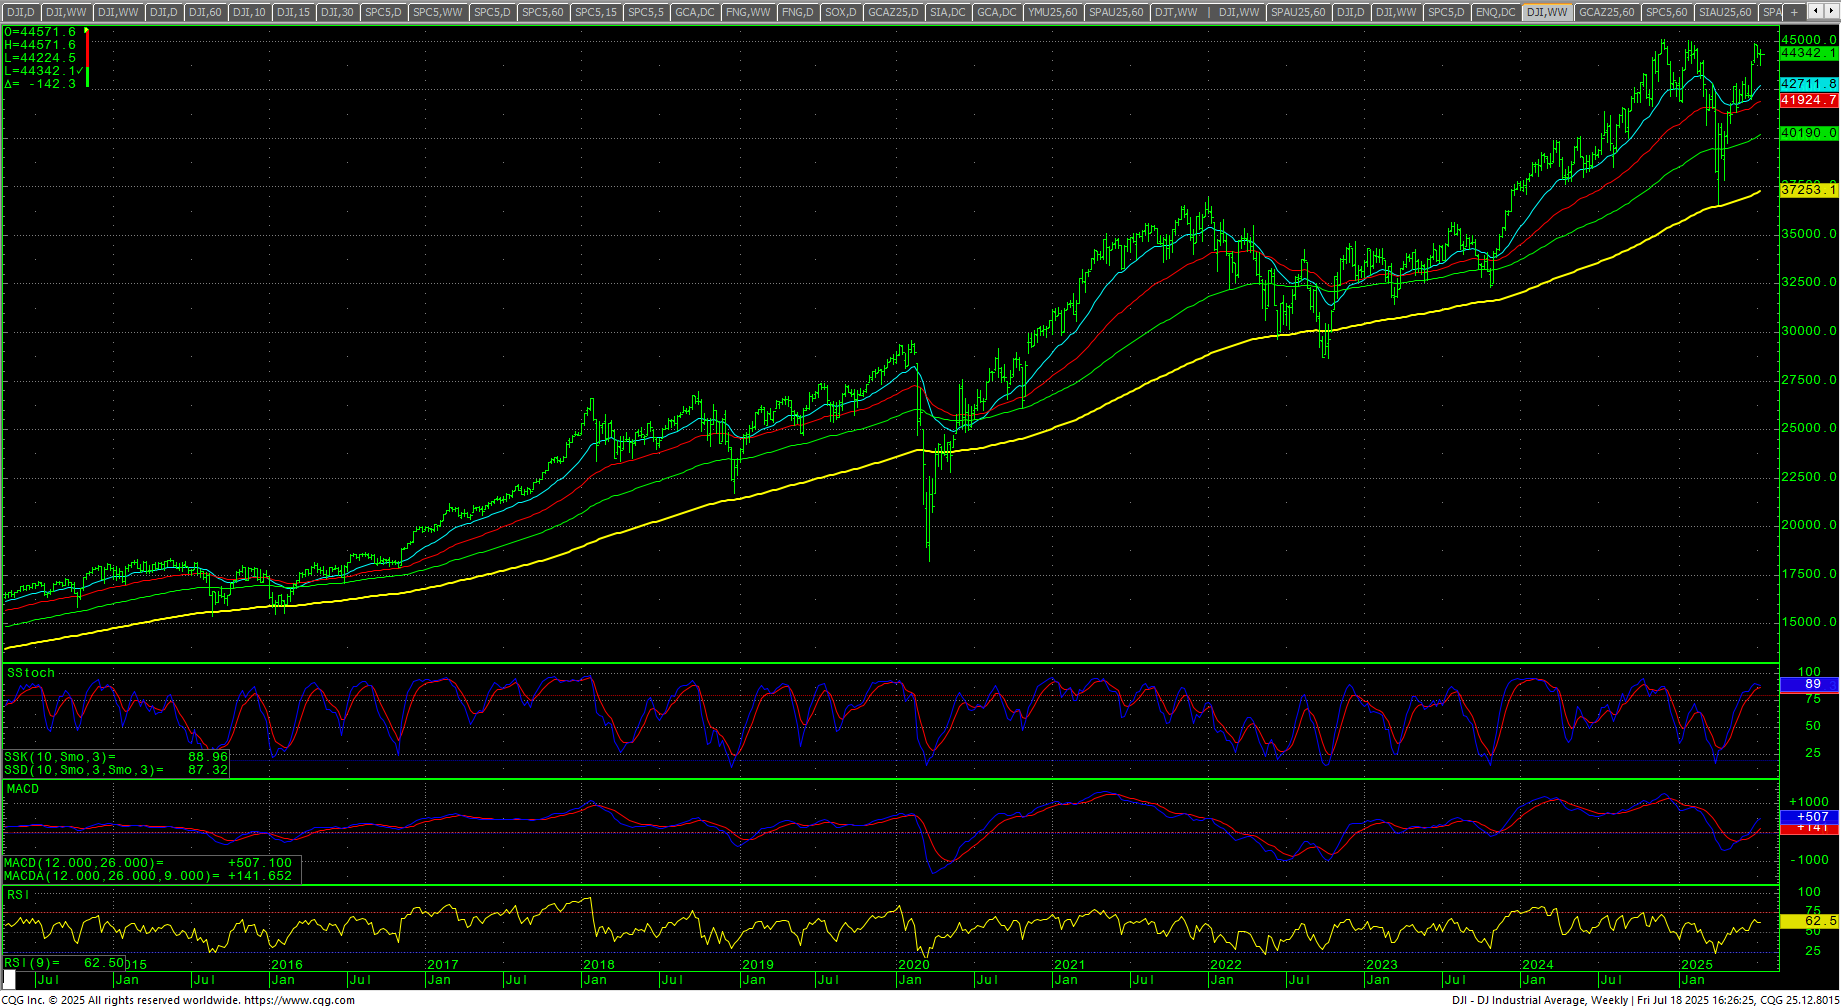 The Dow closed the week up +0.16% on the top end of a reversal range. Prices found near-term pivotal support at 43776/43773 intraweek and saw a bounce. The weekly stochastics are still in an uptrend but have reached overbought numbers. The weekly candle is a hammer, which sometimes is a harbinger of a counter-trend move. The daily stochastics have hooked lower from overbought readings but read neutral. The MACD is extremely overbought. The RSI is pulled back to 57.0. The 200-day MA starts the week at 42170.50 and is trending higher after notching a record high.
Dow Jones Industrial Average Hourly H-L-C
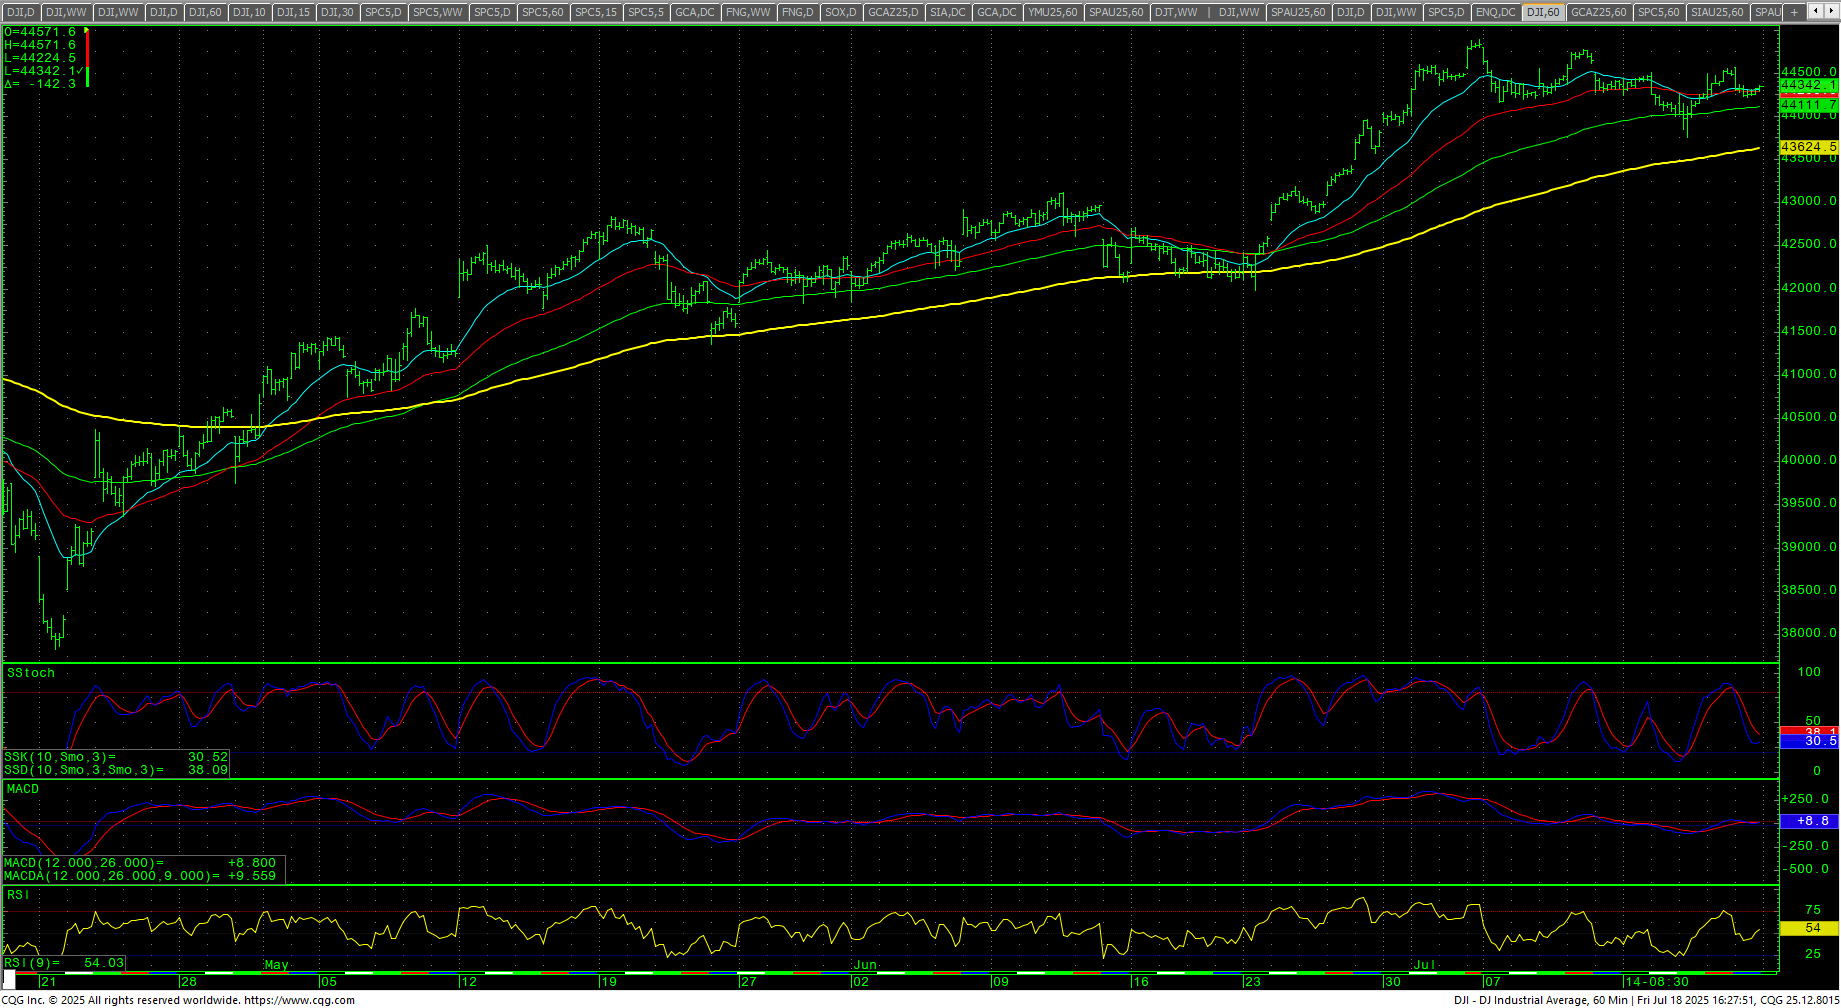 The hourly is neutral on Friday’s close. Resistance is 44455/44460. A drive above 44460 sets up 44604/44619 and 44775 and 44885 with a shot at the all-time highs at 45050/45054/45074. Closes over 45074 opens counts toward 45244 and 45426/45450 (Fibonacci target) and resistance at 45306 and 45378. Rallies with closes over 45450 will reopen longer-term monthly targets in the 47400 level with targets of 46568 and 46954.
Dow Jones Industrial Average Daily Candles
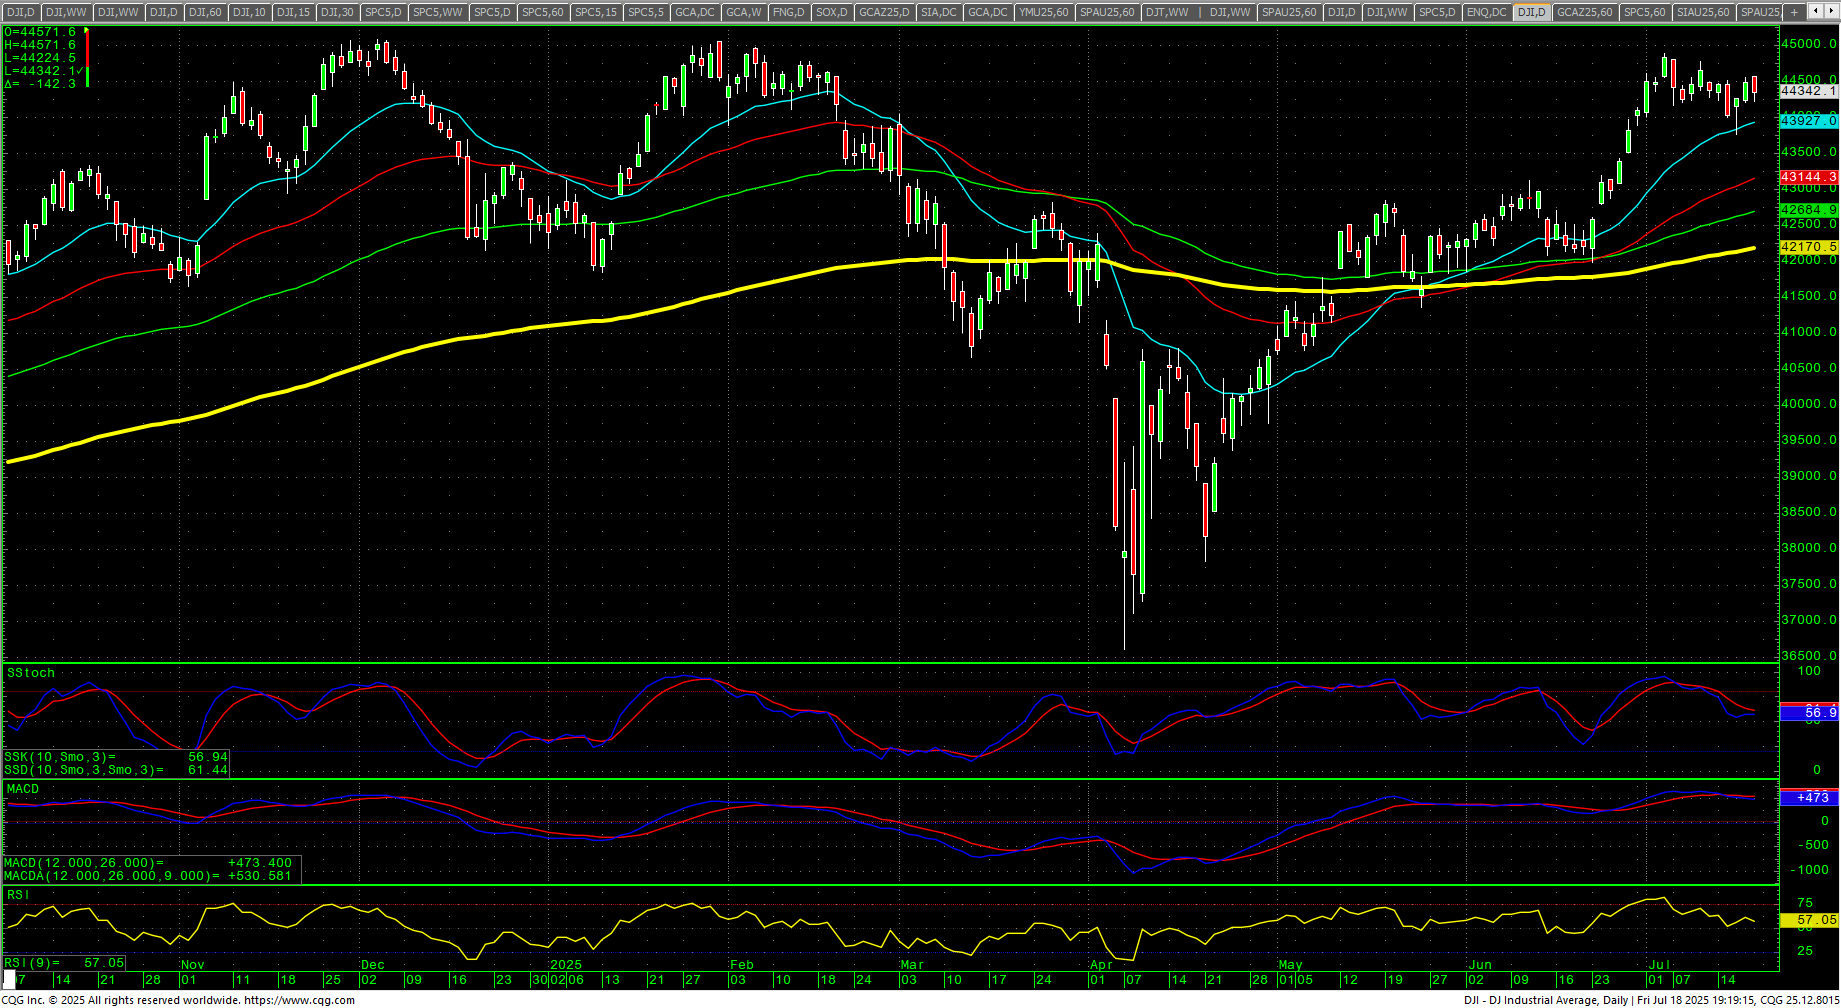 Support remains pivotal at 44200. A further breakdown under 44200 should retest 43988 with counts to near-term pivotal support at 43776/43773/43759. Closes under 43759 should test 43433/43430 with counts to critical near-term support at 43090/43085. Closes under 43085 should minimally test 42707/42666. A breakdown under the 42666 area will set up 42236/42187. Under 42187 sets up 41725. Closes under 41725 are bearish to 40758 with full potential to critical support of 39772/39668.
| Resistance | Support |
|
|
S&P 500 Cash Index: SPX
S&P 500 Index Weekly H-L-C
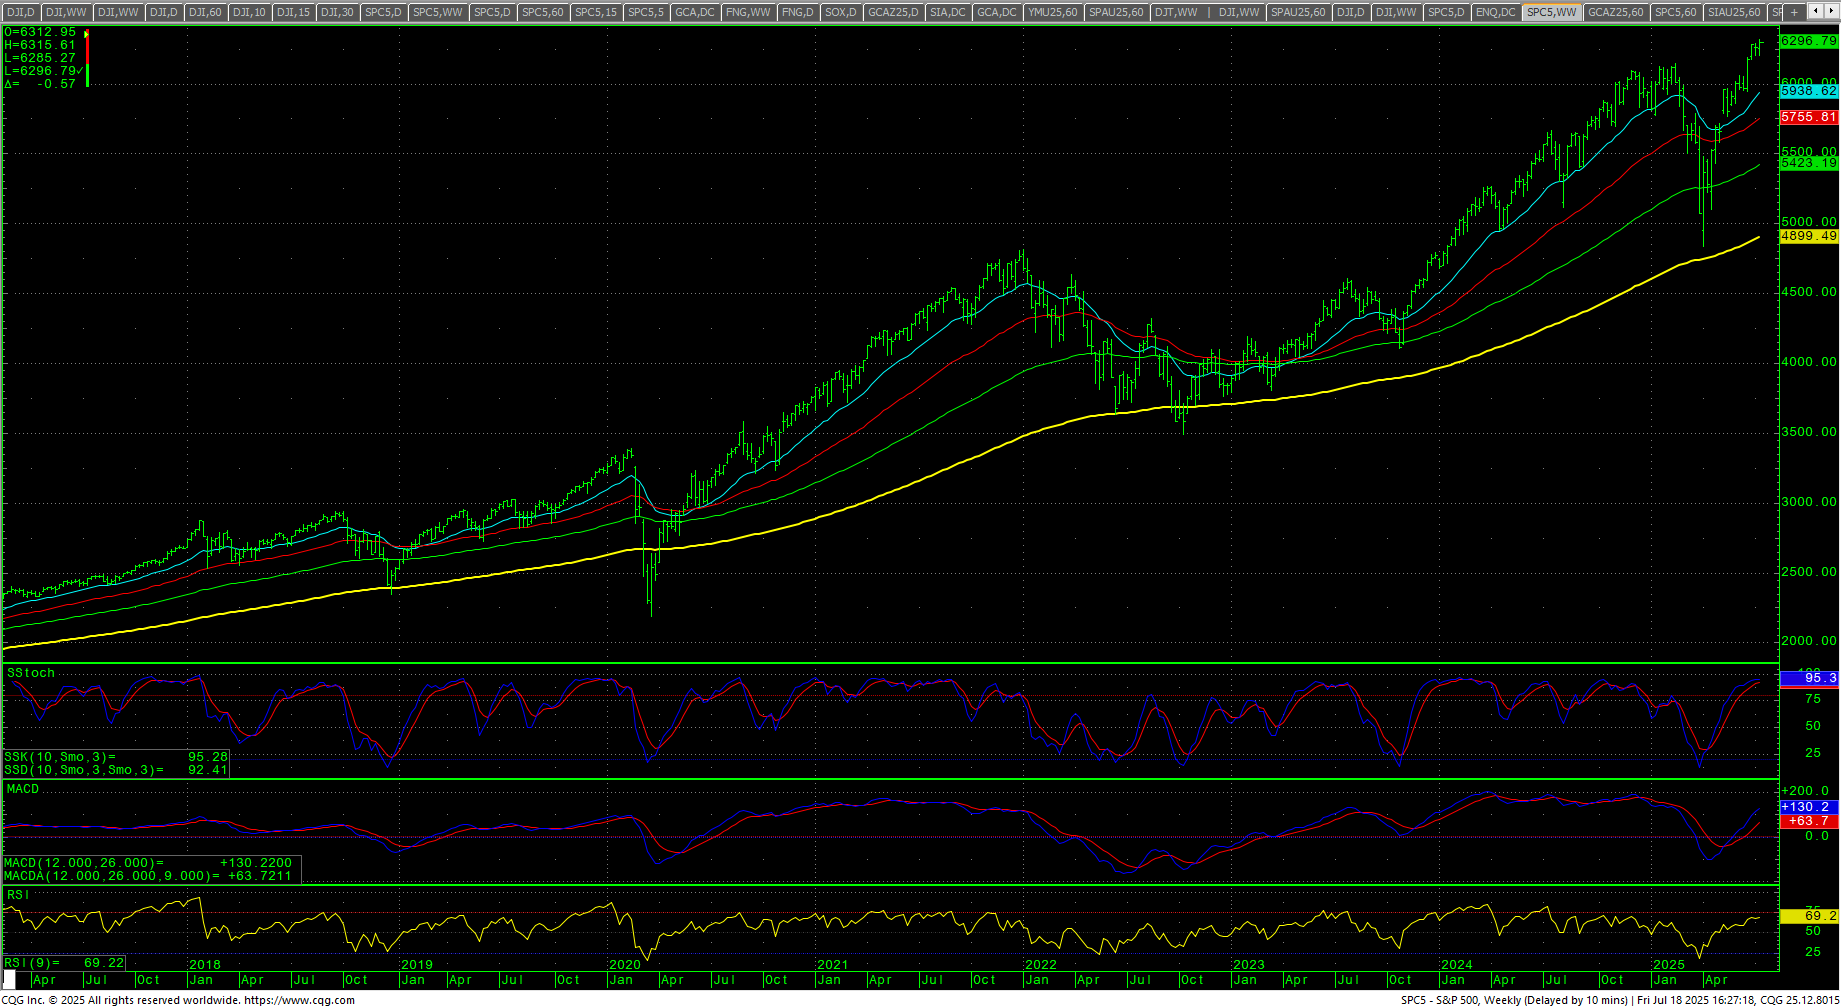 The S&P traded a record high on Friday at 6315.61 and closed flat, just under Thursday’s minor cycle timing ATH close. Prices are trying to build positive gamma in a humungous call wall between 6300/6400. The weekly is extremely overbought but still in an uptrend. The daily is severely overbought in its vertical move from the gap on 24 June 2025. The hourly is neutral on Friday’s close. The 200-day MA is 5801.49 and is trending higher as it sets a record high.
SPY Weekly Candles
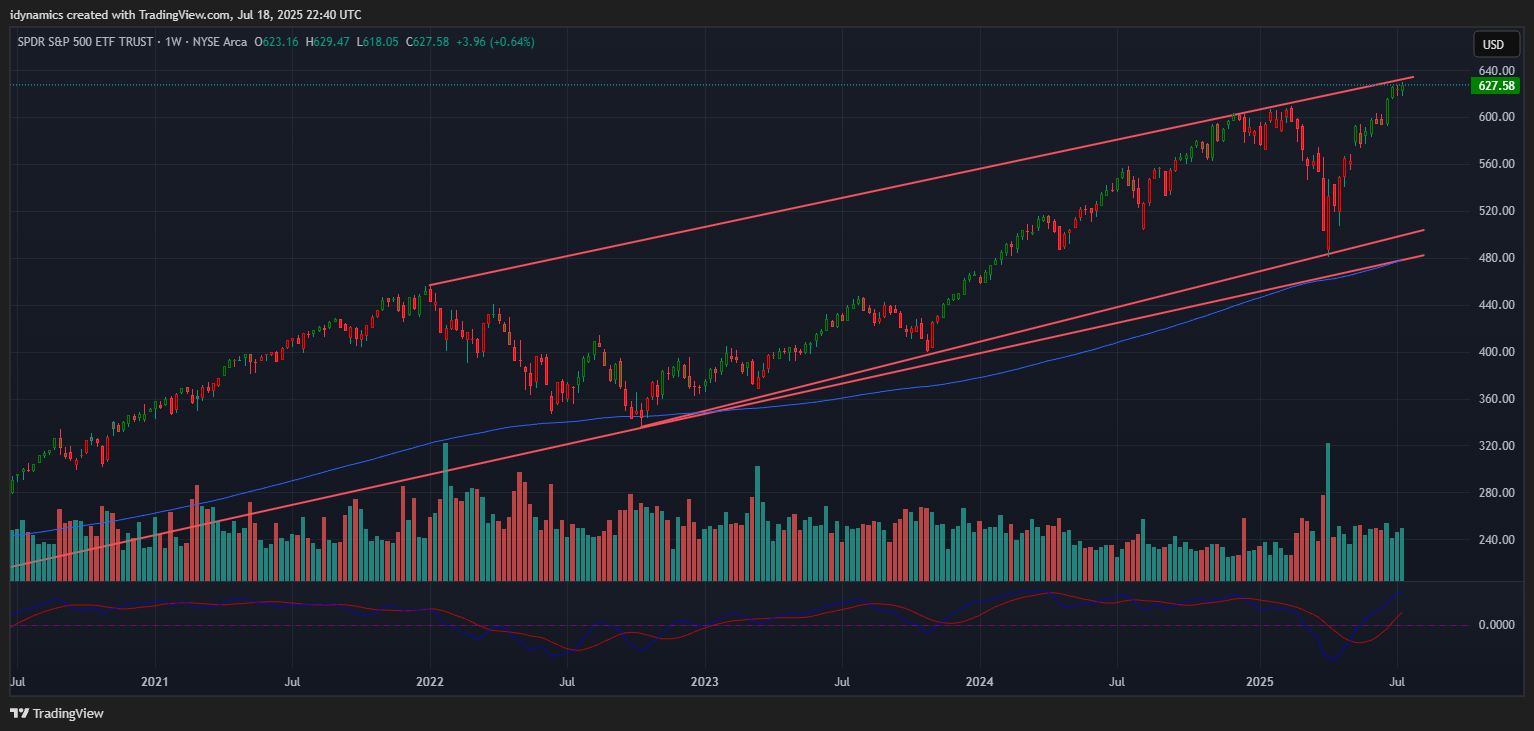 Resistance is 6304/6306 and a drive above that level should retest the highs at 6315/6316. Rallies with closes above 6316 can carry to 6368 with counts into the 6440 area. Closes over 6440 will open counts to 6584 and resistance at 6494. A breakout over 6584 sets up 6638 and 6692. A breakout with closes over 6692 sets up 6764 and 6800. Closes over 6800 can carry to 6872 and 6908.
S&P 500 Index Hourly H-L-C
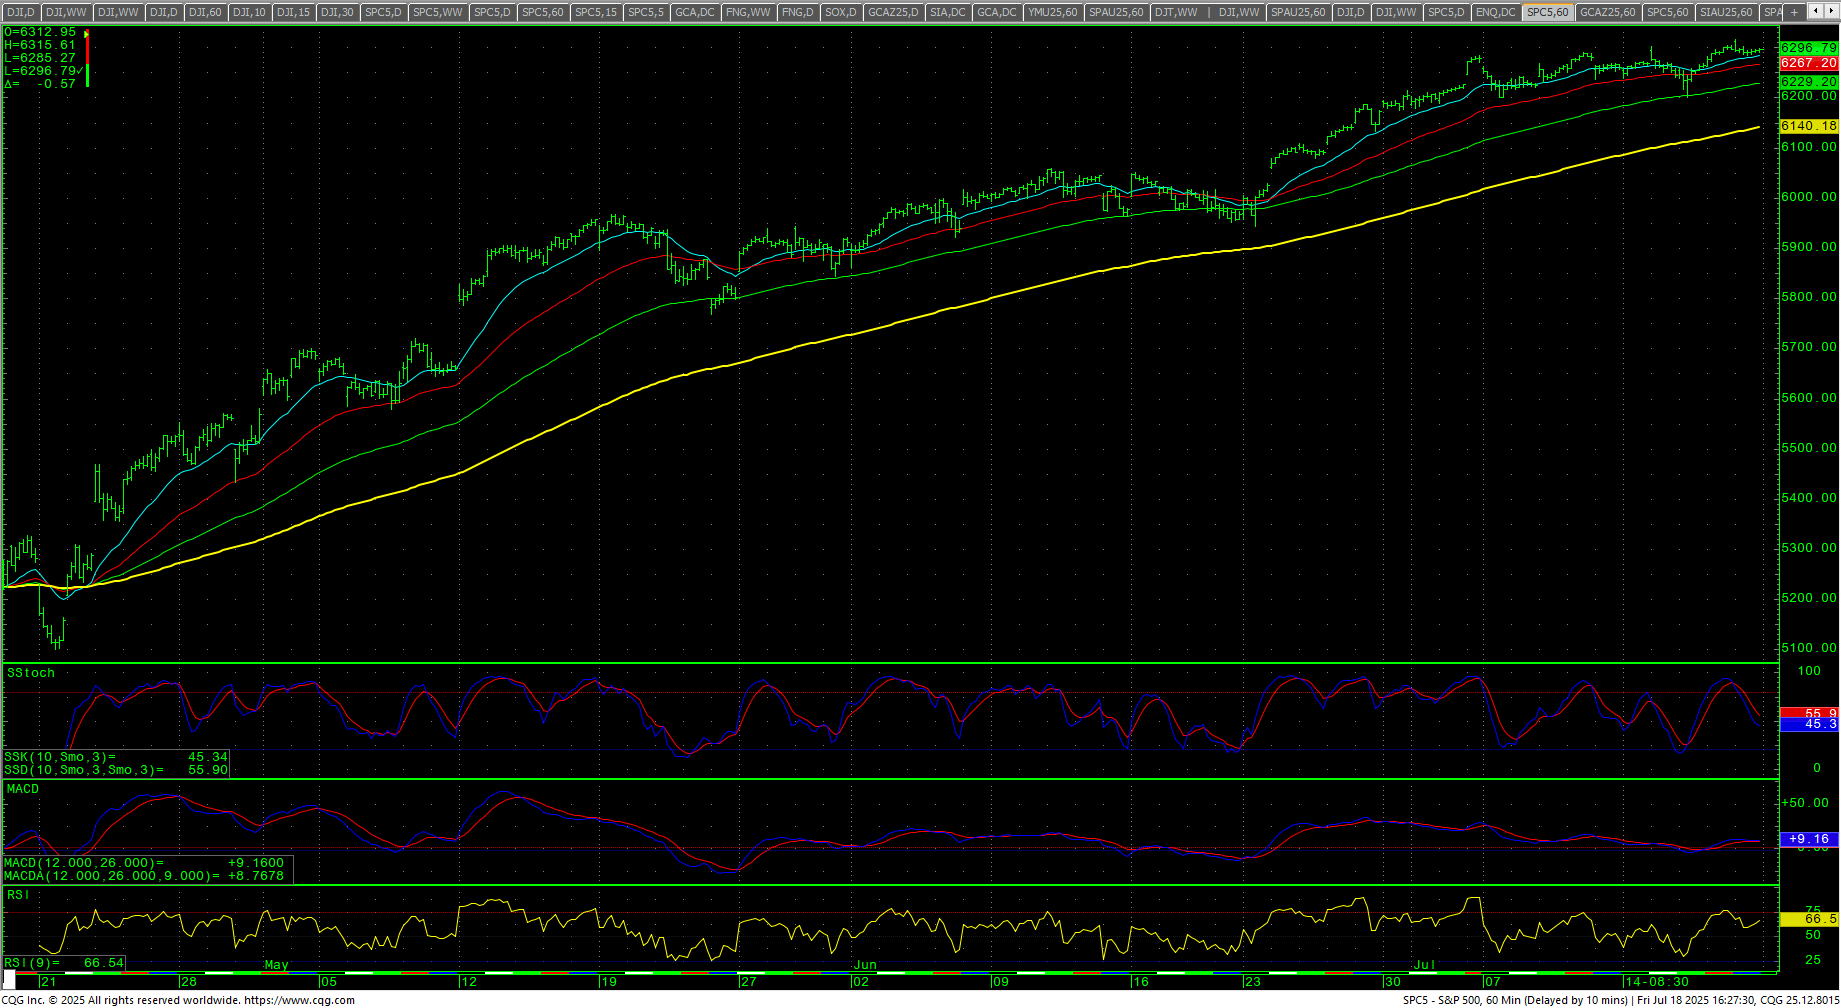 Support is 6208 and 6157. A move under 6157 should test 6116 with potential to pivotal short-term support against the 6075/6072 area. A breakdown under 6072 sets up 6025 with full counts to 5947. Closes under 5947 are bearish to 5734, 5562 and counts to critical short-term support at 5390/5385. Daily closes under 5385 are bearish for a move to 5221 with support of 5629. Closes under 5221 will open counts to 4890/4885 with full counts to 4560/4655. Closes under 4655 can see 4191/4152.
| Resistance | Support |
|
|
Charts courtesy of CQG, Inc., CNN, Koyfin, Trading View and AAII