
 In the beginning if July, I pointed out that the month has a 94% probability of being bullish. Christmas in July came for 2025 with the SPX up nearly 3% heading into the final week. A big week of earnings and fundamental news with PCE and U.S. Employment data is directly ahead.
I have also harped over the past few weeks that, starting in August, things may begin to shift…and shift dramatically.
SPX Weekly H-L-C
 Beginning in August, we have a hurricane of intermediate-term cycles that will begin and last well into the middle of 2026.
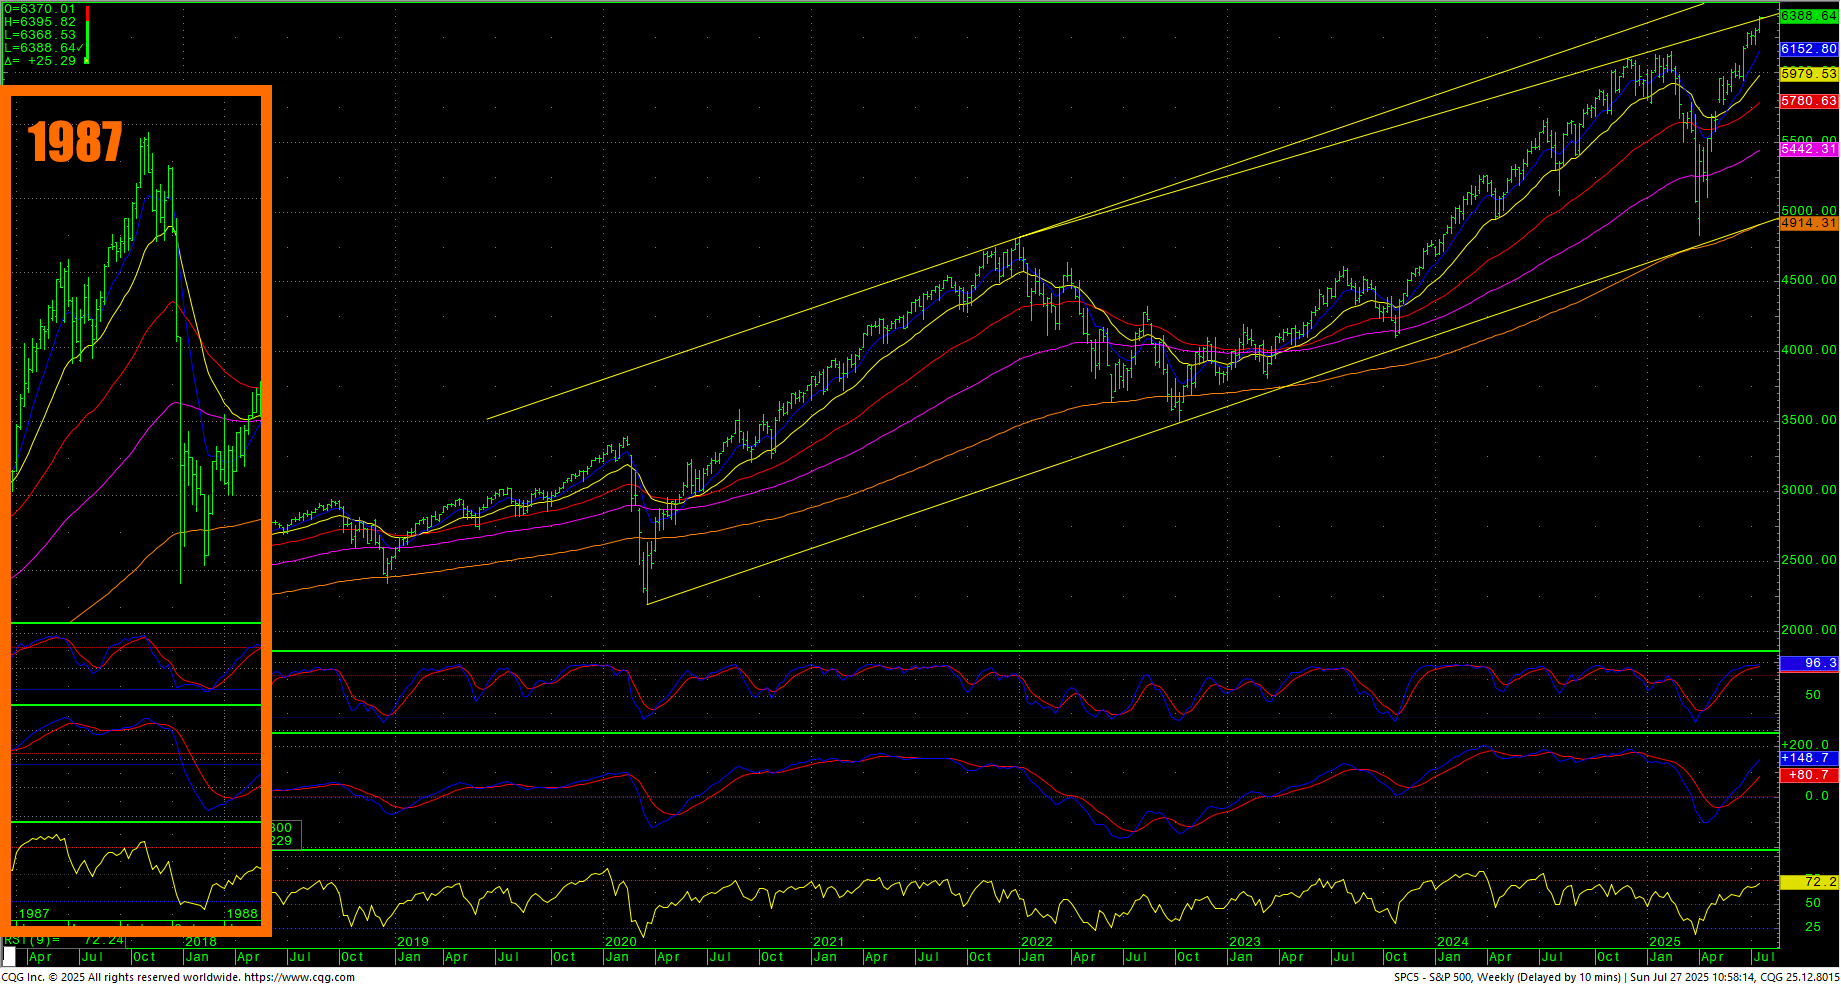
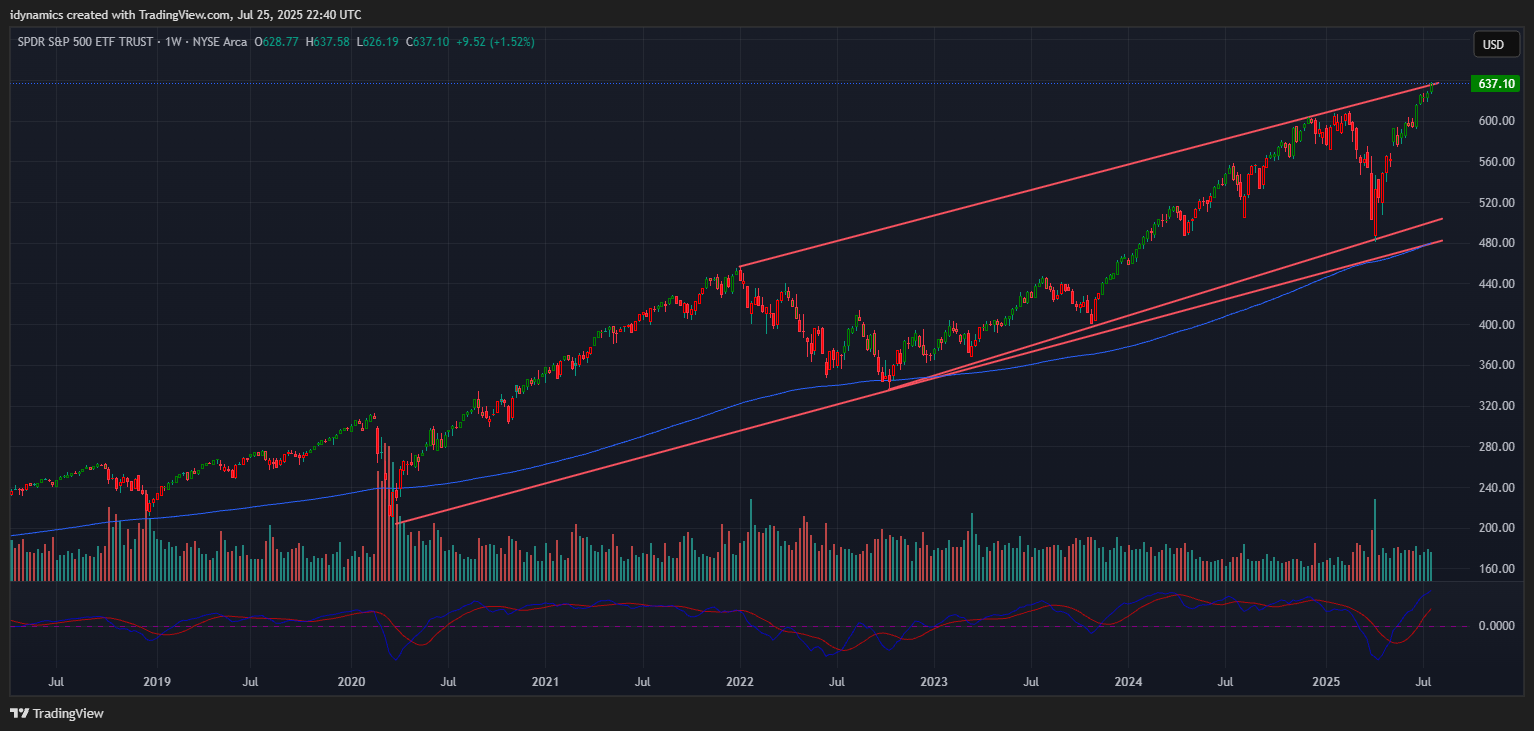
Yes, many indicators are pointing to a frothy market right now. That said, Friday’s close took out the trendline from the 2022 top through the late 2024 top. What is to stop the SPX from ‘not’ surging toward the channel line above (now sitting at 6626/6627)? E.g., could the timing be indicative of a continued and accelerated surge, or are we at the precipice and about to see a major intermediate-term trend shift in the coming months?
This market has a distinct rhyming to 1987…a slow, consistent and quiet crawl to new highs with bull/bear sentiment shifting back and forth. In 1987, the market continued to rise into highs in late August and then began the gradually then suddenly decline into Black Monday in October. It is important to note that it took two years for the market to reclaim the 1987 highs.
The cycles in 2025 are also rhyming with the ones in 1987.
For a disaster scenario to unfold, there needs to be at least three of four key indicators.
- Rampant speculation and overconfidence. ✅
- Irrational Exuberance (?) It is high, but “irrational?”
- Regulatory Shortcomings ✅
- Excess Debt ✅
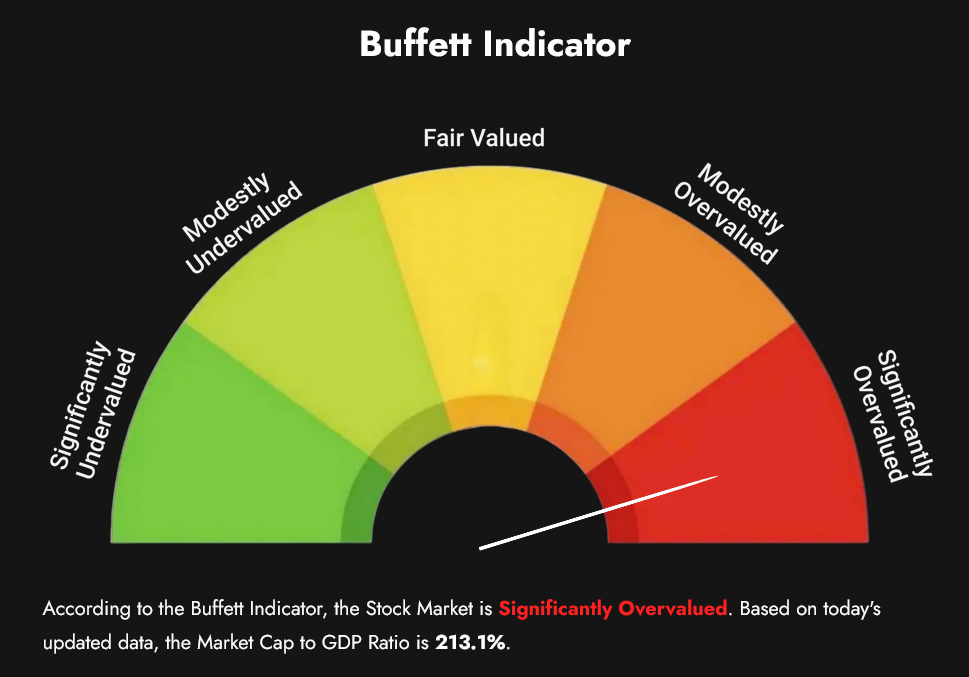
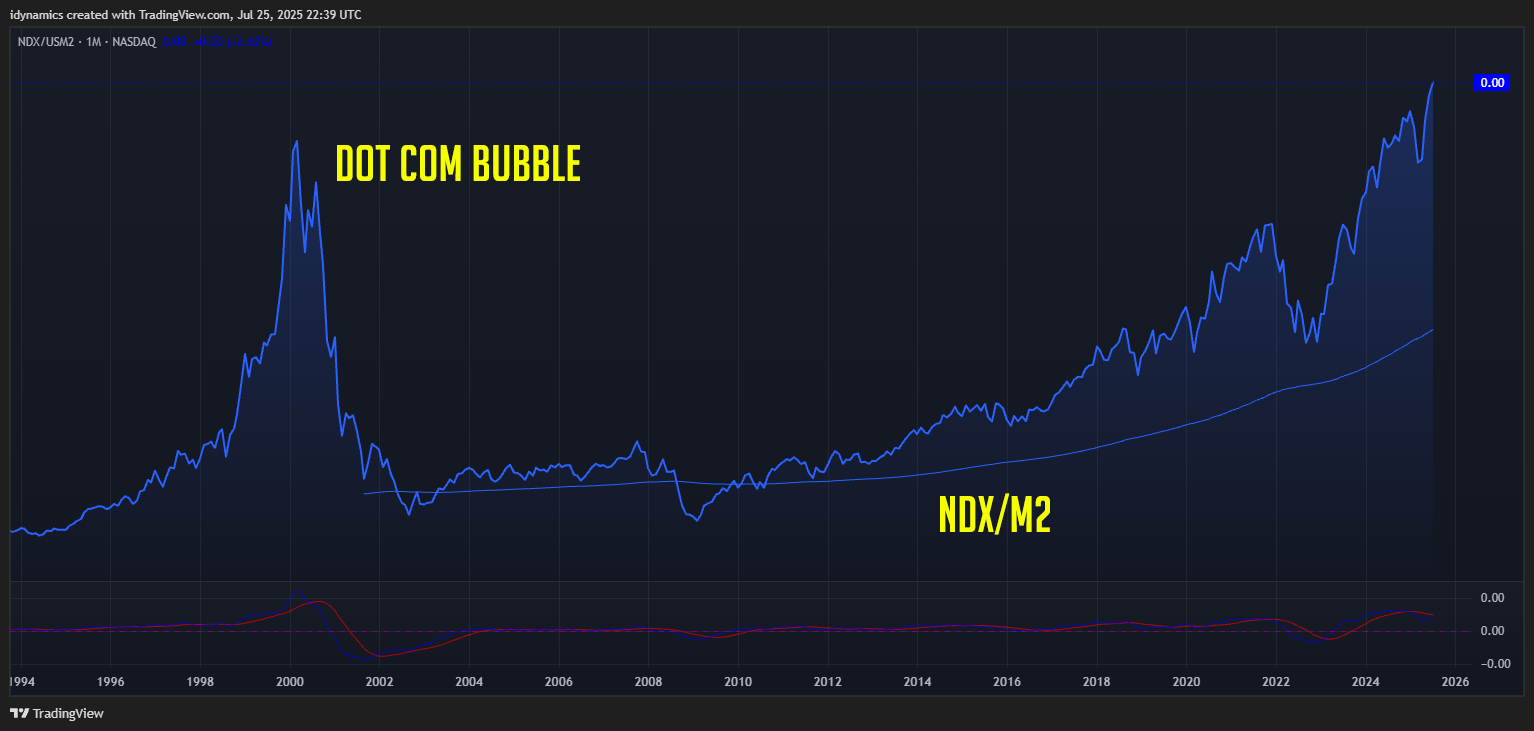
The Nasdaq/NDX by M2 has now exceeded the DotCom Bubble top. The Buffet Indicator has hit a record highs.
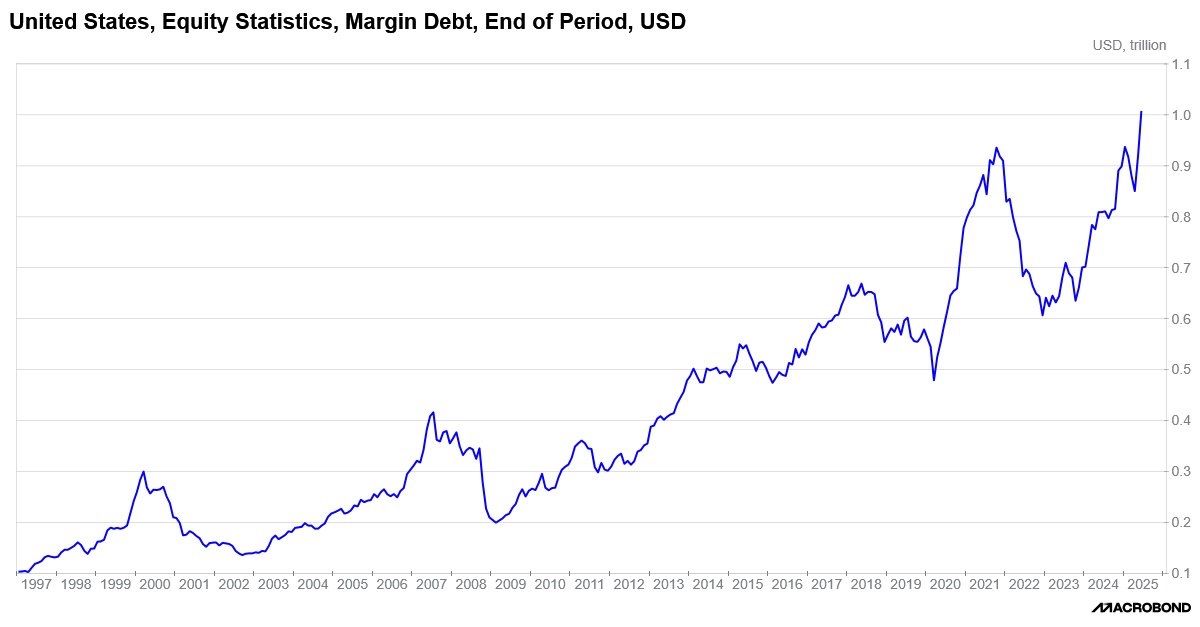
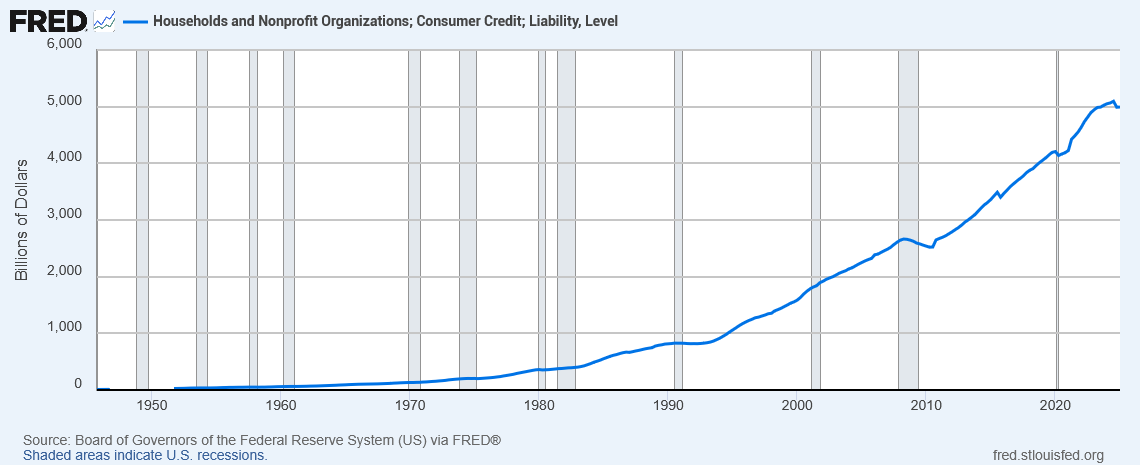
 The other indicator that is flashing warning signs is the massive trade by retail…retail that is enamored with the MAG7 and/or the Top 10 SPX stocks, while doing it with massive margins. The big surge in margin post Covid was on funny money…government money. The current retail margin surge is on debt. Consumer debt is also hitting record highs.
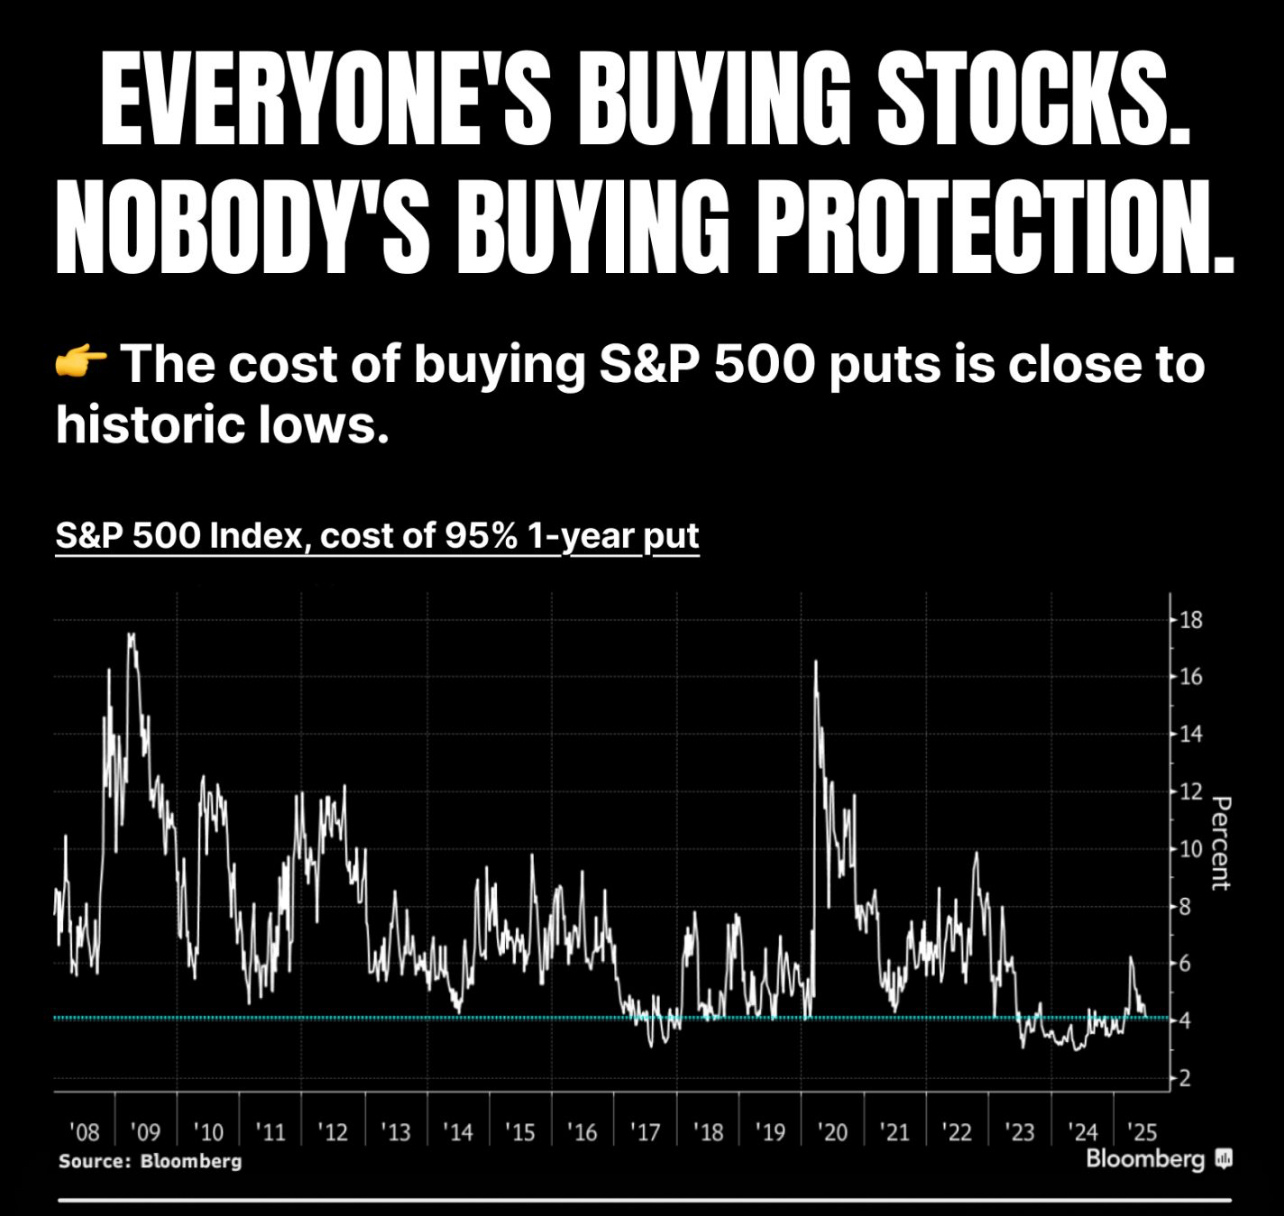
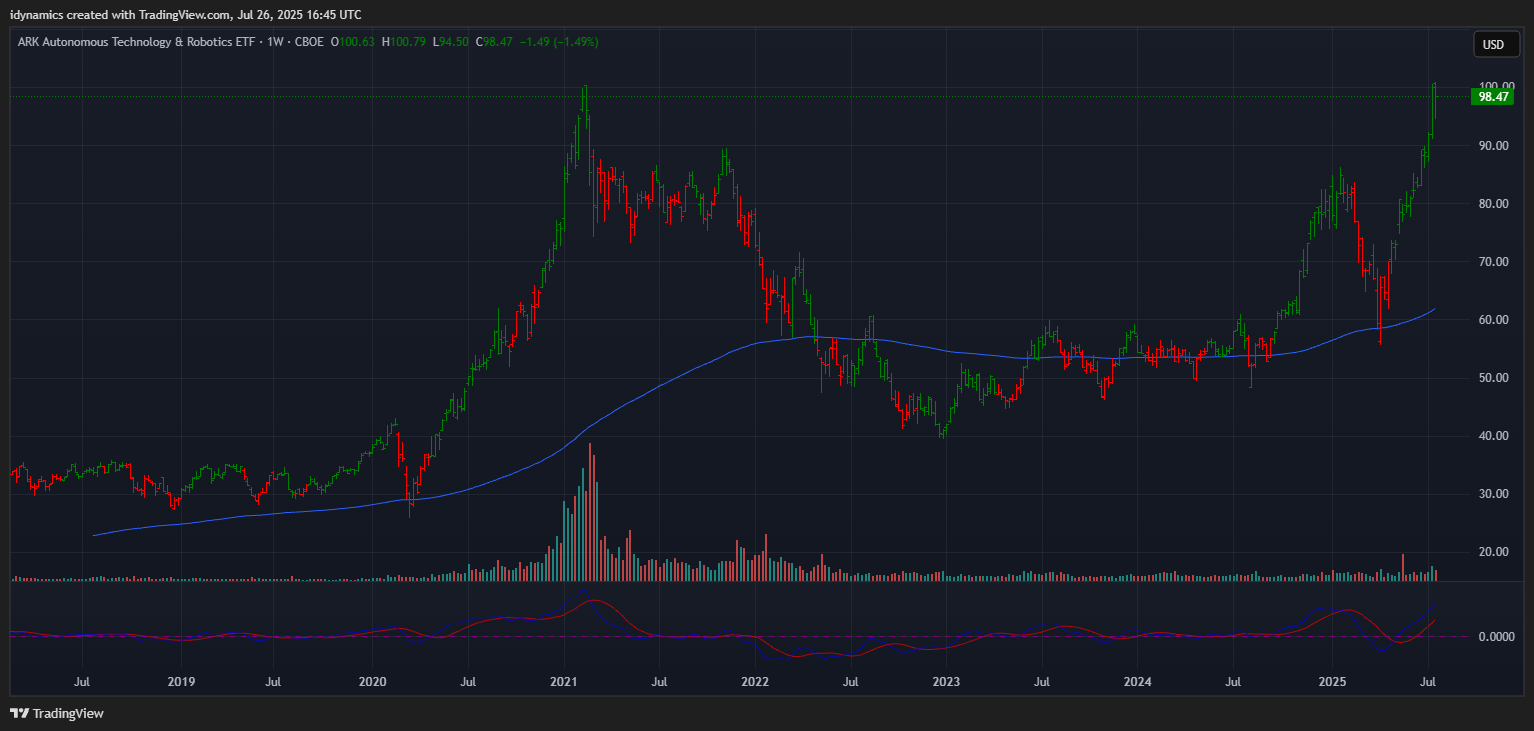
 Reposting from Friday’s tech update: “Both the SPX and the NDX inched above the magic overhead trendlines with Friday’s trade. Speculation is rampant and meme stocks are trading at 2021 levels. Moves in ETFs like ARKQ are signs that extremely weak hands are calling the shots. Call walls are in positive gamma and puts have not been this cheap since 2021 and nearing 2008 levels. Sentiment is frothy with the VIX testing 2025 lows. Divergences are showing up everywhere. Zero-day Options now account for the bulk of options trade. Las Vegas has moved to Wall Street.”
Seeing the 1-2 combination of ARKQ and Jim Cramer announcing the “New FANG” called “PARC” this past week are troubling events in a market where Puts are near historic lows.
 Not only is retail heavily ‘invested’ in meme stocks, but they also now account for the bulk of Zero-Day Options trade.
Now, we could take on the “This time is different” logic…and believe that retail traders a year from now will still be winning. History has a way of disagreeing with that logic.
“Economists have predicted nine out of the last five recessions.”
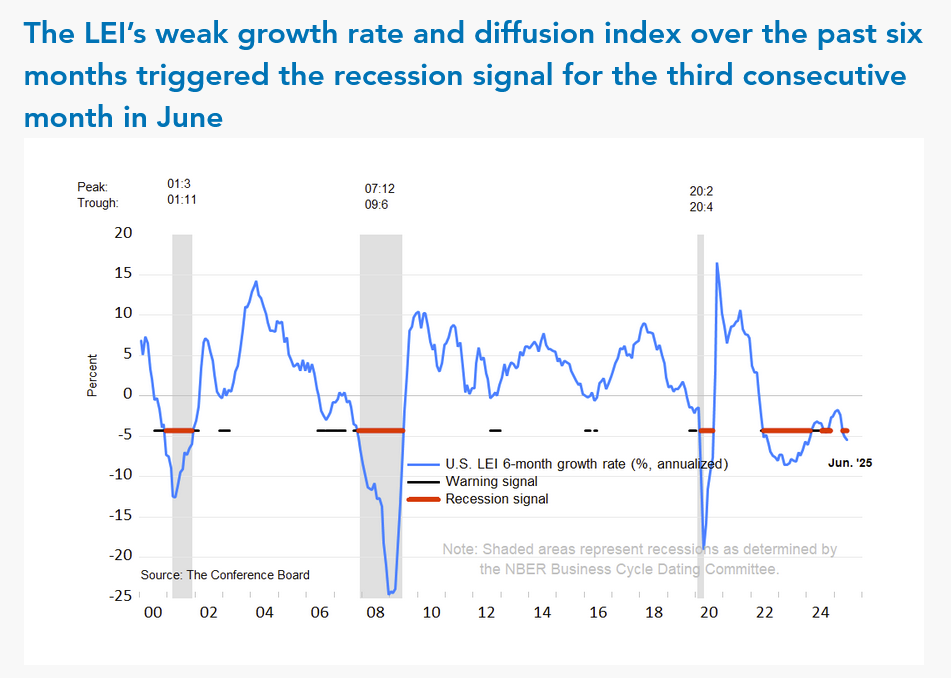 In the first five years of the 2020s, we have had two “recession” predictions that never happened and have seen what some call a “soft landing.”
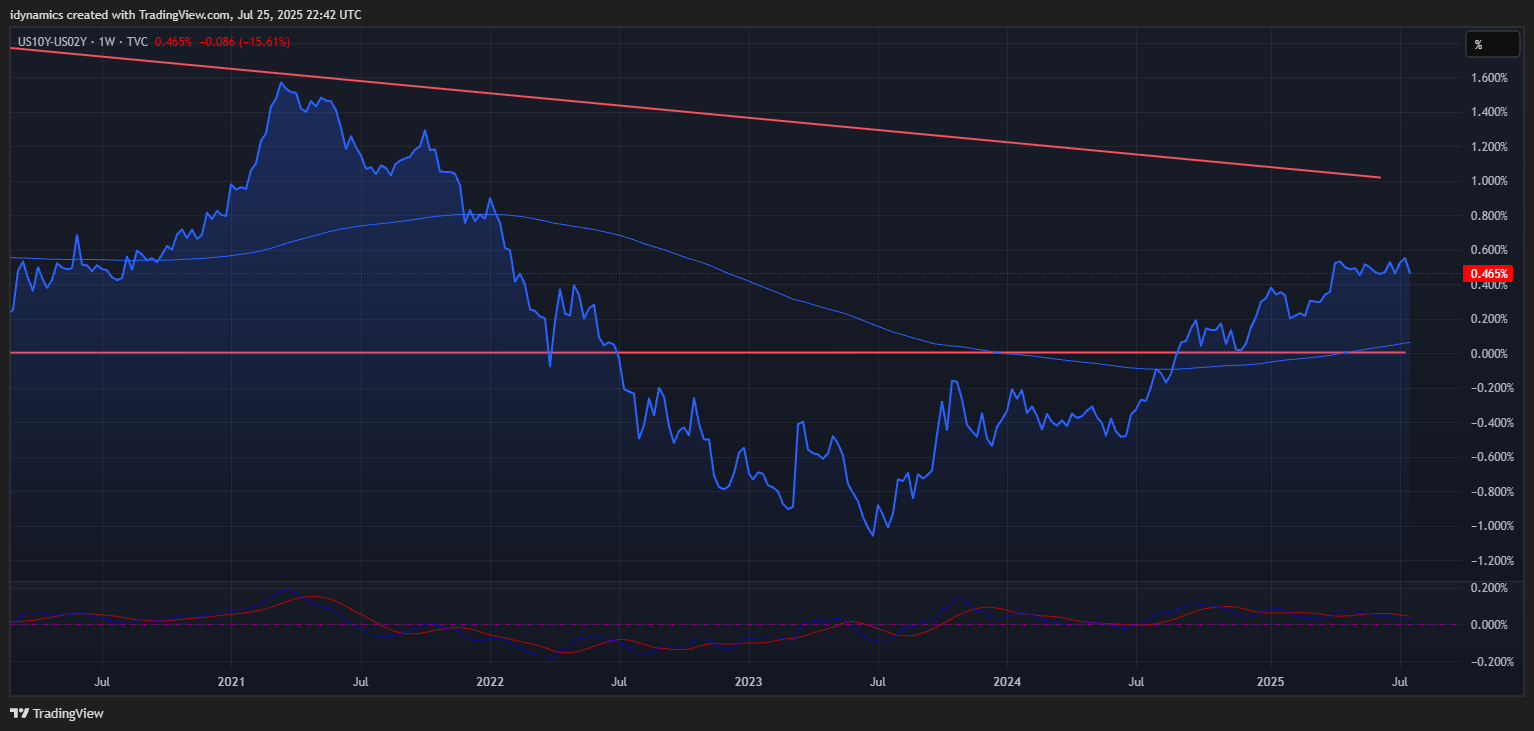
While the reversion of the Yield Curve (following the longest inversion ever recorded) is typically a strong indicator of recession, the normal lag time is six months. The 10YR-2YR turned positive in September of 2024…and things keep chugging along.
In July/August of 2024 the Sahm Rule was triggered, briefly, and then reverted back immediately, dropping to a low of 0.17 currently.
So there are a lot of false/positives occurring over the past few years.
This year, markets were shaken by Liberation Day, and then an immediate 90-day pause was put on Tariffs with Jazz Hands promises of “90 Deals in 90 Days.” The 90-day window passed in July and then got pushed out to August 1. Since then, Wall Street (and retail traders) have been betting on the “TACO Trade.”
Here we are, heading toward the ‘due date’ with ZERO inked deals and across the board tariffs of 10-15%. The recent big “deal” with Japan was immediately shot down by the Japanese government as more Jazz Hands. Will we see another TACO?
And yet, mortgage delinquencies are rising and auto loan defaults have hit record highs in 2025. All while meme stocks and deregulated crypto are frothing. What makes the AI Bubble different from the DotCom Bubble? Does AI have any ROI? CAPEX is truly massive from the investment side, but where are the profits?

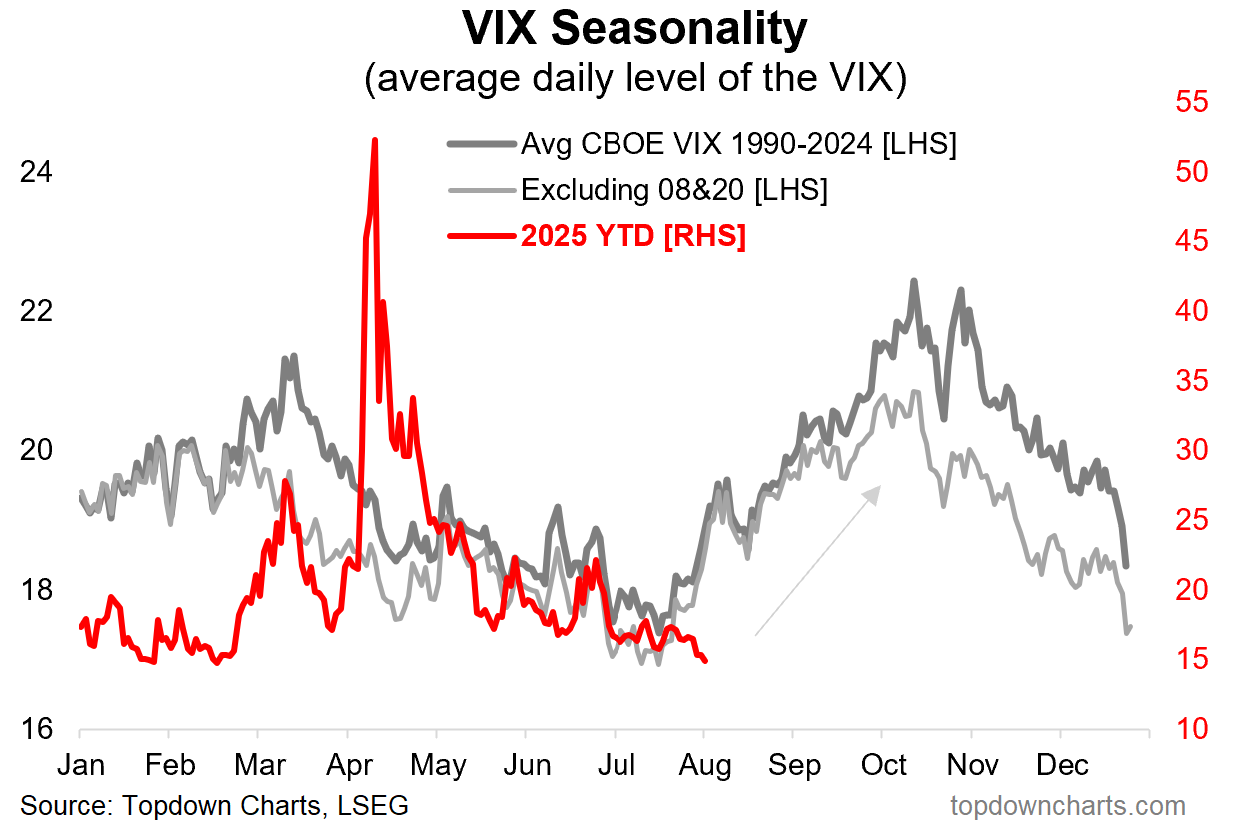
As this chart from Callum Thomas shows, we are entering a period of seasonality where volatility can increase.
 Timing Points
 Here are the key timing points for the next few months. Note that we have two mega windows that last upwards of one+ week each. The first is August 5 through the entire week of the 11th. The second is September 12th through the 19th. August is a month where there is strong potential for an exogenous event to occur.
- 08/01 *** X
- 08/05 *** X kicks off critical week through
- 08/08 *** X through
- 08/11 *** X critical week
- 08/18 **
- 08/25-26 *** X
- 09/05 **
- 09/12 *** X critical weekend through
- 09/16-17 *** X critical week to the 19th
- 09/23 ***
- 10/01 ** key to bonds/dollar
- 10/06 **
- 10/13 *** X
- 10/22 ***
- 10/28-29 *** X
For reference on support and resistance levels, here are the SPX comments from Friday’s update.
S&P 500 Cash Index: SPX
S&P 500 Index Weekly H-L-C
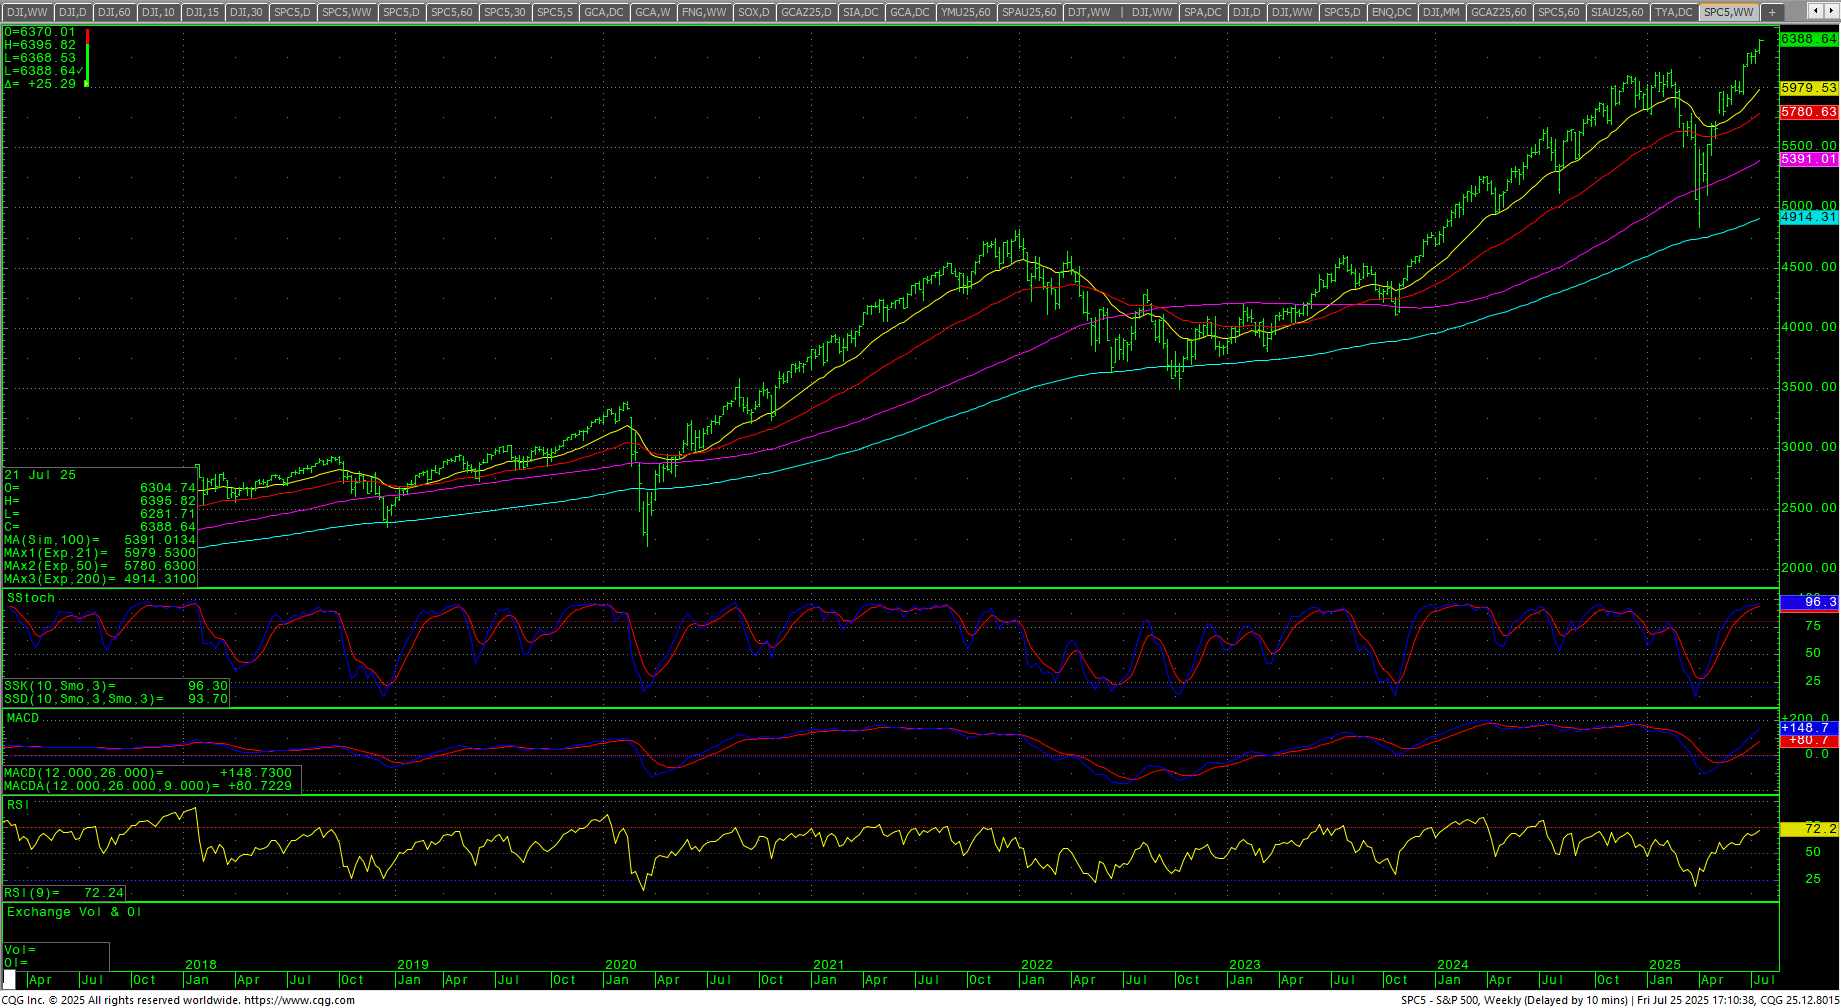 The S&P keeps on trucking, as the lure of the 6400 call-wall kept positive gamma short-term traders piling into the index and ETFs. As outlined above, sentiment and speculative fever have hit extreme levels. The daily chart is up with multiple divergences and is severely overbought. The weekly is extremely overbought but still in an uptrend. The index is at ATHs. The hourly is overbought on Friday’s close. The 200-day MA is 5828.03 and is trending higher as it sets a record high. All moving averages are also at record highs. The SPY took out the massive trendline overhead on Friday and closed above this level.
SPY Daily Candles
 Prices closed just above a key level at 6386 and is on track to test a critical level in the 6440 area. Closes over 6440 will open counts to 6584 and resistance at 6494. A breakout over 6584 sets up 6638 and 6692. A breakout with closes over 6692 sets up 6764 and 6800. Closes over 6800 can carry to 6872 and 6908. Closes over 6908 have counts to 6944 and 6980.
S&P 500 Index Hourly H-L-C
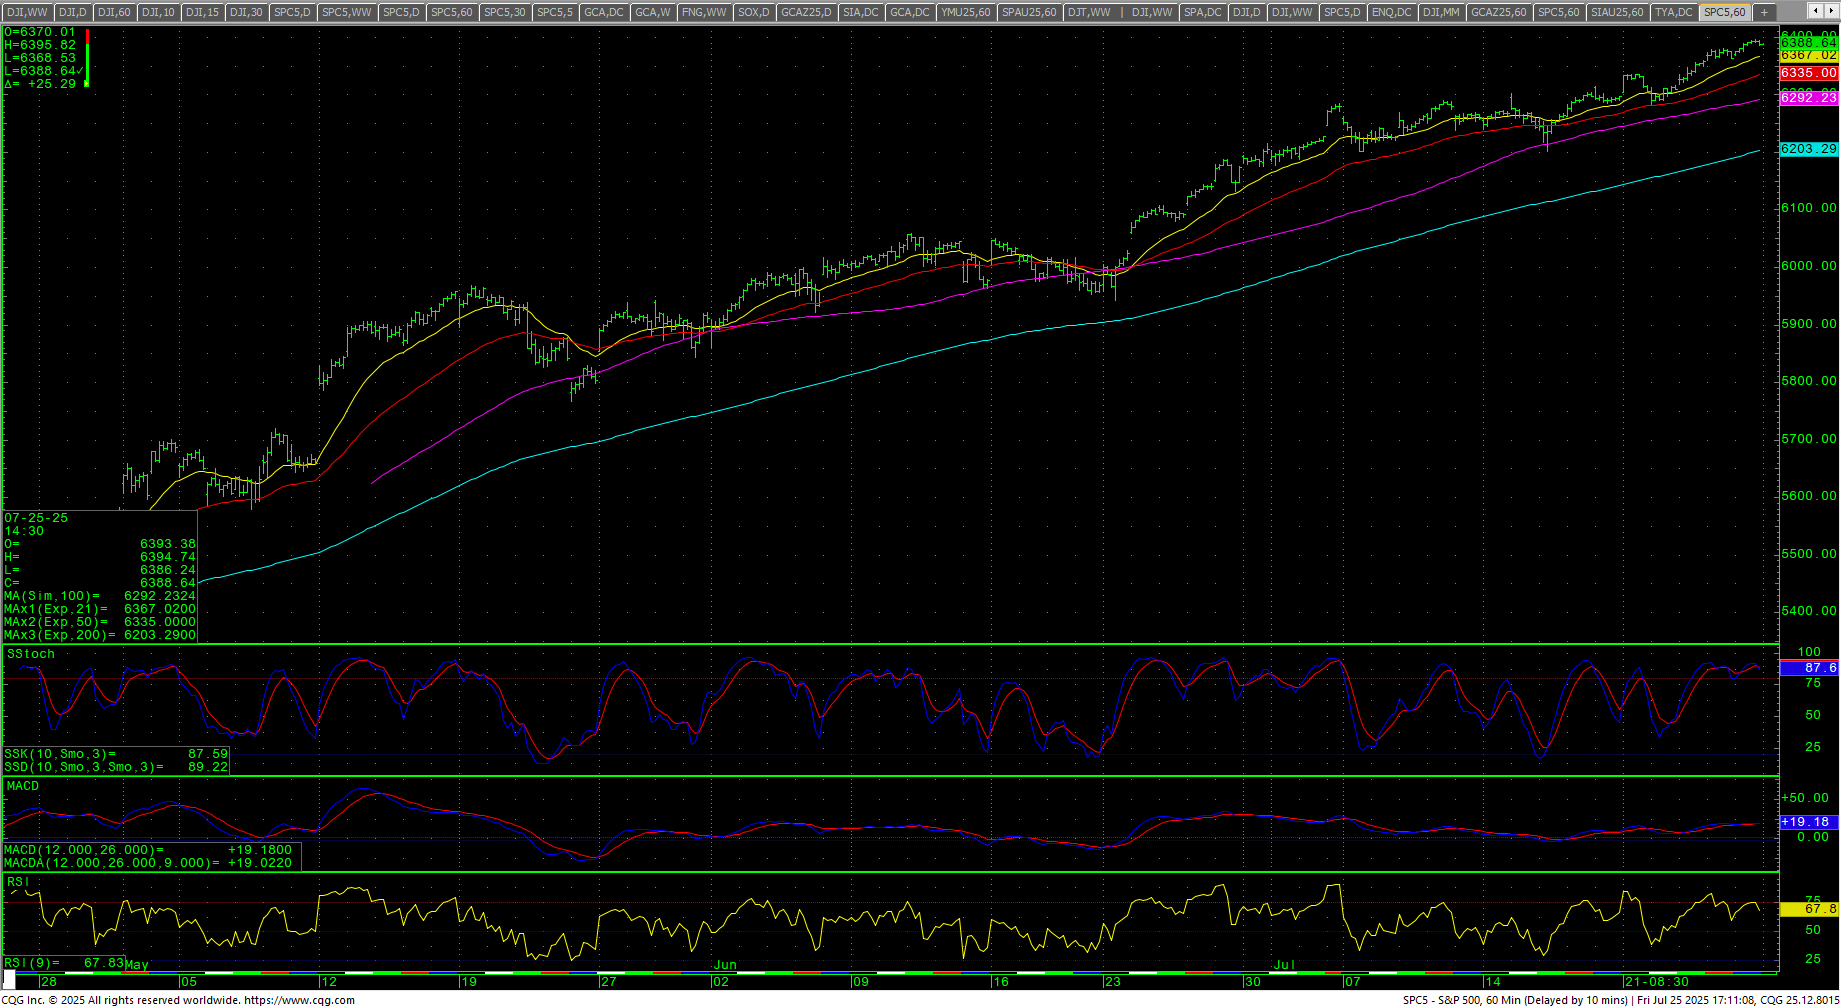 Support short-term is 6368 and 6352/6349. A move under 6349 should test 6338 and 6325/6323. Under 6323 should test 6298 with potential to 6276/6274. Closes under 6274 are bearish to 6247 with potential to test the hourly double bottom at 6201/6200 with full potential to 6156/6155. Closes under 6155 set up. A breakdown under 6080 sets up critical near-term support at 6007/6005. Daily closes under 6005 are bearish to 5924/5915. Closes under 5915 open counts to 5710.
| Resistance | Support |
|
|
Charts courtesy of CQG, Inc. and Trading View