
TECHNICAL ANALYSIS (by Intraday Dynamics)
Major Indices Week of August 1, 2025
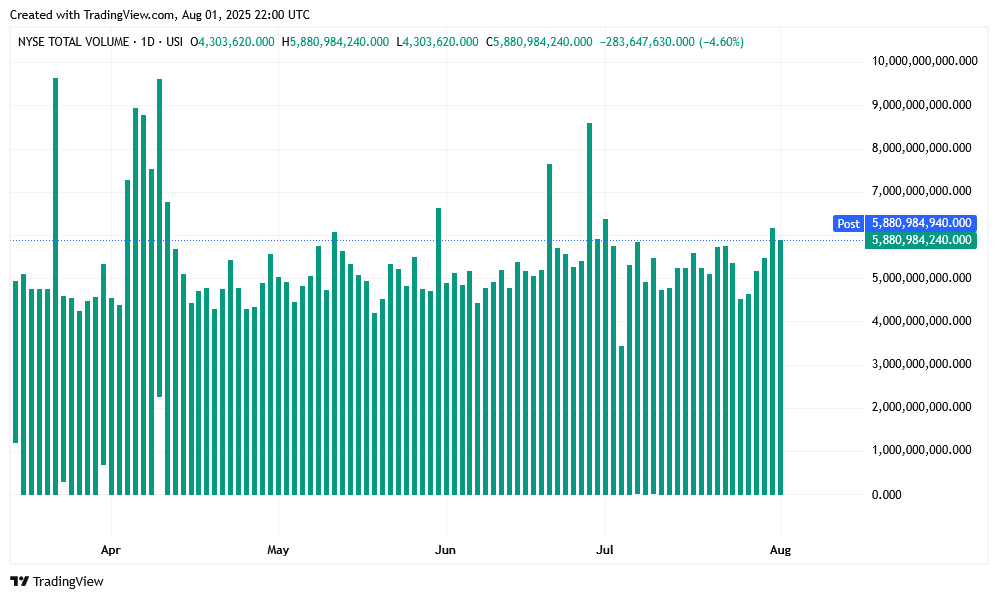
 NYSE Volume

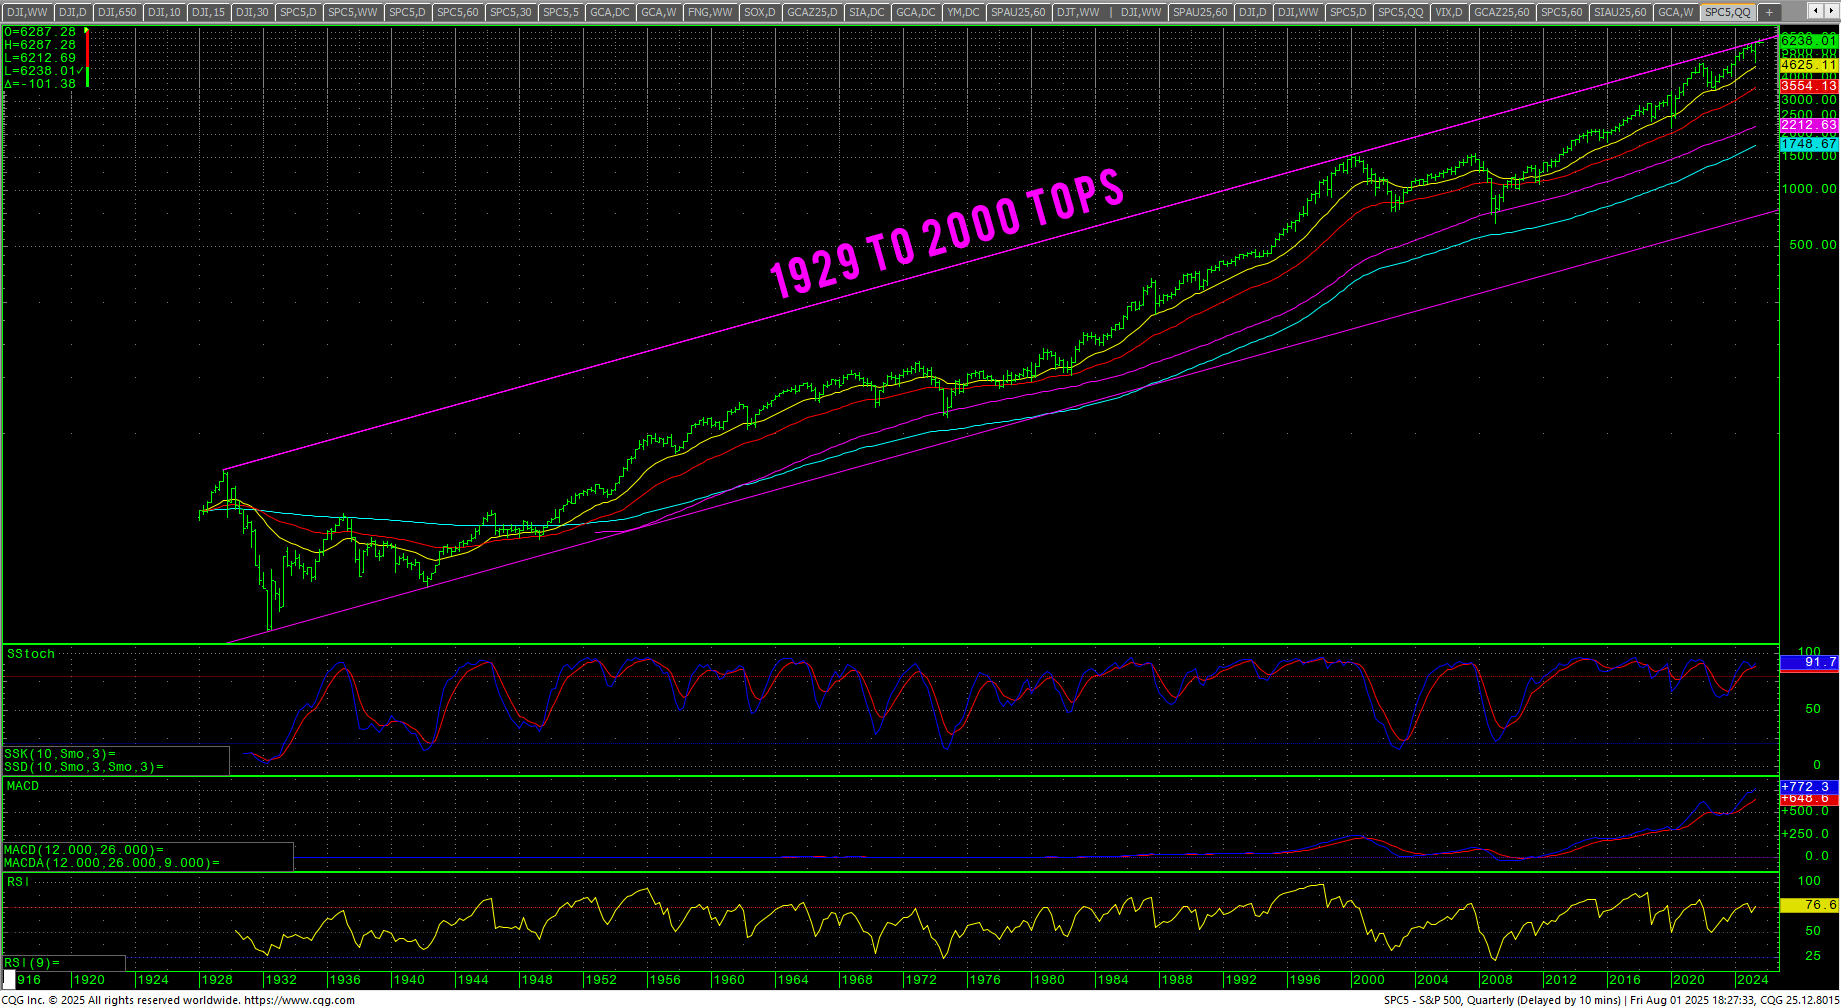
 SPX Quarterly 1928-Present H-L-C
 Stocks traded a volatile news filled week with many indexes setting record intraday highs before reversing sharply late in the week for outside weeks down on most charts. Wednesday saw GDP come in better than expected but skewed sharply due to a 32% decline in imports. That was followed by the Fed holding rates steady. Then Microsoft and META announced gonzo earnings and that sent the tech sector soaring to record highs, only to fail late in the session on the ‘buy the rumor, sell the fact’ trades.
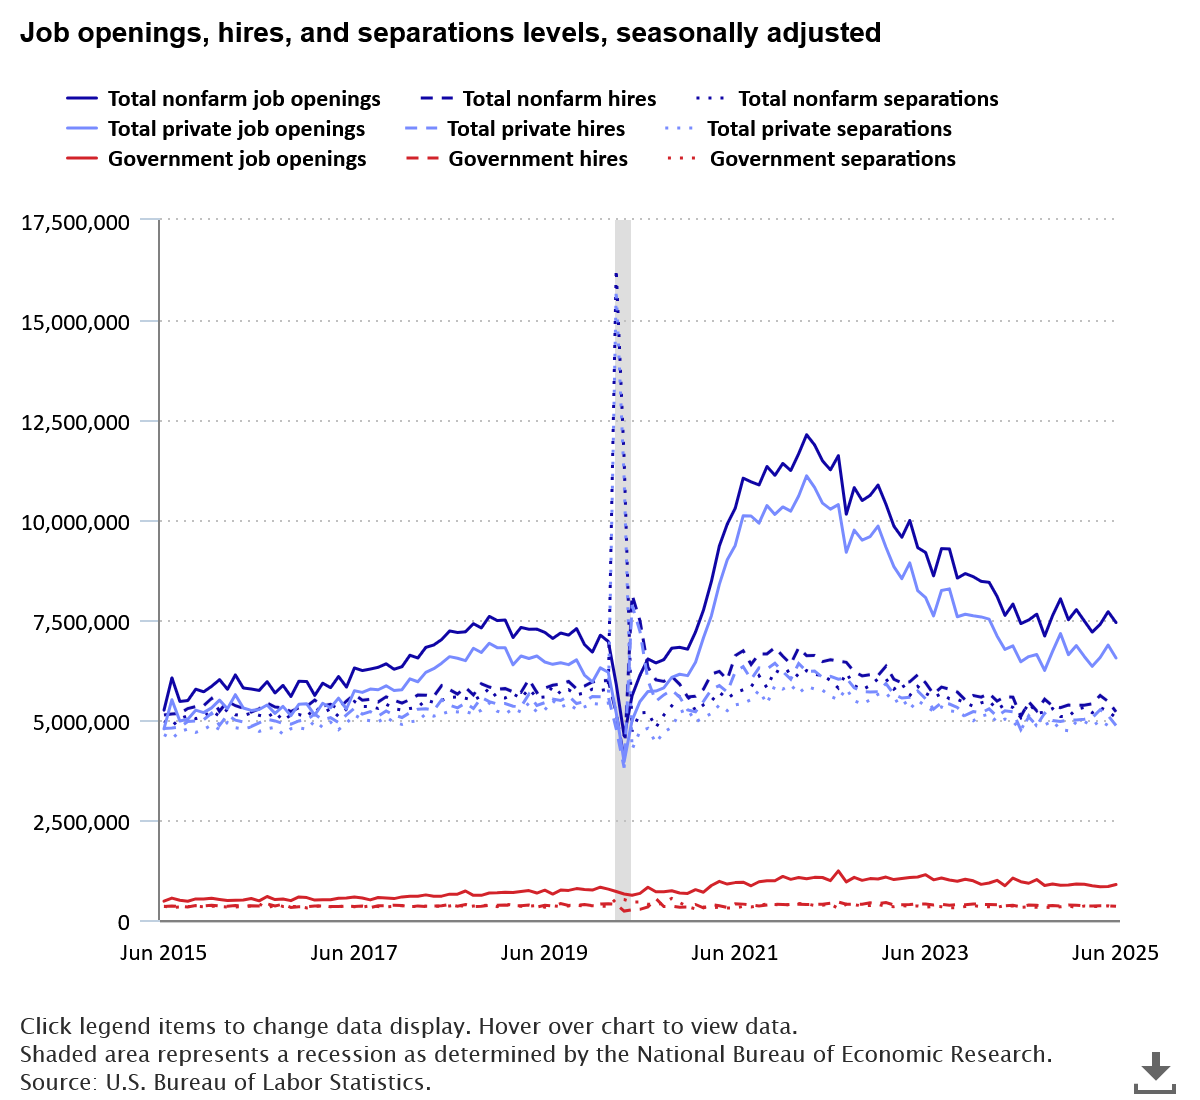
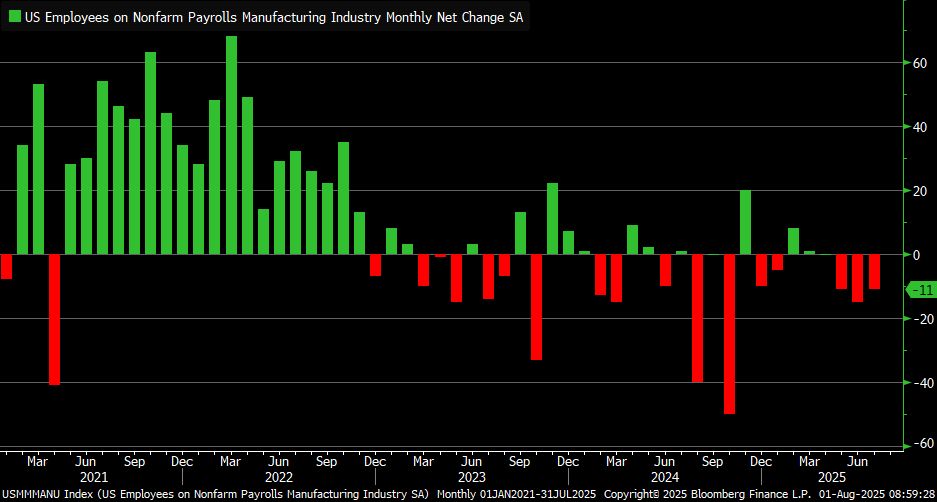
Friday saw a gap lower and a sharp selloff on a weaker than expected jobs report, replete with massive revisions. For the past few months, I have been talking about how the Household Surveys have been describing a radically different picture than the BLS. BLS relies on employer data and Household Surveys relies on employees. Employees have been telling a different story for almost a year now. JOLTS has also been signaling a major problem. Three months of losses in manufacturing. To make things crazier, what do you do when you don’t “like” the numbers the BLS releases? You fire the commissioner of the BLS!
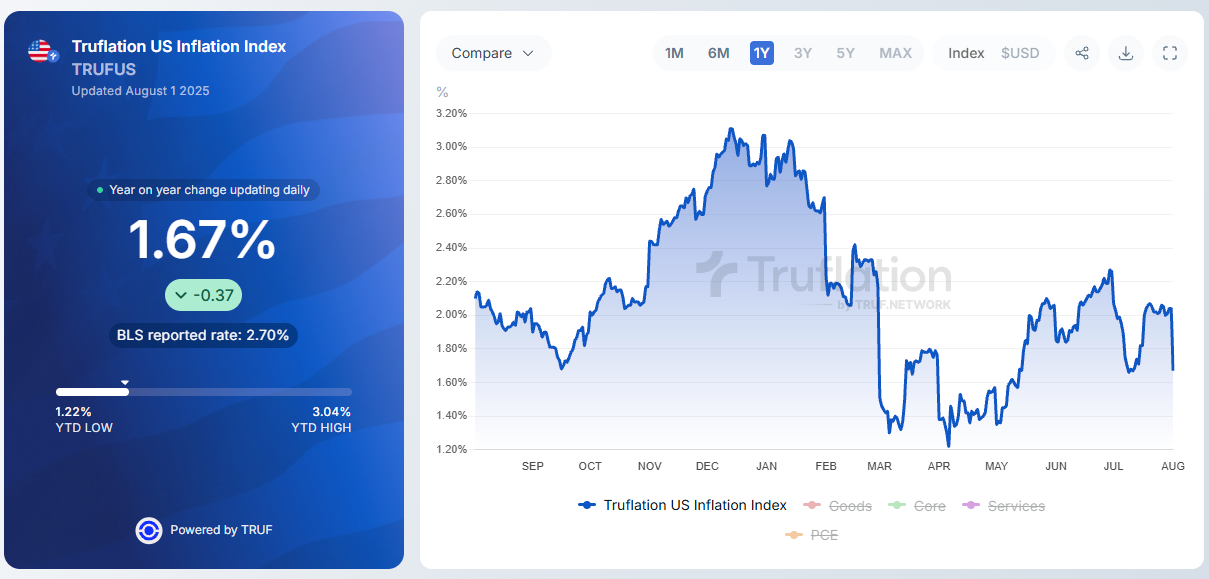
The weak jobs numbers along with Truflation dipping to 1.67% is putting betting odds on a September rate cut at 76%. Along with Fed governor Adriana Kugler stepping down next week, the move to oust Jerome Powell has a new lane…meaning it may come before the end of year and before his term ends in 2026. What will politically manipulating the central bank mean for the markets? Will we have an endogenous event along with an exogenous one?
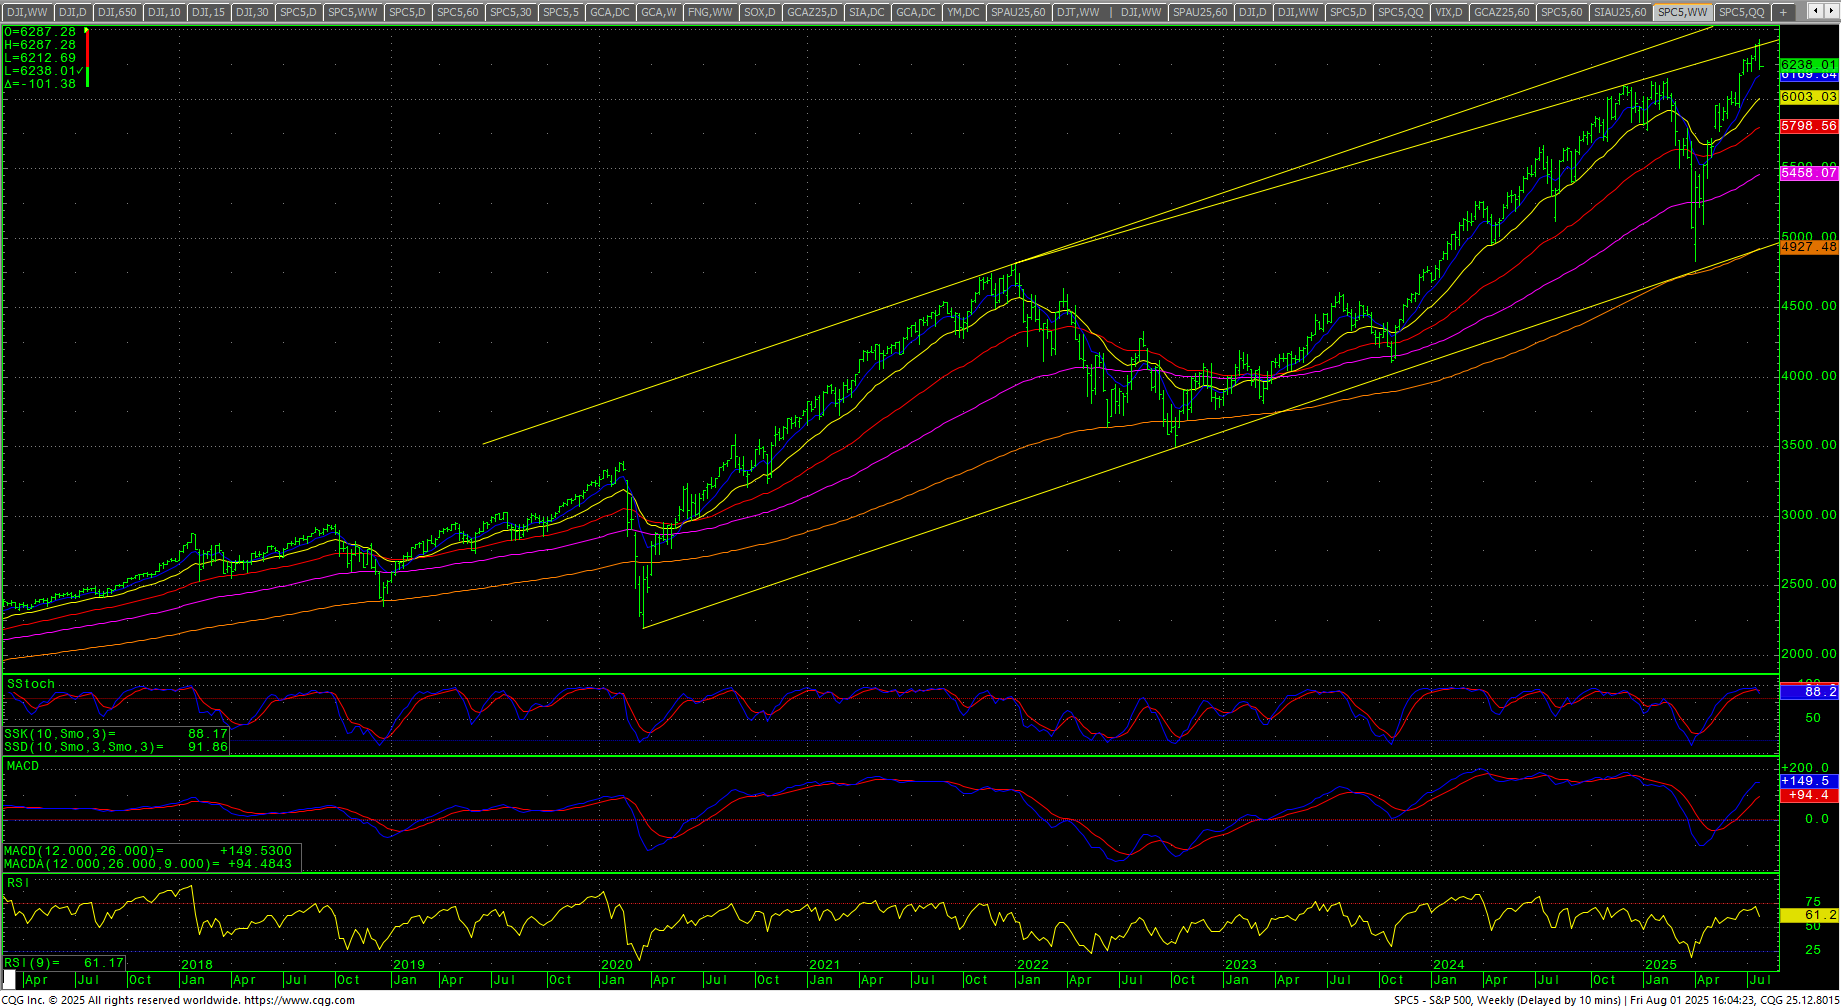
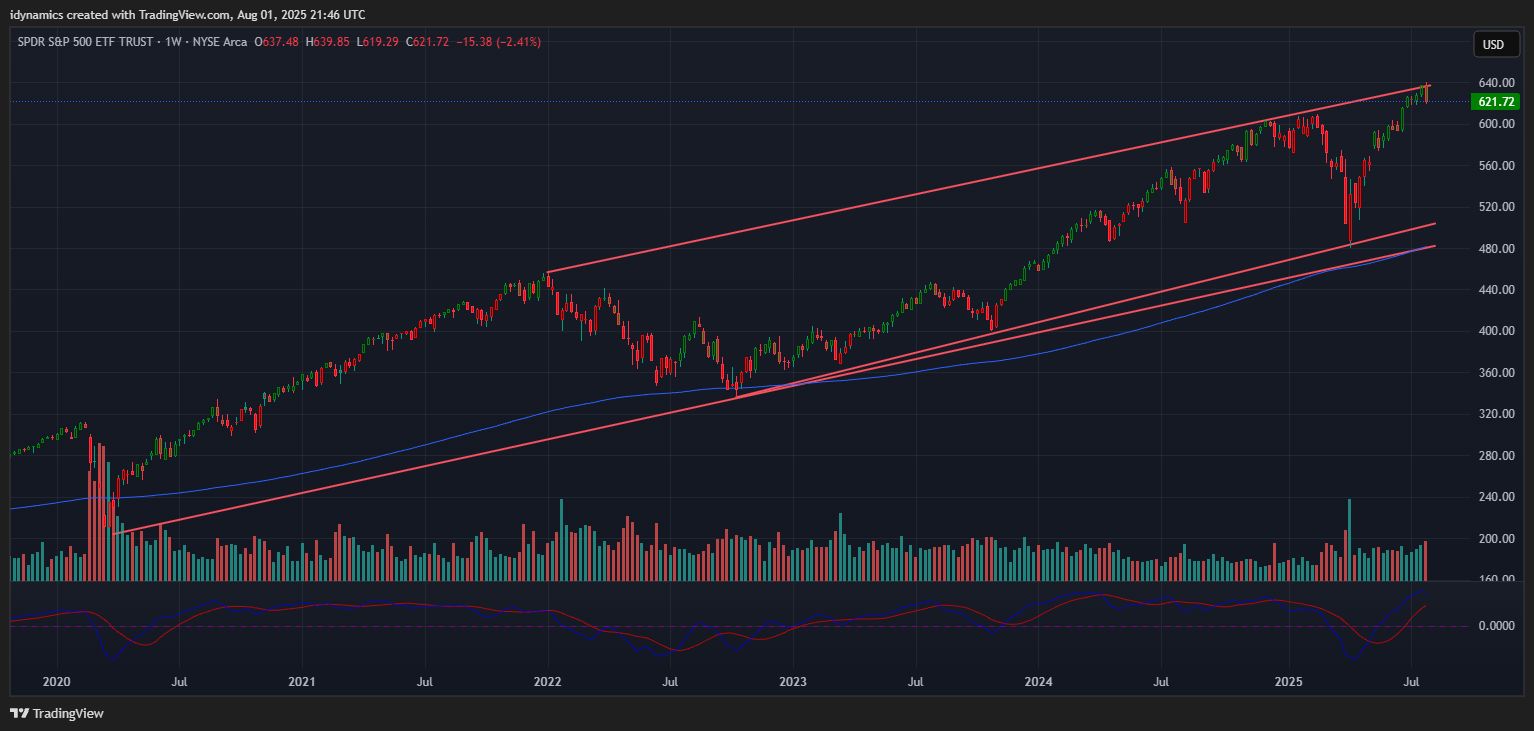
The SPX (Quarterly above) is reacting to a trendline from the 1929 high through the DotCom Bubble highs. Is this another potential intermediate-term level for a seriously overbought market? Time will tell.
Here we are, at the beginning of some major longer-term cycle shifts. Please see the latest Cycle Timing Update for reference. The main thing to note is that we are now in a long window that runs through the entire week of the 11th of August and this month has potential for an exogenous event to occur.
The reality is that we are now entering a 6-9 month window of extremely volatile longer-term cycles. August is when things really heat up with the cycles. The Dog Days of summer are directly ahead. August is a month where there is strong potential for an exogenous event to occur.
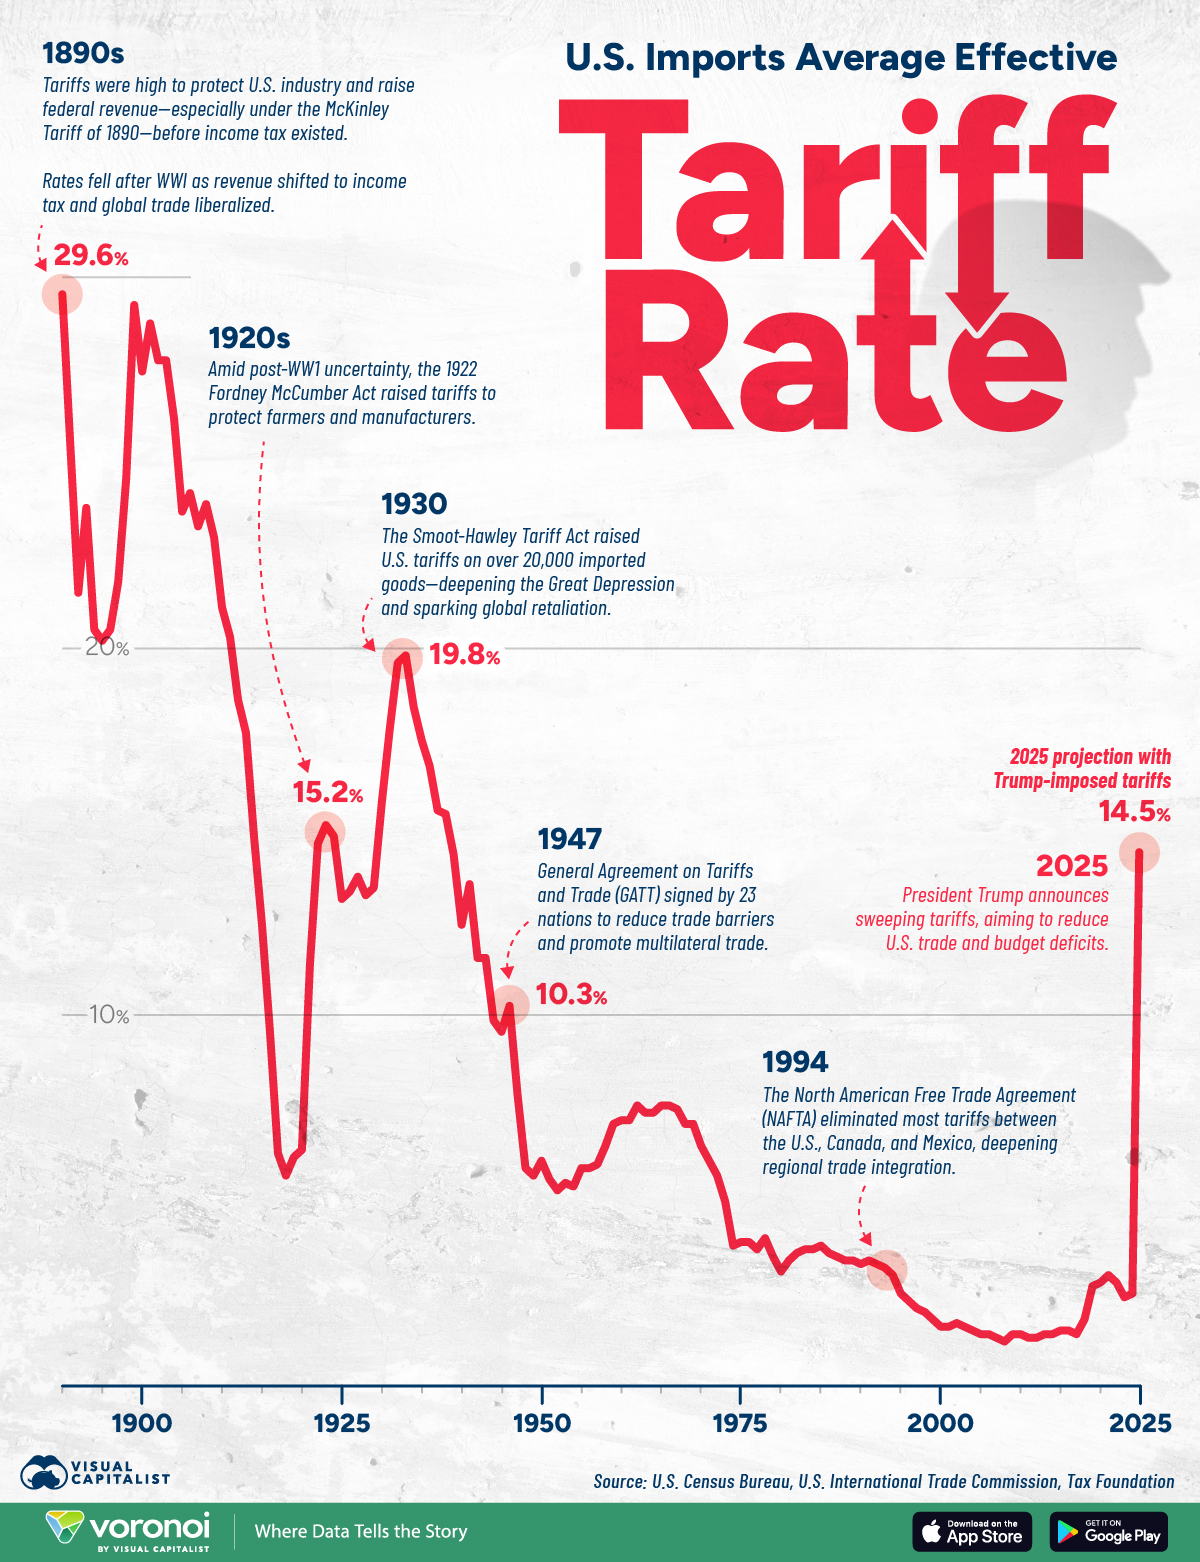
Tariffs are now in the courts, resolution is not expected until September.

 SPX Daily Candles
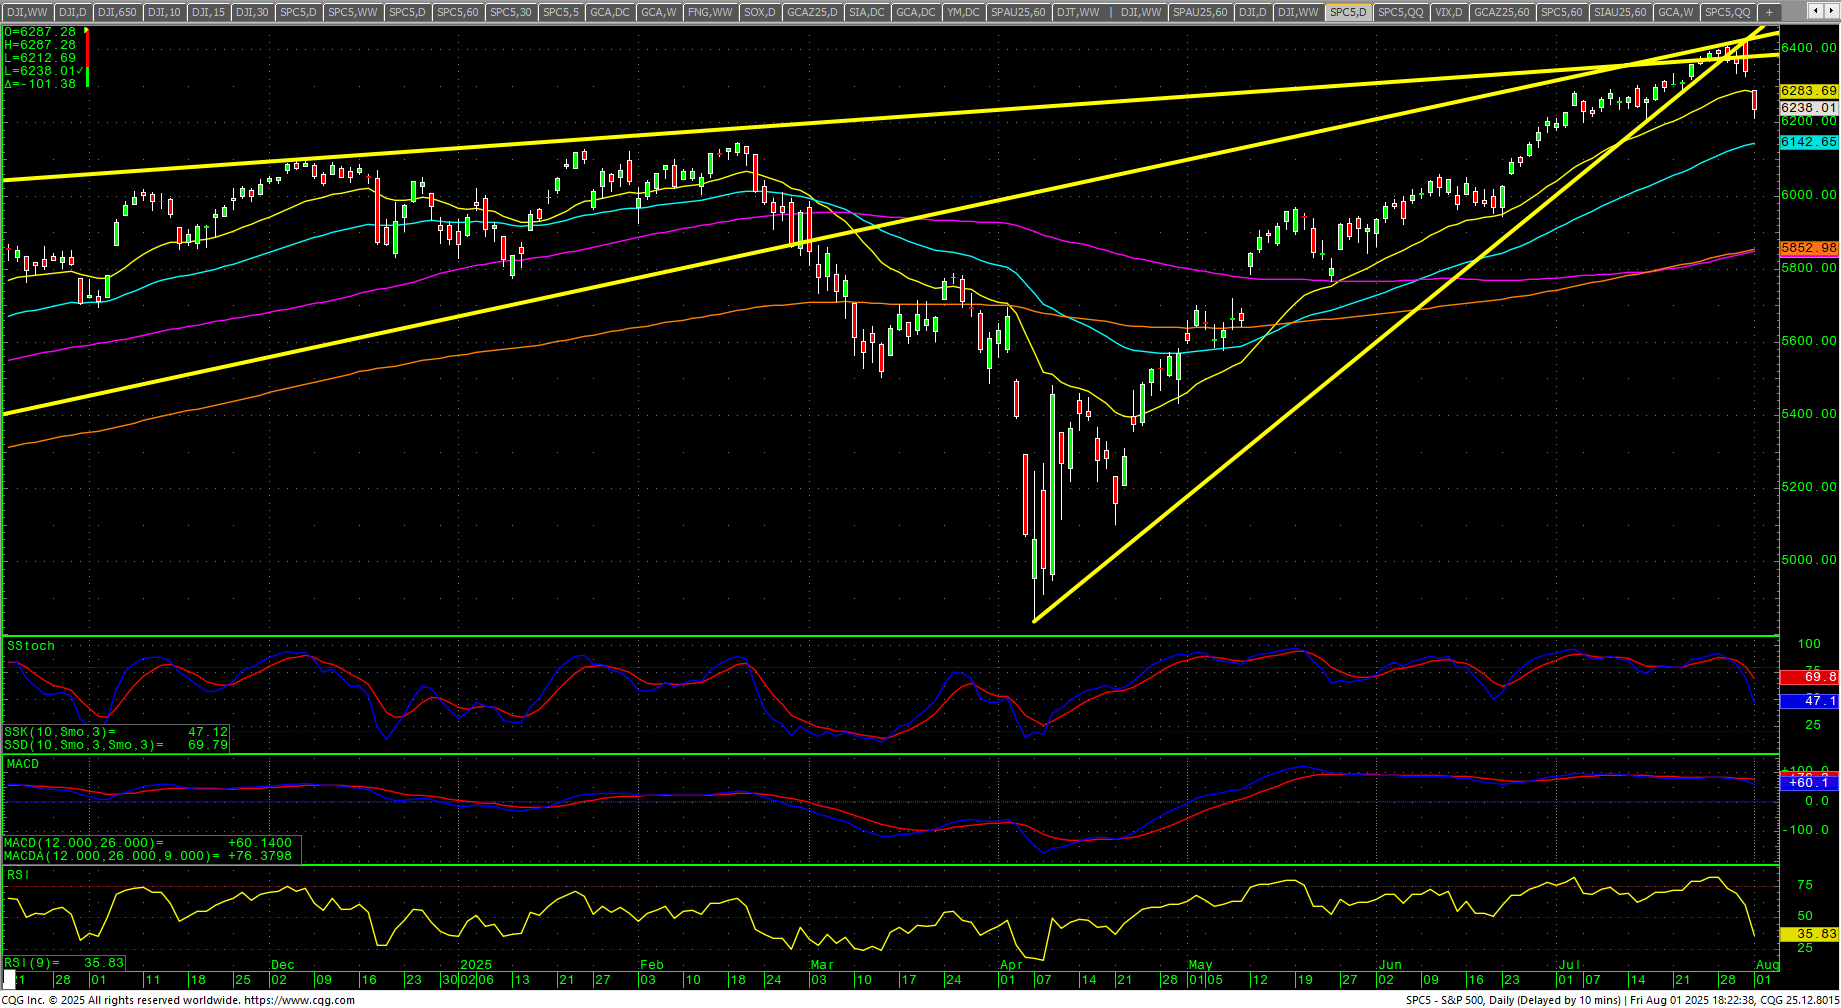 Both the SPX and the NDX inched into record territory above the big overhead trendlines in Thursday’s reversal trade, with the SPX taking out a key call-wall level at 6400 before turning down on the week. Friday’s gap down held the critical 6200 area where there is a double bottom on the hourly.
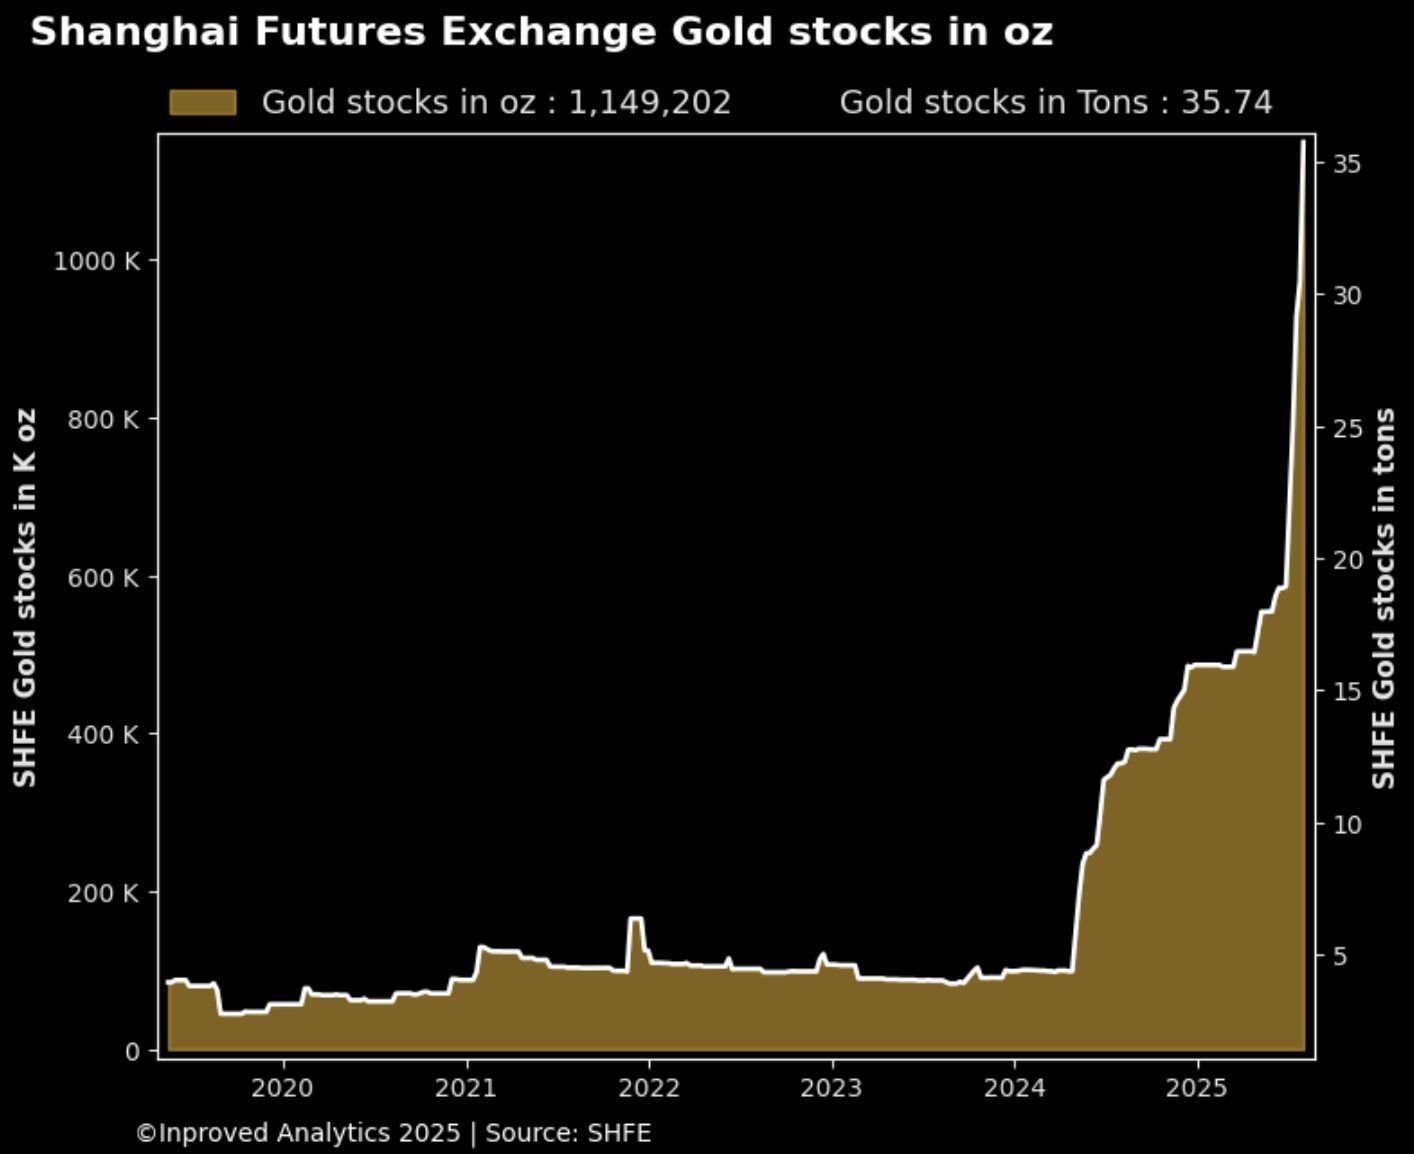
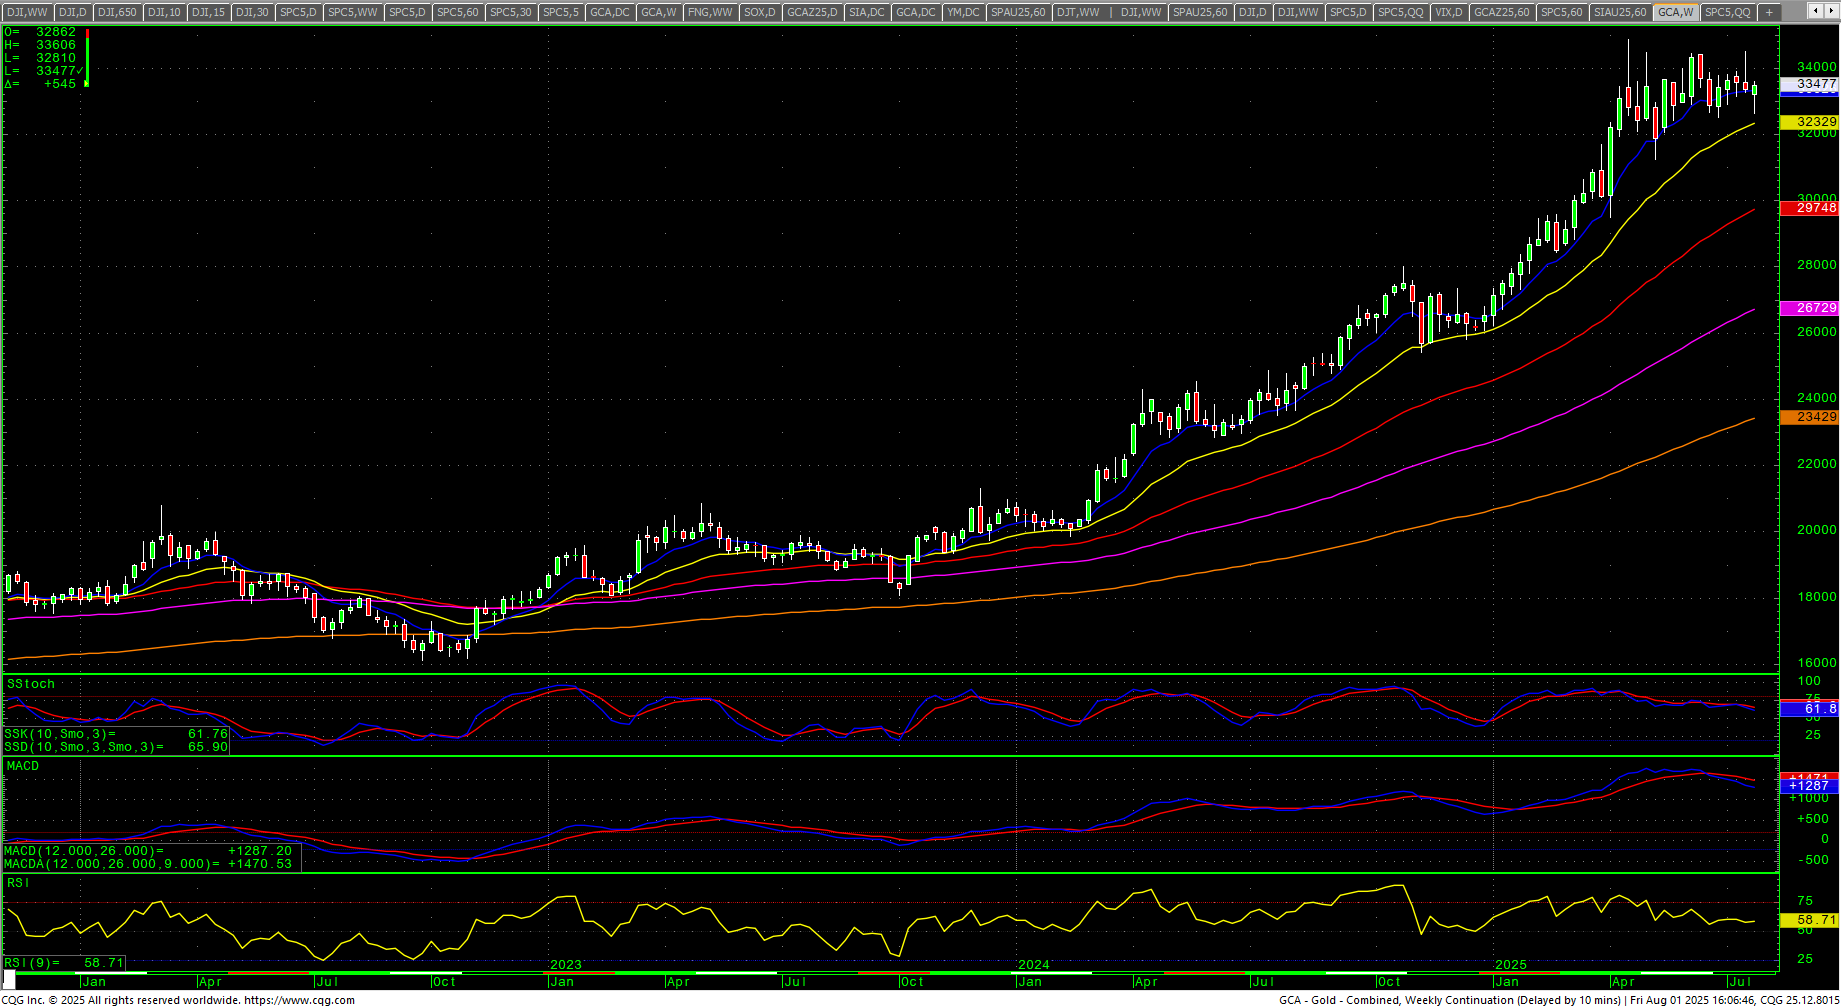
One thing that lends credence to the potential for an exogenous event is the massive buildup of gold inventories by central banks in the past 18 months. Physical gold has become scarce, as well as silver. Deliveries against contracts have the potential to squeeze futures markets. One region where gold has been gobbled up at a meteoric pace is Shanghai. What do they know that the rest of us are about to discover?
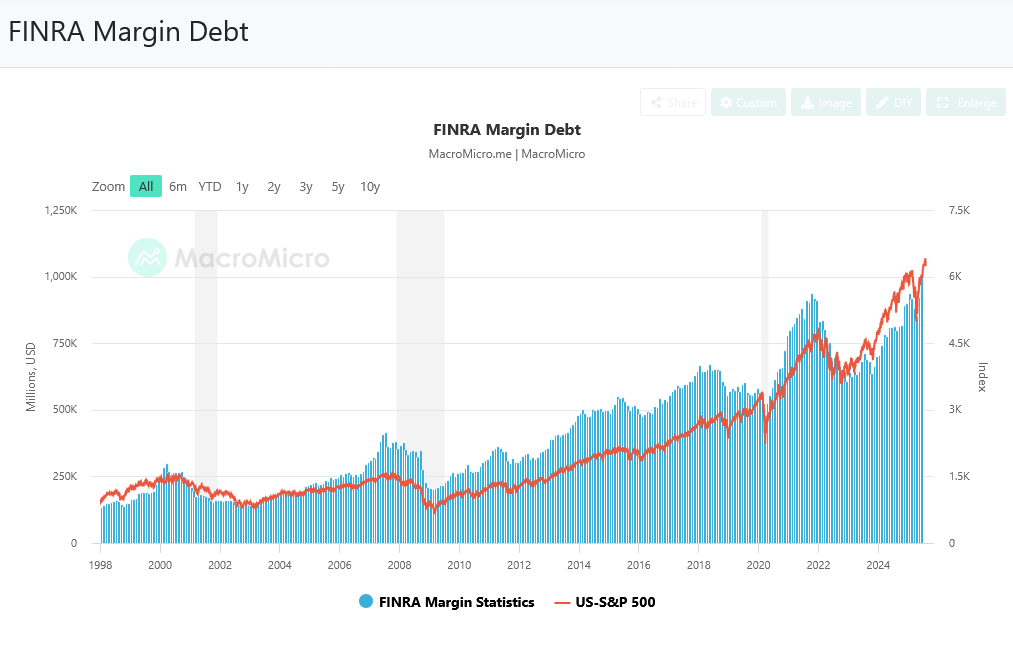
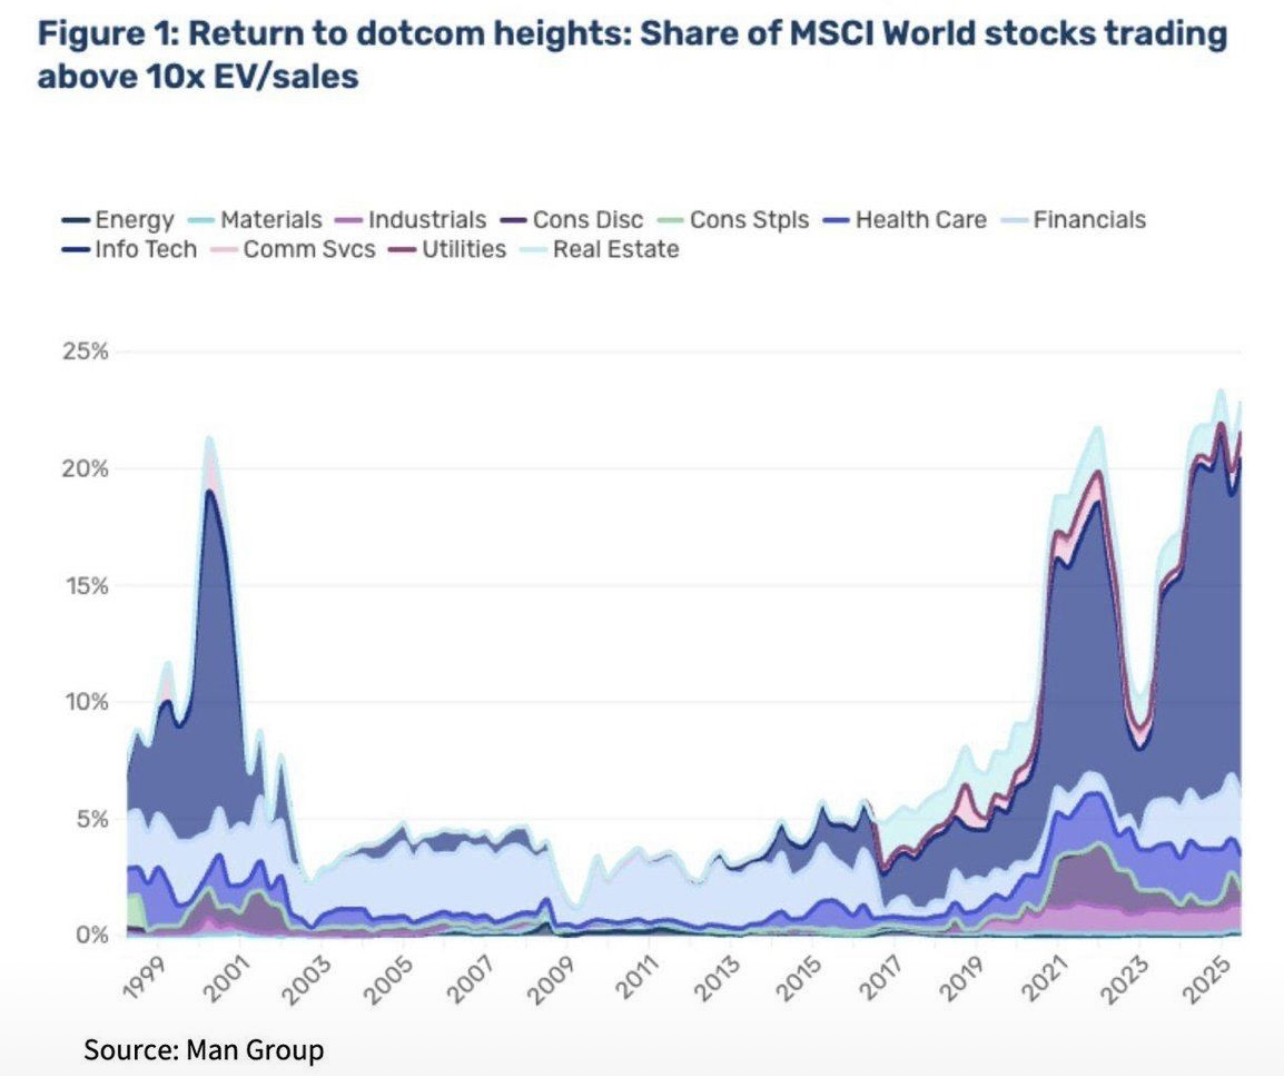
 As mentioned last week, margin debt has hit a record high above $1T. “Margin debt now equals 1.9% of the entire US stock market. That’s the highest ratio since 2007.” Barclay’s Equity Euphoria Indicator has reached a record high. MSCI stocks that are trading above 10X EV/Sales have eclipsed levels last seen at the DotCom Bubble. That said, the late week selloff shaved some of the froth off the sentiment indicators (see below).

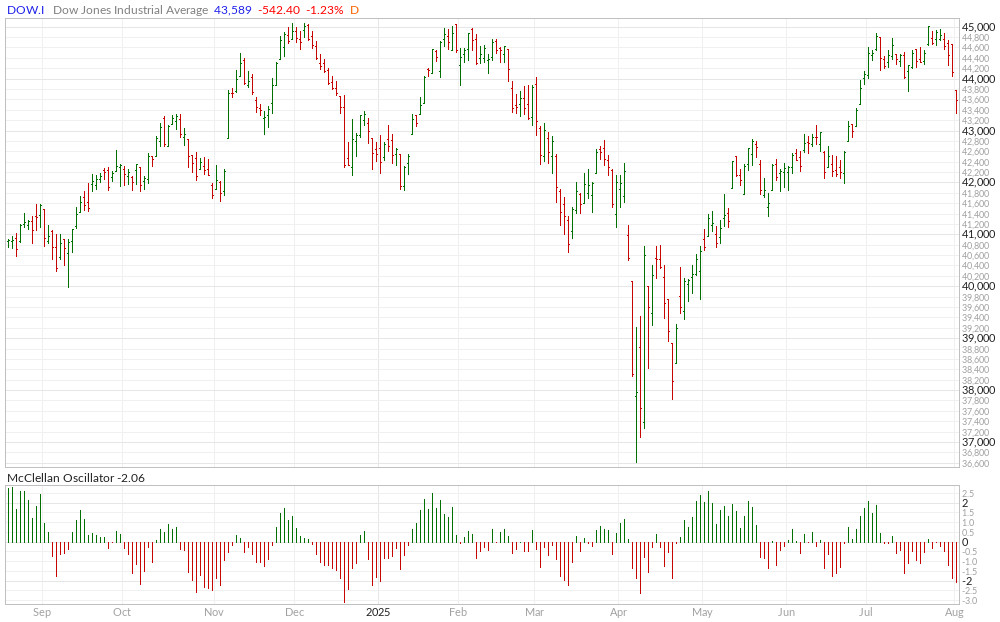
 Dow Theory
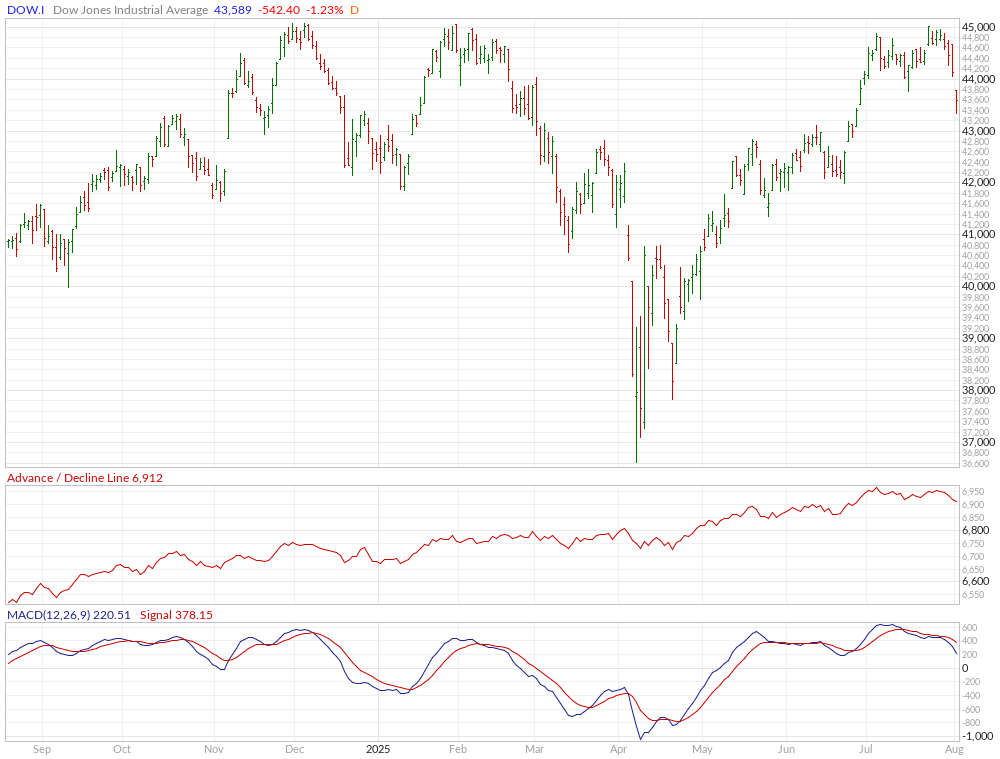
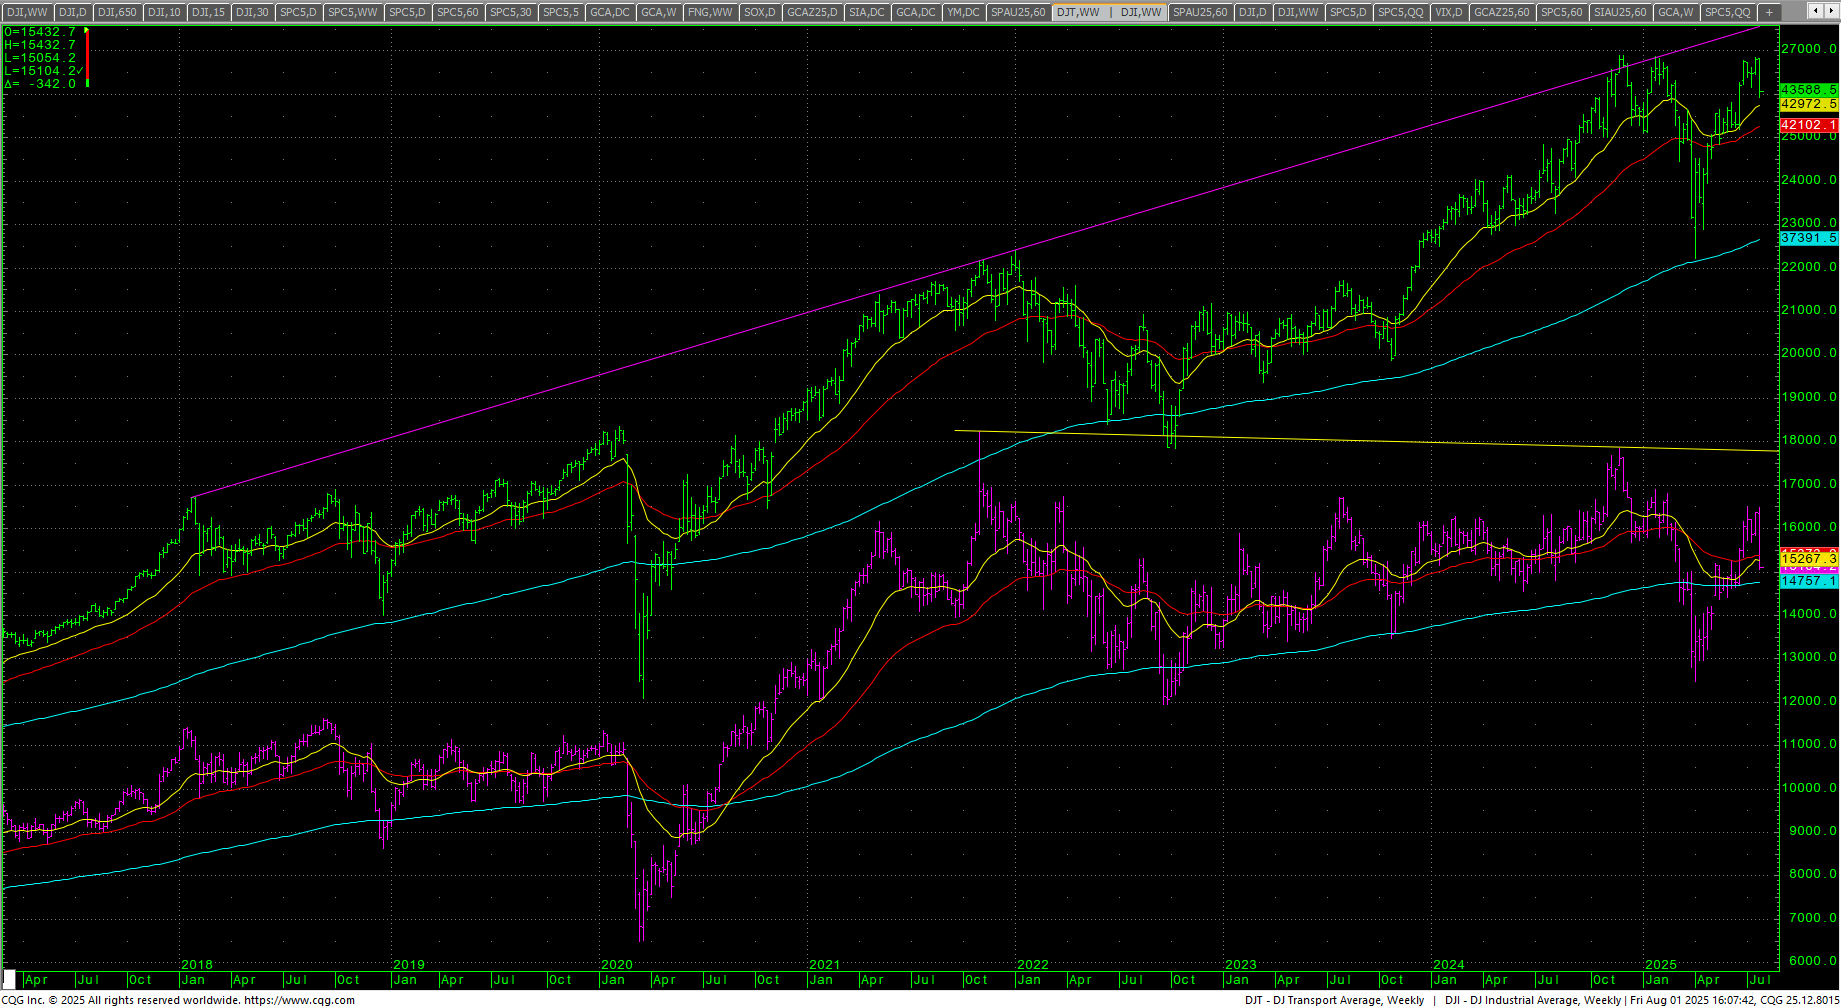 Dow Theory has yet to validate the new highs in the stock market…giving a preliminary bearish divergence.
Buffet Indicator
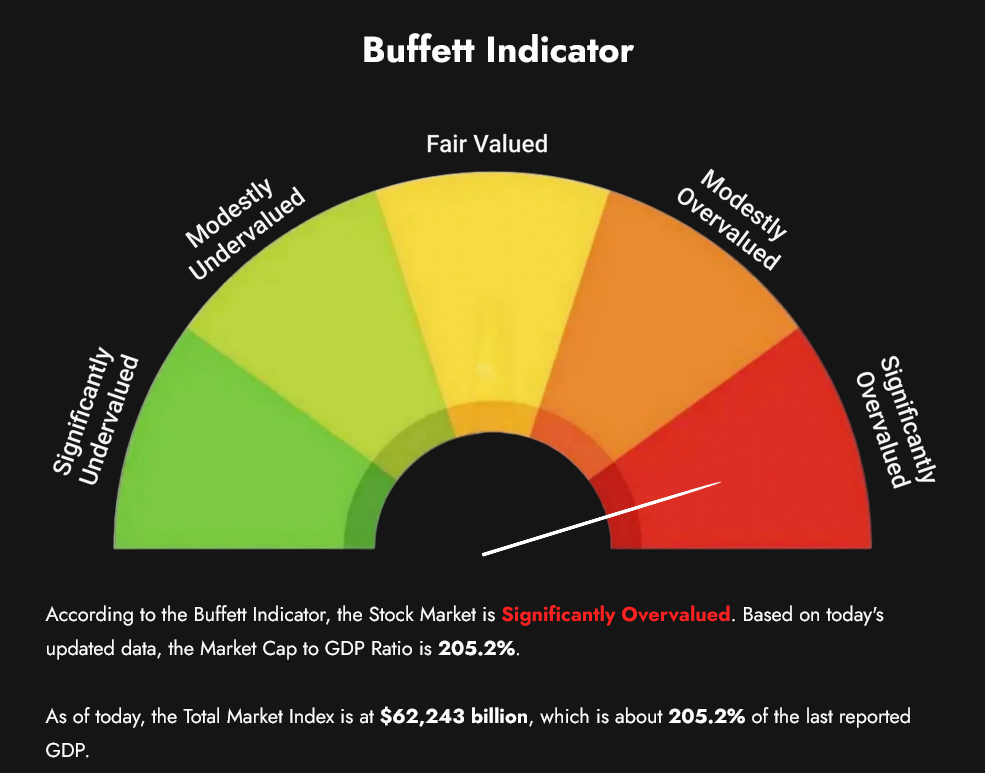 The Buffet Indicator backed off slightly from its recent ATH but still sits at +205.2%.
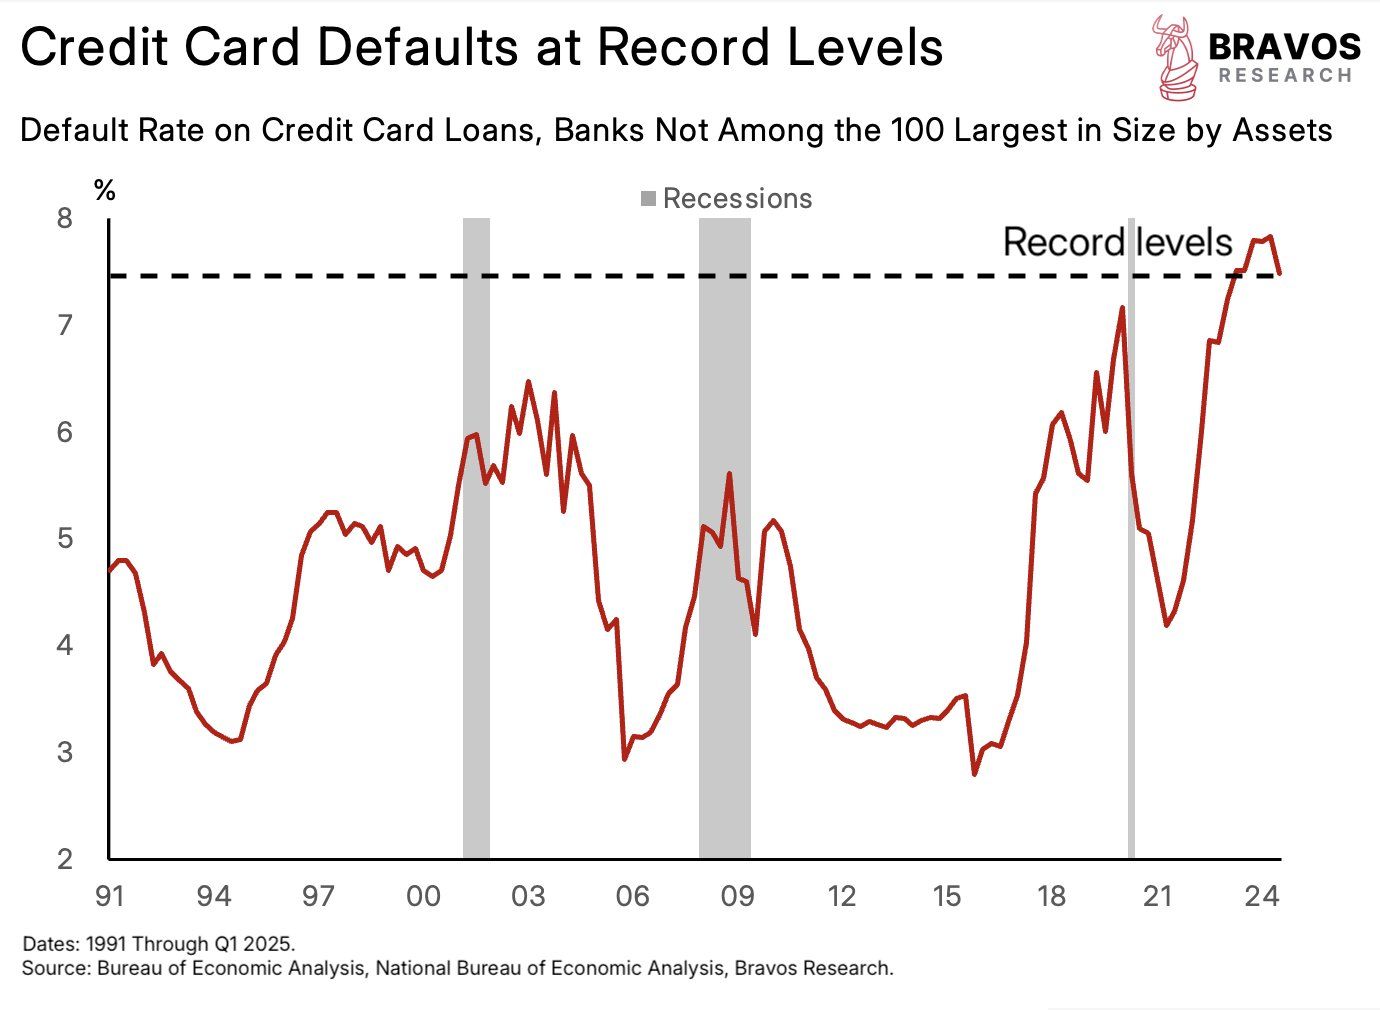 Consumers are heavily invested in top tech stocks while credit defaults sit at record highs.
S&P 500 Stocks Above the 200-day MA
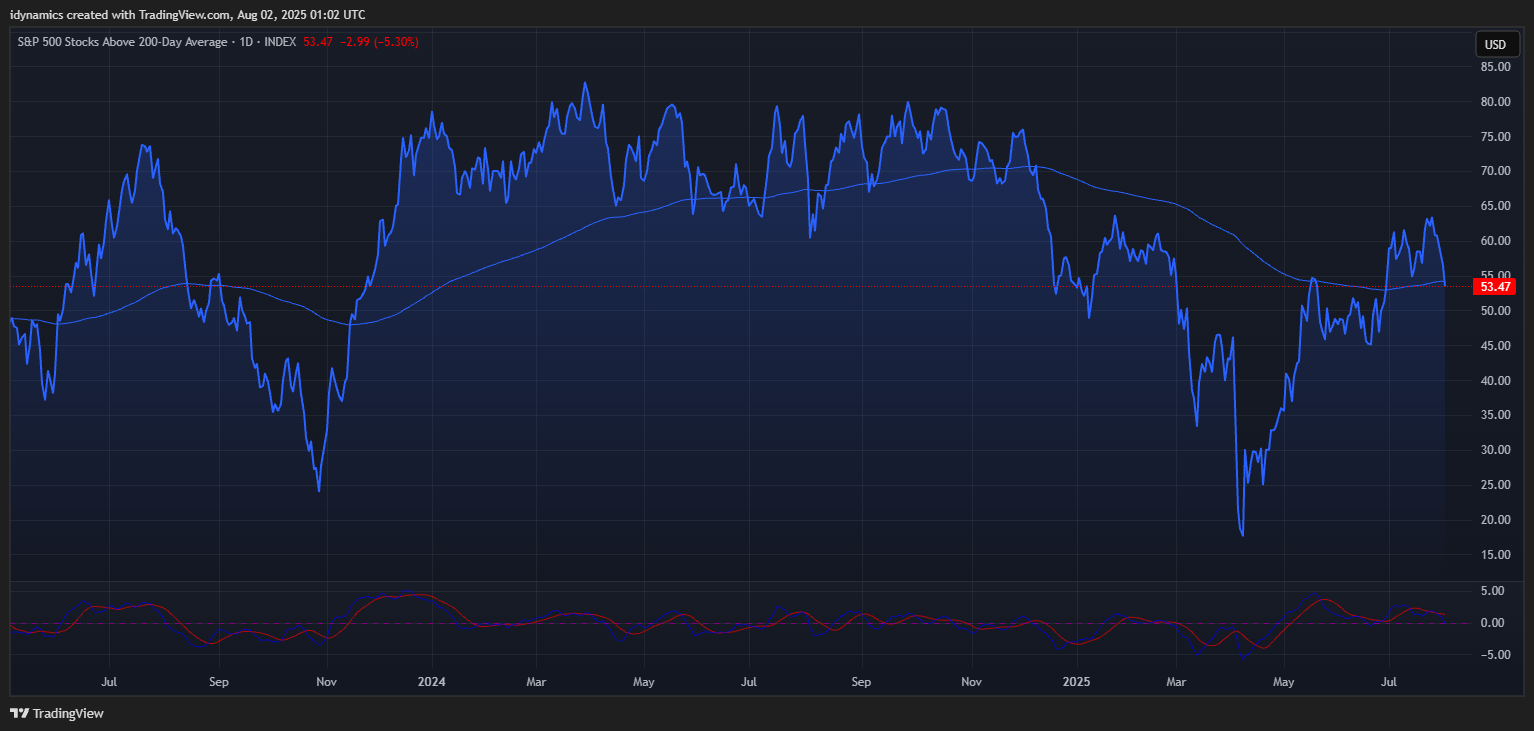 Breadth came unglued Friday and the number of SPX stocks above their 200-day MA closed out the week down -15.58% at 53.47%. It tested the 2025 high of 63.61% on 27 January 2025 and hit 72.92% in September 2024 and 82.70% in March of 2024. Divergence is the name of the game. Given that only 10 stocks now make up 40% of the SPX, this is not unexpected.
MAGS (Magnificent 7) Weekly Candles
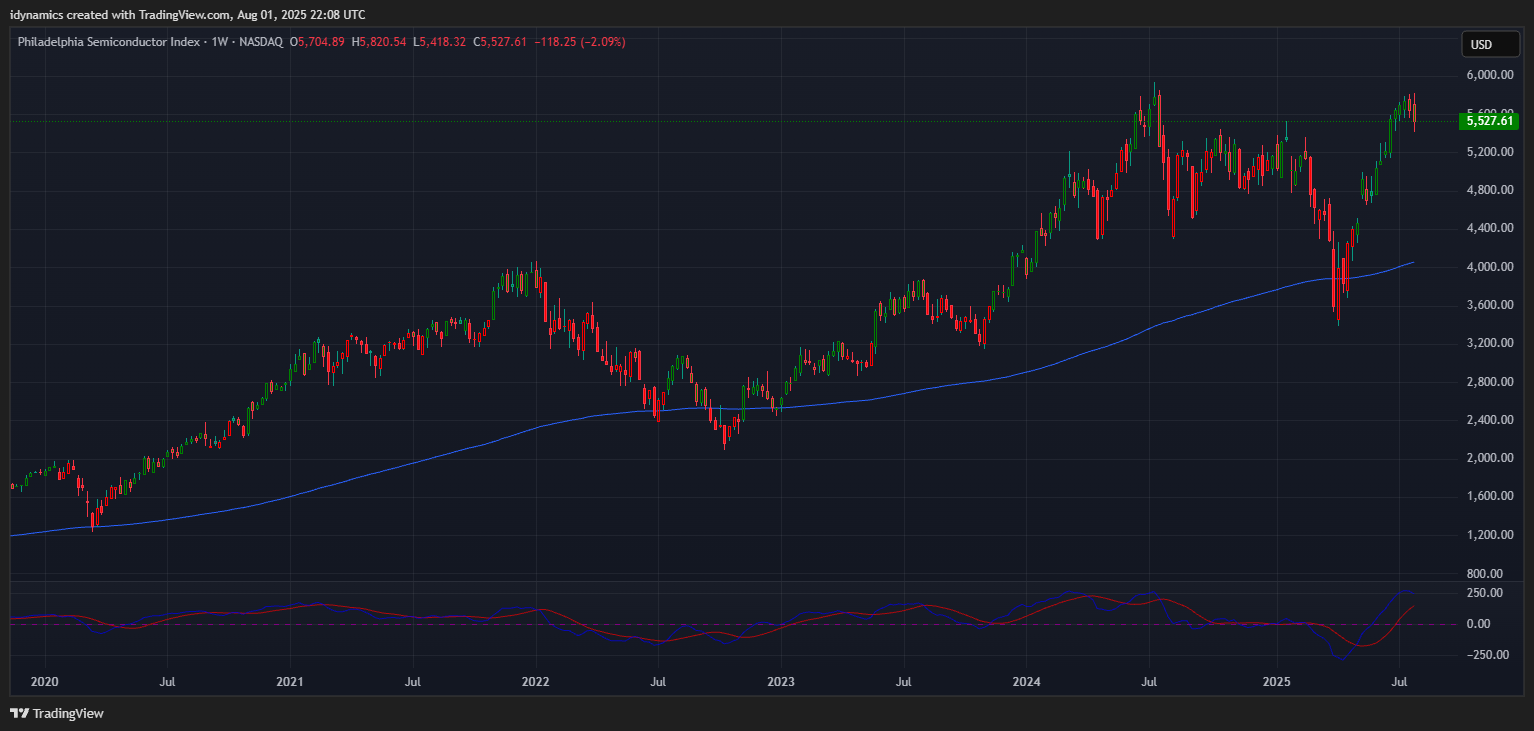
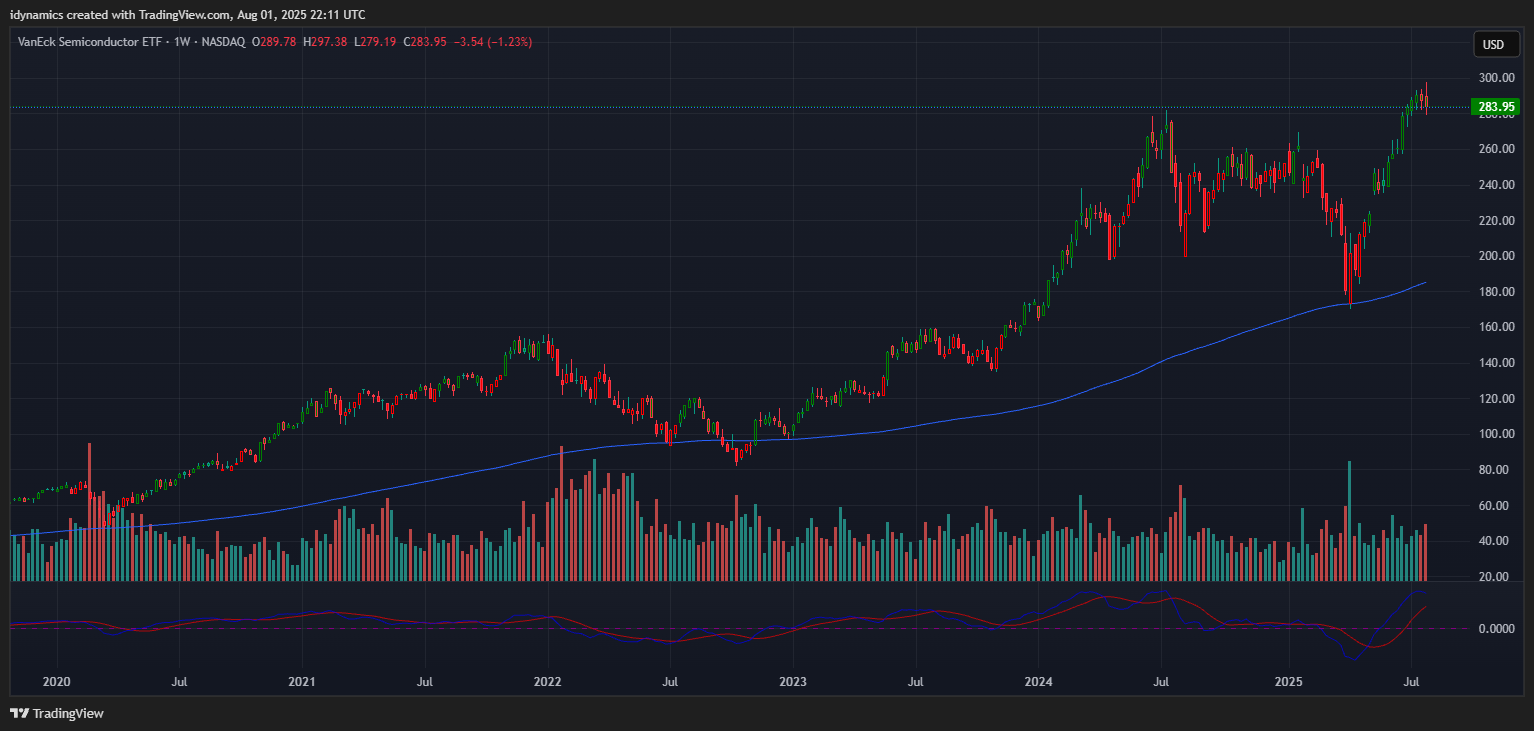
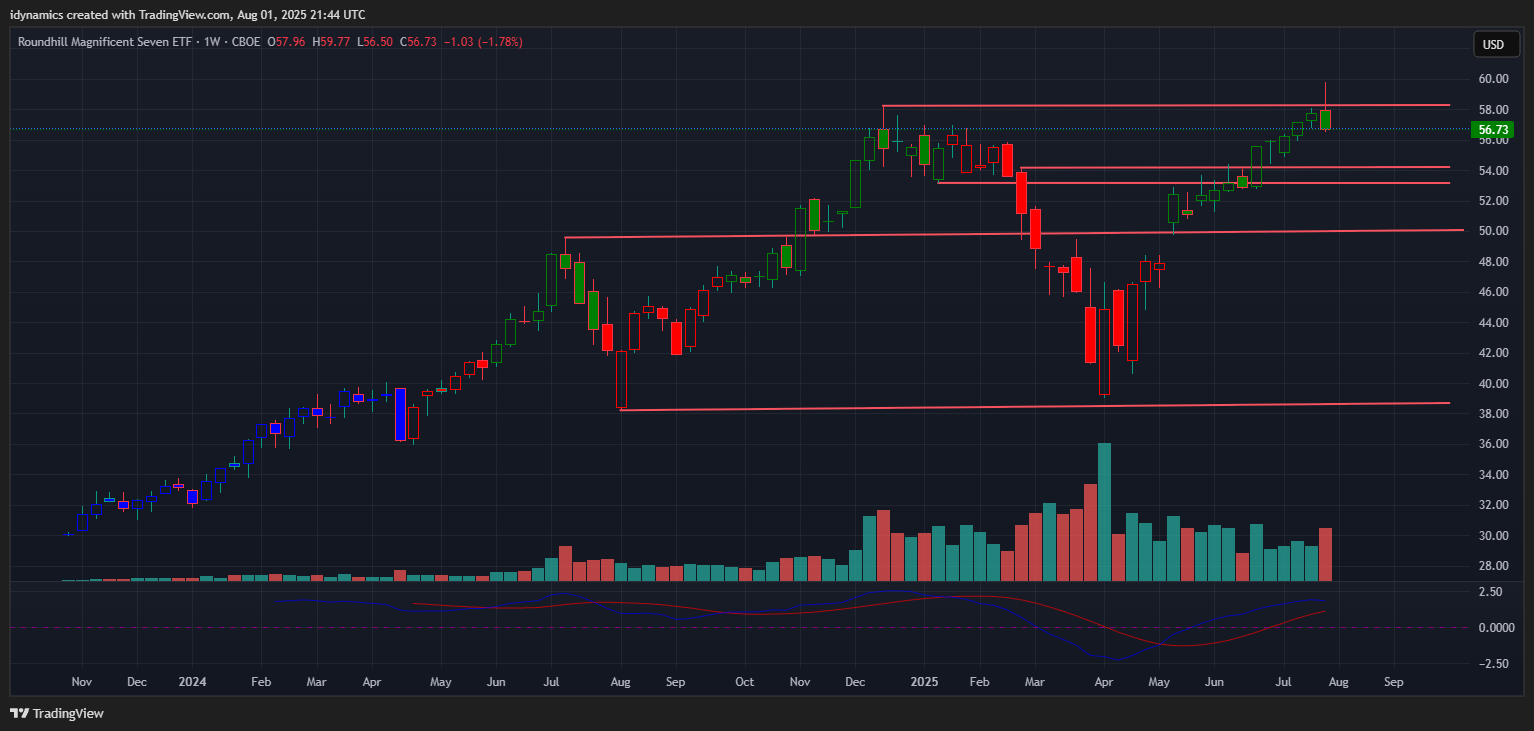 The MAGS gapped into record highs on Thursday and then left an island top on the daily chart as it dropped back under the 58.34 level. Resistance remains critical at the ATH of 58.34. Closes over the 58 should retest the current intraday high of 59.77/60. The market should still see support against the 54.16/53.14. MAGS closed the week down -1.78% on the bottom of an outside week’s range. Both the SOX and SMH also saw outside weeks down and closed on their lows after setting record highs intraweek.
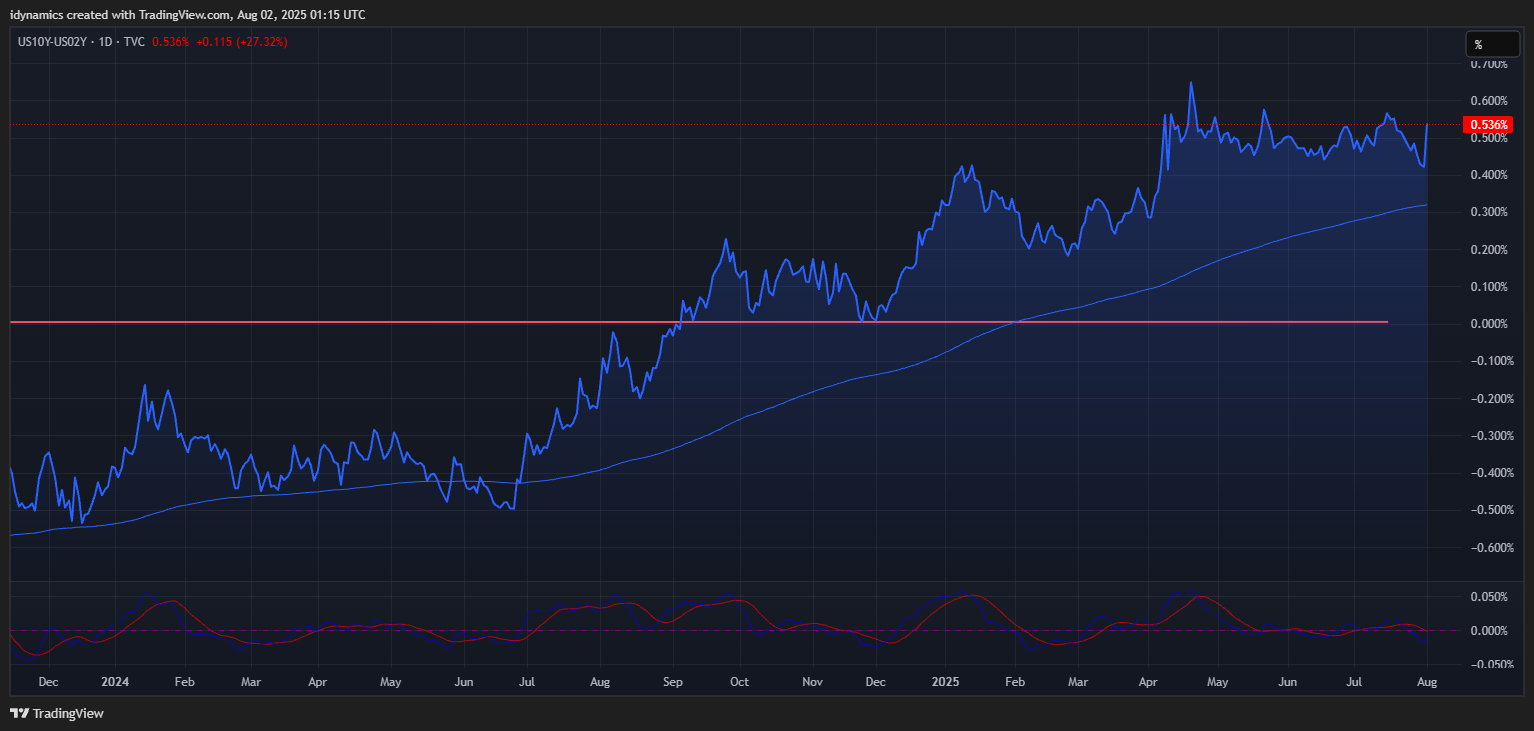
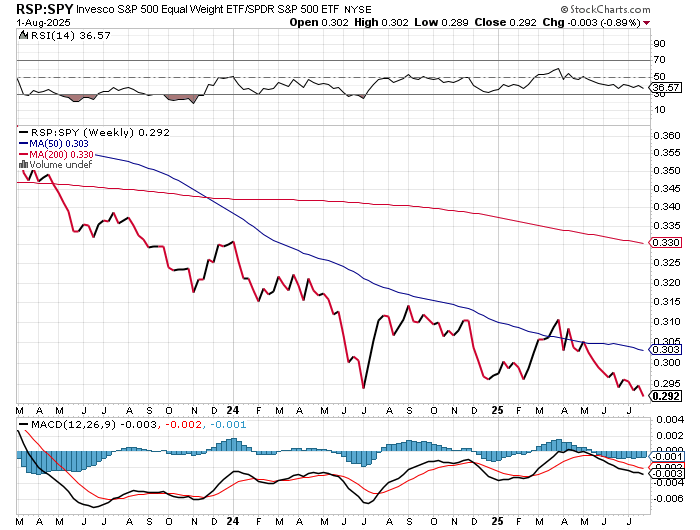
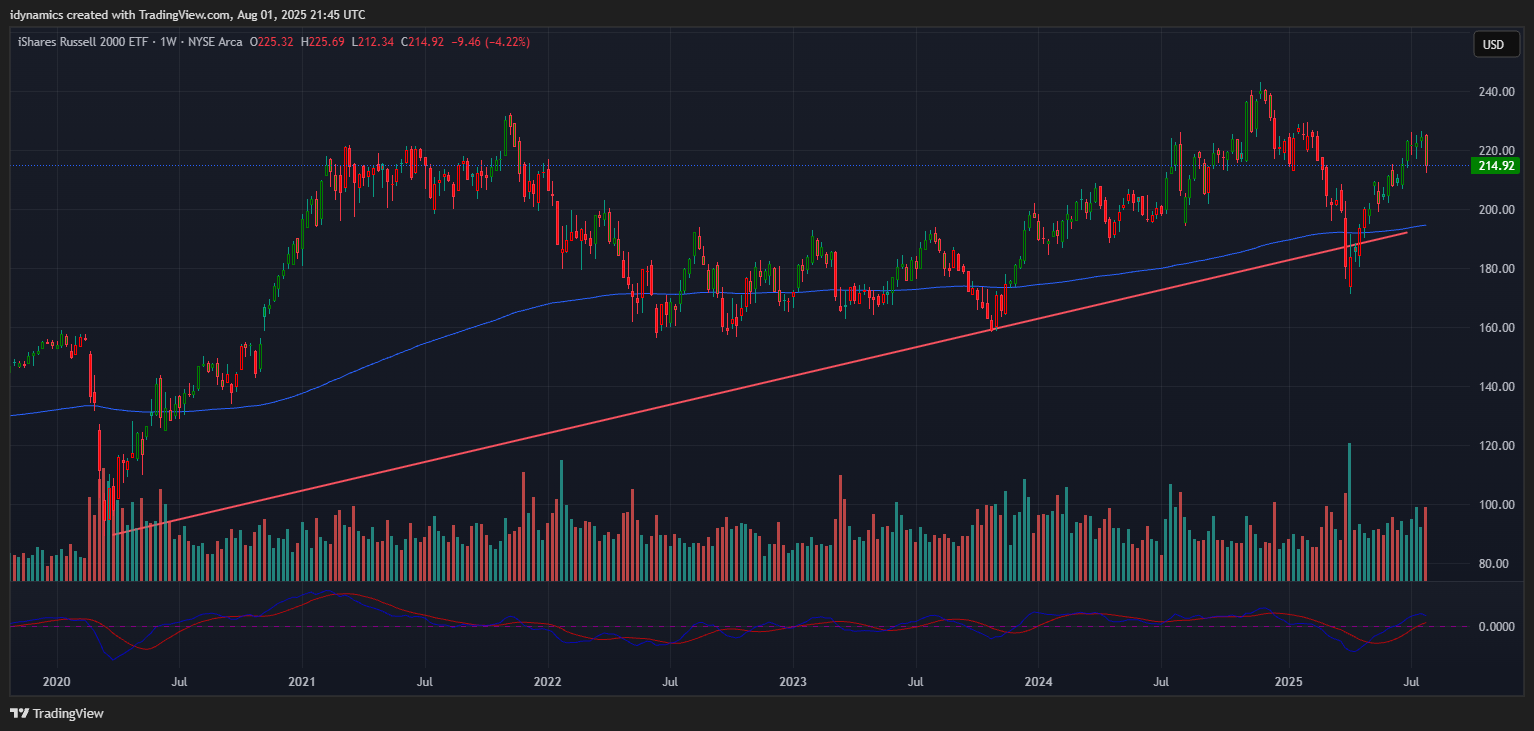
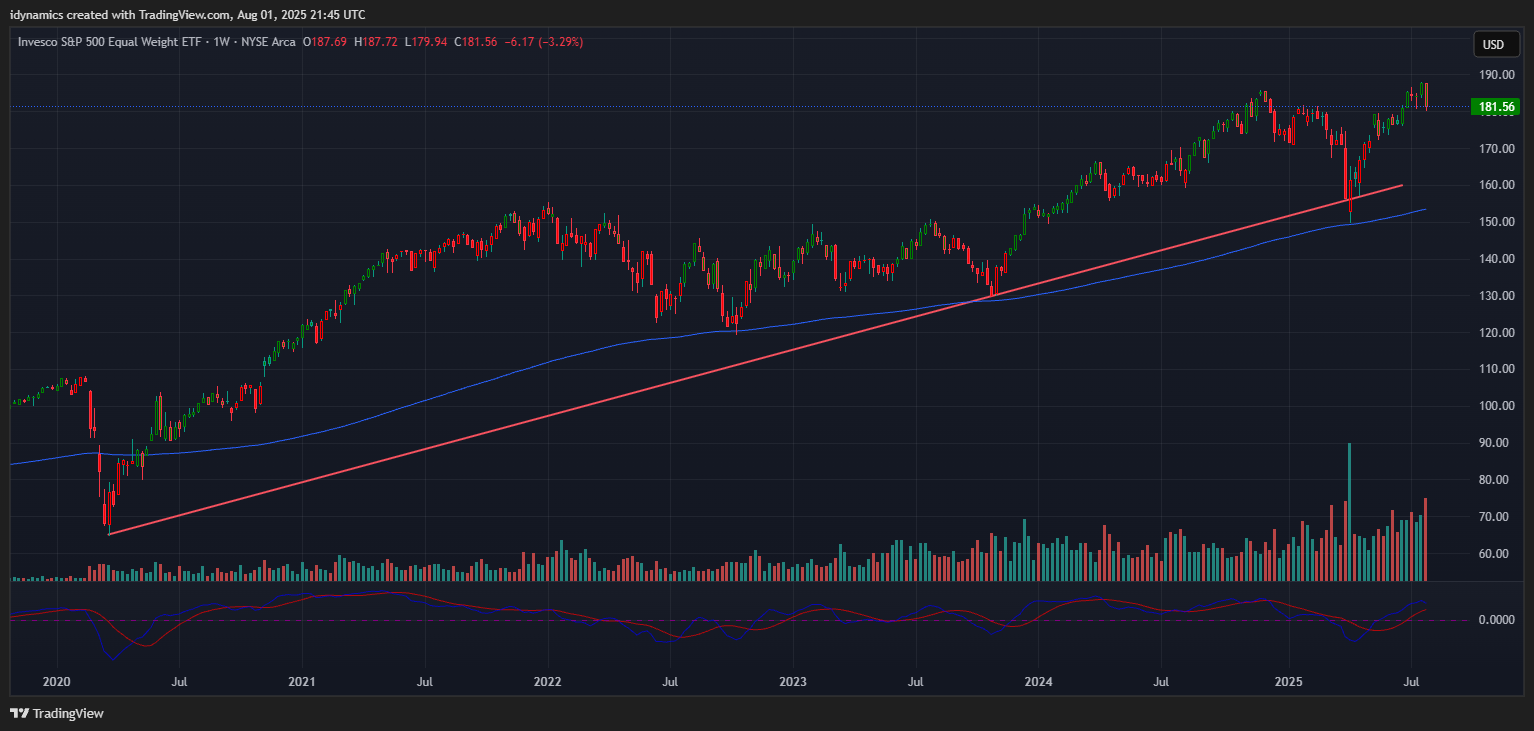
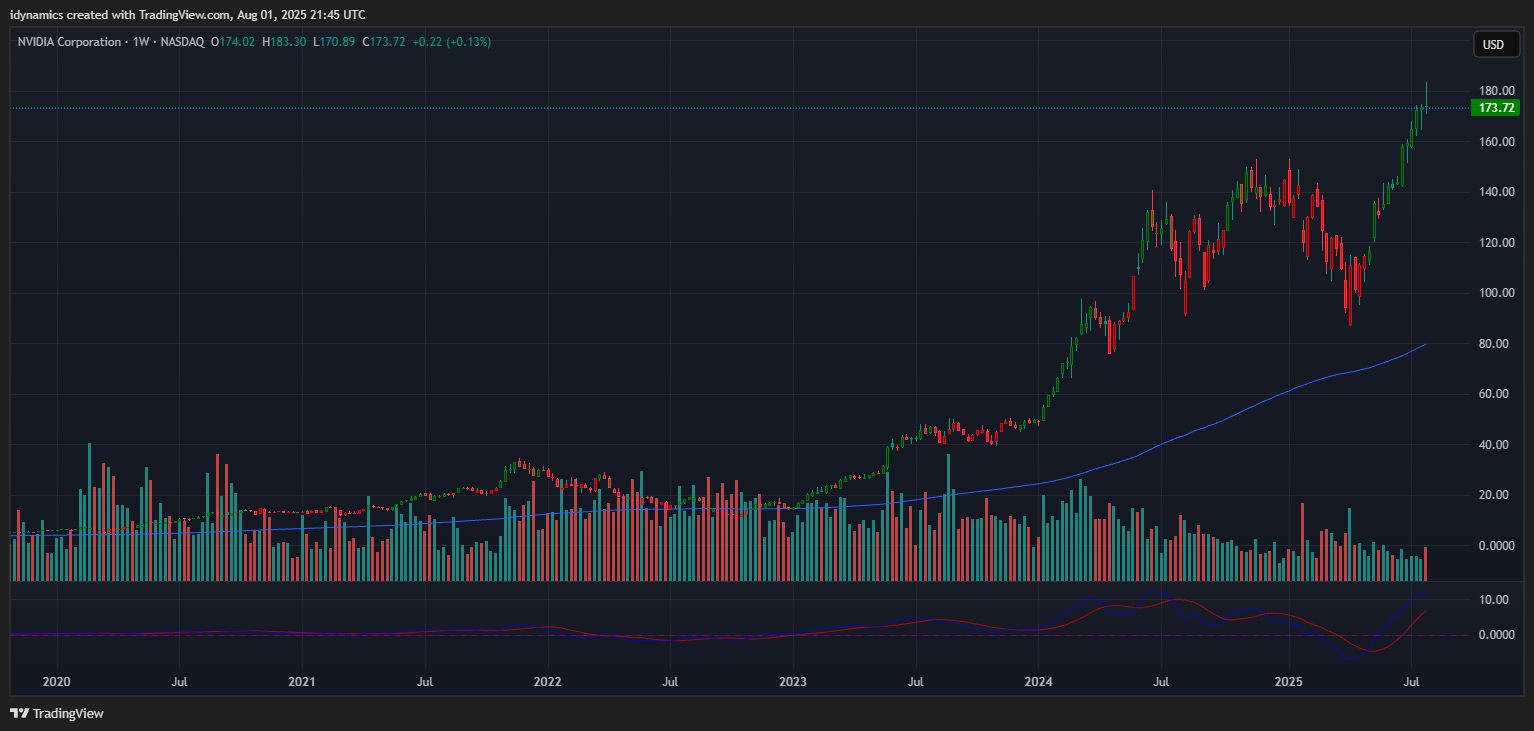
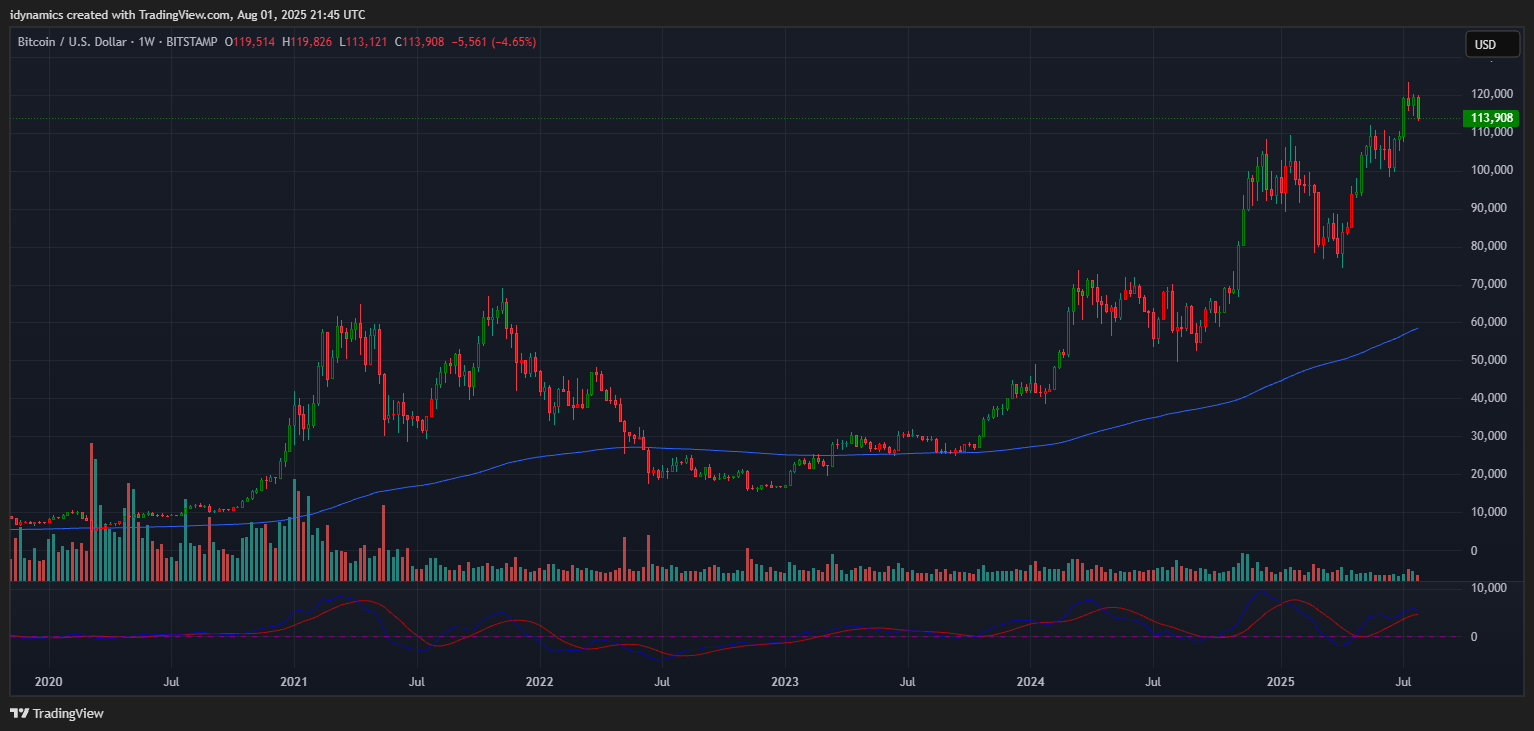
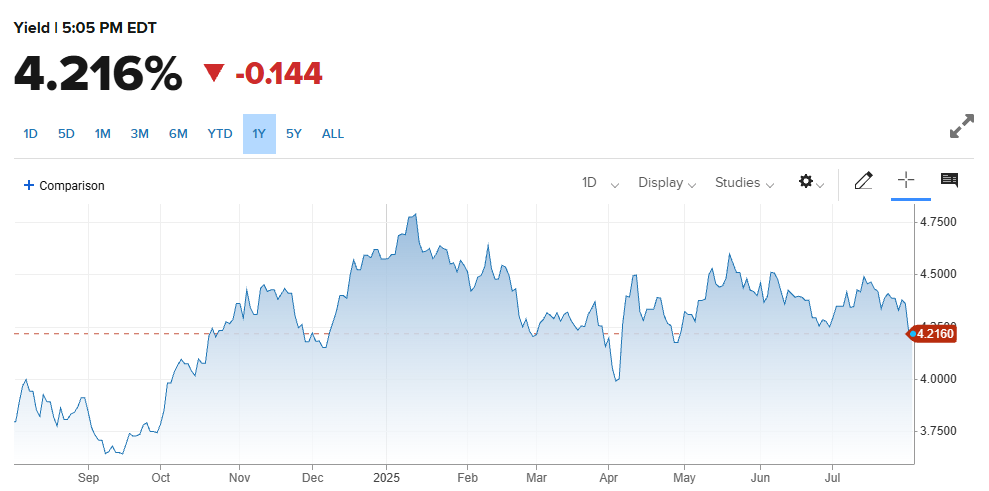
The RSP:SPY moved to yet another new low last week. The spread chart remains extremely weak. The weekly is trending lower in an oversold position and the MACD is turning back down. The IWM plunged sharply, closing down -4.22% on the bottom of the range. The RSP was down -3.29% on the bottom of the weekly range. NVDA closed up +0.13% after setting another ATH above the psychological level of 180 (intraday high 183.30). Volume increased on the selloff. Bitcoin dropped -4.84% on the week and closed on the lows. Support is 110/108. McClellan Oscillators are confirming the weakness in the Dow. The Yield Curve expanded sharply as yields plunged on the employment news, closing at +0.536%. The 10YR yield plunged, closing at 4.216%. Truflation plunged to 1.67%.
10YR-2YR Yield Curve Daily

 VIX Weekly Candles
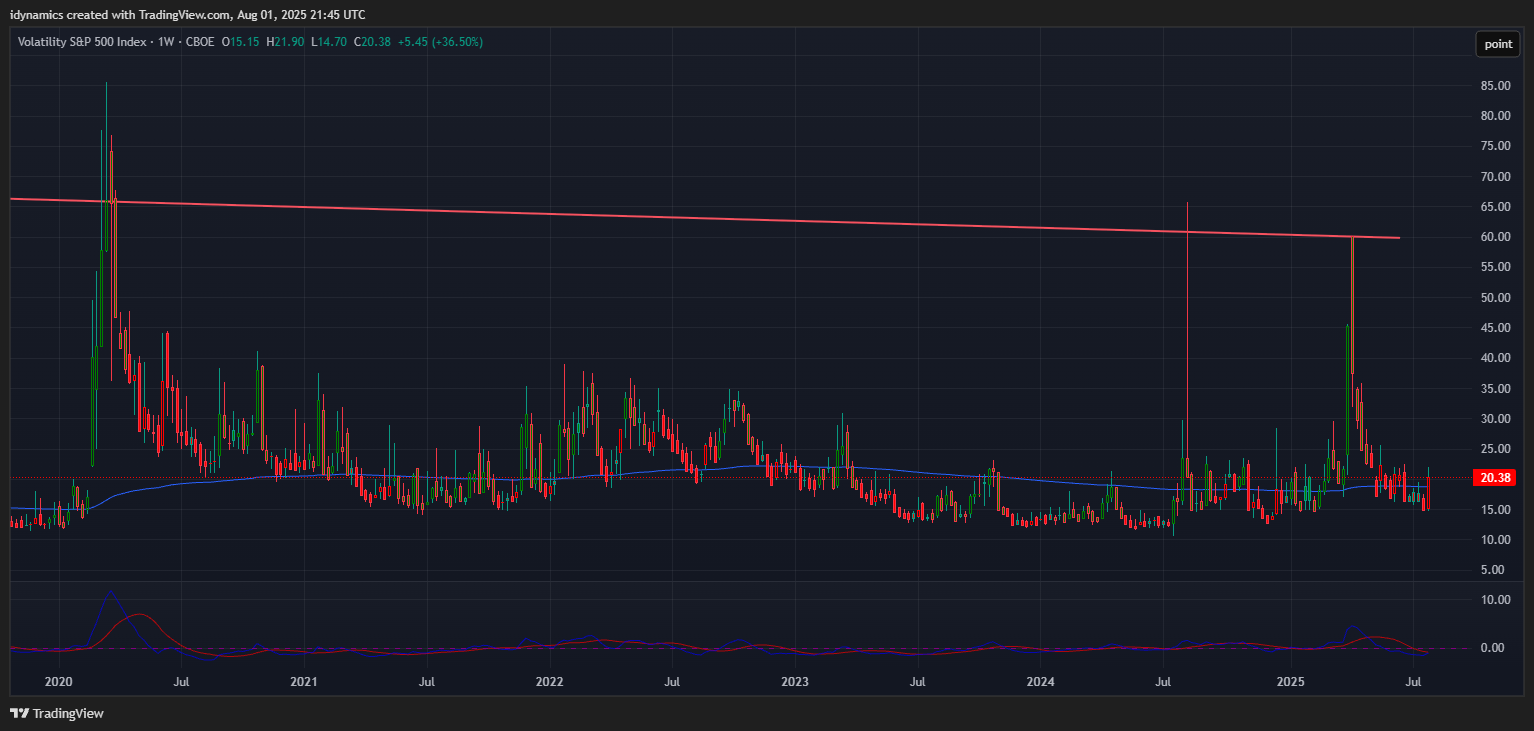
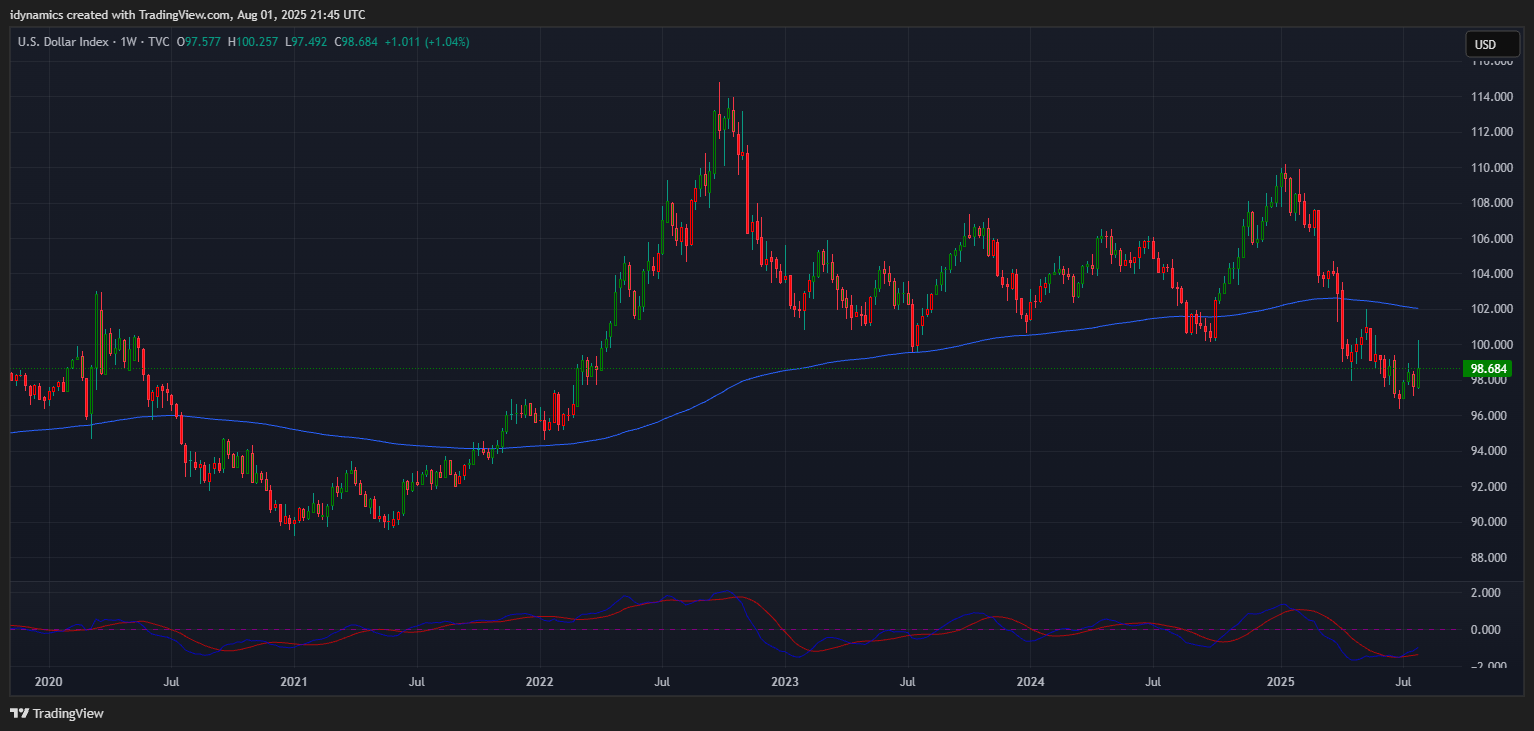
The VIX jumped back over the 20 level, up +36.50% closing in the top end of the range. The US Dollar rallied sharply intraweek, trading above par before selling off late to close up +1.04% in the middle of the weekly range.
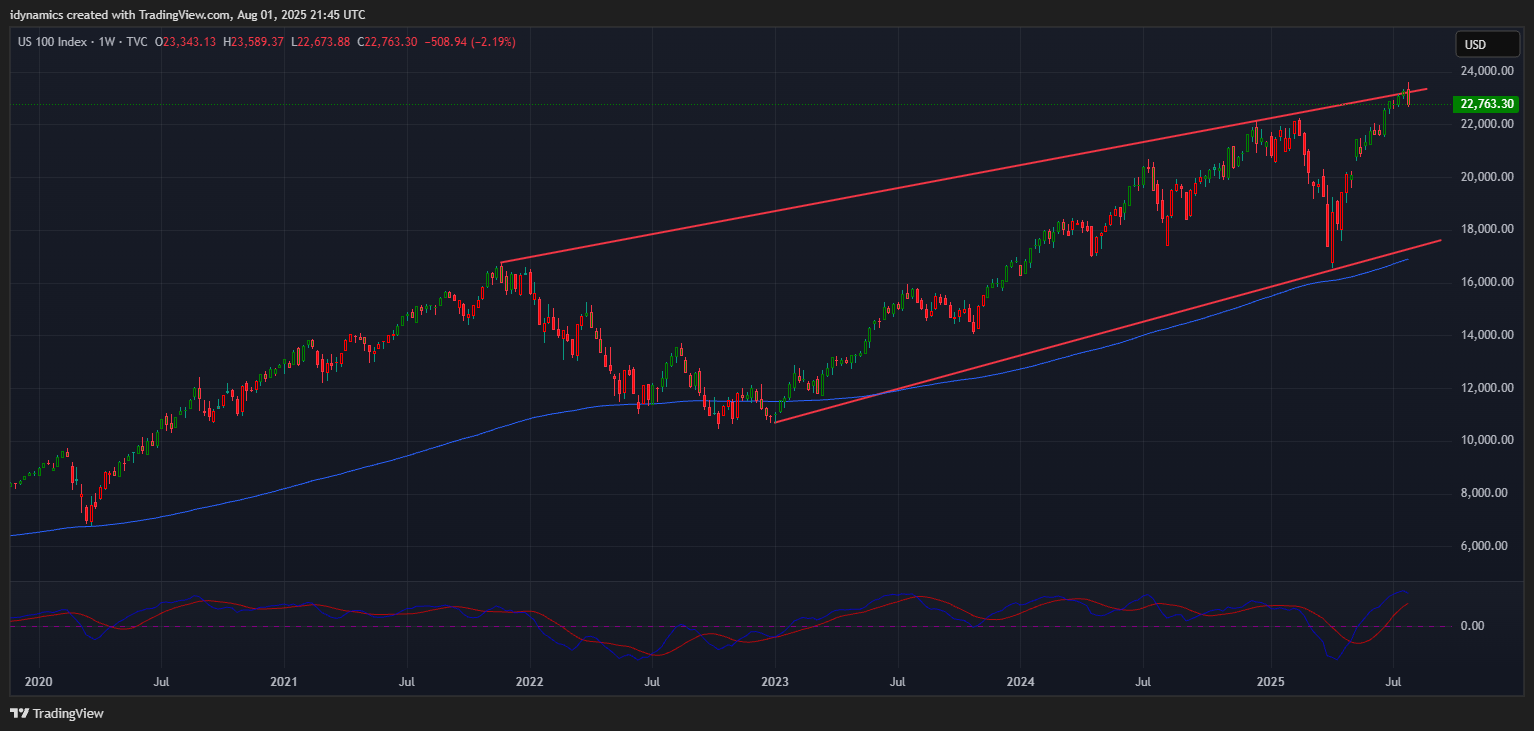
 Nasdaq 100 Weekly Candles
Daily Breadth 
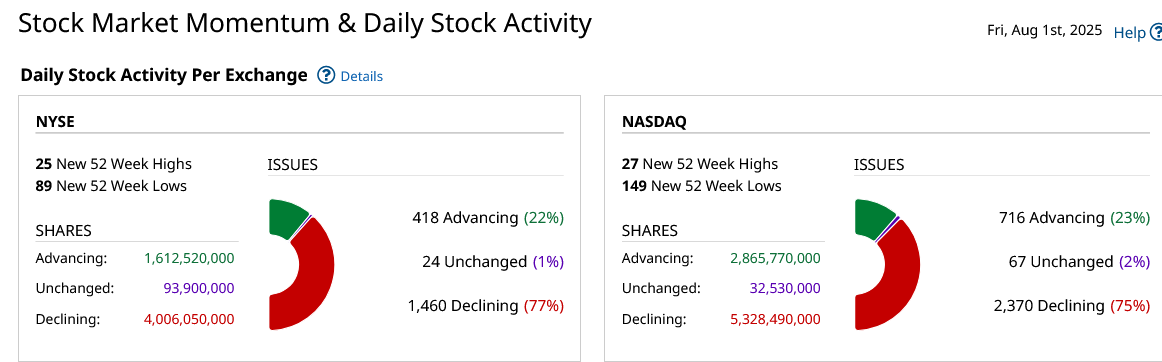
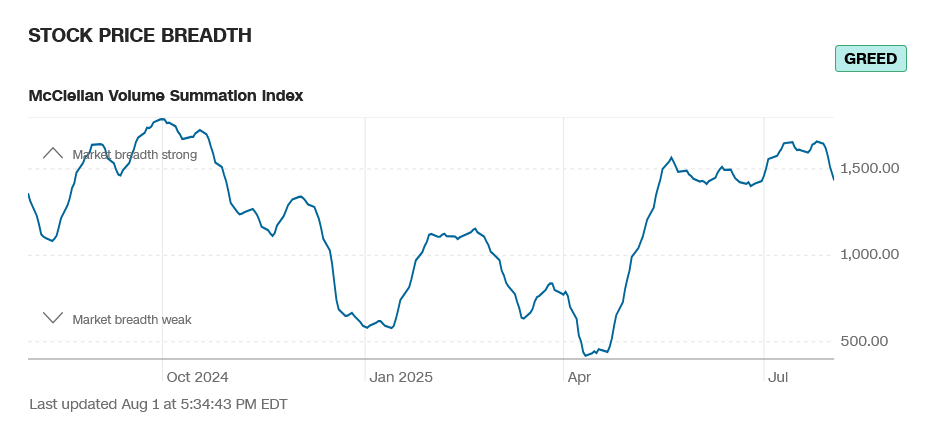
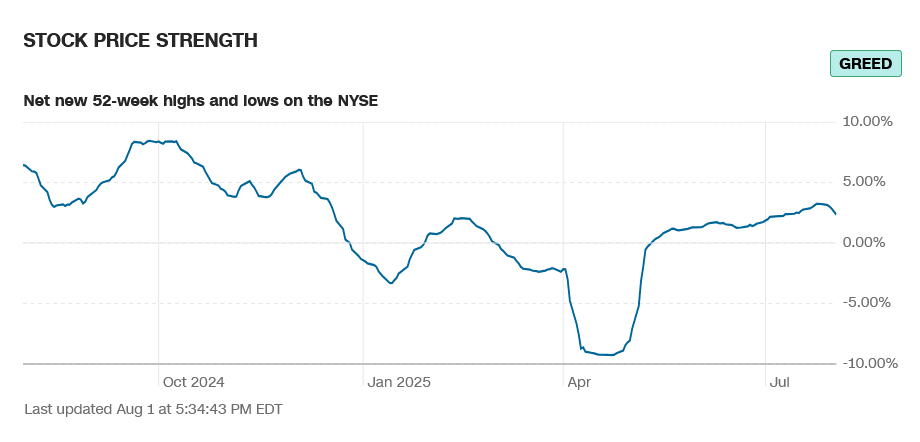
Breadth was hit hard in Friday’s selloff and declined for the week. Sentiment moved to greed.
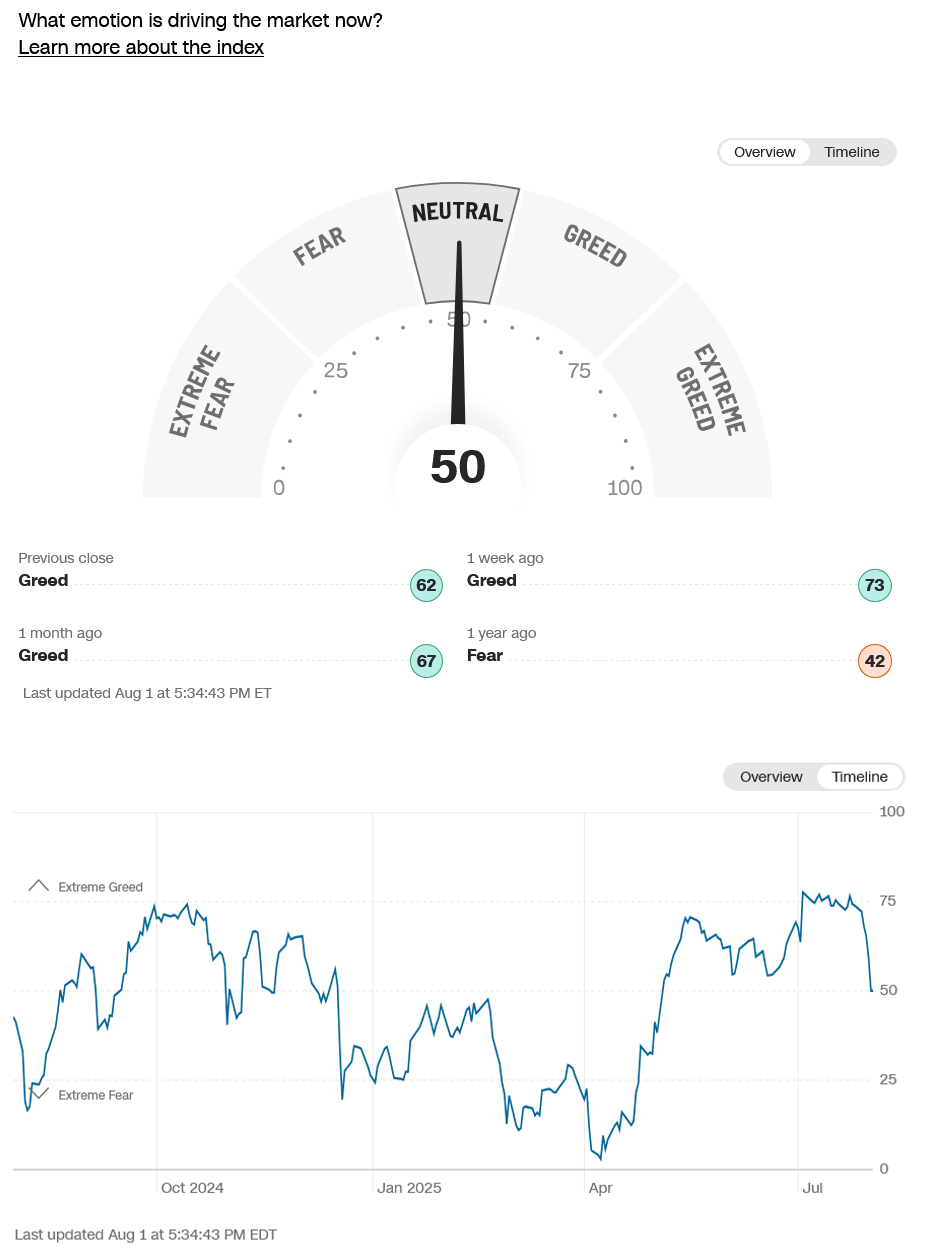
CNN Fear & Greed Index
 AAII Investor Sentiment Survey
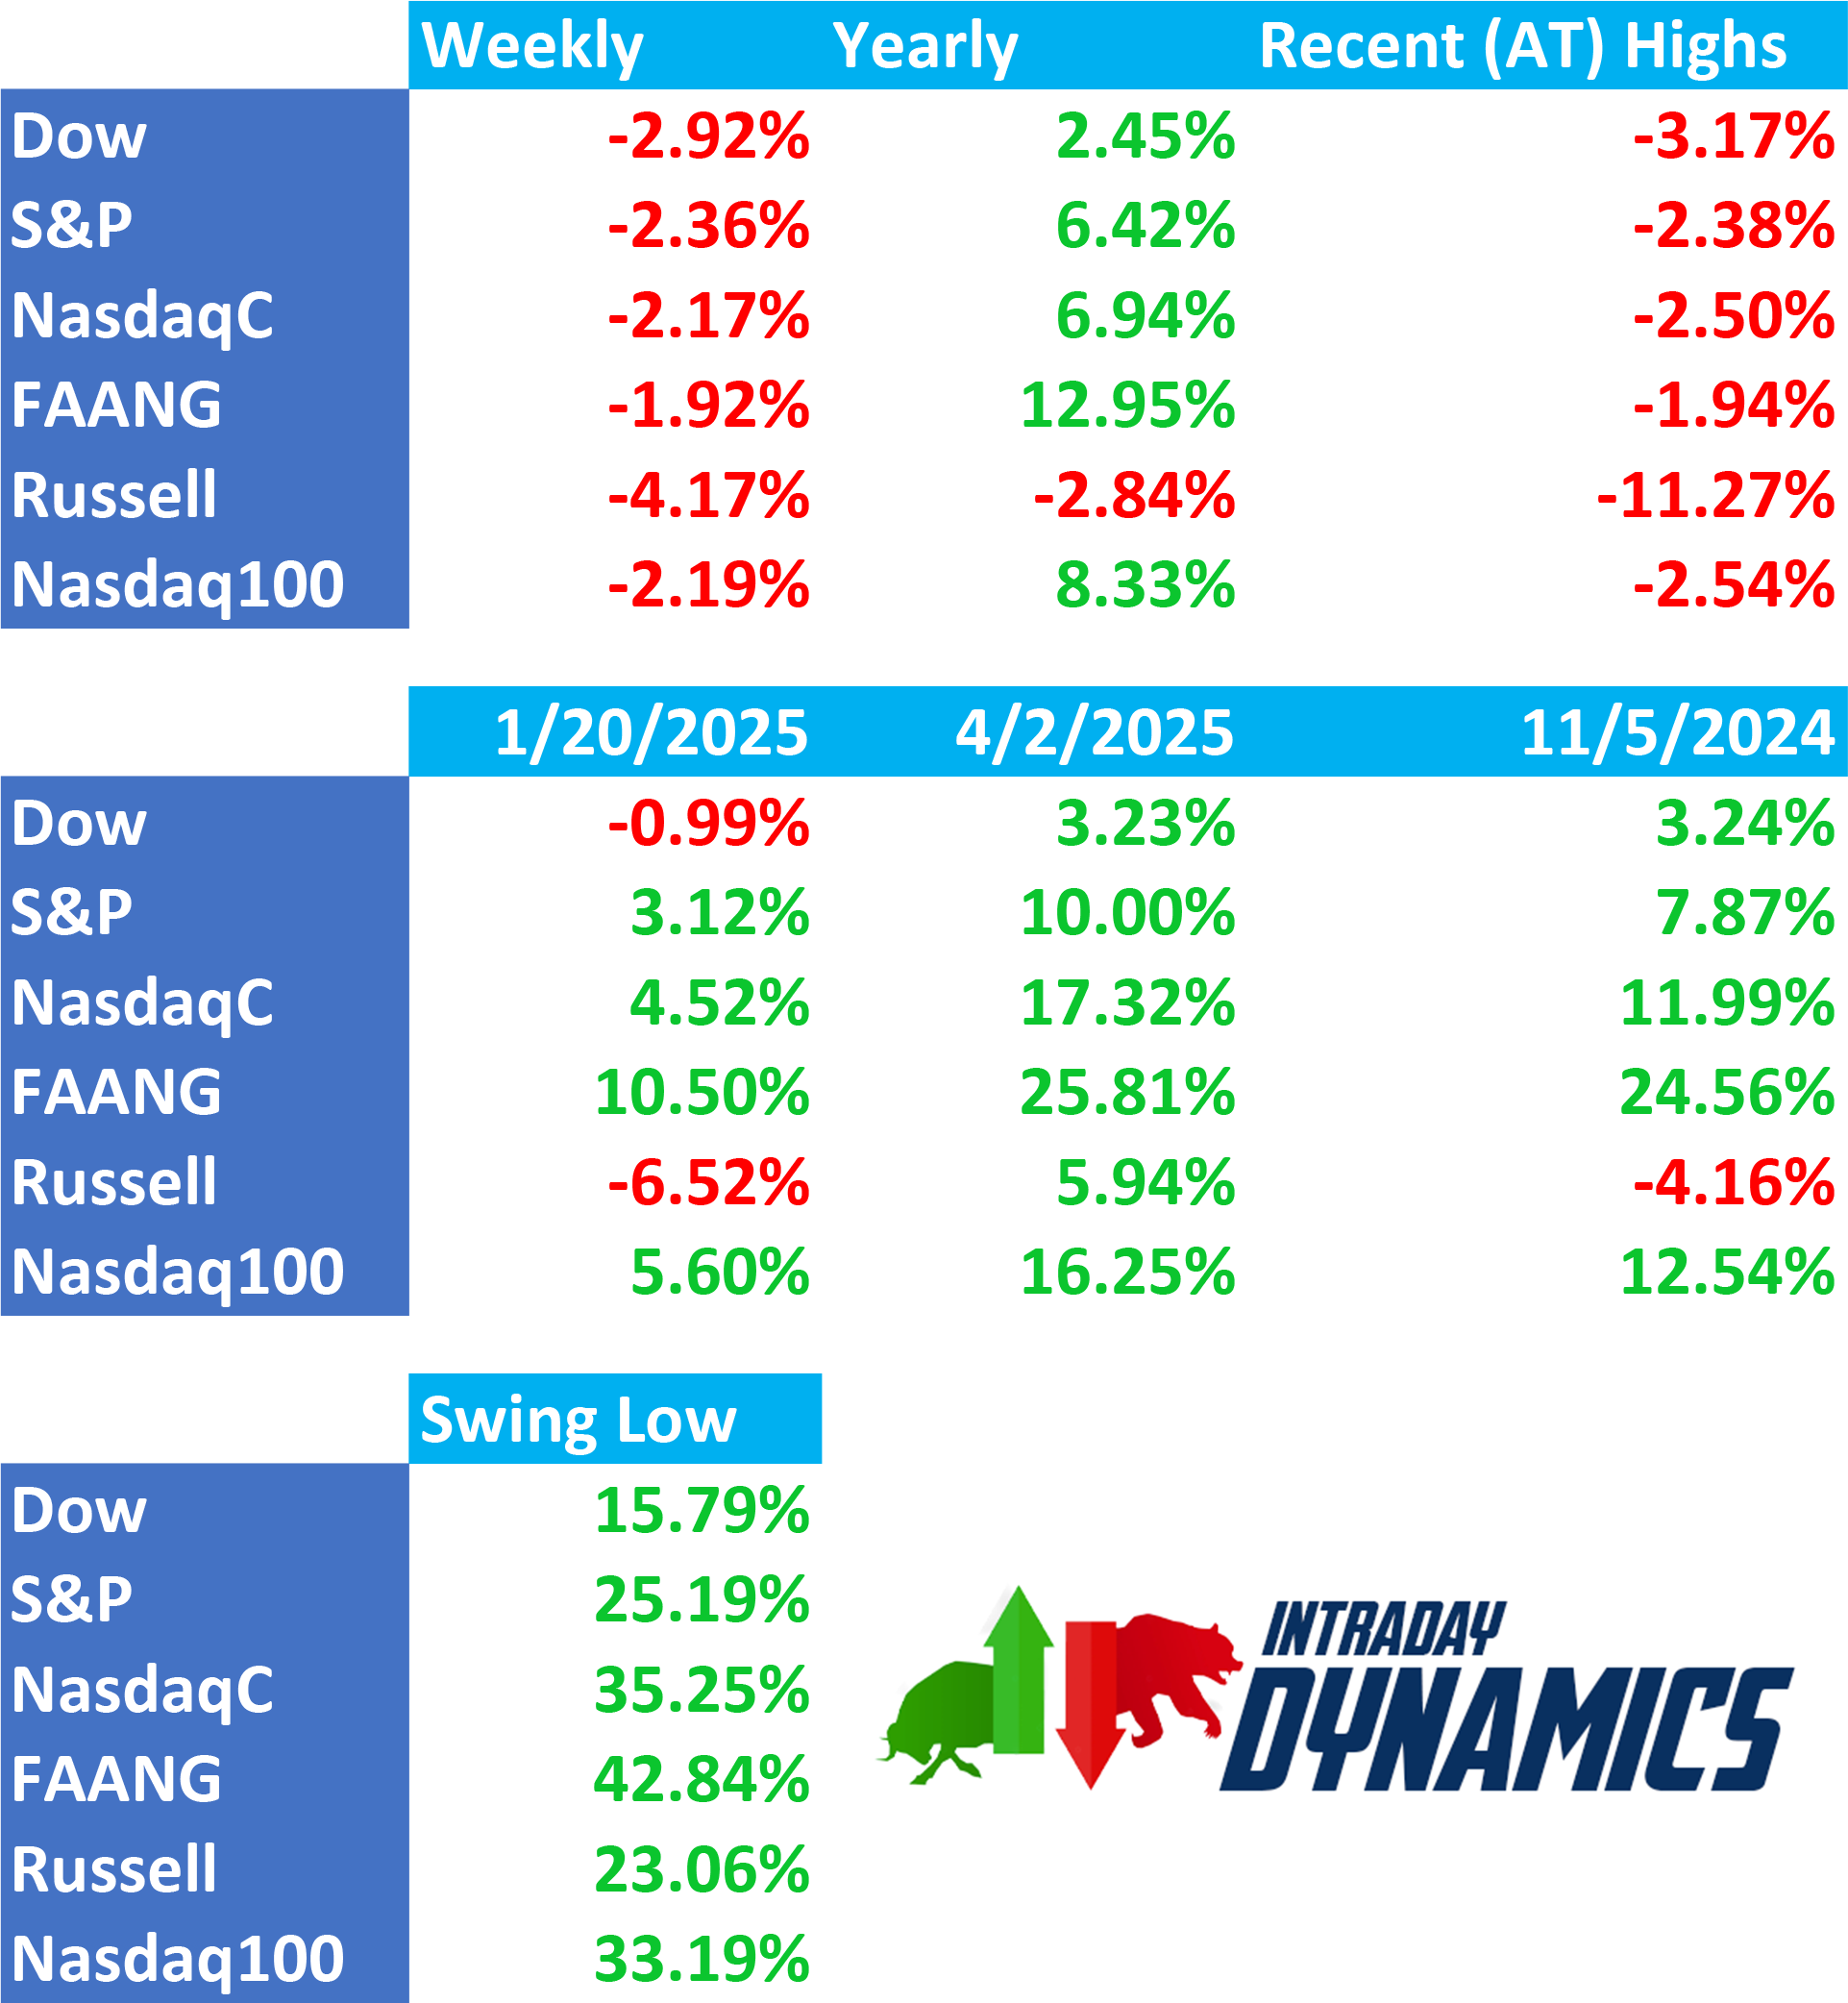
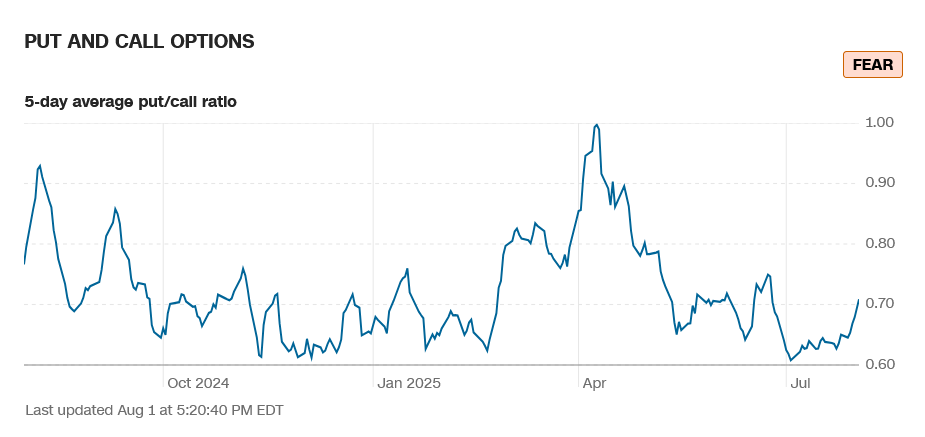
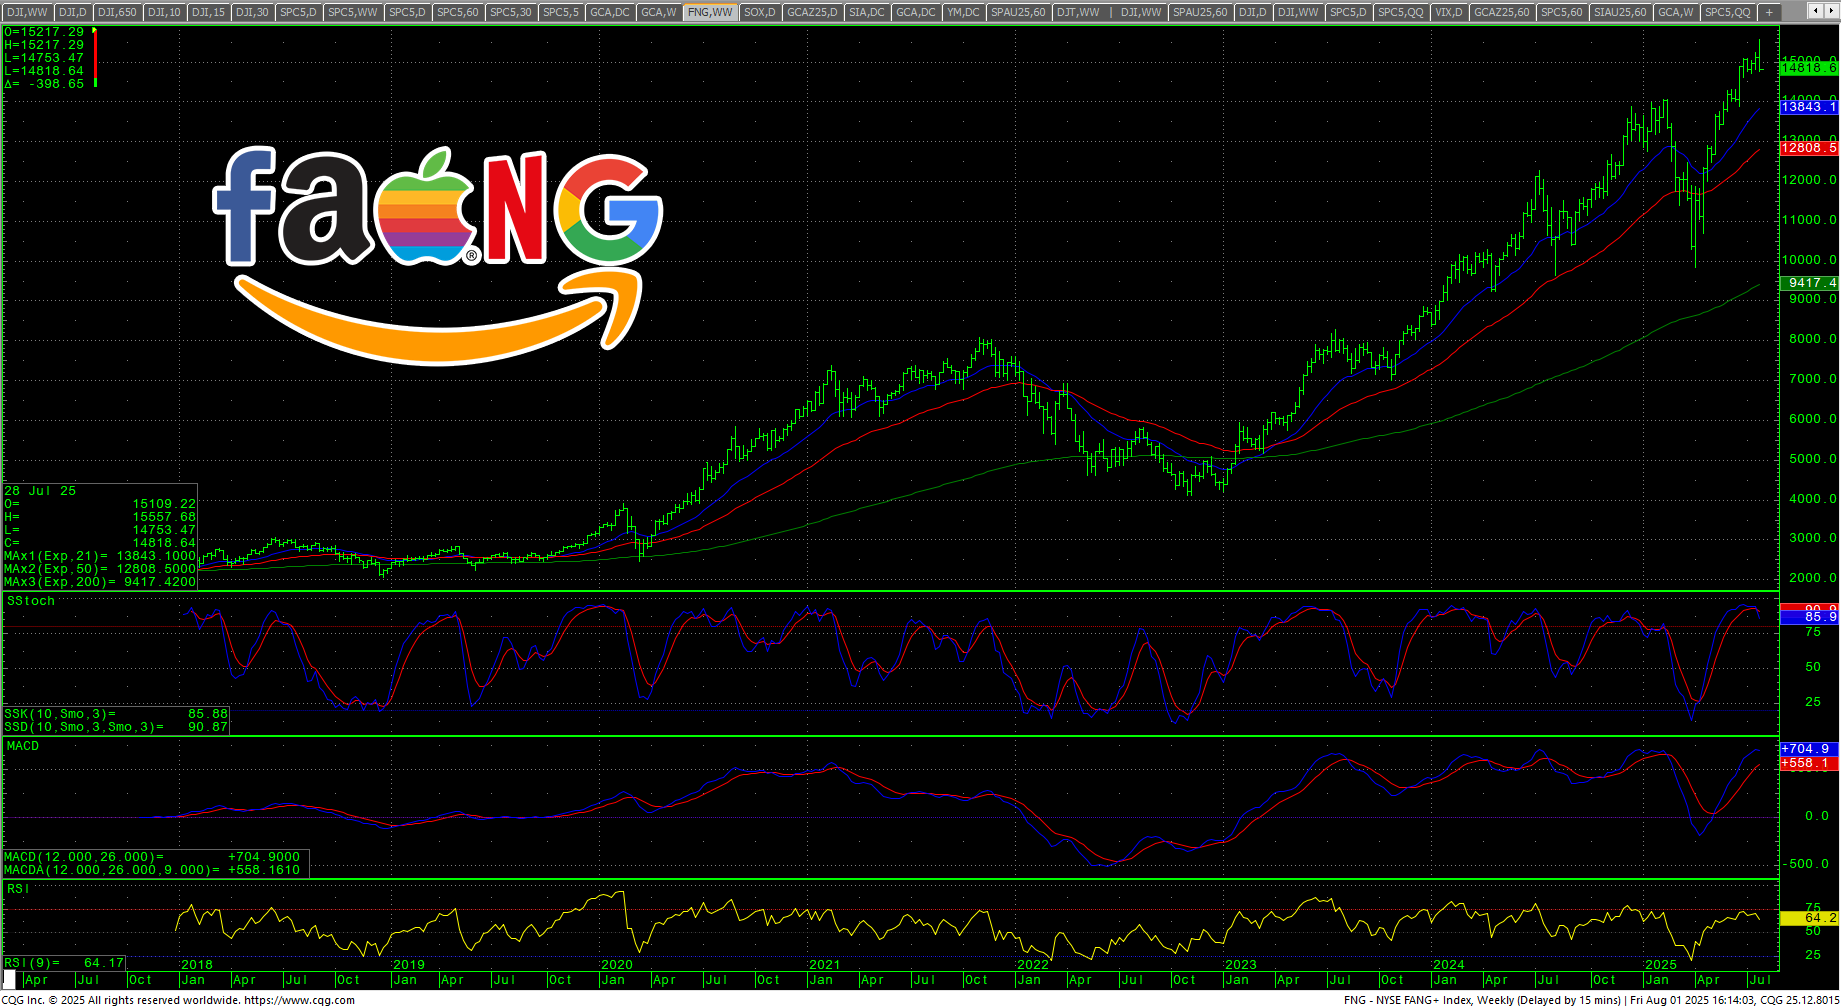
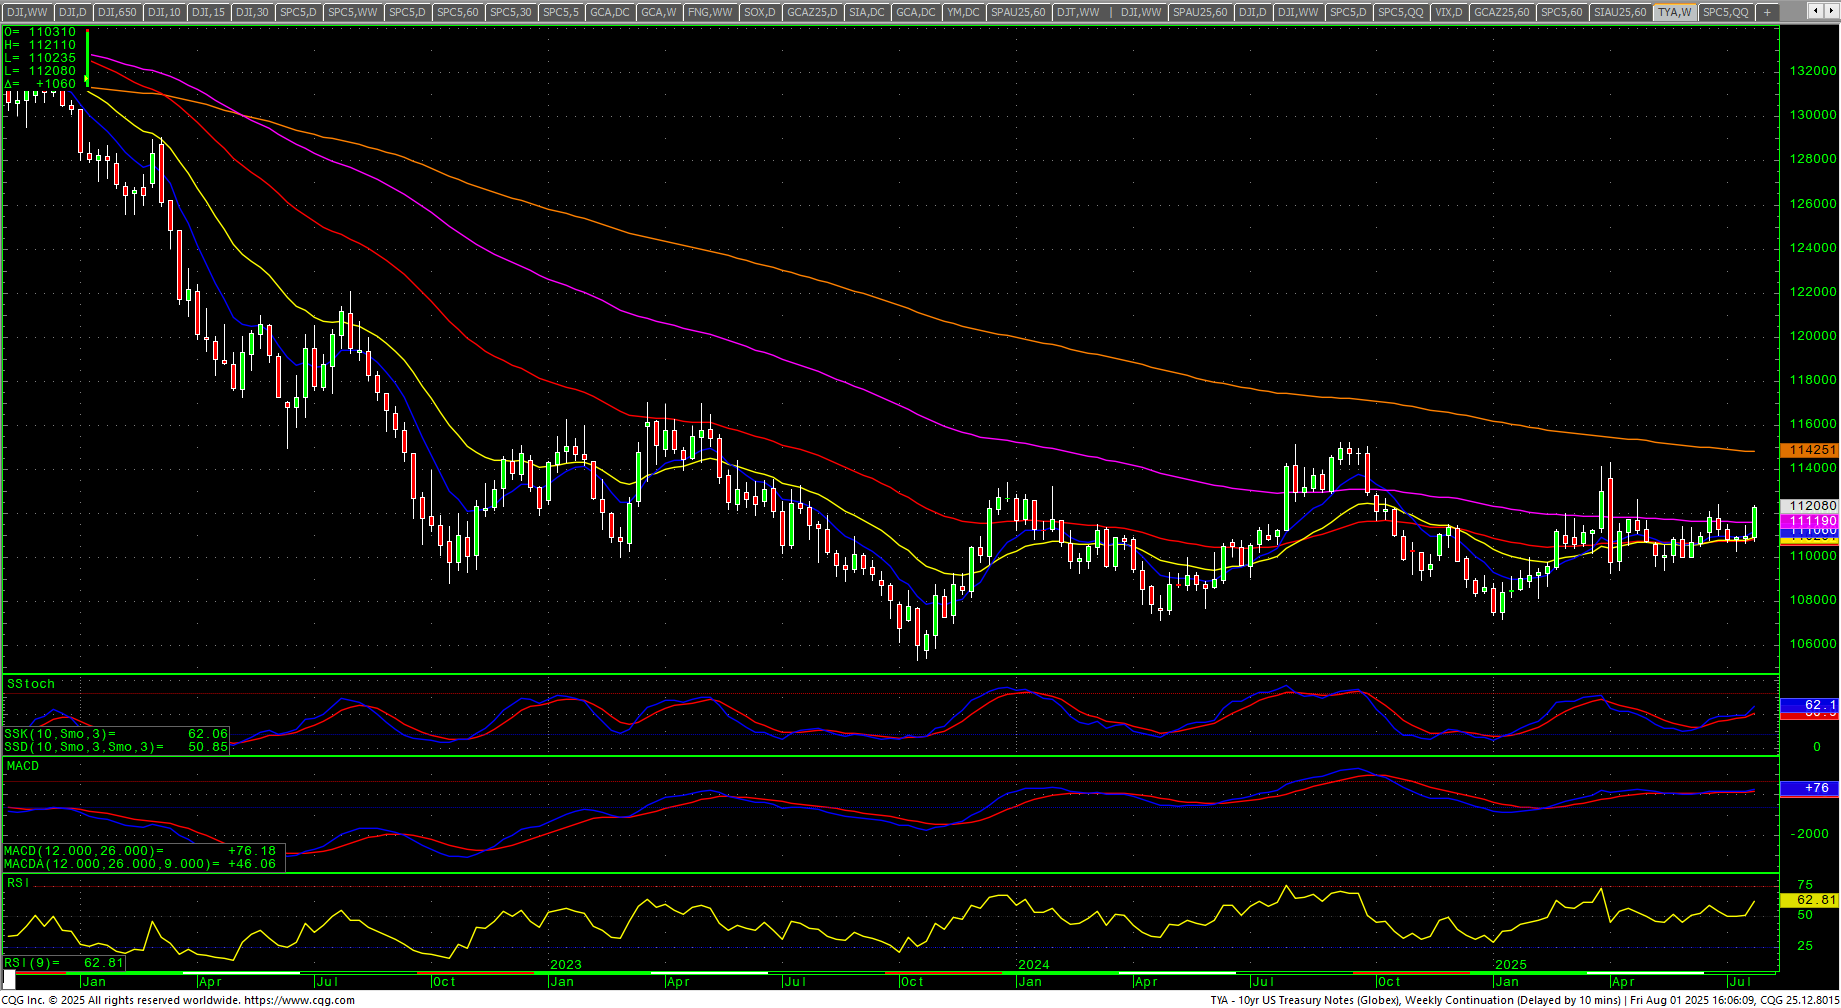
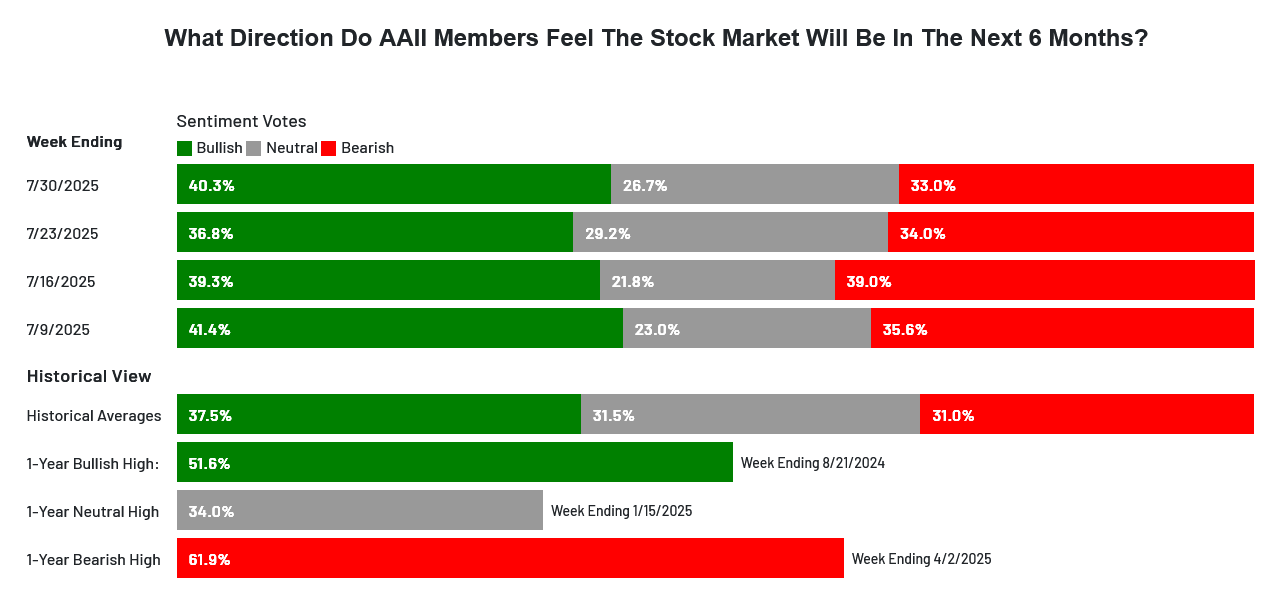 Sentiment was tempered with the weakness on the week. The CNN Fear and Greed Index ended at 50 and reads neutral, coming off the highest readings in a year. Breadth declined on the week and reads greed. Latest AAII Sentiment Survey came out before the big turn: Bullish Sentiment Makes a Comeback as the bulls remain close to historical averages. The Dow A/D pared from the ATH closing at 6912. The VIX exploded higher closed near the highs up +36.50% in the upper end of the range. The Put/Call closed at 0.71 and reads fear. The 52-week, A/D declined to +2.34% and reads greed. The Dow closed the week down -2.92%, closing on the bottom end of the range. The S&P settled down -2.36% ending on bottom of an outside week down. The Nasdaq Composite was down -2.17% and the Nasdaq 100 was down -2.19%. The NYSE FANG closed down -1.92% on the bottom of a wide outside week down. The Russell was down -4.17% on the bottom of the week’s range. The 10-year notes rallied sharply to close on the week’s highs at the highest weekly close since 31 March 2025. The yield on the 10YR plunged to 4.216%.
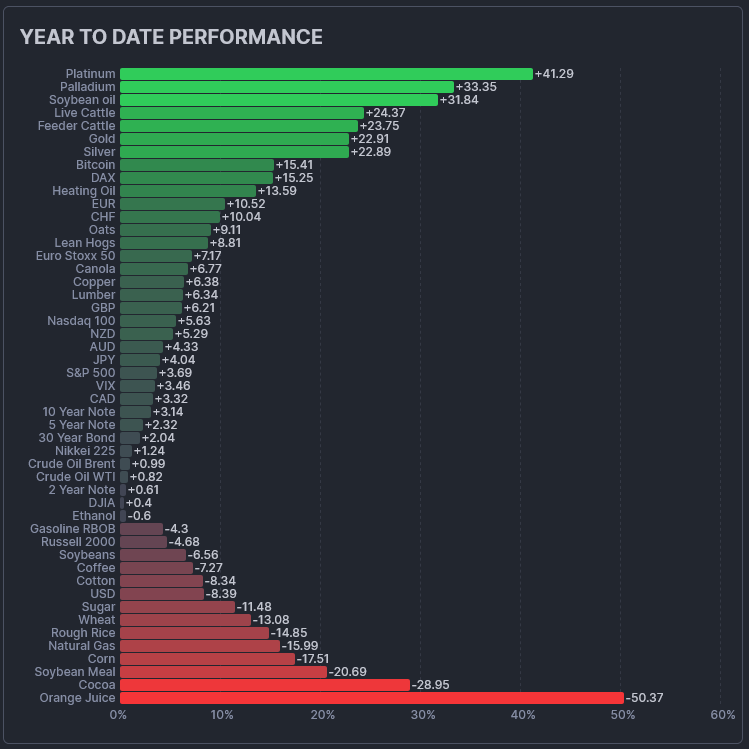
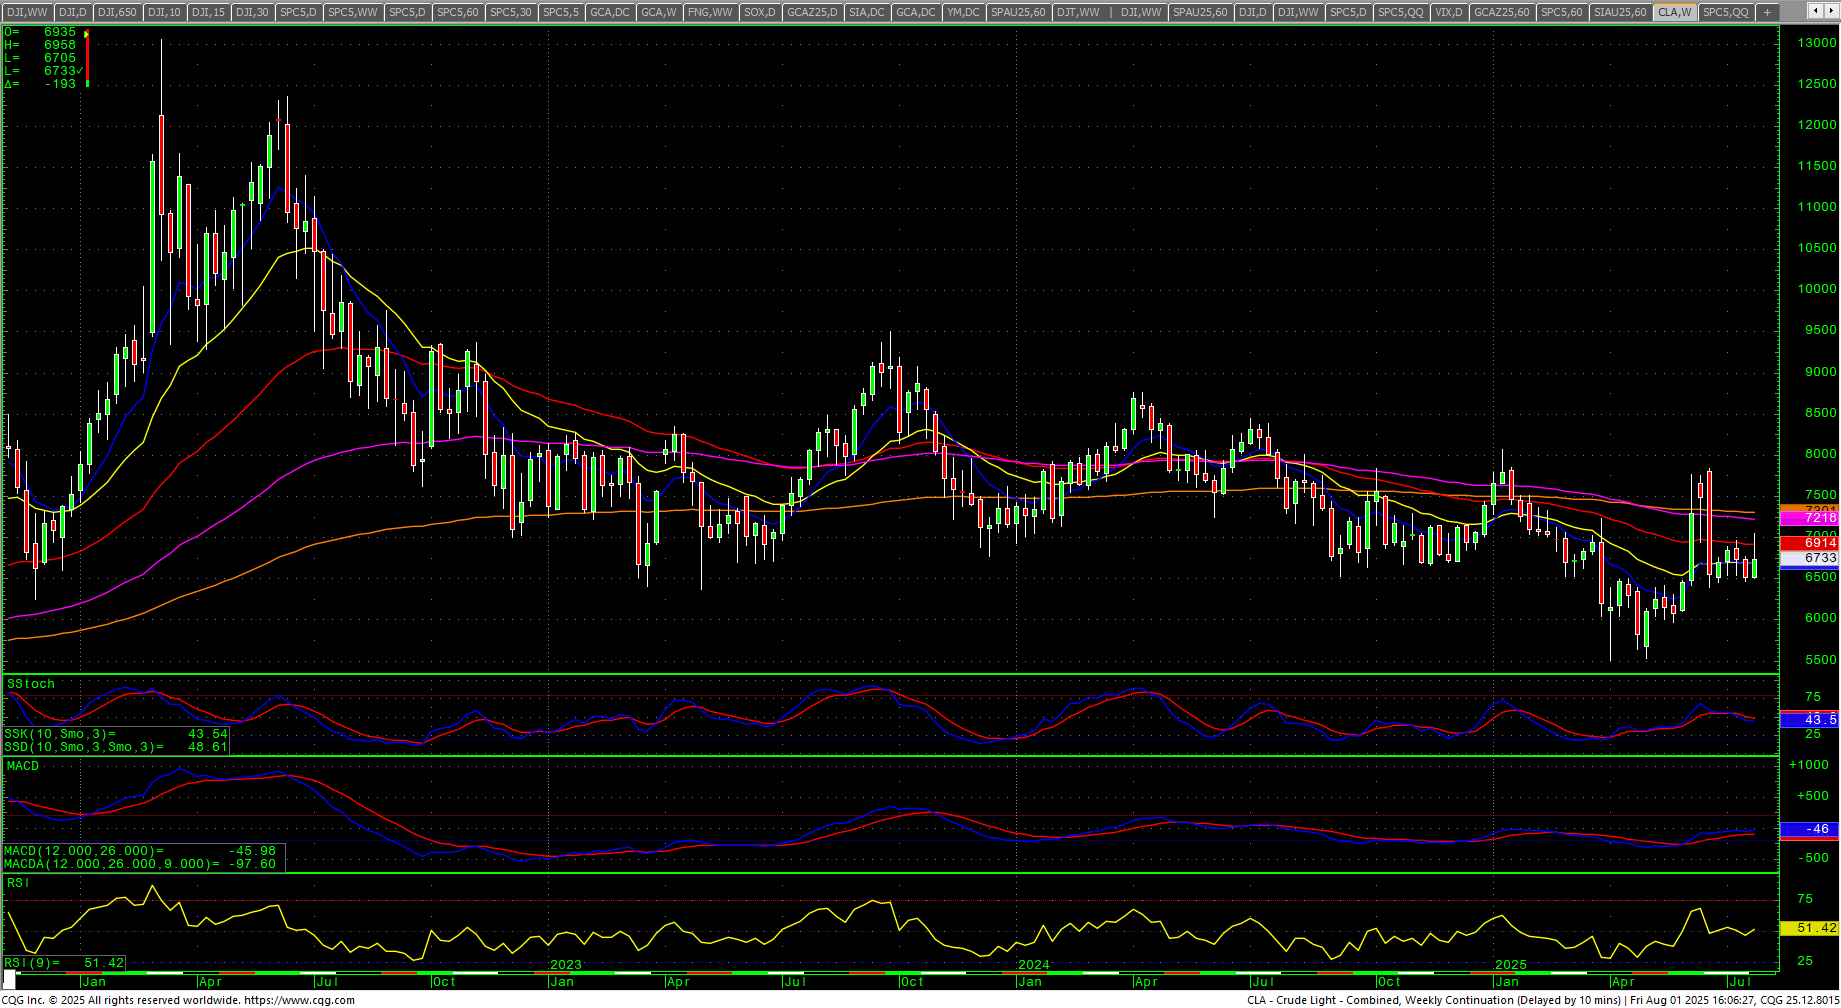
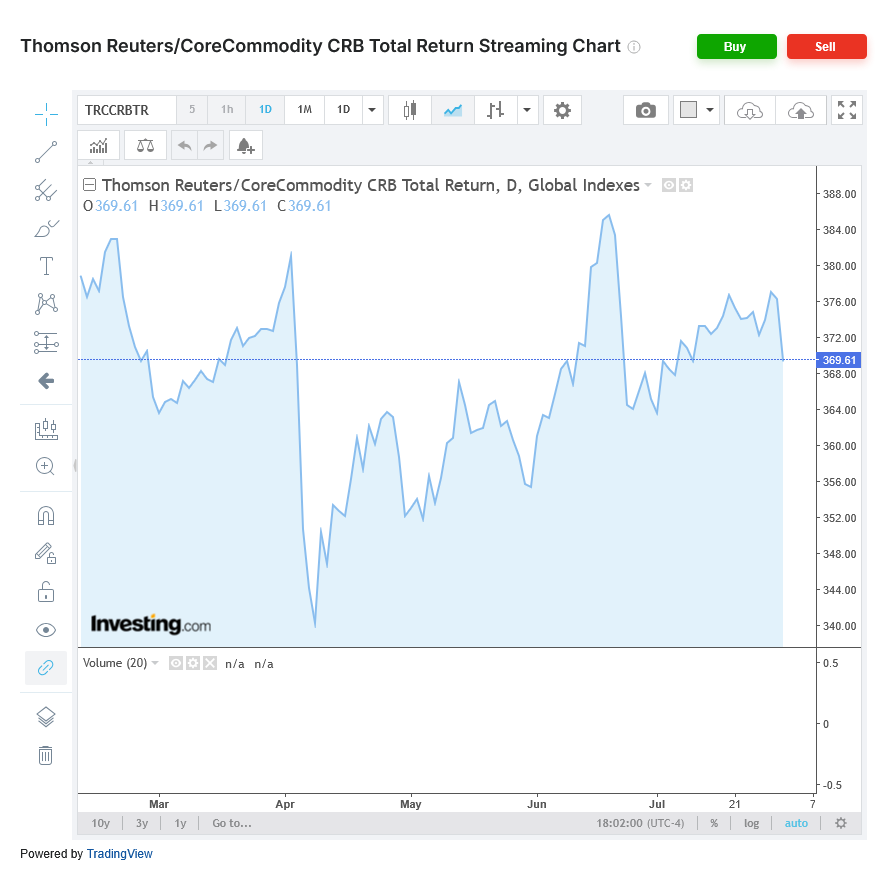 The CRB Index was down -1.43%. Crude oil closed the week higher, in the middle of the range. Gold closed higher on the week after a sharp decline midweek and closed on the top of a reversal range. The CoT for the S&P 500 saw dealers padding positions continuing to add while asset managers remain flat and small specs increased slightly. Non-commercials are flat and commercials are flat. The CFTC S&P 500 Non-Commercial Net Positions ended at -163.18K.
Timing Points
There is a peppering of critical timing now on the 5th, 8th through the 11th. Tuesday we get Trade Deficit and PMI and ISM Services. Thursday is Q2 Productivity and Wholesale Inventories along with Consumer Credit for June. 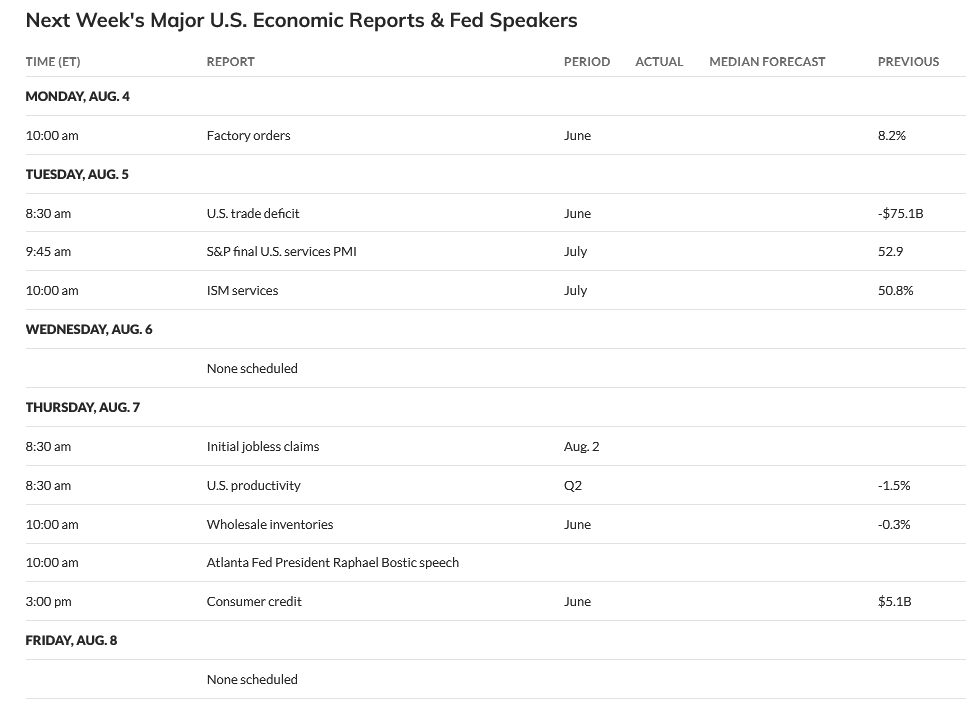
- 08/05 *** X kicks off critical week through
- 08/08 *** X through
- 08/11 *** X critical week
- 08/18 **
- 08/25-26 *** X
- 09/05 **
- 09/12 *** X critical weekend through
- 09/16-17 *** X critical week to the 19th
- 09/23 ***
- 10/01 ** key to bonds/dollar
Dow Jones Industrial Average
Dow Jones Industrial Average Weekly H-L-C
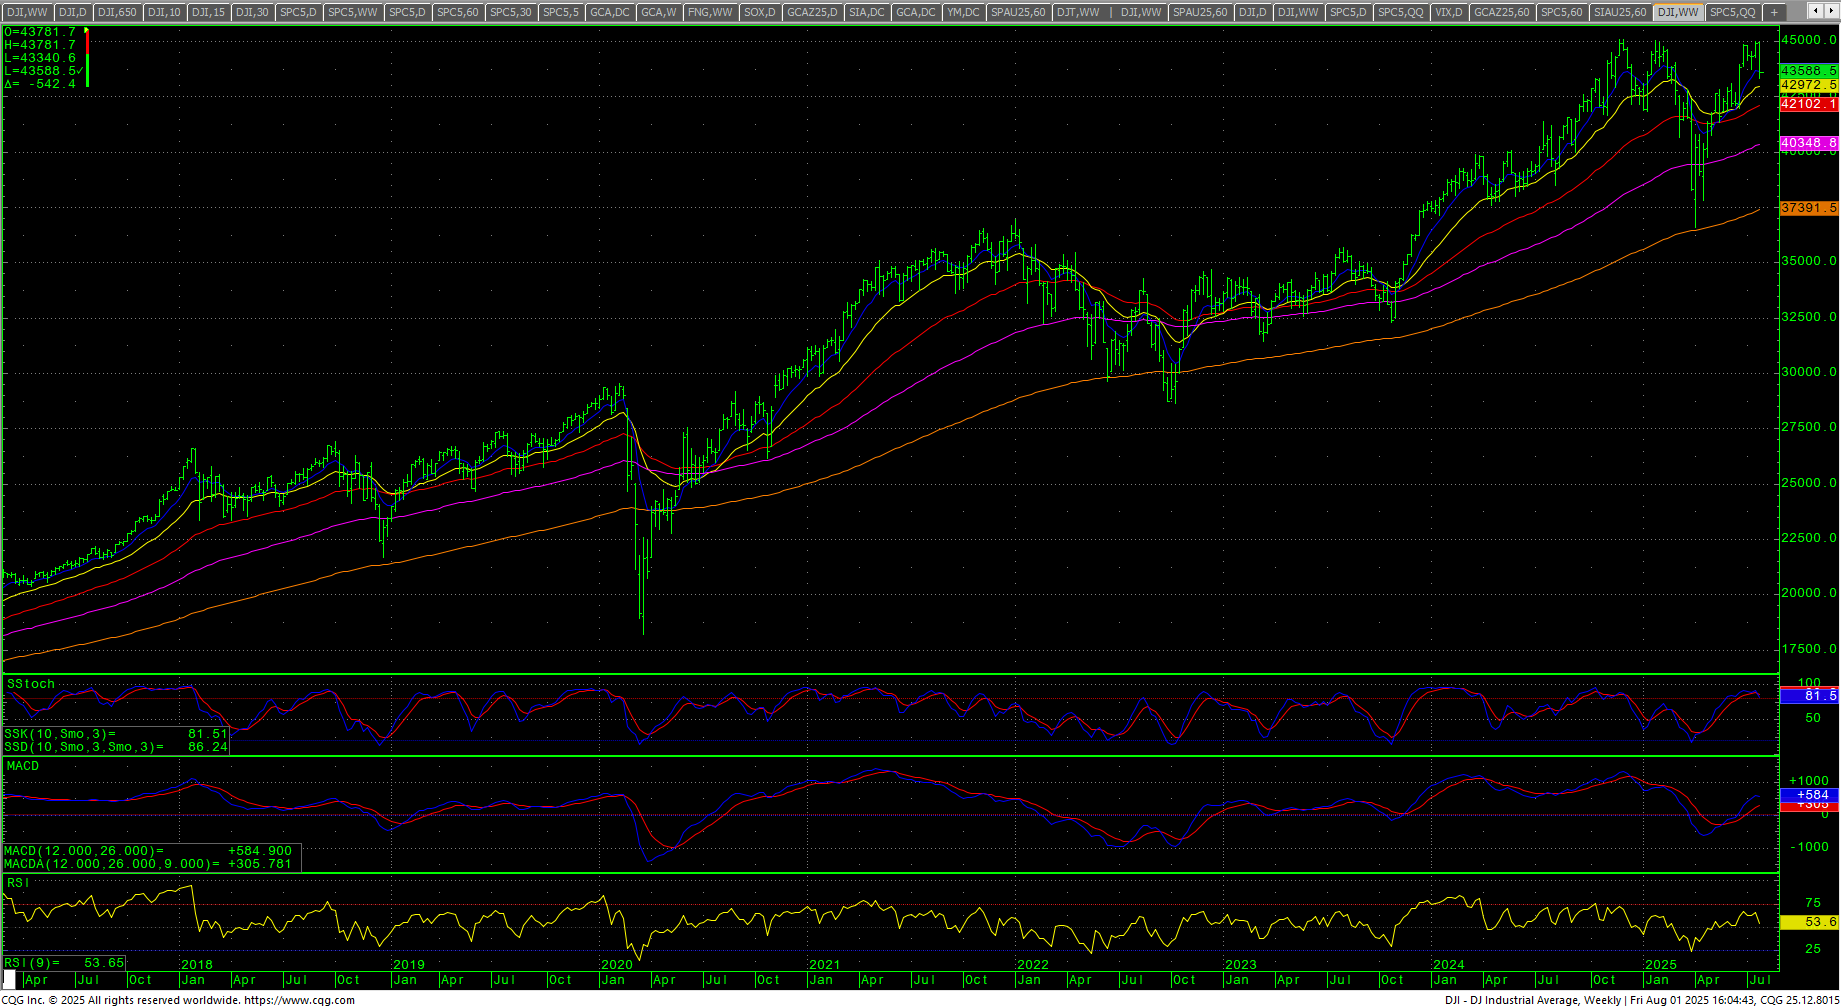 The Dow closed the week down -2.92% on the bottom of the range. It is far too early to start talking about double tops. The daily turned down from a bearish divergence on that chart. The weekly stochastics hooked lower from extreme overbought numbers. The weekly candle is bearish but was not an engulfing candle (Note: It was a bearish engulfing candle on the futures). The MACD is turning down from a key bearish divergence. The daily RSI is 33.05. The 200-day MA starts the week at 42392.40 and is still at record highs.
Dow Jones Industrial Average Hourly H-L-C
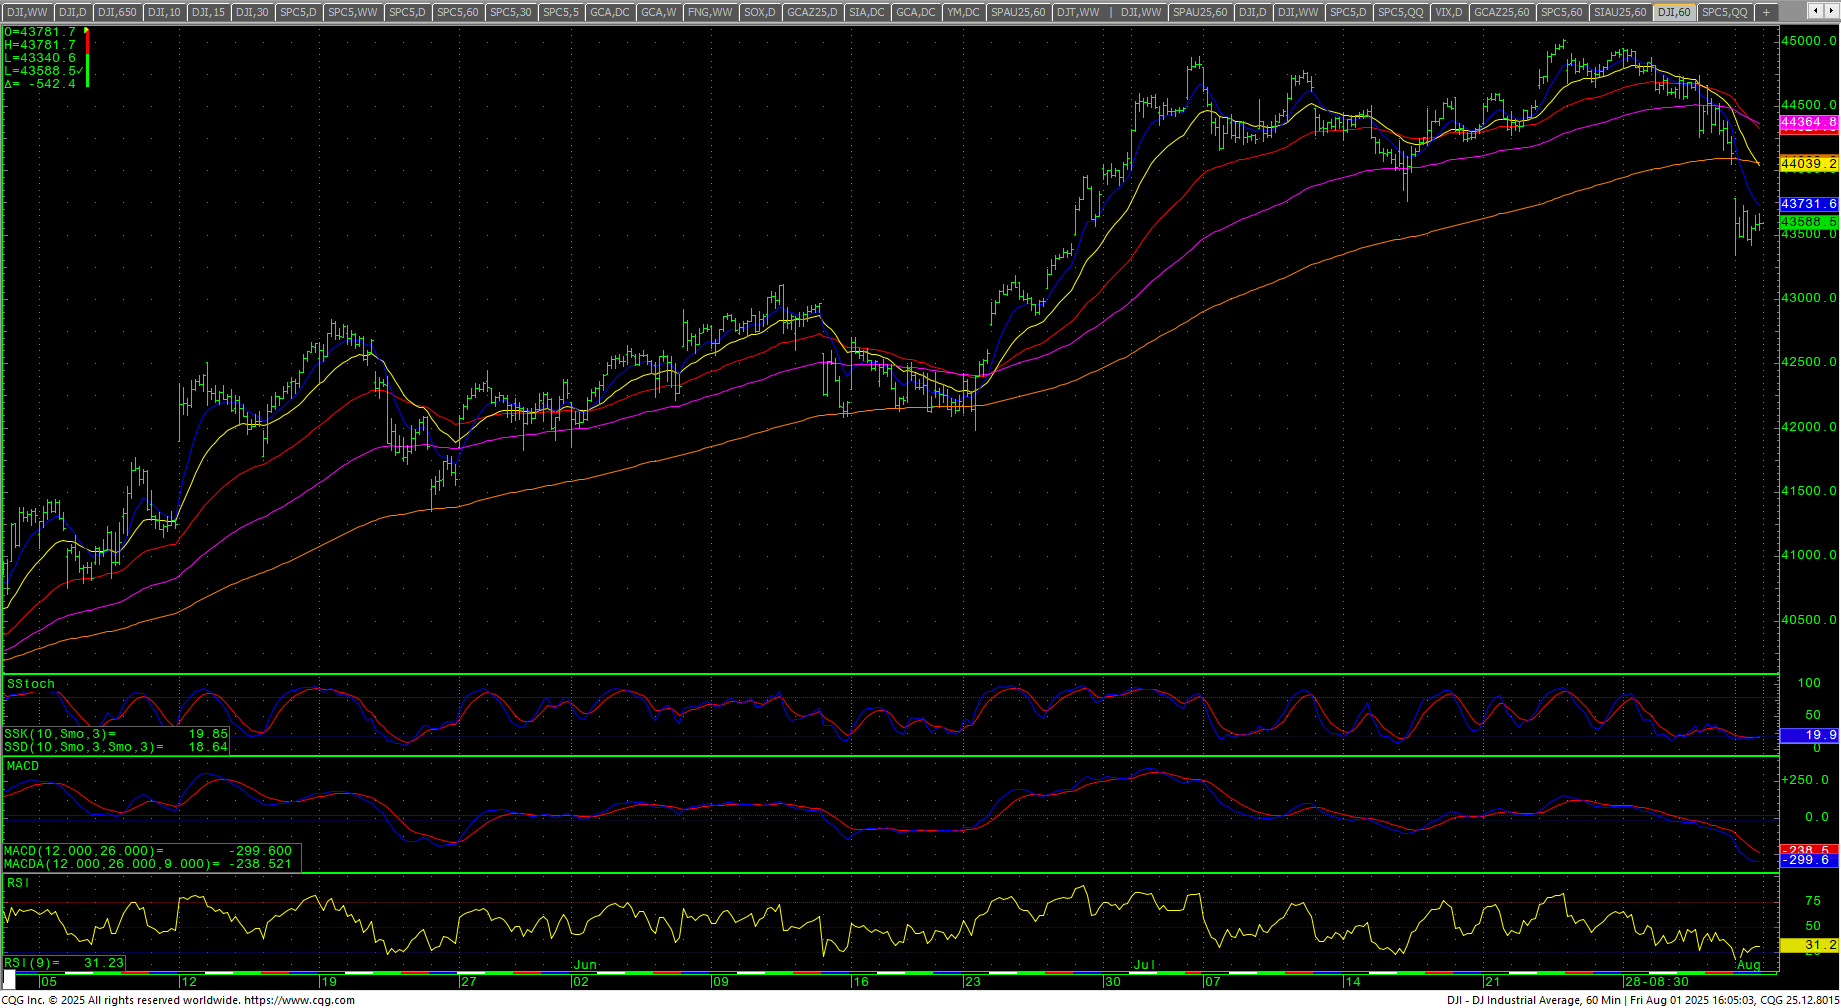 The hourly is oversold on Friday’s close. Support is 43409, 43340, 43237/43236 and pivotal at 43140/43135. Closes under 43135 should minimally test 43030/43025 with counts to 42740. A breakdown under the 42740 area will set up 41805. Under 41805 sets up 41486 with counts to support to 40814. Under 40814 opens counts to critical support of 39822/39818.
Dow Jones Industrial Average Weekly Candles
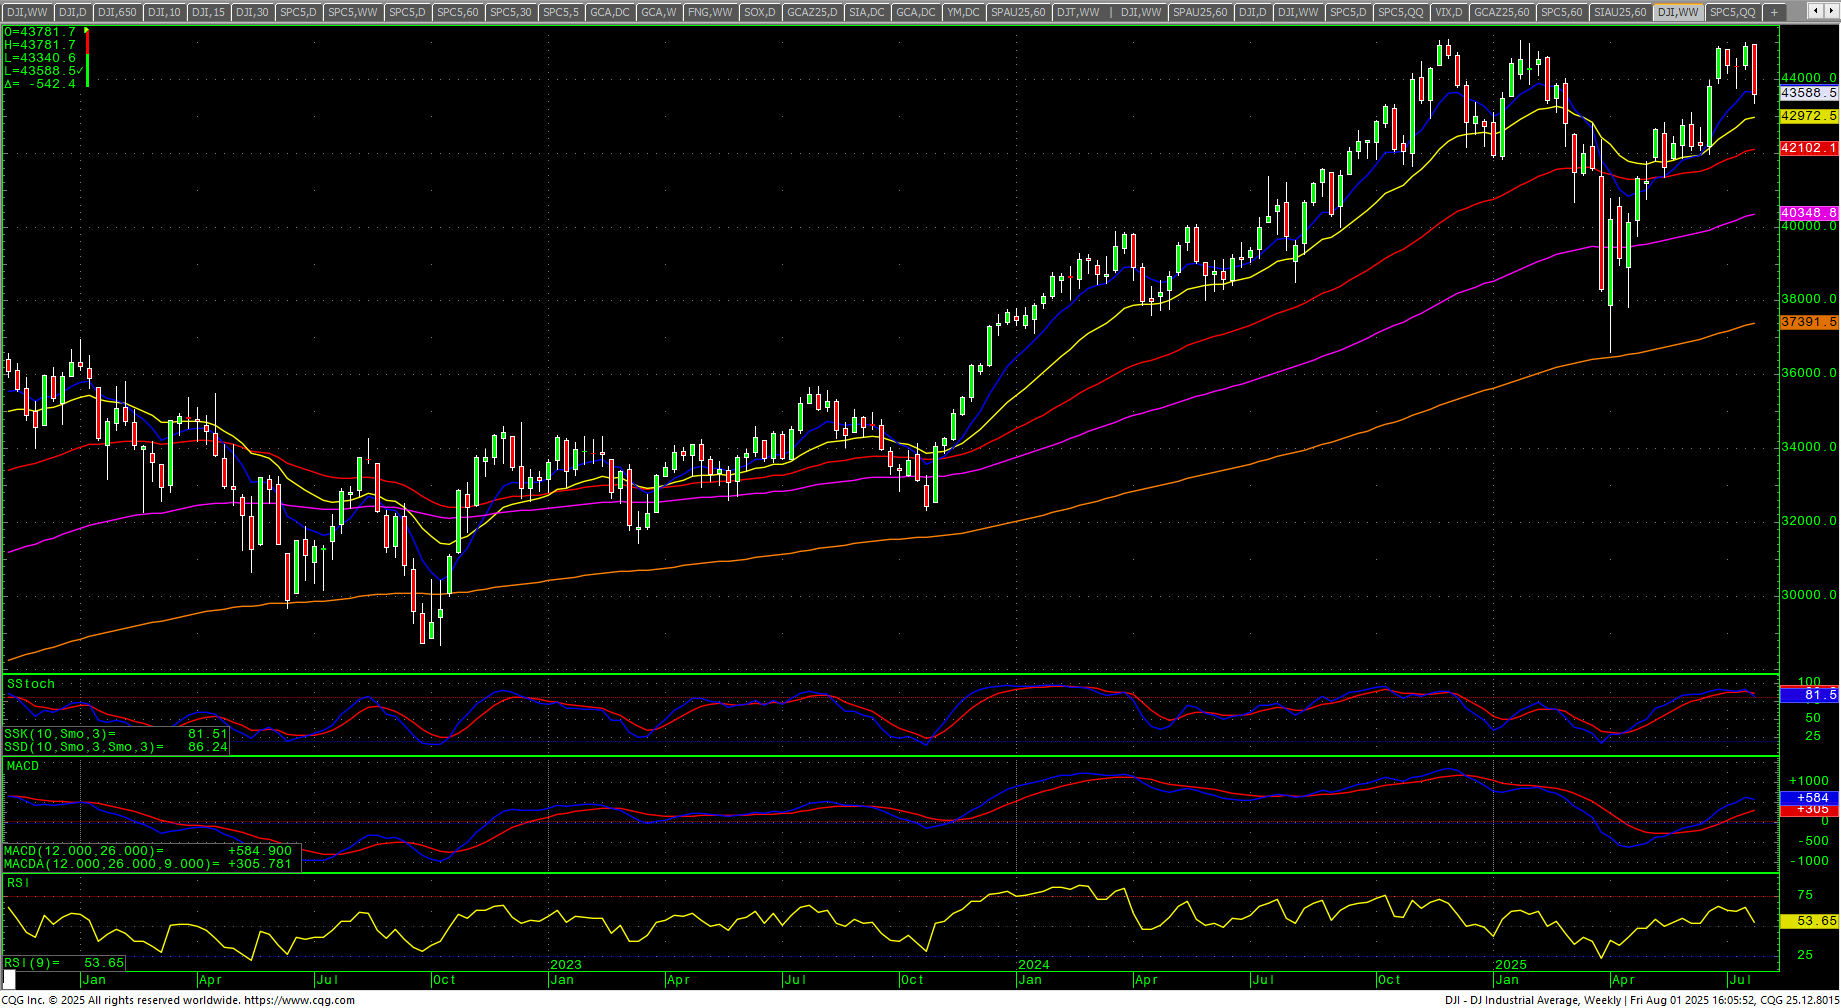 Resistance is 43729/43736 and 43980. A drive above 43980 sets up 44178 with counts to pivotal near-term resistance of 44376/44380. A drive above 44380 should minimally test 44597/44621 with potential toward 45000/45016. Closes over 45016 set up the all-time highs at 45050/45054/45074. Closes over 45074 opens counts toward 45244 and 45426/45450 (Fibonacci target) and resistance at 45306 and 45378. Rallies with closes over 45450 will reopen longer-term monthly targets in the 47400 level with targets of 46568 and 46954.
| Resistance | Support |
|
|
S&P 500 Cash Index: SPX
S&P 500 Index Weekly H-L-C
 The S&P staged a wide outside week down (bearish engulfing candle) and closed on the lows after setting a record high close and intraday high midweek. The daily has hooked down from overbought conditions with a bearish divergence. The weekly stochastics hooked lower with the action. The daily RSI plunged sharply to 35.83. The hourly is oversold on Friday’s close. The 200-day MA is 5852.98 and is trending higher as it sets a record high. All moving averages are at record highs. The SPY reacted to a key trendline overhead and then saw a -3.27% break from Thursday’s high to Friday’s low.
SPY Weekly Candles
 Support is key now against the hourly double bottom at 6201/6194 and further declines have potential to 6156/6155. Closes under 6155 set up 6122 and 6050/6047. A breakdown under 6047 sets up critical near-term support at 5818/5817. Daily closes under 5817 are bearish to 5631 and 5443/5440. Closes under 5440 open counts to 4995 with support at 5305.
S&P 500 Index Hourly H-L-C
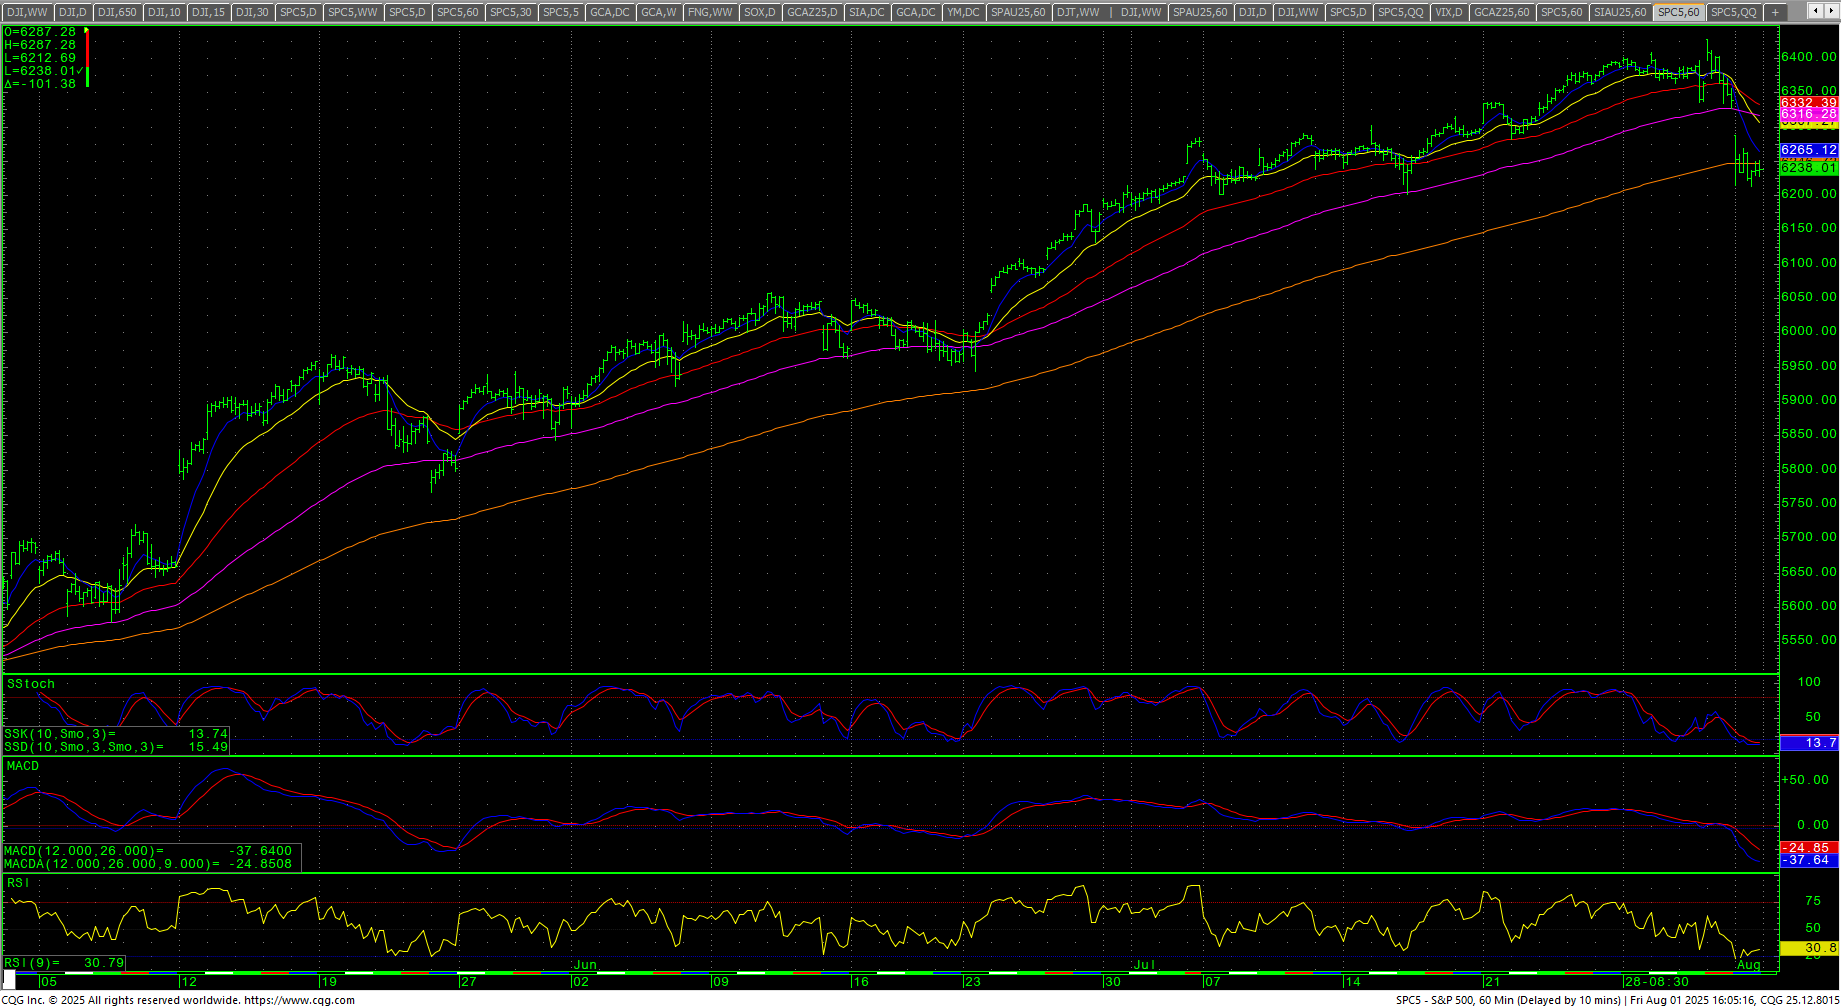 Resistance is 6363/6269 and 6294. A drive over 6294 sets up 6319/6320 with potential to 6345/6348. Closes over 6348 should minimally test 6373/6376 with counts back to 6427 to 6440. Closes over 6440 will open counts to 6584 and resistance at 6494. A breakout over 6584 sets up 6638 and 6692. A breakout with closes over 6692 sets up 6764 and 6800. Closes over 6800 can carry to 6872 and 6908. Closes over 6908 have counts to 6944 and 6980.
| Resistance | Support |
|
|
Charts courtesy of CQG, Inc., CNN, Koyfin, Trading View and AAII