TECHNICAL ANALYSIS
The major market indices have been in a schism since the summer lows. For decades now, the consensus axiom is to ‘never fade the blue chips.’ That said, the past years have proven that absolutely nothing adheres to ‘norms’ with fund managers continuously underperforming the general indices. The Dow Jones has continued to vastly outpace the S&P 500 and the tech-centered Nasdaq and FAANG indices. The DJIA ended the week last week slightly higher and at the highest weekly close since early April 2022. The high close on the daily chart of November 22nd made the current rally a 20.4% increase off the summer lows. By contrast, the S&P has rallied 14.1% off its bottom with the Nasdaq spot futures mustering a 12.6% increase off its lows. Spot FAANG futures have rallied 20.3% from their bottom.
Dow Jones Industrial Average Weekly HLC
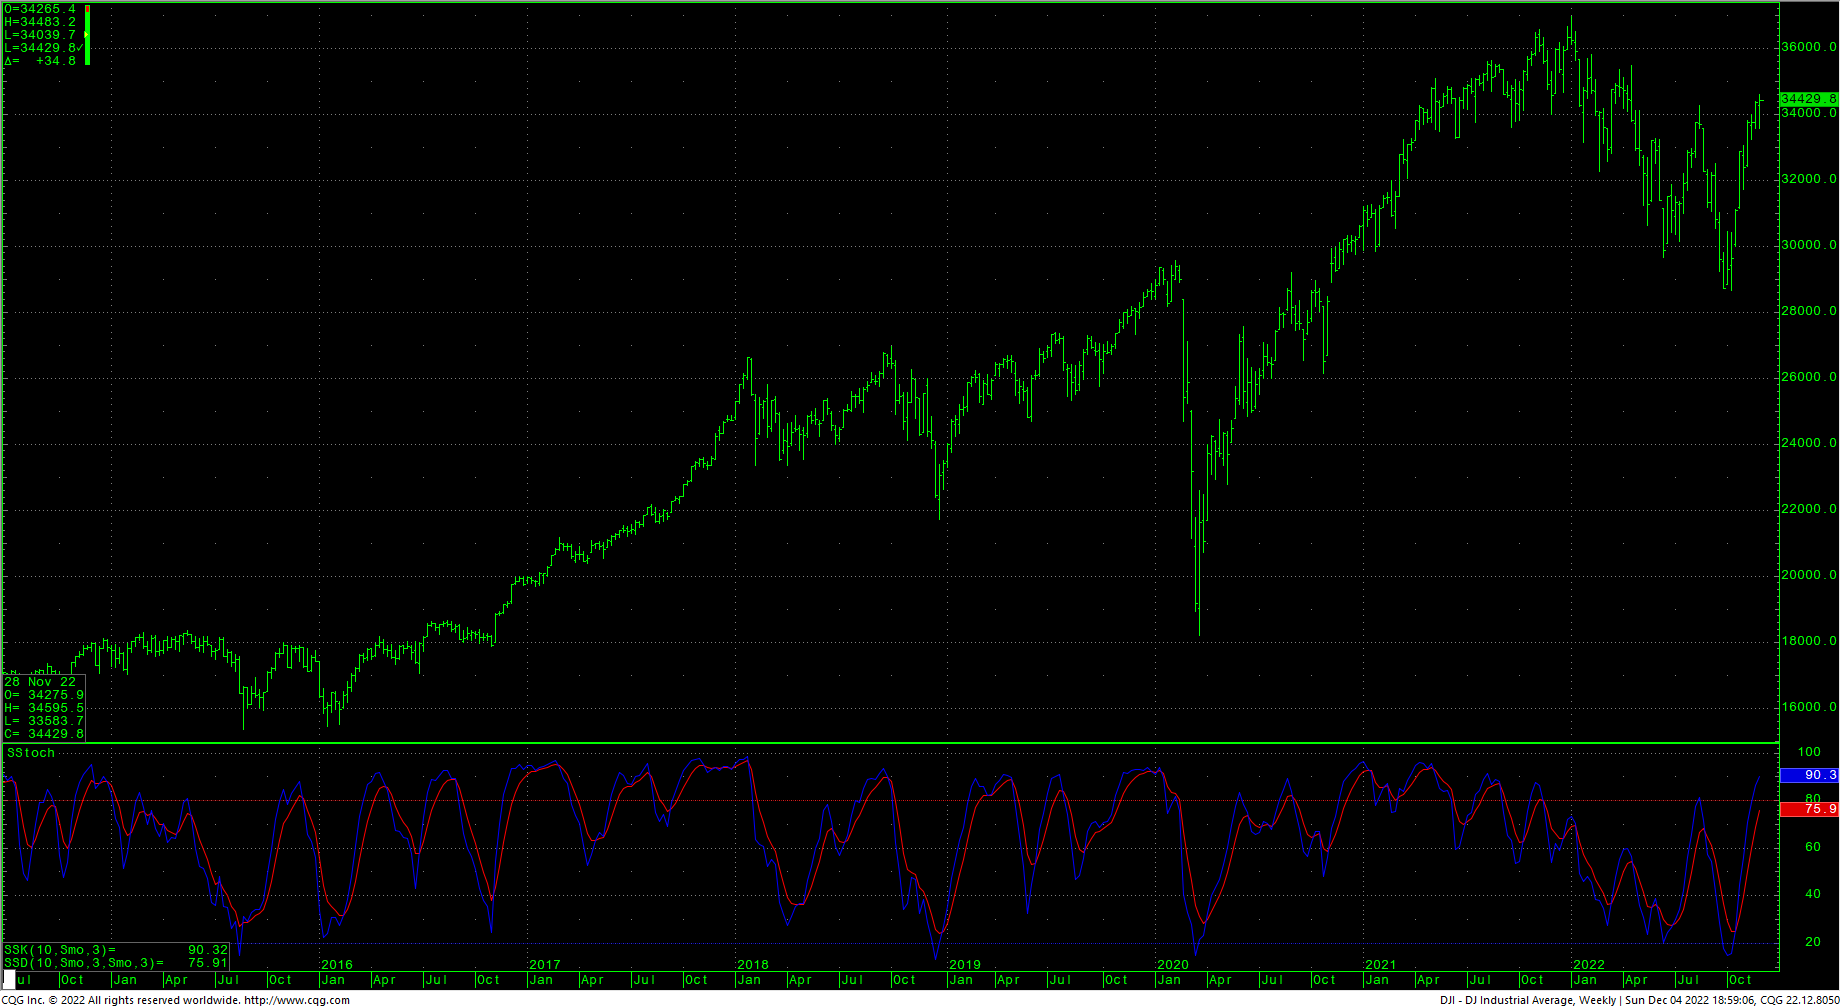
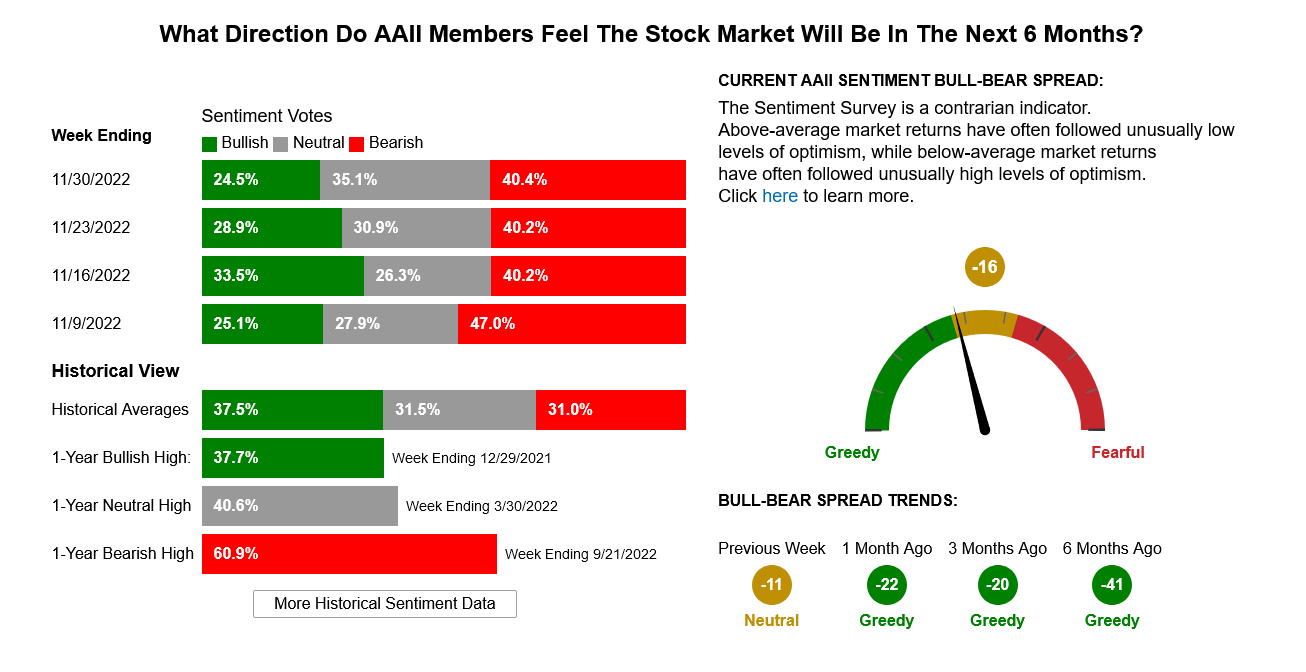
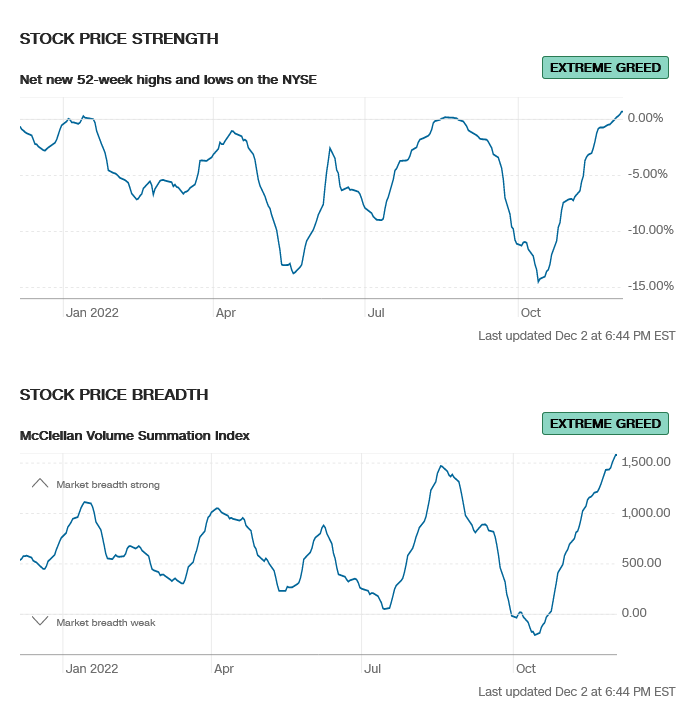
The DJIA is now trading above the August highs and the daily is overbought with some higher targets overhead generated by the breakout above the August tops. Sentiment numbers are beginning to climb with the net new 52-week highs and lows on the NYSE now reaching levels not seen since January of this year. The jury is still out on the aforementioned underperforming fund managers who have chosen cash versus market investment as they bank on a recession-minded philosophy and FOMO has yet to hit them.
AAII Investor Sentiment Survey
CNN Fear & Greed Index
The weekly DJI chart is still in a strong uptrend and continued rallies suggest a test of the absolute last-gasp area on the daily for the bears at 34879/34995. Closes over 34995 suggest a test of the April high at 35492. A breakout over 35492 will setup a test of the February highs at 35768/35824 with a shot at the 2022 highs of 36952. Above the record high is resistance at 37103 and 37253.
Support is at 34356 and 34208. Under 34208 set up a test of the swing low and short-term support of 34089 to 34039. Support is short-term critical at 33970-33960 and a breakdown under that support will setup a move toward 33583 with potential to 33496/33495. Closes under 33495 count to 33158 with support of 32984.
Resistance
- 34879/34995 *** ↑
- 35492 ** ↑
- 35768/35824 ↑
- 36952 (record highs) ↑
- 37103 **
- 37253 ***
Support
- 34356 **
- 34243 **
- 34208 *** ↓
- 34182/34170 **
- 34089/34039 *** ↓
- 33996 **
- 33970/33960 *** ↓
- 33822 ***
- 33583 *** ↓
- 33495 *** ↓
S&P 500 Daily HLC
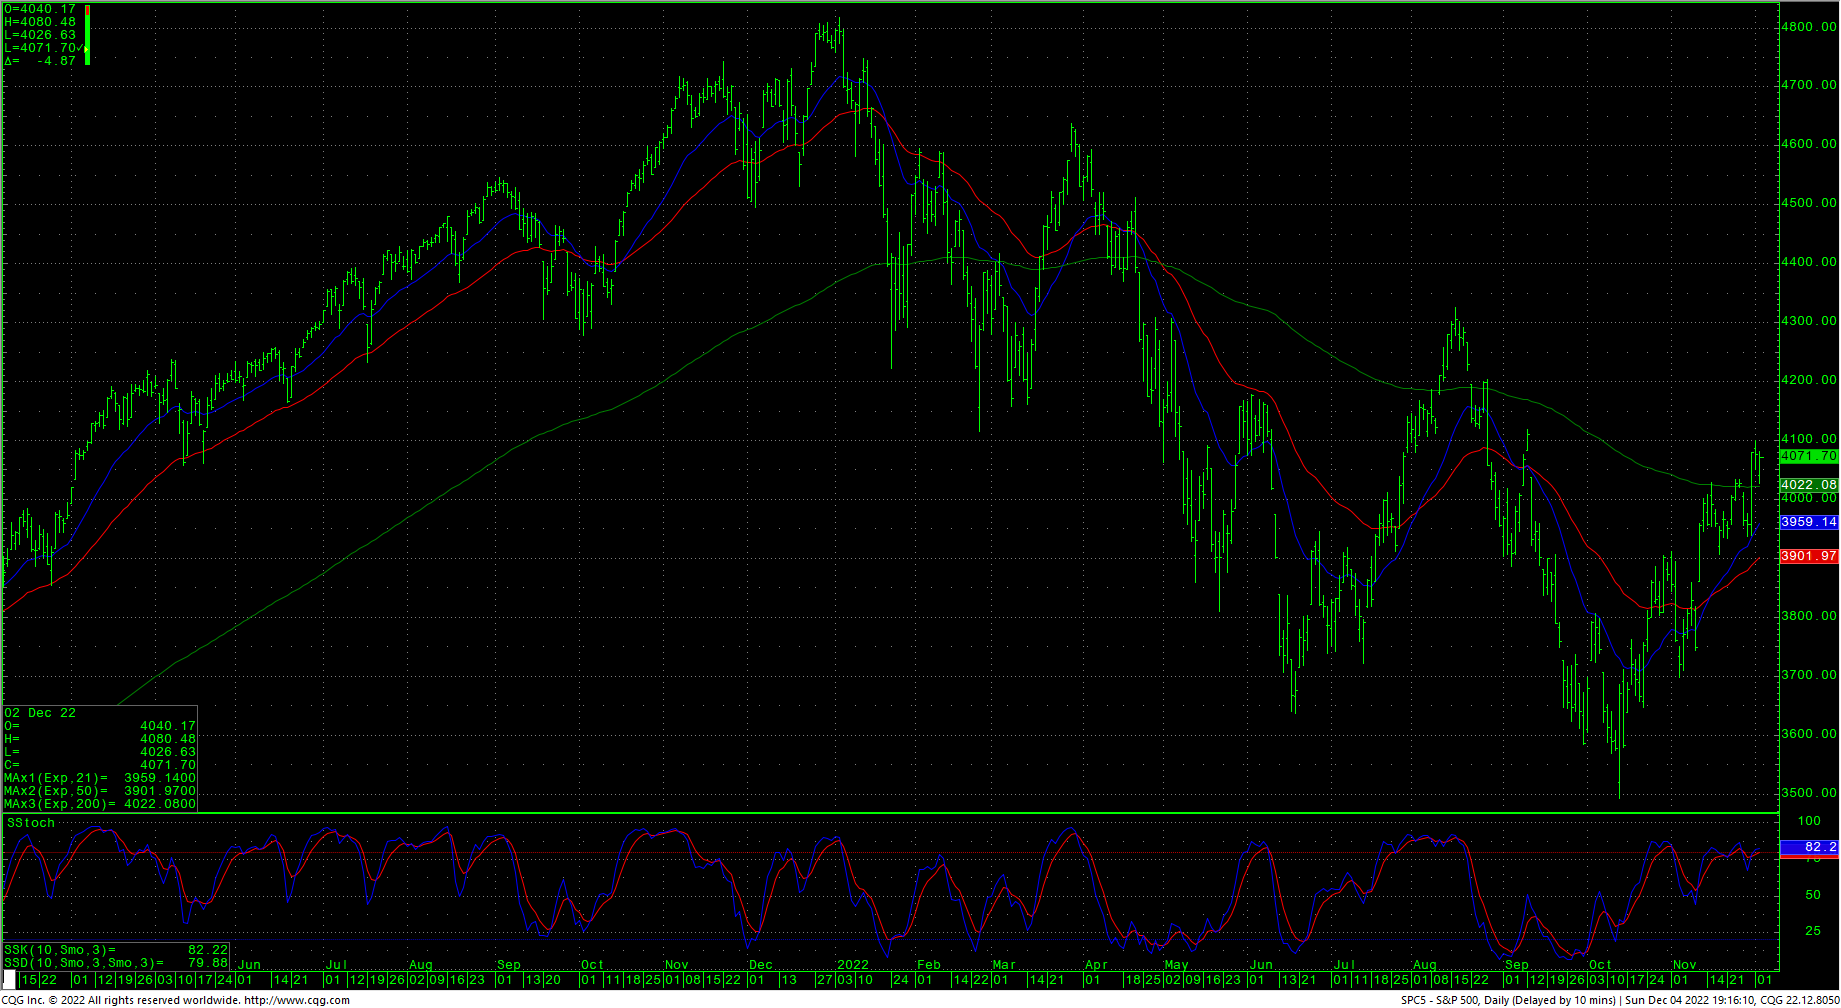
Much has been made recently regarding the 200-day moving average for the S&P cash index, with prices breaking out above that indicator last week. The reality is that there has yet to materialize a “Golden Cross” for the moving averages. The last Death Cross came in April of 2022 and right now the 50-day is running at 3901 with the 200-day coming in at 4022. Note that at the August highs, the spread between the 50-day and the 200-day was a bit narrower than it is currently.
Resistance for the S&P 500 cash is at 4100 and pivotal near-term at 4119/4128. A breakout over 4128 is bullish and should take the cash to key daily resistance of 4155. Closes over 4155 are a strong signal and will open counts toward the gap area on the daily at 4203/4218. A breakout over 4218 sets up a test of critical resistance at 4311/4325.
Support is at 4067, 4056/4053 and 4047/4038. Closes under 4038 will open counts to 4019 with potential to critical short-term support of 3999/3995. Under 3995 should carry to the recent swing lows at 3937. Under 3937 sets up 3906 with a shot toward hourly support of 3867/3859. A close under 3859 suggests a test 3796 with potential to critical hourly support of 3724/3720.
Resistance
- 4100 **
- 4119/4128 *** ↑
- 4155 *** ↑
- 4203/4218 *** ↑
- 4260 **
- 4311/4325 *** ↑
Support
- 4067 **
- 4056/4053 ** ↓
- 4047/4038 *** ↓
- 4019 **
- 3999/3995 *** ↓
- 3937 *** ↓
- 3906 ***
- 3867/3859 *** ↓
- 3796 *** ↓