TECHNICAL ANALYSIS
Spot soybeans have been in an up channel since setting lows in critical timing in early October. The daily spot chart has been flashing a preliminary bearish divergence with the past two weeks’ highs at 1492.25 and open-interest has been creeping slightly higher during this period. Nearby JAN soybeans (SF23) have been in sideways trade for over a week and the short-term charts are neutral. As of this writing (9PM Central 12/18/22) the SF23 has opened sharply lower in overnight trade and prices are now testing a band of support that runs from 1459.5/1456.5.
SF23 Daily H-L-C
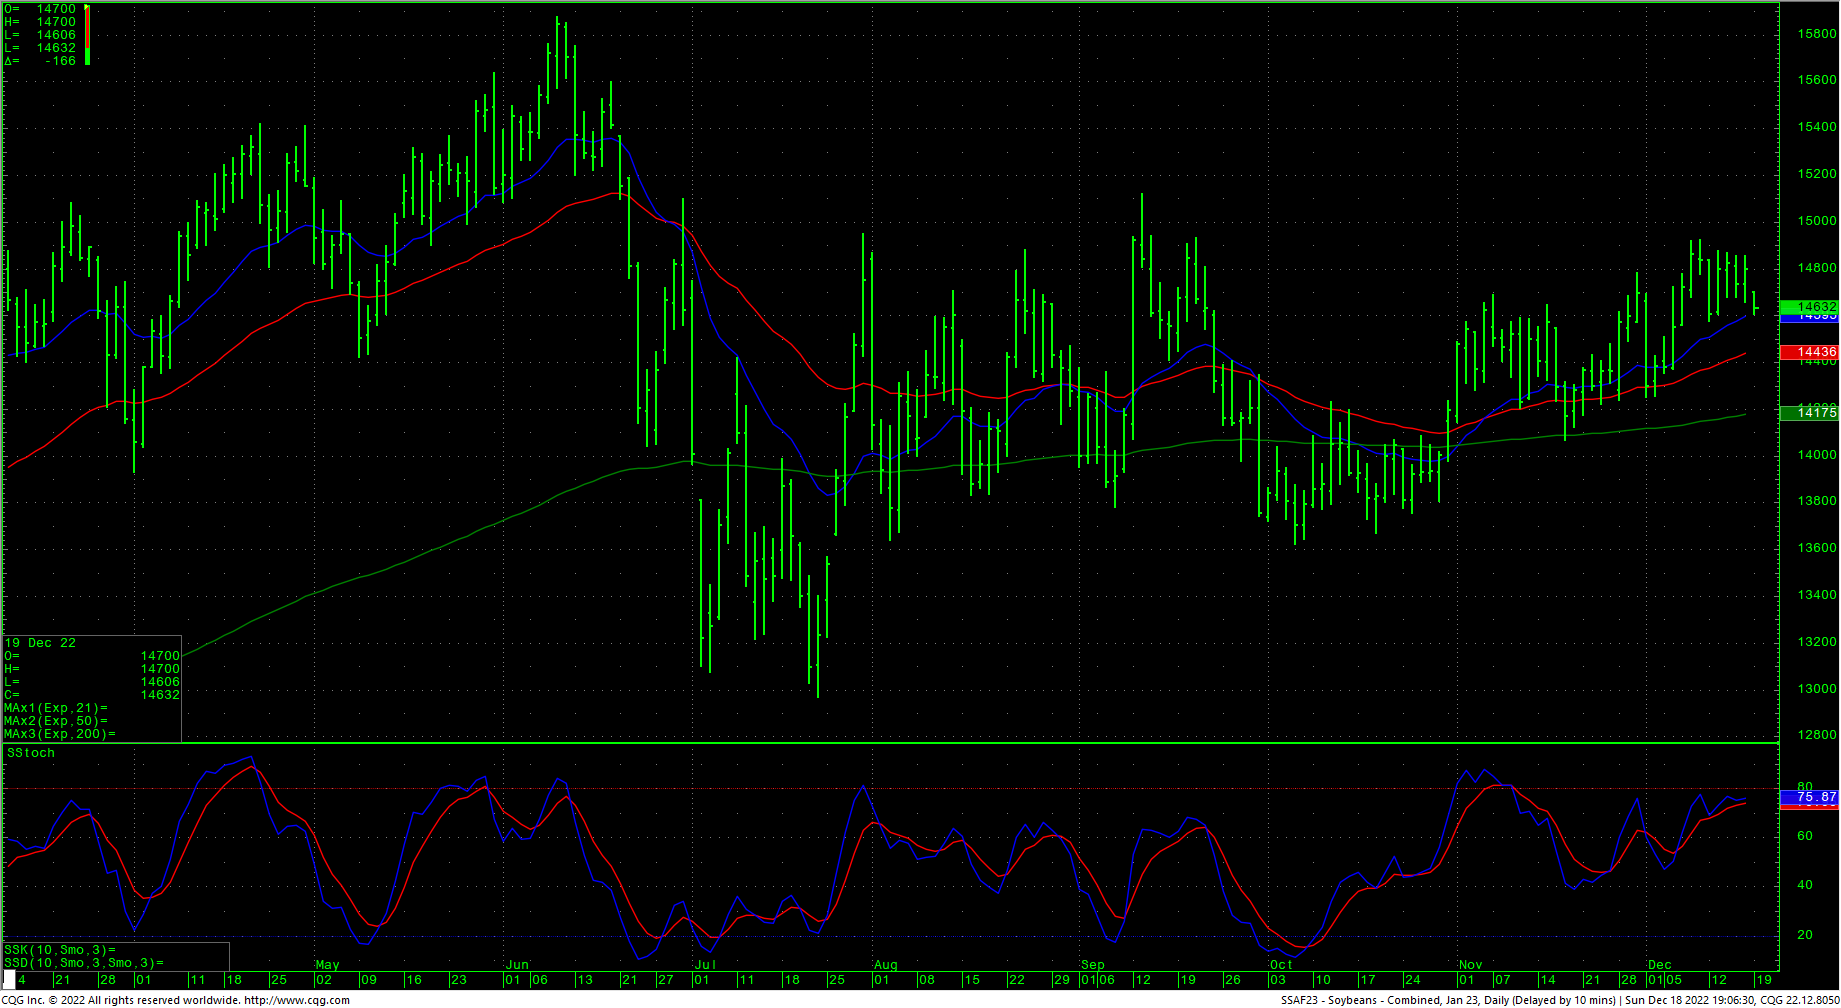
Short-term, support is key at 1449.5 and pivotal at 1439.5/1438.5 The absolute last-gasp area of support for any bullish scenario is at 1430/1425. Closes under 1425 will open counts to 1406.5/1404.5 with potential to carry to critical daily support for SF23 at 1379/1377. The lowest daily close for SF23, for the past five months, is 1370.5. Daily closes under 1370.5 should minimally test 1350/1347 with counts to 1309.5 through 1297.
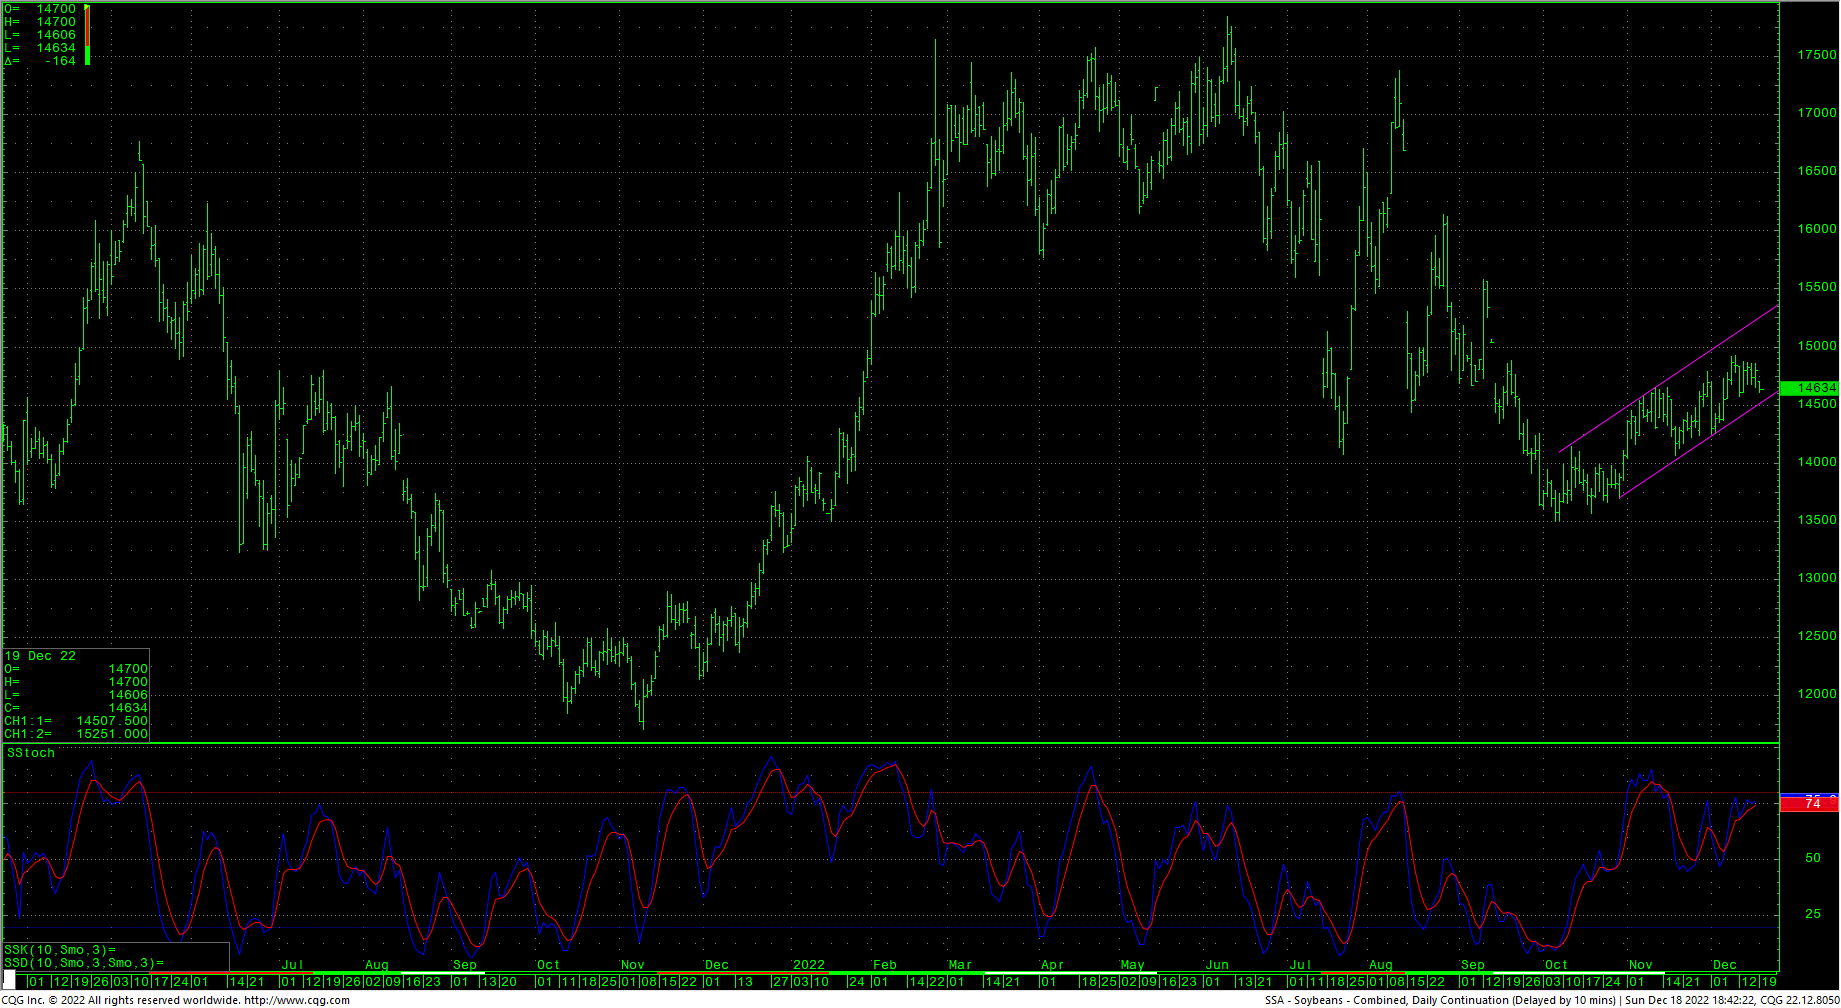
Spot Soybeans Daily H-L-C
Spot Soybeans Weekly H-L-C
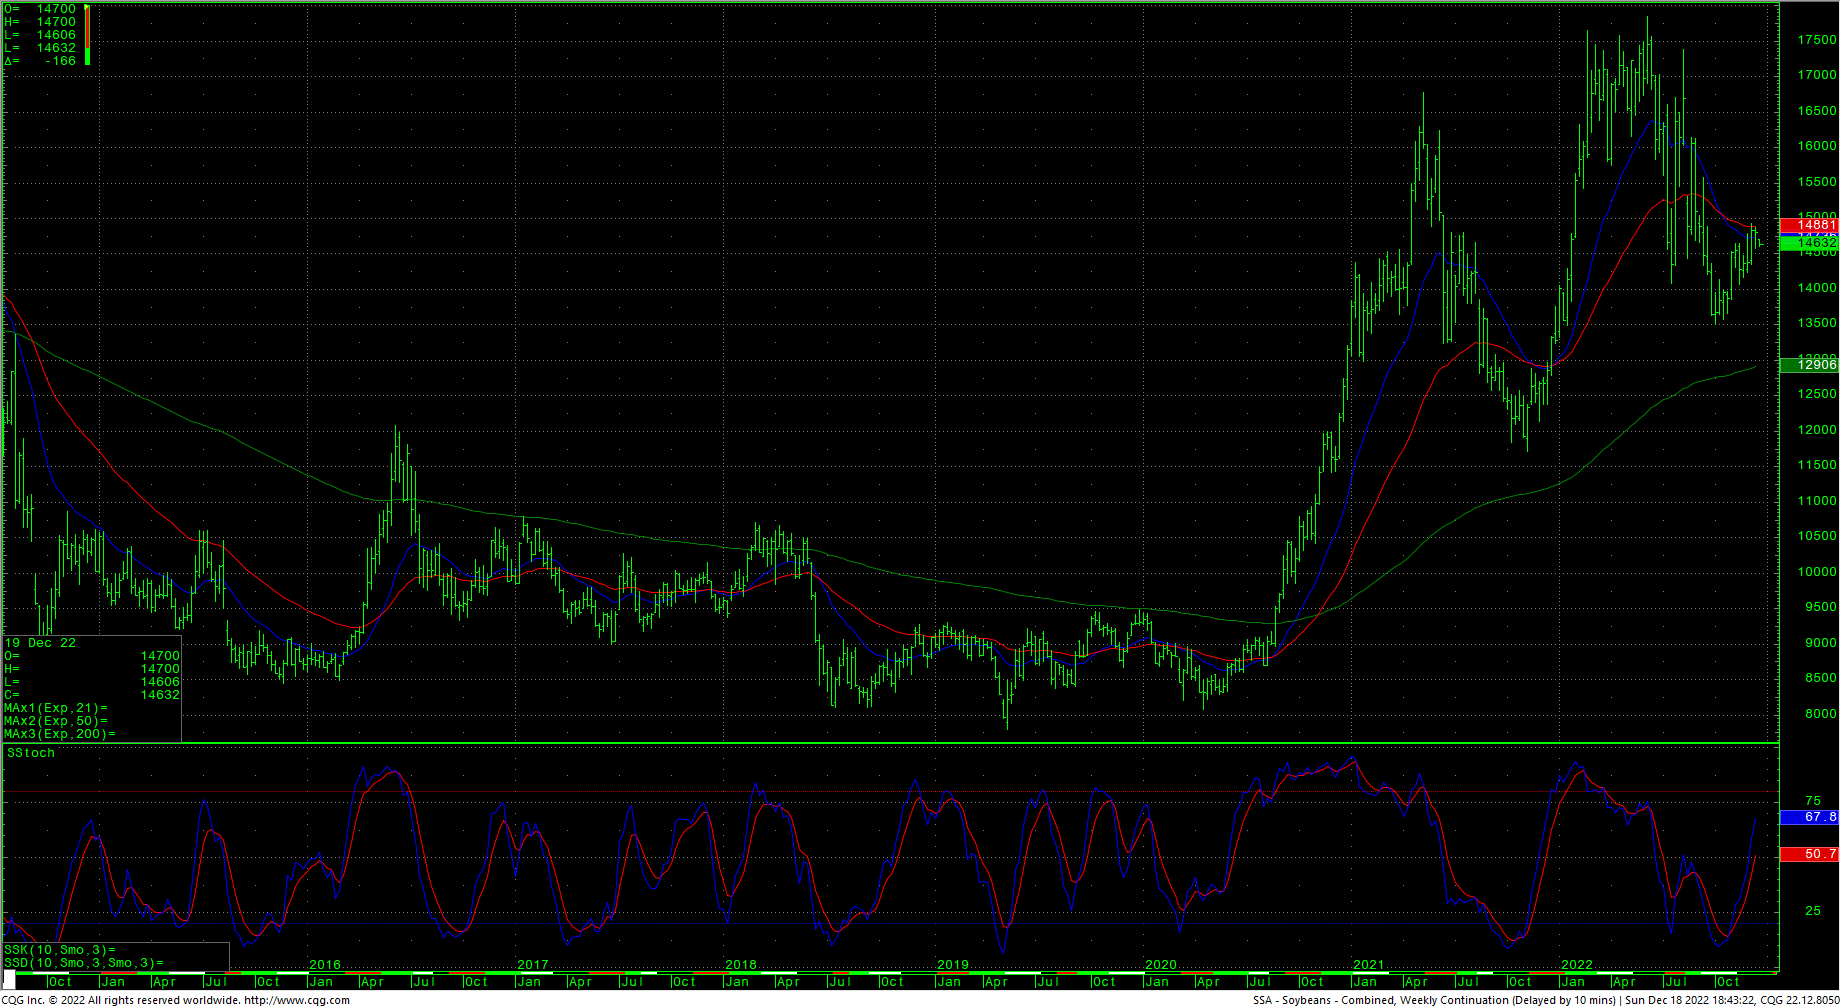
Resistance right now is critical against the recent set of highs that runs from 1477 through 1492.5. A drive over 1492.5 should carry to 1512.25/1515/1519. Closes over 1519 are bullish and suggest a test of the June highs for SF23 at 1587.75 with resistance at 1560 and 1567. Closes over 1587.75 can test critical weekly resistance of 1618/1620.
CRB Commodity Index
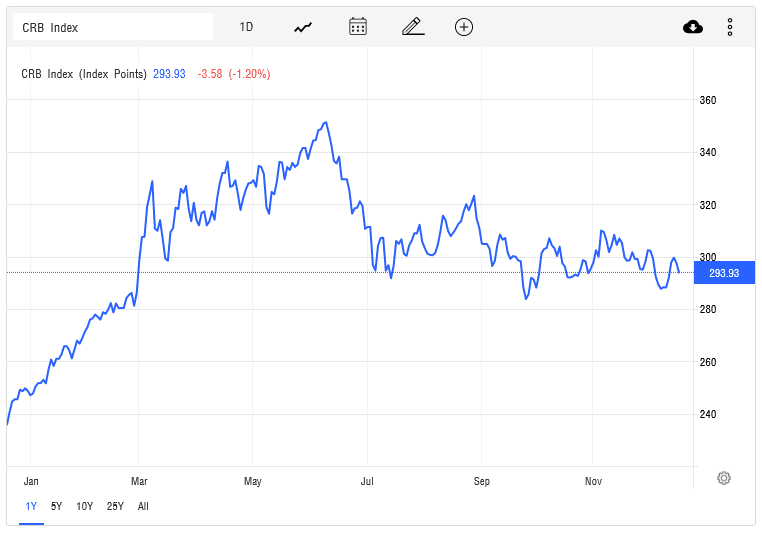
*Items of note, spot DEC meal (SMF23) has reached new contract highs would need closes over 48000 to generate an ultra-bullish scenario. As long as spot meal remains under 46400 short-term the market will be on the defensive. Support is 43670, 42500 and 41350/41250. BOF23 (JAN Oil) has support at 5970/5939 and closes under that area are bearish with counts to 5500/5429. Resistance is 6588, 6780 and 6972/6980. Closes over 6980 are bullish to 7210 with potential to 7594. The CRB Index has been in a large pennant formation since setting the highs in summer and support is at 28300. Resistance is at 30200 and prices are right now smack in the middle of this range.
Support
- 1459.5./1456.5 *** ↓
- 1449.5 *** ↓
- 1439.5/1438.5 *** ↓
- 1430/1425 *** ↓
- 1417 **
- 1406.5/1404.5 *** ↓
- 1398 **
- 1379/1377 *** ↓
- 1370.5 ***
Resistance
- 1477 **
- 1492/1492.5 *** ↑
- 1500 **
- 1512.5 **
- 1515/1519 *** ↑
- 1536.75 *** ↑
- 1560/1567 *** ↑
- 1587.75 *** ↑
Charts courtesy of CQG, Inc